compton detector simulations r&d update (erd15)
TRANSCRIPT

Compton Detector Simulations R&D Update (ERD15)
Joshua HoskinsUniversity of Manitoba1/19/2018

2
Outline
Project Goals
Software
Overview of Completed Work
Road map to Completion

3
Compton Polarimetry R&D SimulationsFor the purposed of studying potential backgrounds and shielding, a model of Compton chicane and Silicon electron detector integrated into simulation.
Main sources of background:● Bremsstrahlung from residual gas in beampipe and synchroton radiation (in-progress).
Compton generator developed for estimating the compton rate in the detector.● Beam halo interacting with detector and/or apertures in the interaction region.
Halo generator, based on PEPII report, developed.
Main goals: Study of background contributions and systematics in order to provide estimates polarization extraction accuracy and recommendations of shielding and beam quality.

4
Project Goals
● Expansion of rate and background estimations to all energies● Optimization of strip size and spacing in electron detector● Thin window optimization● Estimate of experimental accuracy● Beam induced background using Molflow/Synrad● Realistic Roman Pot geometry

5
Project Goals
● Expansion of rate and background estimations to all energies● Optimization of strip size and spacing● Thin window optimization● Estimate of experimental accuracy● Beam induced background using Molflow/Synrad● Realistic Roman Pot geometry
Joshua HoskinsAlexandre Camsonne

6
Project Goals
● Expansion of rate and background estimations (75%)● Optimization of strip size and spacing (75%)● Thin window optimization (50%)● Estimate of experimental accuracy (25%)● Beam induced background using Molflow/Synrad ● Realistic Roman Pot geometry
Joshua HoskinsAlexandre Camsonne
7
Project Goals
● Expansion of rate and background estimations (75%)● Optimization of strip size and spacing (75%)● Thin window optimization (50%)● Estimate of experimental accuracy (25%)● Beam induced background using Molflow/Synrad ● Realistic Roman Pot geometry
Joshua HoskinsAlexandre Camsonne
Need to develop integrated, modular softwarepackages that can be used in the long term for studies even after the end of the project.

8
Software Development
9
Software
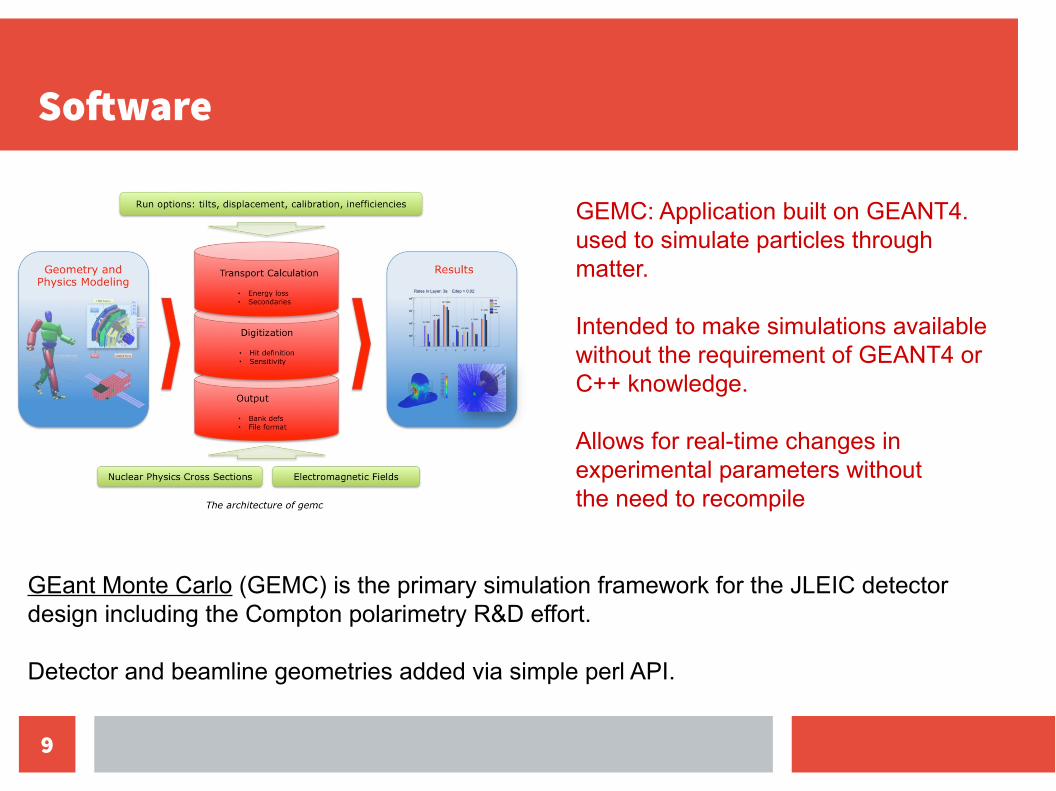
GEMC: Application built on GEANT4. used to simulate particles through matter.
Intended to make simulations available without the requirement of GEANT4 or C++ knowledge.
Allows for real-time changes in experimental parameters without the need to recompile
GEant Monte Carlo (GEMC) is the primary simulation framework for the JLEIC detector design including the Compton polarimetry R&D effort.
Detector and beamline geometries added via simple perl API.

10
Software
Initially, software and analysis piecemeal combination of macros and standalone code.● Generator: Compton and Halo● Analysis: Compton rate, halo rate, background rates, asymmetry, polarization
extraction, systematics.
As software needs evolved → need comprehensive, integrated, software suite.
For complete analysis:● Need high statistics to study systematics and estimate final accuracy → must run on
scientific cluster● Eliminate hard coding and ROOT macros.● Expand analysis to all energies and make configurable externally.
Complete analysis: generator → GEMC → analysis

11
Software
Compton Generator
Compton Analysis
Halo Generator
GEMC Halo Analysis
BackgroundAnalysis
Generator- Halo- Compton
GEMC
Analysis- Background- Compton- Halo- Asymmetry
Compton Fit
Compton Fit
Cluster
Terminal
Consolidating in this way make analysis, faster, more workable with cluster, configurable, easier to evolve in future analysis.

12
Detector Rates and Backgrounds

13
Detector Rates and Backgrounds
Previous analysis can now be easily redone to look at other energies.
Currently 3 GeV and 5 GeV.
Rates for higher energies will also be provided in short term.
3 GeV
5 GeV

14
Halo Background: AperturesExperimental halls A and C at Jefferson Lab use CW, Fabry-Perot cavities.
● Both systems have mirrors ~5 mm from the beam.● Small apertures protect mirrors from beam
excursions and bad beam properties.
The protective apertures can lead to backgrounds due to interactions with beam halo.
Use of FP cavity at JLEIC depends on understanding halo.
Yves Roblin and Arne FreybergerJLAB-TN-06-048

15
Halo Background: Apertures
Both GEANT3 and GEANT4 simulations uses description of beam halo from PEPII design report[1]. Halo flux is about 0.25% of total beam flux
Backgrounds due to halo can contribute in two locations
1. Interactions with cavity apertures2. Direct strike of electron detector
[1] SLAC-R-418 p. 113

16
Halo Backgrounds
Halo contributions from center of chicane will be studied over a range of energies
Rates have been shown previously for 5 GeV to be easily controllable be varying the aperture size.
The more pertinent problem is halo interacting with the detector directly.
3 GeV
5 GeV

17
Halo Backgrounds
Halo contributions from center of chicane will be studied over a range of energies
Rates have been shown previously for 5 GeV to be easily controllable be varying the aperture size.
The more pertinent problem is halo interacting with the detector directly.
3 GeV
5 GeV

18
Detector Systematics

19
Detector Systematics
Want to successfully extract polarization from asymmetries of each beam energy.
Determine the sensitivity of extracted polarization to detector strip size and spacing.
Systematics due to other parameters can be extracted.● dipole placement● dipole field● detector position

20
Detector Systematics
3 GeV
5 GeV
The asymmetry in the electron detector is producedfor both 3 GeV and 5 GeV.
Once the asymmetry data is produced systematicstudies can be done.
Higher beam energy (11 GeV) can also be added in the next week.

21
Detector Systematics
Polarization: 100.0 ±- 0.06Χ^2/NDF: 1.18
3 GeV
5 GeV
Polarization: 100.0 ±- 0.04Χ^2/NDF: 0.87
The polarization can be extracted by fitting theasymmetry with respect to parameters of theBeam, dipoles, and detector properties.
The fitting algorithm is based on the original Qweak poalrimetry extraction; it has now been expanded to new energies and the ability to study systematics.

22
Detector Systematics
The first systematic study was to determine the minimum strip number needed to properly extract polarization.
The study was achieved by extracting the polarizationand then combining strip and refitting till the fit failed.
The 11 GeV study will be important and likely be the limiting factor.

23
Detector Systematics
Multiplier Energy Polarization X^2/NDF
1 5 -100.00 ± 0.40 0.87
2 5 -100.00 ± 0.13 1.09
5 5 -100.00 ± 0.10 1.87
10 5 -100.00 ± 0.11 2.98
12 5 -100.00 ± 0.26 2.74
20 5 -97.20 ± 0.62 17.16
Multiplier Energy Polarization X^2/NDF
1 3 -100.00 ± 0.06 1.17
2 3 -100.00 ± 0.08 1.12
5 3 -100.00 ± 0.04 1.23
10 3 -100.00 ± 0.05 2.12
12 3 -100.00 ± 0.05 2.62
20 3 -98.00 ± 0.36 24.75
Relatively modest number of strips required(<40 from zero-crossing to endpoint) to adequately fit asymmetry distribution.
It is now possible to study the systematic effectof other parameters such as: ● Dipole placement● Detector placement● Dipole field
With these studies we will be able to provide anestimate of the accuracy of the polarization measurement.

24
SynRad Testing
• Geometry import from CAD successful from existing chicane.
• But need simplified geometry to have better speed and control on node collapsing

25
SynRad and Moflow Testing
• Molflow take a photon flux as input.
• Most likely will use Synchrotron information by Mike Sullivan, transport in GEMC and feed flux to Molflow+ to evaluate outgassing

26
RoadmapProduce 11 GeV rates/backgrounds/asymmetries
The tools to complete this are ready with the exception of a few minor tweaks so 2-3 week should be fine.
Mapping halo @detector background phase spaceDepending on how in-depth we got this is expected to take 4 weeks
Systematics and polarization accuracy estimateThis is expected to take 5-6 weeks.
Roman Pot Geometry and Beam Induced BackgroundNew Geometry should be straightforward if we can import it. Need to rerun plots in parallel.
4 weeks Geometry plus analysis plots
4 weeks for Synchrotron studies.
Software documentationSo that the software can be used to further studies in the future, I will write up a users manual 1-2 weeks
Final paperOur final report presenting the results of our studies thus far, 2 weeks.

27
Thank you