computational thinking in primary school: an examination
TRANSCRIPT

Informatics in Education, 2018, Vol. 17, No. 1, 77–92© 2018 Vilnius UniversityDOI: 10.15388/infedu.2018.05
77
Computational Thinking in Primary School: An Examination of Abstraction and Decomposition in Different Age Groups
Wouter J. RIJKE1, Lars BOLLEN1, Tessa H. S. EYSINK1, Jos L. J. TOLBOOM2*
1Department of Instructional Technology, University of Twente, Enschede, The Netherlands2Stichting Leerplanontwikkeling SLO, Enschede, The Netherlandse-mail: [email protected], [email protected], [email protected], [email protected]
Received: December 2017
Abstract. Despite a growing effort to implement computational thinking (CT) skills in primary schools, little research is reported about what CT skills to teach at what age. Therefore, the re-search questions that guide this study read: (1) How is age related to students’ success in com-putational thinking tasks? (2) How are computational thinking tasks perceived by students? (3) How do students’ experience learning with respect to computational thinking? 200 primary school students between the age of 6 and 12 participated in this study. These students got introduced to two CT subjects: abstraction and decomposition. We found that age seems to be related with these concepts, with an interaction effect for gender in the abstraction task. No differences found between young and older students in the constructs perceived difficulty, cognitive load, and flow indicate that young primary school students can engage in learning these CT skills.
Keywords: computational thinking, abstraction, decomposition, primary school, programming, perceived difficulty, flow.
1. Introduction
In the Netherlands, there is increasingly more attention for computational thinking as one of the 21st century skills (Barendsen, Grgurina, & Tolboom, 2016; Thijs, Fisser, & Van der Hoeven, 2014), when compared to earlier stages (Grgurina & Tolboom, 2008). Computa-tional thinking is a term first used by Papert (1980, 1996), and later by Wing (2006), and was used to describe the thought process of formulating problems and their solutions in a way that can be carried out by a computer. It is now more and more argued by educators
* Corresponding author: Jos L.J. Tolboom, SLO, Netherlands Institute for Curriculum Development, P.O. 2041, 7500 CA Enschede, The Netherlands, [email protected]
W.J. Rijke et al.78
that computational thinking should be picked up not only by computer scientists, but by everyone: it can make everyday activities much more efficient, and might create a better understanding of today’s pervasive usage of computers and software (Lee, Mauriello, Ahn, & Bederson, 2014). Despite a growing effort to focus on computational thinking skills in primary schools, there are still no clear guidelines on what is the appropriate age to implement interventions to foster these skills. This study aims to get insight into the de-velopment of students’ computational thinking skills during their primary school years.
1.1. Background
There has been done some research on computational thinking for young students, for example a study which evaluated the teaching of two programming topics (i.e., program-ming and data representation) with twelve-year-olds (Duncan & Bell, 2015). In this study, it was suggested that teaching computational thinking skills would be most easy when combining these lessons with lessons about computer science. However, not all (primary) schools have the resources to provide laptops or desktops for all students. Although this phenomenon has led to a rise in unplugged teaching, which means teaching computer science without actual use of computers, the assessment of computational thinking is cur-rently still mainly computer based (Fields, Searle, Kafai, & Min, 2012; Koh, Basawapat-na, Bennett, & Repenning, 2010; Werner, Denner, & Campe, 2012). In addition, research on teaching programming to older students who have no prior programming experience, has shown that the programming concepts and theories are perceived very difficult, and in result programming courses often have a lot of dropouts (Robins, A., Rountree, J. and Rountree, 2003; Stachel et al., 2013). Students from these studies have difficulties under-standing the abstract concepts that are encountered in programming.
One of the cornerstones of computational thinking is (problem) decomposition. De-composition is used when a problem is too big or complex to solve at once, and when we know how to solve the subproblems effectively. Strategies are used to decompose a problem, since there are usually multiple ways of decomposing a problem. When plan-ning on carrying out a large problem with a computer, decomposition becomes essential. When programming, a code is produced to carry out the command of the programmer. This code should be carried out by a computer step by step. These step-by-step instruc-tions to get something done is called an algorithm. In a study about decomposition in an arithmetic setting, it was found that it is teachable for 5 to 6 year olds, when students are still developing their number sense (Cheng, 2012). In another study on the relation-ship between computational thinking, teaching programming, and Bloom’s Taxonomy, decomposition was found to be the most difficult computational thinking skill to master (Selby, 2015). Selby found that one of the reasons for this, was that sometimes the prob-lem to solve was not completely understood. Also, students appeared to understand the concept of decomposition, but struggled to implement the process in new situations. The Royal Society (2012) stated that understanding decomposition is a necessary condition before attending to the other cornerstones (i.e., abstraction, algorithm design, evalua-tion, and generalizations).

Computational Thinking in Primary School: An Examination of Abstraction ... 79
Problem decomposition might be regarded as the most difficult computational think-ing skill to master, abstraction is seen by various experts as the most important compu-tational thinking skill (Hazzan, 1999; Kramer, 2007; Se, Ashwini, Chandran, & Soman, 2015; Wing, 2006). It is stated that “the abstraction process – deciding what details we need to highlight and what details we can ignore – underlies computational thinking” (Wing, 2008, p. 3718). According to neo-Piagetian theory, people are thought to develop through abstract forms of reasoning, regardless of their age (Lister, 2011).
The main aim of this study is to investigate the development of students’ decomposi-tion and abstraction skills, so that more insight can be gained in what is the appropriate age for teaching these skills. In order to do so, we look at perceived difficulty, cogni-tive load, and flow. When a task is consistent with the age of a child, it should not be perceived too difficult or too easy (Lehmann, Goussios, & Seufert, 2016). Such a task would ask cognitive capacity, but not too much (Mayer & Moreno, 2010). For opti-mizing people’s cognitive capacity, we look at cognitive load theory (Sweller, 1994). This theory explains how cognitive capacity is a system interacting between processing information not directly related to the learning content and processing information deal-ing with the inherent complexity of a task. The remaining capacity is used for actual knowledge building. When students have enough capacity left and they feel capable and challenged, a state of flow could occur (Csikszentmihalyi, 1975). Flow describes a state of mind in which a person is neither over challenged, nor under challenged, and is completely engaged in the task. Both the skill level and the difficulty of the task should increase simultaneously to maintain a level of flow. Measuring perceived difficulty, cog-nitive load, and flow will give an indication if abstraction and decomposition are appro-priate for young students.
The research questions that guide this study are as follows: How is age influencing students’ success in decomposition and abstraction (1) tasks?How difficult (in terms of perceived difficulty, cognitive load, and flow) do stu-(2) dents perceive the decomposition and abstraction tasks? What are students’ perceptions of their learning experiences?(3)
When looking at success of computational thinking in primary school in previous studies, there is no clear indication on what to expect from student’s computational thinking skill in relation to their age, flow level, perceived difficulty, or cognitive load.
2. Methods & Materials
2.1. Participants
The participants were 200 primary school students (100 male, 100 female) ranging from first to sixth grade, with students as young as six, and as old as twelve years of age (M = 9.09, SD = 1.95). The study started with 210 students, but the 10 removed students could not participate in their respective task, so were removed from analysis.

W.J. Rijke et al.80
In this study, a form of nonprobability sampling was used for selecting participants. The participants were collected from a total of six groups from two different schools; one large school located in a small-sized city, and an average-sized school in a mid-sized city in the Netherlands. The six groups were randomly assigned to one of the two condi-tions. Participants were classified as young (everyone younger than 8 years old), middle (those between 8 and 10 years old), and old (everyone older than 10 years old). This re-sulted in the distribution displayed in Table 1. The cut-off points for the age groups were based on the ages at which children are admitted to certain grades in primary school in the Netherlands (Onderwijsraad, 2005). All parents of the participants gave consent for participation of their children in this research project.
2.2. Design of the intervention
For this research, two unplugged lessons were used as an intervention. In the UK, pri-mary school teachers are supported in various ways to implement computational thinking skills. The Barefoot Computing project is one of those initiatives. On barefootcas.org.uk, teachers can download and co-operate in exemplar primary computing resources. The project provides workshops for teachers, with the aim to deliver new computing subjects with confidence, in addition to exemplar teaching activities. These activities focus on showing how computing and other subjects (e.g., math, English, and science) can be combined. In the current study, lessons from the Barefoot Computing project were used as an introduction into two computational thinking skills: abstraction and decomposition. In the abstraction task, originally recommended for 7 through 11-year-olds, the students worked in dyads. One of the students received a deck of sixteen cards, containing com-mon, concrete nouns (e.g., ‘school’, ‘lamp’ or ‘cat’) that s/he had to sketch one-by-one, without skipping cards. The other student had to guess the word. In order to do so, students have to abstract the most important details of the concept, and ignore unimportant details. In the decomposition task, recommended for 5 through 11-year-olds, students created hand clapping, hand tutting, or hand jive sequences of movements. Students were asked to break the sequence of actions down into parts and in doing so, they were using their de-composition skills. The students paired up and received a design sheet to document their movements. They were instructed to make as many decompositions as possible, and to make it clear enough that another pair from their class could perform their sequence with
Table 1Participant Distribution per Computational Thinking Skill and Age Group
Computational thinking skill Age group TotalYoung (< 8 yrs)
Middle(8–10 yrs)
Old(>10 yrs)
Abstraction 43 26 46 115Decomposition 23 42 20 85
Total 66 68 66 200

Computational Thinking in Primary School: An Examination of Abstraction ... 81
only their design sheet. Sets of eight (abstraction) and nine (decomposition) slides were used to guide the lesson. These slides contained examples, learning goals, and discussion topics, like how these skills are used when working with computers. The materials used in the lessons were displayed on the slides, as well as the discussion topics when discuss-ing the role of abstraction and decomposition in programming, for computational think-, for computational think-ing asks how we can use computers to solve problems. The applications of computational thinking are discussed, such as programming a game (Angry Birds and Candy Crush are mentioned), and how you have to abstract and decompose ideas and codes in order to facilitate a computer to run your steps. Ultimately, computational thinking has applica-tions in a wide variety of disciplines, like statistics, biology and economy.
All materials used in the lessons were translated from English to Dutch by the re-searchers. The researchers hereby used the steps provided by the World Health Organi- The researchers hereby used the steps provided by the World Health Organi-The researchers hereby used the steps provided by the World Health Organi-zation (2007) to obtain a Dutch version of the lessons that was conceptually equal to the original. These steps comprised forward translation (to Dutch), expert panel back-translation (with supervisors), and pre-testing (i.e., a pilot) before finalizing the eventual lessons. We accounted for socio-cultural dependent words (e.g., London) and changed them (e.g., Amsterdam) to accommodate to the target group.
2.3. Measurements
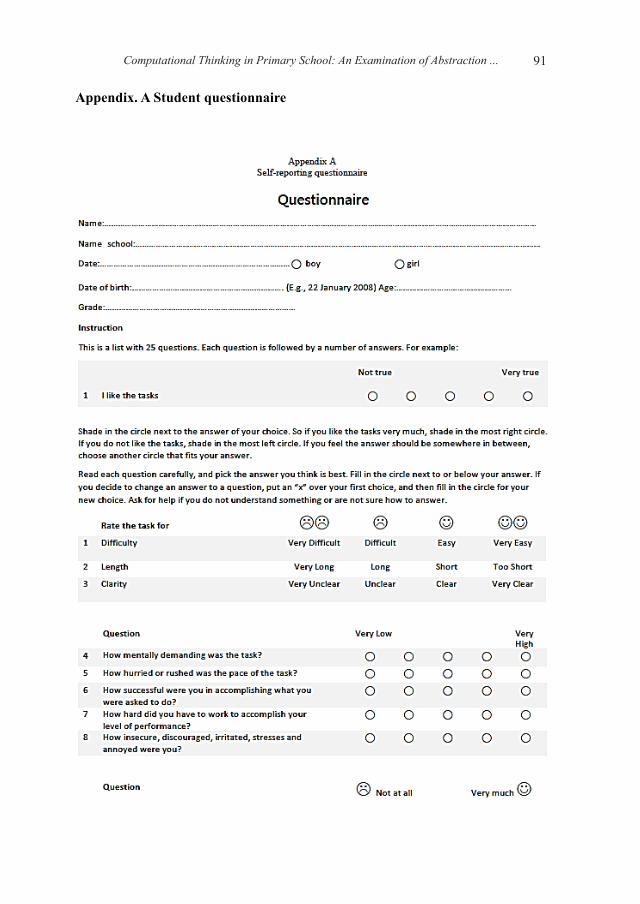
The constructs ‘perceived difficulty’, ‘cognitive load’, ‘flow’, and ‘students’ perceptions and experiences’ were measured by a questionnaire (see Appendix A).
2.3.1. Perceived DifficultyThe questions about perceived difficulty were translated from the Perceived Difficulty Assessment Questionnaire, or PDAQ (Ribiero & Yarnal, 2010). Perceived difficulty was measured by asking students to rate the task on a four-point Likert scale, with a higher number representing more perceived difficulty, on three aspects: difficulty, length, and clarity.
2.3.2. Cognitive LoadCognitive load was measured by an adapted and translated version of the NASA Task Load Index (Hart & Staveland, 1988), consisting of five items measuring mental de-mand, temporal demand, overall performance, frustration level, and effort by means of a five-point Likert scale, with a higher number representing more cognitive load. An example of an item was “How hurried or rushed was the pace of the task?”
2.3.3. FlowFlow was measured by items from the translated Flow Short Scale (Rheinberg, Vollmey-er, & Engeser, in Eysink et al., 2015), consisting of nine items about how students expe-rienced the task. Students rated the questions on a five-point Likert scale, with a higher number representing more perceived flow. This is adapted from the original, where a seven-point Likert scale was used and a higher number represented less perceived flow.
W.J. Rijke et al.82
We decided a five-point scale would be more suitable for this target group. An example of one of the nine items was “I felt like I had everything under control”. The nine flow items (with five answer possibilities) were combined into one variable, with a number between 9 (no flow) and 45 (maximum amount of flow). The reliability as measured with Cronbach’s α, was .68 for young students, .78 for students in the middle group, and .86 for the oldest students.
2.3.4. Perceptions and ExperiencesThe perceptions of the students’ learning experiences were measured by asking students to rate how much they liked the task on a five-point Likert scale, and by asking them to describe the lesson in one word. In addition, they were asked to grade the lesson on a scale from 1 to 10 (a standard way of grading in The Netherlands). Previous experience was measured by one item; “Did you ever carry out an activity like this before?”, with a “yes” or “no” answer option. A follow-up question was provided when “yes” was an-swered; “If yes, then what did you do?”.
2.4. Data Analysis
To measure students´ success on the abstraction task, the number of cards a student could get their partner to guess right was counted. A student good at abstraction is as-sumed to be good at determining the important details to sketch and would have more cards guessed right by their partner than someone less skilled. To compare between ages, the number of cards guessed right was divided by the time on task.
Decomposition success was measured by the number of movements students created. A movement is defined as a separate drawing of a movement, different from the previous movement, and independent from the number of iterations. When decomposing their se-quence, more skilled students would create more movements than less skilled students. Here too, the number of decomposed movements was divided by the time on task.
2.5. Procedure
All lessons were given by the same researcher, to control for the influence of the teacher on the lessons. The lessons were given in the students’ own classroom, with the presence of their own teacher. Students were given a set time for their abstraction or decomposi-tion task. After the lesson ended, students were asked to fill in the questionnaire on per-ceived difficulty, cognitive load, flow, and their perceptions and experiences (Appendix A). Students from first grade (n = 49) did not fill in the questionnaire. This was decided after the pilot run, where students had too much trouble with reading (students start read-ing in first grade), and the unfamiliarity with questionnaires. The first grade students´ artefacts (i.e., drawings and decomposed movements) did get analysed.
The sampling procedures were approved by the Ethics Committee of the Faculty of Behavioural, Management and Social Sciences of the University of Twente.

Computational Thinking in Primary School: An Examination of Abstraction ... 83
3. Results
3.1. Abstraction
Table 2 presents students’ mean scores and standard deviations on the abstraction task for students in the young, middle, and old group.
A one-way ANOVA showed that there were differences between age groups on the abstraction task (F(2,112) = 40.901, p < .001, 𝜂�� = .42). Pairwise comparisons using the Bonferroni procedure showed that students in the old age group performed better than those in the middle age group (p < .001) and the young age group (p < .001), and stu-dents from the middle age group performed better than those from the young age group (p = .004). A Pearson correlation also showed a moderate positive correlation between age (before grouping) and the abstraction task (r = .66, p < .001). This means that, on average, as students become older, more of their drawings in the abstraction task were guessed right by their peers.
3.1.1. Perceived Difficulty, Cognitive Load, and FlowWe found no differences between age groups on the perceived difficulty items (i.e., difficulty, length, and clarity). Students who thought the task was very clear, expe-rienced more flow (M = 39.65, SD = 5.28) than those who felt it was very unclear (M = 29.25, SD = 5.44, F(3, 85) = 8.688, p < .001, 𝜂�� = .24). Experiencing more flow did not lead to more success on the abstraction task (r = .114, p = .353). There were no differences on the other cognitive load items for students in the young, middle, or old age group.
3.1.2. PerceptionsThere were no differences in the perceptions of the abstraction task for younger, mid-dle, or older students. Students gave an average grade of 8.3 (SD = 1.8) on a scale from 1 to 10. Students (n = 15) who said to have done something similar before (prior experience), performed better (M = 2.69, SD = 1.57) on the abstraction task than those (n = 69) who had no prior experience (M = 1.83, SD = 1.32, F(1, 82) = 4.890, p = .03, 𝜂�� = .06).
Table 2Cards Guessed Right per Minute on the Abstraction Task for each Age Group
Age group n M SD 95% CI
Young 43 .60 .29 [.51, .69]Middle 26 1.46 .72 [1.16, 1.75]Old 46 2.60 1.53 [2.14, 3.05]
Note. CI = confidence interval.
W.J. Rijke et al.84
3.2. Decomposition
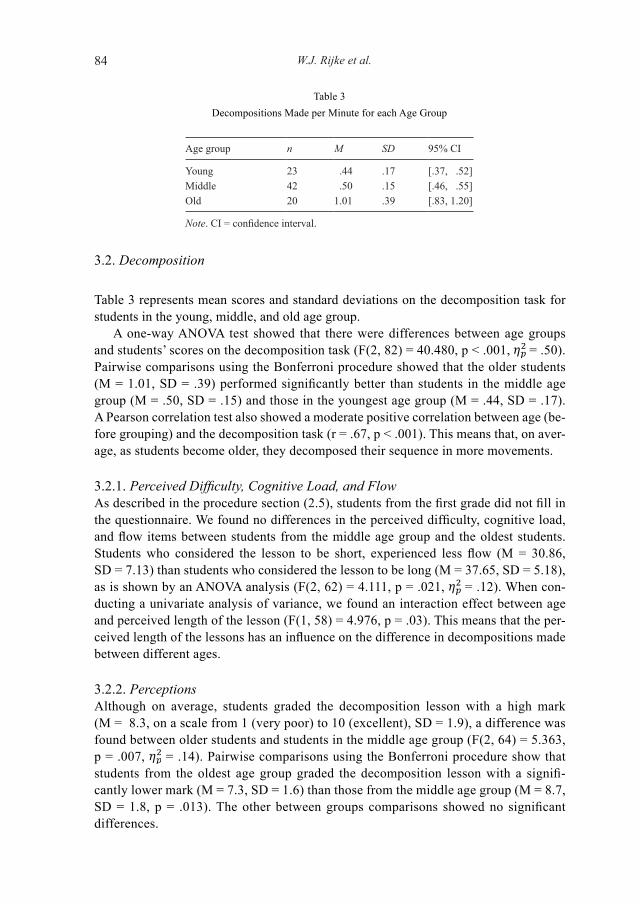
Table 3 represents mean scores and standard deviations on the decomposition task for students in the young, middle, and old age group.
A one-way ANOVA test showed that there were differences between age groups and students’ scores on the decomposition task (F(2, 82) = 40.480, p < .001, 𝜂�� = .50). Pairwise comparisons using the Bonferroni procedure showed that the older students (M = 1.01, SD = .39) performed significantly better than students in the middle age group (M = .50, SD = .15) and those in the youngest age group (M = .44, SD = .17). A Pearson correlation test also showed a moderate positive correlation between age (be-fore grouping) and the decomposition task (r = .67, p < .001). This means that, on aver-age, as students become older, they decomposed their sequence in more movements.
3.2.1. Perceived Difficulty, Cognitive Load, and FlowAs described in the procedure section (2.5), students from the first grade did not fill in the questionnaire. We found no differences in the perceived difficulty, cognitive load, and flow items between students from the middle age group and the oldest students. Students who considered the lesson to be short, experienced less flow (M = 30.86, SD = 7.13) than students who considered the lesson to be long (M = 37.65, SD = 5.18), as is shown by an ANOVA analysis (F(2, 62) = 4.111, p = .021, 𝜂�� = .12). When con-ducting a univariate analysis of variance, we found an interaction effect between age and perceived length of the lesson (F(1, 58) = 4.976, p = .03). This means that the per-ceived length of the lessons has an influence on the difference in decompositions made between different ages.
3.2.2. PerceptionsAlthough on average, students graded the decomposition lesson with a high mark (M = 8.3, on a scale from 1 (very poor) to 10 (excellent), SD = 1.9), a difference was found between older students and students in the middle age group (F(2, 64) = 5.363, p = .007, 𝜂�� = .14). Pairwise comparisons using the Bonferroni procedure show that students from the oldest age group graded the decomposition lesson with a signifi-cantly lower mark (M = 7.3, SD = 1.6) than those from the middle age group (M = 8.7, SD = 1.8, p = .013). The other between groups comparisons showed no significant differences.
Table 3Decompositions Made per Minute for each Age Group
Age group n M SD 95% CI
Young 23 .44 .17 [.37, .52]Middle 42 .50 .15 [.46, .55]Old 20 1.01 .39 [.83, 1.20]
Note. CI = confidence interval.
Computational Thinking in Primary School: An Examination of Abstraction ... 85
3.3. Ancillary Analyses
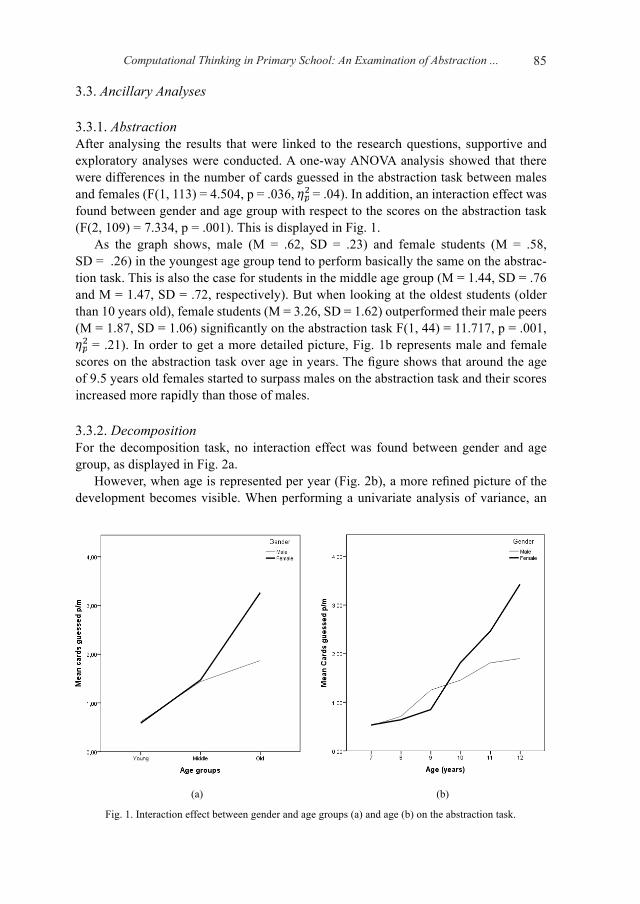
3.3.1. AbstractionAfter analysing the results that were linked to the research questions, supportive and exploratory analyses were conducted. A one-way ANOVA analysis showed that there were differences in the number of cards guessed in the abstraction task between males and females (F(1, 113) = 4.504, p = .036, 𝜂�� = .04). In addition, an interaction effect was found between gender and age group with respect to the scores on the abstraction task (F(2, 109) = 7.334, p = .001). This is displayed in Fig. 1.
As the graph shows, male (M = .62, SD = .23) and female students (M = .58, SD = .26) in the youngest age group tend to perform basically the same on the abstrac-tion task. This is also the case for students in the middle age group (M = 1.44, SD = .76 and M = 1.47, SD = .72, respectively). But when looking at the oldest students (older than 10 years old), female students (M = 3.26, SD = 1.62) outperformed their male peers (M = 1.87, SD = 1.06) significantly on the abstraction task F(1, 44) = 11.717, p = .001, 𝜂�� = .21). In order to get a more detailed picture, Fig. 1b represents male and female scores on the abstraction task over age in years. The figure shows that around the age of 9.5 years old females started to surpass males on the abstraction task and their scores increased more rapidly than those of males.
3.3.2. Decomposition For the decomposition task, no interaction effect was found between gender and age group, as displayed in Fig. 2a.
However, when age is represented per year (Fig. 2b), a more refined picture of the development becomes visible. When performing a univariate analysis of variance, an
(a) (b)
Fig. 1. Interaction effect between gender and age groups (a) and age (b) on the abstraction task.

W.J. Rijke et al.86
interaction effect between gender and age is found (F(5, 73) = 2.501, p = .04). Ergo, dif-ferent results are found for males and females at different ages. Females did, however, outperform their male counterparts after the age of 11 (F(1, 14) = 7.643, p = .02).
Flow is moderately correlated with the grade students gave the decomposition lesson (r = .603, p < .001), which means when the grade they give the lesson becomes higher, the students experienced more flow. Understanding of the task was also correlated moderately with how much they liked the task (r = .509, p < .001) and the grade students assessed the lesson with (r = .571, p < .001). Thus, when students had a good understanding of the de-composition task, they liked the task more and assessed the lesson with a higher grade.
4. Discussion
The aim of this study was to investigate from what age group lessons about decomposition and abstraction are appropriate. Three main findings are worth discussing in further detail. First, results show that students do not show the same level of abstraction skills across all ages, as expected. Older students were found to do better on the abstraction task than students in the youngest age group. This is largely in line with the results of Marini and Case (1994). They found that the capacity for abstract reasoning begins to appear at the age of 11 or 12. This follows Jean Piaget’s theory of cognitive development, in which he states that until the age of 12 children are still forming schemas, which make abstract reasoning difficult (Lister, 2011). According to Piaget, the cognitive development of abstract reasoning goes hand-in-hand with the biological maturation of the brain. When interpreting our results, we should acknowledge that we had no participants from fifth grade, and the small number (i.e., 15) of participants in the decomposition task for sixth grade. This resulted in 20 participants for the group of ‘old’ children who performed the decomposition task. This could lead to a bias of our results of this group.
(a)
(b)
(a) (b)Fig. 2. The difference between age groups (a) and the development between gender and age (b) for the
decomposition task.
Computational Thinking in Primary School: An Examination of Abstraction ... 87
Second, during the ancillary analyses, it was found that after the age of 9.5 years old, female students begin to outperform their male peers on the abstraction task. A similar finding was reported by Statter and Armoni (2016), who found that “female students achieved better grades (…) in our abstract scale grading” (p. 83). Their study involved seventh graders (ages 13 to 14), with the main goal to develop an intervention to teach abstraction skills as early as possible. Also, using functional magnetic resonance imag-ing (fMRI), girls between 9 and 15 years old have been found to show significantly greater activity in brain areas linked to abstract thinking through language than boys of the same age (Burman, Bitan, & Booth, 2008). Also, girls are believed to hit puberty ear-lier than boys; a period linked to the development of abstract reasoning (Kipke, 1999).
Results show a different pattern for performance on the decomposition task and age groups than on the abstraction task. No differences in performance on the decomposition task were found, neither between age groups, nor between males and females. However, when looking at students older than 11 years old, the number of decompositions made per minute more than doubled, and females began to outperform males significantly.
What has to be taken into account, is the validity of the measurements used for ab-straction and decomposition. These were not validated measures, by lack of any. The abstraction skills of the students were measured by the ability of a peer to correctly rec-ognize their drawings of specified concepts. The underlying idea was that a student who is good at abstraction is able to determine which aspects are important and which are not, and, as a consequence, are able to quickly draw concepts that are easy to recognize. One could argue, however, whether other skills, such as drawing skills or creativity interfere. The same applies to the decomposition task, which might have been influenced by motor skills or the complexity of the selected sequence of movements. Further research should investigate whether other ways of measuring these skills would yield similar results. Also, 12 year old students can be expected to perform on a higher level on the computational thinking tasks, simply due to more years of practicing these skills in every day life.
Third, for both tasks, there are no significant differences between age groups on per-ceived difficulty, cognitive load, and flow. Also, there are no extreme scores on the per-ceived difficulty items. The students did not perceive the tasks too difficult, or too easy. Students did not rate the cognitive load items very high, indicating that not very much cognitive capacity was asked from them. Also, flow was rather high in most students. These findings indicate that there are no signs to assume that children under 8 years old are too young to engage in learning these computational thinking skills, and that they can be challenged in doing so. For future research, however, we need to establish certain thresholds for these constructs a priori, to determine at what point we would consider these tasks inappropriate for a student’s age.
In addition, cognitive load and flow were measured by self-reporting questionnaires, which might not be the most reliable way of measuring these complex constructs, es-pecially with respect to the studied age groups (Logan, Claar, & Scharff, 2008; Mor-tel, 2008). In our study, we did not find significant differences, but more qualitative measures, like interviews with the students, could provide other results. Other future research should focus on trying to design validated measures for computational think-ing skills. These will become essential in assessing whether we succeed in our goals of implementing computational thinking in (primary) education.
W.J. Rijke et al.88
5. Conclusions
The current study provides an indication of the minimum age at which lessons about abstraction and decomposition are appropriate, and contributes to the scarce collection of empirical studies on computational thinking. It was observed that students gradually become more skilled in abstraction tasks as they become older, with females following a steeper development than males after the age of 9.5 years old. With the upcoming desires to implement computational thinking skills earlier in the curricula, educators should ex-pect a gradual development for both boys and girls. When students reach fourth grade, girls will likely start to distinguish themselves positively from boys on abstraction tasks. The availability of additional and more challenging materials would be desirable for this scenario. Some opponents feel like young children should not be exposed to more screen time, technology, or computers at all. We see that this argument is not valid when using unplugged, hands-on learning materials. The overall conclusion is that although infer-ences should be made cautiously, abstraction and decomposition have a future in prima-ry school curriculum, starting with the youngest students. Especially in upper primary education (grade 4 through 6), students start to make progress in their abstract reason-ing. The current study underlines the current paradox when it comes to programming: a considerable shortage of women in the Science, Technology, Engineering and Math (STEM)-fields, despite multiple studies reporting that girls perform as good, or even better in these fields (Corbett & Hill, 2015; Grover & Pea, 2013; Modi, Schoenberg, & Salmond, 2012; Wang & Degol, 2013). Although this century has progressed for almost two decades, it is not too late to start investing in these 21st century skills.
6. Acknowledgments
We would like to thank Ton de Jong, Allard Strijker, Petra Fisser, Hylke Faber, Nata a Grgurina, Sandra Legters, Wietse van Bruggen, Teun Meijer, Jane Waite, and the stu-dents and teachers of the participating schools for their contributions to this study.
References
Barendsen, E., Grgurina, N., Tolboom, J.L.J. (2016). A new informatics curriculum for secondary education in the Netherlands. In: Informatics in Schools: Improvement of Informatics Knowledge and Perception: 9th International Conference on Informatics in Schools: Situation, Evolution, and Perspectives, ISSEP 2016, Münster, Germany, October 13–15, 2016, Proceedings. Cham: Springer International Publishing, 105–117.
Burman, D.D., Bitan, T., Booth, J.R. (2008). Sex differences in neural processing of language among children. Neuropsychologia, 46(5), 1349–1362. doi:10.1016/j.neuropsychologia.2007.12.021
Cheng, Z.J. (2012). Teaching young children decomposition strategies to solve addition problems: An experi-mental study. Journal of Mathematical Behavior, 31(1), 29–47. doi:10.1016/j.jmathb.2011.09.002
Corbett, C., Hill, C. (2015). Solving the Equation – The Variables for Women’s Success in Engineering and Computing. Aauw. doi:10.1103/PhysRevA.75.063427
Csikszentmihalyi, M. (1975). Beyond Boredom and Anxiety: Experiencing Flow in Work and Play. The Jossey-Bass Behavioral Science Series, 231. doi:10.2307/2065805
Duncan, C., Bell, T. (2015). A pilot computer science and programming course for primary school students. Workshop in Primary and Secondary Computing Education, 1, 39–48. doi:10.1145/2818314.2818328
Computational Thinking in Primary School: An Examination of Abstraction ... 89
Eysink, T.H.S., Gersen, L., Gijlers, H. (2015). Inquiry learning for gifted children. High Ability Studies, 26(1), 63–74. doi:10.1080/13598139.2015.1038379
Fields, D.A., Searle, K.A., Kafai, Y.B., Min, H.S. (2012). Debuggems to assess student learning in e-textiles. In: Proceedings of the 43rd ACM Technical Symposium on Computer Science Education. New York, New York, USA: ACM Press, 699. doi:10.1145/2157136.2157367
Grover, S., Pea, R. (2013). Computational thinking in K-12: A review of the state of the field. Educational Researcher, 42(1), 38–43. doi:10.3102/0013189X12463051
Hart, S.G., Staveland, L.E. (1988). Development of NASA-TLX (Task Load Index): Results of empirical and theoretical research. Advance in Psychology, 52, 139–183. doi:10.1016/S0166-4115(08)62386-9
Hazzan, O. (1999). Reading abstraction level when learning abstract algebra concepts. Educational Studies in Mathematics, 40(1), 71–90.
Kipke, M.D. (1999). Adolescent development and the biology of puberty. Washington, D.C.: National Acad-emies Press. https://doi.org/10.17226/9634
Koh, K.H., Basawapatna, A., Bennett, V., Repenning, A. (2010). Towards the automatic recognition of com-putational thinking for adaptive visual language learning. 2010 IEEE Symposium on Visual Languages and Human-Centric Computing, 59–66. doi:10.1109/VLHCC.2010.17
Kramer, J. (2007). Is abstraction the key to computing? Communications of the ACM, 50(4), 37–42. doi:10.1145/1232743.1232745
Lee, T.Y., Mauriello, M.L., Ahn, J., Bederson, B.B. (2014). CTArcade: Computational thinking with games in school age children. International Journal of Child-Computer Interaction, 2(1), 26–33. doi:10.1016/j.ijcci.2014.06.003
Lehmann, J., Goussios, C., Seufert, T. (2016). Working memory capacity and disfluency effect: an aptitude-treatment-interaction study. Metacognition and Learning, 11(1), 89–105. doi:10.1007/s11409-015-9149-z
Lister, R. (2011). Concrete and other neo-piagetian forms of reasoning in the novice programmer. Conferences in Research and Practice in Information Technology Series, 114, 9–18.
Logan, D.E., Claar, R.L., Scharff, L. (2008). Social desirability response bias and self-report of psychological distress in pediatric chronic pain patients. Pain, 136(3), 366–372. doi:10.1016/j.pain.2007.07.015
Marini, Z., Case, R. (1994). The development of abstract reasoning about the physical and social world. Child Development, 65(1), 147–159.
Mayer, R.E., Moreno, R. (2010). Nine ways to reduce cognitive load in multimedia learning. Educational Psychologist, 1520(38), 43–52. doi:10.1207/S15326985EP3801
Modi, K., Schoenberg, J., Salmond, K. (2012). Generation STEM – Full Report. Girl Scout Research Institute. Retrieved from www.girlscouts.org/research/pdf/generation_stem_full_report.pdf
Mortel, T. van de. (2008). Faking it: social desirability response bias in self- report research report research. Australian Journal of Advanced Nursing, 25(4), 40–48.
Onderwijsraad. (2005). Better transitions in education (Dutch: Betere overgangen in het onderwijs).Papert, S. (1980). Mindstorms: Computers, Children, and Powerful Ideas. New York: Basic Books.Papert, S. (1996). An exploration in the space of mathematics educations. International Journal of Computers
for Mathematical Learning, 1(1), 1–20. doi:10.1007/BF00191473Ribiero, N.F., Yarnal, C.M. (2010). The Perceived Difficulty Assessment Questionnaire (PDAQ): Methodol-
ogy and applications for leisure educators and practitioners. Schole: A Journal of Leisure Studies and Recreation Education, 25, 111–115.
Robins, A., Rountree, J., Rountree, N. (2003). Learning and teaching prgramming : A review and discussion. Computer Science Education, 13(2), 137–172. doi:10.1076/csed.13.2.137.14200
Se, S., Ashwini, B., Chandran, A., Soman, K.P. (2015). Computational thinking leads to computational learn-ing: Flipped class room experiments in linear algebra. In: ICIIECS 2015 – 2015 IEEE International Conference on Innovations in Information, Embedded and Communication Systems, 1–6. doi:10.1109/ICIIECS.2015.7193021
Selby, C.C. (2015). Relationships: computational thinking, pedagogy of programming, and Bloom’s Taxon-omy. In: Proceedings of the Workshop in Primary and Secondary Computing Education on ZZZ – WiP-SCE’15. New York, New York, USA: ACM Press, 80–87. doi:10.1145/2818314.2818315
Stachel, J., Marghitu, D., Brahim, T. Ben, Sims, R., Reynolds, L., Czelusniak, V. (2013). Managing cognitive load in introductory programming courses: A cognitive aware scaffolding tool. Journal of Integrated De-sign and Process Science, 17(1), 37–54. doi:10.3233/jid-2013-0004
Statter, D., Armoni, M. (2016). Teaching abstract thinking in introduction to computer science for 7th graders. In: Proceedings of the 11th Workshop in Primary and Secondary Computing Education on ZZZ – WiPSCE ’16. New York, New York, USA: ACM Press, 80–83. doi:10.1145/2978249.2978261

W.J. Rijke et al.90
Sweller, J. (1994). Cognitive load theory, learning difficulty, and instructional design. Learning and Instruc-tion, 4(4), 295–312. doi:10.1016/0959-4752(94)90003-5
The Royal Society. (2012). Shut down or restart? The way forward for computing in UK schools. Technology, (January), 1–122. doi:10.1088/2058-7058/25/07/21
Thijs, A., Fisser, P., Hoeven, M. van der. (2014). 21st Century Skills in the Dutch Curriculum (Dutch: 21e Eeuwse Vaardigheden in Het Curriculum Van Het Funderend Onderwijs). Enschede: SLO.
Wang, M.Te, Degol, J. (2013). Motivational pathways to STEM career choices: Using expectancy-value per-spective to understand individual and gender differences in STEM fields. Developmental Review, 33(4), 304–340. doi:10.1016/j.dr.2013.08.001
Werner, L., Denner, J., Campe, S. (2012). The fairy performance assessment : Measuring computational think-ing in middle school. In: Proceedings of the 43rd ACM Technical Symposium on Computer Science Educa-tion – SIGCSE’12. 215–220. doi:10.1145/2157136.2157200
Wing, J.M. (2006). Computational thinking. Communications of the ACM, 49(3), 33–35. doi:10.1145/1118178.1118215
Wing, J.M. (2008). Computational thinking and thinking about computing. In: IPDPS Miami 2008 – Proceed-ings of the 22nd IEEE International Parallel and Distributed Processing Symposium, Program and CD-ROM, (July). 3717–3725. doi:10.1109/IPDPS.2008.4536091
World Health Organization. (2007). Process of Translation and Adaptation of Instruments. Retrieved on Janu-ary 18 2018, from http://www.who.int/substance_abuse/research_tools/translation/en/
W. Rijke conducted research on computational thinking and 21st century skills through-out his psychology bachelor and master. This current article was carried out for his master’s degree. Now, he works as a researcher at the Radboudumc, Nijmegen, where he investigates the operationalization of the capability approach, as defined by Nobel Prize laureate Amartya Sen, to assess the impact of health technology on children.
L. Bollen studied physics and computer science for higher education at the University Duisburg-Essen, Germany, where he received the PhD degree in 2009 in the field of ap-plied computer science and mobile learning. He then worked as a postdoctoral research scientist in the Department of Instructional Technology at the University Twente, the Netherlands. His research interests include model-based learning, computational model-ling, visual modeling languages and environments, mobile devices in learning scenarios, and (inter)action analysis.
T. Eysink works as an assistant professor in the department of Instructional Technology at the University of Twente, where she combines research and education. She received her doctor’s degree in 2001 by the defense of her thesis called “Signs for logic teaching: The effect of instructional variables on the development of conceptual knowledge of logic”. Since then, she continued doing research on learning and instruction in science education.
J. Tolboom works as a mathematics and informatics curriculum developer for upper secondary education at the Netherlands Institute for Curriculum Development. His re-search interests focus on curricular and didactical aspects of STEM education, with an emphasis on the utilization of technology for mathematics and informatics education.
Computational Thinking in Primary School: An Examination of Abstraction ... 91
Appendix. A Student questionnaire
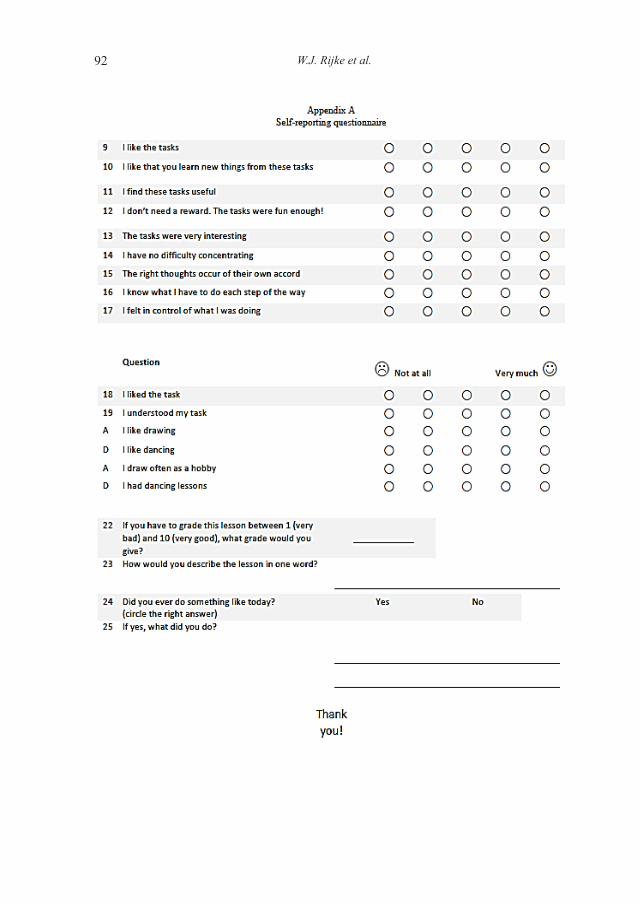
W.J. Rijke et al.92