computational tissue analysis-based quantification of
TRANSCRIPT
© Flagship Biosciences, Inc. 2017 7575 W. 103rd Ave Suite 102 Westminster, CO 80021 - 303.325.5894 - www.flagshipbio.com - [email protected]
FlagshipBio.com | [email protected]
Computational Tissue Analysis-Based Quantification of Tumor-Infiltrating Leukocytes Using Morphometrics in Immunohistochemistry-Stained NSCLC Samples
Elliott Ergon, Allison S. Harney, Will Paces, Kristin Wilson, Karen Ryall, Daniel Rudmann, Brooke Hirsch, Joseph Krueger
Background:Quantification of tumor-infiltrating lymphocytes (TILs) is predictive of patient response to immunotherapy regimens. Because of the role of anti-PD-L1 and anti-PD-1 treatments in promoting tumor-specific cytotoxic T-cell responses, the identification and quantification of TILs and PD-L1-positive tumor cells by immunohistochemistry (IHC) may provide important information for disease prognosis. Using Computational Tissue Analysis (cTA™)-based morphometric features instead of an IHC-based lymphocyte assay enables a simpler workflow for TIL assessment and can be combined with additional IHC assays, enabling the identification and classification of immune cell subsets within the complex tumor microenvironment (TME).
Materials and Methods:Non-small cell lung cancer (NSCLC) samples were stained with IHC assays for CD45, CD3, CD8, and PD-L1. Serial sections were stained with appropriate isotype-negative controls. cTA tools were used to determine the morphometric parameters that identified hematoxylin-stained leukocytes on isotype-stained slides and used to quantify the total immune cell population in tumor nests and surrounding stroma. The same morphometric ruleset was used to quantify total leukocytes in CD45-, CD3-, CD8-, and PD-L1-stained tissues. The results of this analysis were then compared with the results of the biomarker-specific assay to evaluate the frequency of biomarker-positive TILs in the context of total infiltrating leukocytes quantified by the cTA ruleset.
Results:Morphometric parameters were established that determined that the number of hematoxylin-stained leukocytes correlated with the number of leukocytes identified by CD45 in serial sections. The relative populations of CD3-positive and CD8-positive TILs were consistent with available literature findings. The cTA morphometric ruleset separated PD-L1-positive leukocytes from PD-L1-positive tumor staining in the tumor nests and surrounding stromal tissue.
Conclusions:Methods were developed that use morphometric features to identify the total number of infiltrating immune cells in tumor tissues stained with hematoxylin and eosin or by IHC biomarker assays. These methods provide an additional dimension of data without requiring additional biomarker staining. In some IHC assays, like anti-PD-L1 assays, both the immune infiltrate and tumor cells may stain positive, and the accuracy and precision of quantifying one population by visual pathology is hindered by the staining of the second population. The cTA-based methods can be used to aid pathologists in the interpretation of these types of biomarker assays in which both tumor cells and immune infiltrates may stain positive.
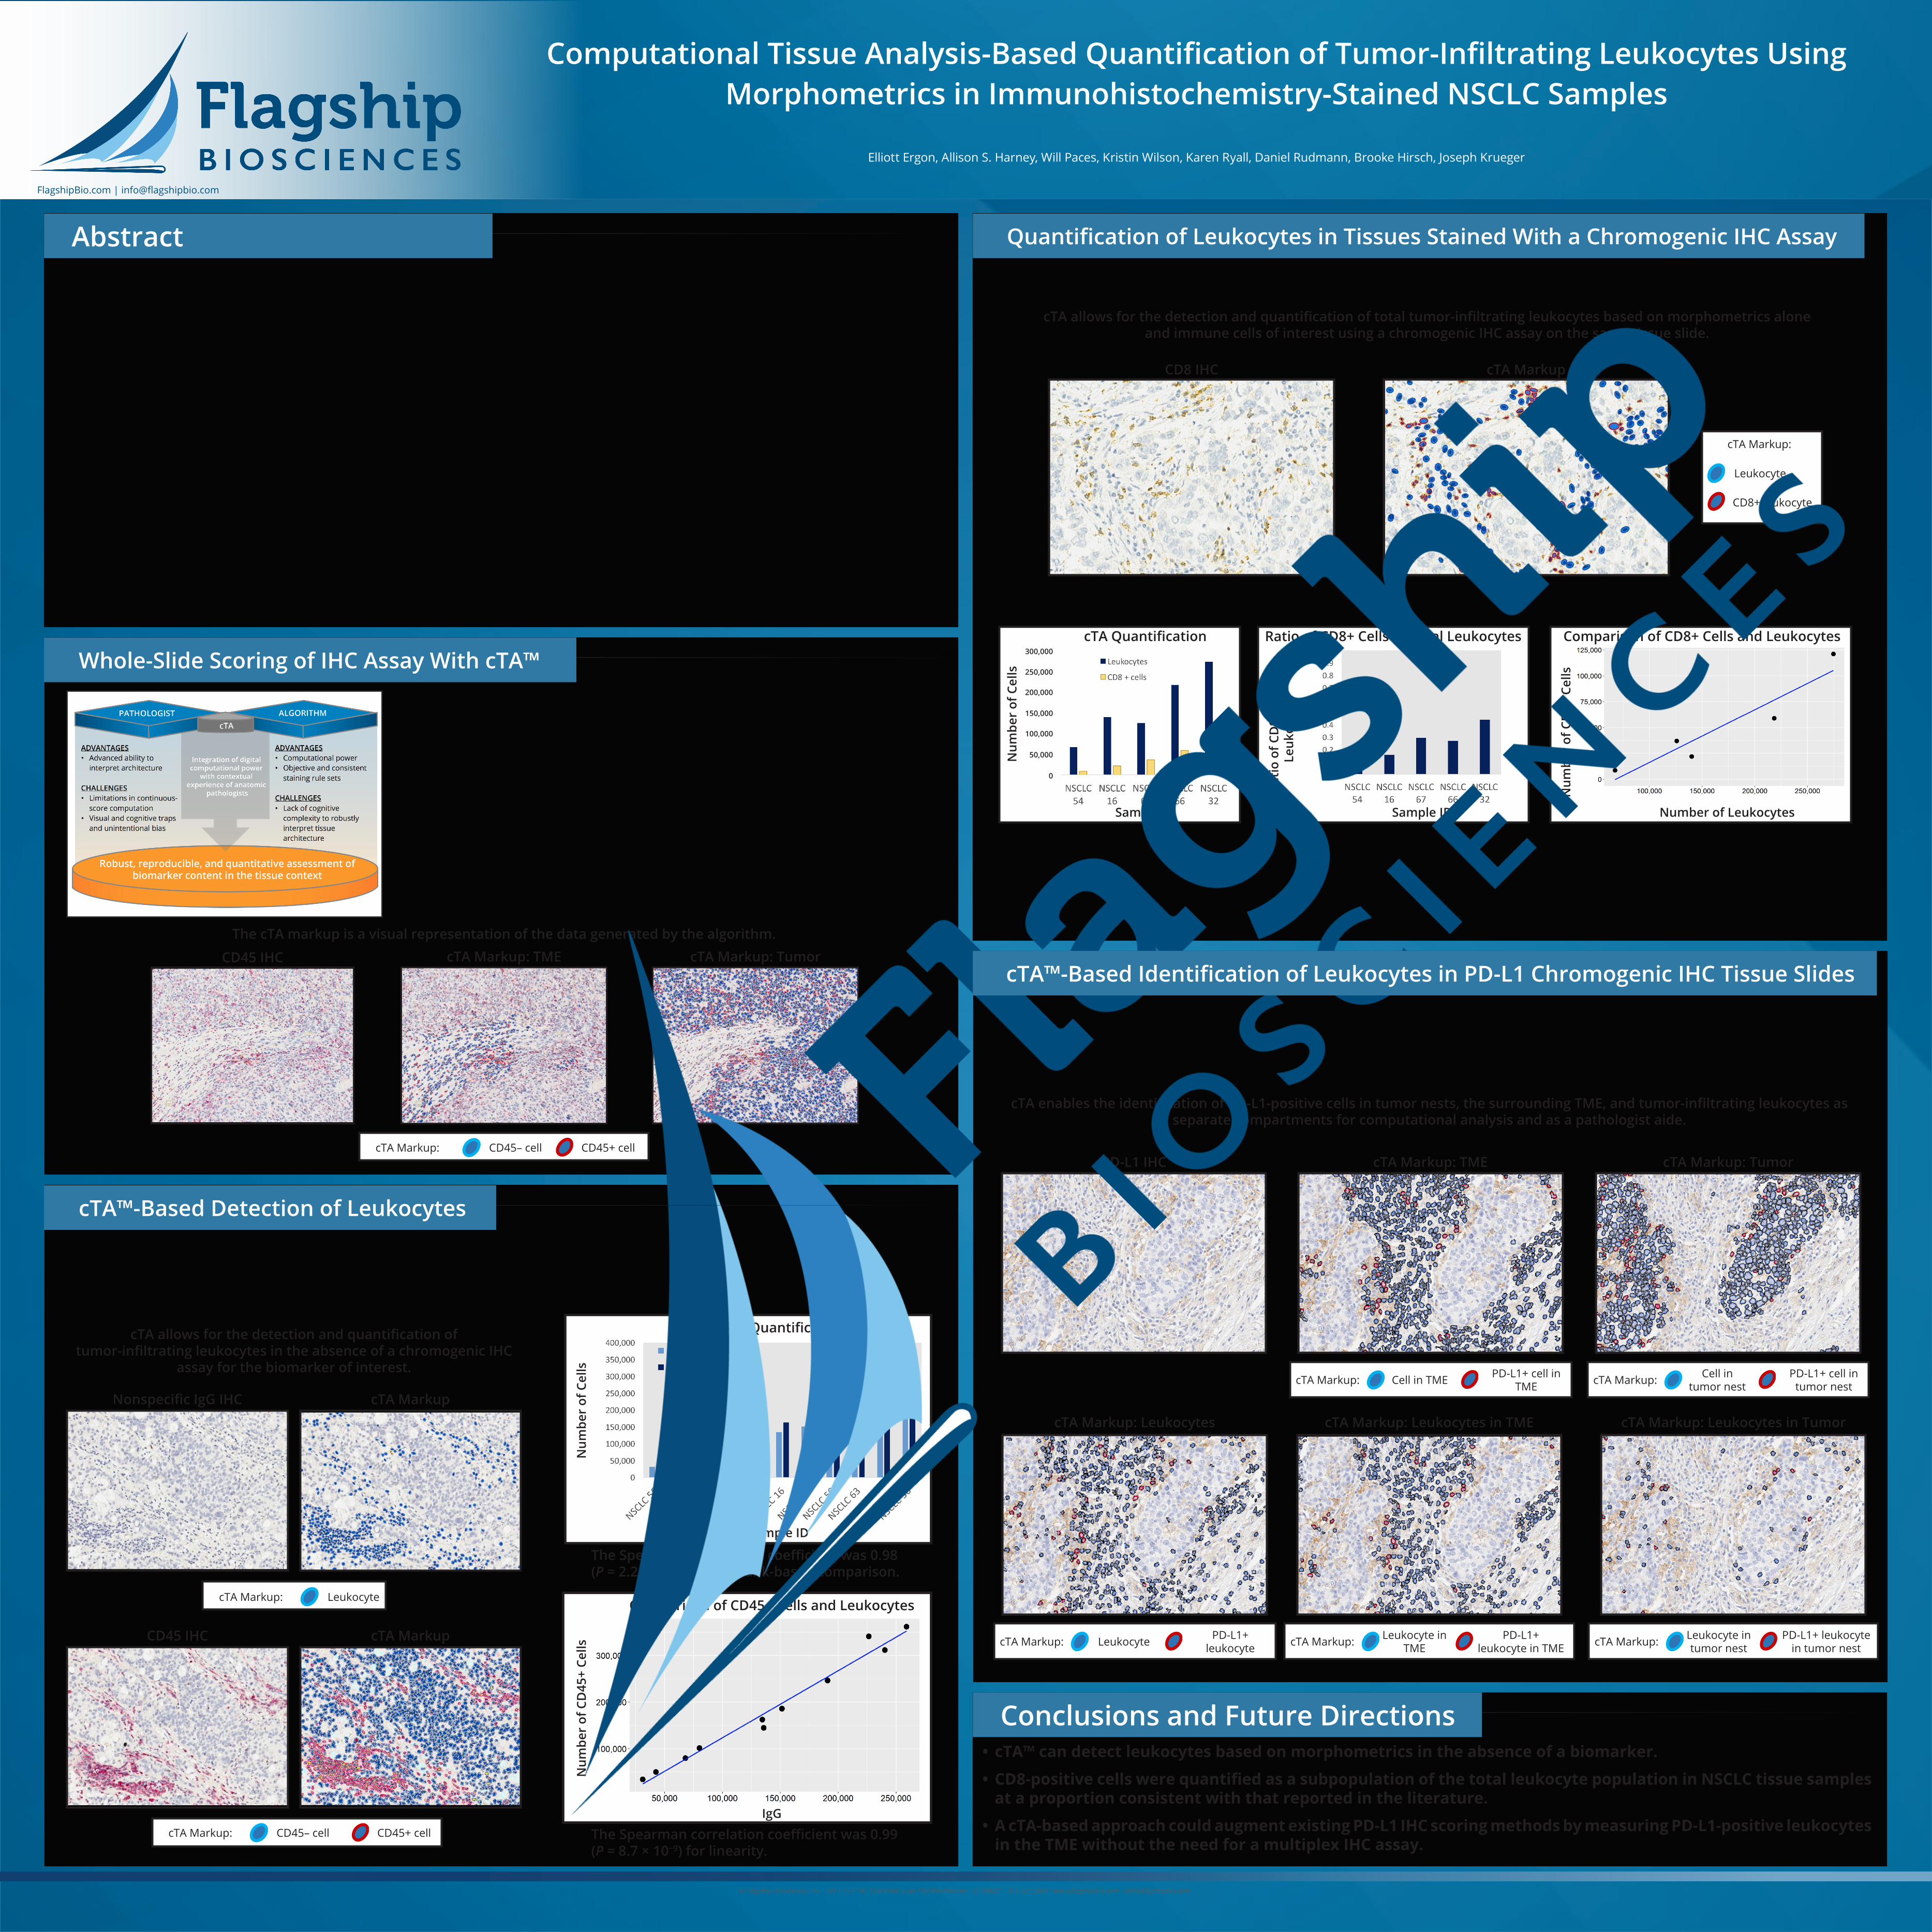
Image analysis tools overcome some of the challenges in conventional anatomic pathology practice, particularly analyzing complex tissue architecture and heterogeneous biomarker expression. Algorithms analyze the tissue captured in the high-resolution image and provide a digitally derived score. The use of cTA™-assisted scoring allows for direct cell counting and scoring across the whole slide, as compared to whole-slide estimated scores derived from manual scoring.
Flagship’s cTA platform uses tissue morphometrics to select features for analysis. The cTA platform can be used to separate tumor nests from the surrounding stroma into separate layers for subsequent analysis. This feature allows for the quantification of biomarkers in tumor nests and stroma individually without requiring an IHC biomarker for tumor cells, such as the typically used pan-cytokeratin. The use of tissue morphometrics is particularly applicable in immuno-oncology, where a TIL biomarker such as CD45 can be quantified in both the tumor nests and surrounding stroma (or TME), as seen below.
A cTA™-based scoring algorithm was developed for the detection of leukocytes in NSCLC tissues stained with a nonspecific IgG antibody and hematoxylin based on morphometric features that distinguish leukocytes. Algorithm performance was reviewed for accuracy by a Flagship pathologist to ensure the algorithm was not misclassifying nonleukocyte cells (ie, tumor cells) that are visually different from typical leukocytes. The numbers of cells detected by both methods were compared across serial sections. The total number of leukocytes or CD45-positive cells obtained from chromogenic IHC slides was quantified from whole-slide images with pathologist oversight.
The cTA™-based solution for detecting leukocytes based on cellular morphometrics in hematoxylin-stained tissues was applied to a tissue sample stained with a CD8 IHC assay. CD8-positive cells were quantified using a cTA-based solution to identify biomarker-positive cells with the chromogenic IHC assay.
The cTA solution identified the CD8-positive cells and additional cells containing features of leukocytes.
A comparison of the number of leukocytes with the number of CD8-positive cells had a Pearson correlation coefficient of 0.94 (P = .083) for linearity.
The Spearman correlation coefficient was 0.90 (P = .018) for the rank-based comparison of CD8-positive cells and leukocytes.
A comparison of the quantification of total leukocytes calculated using cTA versus CD8 chromogenic IHC staining demonstrates that CD8-positive cells are a subset of the total leukocyte population, comprising an average of 26% of the total leukocyte population. These data are consistent with literature reports of CD8-positive cells representing approximately 15% to 40% of CD45-positive leukocytes (Kuo et al. 1998; Ganesan et al. 2013).
PD-L1 expression is increased in both tumor cells and infiltrating immune cells in NSCLC. The pathologist scoring paradigms for PD-L1 companion and complementary diagnostic IHC tests differentially include assessment of tumor cells or both tumor cells and TILs. To aid pathologists in assessing PD-L1 IHC assays for positivity of tumor cells and TILs, the cTA™-based solution detecting leukocytes based on cellular morphometrics in hematoxylin-stained tissue slides was applied to NSCLC tissue samples stained with the PD-L1 IHC assay (Cell Signaling Technology clone E1L3N). PD-L1-positive cells were quantified using a cTA-based solution to identify biomarker-positive cells in the total leukocyte population, TME, and tumor compartments.
• cTA™ can detect leukocytes based on morphometrics in the absence of a biomarker.
• CD8-positive cells were quantified as a subpopulation of the total leukocyte population in NSCLC tissue samples at a proportion consistent with that reported in the literature.
• A cTA-based approach could augment existing PD-L1 IHC scoring methods by measuring PD-L1-positive leukocytes in the TME without the need for a multiplex IHC assay.
The cTA markup is a visual representation of the data generated by the algorithm.
cTA Markup: CD45– cell CD45+ cell
CD45 IHC cTA Markup: TME cTA Markup: Tumor
cTA allows for the detection and quantification of tumor-infiltrating leukocytes in the absence of a chromogenic IHC
assay for the biomarker of interest.
Nonspecific IgG IHC cTA Markup
CD45 IHC cTA Markup
cTA Markup: CD45– cell CD45+ cell
cTA Markup: Leukocyte
cTA Quantification
Comparison of CD45+ Cells and Leukocytes
Num
ber
of C
ells
Num
ber
of C
D45
+ Ce
lls
Sample ID
IgG
The Spearman correlation coefficient was 0.98 (P = 2.2 × 10⁻¹⁶) for the rank-based comparison.
The Spearman correlation coefficient was 0.99 (P = 8.7 × 10⁻⁹) for linearity.
cTA allows for the detection and quantification of total tumor-infiltrating leukocytes based on morphometrics alone and immune cells of interest using a chromogenic IHC assay on the same tissue slide.
cTA MarkupCD8 IHC
cTA Markup:
Leukocyte
CD8+ leukocyte
cTA Quantification
Num
ber
of C
ells
Sample ID
Ratio of CD8+ Cells to Total Leukocytes
Rati
o of
CD
8+ C
ells
to
Leuk
ocyt
es
Sample ID
Comparison of CD8+ Cells and Leukocytes
Num
ber
of C
D8+
Cel
ls
Number of Leukocytes
cTA enables the identification of PD-L1-positive cells in tumor nests, the surrounding TME, and tumor-infiltrating leukocytes as separate compartments for computational analysis and as a pathologist aide.
PD-L1 IHC cTA Markup: TME cTA Markup: Tumor
cTA Markup: Cell in tumor nest
PD-L1+ cell in tumor nest
cTA Markup: Leukocytes
cTA Markup: Leukocyte PD-L1+ leukocyte
cTA Markup: Leukocytes in TME
cTA Markup: Leukocyte in TME
PD-L1+ leukocyte in TME
cTA Markup: Leukocytes in Tumor
cTA Markup: Leukocyte in tumor nest
PD-L1+ leukocyte in tumor nest
300,000
250,000
200,000
150,000
100,000
50,000
0
cTA Markup: Cell in TME PD-L1+ cell in TME
Abstract
Whole-Slide Scoring of IHC Assay With cTA™
cTA™-Based Detection of Leukocytes
Quantification of Leukocytes in Tissues Stained With a Chromogenic IHC Assay
cTA™-Based Identification of Leukocytes in PD-L1 Chromogenic IHC Tissue Slides
Conclusions and Future Directions