computer modeling electrical …/67531/metadc780806/m2/1/high... · firing set & contact fuze...
TRANSCRIPT

COMPUTER MODELING OF ELECTRICAL PERFORMANCE OF DETONATORS*
Carlton M. Fumberg Reliability and Electrical Systems Department
Sandia National Laboratories / California Livermore, CA 94551-0969 USA
Gregg R Peevy Explosives Components Department
William P. Brigham Explosives Projects and Diagnostics Department
GregoIy R Lyons Firing Set & Contact Fuze Department
Sandia National Laboratories / New Mexico Albuquerque, NM 87185-5800 USA
ABSTRACT
An empirical model of detonator electrical performance which describes the resistance of the exploding bridgewire (EBW) or exploding foil initiator (EFI or slapper) as a function of energy deposition will be described. This model features many parameters that can be adjusted to obtain a close fit to experimental data. This has been demonstrated using recent experimental data taken with the cable discharge system located at Sandia National Laboratories. This paper wil l be a continuation of the paper entitled “Cable Discharge System for Fundamental Detonator Studies” presented at the 2nd NAS A/D OD/D OE Pyrotechnic Workshop.
*This work was supported by the United States Department of Energy under Contract DE-ACO4- 94AL85000.
INTRODUCTION
This paper is a culmination of two papers previously written by the authors’”. Portions of these two papers are repeated to present information in one place and to give continuity. In addition to this, electrical circuit simulation of the Cable Discharge System (CDS) used to characterize the detonators of interest, lessons learned on the CDS voltage probe and the CDS gas switch, a custom high voltage switch, and prediction of performance of a new EBW detonator are presented.
High energy detonators have been used for various purposes in weapon designs over the years. One type uses an exploding bridgewire (called an “EBW detonator), typically gold, to initiate the explosive material mounding the wire. The wire, which has dimensions on the order of 1.5 mils (0.0015 inch) in diameter by 10 mils in length forms a bridge between two large (in a relative sense) electrical pins (0.040 inch diameter). Energy is delivered to the detonator at a high rate from a high voltage source (typically a capacitive discharge circuit that gives an exponentially decaying sinusoidal signal) causing the bridgewire to explode in nanosecond timefi-ames at a current level of
DISCLAIMER
Portions of this. document may be illegible in electronic image products. Images are produced from the best available original document.

hundreds to thousands of amperes. The resistance of the EBW is extremely nonlinear during the firing process, starting out very low, milliohms to tens of milliohms, and peaking at a maximum value on the order of a few ohms, and then decaying to a value which is typically significantly higher than its initial resistance. Another type of detonator uses an Exploding Foil Initiator (“EFP’ or “Slapper”) detonator which consists of a thin copper bridge foil that is deposited (typically by electro-chemical or physical vapor processes) on a thin polyimide film. The bridge is burst (the condition in which the bridge foil is vaporized by electrical energy and an arc breakdown occurs) by a low inductance firing circuit (typically a capacitive discharge circuit that gives an exponentially decaying sinusoidal signal) that is matched to rapidly deliver both high voltage and current at time of burst. A barrel is aligned to the polyimide film opposite the side with the deposited copper bridge. As the bridge is vaporized at burst, the resulting high pressure gas shears out a portion of the polyimide film and propels it down the barrel to impact the explosive. The flyer then shock initiates the explosive at impact. The EFIs typically, but not always, require more energy to f i e than the EBWs but have similar resistance characteristics starting initially at a few milliohms, peaking at a value in the hundreds of milliohms, and then decaying to a value in between the two extremes. Time of EBWBFiI “burst” is defined as the time of maximum resistance.
New data have recently been taken by G. R. Peevy and W. P. Brigham using a cable discharge system, “CDS”, and modem instrumentation, to provide accurate information on old and new detonators until well after EBWBFI burst*. The constant current through the EBWBFI and the voltage developed across the EBWBFI are digitized at one-nanosecond intervals for the width of the first positive going current pulse, approximately three microseconds. These data are used to provide plots of EBWBFI resistance as functions of the energy absorbed and the action (time integral of the current squared) delivered. Figures 1 and 2 show the resistance of an EBW and an EFI respectively as a function of energy absorbed using data taken with the cable discharge system. A mathematical model has been developed by C. M. Fumberg which descriies this resistance vs. energy behavior.
1.5 x 10 Mil Gold EBW Detonator Tested at 300 Amperes
Until recently, most of the computer modeling of detonators within Sandia National Laboratories (SNL) used “look-up” tables based upon experimental data obtained many years ago using high voltage, coaxial cable, discharge systems. ”his test circuit provides an adjustable, constant-current source with a fast rise time that is ideal for obtaining the electrical characteristics of EBWsBFIs. Unfortunately, some of the data recorded was on bridgewires that were tamped (confined) with grease or other materials that were not representative of the conductive nature of the explosive powders normally loaded around them in a real application. Also, the old data do not characterize well the resistance of the EBWBFI after time of burst since this time regime was thought to be of less importance. However, to determine operating margins for energy delivery systems, conduct system fault studies, simulate system test anomalies, perform system retrofit scenarios, and investigate new designs it is important to accurately model the bridgewire with explosive powders and determine the resistance over the entire time of operation.
0.00 0.01 OB2 Om 0.04 0% 0.06
Energy Absorbed In Brldgewlre fJoUles)
Figure 1. Resistance as a function of energy for an EBW
20 x 20 x 0.2 Mil EFl Detonator Tested at 3,800 Amperes
0.7
0.1
0.0 0.0 0.6 i.0 1.6
Energy Absorbed In Foll (joules)
Figure 2. Resistance as a function of energy for an EFI
2 American Institute of Aeronautics and Astronautics

Although the mathematical model describing the resistance vs. energy behavior of the detonator is generic, this paper will discuss how it is implemented in the MicroSim Schematics and PSPICE circuit analysis software package3. BY implementing the detonator as an electrical circuit model within PSPICE, this will offer the designer and analyst a useful tool. As a design tool, it will allow the designer to reach final development hardware more rapidly, efficiently, and economically. The designer then can determine circuit margins (monte car10 and worst case analysis), optimize circuits, conduct enhanced circuit analysis, investigate resonant frequencies of fairly complex circuits, and perform analog behavioral modeling of complex systems. As an analytical tool, it will allow the analyst to investigate system anomalies, conduct fault analysis, and perform margin analysis.
CDS DESCRIPTION AND MODEL
The Cable Discharge System (CDS) has been described in the previous referenced paper and is being partially repeated here for continuity*. The cable discharge system (CDS), operated by W. P. Brigham, resides at Sandia National Laboratories / New Mexico in the Explosives Component Facility (ECF) and consists of the following hardware:
Four 1000 foot long rolls of RG218 coaxial cable A high-voltage power supply (100 kV, 5 mA) A gas pressurized, self-breaking switch A gas system for pressurizing and venting the switch Custom output couplings with integral current viewing resistor (CVR) - Flat cable coupling for testing of exploding foil
- Coaxial coupling for testing of exploding initiators (EFl)
bridgewires (EBW) Instrumentation for measuring: - System current - current viewing resistor (CVR) - Voltage across the EBWEFI bridge elements -
voltage probes - Free-surface velocity of flying plate and particle
velocities at interfaces for determining device output pressure - velocity interferometer system for any reflector (VISAR)~
0 Tektronix DSA602A digitizers 486DX33 PC
The VISAR is used to measure the free-surface velocity of the flyers of an EBW or EFI. It also can be used to measure particle velocity at a window interface which in tum, through the use of Hugoniot curves, can determine the explosive output pressure of an EBW.
The CDS is operated by pressurizing the output switch with nitrogen, charging the cables up to a pre- determined voltage which will deliver the required current to the device being tested when the switch is operated. The switch is operated by venting the gas with a fast-acting solenoid valve. Current from the CVR is used as a trigger source for the data recording system. A schematic descriiing the CDS is shown in Figure 3. An example of current and voltage waveforms of the CDS fired with a 1 o h m load across the exploding foil initiator (EFI) coupling are shown in Figure 4 (the leading edge of the first positive going current pulse).
w2%2--= I - Z % - W a ' % n r r u * .- Figure 3. Schematic of Cable Discharge System
DSA 602A UlGI.TIZIHG SIGNAL ANALYZER . date: 18-NOV-94 tine: 10:06:55
Figure 4. V and I Trace of CDS with 1 ohm Load
3 American Institute of Aeronautics and Astronautics
-.

In order to better understand the CDS, a circuit Table2. Parametric Studies Summary simulation was performed by G. R. Lyons using the MicroSim Schematic and PSPICE software package3. The test fixtures for both the EFI and EBW setups were characterized from the load side to the high voltage switch with an HP4194A Impedance / Gain Phase Analyzer at a frequency of 14 Mhz using the equivalent circuit function. Since both setups were characteristically coaxial, the equivalent circuits shown in Figure 5 were used to develop the CDS model. In both cases, the measurements were made looking in from the load side to the gap switch. The test load characterization is shown in Figure 6. Resonant frequency of the one ohm load was 177 Mhz. So the voltage overshoot on leading edge (approximately 9 Mhz) does not approach resonant frequency of the load proving that the overshoot is characteristic of the system. Figure 3 shows the model that represents the EFI fixture for the CDS. Figure 7 shows the simulation results. Comparison of simulation to experiment is given in Table 1. A parametric study of switch transition time using the PSPICE Time-Dependent Switch model was performed to see how switch transition time affected model results, see Table 1. Parametric studies were also conducted on the remaining CDS characteristics of interest. The results are given in Table 2. The switch transition time affected the results the most.
Cable Discharge System Model
Parametric Studies Summary f
Cable Discharge System Model
. - . -. . . ._
With gap switch shorted lo ground. L and R meumernent.
EFIFixlurc; @ 1 4 M 4 L = 13139nH. R = 0.208 ohm
With gap switch open. C meuuremcnt.
EFlFixture; @ 1 m C - 148pF
Figure 5. Equivalent Circuits for CDS Model
Table 1.Comparison of CDS Simulation to Experiment
Cable Discharge System Model
Switch Transition Time Parametric Cable Discharge System Model
thn-30nS 6.24 1.40 3.10 4 U 2.3
h-ua 5.20 5.61 41.0 2 3
nnn- ISOd 3.91 6.73 313 2.26 -
Test Load Characterization
L = 28.55 n€I C = 28.43 pF R = 1.03 ohm
NOIB 1
= 2 p p 3 -
= 177MIIz
Figure 6. Test Load Characterization
4 American Institute of Aeronautics and Astronautics

Figure 7. CDS. Simulation Results.
DIFFERENTIAL VOLTAGE PROBE A custom voltage probe was needed to accurately measure high frequency, high amplitude voltages across bursting bridgewires. Initially, a probe consisting of a 1OOO:l voltage divider circuit connected across the bridgewire with a low inductance flat cable was investigated. The capacitance of the flat cable turned out to significantly affect circuit impedance at the frequencies of interest. A second attempt was made by putting the same 1OOO:l divider across the bridge using RG-59 coaxial cable and adding a fast rising current viewing transformer (CVT). This was an improvement, however since the circuit was not tied to ground, noise due to the fast rising current input was still encountered.
A differential voltage probe was then tried and the measurement was significantly improved. A schematic of the DV probe in shown in Figure 3. The DV probe uses a Solid Core AC current transformeq either a Tektronix CT-1 (mV/mA sensitivity, .35 ns rise time, 1.0 E-06 A-s product) or a CT-2 (1 mV/mA sensitivity, .5 11s rise time, 50 E-06 A-s product). A 5X attenuator is used with the DV probe that has the CT-2 CVT so that in both cases there is a 1OOO:l voltage step-down divider ratio. The circuit is referenced to ground so that it is not floating as in the previous voltage probes. The difference in voltage is shown as current in both legs passed through the CVT in opposite directions subtracting currents and yielding a signal that is the true fidelity of the differential voltage. Passing the current of each leg through the transformer in opposite directions also gives common mode rejection. The leads were shielded and kept to a minimum length to minimize inductance and noise pickup. The DV probe is calibrated using a Velonix pulser using a divider traceable to NIST. DV probe was calibrated in SNL primary standards lab. A 7 ps
Impedance/Gain Phase Analyzer at a frequency of 14 Mhz using the equivalent circuit function. A frequency of 14 Mhz is typical of detonator functions under investigation. The DV probe was also put into the CDS circuit simulation to determine that it did not load down the CDS. This was also verified experimentally by putting a known current through a one ohm load and measuring the voltage across it.
LESSONS LEARNED ON CDS GAS SWITCH Tests conducted at high voltage in order to obtain high current levels had sporadic switch breakdown along the insulatorlgas interface. At voltages above 45-50 kV, when the nitrogen gas was vented from the switch, it was discovered that the voltage and current were not going from electrode to electrode but from the lower electrode along the surface of the delrin insulating sleeve past the upper O-ring that seals between insulating sleeve and the delrin plug (that the upper output electrode mounts to), and finally to ground at the surface of the brass cap of the switch housing, see Figure 8.
Brass housisng cap Delrin uDDer electrode holder
Delrin insulating sleeve
Figure 8. Original Gas Switch
5 American Institute of Aeronautics and Astronautics
-__

The first attempt at solving the problem was made with the goal of not having to modify the switch hardware. It was resolved to be more careful about keeping the switch cavity clean. Secondly, the buna-N O-rings (which require lubrication) were replaced with Viton O-rings (which require no lubrication). It was thought that perhaps a greased O-ring left a film on the surface of the insulating sleeve which could retain any debris that might be blown off the electrodes during previous firings and cause a more conductive path along the surface. At first, it was thought that the problem was corrected, but after a small number of shots it was evident that it still existed.
From that point, it was decided to consult Sandia National Laboratories experts from the Pulsed Power area. They looked the system over and saw no major flaws in the system design. They reiterated the need of cleanliness and they recommended that the upper electrode holder be modified to remove the threaded holes and screws that hold it to the metal cap, see Figure 9 (Mod 1). These threads can cause an enhancement that would encourage tracking. This was done by building a new plug that had a threaded neck that screws directly in the cap. However, following a few tests, it was determined that the problem sti l l existed.
Brass housing cap Delrin upper electrode holder
Delrin insulating sleeve \Brasrhousing ' \
Lower electrode (Wed) Upper electrode (moveable)
The experts from the Pulsed Power are were consulted a second time in an attempt to diagnose the problem. They looked the system over and explained that electric field-enhancement was occurring at the point that the lower electrode (which had a fairly short radius), the insulating sleeve, and the gas volume come together. The arc was starting at that point and running up the surface when at high voltages instead of going across the expected gap. They also explained that the breakdown strength along a surface was different than that across a pressurized gap. Across the gap, the breakdown varies as the pressure of the gas varies. Along the dielectric surface the breakdown varies as the gas pressure varies only up to a point then flattens out. So at the high voltages necessary to reach the higher current output, the breakdown of the surface was reached before that of the gap as the gas was vented from the switch.
Their suggestions were to increase the path length for the voltage along the dielectric surface by cutting more grooves in the delrin similar to the already existing O-ring grooves; to change the way the lower electrode seals by removing the O-ring from the diameter and sealing around the individual connectors where the cables plug in; on the lower electrode, make as large a radius as possible to reduce the electric field enhancement; reduce the lower electrode diameter as much as possible to increase the space between it and the insulator wall, also reducing the electric field stress; and move the O-ring seal at the upper end of the switch up as far as possible so that more of the insulator surface is within the pressure boundary.
All of the above suggestions were incorporated and testing showed that we could reliably charge and fire the system at up to 60-kV. However, at the higher voltages necessary for currents greater than 5 kA, tracking along the insulator surface st i l l occurred. After careful inspection, it was discovered that the root of the arc st i l l came from the lower electrode / delrin insulator / gas interface. As a result of this finding, some of the delrin material in this area was machined out to give more space between it and the electrode. With this modification, it was possible to charge and trigger the system successfidly up to 75 kV which gives close to 6 kA, see Figure 10 (Mod 2).
Figure 9. Gas SwitchMod 1
6 American Institute of Aeronautics and Astronautics

Brass houslsng cap Delrin upper electrode holder
Delrin Insulating sleeve
Upper electrode (moveable) Figure 10. Gas Switch Mod 2
ADDITIONAL INFORMATION ON CDS Some of the detonators tested required a very high charge voltage to be placed on the CDS to achieve the resultant high current output. When this was first attempted, switch breakdown problems were encountered. These problems were remedied and are explained in the previous section . Once the switch breakdown problem was solved and the current could be delivered, there was then a concern of how much voltage was applied to the posts of the detonator.
Although this did not turn out to be a problem, it was investigated, using the CDS PSPICE model, if the addition of RG218 cables, which would require less charge voltage to produce desired currents, would cause the CDS to be loaded down more with the detonator bridgewire spiking resistance due to decreased CDS circuit impedance. Simulations showed that the circuit would not be loaded down. The simulation also showed that adding cables increased the rise of the current output waveform. The existing high voltage switch can only accommodate a maximum of four cables. Thus, the observed phenomenon was verified experimentally by reducing the number of cables from four to two to one. The resulting current traces are overlaid and given in Figure 11 and were found to exhibit the observed simulation behavior. It was also observed in the experiment that although current rise was reduced by reducing number of cables, there was a tradeoff in increasing noise in the leading edge.
DSA 602A D I G S R Z I N C 61- ANALYZlSK date: 24-HAR-95 eino: 17:20:26
......... ......... ....... : i : i i
_-I-. - I A. Rns
Figure 11. Effect of Addition of Cables to CDS
CUSTOM HIGH VOLTAGE SWITCH A custom high voltage switch that is more characteristic of some switches used at SNL is shown in Figure 12. This switch is based upon action (integral of current squared) accumulated in switch and an exponential switch closure resistance fimction. The MicroSim PSPICE nonlinear resistive switch model which is controlled by closure time, initial resistance, and final resistance was used initially in the modeling of the CDS and was matched to data by adjusting switch parameters as mentioned in the previous section. The custom high voltage switch model was then applied to the CDS and the results are given in Figure 13. Note that the amplitude of the oscillations on the voltage waveform more closely match that of the data.
K-7 IP4
Figure 12. SNL Action Based Switch
7 American Institute of Aeronautics and Astronautics

EXPERIMENTALDATA
The experimental data from the cable discharge system show that the resistance behavior of an EBWEFI depends upon the rate of energy delivery, or, in other terms, the current level used in obtaining the data. As the current level is increased, the energy absorbed in the EBWEFI at time of burst increases significantly while the action delivered at time of burst increases to a much lesser extent. Also the peak resistance decreases as the current level is increased. Therefore, to accurately model a particular EBWEFI over a range of firing or burst currents, several models are required. Generally, experimental data are taken at three different current levels for a particular detonator, nominal operating burst current, threshold burst current (that current at which 50% of the detonators would fire), and a burst current midway in between.
MATHEMATICAL MODEL
The mathematical model of the resistance vs. energy behavior of an EBWEFI consists of two equations. The first equation applies from zero input energy until slightly after the energy at which burst occurs while the second equation applies for higher energies. The first equation, or “early” model, consists of the initial resistance and a Gaussian function with a zero offset correction:
R = RO + AB*(exp(-((G - GO)/AS)2) - 201)
where RO = initial resistance (ohms), AB controls the height of the resistance peak, G = energy absorbed (joules), GO = energy absorbed at burst (joules), AS controls the function width, and 201 = zero offset correction which makes the Gaussian function = zero when G = zero.
The second equation, or “late” model, is a decaying exponential:
R = RO’*exp(-G/(N*GO)) + K
where
RO’ = (A13*(exp(-(((SWPT-1)*GO)/AS)2) - 201) + RO - K) *exp(SWPT/N) (3)
and K = resistance (ohms) when G = infinity. N controls the exponential decay rate while SWPT provides the capability to move the intersection point of (2) with (1) to provide a better fit to the experimental data.
To model the resistance of a particular detonator one must determine its model parameters using experimental data, except for parameter RO which can be calculated laowing the EBWEFI dimensions and material. The other parameters, AB, AS, GO, K, N, and SWPT are determined by trial and error. Since a perfect match to experimental data cannot be accomplished, a practical knowledge of which parameters are more important is helpful. Good results are obtained by fixing the initial resistance, RO, energy at burst, GO, and peak resistance (controlled by AB) while AS, K, N, and SWPT are varied to obtain the best visual fit to the experimental data. It should be noted that there is an interdependency between some parameters which must be taken into account. For example, changing AS will require a change in AB in order to maintain a constant peak resistance.
While parameters can be chosen to give a very good visual match to experimental results (R vs. G), the detonator model can have a serious flaw unless the action at burst is also taken into account in choosing the parameters. If the action at burst is not matched to the experimental value, EBWEFI burst will occur at the wrong time giving erroneous results. With initial resistance and peak resistance fixed, AS is the parameter which must be chosen carefully to match the experimental value of action at burst. In some cases this will result in a visual match to the experimental data that appears less than optimum but, in reality, will provide a more accurate model. On occasion, as a last resort, when a good match with the action at burst cannot be obtained by simply adjusting AS, small increases can also be made to RO to obtain the desired match without significantly affecting computer simulation results. In addition to matching the action at burst, there must also be agreement with resistance in the time domain.
8 American Institute of Aeronautics and Astronautics

Two METHODS TO “SUBTRACT OUT” ENERGY
Measurements of some exploding bridgewires exhibit a significant inductive voltage (occurs during current rise - very high di/dt) in the early part of the waveform that will cause an increase in the calculated energy to burst. This is because the voltage and current waveforms are multiplied and integrated over time to obtain the energy. This inductive voltage does not directly contribute to the heating of the bridge, and should be removed from the energy calculation. It should be noted that the EBW data is more affected than EFI data since there are lower inductance fixtures for handling EFIs,
ATTRIBUTED TO INITIAT-. INDUCTIVE VOLTAGE
One method of handling this inductive initial voltage when constructing detonator models begins with smoothing the voltage and current data with a 5-point smooth routine or a 9-point smooth if the data is particularly noisy initially. Then the important characteristics for the first equation (initial resistance and a Gaussian function with a zero offset correction - discussed in previous section) must be known. Initial resistance is calculated knowing bridge material and dimensions. Resistance at burst is determined from the experimental data and occurs after the initial inductive voltage component. The energy at burst determined from the experimental data is distorted by the initial inductive voltage component which increases the value. The action at burst which is also determined from the experimental data is not appreciably affected by the inductive voltage component
In this method to “subtract out” the energy attributed to the initial inductive voltage, first the resistance of the bridge / foil up to melt temperature must be calculated as a function of energy deposited. In this simplified approach, temperature is calculated from the changing resistance by assuming a constant temperature coefficient of electrical resistance.
where R(G) = resistance at temperature t2 (a), R(tl) = resistance at temperature tl (a), and cc, = temperature coefficient of electrical resistance 6- l ) . Then compare calculated time of “start of melt” with time at which experimental data becomes relatively “clean.” If data becomes relatively “clean” at time of “start of melt” or sooner, the energy due to initial inductive voltage component can be subtracted out.
energy due to initial inductive voltage = experimental energy (start of melt) - calculated energy (start of melt) (5)
The second method is as follows. To calculate a value for the inductance of this inductive voltage component, it is first necessary to accurately determine the resistive portion of the waveform. To do this, the physical properties of the bridge material must be known to calculate the increasing resistance of the bridge as its temperature rises from ambient to melt.
From data giving a relationship between specific heat and temperature for a specific material, thermal energy of the material as a function of temperature can be calculated. Inverting this relationship and converting calories to Joules give us the temperature as a function of the deposited energy in Joules per gram. Combining the previous relationships and performing a least squares fit produces a linear approximation of the resistivity of the material as a direct function of the deposited energy (assuming no energy loss to the surrounding environment).
Because the measured current through the detonator can be very noisy on the fast rising leading edge, to obtain a more usable current rise the actual waveform is assumed to approximate a rising exponential, which is visually fit to the measured data by the operator performing the parameter extraction. This assumption facilitates the calculation of the increasing resistance and provides a well behaved derivative for the computation of the inductance.
After the calculation of the initial resistance of the bridge, based on the physical properties of the material, the deposited energy and increase in resistance for each time step can be computed from the current at the beginning and at the end of the time step and the resistance at the beginning of the time step. The product of the calculated resistance and the measured current is then subtracted from the measured voltage, leaving a voltage that is assumed to be purely inductive. A lease squares fit is then computed, using the inductive voltage and the derivative of the exponential m e fit, to determine the inductance of the detonator. For parameter extraction, the early portion of the measured voltage is replaced by the calculated resistive voltage. For simulation, an inductor is placed in series with the Furnberg model.
9 American Institute of Aeronautics and Astronautics
. .
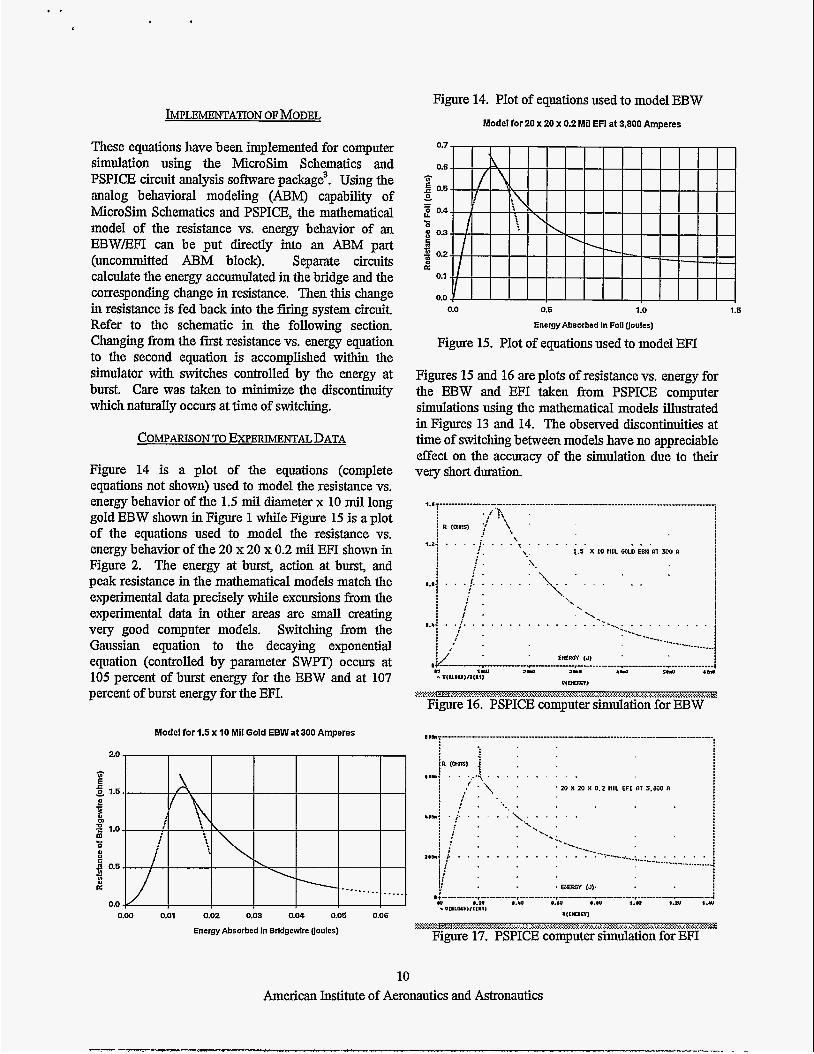
IMPLEMENTATION OF MODEL
These equations have been implemented for computer simulation using the MicroSim Schematics and PSPICE circuit analysis software package3. Using the analog behavioral modeling (ABM) capability of MicroSim Schematics and PSPICE, the mathematical model of the resistance vs. energy behavior of an EBWEFI can be put directly into an ABM part (uncommitted ABM block). Separate circuits calculate the energy accumulated in the bridge and the corresponding change in resistance. Then this change in resistance is fed back into the firing system circuit. Refer to the schematic in the following section. Changing from the first resistance vs. energy equation to the second equation is accomplished within the simulator with switches controlled by the energy at burst. Care was taken to minimize the discontinuity which naturally occurs at time of switching.
COMPARISON TO EXPERIMENTAL DATA
Figure 14 is a plot of the equations (complete equations not shown) used to model the resistance vs. energy behavior of the 1.5 mil diameter x 10 mil long gold EBW shown in Figure 1 while Figure 15 is a plot of the equations used to model the resistance vs. energy behavior of the 20 x 20 x 0.2 mil EFI shown in Figure 2. The energy at burst, action at burst, and peak resistance in the mathematical models match the experimental data precisely while excursions from the experimental data in other areas are smal l creating very good computer models. Switching fiom the Gaussian equation to the decaying exponential equation (controlled by parameter SWPT) occurs at 105 percent of burst energy for the EBW and at 107 percent of burst energy for the EFI.
Model for 1.5 x 10 MI1 Gold EBW at 300 Amperes
2.0
t
2
E
C 0 1.6 P - Ul n i 1.0
0 C Q 0.5 - in P
0.0
Figure 14. Plot of equations used to model EBW Model for 20 x 20 x 0.2 Mil EFI at 3,800 Amperes
0.7
c
0.3 c L 8 0.2 t
0.1
0.0 0.0 0.5 1 .o 1.5
Energy Absorbed In Foll Uoules)
Figure 15. Plot of equations used to model EFI
Figures 15 and 16 are plots of resistance vs. energy for the EBW and EFI taken from PSPICE computer simulations using the mathematical models illustrated in Figures 13 and 14. The observed discontinuities at time of switching between models have no appreciable effect on the accuracy of the simulation due to their very short duration.
~~~~~~
Figure 16. PSPICE computer simulation for EBW
10 American Institute of Aeronautics and Astronautics

I
Accurate computer models for many EBWs and Ems of various sizes and materials have been created using the mathematical models described in this paper. Much of the success is attributed to the flexibility provided by the large number of parameters that can be adjusted to closely approximate the experimental data. Also, the ability to divide the resistance behavior into two energy regimes described by different equations, which the electrical circuit simulator can switch between, has beenvery helpful.
COMPUTER PREDICTION VS. DATA Recently, SNL Explosive Subsystem and Materials group was requested to aid in the design of a new detonator to fit an existing firing set. CDS generated data and a model derived from that data existed on a previous program detonator with materials of interest: nickel bridgewire with CP {2-(5-cyanotetrazolato) Pen- ’ ecobalt @I> Perchlorate} explosive. Data and model are shown in Figure 18. The model does not align due to the fact that the energy calculated from the measured inductive voltage component has been subtracted out of the model. Also note that the rising edge of the gaussian fit of the model did not well fit the “knee” that was seen in the nickel data (this knee was characteristic to nickel material and has not been observed in other materials that are typically used in detonators). The goal was to size the bridgewire to fit the existing firing set and achieve maximum wire size to meet customer specification to minimize effect of RF (radio frequency) induced heating and burst the bridgewire at peak ament for maximum power. Modeling showed that the previous program detonator bridgewire was undersized to meet requirements. Therefore, the model had to be extrapolated by using energy density to bwst and trying larger wires. The schematic of the firing set and the bridgewire size which best met the requirements is shown in Figure 19. The simulation and actual firing waveforms of the detonator bridgewire selected are shown in Figures 20 and 21. As can be seen in Table 4, the simulation compare well to experiment. With the use of the model, the detonator bridgewire was sized without building any hardware and prototype hardware and development test time were significantly reduced.
Table 4. Prediction vs. Data Summarv
I EBW @, 250 A I 0.605 I 1001 I 1590 i MODELvs DATA
1 x20MlLNlCKELEBWAT250AMPS
Figure 18. Model and Data of 1 x 20 mil Nickel EBW
Figure 19. Firing System Schematic
Description
Brigham (data), CDU: 1 pF, 300 m Q 700 nH Model: Brigham, CDS
0.603
Figure 20. Simulation Waveforms
11 American Institute of Aeronautics and Astronautics
A mathematical model for the resistance of high energy detonators as a function of energy absorbed has been descriied. This model uses two equations with seven parameters that can be chosen to closely fit experimental data. The first equation applies to the energy regime until slightly after EBWEFI burst while the second applies for higher energies. These equations have been implemented using the electrical circuit simulator PSpice. Switching between equations is accomplished within the simulator. Accurate computer models for many EBWs and EFIs have been created using the mathematical model descriied.
Figure 21. Detonator Data
MATHEMATICAL MODEL vs. LOOK-UP TABLE
One might question the usefulness of a mathematical model for the resistance of an EBWEFI when a look- up table can be constructed fi-om the original experimental data and readily implemented into an electrical circuit simulator. The major advantage of the mathematical model over the look-up table is the ease with which “what if’ or “worst case” analyses can be performed. One parameter that one likes to adjust for analysis of detonator firing circuits is GO, the energy at burst. This can easily be done with the mathematical model but can be a formidable task when using a look-up table. Also, the mathematical model provides a compact description of any detonator using just seven parameters while the look-up table may contain hundreds of individual data pairs, depending upon the desired accuracy.
The CDS has been fully documented and characterized. Newly obtained data are more accurate and improves computer simulation, electricaVmechanical performance predictions and failure analysis of EBW and EFI detonators. Future plans are to model other EBW and EFI detonators of interest.
REFERENCES
1 C. M. Fumberg, “Computer Modeling Detonators,” presented at the IEEE meeting Spring 1994.
2 G. R Peevy, S. G. Barnhart, and W. P. Brigham, ”Cable discharge system for fundamental detonator studies,” presented at the NASA Aerospace Pyrotechnic Systems Workshop, February 1994, to be published.
3 Corporation, 20 Faiibanks, Imine, California.
PSpice (a registered trademark of) MicroSim
DISCLAIMER
This report was prepared as an account of work sponsored by an agency of the United States Government. Neither the United States Government nor any agency thereof. nor any of their employees, makes any warranty, express or implied, or assumes any legal liability or responsi- bility for the accuracy, completeness, or usefulness of any information, apparatus, product, or process disclosed, or represents that its use would not infringe privately owned rights. Refer- ence herein to any specific commercial product, process, or service by trade name, trademark, manufacturer, or otherwise does not necessarily constitute or imply its endorsement, recom- mendation, or favoring by the United States Government or any agency thereof. The views and opinions of authors expressed herein do not necessarily state or reflect those of the United States Government or any agency thereof.
12 American Institute of Aeronautics and Astronautics