computer science for science - curriculum · web viewnext they consider ways of reducing their...
TRANSCRIPT

The CA Science Framework was adopted by the California State Board of Education on November 3, 2016. The CA Science Framework has not been edited for publication. © by the California Department of Education.
Appendix 3Computer Science in Science
2016 Science Framework for California Public Schools Kindergarten through Grade 12
2016 California Science Framework Appendix 3 Computer Science Page 2 of 72
Appendix 3
Computer Science in Science
Integrating the Practices of Computational Thinking, Computer Modeling, and Simulation to Teach the CA NGSS Appropriate Use of Technology – Bifocal Modeling FrameworkDescription of the VignettesStructure of the Vignettes
Middle School ESS Vignette: Greenhouse Gases
High School LS Vignette: Ecosystems as Complex Systems
High School ESS Vignette: Water Resources and Farming
High School PS Vignette: Modeling Electrostatic Interactions
References
Integrating the Practices of Computational Thinking, Computer Modeling, and Simulation to Teach the CA NGSS By Irene Lee, Director, Project GUTS, Research Scientist, MIT Scheller Teacher Education Program/Education Arcade
Computer science plays a central role in modern scientific research and practice and
in generating economic opportunity in California. Thus, all California students should be
better prepared to incorporate computational concepts and methods as an integral part
of their science education. The inclusion of modern scientific practices of computational
thinking, computer modeling, and simulation are included in the CA Science Framework
to support application of computer science in secondary classrooms. In this appendix, a
variety of examples are offered for forging a deeper connection between computer
science and science and engineering through computer modeling and simulation.
Incorporating these practices has been found to be highly engaging to a wide variety of
students while supporting instruction of specific CA NGSS middle grade and high school
standards.
The CA Science Framework was adopted by the California State Board of Education on November 3, 2016. The CA Science Framework has not been edited for publication. © by the California Department of Education.

2016 California Science Framework Appendix 3 Computer Science Page 3 of 72
A computer model is a computer-based representation of the system that includes
specification of objects or components and their state variables, as well as programmed
relationships among variables or components, based on known scientific theory. When
a computer model is used to mimic the system moving forward in time it is called
computer “simulation.” Computer simulations may be augmented by graphs of
relationships between variables over time, or of how output variables evolve over time
for given input conditions.
Simulations designed for teaching usually include visualizations designed to present
students with a representation of otherwise invisible processes. It is of utmost
importance that students inspect and analyze the computer code that underlies
computer models; therefore we refrain from presenting simulations as black boxes that
cannot be investigated.
The computer models presented in the vignettes that follow are “agent-based
models,” a particular type of computer model in which artificial worlds are created out of
agents, their environment, and interaction between agents and their environment. This
type of modeling is particularly suitable for middle and high school students because the
behaviors of individual agents can be described in computer code without the use of
higher-level mathematics. Instead, students describe the behavior of agents from a first-
person perspective as actions and reactions. Then, when the passage of time is
simulated, emergent patterns appear as a product of the actions and interactions of
agents. Agent-based models have been used by researchers, ranging from young
students to research scientists, as a tool to study the behavior of complex systems.
Computational thinking is a key thinking skill used when engaged in creating and
modifying computer models. Computational thinking is the human thought process used
when deciding what aspects of the real world are important to represent in a computer
model. Computational thinking also is used when developing algorithms to simulate
agent behaviors and analyzing if a computer model is a valid representation of the real
world (for the purposes of answering the question at hand). Computational thinking can
be developed progressively across the grades as students develop algorithms and
describing the components necessary to portray in their computer models.
Understanding that someone has abstracted the real world into a model and has
The CA Science Framework was adopted by the California State Board of Education on November 3, 2016. The CA Science Framework has not been edited for publication. © by the California Department of Education.

2016 California Science Framework Appendix 3 Computer Science Page 4 of 72
developed instructions to tell the components of the model how to behave is
fundamental to understanding what models are made of, what models are good for, and
what limitations models may possess.
Concrete steps can be taken to support the development of computational thinking
in middle and high school students. The first is to read and decode computer models.
For example, in the StarLogo Nova environment, the student can “look under the hood”
and inspect the causal relationships and abstractions that are embedded in a model.
Second, a three-stage progression called Use-Modify-Create can support and deepen
youth’s interaction with computer models. In the “Use” stage, students are consumers of
someone else’s creation. For example, they decode and run experiments using pre-
existing computer models. Over time they begin to modify the model with increasing
levels of sophistication. For example, a student may initially want to change the color of
a character or some other purely visual attribute. Later the student may want to change
the character’s behavior in a way that entails developing new algorithms in code.
Through a series of modifications and iterative refinements, new skills and
understandings are developed as what was once someone else’s model becomes one’s
own. Finally, students reach the “create” stage in which they make a model of their own
either through multiple modifications or starting from a blank slate.
Importantly, modeling and simulation have been shown to have broad appeal and to
provide students from diverse backgrounds and a range of educational needs with
opportunities to successfully engage in modern scientific practice. Project GUTS
(Growing Up Thinking Scientifically) and NM-CS for All (New Mexico Computer Science
for All) serve student populations that are more than 70 percent from underrepresented
groups in Science, Technology, Engineering, and Mathematics (STEM), including
Native Americans, African Americans, Hispanics/Latinos, and young women. In these
programs, students have been able to incorporate their own reality into scientific
investigations through computer modeling and simulation resulting in deep engagement
in CA NGSS content and practices.
The CA Science Framework was adopted by the California State Board of Education on November 3, 2016. The CA Science Framework has not been edited for publication. © by the California Department of Education.

2016 California Science Framework Appendix 3 Computer Science Page 5 of 72
Appropriate Use of Technology – Bifocal Modeling Framework
While computer modeling is a crucial aspect of the CA NGSS, how does it fit into the
broader curriculum? What is the balance between computational investigations and
real-world investigations? This section describes one example of an appropriate
marriage between these different types of scientific experiences that maximizes the
value of each.
In their daily work, scientists and engineers not only make use of computers to
analyze data, communicate, calculate and model systems, but they also employ highly
technical equipment, including specialized probes and instruments, to extend their
ability to experiment with and make observations of phenomena.
The CA NGSS science instruction should include resources for students to engage
with and even design technology-based tools to:
plan and perform investigations
explore and make predictions from provided computer simulations
create new or extend existing computer simulations
understand how these simulations incorporate science theory in their underlying
computational models
analyze and display data
search for information
communicate findings
collaborate
The use of graphing calculators and computer-linked measurement tools greatly
expand students’ ability to measure, record, and analyze a sufficient quantity of data to
reach meaningful conclusions. Creating new, or extending existing computer models
and understanding how simulations incorporate science theory in their underlying
computational models are additional ways that technology is an essential tool for the full
implementation of the CA NGSS. Specifically, students engaged in computer modeling
and simulation use the engineering design cycle as they iteratively develop and refine
their models and exemplify how technology is an essential tool in modern scientific
investigation. The level of complexity in technology use and of students’ capacity for
The CA Science Framework was adopted by the California State Board of Education on November 3, 2016. The CA Science Framework has not been edited for publication. © by the California Department of Education.

2016 California Science Framework Appendix 3 Computer Science Page 6 of 72
computational thinking progresses with each grade level as students develop a deeper
understanding of and ability to reason with data. The need for creating more
sophisticated analysis tools, including coding capability, increases as students engage
in understanding phenomena that are characterized by large data sets or complex
relationships between multiple variables. Because computer models are written in code,
the creation, modification, and inspection of computer models can be achieved if
students are provided with age-appropriate computer science instruction that enables
them to read and edit the code. Organizations and programs such as Code.org
(http://code.org), Santa Fe Institute’s Project GUTS (http://projectguts.org ) , and
Northwestern University’s and NetLogo (http://ccl.northwestern.edu/netlogo/) provide
valuable free resources that create opportunities for students to develop new or use
existing computational models and simulation of systems in the context of life, physical,
and Earth sciences aligned to the CA NGSS.
It is important to note, however, that computer simulations should be used as an aid
and extension to students’ understandings of scientific concepts and should not
completely replace the hands-on experience of interacting with a real experiment and
making sense of real data. The Bifocal Modeling (http://bifocalmodeling.stanford.edu)
project from Stanford University is an example of how to develop experiences for
students through the parallel use of real experiments and computational models of the
same experiment (see figure App 3.1). These activities allow students to learn scientific
content while deepening their modeling skills, use of scientific instrumentation,
computational thinking, and understanding of how science builds knowledge and
engineering solves problems (Fuhrmann et al. 2012; Salehi et al. 2013). Whenever
possible, teachers should emphasize the existing discrepancies between a simulation
and a real experiment to emphasize the limitations, accuracy, and credibility of both
simulation and experiment.
The CA Science Framework was adopted by the California State Board of Education on November 3, 2016. The CA Science Framework has not been edited for publication. © by the California Department of Education.

2016 California Science Framework Appendix 3 Computer Science Page 7 of 72
Figure App 3.1: Representation of the Bifocal Modeling framework from Stanford University.
Source: Transformative Learning Technologies Lab 2013.
Effective science instruction in K–12 uses technology to teach and engage students,
assess students’ demonstration of knowledge in multiple formats and media, and
increase their technological and scientific literacy, and engage students as young
computational scientists. Even in elementary grades, there are many valuable teaching
tools and resources that are accessible through computers, tablets, or even cell-
phones. Choosing how and when to use such tools and resources is an important
element of instructional planning. Too often students’ experiences with technology are
as end-users or consumers of products made by others. In science, it is of utmost
importance that students are not trained to blindly accept the models and theories put
forth by others as black boxes, but instead to use technology to its fullest potential as a
tool.
Curriculum developers also need to attend to the technological and computational
elements. They should ensure that curriculum incorporates high-quality resources such
as those that engage students as creators of models that can be used to run
simulations and, as needed, the use of appropriate computer-linked measurement
probes. Curriculum should also provide links to quality open-source materials and
pedagogical supports for teachers to effectively incorporate these technological tools
and resources throughout their instruction.
The CA Science Framework was adopted by the California State Board of Education on November 3, 2016. The CA Science Framework has not been edited for publication. © by the California Department of Education.

2016 California Science Framework Appendix 3 Computer Science Page 8 of 72
Finally, all science educators should leverage the increased use of technology that is
included in the CA CCSSM and the CA CCSS for ELA/Literacy. For example, searches
for information through the Internet, evaluation of the reliability of informational
resources, and interpretation of data available through external databases are all
important components of the practice of obtaining, evaluating and communicating
information. These technology-related skills are equally important in the context of CA
CCSSM and the CA CCSS for ELA/Literacy as they are for the CA NGSS. All teachers,
not only science teachers, should take advantage of the skills that students develop
across multiple disciplines and should support the on-going development of these skills.
This includes the development and use of computational and technology-based tools in
multiple contexts and learning environments.
Description of the VignettesThe vignettes presented below are examples of how teaching and learning may look
in the classroom when the CA NGSS are implemented. The purpose of the vignettes is
to illustrate how a teacher engages students in three-dimensional learning by providing
students with the opportunity to engage in the Science and Engineering Practice (SEPs)
of computational thinking and the Crosscutting Concepts (CCCs) of systems and
system models to understand Disciplinary Core Ideas (DCIs). It is important to note that
the vignettes focus on only a limited number of performance expectations. It should not
be viewed as showing all instruction necessary to prepare students to fully achieve
these performance expectations. Neither does it indicate that the performance
expectations should be taught one at a time.
The vignettes assume that the students have completed a multi-day introductory
sequence in computer modeling and simulation (e.g. Module 1 of the Code.org
Computer Science in Science curriculum at https://code.org/curriculum/science) in order
to have the necessary skills to perform the modeling required. Students will need basic
skills in reading and modifying computer codes. They will need to interpret an existing
base model, and make modifications to it by adding new codes or altering the ones that
exist.
The CA Science Framework was adopted by the California State Board of Education on November 3, 2016. The CA Science Framework has not been edited for publication. © by the California Department of Education.

2016 California Science Framework Appendix 3 Computer Science Page 9 of 72
Structure of the VignettesThe vignettes that follow describe a series of instructional modules and the CA
NGSS performance expectations (PEs) they meet. Each module follows a common
trajectory across five 50-minute lessons and uses the 5E learning approach. In the first
lesson, students participate in an experience that grounds their knowledge and/or
stimulates prior knowledge on the topic (Engage). In the second lesson, students
inspect the base model to learn about the elements in the model and how the behaviors
and interactions of those elements is implemented. Then the students design and run
an experiment of their choice (Explore). In the third lesson, students modify the base
model to add a variable then experiment with changing a variable and analyze the
impact the change has on the system (Explain). In the fourth lesson, students
brainstorm customizations that can be made to the model to answer new questions.
Then students design new experiments, and implement the alterations to the model
(Extend). Finally, in the fifth lesson, students test their models, run controlled
experiments with the new model as a test bed, collect and analyze data, and share
findings with classmates (Evaluate). An option of two additional days is included for
students to further develop models to investigate human impacts on the system studied
and for designing, implementing, and testing mitigation strategies in the context of the
model. The 5E learning approach parallels the science and engineering practices
(SEPs) of CA NGSS in many ways, but applies them in the perspective of lesson
design. While SEPs should be shared explicitly with students, the 5Es are only for the
benefit of the teacher.
Day 1: Introduction to the module (Engage) Students participate in an
experience that grounds
their knowledge and/or
stimulates prior knowledge
on the topic.
Day 2: Decoding and using the base model to run experiments (Explore)Students inspect the base
model to learn about the
implementation of
behaviors and interactions.
Then the students design
Day 3: Modifying the base model and investigating the impact of changing variables. (Explain) Students experiment with
changing a variable and
witnessing the impact the
change has on the system.
The CA Science Framework was adopted by the California State Board of Education on November 3, 2016. The CA Science Framework has not been edited for publication. © by the California Department of Education.

2016 California Science Framework Appendix 3 Computer Science Page 10 of 72
and run an experiment of
their choice.
Day 4: Extending the model and running an experiment (Extend)Students add a feature to
the modeled system and
design an experiment to
investigate the impact of
the addition on the system.
Then they use their model
to run controlled
experiments and track the
outcomes of subsequent
runs of the model.
Day 5: Testing and evaluation of the model (Evaluate)Students test their models
and consider whether their
models are working and
reflect the real world
phenomenon.
Days 6-7 (optional): Computational science & engineering challengeStudents design and
implement models to
investigate human impacts
on the system and/or test
strategies that might
mitigate system disruption.
Note that each of the three modules described below engage students in the
eight SEPs outlined in the National Research Council’s A Framework for K–12 Science
Education and fulfill specific CA NGSS PEs. Additionally, computer modeling and
simulation present a concrete way to make explicit the links between science and
engineering. Computer models are engineered designs manifested in computer code.
Students engaged in computer modeling and simulation will use the engineering design
cycle as they iteratively design, implement, and refine their models.
The CA Science Framework was adopted by the California State Board of Education on November 3, 2016. The CA Science Framework has not been edited for publication. © by the California Department of Education.

2016 California Science Framework Appendix 3 Computer Science Page 11 of 72
Middle School ESS Vignette: Greenhouse Gases
Vignette Appendix 3.1: Greenhouse Gases in Middle SchoolBy Irene Lee, Director, Project GUTS, Research Scientist, MIT Scheller Teacher
Education Program/Education Arcade
Performance ExpectationsStudents who demonstrate understanding can:
MS-ESS3-3. Apply scientific principles to design a method for monitoring and minimizing a human impact on the environment.* [Clarification Statement: Examples of the design process include examining human environmental impacts, assessing the kinds of solutions that are feasible, and designing and evaluating solutions that could reduce that impact. Examples of human impacts can include water usage (such as the withdrawal of water from streams and aquifers or the construction of dams and levees), land usage (such as urban development, agriculture, or the removal of wetlands), and pollution (such as of the air, water, or land).]
MS-ESS3-4. Construct an argument supported by evidence for how increases in human population and per-capita consumption of natural resources impact Earth’s systems. [Clarification Statement: Examples of evidence include grade-appropriate databases on human populations and the rates of consumption of food and natural resources (such as freshwater, mineral, and energy). Examples of impacts can include changes to the appearance, composition, and structure of Earth’s systems as well as the rates at which they change. The consequences of increases in human populations and consumption of natural resources are described by science, but science does not make the decisions for the actions society takes.]
MS-ESS3–5. Ask questions to clarify evidence of the factors that have caused the rise in global temperatures over the past century. [Clarification Statement: Examples of factors include human activities (such as fossil fuel combustion, cement production, and agricultural activity) and natural processes (such as changes in incoming solar radiation or volcanic activity). Examples of evidence can include tables, graphs, and maps of global and regional temperatures, atmospheric levels of gases such as carbon dioxide and methane, and the rates of human activities. Emphasis is on the major role that human activities play in causing the rise in global temperatures.]
MS-ETS1-1. Define the criteria and constraints of a design problem with sufficient precision to ensure a successful solution, taking into account relevant scientific principles and potential impacts on people and the natural environment that may limit possible solutions.
The CA Science Framework was adopted by the California State Board of Education on November 3, 2016. The CA Science Framework has not been edited for publication. © by the California Department of Education.

2016 California Science Framework Appendix 3 Computer Science Page 12 of 72
MS-ETS1-2. Evaluate competing design solutions using a systematic process to determine how well they meet the criteria and constraints of the problem.
MS-ETS1-3. Analyze data from tests to determine similarities and differences among several design solutions to identify the best characteristics of each that can be combined into a new solution to better meet the criteria for success.
MS-ETS1-4. Develop a model to generate data for iterative testing and modification of a proposed object, tool, or process such that an optimal design can be achieved.
*The performance expectations marked with an asterisk integrate traditional science content with engineering through a practice or disciplinary core idea.
HighlightedScience and
Engineering Practices
[SEP-2] Developing and using models [SEP-5] Using computational and mathematical thinking
[SEP-1] Asking questions and defining problems [SEP-3] Planning and carrying out investigations
[SEP-4] Analyzing and interpreting data
[SEP-6] Constructing explanations and designing solutions
[SEP-7] Engaging in argument from evidence
HighlightedDisciplinary Core Ideas
ESS3.D Global Climate Change
ESS3.C: Human Impacts on Earth Systems
HighlightedCrosscutting Concepts
[CCC-4] Systems and system models
[CCC-5] Energy and matter: Flows, cycles, and conservation
Highlighted California Environmental Principles & Concepts:
Principle I The continuation and health of individual human lives and of human
The CA Science Framework was adopted by the California State Board of Education on November 3, 2016. The CA Science Framework has not been edited for publication. © by the California Department of Education.

2016 California Science Framework Appendix 3 Computer Science Page 13 of 72
communities and societies depend on the health of the natural systems that provide essential goods and ecosystem services.
Principle II The long-term functioning and health of terrestrial, freshwater, coastal and marine ecosystems are influenced by their relationships with human societies.
Principle III. Natural systems proceed through cycles that humans depend upon,
benefit from and can alter.
Principle V Decisions affecting resources and natural systems are complex and involve many factors.
CA CCSS Math Connections: 7.RP.2c-d; MP 1,3,6
CA ELD Connections: ELD.PI.6-8.1,5,6a-b,9,10,11a
CA CCSS ELA/Literacy Connections: SL.6-8.1a-d,4,5; RST.6-8.3,9 WHST.6-8.1
IntroductionMotivated by computing their own carbon footprint and learning about greenhouse
effect, students apply and refine their existing model about Earth’s energy balance. As
budding computational-enabled scientists, students articulate the mechanisms by which
human activities alter the local climate system and ultimately design mitigation
strategies to reduce that impact.
The goal of this vignette is to clarify what is known about climate change, what
scientists believe is happening, and how changes in climate impact our environment
and species by acting as computational scientists! The students will learn to use,
modify, and customize a computer model of the build-up of greenhouse gases and its
impact on the climate. As in many scientific endeavors, the students are challenged to
be precise with their scientific language, to be explicit in describing their conceptual
models, and revise their models as new evidence is produced. As computational
scientists, students they learn to represent conceptual models by decoding, using,
modifying, and creating computer models. As students gain experience with
computational thinking, modeling and simulation, and data analysis, scientific practices
key to the CA NGSS, they gain better understanding of the DCIs and CCCs.
Length and position in course – This vignette describes one week of instruction based
on Project GUTS’ Computer Science (CS) in Science module on greenhouse gases.
The CA Science Framework was adopted by the California State Board of Education on November 3, 2016. The CA Science Framework has not been edited for publication. © by the California Department of Education.

2016 California Science Framework Appendix 3 Computer Science Page 14 of 72
This module describes how computer models can be developed, used, and analyzed in
the context of studying earth-atmosphere systems. Activities related to the urban heat
islands (HS) and the albedo effect will naturally follow from this vignette because this
module sets the stage for understanding feedback loops in complex systems.
This vignette could support and extend students’ existing models [SEP-2] of
Earth’s energy balance (as introduced in IS2 of this course), or the vignette could
provide students initial exposure to the factors that affect a system’s temperature (that
could later be extended to the global scale [CCC-3] of Earth’s climate).
Prior knowledge – This vignette assumes that students have completed a multi-day
sequence introducing computer modeling and simulation (such as module 1 of the
Code.org CS in Science curriculum). Students will need basic skills in reading and
modifying computer codes. They will need to interpret an existing base model and make
modifications to it by adding new codes or altering the ones that exist. While this
vignette provides opportunities to practice those skills, they are not specifically
addressed in this lesson outline.
Teacher background – The Greenhouse Effect
The physics behind the greenhouse effect is well-understood. Solar radiation passes
through the clear atmosphere. While some of it is reflected by the Earth and the
atmosphere, most of the radiation is absorbed by Earth’s surface. Some of the infrared
radiation passes through the atmosphere and some of it is absorbed and re-emitted in
all directions by greenhouse gas molecules. The energy that gets absorbed warms
Earth’s surface and the lower atmosphere.
Certain naturally occurring gases, such as carbon dioxide (CO2) and water vapor
(H2O), trap heat in the atmosphere causing a greenhouse effect. Burning of fossil fuels,
like oil, coal, and natural gas is adding CO2 to the atmosphere. There is now more CO2
in the atmosphere than any time in the past 650,000 years. The Fourth Assessment
Report of the Intergovernmental Panel on Climate Change (IPCC) concluded “that most
of the observed increase in the globally averaged temperature since the mid-20th
The CA Science Framework was adopted by the California State Board of Education on November 3, 2016. The CA Science Framework has not been edited for publication. © by the California Department of Education.

2016 California Science Framework Appendix 3 Computer Science Page 15 of 72
century is very likely due to the observed increase in anthropogenic (of human origin)
greenhouse gas concentrations.”
5E Lesson Design – This sequence is based on an iterative 5E model. See the
Instructional Strategies chapter for tips on implementing 5E lessons.
Day 1: Introduction to Climate Change and the Greenhouse Gases base model (Engage)Students calculate their
personal carbon footprint
and begin to consider how
their everyday actions
contribute to greenhouse
gas emissions. Then they
observe and interact with
the computer model of
greenhouse gases.
Day 2: Decoding and using the Greenhouse Gases model to run experiments (Explore)Students examine and
decode the computer model
then interpret what
mechanisms were
implemented. Then they
run the model to run a
simple experiment.
Day 3: Modifying the base model and investigating the albedo effect (Explain) Students add an
albedo slider and design an
experiment to investigate
the impact of changing the
earth’s albedo. Then they
use the model to run
experiments by changing
the variable albedo in
subsequent runs of the
model.
Day 4: Adding CO2 to the model (Extend)Students reflect on their
carbon footprints and then
extend the base model to
incorporate human CO2
production.
Day 5: Testing and evaluation of the model (Evaluate)Students consider whether
their models are working
and reflect the real world
phenomenon of
greenhouse gases.
Days 6-7 (optional): Computational science & engineering challengeStudents design potential
mitigation strategies and
implement them in their
model. They test the
strategy within the model
and examine its impact.
The CA Science Framework was adopted by the California State Board of Education on November 3, 2016. The CA Science Framework has not been edited for publication. © by the California Department of Education.

2016 California Science Framework Appendix 3 Computer Science Page 16 of 72
Day 1 – Introduction to Climate Change and the Greenhouse Gases base model (Engage)
Ms. P. engages students in a discussion of climate change and greenhouse gases
stimulated by watching an Environmental Protection Agency (EPA) video called “The
Greenhouse Effect” and completing an online activity. The short video serves to provide
discussion points and introduce key concepts related to climate change. In the online
activity, students navigate to an Online Carbon Footprint Calculator on the EPA website
and use the calculator to gain an understanding of how their everyday actions contribute
to greenhouse gas emissions. Next they consider ways of reducing their carbon
footprint. Ms. P asks the students “who is saving more carbon, and why?”, and “What is
the easiest change to make that will reduce carbon emissions, and why?” inviting
students to link their own experience with the topic of the unit.
Investigative phenomenon: Changing the amount of greenhouse gas in the
atmosphere alters the temperature of the Earth.
Next, Ms. P. opens the StarLogo Nova base model of greenhouse gases and uses
the projector to demonstrate how it works to the class. Students are shown how to use
the “set up” and “run forever” buttons to reset and run the model. Ms. P asks students to
tell her what to do next and to interpret what they are seeing when the model is run. She
asks, “What are the elements in this model?” and hears that the model was seen to
contain a sun, solar radiation, reflected solar radiation and infrared radiation. Ms. P
asks, “When the model was run or executed what happens?” and hears various
interpretations of what was seen, including, you hit the ‘show graph’ button and the
temperature will show a big increase,” “the world will continue to get hotter,” and “the
temperature will continue to jump around.” After running the model several times and
comparing [SEP-4] the pattern [CCC-1] of temperature change generated by the
model, students write a summary statement: “Temperature is increasing for a while then
stays around the same temperature.” Ms. P explicitly draws their attention to stability and change [CCC-7], noting that it is common for systems to reach a new stable state
after experiencing a change. Ms. P also notes that each run of the computer model is
slightly different, which leads to a discussion of what computer models are good for and
how they can help us understand climate impacts (ESS2.D).
The CA Science Framework was adopted by the California State Board of Education on November 3, 2016. The CA Science Framework has not been edited for publication. © by the California Department of Education.

2016 California Science Framework Appendix 3 Computer Science Page 17 of 72
Day 2 – Analysis and use of the Greenhouse Gas model to run experiments (Explore)
In the first activity of this lesson the students review familiar code blocks prior to
inspecting the model’s code. Ms. P assigns partners to work together and then assigns
each pair a segment of the model’s code to examine and decode. Students use a
graphic organizer called a “model observation form” to document what each of the
assigned procedures do to simulate the behavior of the Sun, Solar Energy, Heat,
Reflected Energy or The World. After five minutes of decoding, Ms. P asks the students
to share their findings. Following each pair’s reporting out of what mechanisms or
behaviors are implemented in the algorithms, Ms. P asks students if students have
other interpretations of what the code does. Any dissention is resolved by looking closely at the source for evidence [SEP-7] – the code itself. Ms. P concludes the
activity by discussing the main program loop and execution order. She has students
draw a diagram mapping out the sequence of the different procedures and sub-
procedures. She then has students enact their diagram as a physical model with pairs
of students moving around the room from one procedure to the next to the next to
simulate the execution of the code starting with the pressing of the setup button.
Investigative phenomenon: Different surfaces reflect different amounts of energy,
which alters the temperature of the Earth.
In the second activity of this lesson, students learn how to use the model to run an experiment [SEP-3] by changing the variable related to albedo. During their decoding,
students noted the procedures that simulate the behavior of solar radiation as it reaches
the earth. Ms. P makes sure that students can relate this computer code to the flow of energy [CCC-5] in the physical situation by asking, “What happens to the solar energy
when it hits the ground?” Students respond that “Some of the time, the solar energy
turns into reflected energy and heads out into space (the yellow dots). Other times it
shows up as infrared radiation (red dots, ‘heat’). The temperature of the Earth is
determined by how many ‘heat agents’ there are floating around.” In the base model the
code is set so that, “60 percent of the time, the radiation is simply reflected back to
space, but 40 percent of the time a ‘heat’ is generated, causing the temperature to
The CA Science Framework was adopted by the California State Board of Education on November 3, 2016. The CA Science Framework has not been edited for publication. © by the California Department of Education.

2016 California Science Framework Appendix 3 Computer Science Page 18 of 72
increase.” Ms. P asks, “Do you think there are some surfaces that reflect more solar
energy than others?” She points to how different colors of cars seem to get warmer
faster. Students respond that perhaps this “albedo” or the reflectivity of surfaces
depends on the surface type. Ms. P draws the real world connection to ice and snow
that are much lighter than other Earth surfaces and reflect more solar energy. She then
ask, “What do you think would happen if more solar energy was reflected instead of
turning into heat?” Students write down their prediction. Next, students locate this
variable in the code, change the variable to represent a different surface, and start the
model again. She assigns some students to mimic a snowy surface with lighter colors
while other students represent a darker colored surface such as ash after a forest fire.
Ms. P asks the students to compare and analyze [SEP-4] the results of their model
runs and determine whether their prediction is correct. Students find that an albedo
higher than 60 causes [CCC-2] more solar radiation to reflect off the Earth’s surface
and the overall temperature is lower than the base case. An albedo lower than 60
causes more solar radiation to be absorbed and converted to infrared radiation, and the
overall temperature would be higher.
Day 3: Modification of the base model and investigation of the albedo effect (Explain)
In the third activity, students add new computer code to create a slider on the user
interface panel that adjusts the albedo variable, and then design and run more
experiments using the slider to control the albedo. Students then pose questions [SEP-1] about the effect of albedo on the climate model, and to reflect on the real-world
implications of their discoveries. The model allows them to answer all sorts of “what if…”
questions. A graphic organizer Ms. P calls an “experimental design form” guides
students to develop scientific questions that they can investigate using their model. The
form then scaffolds the students into seeing the need to use trials and to clearly identify
the variables. Students design and run their experiment in pairs after specifying which
variable they will change. Within what range? How many trials at each setting? They
use the instrumentation in the model (the graph and the data boxes) to monitor
temperature under the different scenarios, students record the data from the graph.
The CA Science Framework was adopted by the California State Board of Education on November 3, 2016. The CA Science Framework has not been edited for publication. © by the California Department of Education.

2016 California Science Framework Appendix 3 Computer Science Page 19 of 72
Then they analyze [SEP-4] the results of their experiments, document the patterns [CCC-1] in their findings, and use these as evidence to support a claim explaining [SEP-6] one aspect of the system.
Ms. P uses direct instruction to introduce feedback loops, an advanced form of
cause and effect mechanisms [CCC-2]. She describes a feedback loop as a closed
system that has feedback wherein outputs become inputs to the system. There are two
kinds of feedback: reinforcing (or positive) and balancing (or negative). Reinforcing
feedbacks amplify or accelerate a change away from a starting point whereas balancing
feedback dampens, slows down, or corrects a change in a system that is moving away
from the starting point. There are many feedback loops in the global climate system.
Some are not very well understood yet, and there are probably even many feedback
loops that we haven’t even recognized yet! One well known feedback loop describes the
effect that melting ice caps and glaciers will have on climate change. As the
temperature rises, ice will melt, and there will be fewer white, reflective surfaces on the
planet, decreasing the planet’s albedo and causing it to absorb more solar radiation,
which will heat the planet up even more.
Finally, students are asked to think of ways to improve the model, based on what
they have learned about climate change, greenhouse gases and human contributions to
the increase of CO2. (Notably, what is missing from this greenhouse gas model are the
greenhouse gases!)
Day 4 – Addition of CO2 to the model (Extend)
Investigative phenomenon: Changing the amount of greenhouse gas in the
atmosphere alters the temperature of the Earth. (revisited in more detail from Day 1)
Ms. P starts off the day by asking, “Do humans produce greenhouse gases?”
referring back to the activity from Day 1, the carbon footprint activity (ESS 3.D) She then
proceeds to ask students how CO2 can be added to the base model. Students suggest
adding a factory that emits CO2 into the atmosphere to the model. Students are then
tasked with modifying the Greenhouse Gas base model by adding a factory that emits
CO2 to answer the question, “Does adding CO2 affect the temperature?” Ms. P has
students review the greenhouse effect from Day 1 by sketching a model [SEP-2] of the
The CA Science Framework was adopted by the California State Board of Education on November 3, 2016. The CA Science Framework has not been edited for publication. © by the California Department of Education.

2016 California Science Framework Appendix 3 Computer Science Page 20 of 72
energy flow [CCC-5] in the system [CCC-4] that includes solar radiation, infrared
radiation, and greenhouse gases (ESS 3.D).
Ms. P asks students to join her in thinking about factories emitting CO2 and what are
the essential parts of that we might be able to include in our model, reminding them to
“keep it simple!” Students decide they want to add a factory that emits a lot of CO2 while
it is in operation. Calling on prior knowledge, they decide that the CO2 should come out
of the factory and rise in the atmosphere. As it lingers, it blocks heat from escaping and
eventually it is absorbed by growing plants or washes out of the atmosphere (CO2
dissolves in rain water). Ms. P helps them to see the analogy between releasing CO2
and creating new agents in their previous models. Then she provides students with a
progress monitor that includes the following tasks: add a breed for the factory; use the
“create and do” code block to create a factory and position it in the environment; add a
breed for CO2; and give the CO2 agents new behaviors. After adding CO2, Ms. P guides
the students in giving the CO2 behavior related to hovering and leaving the atmosphere.
She expresses in pseudo-code the description of the behaviors and then askes the
students to try their hand at implementing those behaviors. “In the hover procedure,
have the CO2 move upwards a small amount at each time step, until it reaches a height
of 12. Once there it should just move randomly while maintaining the same height. To
simulate ways that CO2 leaves the atmosphere and cycles [CCC-5] into other parts of
the Earth system, they set a probability that CO2 will be deleted a small fraction of the
time (0.1 percent of the time).” Ms. P reminds the students about the engineering cycle
and the need to incrementally make changes and test the model frequently.
To make responding to student questions occur in a timely manner and to develop
student self-sufficiency as learners while coding, Ms. P employs three tactics. The first
is to use pair programming, the second is to use green yellow and red cups for signaling
status, and the third is to employ a “Ask three then me” method of problem solving. In
pair programming, one student plays the role of the driver, who writes code while the
other, the navigator, makes suggestions and reviews the code as it is typed in. The two
programmers switch roles frequently. This practice encourages communication between
the pair and encourages collaborative problem solving. Colored cups are useful when
quickly taking the temperature of the room. Red cups signal that the students are stuck
The CA Science Framework was adopted by the California State Board of Education on November 3, 2016. The CA Science Framework has not been edited for publication. © by the California Department of Education.

2016 California Science Framework Appendix 3 Computer Science Page 21 of 72
and cannot move forward, yellow cups signal that the pair is experiencing difficulty but is
trying various solutions, and green cups signal that all is well with the pair. Since the
cups are visible to all, students who are ahead can locate and help pairs that are stuck.
Finally, the “ask three then me” encourages students to ask for suggestions from other
students rather than running to the teacher for help. When these three practices are
incorporated into the classroom culture, students learn faster and become more self-
sufficient.
Day 5 – Testing and evaluation of models (Evaluate)
Investigative phenomenon: The amount of greenhouse gases in the air changes over
time.
To test if their model is working as expected, students need to add some
instrumentation to determine how much CO2 exists in the atmosphere initially and
whether or not it declines over time. Once students implement their code and test it,
students design an experiment to determine the impact of altering the amount of CO2
entering the system from the factory.
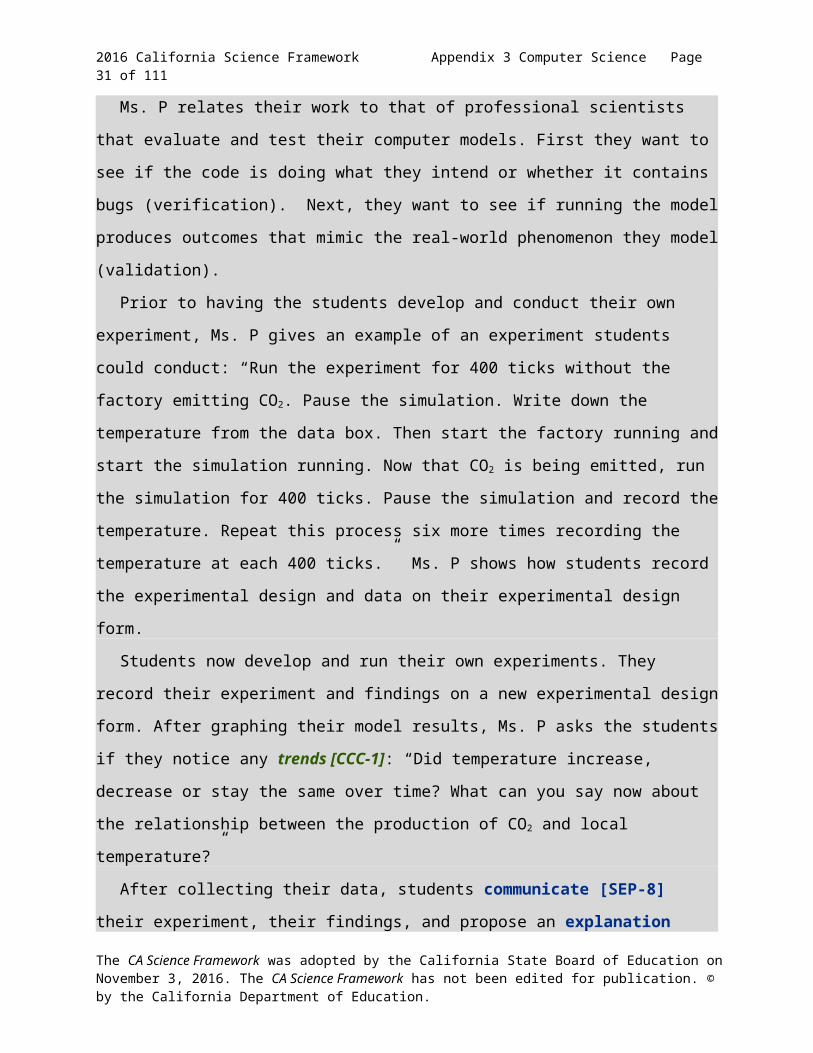
Ms. P relates their work to that of professional scientists that evaluate and test their
computer models. First they want to see if the code is doing what they intend or whether
it contains bugs (verification). Next, they want to see if running the model produces
outcomes that mimic the real-world phenomenon they model (validation).
Prior to having the students develop and conduct their own experiment, Ms. P gives
an example of an experiment students could conduct: “Run the experiment for 400 ticks
without the factory emitting CO2. Pause the simulation. Write down the temperature
from the data box. Then start the factory running and start the simulation running. Now
that CO2 is being emitted, run the simulation for 400 ticks. Pause the simulation and
record the temperature. Repeat this process six more times recording the temperature
at each 400 ticks.” Ms. P shows how students record the experimental design and data
on their experimental design form.
Students now develop and run their own experiments. They record their experiment
and findings on a new experimental design form. After graphing their model results, Ms.
P asks the students if they notice any trends [CCC-1]: “Did temperature increase,
The CA Science Framework was adopted by the California State Board of Education on November 3, 2016. The CA Science Framework has not been edited for publication. © by the California Department of Education.

2016 California Science Framework Appendix 3 Computer Science Page 22 of 72
decrease or stay the same over time? What can you say now about the relationship
between the production of CO2 and local temperature?”
After collecting their data, students communicate [SEP-8] their experiment, their
findings, and propose an explanation [SEP-6] for the data [SEP-4]. As they present
their findings, they must account for any unexpected variations and construct an argument [SEP-7] about the cause and effect relationship [CCC-2] between CO2
and temperature (i.e., the production of CO2 is an important determiner of temperature,
increases in CO2 production turned out to be unimportant, or that an unintended
variable interfered with the ability to conclude either way).
Next, she asks students how they could determine whether the outcome of running
the model mirrors what was happening in the real world. She leads a discussion of how
the model was similar to and different from the real world and to what extent a model
like this could be used to learn about the real world.
Days 6-7 (optional): Computational science and engineering challenge
Investigative problem: How can we reduce the impacts of human activity on the
climate?
This optional two-day extension enables students to design mitigation strategies [SEP-6] and then implement and test the strategies within a greenhouse gases model
to determine their potential impact. Students design their own alterations to the
Greenhouse Gases project consisting of a mitigation strategy, a question, an
experimental design and a model. Students isolate and develop their strategy for
mitigating CO2 production (for example, increase public transportation use, decrease
car usage) considering a range of factors (e.g., commuting options, availability of
different options in rural vs. urban communities), and identify the changes they will need
to make to their greenhouse gases model. This leads to a second activity in which they
design and implement their model, then use the model as an experimental test bed to
assess the impact of mitigation strategy they proposed.
The CA Science Framework was adopted by the California State Board of Education on November 3, 2016. The CA Science Framework has not been edited for publication. © by the California Department of Education.

2016 California Science Framework Appendix 3 Computer Science Page 23 of 72
Vignette DebriefComputer models provide a complete framework for teaching science. With
computational modeling and simulation, students are able to ask “what if” questions [SEP-1]. They act as both theorists and experimentalists. When students develop models [SEP-2], they must think about the underlying processes. The models allow
students to plan and conduct investigations [SEP-3] that test and isolate different
cause and effect relationships [CCC-2]. Because models run quickly, students can
obtain a large amount of data to analyze [SEP-5] for patterns [CCC-1]. The models
created also serve as a focal point for argument based on evidence [SEP-7]. Students must address the limitations of the model, the assumptions made, and work
together to determine the explanatory power of the model. Throughout this vignette, Ms.
P promotes meta-thinking about the nature of models. She encourages skepticism and
dialog by asking, “In what ways did it reflect the real world? In what ways was it
lacking?” and “Would you trust this model if your life depended on it?” Students must
describe how they would decide if the model is realistic enough to be used to make
predictions of the future.
SEPs. Students perform two investigations [SEP-3] of the impact of increasing
CO2 production on local temperature at a range of scales [CCC-3], they ask questions [SEP-1] about what is the impact of adding new sources of CO2. They analyze their data [SEP-4] to help figure out the relationship between different components in the
system [CCC-4] they study. They use these relationships to analyze a model [SEP-2] of the system. They use the data from their investigations along with the reasoning of
their model to construct an explanation [SEP-6] about the causes [CCC-2] of climate
change. In the Computational Science & Engineering design challenge, they employ
engineering practice by defining the parameters of the problem [SEP-1] and
designing solutions [SEP-6]. They then create a compelling argument [SEP-7] that
their design is an effective way to mitigate human impacts on local temperature.
Students briefly explore the results of their computational science [SEP-5] projects
that investigate mitigation strategies to combat climate change.
DCIs. The greenhouse gas effect is a tangible example of human impacts on
Earth systems (ESS3.C) and a microcosm of the entire energy balance in the global
The CA Science Framework was adopted by the California State Board of Education on November 3, 2016. The CA Science Framework has not been edited for publication. © by the California Department of Education.

2016 California Science Framework Appendix 3 Computer Science Page 24 of 72
climate system (ESS2.D). Students begin to characterize variations in Earth materials
(reflectivity) and the impact of these variations (ESS2.A), then explore the role of human
behavior in Earth’s systems. This vignette extends part way into the high school level of
understanding of global climate. In middle school, students are supposed to ask
questions about what causes temperature changes, but they will not be assessed about
the details of the greenhouse effect until high school.
CCCs. Students apply the crosscutting concept of systems and system models [CCC-4] to represent the flow of energy [CCC-5] and the interactions between energy
and matter. Students look for patterns [CCC-1] in temperature data [SEP-4] to test for
cause and effect [CCC-2] relationships between CO2 production and local
temperature. They learn to question the validity of the model [SEP-2] and consider
what it can and cannot tell us about the real world. Feedback loops are an example
where the line between cause and effect [CCC-2] blurs. While these loops are
essential for a complete understanding of Earth’s climate, feedback mechanisms are a
high school level of understanding of CCC-2 that goes beyond the baseline level
expected of middle grade students.
EP&Cs. Climate change affects the welfare of humans in their everyday lives,
and students discover that some of the potential solutions to the problem involve
changes in human behavior (EP&C I, II). The bulk of the modeling focuses on
understanding Earth’s cycles and how humans alter them (EP&C III). On Days 6-7,
students really dig into the complexity of solutions (EP&C V).
CCSS Connections to English Language Arts and Mathematics: Throughout the
vignette, students participate in several small group and whole class discussions (SL.6-
8.1a-d, 4, 5). They gather information from several sources (RST.6-8.3, 9) to make
scientific arguments supported by evidence (WHST.6-8.1). Coding is an excellent
example of reasoning quantitatively (MP.2) and modeling using mathematics (MP.4).
The students participate in a coding exercise and simulation to answer the question
“Does adding CO2 affect the temperature?” (7.RP.2c-d).
The CA Science Framework was adopted by the California State Board of Education on November 3, 2016. The CA Science Framework has not been edited for publication. © by the California Department of Education.

2016 California Science Framework Appendix 3 Computer Science Page 25 of 72
ResourcesSeveral of the activities described in this vignette were adapted from other sources and
are cited within. Please refer to them for more detail.
The Project GUTS Introduction to Computer Modeling and Simulation module is available at https://code.org/curriculum/science.
The Project GUTS Climate Change module is available at http://www.projectguts.org/ClimateChangeUnit.
Historical temperature data can be viewed http://www.ncdc.noaa.gov/paleo/abrupt/story2.html.
See the Intergovernmental Panel on Climate Change (IPCC) document “Climate Change 2007: The Physical Basis” for details of the 24 different climate models used to study climate change.
For more information on climate change, go to the website: https://www3.epa.gov/carbon-footprint-calculator/. The Online Carbon Footprint Calculator is available on the EPA website: http://www.epa.gov/climatechange/students/calc/index.html.
The CA Science Framework was adopted by the California State Board of Education on November 3, 2016. The CA Science Framework has not been edited for publication. © by the California Department of Education.

2016 California Science Framework Appendix 3 Computer Science Page 26 of 72
High School LS Vignette: Ecosystems as Complex Systems
LS Vignette Appendix 3.2: Ecosystems as Complex Systems in High School By Irene Lee, Director, Project GUTS, Research Scientist, MIT Scheller Teacher
Education Program/Education Arcade
Performance ExpectationsStudents who demonstrate understanding can:
HS-LS2-1. Use mathematical and/or computational representations to support explanations of factors that affect carrying capacity of ecosystems at different scales. [Clarification Statement: Emphasis is on quantitative analysis and comparison of the relationships among interdependent factors including boundaries, resources, climate and competition. Examples of mathematical comparisons could include graphs, charts, histograms, and population changes gathered from simulations or historical data sets.] [Assessment Boundary: Assessment does not include deriving mathematical equations to make comparisons.]
HS-LS2-2. Use mathematical representations to support and revise explanations based on evidence about factors affecting biodiversity and populations in ecosystems of different scales. [Clarification Statement: Examples of mathematical representations include finding the average, determining trends, and using graphical comparisons of multiple sets of data.] [Assessment Boundary: Assessment is limited to provided data.]
HS-LS2-6. Evaluate the claims, evidence, and reasoning that the complex interactions in ecosystems maintain relatively consistent numbers and types of organisms in stable conditions, but changing conditions may result in a new ecosystem. [Clarification Statement: Examples of changes in ecosystem conditions could include modest biological or physical changes, such as moderate hunting or a seasonal flood; and extreme changes, such as volcanic eruption or sea level rise.]
HS-LS2-7. Design, evaluate, and refine a solution for reducing the impacts of human activities on the environment and biodiversity.* [Clarification Statement: Examples of human activities can include urbanization, building dams, and dissemination of invasive species.]
HS-LS2-8. Evaluate the evidence for the role of group behavior on individual and species’ chances to survive and reproduce. [Clarification Statement: Emphasis is on: (1) distinguishing between group and individual behavior, (2) identifying evidence supporting the outcomes of group behavior, and (3) developing logical and reasonable arguments based on evidence. Examples of group behaviors could include flocking, schooling, herding, and cooperative behaviors
HS-ETS1-1. Analyze a major global challenge to specify qualitative and The CA Science Framework was adopted by the California State Board of Education on November 3, 2016. The CA Science Framework has not been edited for publication. © by the California Department of Education.

2016 California Science Framework Appendix 3 Computer Science Page 27 of 72
quantitative criteria and constraints for solutions that account for societal needs and wants.
HS-ETS1-4. Use a computer simulation to model the impact of proposed solutions to a complex real-world problem with numerous criteria and constraints on interactions within and between systems relevant to the problem.
*The performance expectations marked with an asterisk integrate traditional science content with engineering through a practice or disciplinary core idea.
HighlightedScience and
Engineering Practices
[SEP-2] Developing and using models [SEP-5] Using computational and mathematical thinking
[SEP-1] Asking questions and defining problems [SEP-3] Planning and carrying out investigations
[SEP-4] Analyzing and interpreting data
[SEP-6] Constructing explanations and designing solutions
[SEP-7] Engaging in argument from evidence
HighlightedDisciplinary Core Ideas
LS2.A Interdependent Relationships in Ecosystems
LS2.B Cycle of Matter and Energy Transfer in Ecosystems
LS2.C Ecosystem Dynamics, Functioning, and Resilience
HighlightedCrosscutting Concepts
[CCC-4] Systems and system models
[CCC-5] Energy and Matter [CCC-2] Cause and effect
[CCC-6] Stability and change
Significant Connections to California’s Environmental Principles and Concepts:
Principle I The continuation and health of individual human lives and of human communities and societies depend on the health of the natural systems that provide essential goods and ecosystem services.
Principle II The long-term functioning and health of terrestrial, freshwater, coastal and marine ecosystems are influenced by their relationships with human
The CA Science Framework was adopted by the California State Board of Education on November 3, 2016. The CA Science Framework has not been edited for publication. © by the California Department of Education.

2016 California Science Framework Appendix 3 Computer Science Page 28 of 72
societies. CA CCSS Math Connections: S-IC.1,2,5,6
CA ELD Connections: ELD.PI.11-12.1,5,6a-b,9,10,11a
CA CCSS ELA/Literacy Connections: SL.9-12.1a-d,4,5; RST.9-12.3,9 WHST.9-12.1
IntroductionThis life science vignette begins with an exploration of a simple predator-prey
model to consider who eats whom—and what happens when one population grows
faster than another. The goal of this vignette is to make these concepts “come to life”
through computer modeling and simulation, and develop a better understanding of
ecosystem dynamics by acting as computational scientists. After learning more about
ecosystem dynamics, producers and consumers, and interdependent relationships
within an ecosystem, students develop their own model of a local ecosystem. As
students use, modify, and create an agent-based model of a simple virtual ecosystem,
they deepen understanding of ecosystems concepts. As in many scientific endeavors,
the students are challenged to be precise with their scientific language, to be explicit in
describing their conceptual models, and revise their models as new evidence is
produced. As computational scientists, students they learn to represent conceptual
models by decoding, using, modifying, and creating computer models. As students gain
experience with computational thinking, modeling and simulation, and data analysis,
scientific practices key to the CA NGSS, they gain better understanding of the DCIs and
CCCs.
Length and position in course – This vignette describes one week of instruction based
on Project GUTS’ Computer Science (CS) in Science module on Ecosystems. This
module describes how computer models can be developed, used, and analyzed in the
context of studying ecosystems as complex systems. Teachers need to select an
anchoring phenomenon related to ecosystem dynamics in their local habitat, such as a
news article about a recent increase in neighborhood coyote sightings or a sudden
decrease in butterfly migration.
The CA Science Framework was adopted by the California State Board of Education on November 3, 2016. The CA Science Framework has not been edited for publication. © by the California Department of Education.

2016 California Science Framework Appendix 3 Computer Science Page 29 of 72
Prior knowledge – This lesson assumes that the teacher has already introduced
ecosystems concepts such as (a) the definition of an ecosystem, (b) indirect interactions
within ecosystems, (c) direct interactions between organisms in ecosystems, (d) food
chains and food webs, (e) energy flows in ecosystems, (f) trophic levels, and (g)
biomass in ecosystems. It is necessary to have completed the six-day sequence
introducing computer modeling and simulation (such as module 1 of the Code.org CS in
Science curriculum) prior to commencing this module, in order to have the necessary
skills to perform the modeling required in this module. Students will need basic skills in
reading and modifying computer codes. They will need to interpret an existing base
model, and make modifications to it by adding new codes or altering the ones that exist.
While this vignette provides opportunities to practice those skills, they are not
specifically addressed in this lesson outline.
Teacher background – Ecosystems as complex systems.
One of the main characteristics of a complex system is that the behavior of some
aspect of the system, seen as a whole, does not necessarily follow directly from an
understanding of how the individual “parts” of the system work. Another characteristic of
most complex systems is feedback: as the system changes, the new state of the system
affects the way in which the system changes in the future. For example, if we look at the
ecosystem of fish in a pond, where fish are not being consumed by predators, we see
that as the population approaches the carrying capacity of the pond, the rate of eggs
hatching and maturing to adulthood decreases. This is often through increased
cannibalism, as other food sources become scarce; it also happens via limits in other
required resources (e.g., oxygen in the water). So the increase in the fish population
leads to a reduction in the necessary resources available to each member of the
population, which in turn leads to moderation in the rate of increase in the population.
(This type of feedback is called a balancing feedback in the CA Science Framework.)
This interaction balances out the change and causes the population growth curve to
stabilize.
Another important feature of complex systems is that relationships are nonlinear:
small changes in one moment may result in disproportionately large changes later on.
The CA Science Framework was adopted by the California State Board of Education on November 3, 2016. The CA Science Framework has not been edited for publication. © by the California Department of Education.

2016 California Science Framework Appendix 3 Computer Science Page 30 of 72
Ecosystems often demonstrate this feature: we might have relative stability in the
populations of a number of species, but then a brief spike or dip in one can produce a
chain reaction of changes in the other populations, sometimes with serious results.
Possibly most important, ecosystems often demonstrate emergent behavior. This is
related to the first point, where the overall behavior turns out not to be obvious from the
component behavior. In an aquatic ecosystem, simply knowing that fish eat plankton,
and shark eat fish does not tell us much (beyond giving us a general sense) about the
patterns in the respective populations over time – we really need to study the
ecosystem as a whole. From the above, we can see that ecosystems are usually
complex systems, as well.
5E Lesson Design – This sequence is based on an iterative 5E model. See the
instructional strategies chapter in this framework for tips on implementing 5E lessons.
Day 1: Introduction to Ecosystems as Complex Systems (engage) Students experience
population growth and
limits to growth through a
participatory simulation
that reinforces the
ecosystem concept of a
carrying capacity. Then
students preview a simple
ecosystem model and try
to maintain artificial
populations within the
modeled ecosystem.
Day 2: Decoding and using the Rabbits and Grass base model to run experiments (explore)Students inspect the
Rabbits and Grass model to
learn about the
implementation of
behaviors and energy
cycling through the
modeled ecosystem. Then
the students design and run
an experiment of their
choice.
Day 3: Modifying the base model and investigating the impact of changing variables on the ecosystem. (explain) Students experiment with
changing either the initial
population sizes or the
energy cycling through the
ecosystem and witnessing
the impact the change has
on the longevity of the
populations within the
ecosystem.
Day 4: Adding a top predator to the model
Day 5: Testing and evaluation of the model
Days 6-7 (optional): Student symposium
The CA Science Framework was adopted by the California State Board of Education on November 3, 2016. The CA Science Framework has not been edited for publication. © by the California Department of Education.
2016 California Science Framework Appendix 3 Computer Science Page 31 of 72
and running an experiment (extend)Students add a top
predator to the modeled
ecosystem and design an
experiment to investigate
the impact of the addition
on existing populations.
Then they use their
models to run controlled
experiments and track the
outcomes of subsequent
runs of the model.
(evaluate)Students consider whether
their models are working
and reflect the real world
phenomenon of ecosystem
dynamics.
Students prepare and give
presentations on their
models, questions,
experimental design and
findings in a symposium
like setting. They are
encouraged to ask each
other to show a part of
their code that they are
proud of and make the
case for their conclusions
based on their model and
findings.
Day 1 – Introduction to Ecosystems as Complex Systems (Engage)
Investigative phenomenon: In a kinesthetic model, population changes as resources
change.
Ms. E grounds students understanding of population dynamics and carrying capacity
through a kinesthetic model [SEP-2] called “Papercatchers.” She informs the class
that they will play the part of members of a growing population and experience limits to
the growth of populations when resources are limited. Ms. E asks for a volunteer
“recorder” to set up a graph on the whiteboard with the x-axis labeled with generations
#1 through #10 and the y-axis labeled with population size between 0 and 50.
Round one begins by having each student crumple up a piece of paper from the
recycle bin into a ball. Ms. E picks one student to represent the initial member of the
population and asks that person to stand in the middle of the room. The recorder marks
the graph with generation 0 having population size of 1. Ms. E tells her class that when
she gives the “next generation” command, the population member(s) are to throw the
paper ball two feet overhead and attempt to catch it. If the population member
succeeds, then he/she survives into the next generation and reproduces by selecting a
student from the audience who is not already part of the population to join in the
The CA Science Framework was adopted by the California State Board of Education on November 3, 2016. The CA Science Framework has not been edited for publication. © by the California Department of Education.

2016 California Science Framework Appendix 3 Computer Science Page 32 of 72
population. If he/she does not catch the paper ball, he/she does not survive and must sit
down.
At each generation, the recorder updates the graph with the new population size.
Ms. E has the students repeat this process for several more generations. One time the
population crashes or becomes extinct, so they begin again with one population
member, noting that sometimes populations will crash by chance when numbers are
small. Once all members of the audience are standing, she gathers them around to take
a look at the graph. The recorder summarizes the data and students reflect on the
pattern [CCC-1]. Ms. E asks, “Was this what you expected?, What type of pattern do
you see?, What do you predict would happen if we could play with an unlimited number
of people?” (The result would be exponential growth/population explosion.)
Next, Ms. E tells the class that they are going to play with slightly different rules in
round two. She unfolds a single piece of newspaper and places it on the floor. She tells
the students there is an added constraint. To survive, they must throw and catch their
paper ball while keeping one foot on the piece of newspaper at all times. Ms. E asks for
predictions of what will happen when they play this round. She also asks for a new
student to act as “recorder” and that the new recorder makes the population size and
generation number as before but in a different color marker. Ms. E leads the class
through several generations and (after the population size stabilizes) asks students
what pattern they observed in the data and how the piece of newspaper relates to
limited resources in nature. Ms. E helps students make the connection between the
piece of newspaper and a limited food supply (LS2.A). She draws a horizontal line
across the graph at the maximum population supported by the piece of newspaper and
calls it the “carrying capacity.” (The S-curve in the data is known as Logistic Growth.)
Finally, in round three, Ms. E tells the class that in this round the piece of newspaper
will be replaced with a sheet of 8.5” by 11” paper. She asks students for a prediction of
what will happen when they play again. Where would the carrying capacity be under
these conditions? For this round, Ms. E asks the recorder to use a different colored
marker. Play ensues for several generations (with much laughter) and the carrying
capacity of the smaller sheet of paper is determined. Ms. E concludes the activity with a
discussion on the relationship between food supply and population growth and relates it
The CA Science Framework was adopted by the California State Board of Education on November 3, 2016. The CA Science Framework has not been edited for publication. © by the California Department of Education.

2016 California Science Framework Appendix 3 Computer Science Page 33 of 72
to the need to feed the world’s growing population. Several students identify another
potential possible application of the model: investigating how the health of an
ecosystem would influence human efforts to increase the food supply for the human
population (CA EP&C I).
Investigative phenomenon: In a computer model, a rabbit population quickly grows
until it suddenly crashes.
Next, Ms. E opens the StarLogo Nova base model of an ecosystem consisting of
rabbits and grass and uses the projector to introduce it to students. She demonstrates
how to use the “set up” and “run forever” buttons to reset and run the model. Ms. E asks
students to tell her what to do next and to interpret what they are seeing when the
model is run. She asks “What are the components in this model?” and hears that the
model contains earth, rabbits and grass. Ms. E asks, “When the model runs or is
‘executed’ what happens?” and hears various interpretations [SEP-4] of the results,
ranging from “the bunnies multiply out of control” or “all the grass gets eaten” or “the
system collapses [CCC-7].” After running the model several times and comparing the
pattern [CCC-1] of population growth and crash by the model, Ms. E asks the students
to summarize the sequence of events. “The rabbits eat grass and multiply, then the
population of rabbits grows and eats all the grass, then all the rabbits die.” Ms. E asks
the students if the pattern is the same every time the model is run. Some students
notice that each run of the computer model is slightly different. For example, a few times
the population grew more slowly. This observation leads to a discussion of what
computer models are good for and how they can help us understand ecosystem
dynamics.
Day 2 – Decoding and using the Rabbits and Grass base model to run experiments (Explore)
In the first activity of this lesson the students were guided reviewing code blocks
they were familiar with prior to inspecting the model’s code. Ms. E assigns partners to
work together and then assigns each pair a segment of the model’s code to examine
and decode: a “model observation form” is used to document what each of the assigned
procedures did to produce the behavior of the rabbits, grass, or “the world.” After five
The CA Science Framework was adopted by the California State Board of Education on November 3, 2016. The CA Science Framework has not been edited for publication. © by the California Department of Education.

2016 California Science Framework Appendix 3 Computer Science Page 34 of 72
minutes of decoding, Ms. E asks the students to share their findings. Following each
pair’s reporting out of what mechanisms or behaviors are implemented in the
algorithms, Ms. P asks students if students have other interpretations of what the code
does. Any dissention is resolved by looking closely at the source for evidence [SEP-7] – the code itself. Ms. P concludes the activity by discussing the main program
loop and execution order. She has students draw a diagram mapping out the sequence
of the different procedures and sub-procedures. She then has students enact their
diagram as a physical model with pairs of students moving around the room from one
procedure to the next to the next to simulate the execution of the code starting with the
pressing of the setup button.
Day 3 – Modifying the base model and investigating the impact of changing variables on the ecosystem. (Explain)
In the first activity of this lesson, students learned how to use the model to run an
experiment by changing the variable related to initial population size of grasses or
energy gained from eating. Ms. E asks the students, what happens in the model when a
rabbit eats grass? A student response was, “the grass disappears and the rabbit gains
energy.” Ms. E asks if this was realistic and follows with the question, “Do you think that
the amount of initial grass in the ecosystem determines how long the rabbits will
survive?” Ms. E asks students to write down their prediction. Some students answer yes
while others answered no. Ms. E prompts students to engage in argumentation based on evidence [SEP-7]. Some students use the reasoning that the population will survive
if there is enough grass to start off with while others reason that the population will just
explode faster.
Investigative phenomenon: The rabbit population grows at a different rate when there
is more initial grass in the model.
Next, students are asked to locate this variable in the code that controlled the initial
amount of grass, change the variable to reflect a different initial population, and run the
model again. After a few minutes. Ms. E asks the students to “crowdsource” their data
and report out on the value they choose and the outcome in terms of how long the
ecosystem persisted. Analyzing [SEP-4] the amassed data, Ms. E asks the students if
The CA Science Framework was adopted by the California State Board of Education on November 3, 2016. The CA Science Framework has not been edited for publication. © by the California Department of Education.

2016 California Science Framework Appendix 3 Computer Science Page 35 of 72
they noticed any difference when they ran their model this time and whether their
prediction was correct.
Investigative phenomenon: The rabbit population grows at a different rate when each
clump of grass provides more energy to the rabbits.
Students add new computer code to create a slider to the user interface panel that
allows them to easily set the amount of energy the rabbits get each time they eat the
grass. Then, students pose questions [SEP-1] about the effect [CCC-2] of changing
this variable, and to reflect on the real-world implications of their discoveries. A graphic
organizer Ms. E calls an “experimental design form” guides students to develop
scientific questions that they can investigate using their model. The form then scaffolds
the students into seeing the need to use trials and to clearly identify the variables.
Students design and run their experiment in pairs after specifying which variable they
will change. Within what range? How many trials at each setting? They use the
instrumentation in the model (the graph and the data boxes) to monitor temperature
under the different scenarios, students record the data from the graph. Then they
analyze [SEP-4] the results of their experiments, document the patterns [CCC-1] in
their findings, and use these as evidence to support a claim explaining [SEP-6] one
aspect of the system.
Finally, students extend the model based on what they have learned about
ecosystems, energy flows [CCC-5] within ecosystems, interactions within ecosystems
and how human activities influence ecosystems. Ms. E leads a wrap up discussion
about models and modeling. In what ways might this model be helpful to scientists in
understanding ecosystems? Might this model help scientists predict the effects of
human activities on ecosystems? How would a scientist determine if their models are
accurate enough to make predictions?
The CA Science Framework was adopted by the California State Board of Education on November 3, 2016. The CA Science Framework has not been edited for publication. © by the California Department of Education.

2016 California Science Framework Appendix 3 Computer Science Page 36 of 72
Day 4 – Adding a top predator to the model and running an experiment (Extend)
Investigative phenomenon: Adding predators to the model changes the growth rate of
the rabbits.
Ms. E starts off day four by asking students what they predict would be the effect of
adding a top predator to the model. Then Ms. E leads reviews what they learned in
previous computer science lessons about how to add a new agent to their model – first
she demonstrates how to add a new “breed” of agents using the add breed widget, then
she notes that students could simply refer to how rabbits are given behaviors when
setting up behaviors for a new agent. She then asks students what the top predator
would eat and how much energy it gains each time it eats. Students propose that the
predator eats rabbits, acquiring all the rabbit’s energy but Ms. E asks students to think
about the energy conversion process. No energy conversion is 100% efficient.
Developing a model allows students to discover the concept of trophic levels – they
have to think very specifically about how to represent the energy transfer within the
ecosystem (LS2.B). Ms. E then lets the students go to work on modifying the rabbits
and grass ecosystem base model by adding a top predator to answer the question,
“Does adding a top predator affect the longevity of the ecosystem?” Ms. E reminds the
students about the engineering cycle and the need to incrementally make changes and
test the model frequently.
To make responding to student questions occur in a timely manner and to develop
student self-sufficiency as learners while coding, Ms. P employs three tactics. The first
is to use pair programming, the second is to use green yellow and red cups for signaling
status, and the third is to employ a “Ask three then me” method of problem solving. In
pair programming, one student plays the role of the driver, who writes code while the
other, the navigator, makes suggestions and reviews the code as it is typed in. The two
programmers switch roles frequently. This practice encourages communication between
the pair and encourages collaborative problem solving. Colored cups are useful when
quickly taking the temperature of the room. Red cups signal that the students are stuck
and cannot move forward, yellow cups signal that the pair is experiencing difficulty but is
trying various solutions, and green cups signal that all is well with the pair. Since the
cups are visible to all, students who are ahead can locate and help pairs that are stuck.
The CA Science Framework was adopted by the California State Board of Education on November 3, 2016. The CA Science Framework has not been edited for publication. © by the California Department of Education.

2016 California Science Framework Appendix 3 Computer Science Page 37 of 72
Finally, the “ask three then me” encourages students to ask for suggestions from other
students rather than running to the teacher for help. When these three practices are
incorporated into the classroom culture, students learn faster and become more self-
sufficient.
Ms. E instructs students to test their models. To test if their model is working as
expected, students need to add some instrumentation to log the size of each population
over time and visualize the balance of species in the ecosystem. Once students have
implemented their code for output databoxes and plots of population sizes, students
must plan an investigation [SEP-3] to determine the impact of adding the top predator.
Students record their ideas and findings on a new experimental design form. After
graphing the data points Ms. E asks the students if they noticed any trend, “Did the
ecosystem last for a longer or short duration with the addition of the top predator? What
can you say now about your testable idea?” She wraps up the activity with a discussion
of energy flow and why a population might persist longer with the existence of a top
predator. To extend students’ thinking further, Ms. E asks students to propose ways
that they can modify their models to include human activities (CA EP&C II).
Day 5 – Testing and evaluation of models (Evaluate) In this lesson, Ms. E asks students to think about how they would test to see if their
models were “correct.” She explains that there are two concerns: (1) whether the coding
was done properly and (2) whether the model has the right elements included in it. To
test whether the coding was done properly, students trace their code and work through
the program logic in pairs. The difficulty of testing is discussed because of the
randomness inherent in agent-based models, no two runs of the model would produce
identical outcome data. Since that is the case, how would they discern whether their
code is written correctly? Ms. E reassures the class that they could test specific cases
with known outcomes to make sure that the outcomes are produced as expected. The
class comes up with a few situations that have obvious outcomes such as very little
grass or many more consumers than producers. Next, Ms. E asks half the students to
support an argument [SEP-7] that their models represent real-world ecosystems and
the other half of the students to support an argument that their models do not represent
The CA Science Framework was adopted by the California State Board of Education on November 3, 2016. The CA Science Framework has not been edited for publication. © by the California Department of Education.

2016 California Science Framework Appendix 3 Computer Science Page 38 of 72
real-world ecosystems. She encourages them to think about what they know of the real
world populations and interactions. Several students point out that they can’t really
know for sure because they do not have real world data to compare the models output
to. Ms. E points out that their models and experiments still have value – they learn to
identify trends [CCC-1] and connect outcomes to patterns of population growth and
decline.
Days 6-7 (optional): Student symposiumAfter collecting and analyzing their data, students present their experiment, their
findings, and propose an explanation [SEP-6] for the data [SEP-4]. As they present
their findings, they must account for any unexpected variations and construct an argument [SEP-7] that either the addition of a top predator is a determiner of longevity
of the ecosystem, that the addition of a top predator turns out to be unimportant, or that
an unintended variable interferes with the ability to conclude either way. Then students
prepare presentations that take place at the next class meeting. Each team of students
gives a five-minute presentation following the guidelines below.
1. State the question you were seeking to answer
2. Present any background research you did on the topic.
3. Tell us about your model (what’s included and what was left out).
4. Tell us about your experimental design.
5. Show your model running and how you collected data.
6. Show any collected data and how it was analyzed.
7. Tell us about any relationships you noticed between variables that help you
understand or predict the phenomenon.
8. Summarize your findings; what was the outcome of running your experiments?
9. Do you think you learned anything about the real world?
10. Show us a piece of code you are most proud of.
11. Allow time for questions and answers.
The CA Science Framework was adopted by the California State Board of Education on November 3, 2016. The CA Science Framework has not been edited for publication. © by the California Department of Education.

2016 California Science Framework Appendix 3 Computer Science Page 39 of 72
Revisiting the model (optional)
Investigative phenomenon: Rabbits with different traits become more common within
the population over time.
A few weeks later when the class is exploring evolution, Ms. E revisits the model.
Rather than hypothetically arguing whether or not variation in a population has to exist
before selection can act, students could modify computer models to try different
scenarios, such as comparing the effects of human activities on the rate of
environmental change and how that effects different populations (CA EP&C II). In one
model, all the individuals would have the same genetic characteristics, and in the other
model individuals would have varying traits. When a predator is introduced, certain
characteristics are more favorable than others. When simulations are run over multiple
generations, students could determine how the population changes over time and argue
whether or not variation is necessary before selection can act. Note that in the course of
making this model and implementing reproduction and predation, students will need to
review and program the inheritance of traits (LS3.A) and energy flow through an
ecosystem (LS2.B). Ms. E uses the model to help her students meet HS-LS4-3 (“Apply
concepts of statistics and probability to support explanations that organisms with an
advantageous heritable trait tend to increase in proportion to organisms lacking this
trait.”) and HS-LS4-4 (“Construct an explanation based on evidence for how natural
selection leads to adaptation of populations.”).
Vignette DebriefComputer models provide a complete framework for teaching science. With
computational modeling and simulation, students are able to ask “what if” questions [SEP-1]. They act as both theorists and experimentalists. When students develop models [SEP-2], they must think about the underlying processes. The models allow
students to plan and conduct investigations [SEP-3] that test and isolate different
cause and effect relationships [CCC-2]. Because models run quickly, students can
obtain a large amount of data to analyze [SEP-5] for patterns [CCC-1]. The models
created also serve as a focal point for argument based on evidence [SEP-7].
The CA Science Framework was adopted by the California State Board of Education on November 3, 2016. The CA Science Framework has not been edited for publication. © by the California Department of Education.

2016 California Science Framework Appendix 3 Computer Science Page 40 of 72
Students must address the limitations of the model, the assumptions made, and work
together to determine the explanatory power of the model. Throughout this vignette, Ms.
E promotes meta-thinking about the nature of models. She encourages skepticism and
dialog by asking, “In what ways did it reflect the real world? In what ways was it
lacking?” and “Would you trust this model if your life depended on it?” Students must
describe how they would decide if the model is realistic enough to be used to make
predictions of the future.
The goal of engaging students in modeling is not just one of developing their
understanding of the concepts of science. Rather, it is to also learn a form of meta-
knowledge about science – that is knowledge of specific features of science and their
role in contributing to how we know what we know. For instance, when students
construct models it helps them to understand that the goal of science is not the
construction of a picture that accurately depicts every aspect of nature, but rather a map
that captures some certain important features and not others. In developing models,
students should propose an explanation of a particular process or phenomenon by
focusing their attention on key aspects of the system and the variables that are relevant
to that process, while de-emphasizing other details which are less relevant at that
moment but may be reconsidered later.
The structure of the lessons that incorporate both on- and off-computer activities,
and building student understanding over time by activating prior knowledge prior to
extending that knowledge through new experiences. The actual computer time is
scaffolded by a “use-modify-create” framework where students begin by using the
model, then make small modifications, and finally create entirely new components.
SEPs. Students perform investigations [SEP-3] on the impact of modifying the
energy flow [CCC-5] through the modeled ecosystem then they ask questions [SEP-1] about what is the impact of adding a top predator. They analyze their data [SEP-4] to help figure out the relationship between different components in the system [CCC-4] they study. They use these relationships to analyze a model [SEP-2] of the system.
They use the data from their investigations along with the reasoning of their model to
construct an explanation [SEP-6] about the causes [CCC-2] of ecosystem collapse.
The CA Science Framework was adopted by the California State Board of Education on November 3, 2016. The CA Science Framework has not been edited for publication. © by the California Department of Education.

2016 California Science Framework Appendix 3 Computer Science Page 41 of 72
In the Student Symposium, they employ the engineering practice of creating a
compelling argument [SEP-7] that their findings are true to life.
DCIs. Organisms, and populations of organisms, are dependent on their
environmental interactions both with other living things and with nonliving factors
(LS2.A). In this vignette, students model only the interactions between living parts of the
ecosystem. They explore the carrying capacity and stability of ecosystems under
different conditions (LS2.C).
CCCs. Patterns [CCC-1] can be used to identify cause and effect [CCC-2] relationships. Cause and effect relationships may be used to predict phenomena in
natural or designed systems. Students must make sure that their model tracks the
energy flows [CCC-5] through the natural system – they confront this problem explicitly
when they think about how much energy the predator receives when eating a rabbit.
Their models also illustrate how populations change and can move towards stability [CCC-7]. Students discover the surprising effect that adding a predator actually helps
prevent the rabbit population from crashing.
EP&Cs. The dependence of human populations on healthy natural systems, as
well as the influence of human societies on those systems offer a variety of
opportunities for students to engage in computational thinking, modeling and simulation,
and data analysis. Computer models, like those used to analyze changes to Earth’s
climate are frequently the only means through which scientists and students can predict
the long-term impacts of humans on natural systems and changes to natural systems
on humans. In this vignette, students propose different ways that they can represent
human impacts in their models. In the process, they must think carefully about the
specific mechanisms [CCC-2] by which humans alter natural cycles (EP&C III).
Students have to think about how they would represent diverse human behaviors such
as polluting, hunting, destroying habitat through deforestation, or disrupting habitat
through building roads that divide populations.
CA CCSS Connections to English Language Arts and Mathematics. Throughout
the vignette, students participate in several small group and whole class discussions
(SL.9-12.1a-d, 4, 5). Students participate in a computer simulation which involves an
ecosystem of rabbits and grass. The students run the simulation looking for patterns in
The CA Science Framework was adopted by the California State Board of Education on November 3, 2016. The CA Science Framework has not been edited for publication. © by the California Department of Education.

2016 California Science Framework Appendix 3 Computer Science Page 42 of 72
the data. Students argue (WHST.9-12.1) whether changing a variable (the amount of
initial grass) would change the outcome of the simulation. The students also add a top
predator to the model and graph data points and analyze what impact it makes on the
rabbit population (S-ID.1,2,5,6)
Resources Several of the activities described in this vignette were adapted from other sources and
are cited within. Please refer to them for more detail.
The Project GUTS Introduction to Computer Modeling and Simulation module is available at http://code.org/curriculum/science.
The Project GUTS Ecosystems module is available at http://code.org/curriculum/science.
The CA Science Framework was adopted by the California State Board of Education on November 3, 2016. The CA Science Framework has not been edited for publication. © by the California Department of Education.

2016 California Science Framework Appendix 3 Computer Science Page 43 of 72
High School ESS Vignette: Water Resources and Farming
Vignette Appendix 3.3: Water Resources and Farming in High SchoolBy Irene Lee, Director, Project GUTS, Research Scientist, MIT Scheller Teacher
Education Program/Education Arcade
Performance ExpectationsStudents who demonstrate understanding can:
HS-ESS3-1. Construct an explanation based on evidence for how the availability of natural resources, occurrence of natural hazards, and changes in climate have influenced human activity. [Clarification Statement: Examples of key natural resources include access to fresh water (such as rivers, lakes, and groundwater), regions of fertile soils such as river deltas, and high concentrations of minerals and fossil fuels. Examples of natural hazards can be from interior processes (such as volcanic eruptions and earthquakes), surface processes (such as tsunamis, mass wasting and soil erosion), and severe weather (such as hurricanes, floods, and droughts). Examples of the results of changes in climate that can affect populations or drive mass migrations include changes to sea level, regional patterns of temperature and precipitation, and the types of crops and livestock that can be raised.]
HS-ESS3-3. Create a computational simulation to illustrate the relationships among management of natural resources, the sustainability of human populations, and biodiversity. [Clarification Statement: Examples of factors that affect the management of natural resources include costs of resource extraction and waste management, per-capita consumption, and the development of new technologies. Examples of factors that affect human sustainability include agricultural efficiency, levels of conservation, and urban planning.] [Assessment Boundary: Assessment for computational simulations is limited to using provided multi-parameter programs or constructing simplified spreadsheet calculations.]
HS-ESS3-5. Analyze geoscience data and the results from global climate models to make an evidence-based forecast of the current rate of global or regional climate change and associated future impacts to Earth system. [Clarification Statement: Examples of evidence, for both data and climate model outputs, are for climate changes (such as precipitation and temperature) and their associated impacts (such as on sea level, glacial ice volumes, or atmosphere and ocean composition).] [Assessment Boundary: Assessment is limited to one example of a climate change and its associated impacts.]
HS-ETS1-1. Analyze a major global challenge to specify qualitative and quantitative criteria and constraints for solutions that account for societal needs and wants.
HS-ETS1-4. Use a computer simulation to model the impact of proposed
The CA Science Framework was adopted by the California State Board of Education on November 3, 2016. The CA Science Framework has not been edited for publication. © by the California Department of Education.
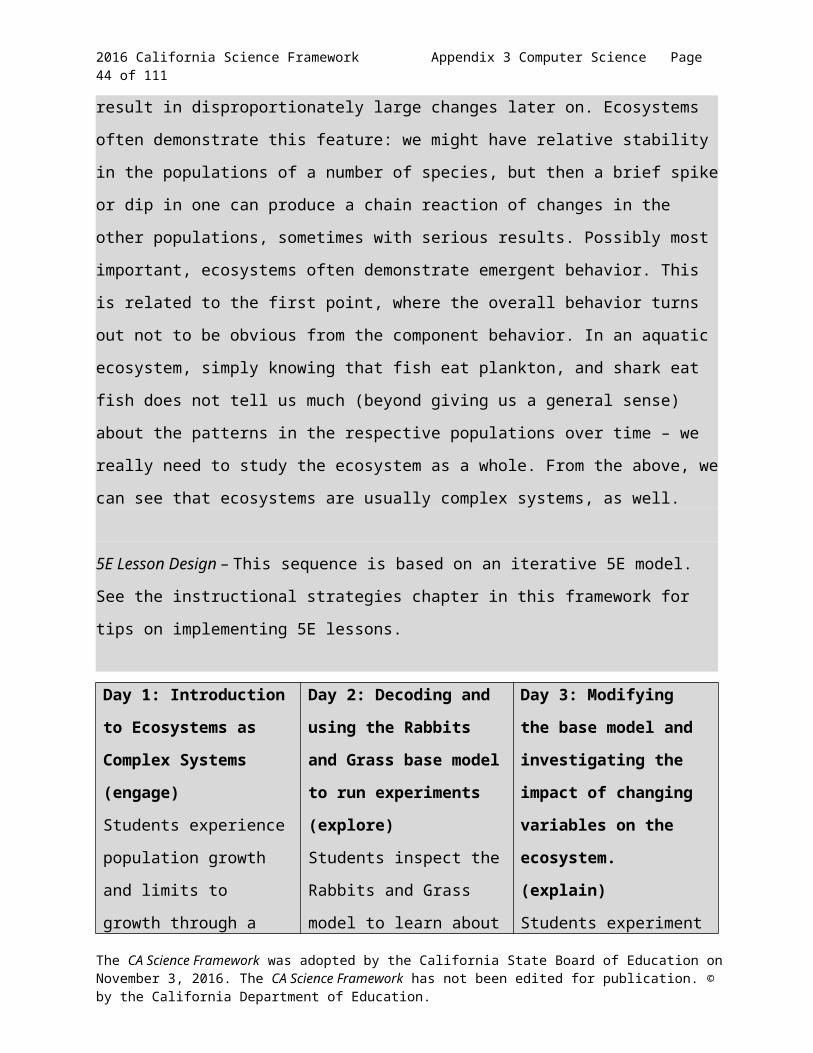
2016 California Science Framework Appendix 3 Computer Science Page 44 of 72
solutions to a complex real-world problem with numerous criteria and constraints on interactions within and between systems relevant to the problem.
*The performance expectations marked with an asterisk integrate traditional science content with engineering through a practice or disciplinary core idea.
HighlightedScience and
Engineering Practices[SEP-2] Developing and using models [SEP-5] Using computational and mathematical thinking
[SEP-1] Asking questions and defining problems [SEP-3] Planning and carrying out investigations
[SEP-4] Analyzing and interpreting data
[SEP-6] Constructing explanations and designing solutions
[SEP-7] Engaging in argument from evidence
HighlightedDisciplinary Core Ideas
ESS3.A: Natural Resources
ESS3.C: Human Impacts on Earth Systems
HighlightedCrosscutting Concepts
[CCC-4] Systems and system models
[CCC-2] Cause and effect
[CCC-6] Stability and change
Significant Connections to California’s Environmental Principles and Concepts:
Principle I The continuation and health of individual human lives and of human communities and societies depend on the health of the natural systems that provide essential goods and ecosystem services.
Principle II The long-term functioning and health of terrestrial, freshwater, coastal and marine ecosystems are influenced by their relationships with human societies.
Principle IV The exchange of matter between natural systems and human societies affects the long-term functioning of both.
The CA Science Framework was adopted by the California State Board of Education on November 3, 2016. The CA Science Framework has not been edited for publication. © by the California Department of Education.

2016 California Science Framework Appendix 3 Computer Science Page 45 of 72
Principle V Decisions affecting resources and natural systems are based on a wide range of considerations and decision-making processes.
CA CCSS Math Connections: S-IC.1,2,5,6
CA ELD Connections: ELD.PI.11-12.1,5,6a-b,9,10,11a
CA CCSS ELA/Literacy Connections: SL.9-12.1a-d,4,5; RST.9-12.3,9 WHST.9-12.1
IntroductionThis Earth Science vignette considers how humans are impacting the environment
and how resources are being used and managed (or not managed) for the future.
Students model the hydrological cycle as a complex system that includes humans that
consume water resources. In particular, the Project GUTS Computer Science (CS) in
Science Earth Science module explores ground water as a shared resource and factors
that affect how a resource is shared among stakeholders. Even though water
continually cycles among land, ocean, and atmosphere, humans use some water
resources are not renewable or replaceable over human lifetimes. As human
populations increase, the consumption of natural resources increase, and so do the
negative impacts on Earth.
The base model for this unit simulates the part of the hydrological cycle in which
water drops as rain, seeps into an aquifer, and is pumped out by a single pump.
Students walk through each part of the model, run experiments to better understand the
model, and then modify the base model to add additional pumps and/or add variable
rates for rainfall, pumping, and infiltration (soil types). Students will then modify this
model to explore different changes to the system.
Length and position in course – This vignette describes one week of instruction based
on Project GUTS’ CS in Science module on Water Resources. This module describes
how computer models can be developed, used, and analyzed in the context of studying
human impacts on earth’s systems.
Prior knowledge – This Earth Science module offers some disciplinary core concepts
through direct instruction and activities but assumes the students already possess a
The CA Science Framework was adopted by the California State Board of Education on November 3, 2016. The CA Science Framework has not been edited for publication. © by the California Department of Education.

2016 California Science Framework Appendix 3 Computer Science Page 46 of 72
certain level of knowledge in key areas. Concepts such as the hydrological cycle,
watersheds, surface water, ground water, precipitation, percolation, aquifers, porosity,
and infiltration are reviewed, but in order to achieve deeper learning it is advisable that
the students will have covered these concepts beforehand. A recommended video that
introduces these concepts is available at: https://www.youtube.com/watch?
v=R8NQUQDZ3N0. An alternate video is available at: https://www.youtube.com/watch?
v=al-do-HGuIk.
This vignette assumes that students have completed a multi-day sequence
introducing computer modeling and simulation (such as module 1 of the Code.org CS in
Science curriculum). Students will need basic skills in reading and modifying computer
codes. They will need to interpret an existing base model and make modifications to it
by adding new codes or altering the ones that exist. While this vignette provides
opportunities to practice those skills, they are not specifically addressed in this lesson
outline.
Teacher background
California is the largest agricultural producer in the country. Its farming success
depends on three main natural resources: its climate, fertile soil, and the availability of
massive amounts of water for irrigation. Agriculture is by far the number one user of
developed water (>75 percent of all consumed water) and that the state gets its water
from a combination of groundwater pumping (20-40 percent, depending on the year;
Legislative Analyst’s Office 2010) and surface water from dams and reservoirs. Articles
about California’s water supplies along with some hands-on demonstrations of the
groundwater storage capacity of different earth materials can serve as valuable review
of these topics.
Students will build on their model of the hydrological cycle in middle school (MS-
ESS2-4). The high school Performance Expectations from the CA NGSS do not add
any additional content knowledge tasks related to the internal processes of the
hydrosphere. Instead, they press students to apply the knowledge from previous grades
to situations involving hydrosphere-anthrosphere interactions (CA EP&C Principles I, II,
& III).
The CA Science Framework was adopted by the California State Board of Education on November 3, 2016. The CA Science Framework has not been edited for publication. © by the California Department of Education.

2016 California Science Framework Appendix 3 Computer Science Page 47 of 72
5E Lesson Design – This sequence is based on an iterative 5E model. See the
Instructional Strategies chapter for tips on implementing 5E lessons.
Day 1: Introduction to Water as a Shared Resource (engage) Students engage in
discussion about water
resources stimulated by a
video and a participatory
simulation where they play
the role of various water
users. The activities provide
background and a common
basis necessary for further
exploration of water
resources and how
communities make
decisions.
Day 2: Decoding and using the Water Pumping base model to run experiments (explore)After reviewing math basics
for modeling, students are
introduced to the base
model. They examine and
decode the computer model
and interpret what
mechanisms were
implemented. Then they
run the model to run a
simple experiment.
Day 3: Modifying the base model and investigating the impact of changing the evaporation rate (explain) Students add an
evaporation slider and
design an experiment to
investigate the impact of
evaporation on water
availability. Then they use
the model to run
experiments by changing
the evaporation rate in
subsequent runs of the
model.
Day 4: Adding water pumps to the model and running an experiment (extend)Students extend their
models to include other
users with water pumps
drawing from the same
aquifer then run
experiments to determine
the impact on the
availability of water.
Day 5: Testing and evaluation of the model (evaluate)Students consider whether
their models are working
and reflect the real world
phenomenon of water
sharing in a community of
users.
Days 6-7 (optional): Computational science & engineering challengeStudents design potential
sharing strategies or
policies, and implement
them in their model. They
test the strategy within the
model and examine its
impact.
The CA Science Framework was adopted by the California State Board of Education on November 3, 2016. The CA Science Framework has not been edited for publication. © by the California Department of Education.

2016 California Science Framework Appendix 3 Computer Science Page 48 of 72
Day 1 – Introduction to Water as a Shared Resource (Engage)
Anchoring phenomenon: People in some parts of the world must travel great
distances to get clean drinking water.
Ms. H engages students by contrasting the availability of clean water in the US with
other parts of the world. She shows the “Water for Life: Diary of Jay-Z in Africa” video
(found at http://www.mtv.com/artists/jayz/playlist/1688080/) to get students thinking
about water resources and the difficulties some people their age face in obtaining safe
drinking water. Ms. H asks students to think about why groundwater from wells can be
safer than water that flows at the surface. She asks students to draw models [SEP-2] that track the cycling [CCC-5] of water and how pollution can be carried along the
surface but filtered out by the soil in groundwater. She uses the models to get students
to realize that the groundwater beneath their feet is connected to the groundwater
beneath their neighbors. In other words, we all depend on a shared resource.
Investigative phenomenon: When people rely on a shared resource, they may try to
hoard too much of the resource for themselves and ultimately deplete the resource for
everyone (including themselves).
Ms. H wants students to consider some of the issues that arise from sharing
resources. She has students engage in a kinesthetic model [SEP-2] called “Some for
All or All for One” that highlight some of the interesting dynamics that come about when
a group of individuals has to make decisions regarding a shared resource. Students act
as stakeholders in a water-sharing scenario. Each individual in the simulation has the
ability to choose what amount of the resource they take based on some simple rules.
When considering a shared resource like a water well, this activity helps students
understand that each member in a community that uses this well has an impact on
every other community member. After the activity, Ms. H asks how students made their
decisions and if there were any unexpected results. Then she leads a short debrief
incorporating evidence on the evolution of human cooperation (for more details, see the
following articles: http://www.sciencedaily.com/releases/2010/05/100501013529.htm
and http://www.beinghuman.org/article/evolutionary-benefits-cooperation). Making
decisions as an individual or as a group can often lead to unexpected results. If you
The CA Science Framework was adopted by the California State Board of Education on November 3, 2016. The CA Science Framework has not been edited for publication. © by the California Department of Education.
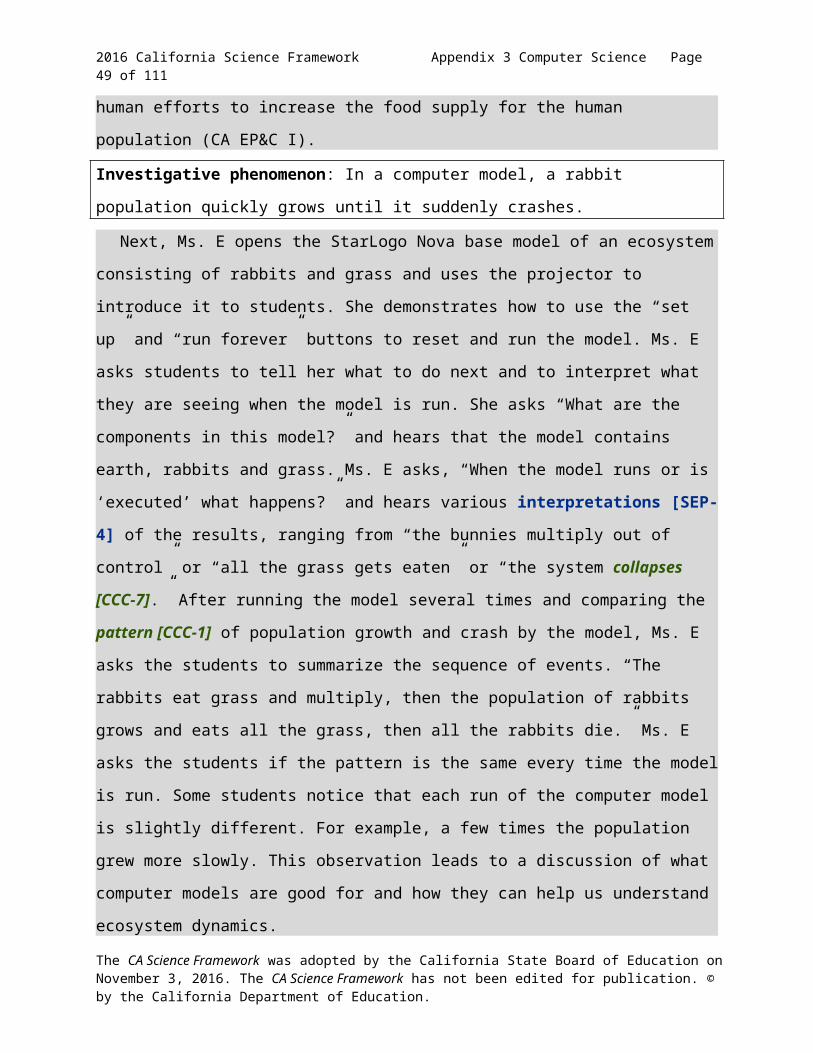
2016 California Science Framework Appendix 3 Computer Science Page 49 of 72
were to study the ‘average’ decision that individuals make, it will not always be a good
predictor of what the group as a whole will decide. Individuals may act differently when
they are cooperating. In small groups, humans will often cooperate because they are
related or friends with the others in the groups. Cooperation and sharing resources was
necessary for our human ancestors’ early survival, yet cooperation still exists today.
There are not many ‘free loaders.’ People in these groups tend to help out and
eventually get rewarded by receiving help from others. There are many examples of
where cooperation is seen in humans - a group of hunters going after a large prey,
cooperating on the playing field to win a game, community gardens and farms,
volunteering to help pass out papers in the classroom, etc. However, even if
cooperation is still very common in humans, it doesn’t mean that everyone in a group
will cooperate with a group decision. In this case, an individual could ‘defect’ from the
cooperation yet still benefit from the resources that are in the community. In a group of
cooperative people, it is often beneficial for a person to act in a selfish way.
Day 2 - Decoding and using the Water Pumping base model to run experiments (Explore)
To build up programming skills and motivate students to review the mathematics
necessary to understand the base model, Ms. H starts the day with a set of simple
programming challenges. Students must position agents in the virtual world (Spaceland)
and instruct the turtles move to certain locations using relative and absolute directions
to review Cartesian coordinates and turtle motion and positioning in StarLogo Nova. In a
second activity, Ms. H asks students to get out their StarLogo Nova blocks reference
guide and use it in decoding the base model of a water pump. In small groups, students
kept track of new and familiar blocks encountered as they decode a segment of code.
Ms. H asks each group to report out on what their group’s assigned piece of code did.
Ms. H then draws an illustration of the “runtime loop” and asks students to call out all of
the things that get updated each time the computer traverses the loop. She adds the
student suggestions of these to the diagram (such as update agents, or draw the
screen), or addresses misconceptions about how the parts of the code are executed.
The CA Science Framework was adopted by the California State Board of Education on November 3, 2016. The CA Science Framework has not been edited for publication. © by the California Department of Education.

2016 California Science Framework Appendix 3 Computer Science Page 50 of 72
Investigative phenomenon: When a well pumps, the water level near the well is much
lower so that it looks like there is a “cone of depression” shape around the well opening.
With this understanding of the model, students run it and simply observe the
outcome. After running the model several times and comparing the distribution of
groundwater produced by running the model, Ms. P leads the students in coming up
with a statement that describes the pattern [CCC-1] in how the groundwater changes over time [CCC-7]. Students that the water agents arrange themselves in a specific
shape around the entry to the well that Ms. P calls a “cone of depression.” The water
agents were not given instructions to form this pattern, and the surprised students
wonder what caused [CCC-2] this specific structure to form [CCC-6]. Ms. H reiterates
the characteristics of complex adaptive systems [CCC-4] and describes the cone of
depression formed as an emergent pattern. Noticing that each run of the computer
model is slightly different leads to a discussion of what computer models are good for
and how they can help us understand natural and artificial processes (ESS 3.B Human
impacts of Earth’s systems).
Day 3 - Modifying the base model and investigating the impact of changing the evaporation rate (Explain)
Investigative phenomenon: When the model includes evaporation, the amount of
available groundwater changes.
Ms. H asks the students, “how would this model be different if Earth’s climate
warmed?” She points out that “Computer models [SEP-2] of global climate predict that
California is likely to be warmer and drier on average than at present” and reviews a
piece of critical background knowledge from prior lessons, “the higher the temperature
of a substance the greater the kinetic energy of the molecules at its surface and
therefore the faster the rate of their evaporation.” With these pieces of information in
hand, Ms. H leads a discussion in which students connect rising local temperatures to
evaporation of water droplets. Students now modify the base model to add a new
procedure called “evaporation” and add a slider that controls the rate of evaporation of
water as it falls to earth.
The CA Science Framework was adopted by the California State Board of Education on November 3, 2016. The CA Science Framework has not been edited for publication. © by the California Department of Education.
2016 California Science Framework Appendix 3 Computer Science Page 51 of 72
Students then plan how they would use the model to run an experiment by changing
the variable related to evaporation rate. The students propose questions [SEP-1] about the effect [CCC-2] of evaporation on water pumped. A graphic organizer that Ms.
H calls an “experimental design form” guides students to develop scientific questions
that they can investigate using their model. The form then scaffolds the students into
seeing the need to use trials and to clearly identify the variables. Students design and
run their experiment in pairs after specifying which variable they would be changing.
Within what range? How many trials at each setting? They use the instrumentation in
the model (the graph and the data boxes) to monitor temperature under the different
scenarios, students record the data from the graph. Then analyze [SEP-4] the results of
their experiments, document the patterns [CCC-1] in their findings, and use these as
evidence to support a claim explaining [SEP-6] one aspect of the system. Ms. H leads
them to reflect on the real-world implications of their discoveries. Finally, students are
asked to think of ways to extend the model, based on what they have learned about
California’s agriculture, population growth, and water needs.
Day 4 - Adding water pumps to the model and running an experiment (Extend)
Investigative phenomenon: When two wells draw from the same aquifer, the height of
the pump head, the distance between the wells, and the amount of pumping all affect
whether or not one or both of the wells will run dry.
Ms. H starts off the day by reviewing the “Some for All or All for One” kinesthetic
model that the students ran on day one. She asks how their water pump model could be
used to model a scenario in which many different users were sharing the water
resource. After much lively discussion and ideas for changing the model are made, Ms.
H suggests that the students “keep it simple” and start simply by adding a second water
pump that pulls from the same aquifer.
Calling on their prior knowledge, Ms. H asks them to review how the first pump was
made in code. They describe that an agent was used to draw the pump by stamping
different colors as they walked. The colored tip of the pump head is used to detect when
water molecules hit the head and are pumped out of the ground. Students proceed to
copy and paste the existing “create pump” procedure to create a new procedure for
The CA Science Framework was adopted by the California State Board of Education on November 3, 2016. The CA Science Framework has not been edited for publication. © by the California Department of Education.
2016 California Science Framework Appendix 3 Computer Science Page 52 of 72
creating the second pump. Students can customize the height of the pump head and
the distance of the second pump from the first. Ms. H reminds the students about the
engineering cycle and the need to incrementally make changes and test the model
frequently.
To make responding to student questions occur in a timely manner and to develop
student self-sufficiency as learners while coding, Ms. P employs three tactics. The first
is to use pair programming, the second is to use green yellow and red cups for signaling
status, and the third is to employ a “Ask three then me” method of problem solving. In
pair programming, one student plays the role of the driver, who writes code while the
other, the navigator, makes suggestions and reviews the code as it is typed in. The two
programmers switch roles frequently. This practice encourages communication between
the pair and encourages collaborative problem solving. Colored cups are useful when
quickly taking the temperature of the room. Red cups signal that the students are stuck
and cannot move forward, yellow cups signal that the pair is experiencing difficulty but is
trying various solutions, and green cups signal that all is well with the pair. Since the
cups are visible to all, students who are ahead can locate and help pairs that are stuck.
Finally, the “ask three then me” encourages students to ask for suggestions from other
students rather than running to the teacher for help. When these three practices are
incorporated into the classroom culture, students learn faster and become more self-
sufficient.
Day 5 – Testing and evaluation of models (Evaluate) To see if their model is working as expected, students need to add some
instrumentation to determine how much water exists in the aquifer initially and whether
or not it decreases over time. Once students have implemented their code and tested it,
students design an experiment to determine the impact of altering the amount of
evaporation rate and/or adding additional water pumps to the system. Using the model
as an experimental test bed, students choose to explore parameters and discover some
of the issues and choices that affect water supplies. By the end of the five-day module,
students gain a more specific understanding of the processes involved in water
The CA Science Framework was adopted by the California State Board of Education on November 3, 2016. The CA Science Framework has not been edited for publication. © by the California Department of Education.

2016 California Science Framework Appendix 3 Computer Science Page 53 of 72
availability, storage, and use, and the potential impact of climate change on California’s
water supply.
After collecting their data, students communicate [SEP-8] their experiment, their
findings, and propose an explanation [SEP-6] for the data [SEP-4]. As they present
their findings, they must account for any unexpected variations and construct an argument [SEP-7] about the cause and effect relationship [CCC-2] between
evaporation and groundwater availability (i.e., the evaporation rate is an important
determiner of ground water availability, increases in evaporation rate turn out to be
unimportant, or that an unintended variable interferes with the ability to conclude either
way).
Days 6-7 (optional): Computational science and engineering challenge
Investigative problem: How can we reduce the impacts of human activity on the
climate?
This optional two-day extension enables students to design mitigation strategies [SEP-6] and then implement and test the strategies using the water pumping
model to determine their potential impact. Students design their own alterations to the
base model consisting of a mitigation strategy, a question, an experimental design, and
a model. In the first activity, students isolate and develop their strategy for mitigating
water wasting (for example, catching rainwater or implementing scheduled irrigation)
considering a range of factors (e.g., crops grown, soil types), and identify the changes
they will need to make to their water pump model. This leads to a second activity, in
which they design and implement their model, then use the model as an experimental
test bed to assess the impact of mitigation strategy they propose.
Vignette DebriefWith computational modeling and simulation, students are able to design
investigations that answer “what if” questions. As they investigated [SEP-2] the effects
of changing evaporation rate, they were creating computational models that show how
humans alter the interaction between the hydrosphere and atmosphere (HS-ESS3-6).
Students can use the results of their models as evidence that helps explain [SEP-6]
The CA Science Framework was adopted by the California State Board of Education on November 3, 2016. The CA Science Framework has not been edited for publication. © by the California Department of Education.
2016 California Science Framework Appendix 3 Computer Science Page 54 of 72
how changes [CCC-7] in climate affect water resources, which can therefore alter
human activity (HS-ESS3-1).
SEPs. Students perform investigations [SEP-3]. They analyze their data [SEP-4] to help figure out the relationship between different components in the system [CCC-4] they study. They use these relationships to evaluate a model [SEP-2] of the system.
They use the data from their investigations along with the reasoning of their model to
construct an explanation [SEP-6] about the causes [CCC-2] of limited groundwater
supply. In the making of modifications to an existing computer model, they employ
engineering practice by defining the parameters of the problem [SEP-1] and
designing solutions [SEP-6].DCIs. The competition for water resources is a tangible example of limited
natural resources (ESS3.A) and human impacts on Earth systems (ESS3.C).
CCCs. Students apply the crosscutting concept of systems and system models [CCC-4] as they think about the different components and how they interact. They
observe the unique system property/behavior of the “cone of depression” when they run
the base model for the first time. This feature is an example where the structure gives clues about the process that causes it to occur [CCC-6]. Students look for patterns [CCC-1] in pumping data [SEP-4] to test for cause and effect [CCC-2] relationships
between number of pumps and captured water, and between evaporation rate and
groundwater availability. They learn to question the validity of the model [SEP-2] and
consider what it can and cannot tell us about the real world, an application of CCCs
related to nature of science and the interaction between technology and science.
EP&Cs. Water resources support California’s vibrant population, its economically
vital agricultural sector, and its diverse natural habitats (EP&C I, IV). As such, decisions
surrounding these resources are complex and must balance many needs (EP&C V).
The kinesthetic model on Day 1 provides students a tangible experience about how
these decisions are complex. Nonetheless, these decisions are important because
humans have the ability to extract groundwater resources faster than they are
replenished, which can permanently alter the environment (EP&C II, III). The base
model does not include the environmental effects of groundwater pumping, but it could
The CA Science Framework was adopted by the California State Board of Education on November 3, 2016. The CA Science Framework has not been edited for publication. © by the California Department of Education.

2016 California Science Framework Appendix 3 Computer Science Page 55 of 72
be extended to do so. Even without directly modeling interactions with the non-human
biosphere, students can still notice how humans can affect one-another through the
multiple-pump experiments on Day 4. And the optional extension on Days 6-7 provides
students the chance to thoroughly brainstorm and test solutions that can minimize these
impacts (HS-ESS3-4).
CA CCSS Connections to English Language Arts and Mathematics: Throughout the
vignette, students participate in several small group and whole class discussions (SL.9-
12.1a-d, 4, 5). Students participate in a computer simulation which involves a base
model of a water pump. Students add a variable of evaporation to see how it impacts
the amount of water pumped. Students then adding a second water pump that pulls
from the same aquifer to simulate different users drawing from the same water supply.
Students argue (WHST.9-12.1) either the evaporation rate is an important determiner of
ground water availability or that increases in evaporation rate turn out to be unimportant,
or that an unintended variable interferes with the ability to conclude either way. (S-
IC.1,2,5,6)
Resources Several of the activities described in this vignette were adapted from other sources and
are cited within. Please refer to them for more detail.
The Project GUTS Introduction to Computer Modeling and Simulation module is available at http://code.org/curriculum/science.
The Project GUTS Water Resources module is available at http://code.org/curriculum/science.
The CA Science Framework was adopted by the California State Board of Education on November 3, 2016. The CA Science Framework has not been edited for publication. © by the California Department of Education.

2016 California Science Framework Appendix 3 Computer Science Page 56 of 72
High School Physics Vignette: Electrical Forces
Vignette Appendix 3.4: Electric Force Inquiry Investigation in High SchoolWritten by Dean Reese
Performance ExpectationsStudents who demonstrate understanding can:
HS-PS2-4. Use mathematical representations of Newton’s Law of Gravitation and Coulomb’s Law to describe and predict the gravitational and electrostatic forces between objects. [Clarification Statement: Emphasis is on both quantitative and conceptual descriptions of gravitational and electric fields.] [Assessment Boundary: Assessment is limited to systems with two objects.]
HighlightedScience and
Engineering Practices
[SEP-2] Developing and Using Models
[SEP-5] Using Mathematics and Computational Thinking
[SEP-7]Engaging in Argument from Evidence
HighlightedDisciplinary Core Ideas
PS2.B Types of Interactions
HighlightedCrosscutting Concepts
[CCC-2] Patterns
CA CCSS Math Connections: MP.2, MP.4, HSN-Q.A.2, HSA-SSE.A.1
CA ELD Connections: ELD.PI.11-12.1,5,6a-b,9,10,11a
CA CCSS ELA/Literacy Connections: RST.11-12.1, RST.11-12.7, WHST.9-12.9
IntroductionStudents investigate through inquiry the electric force by exploring static
electricity phenomenon and building a computer simulation in order to understand the
factors that affect the Electric Force (Coulomb’s Law).
The CA Science Framework was adopted by the California State Board of Education on November 3, 2016. The CA Science Framework has not been edited for publication. © by the California Department of Education.

2016 California Science Framework Appendix 3 Computer Science Page 57 of 72
Length and position in course – This vignette represents about two weeks of instruction
that would come at the beginning of an instructional segment on Coulomb’s law. It
assumes limited prior knowledge about electrical interactions. Because students build
up the equation of Coulomb’s law using an inquiry approach, this vignette needs to
come before students read any textbook material on the subject.
Prior knowledge – Students should be familiar with the internal structure of atoms and
know about the charged particles within the atoms.
This vignette assumes that students have completed a multi-day sequence
introducing computer modeling and simulation (such as module 1 of the Code.org CS in
Science curriculum). Students will need basic skills in reading and modifying computer
codes. They will need to interpret an existing base model and make modifications to it
by adding new codes or altering the ones that exist. While this vignette provides
opportunities to practice those skills, they are not specifically addressed in this lesson
outline.
5E Lesson Design – This sequence is based on an iterative 5E model. See the
Instructional Strategies chapter for tips on implementing 5E lessons.
Day 1: The Mystery of the Transparent Tape (Engage)Students investigate
several situations where
objects are attracted to
one another.
Days 2-3: Qualitative and Quantitative Models (Explore/Explain)Students investigate
additional static electricity
phenomena in a hands-on
lab and then use a
computer visualization to
develop qualitative models
that explain the
phenomena. They then
create quantitative models
Days 4-5: Lab Stations to Refine the Mathematical Model (Explore/Explain) Students rotate through lab
stations where they directly
investigate electrostatic
forces or obtain
information about them.
They refine their models in
groups and then spend an
entire day in a whole class
science talk discussion to
The CA Science Framework was adopted by the California State Board of Education on November 3, 2016. The CA Science Framework has not been edited for publication. © by the California Department of Education.

2016 California Science Framework Appendix 3 Computer Science Page 58 of 72
of these attractions by
coding computer
simulations.
determine the equation of
Coulomb’s law.
Day 6: Applying Coulomb’s Law (Elaborate)Students apply Coulomb’s
law to a variety of
circumstances.
Day 7: Coding Coulomb’s Law (Elaborate)Students compare their
paper and pencil
calculations to their code
from Day 3 and then
modify the code to
accurately reflect
Coulomb’s law.
Day 8 (Evaluate): Computational science & engineering challengeStudents complete an
assessment where they
cite evidence and
reasoning to support
Coulomb’s law, comment
sample code, and apply
Coulomb’s law to several
scenarios.
Day 1 – The Mystery of the Transparent Tap (Engage)
Anchoring phenomenon: When two pieces of transparent tape are pulled apart, they
interact with one another.
Mr. R hands out two pieces of scotch tape to all of the students in class. Then he
shows the students how to adhere one piece of tape onto another piece of tape, and
then how to pull them apart (https://www.youtube.com/watch?v=YIbEtIuzT8E). One
piece of tape becomes positively charged and the other becomes negatively charged.
Mr. R then asks students to Think/Pair/Share on what they think is happening to cause
the tape to interact in this way. Mr. R is mindful that at this stage of the lesson it is
important to simply listen to the student’s answers as oppose to qualifying them as right
or wrong.
Each student pulls the two pieces of tape apart and experiences the electric force
interaction that occurs between the two pieces of tape. Students are usually baffled by
the interaction and did not expect to see this occur. Students are asked to think about
what is happening and to discuss with a partner next to them in class about why the
The CA Science Framework was adopted by the California State Board of Education on November 3, 2016. The CA Science Framework has not been edited for publication. © by the California Department of Education.

2016 California Science Framework Appendix 3 Computer Science Page 59 of 72
phenomenon that they see occurs. Then students are randomly called on to share their
partner’s thoughts on the situation.
Mr. R introduces the Van de Graaff generator, highlights some of the different parts,
and then demonstrates the generator discharging to a grounding rod. Mr. R asks
students to identify what is common about the two demonstrations. Students note that
both involve something pushing or rubbing together. Mr. R notes that they will want to
return to this observation as they begin to explain the next phenomenon.
Explore/Explain
Investigative phenomenon: Pie tins placed on top of a Van de Graaf generator seem
to fly away as the generator is turned on.
The idea of placing 10 aluminum pie tins on top of the Van de Graaff Generator and
turning it on is presented to the students, but not carried out at this point. Previous to
conducting the pie tin demonstration Mr. R asks students to write a paragraph predicting
what they think will occur when he turns the generator on with the pie tins on top and
why. Students are encouraged to draw the system and add annotations to the drawing
to help develop their thinking. Mr. R asks the students to share their thinking with the
students around them and then has students share out their expectations about what
will happen.
Then Mr. R commences the pie tin demonstration. Pie tins begin to repel one by one
off of the stack and fall down from the top of the generator. After the demonstration, the
class discusses what they actually saw and possible explanations of how it happened.
Mr. R asks students to circle places in their original drawing that they think are accurate
and put boxes around sections that they would like to now change. Students write a
paragraph explaining what actually occurred in the demonstration and reasoning behind
why it may have occurred. Mr. R emphasizes the importance of using their actual
observations as evidence in this preliminary explanation [SEP-6].
Day 2 – Qualitative and Quantitative Models (Explore/Explain)
Investigative phenomenon: A balloon sticks to the wall after being rubbed back and
forth across a student’s hair.
The CA Science Framework was adopted by the California State Board of Education on November 3, 2016. The CA Science Framework has not been edited for publication. © by the California Department of Education.

2016 California Science Framework Appendix 3 Computer Science Page 60 of 72
Mr. R engages students in this day with a few quick static electricity demos,
including making a balloon stick to the wall and having a student feel a shock when
reaching out to touch a metal doorknob after having rubbed her feet across the carpet.
He asks students to identify similarities between these two phenomena and yesterday’s
phenomena. He then instructs students to explore two simulations of these phenomena
from PhET, John Travoltage (https://phet.colorado.edu/en/simulation/john-travoltage)
and the Balloons and Static Electricity
(https://phet.colorado.edu/en/simulation/legacy/balloons). They record observations of
how objects charge up and the resulting forces from this buildup of charge.
Students then revisit their models and explanations from yesterday. After having
them discuss in pairs and as a class, he has students individually redraw their diagrams
using their new understanding of how electric charges work.
ElaborateAt this point, students have developed a qualitative model [SEP-2] of electrical
charges attracting and repelling one another. It does a good job of describing the
general cause and effect relationships [CCC-2] they have observed, but their model
does not help them predict how strong these electrical forces are. Scientists always
strive to quantify [CCC-3] the electric force so they can make more meaningful
predictions. Mr. R tells students that they will use the simulation software NetLogo to
turn their qualitative models into quantitative ones. Mr. R models how to incorporate
mathematical equations into a NetLogo simulation using an energy conservation model
that the students had used previously in class (see
http://modelingcommons.org/search/search_action). Then Mr. R asks students to list the
factors that they think might affect the strength of the electric force. Students asked questions [SEP-1] about these factors during the middle grades, MS-PS2-3. Students
then work in teams to combine the factors that affect the electric force into a possible
equation for the electric force. Students should not be using the book or internet
resources here. Only their insight from the previous phenomena should be shaping
these mathematical models. Different teams have come up with very different
equations, and few of them resemble the commonly accepted scientific equation at this
point.
The CA Science Framework was adopted by the California State Board of Education on November 3, 2016. The CA Science Framework has not been edited for publication. © by the California Department of Education.

2016 California Science Framework Appendix 3 Computer Science Page 61 of 72
Students examine code from a simulation that incorporates mathematical equations
into NetLogo. Mr. R assigns different groups to explain different sections of the code to
the rest of the class. He circulates around to make sure that each group has properly
traced through their code. One new coding tool that the example demonstrates is the
idea of a global variable. Mr. R calls on students to identify where the variable is used in
their section of the code.
Mr. R then asks students to create a NetLogo simulation of the electric force
interaction of two charges. To make this simulation, they will modify code from a base
model they have previously worked with. As students work, Mr. R asks students to
rotate who is the “pilot” and who are the “co-pilots” every 15 minutes throughout the
coding portion of lesson. Some students code systems where the charges are
stationary and others code simulations that are dynamic where one or both of the
charges begins to move as a result of the electric force. They embed their mathematical
model for the electric force into their simulations using global variables in their code.
Day 3: Finish Coding (Explain, continued)Mr. R asks several students to briefly present the unfinished program that they have
been building. He chooses groups that either have interesting code development or
have an interesting mental model on the factors that affect the electric force. The aim is
to share the various mathematical forms of the electric force as well as how students
have gone about incorporating these equations into their simulations.
Students continue coding their electric force simulations and are reminded to rotate
who is the “pilot” of the simulation throughout the class period. Students submit the
finished or unfinished code to Edmodo by the end of the class period. Figure App 3.2
shows an example of student work.
The CA Science Framework was adopted by the California State Board of Education on November 3, 2016. The CA Science Framework has not been edited for publication. © by the California Department of Education.

2016 California Science Framework Appendix 3 Computer Science Page 62 of 72
Figure App 3.2. Student Example of a NetLogo Simulation of Electric Force
-Entire Simulation created by four students in group A
Information Tab:What is it?
This model is used to quantitatively simulate the interactions between two particles with
the electric force (F). The simulation uses initial conditions and Coulomb's Equation for
the electric force in order to model particle-particle interaction.
How it works:
This model utilizes multiple equations in order to function. The basis of these equations
are dictated by the globals defined within the code and in the User Interface (UI):
[charge1] are [charge2] are globals defined in the UI and correspond to the given
charge (in Coloumbs). Charge1 defines the left particle's charge and Charge2
defines the right paricle's charge. The color (via the globals [color1] and [color2]) of
each particle also corresponds to its charge, with neutral displaying gray, negative
displaying black, and positive displaying red.
[D] is a UI-defined global that represents distance.
[Mass] is defined in the UI and is uniform between the two particles.
[Initial_Velocity] is the beginning velocity of the rightmost particle.The CA Science Framework was adopted by the California State Board of Education on November 3, 2016. The CA Science Framework has not been edited for publication. © by the California Department of Education.

2016 California Science Framework Appendix 3 Computer Science Page 63 of 72
[F] is defined as the electric force and is defined by Coloumb's Equation embedded
into the code: F = k(charge1)(charge2)/(D ^ 2)
[A] is defined as the acceleration of the rightmost particle, defined by Newton's
Second Law, embedded in the code: F = mA A = F/m
[V] is the given velocity of the rightmost particle, defined as a function of time and
acceleration: V = (initial_velocity) + (A * T)
[X] is the position of the rightmost particle's position. It changes depending on the
velocity defined above.
[T] represents time, as a replacement of ticks. Within the code, the value for T
increases by 0.01 every 0.01 seconds. As such, T represents time in the real-world.
[R] is the distance between two particles, which is identical to X.
[k] is Coulomb's constant, defined as 9 * (10 ^ 9) at the setup phase of the code.
How to use it
(1) Select values for the particle’s charges and the distance between them. Choose
values for their mass and the rightmost particle’s initial velocity. (2) Hit the setup button.
(3) Hit the go button to begin the simulation. At any point during the model, the “go”
button can be deselected to stop the model manually.
Things to Notice
As the simulation is running, notice the velocity of the right participles, Is it constant or
does it change? How does the movement of the particle relate to its distance from the
left particle relate to its distance from the left particle?
Things to Try:
(1) Make one or both charges neutral. What happens? (2) If both charges are positive,
do the particles repel or attract? (3) How does the mass affect velocity? Try increasing
the mass and using the graph provided to examine this relationship.
The CA Science Framework was adopted by the California State Board of Education on November 3, 2016. The CA Science Framework has not been edited for publication. © by the California Department of Education.

2016 California Science Framework Appendix 3 Computer Science Page 64 of 72
Extending the Model:
This is a simplistic model of the electric force, with only one particle moving at a time.
To extend this model, both particles can be allowed movement. In addition, more than
two particles can be included in the model to demonstrate the addition of force vectors.
NetLogo Features:
Note the use of [globals] at the top of the code to define variables not present in the
user interface. The most important part of this model are the relationships defined by
the equations embedded in the simulation. View the “How it Works” section to see
more.
Related Models:
This model is most like the “Traffic Basic” model in the NetLogo Model Library. It utilizes
a similar interaction between acceleration, velocity, and position for the right particle.
Credits and References:
Programmed by: Joshua Abraham, Joe Garcia, Ryan Wang, and Jace Marcos
Teacher: Mr. Reese, Tracy High School, IB Physics Period 1
This work is licenses under the Creative Commons Attribution-NonCommerical-
ShareAlike 4.0 International License (see
http://modelingcommons.org/browse/one_model/4472#model_tabs_browse_info). To
view a copy of this license, visit http://creativecommons.org/licenses/by-nc-sa/4.0/.
Day 4 – Lab Stations to Refine the Mathematical Model (Explore)
Investigative phenomenon: Sometimes two charged objects attract one another and
sometimes they repel. Two objects repel one another more when they are close
together or when more rubbing is done to charge them.
Mr. R sets up 4 stations for the students to cycle through. Station 1 has one ring
stand with a Styrofoam insulator hanging from it by a cotton string, and another ring
stand with a crumpled ball of aluminum foil hanging from it by a cotton string. This
station is also accompanied with a fur pelt, glass rod, plastic rod, silk, balloons, and a
The CA Science Framework was adopted by the California State Board of Education on November 3, 2016. The CA Science Framework has not been edited for publication. © by the California Department of Education.

2016 California Science Framework Appendix 3 Computer Science Page 65 of 72
metal rod. Station 2 has a close reading that focuses on the details of the electric force
without stating the equation explicitly (figure App 3.3). Station 3 has a computer
simulation (http://employees.oneonta.edu/viningwj/sims/ coulombs_law_s.html ) allowing
students to generate simulated distance and force data between two charges. Station 4
has another close reading article focused on how electric forces translate into
accelerations of the charged object (figure App 3.4).
At each station students document what they see, write questions that arise, and
collect data where appropriate. At the stations where they obtain information [SEP-8] from articles, they highlight quotes from the reading that would provide evidence for
their claim regarding factors that affect the electric force.
ExplainAfter students have spent about 10 minutes each at the four stations, Mr. R asks the
students to revisit their equations of magnetic force. He asks them to prepare comments
for tomorrow’s whole class discussion on the topic of factors that affect the electric
force. Students reflect and write about how the experience of the 4 stations is affecting
their thinking in regards to factors that affect the electric force. This reflection goes into
their lab notebooks.
Day 5 – Explaining the Lab Stations (Explain)Mr. R sets up the ground rules for the day’s discussion topic, “what factors affect the
electric force?” He asks the students to take five minutes to review all data collected,
important text from the close reading articles, and observations from station 1 that may
be relevant to answering the question. He also explains to the students that their
participation will go towards the class participation grade. During the whole class
discussion, Mr. R purposefully removes himself from the discussion and lets the class
know that he will just be an observer. He does not try to qualify the answers from the
group during this discussion as this would interfere with the students’ discourse.
However, if thing do go off topic he will remind students of the discussion focus.
After the discussion Mr. R reveals Coulomb’s law to the class by writing it on the
white board. He shows a short YouTube video that illustrates Coulomb’s torsion balance
experiment (https://www.youtube.com/watch?v=FYSTGX-F1GM). He asks students to
The CA Science Framework was adopted by the California State Board of Education on November 3, 2016. The CA Science Framework has not been edited for publication. © by the California Department of Education.

2016 California Science Framework Appendix 3 Computer Science Page 66 of 72
write an entry in their lab notebook comparing their group’s equation to Coulomb’s law.
What do they have in common and what is different? Do they have the same terms?
Does their equation follow a similar form or structure? What information did Coulomb
have that they did not?
Day 6: Applying Coulomb’s Law (Elaborate)Now that students have seen the form of Coulomb’s law, they apply it to predict the
force between charges in different circumstances. The students first work independently
on applying Coulomb’s Law to the various situations presented in the problem set.
When students are struggling on a particular problem they spend a few minutes on it
trying to figure it out and then move on to the next problem. After 30 minutes they move
to their lab groups to discuss the solutions with their peers and with the support of Mr.
R.
Days 7: Coding Coulomb’s Law (Elaborate)Students revisit their code from Day 3. Mr. R selects a few of the word problems
from Day 6 and asks the students to determine if their original code will get the correct
answer, predict a smaller force, or predict a larger force than they calculated using
Coulomb’s law. He then asks them to set up their old code so that it reproduces the
scenario in the word problem and see if they have accurately predicted their model’s
behavior. Then, he has them modify the code so that it includes the correct version of
Coulomb’s law. Does the code produce the same answer as their manual calculations?
Mr. R then introduces a third problem that is very complex and too difficult to complete
by hand. Students use their code to solve this problem.
Day 8: (Evaluate)Mr. R gives students an assessment on the learning objectives for the learning
sequence. The individual written assessment that involves 3 parts. The first part
requires students to support claims about different factors that affect the electric force
with appropriate evidence and reasoning. The second part of the assessment requires
students to comment lines of code from one of the student models of the NetLogo
The CA Science Framework was adopted by the California State Board of Education on November 3, 2016. The CA Science Framework has not been edited for publication. © by the California Department of Education.

2016 California Science Framework Appendix 3 Computer Science Page 67 of 72
electric force simulations. The third part of the assessment requires students to apply
Coulomb’s Law to various situations in order to solve for the electric force.
Vignette DebriefThis vignette presents an innovative approach to teaching one of the classic
equations in physics. Rather than give students Coulomb’s law and have them simply
apply it, Mr. R provided students a range of phenomena to investigate electrostatic
interactions. He had them develop a qualitative model on Day 2, which they then extend
into a quantitative model. Mr. R has students code up their mathematical representation
even though most of the students have a scientifically incorrect equation. He does this
intentionally so that students can return to their model and revise it after they have
additional information. After these rich experiences, students will be much more fluent
with Coulomb’s law and can apply it to predict electrostatic forces between objects (HS-
PS2-4).
SEPs. Students develop qualitative and quantitative models [SEP-2] of
electrostatic interactions, refine their model, and then apply it to predict behavior in a
range of circumstances. As students struggle to formulate an equation for the strength
of the electrostatic force, they employ mathematical thinking [SEP-5]. They then use
computational thinking [SEP-5] to convert the mathematics into a computer code.
The science talk session on Day 5 requires students to engage in argument from evidence [SEP-7], which eventually allows students to construct meaningful
explanations [SEP-6] of the factors that influence [CCC-2] electrostatic forces on Day
8’s assessment.
DCIs. Students develop an in depth understanding of the factors that influence
electrostatic forces, one form of interaction (PS2.B).
CCCs. Through repeated exposure to related phenomena, students identify
patterns [CCC-1] about how objects become electrically charged and the factors that
influence the electrostatic forces between them. Students’ initial mathematical model of
electrostatic interactions often incorporate several of the correct causal mechanisms [CCC-2], but few students correctly identify the inverse square proportional [CCC-3] relationship without additional information. While simply listing the factors may have
The CA Science Framework was adopted by the California State Board of Education on November 3, 2016. The CA Science Framework has not been edited for publication. © by the California Department of Education.

2016 California Science Framework Appendix 3 Computer Science Page 68 of 72
been sufficient in earlier grades, the high school level of understanding of cause-and-effect [CCC-2] for Coulomb’s law requires that students quantify the relative importance
of the different factors.
EP&Cs. Much like Coulomb’s law controls the interactions between the two
pieces of transparent tape on Day 1, it also controls adhesion of contaminants to soil in
groundwater. Mr. R could extend the lesson to show different ways that electrostatic
interactions are utilized in real world engineering solutions such as water filtration.
CA CCSS Connections to English Language Arts and Mathematics: Throughout
the vignette, students participate in several small group and whole class discussions
(SL.6-8.1a-d, 4, 5). They gather information from several sources (RST.6-8.3, 9) to
make scientific arguments supported by evidence (WHST.6-8.1). Coding is an excellent
example of reasoning quantitatively (MP.2) and modeling using mathematics (MP.4).
Teachers can emphasize different aspects of the Coulomb’s law equation to connect to
CCSS Mathematics concepts that are at the appropriate level of complexity for their
students. Students can recognize the structure of the equation as a multi-variable
equation with terms and coefficients (A-SSE.1). Teachers can prompt students to graph
and interpret the function from different representations (F-IF.7), identify the key
features of the function (F-IF.4) and explicitly discuss the domain over which it is valid in
the real world (F-IF.5). By graphing Coulomb’s law for a certain pair of charges at
different distances apart, students can notice that the rate of change of the function is
large when the charges are close together but is small when the particles move farther
apart. Students can ask questions about how this behavior relates to the structure of the
equation they wrote (F-IF.6).
Figure App 3.3: Student Handout: The Electric Force Close Reading #1
Directions: Read this article (http://www.physicsclassroom.com/class/estatics/Lesson-
3/Coulomb-s-Law) specifically for any information that will help you understand the
factors that affect the electric force. You are looking for evidence and reasoning that will
support your claim. Highlight all relevant information with regards to this focus.
Force as a Vector Quantity
The CA Science Framework was adopted by the California State Board of Education on November 3, 2016. The CA Science Framework has not been edited for publication. © by the California Department of Education.

2016 California Science Framework Appendix 3 Computer Science Page 69 of 72
The electrical force, like all forces, is typically expressed using the unit Newton. Being a
force, the strength of the electrical interaction is a vector quantity
(http://www.physicsclassroom.com/Class/1DKin/U1L1b.cfm) that has both magnitude
and direction. The direction of the electrical force is dependent upon whether the
charged objects are charged with like charge or opposite charge and upon their spatial
orientation. By knowing the type of charge on the two objects, the direction of the force
on either one of them can be determined with a little reasoning. In the diagram below,
objects A and B have like charge causing them to repel each other. Thus, the force on
object A is directed leftward (away from B) and the force on object B is directed
rightward (away from A). On the other hand, objects C and D have opposite charge
causing them to attract each other. Thus, the force on object C is directed rightward
(toward object D) and the force on object D is directed leftward (toward object C). When
it comes to the electrical force vector, perhaps the best way to determine the direction of
it is to apply the fundamental rules of charge interaction (opposites attract and likes
repel) using a little reasoning.
Source: The Physics Classroom http://www.physicsclassroom.com/Class/estatics/u8l1c.cfm
Electrical force also has a magnitude or strength. Like most types of forces, there are a
variety of factors that influence the magnitude of the electrical force. Two like-charged
balloons will repel each other and the strength of their repulsive force can be altered by
changing three variables. First, the quantity of charge on one of the balloons will affect
the strength of the repulsive force. The more charged a balloon is, the greater the
repulsive force. Second, the quantity of charge on the second balloon will affect the
strength of the repulsive force. Gently rub two balloons with animal fur and they repel a
little. Rub the two balloons vigorously to impart more charge to both of them, and they
repel a lot. Finally, the distance between the two balloons will have a significant and
noticeable effect upon the repulsive force. The electrical force is strongest when the
The CA Science Framework was adopted by the California State Board of Education on November 3, 2016. The CA Science Framework has not been edited for publication. © by the California Department of Education.
2016 California Science Framework Appendix 3 Computer Science Page 70 of 72
balloons are closest together. Decreasing the separation distance increases the force.
The magnitude of the force and the distance between the two balloons is said to be
inversely related.
Figure App 3.4: Student Handout: The Electric Force Close Reading #2
Directions: Read this article (http://www.physicsclassroom.com/class/estatics/Lesson-
3/Newton-s-Laws-and-the-Electrical-Force) specifically for any information that will help
you understand the factors that affect the electric force. You are looking for evidence
and reasoning that will support your claim. Highlight all relevant information with regards
to this focus.
The attractive or repulsive interaction between any two charged objects is an electric
force. Like any force, its effect upon objects is described by Newton's laws of motion.
The electric force - Felect - joins the long list of other forces that can act upon objects.
Newton's laws are applied to analyze the motion (or lack of motion) of objects under the
influence of such a force or combination of forces. The analysis usually begins with the
construction of a free-body diagram in which the type and direction of the individual
forces are represented by vector arrows and labeled according to type. The magnitudes
of the forces are then added as vectors in order to determine the resultant sum, also
known as the net force. The net force can then be used to determine the acceleration of
the object.
In some instances, the goal of the analysis is not to determine the acceleration of the
object. Instead, the free-body diagram is used to determine the spatial separation or
charge of two objects that are at static equilibrium. In this case, the free-body diagram is
combined with an understanding of vector principles in order to determine some
unknown quantity in the midst of a puzzle involving geometry, trigonometry and
Coulomb's law. In this last section of Lesson 3, we will explore both types of
applications of Newton's laws to static electricity phenomenon.
The CA Science Framework was adopted by the California State Board of Education on November 3, 2016. The CA Science Framework has not been edited for publication. © by the California Department of Education.

2016 California Science Framework Appendix 3 Computer Science Page 71 of 72
Electric Force and AccelerationSuppose that a rubber balloon and a plastic golf tube are both charged negatively by
rubbing them with animal fur. Suppose that the balloon is tossed up into the air and the
golf tube is held beneath it in an effort to levitate the balloon in midair. This goal would
be accomplished when the spatial separation between charged objects is adjusted such
that the downward gravity force (Fgrav) and the upward electric force (Felect) are balanced.
This would present a difficult task of manipulation as the balloon would constantly move
from side to side and up and down under the influences of both the gravity force and the
electric force. When the golf tube is held too far below the balloon, the balloon would fall
and accelerate downward. This would in turn decrease the separation distance and lead
to an increase in the electric force. As the Felect increases, it would likely exceed the Fgrav
and the balloon would suddenly accelerate upward. And finally, if the point of charge on
the golf tube is not directly under the point of charge of the balloon (a likely scenario),
the electric force would be exerted at an angle to the vertical and the balloon would
have a sideways acceleration. The likely result of such an effort to levitate the balloon
would be a variety of instantaneous accelerations in a variety of directions.
The CA Science Framework was adopted by the California State Board of Education on November 3, 2016. The CA Science Framework has not been edited for publication. © by the California Department of Education.

2016 California Science Framework Appendix 3 Computer Science Page 72 of 72
References
Fuhrmann, T., Greene, D., Salehi, S., & Blikstein, P. (2012). Bifocal Biology: the link between real and virtual experiments. Proceedings of the Constructionism 2012 Conference, Athens, Greece.
Salehi, S., T. Fuhrmann, D. Greene, and P. Blikstein. 2013. The Effect of Bifocal Modeling on Students’ Assessment of Credibility. American Educational Research Association. Review.
Transformative Learning Technologies Lab. 2013. “Project: Bifocal modeling.” https://tltl.stanford.edu/project/bifocal-modeling (accessed February 16, 2017).
The CA Science Framework was adopted by the California State Board of Education on November 3, 2016. The CA Science Framework has not been edited for publication. © by the California Department of Education.