computer science & information technology 51aircconline.com/csit/csit651.pdf · 2016-03-29 ·...
TRANSCRIPT

Computer Science & Information Technology 51


David C. Wyld
Jan Zizka (Eds)
Computer Science & Information Technology
The Second International Conference on Computer Science, Engineering
and Information Technology (CSITY 2016)
Chennai, India, April 02~03, 2016
AIRCC Publishing Corporation

Volume Editors
David C. Wyld,
Southeastern Louisiana University, USA
E-mail: [email protected]
Jan Zizka,
Mendel University in Brno, Czech Republic
E-mail: [email protected]
ISSN: 2231 - 5403
ISBN: 978-1-921987-49-6
DOI : 10.5121/csit.2016.60401 - 10.5121/csit.2016.60412
This work is subject to copyright. All rights are reserved, whether whole or part of the material is
concerned, specifically the rights of translation, reprinting, re-use of illustrations, recitation,
broadcasting, reproduction on microfilms or in any other way, and storage in data banks.
Duplication of this publication or parts thereof is permitted only under the provisions of the
International Copyright Law and permission for use must always be obtained from Academy &
Industry Research Collaboration Center. Violations are liable to prosecution under the
International Copyright Law.
Typesetting: Camera-ready by author, data conversion by NnN Net Solutions Private Ltd.,
Chennai, India

Preface
The Second International Conference on Computer Science, Engineering and Information Technology
(CSITY 2016) was held in Chennai, India, during April 02~03, 2016. The Second International
Conference on Signal and Image Processing (SIGPRO 2016), The Second International Conference on
Artificial Intelligence & Fuzzy Logic Systems (AIFZ 2016), The Second International Conference on
Networks & Communications (NWCOM 2016), The Second International Conference on Data
Mining (DTMN 2016) and The Seventh International Conference on Applications of Graph Theory in
Wireless Ad hoc Networks and Sensor Networks (GRAPH-HOC 2016) were collocated with the
CSITY-2016. The conferences attracted many local and international delegates, presenting a balanced
mixture of intellect from the East and from the West.
The goal of this conference series is to bring together researchers and practitioners from academia and
industry to focus on understanding computer science and information technology and to establish new
collaborations in these areas. Authors are invited to contribute to the conference by submitting articles
that illustrate research results, projects, survey work and industrial experiences describing significant
advances in all areas of computer science and information technology.
The CSITY-2016, SIGPRO-2016, AIFZ-2016, NWCOM-2016, DTMN-2016, GRAPH-HOC 2016
Committees rigorously invited submissions for many months from researchers, scientists, engineers,
students and practitioners related to the relevant themes and tracks of the workshop. This effort
guaranteed submissions from an unparalleled number of internationally recognized top-level
researchers. All the submissions underwent a strenuous peer review process which comprised expert
reviewers. These reviewers were selected from a talented pool of Technical Committee members and
external reviewers on the basis of their expertise. The papers were then reviewed based on their
contributions, technical content, originality and clarity. The entire process, which includes the
submission, review and acceptance processes, was done electronically. All these efforts undertaken by
the Organizing and Technical Committees led to an exciting, rich and a high quality technical
conference program, which featured high-impact presentations for all attendees to enjoy, appreciate
and expand their expertise in the latest developments in computer network and communications
research.
In closing, CSITY-2016, SIGPRO-2016, AIFZ-2016, NWCOM-2016, DTMN-2016, GRAPH-HOC
2016 brought together researchers, scientists, engineers, students and practitioners to exchange and
share their experiences, new ideas and research results in all aspects of the main workshop themes and
tracks, and to discuss the practical challenges encountered and the solutions adopted. The book is
organized as a collection of papers from the CSITY-2016, SIGPRO-2016, AIFZ-2016, NWCOM-
2016, DTMN-2016, GRAPH-HOC 2016.
We would like to thank the General and Program Chairs, organization staff, the members of the
Technical Program Committees and external reviewers for their excellent and tireless work. We
sincerely wish that all attendees benefited scientifically from the conference and wish them every
success in their research. It is the humble wish of the conference organizers that the professional
dialogue among the researchers, scientists, engineers, students and educators continues beyond the
event and that the friendships and collaborations forged will linger and prosper for many years to
come.
David C. Wyld
Jan Zizka

Organization
General Chair
Jan Zizka Mendel University in Brno, Czech Republic
Dhinaharan Nagamalai Wireilla Net Solutions PTY LTD, Australia
Program Committee Members
Abd El-Aziz Ahmed Cairo University, Egypt
Abdolreza Hatamlou Islamic Azad University, Iran
Abe Zeid Northeastern University, USA
Ahmed Hussein Aliwy University of Kufa, Iraq
Ahmed Taisser Cairo University, Egypt
Aiden B. Lee University of La Jolla, USA
Akira Otsuki Nihon University, Japan
Alejandro Regalado Mendez Universidad del Mar, Mexico
Ali Abid D. Al-Zuky Mustansiriyah University Baghdad, Iraq
Ali Elkateeb University of Michigan-Dearborn, USA
ALI ZAART Beirut Arab University,Lebanon
Alireza Sahab Lahijan Branch Islamic Azad University, Iran
Alvin Lim Auburn University, USA
Amar Faiz bin Zainal Abidin Universiti Teknologi MARA, Malaysia
Amol D Mali Univ. of Wisconsin-Milwaukee, USA
Anja Richert RWTH Aachen University, Germany
Ankit Chaudhary Truman State University, USA
Apai Universiti Malaysia Perlis, Malaysia
Arifa Ferdousi Varedndra University, Bangladesh
Atif Farid Mohammad University of North Carolina,Charlotte
Ayad N.M.A Atomic Energy authority, Egypt
Ayad Salhieh Australian College of Kuwait, Kuwait
Azween Bin Abdullah Universiti Teknologi Petronas, Malaysia
Bai Li Woodside Energy Ltd, Australia
Barbaros Preveze Cankaya University, Turkey
Bouix Emmanuel iKlax Media, France.
Braham Barkat The petroleum Institute, Saudi Arabia
Chandan Kumar Karmakar University of Melbourne, Australia
Cheng fang Zhejiang University, China
Chih-Lin Hu National Central University, Taiwan
Chin-Chih Chang Chung-Hua University, Taiwan
Chiranjib Sur University of Florida, USA
Christian Esposito National Research Council, Italy
Dac-Nhuong Le Haiphong University, Vietnam
Dalila Guessoum Saad Dahleb University, Algeria
Danda B.Rawat Georgia Southern University, USA
David B. Bracewell General Electric Global Research, USA
David C. Wyld South eastern Louisiana University, USA

Derya Birant Dokuz Eylul University, Turkey
Dongchen Li Peking University, China
Ed Hammond Duke University, USA
Epaminondas Kapetanios University of Westminster, London
Eric Renault Telecom SudParis, France
Faiz ul haque Zeya Bahria University, Pakistan
Farzad Kiani Istanbul S.Zaim University, Turkey
Fatih Korkmaz Cankiri Karatekin University, Turkey
Fernando Zacarias University of Puebla, Mexico
G.Ali Mansoori University of Illinois at Chicago, Chicago
Gongjun Yan Indiana University Kokomo, USA
Hamid Reza Karimi University of Agder, Norway
Hao Shi Victoria University, Australia
Hao-En Chueh Yuanpei University, Taiwan,
Huiyu Zhou Queen's University Belfast, United Kingdom
I.V.Narasimha University of Houston, USA
Ijaz A. Shoukat King Saud University, Saudi Arabia
Intisar Al-Mejibli University of Essex, United Kingdom
Ioannis Karamitsos University of Aegean, Greece
Isa Maleki Islamic Azad University, Iran
ISAMM University of Manouba, Tunisia
Jacques Epounde Ngalle Robert Morris University, USA
Jan Lindström MariaDb Corporation, Finland
Jerin Cyriac Truman State University, USA
Jose Enrique Armendariz-Inigo Universidad Publica de Navarra, Spain
José Raniery University of Sao Paulo, Brazil
Kamalrulnizam Abu Bakar Universiti Teknologi Malaysia, Malaysia
Kanti Prasad University of Massachusetts Lowell, USA
Kassim S.Mwitondi Sheffield Hallam University, United Kingdom
Keneilwe Zuva University of Botswana, Botswana
Kenneth MAPOKA Iowa state university, USA
Khoa N. Le Griffith School of Engineering, Australia
Kim Le University of Canberra, Australia
Lei Wu University of Houston, USA
Lylia Abrouk University of Burgundy, France
Lynne Grewe California State University East Bay, USA
Malka N. Halgamuge Melbourne School of Engineering ,Australia
Manish Kumar Anand Salesforce (R&D Analytics), USA
Manish Wadhwa Old Dominion University, USA
Turnad Lenggo Ginta Universiti Teknologi Petronas, Malaysia
Virginia Araujo New Atlantica University, Portugal
Viroj Wiwanitkit Surin Rajabhat University, Thailand
Xiaofeng Liao Chongking University, China
Yahya Slimani Faculty of Sciences of Tunis, Tunisia
Yuhanis binti Yusof Universiti Utara Malaysia, Malaysia
Yusmadi Universiti Putra Malaysia, Malaysia
Zaw Zaw Htike International Islamic University, Malaysia
Zhang Xiaojun Dublin City University, Ireland

Technically Sponsored by
Networks & Communications Community (NCC)
Computer Science & Information Technology Community (CSITC)
Digital Signal & Image Processing Community (DSIPC)
Organized By
Academy & Industry Research Collaboration Center (AIRCC)

TABLE OF CONTENTS
The Second International Conference on Computer Science,
Engineering and Information Technology (CSITY 2016)
COQUEL : A Conceptual Query Language Based on the Entity Relationship
Model………………………………………………………………………...…….. 01 - 13
Rafael Bello and Jorge Lloret
Fileshader : Entrusted Data Integration Using Hash Server……………….….. 15 - 25
Juhyeon Oh and Chae Y. Lee
Feature Selection Model Based Content Analysis for Combating
Web Spam…………………………………………………………………...…….. 27 - 34
Shipra Mittal and Akanksha Juneja
The Second International Conference on Signal and Image Processing
(SIGPRO 2016)
Geometric Correction for Braille Document Images…………………......…….. 35 - 46
Padmavathi.S, Aishwarya.A.V and Iswaryah.S
Gaussian Kernel Based Fuzzy C-Means Clustering Algorithm for Image
Segmentation………………………………………………………………...…….. 47 - 56
Rehna Kalam, Ciza Thomas and M Abdul Rahiman
The Second International Conference on Artificial Intelligence & Fuzzy
Logic Systems (AIFZ 2016)
Selection of Best Alternative in Manufacturing and Service Sector Using
Multi Grade Decision Approach - A Review…………………….……......…….. 57 - 74
Karuppanna Prasad N and Sekar K
OCR - The 3 Layered Approach for Classification and Identification of Telugu
Hand Written Mixed Consonants and Conjunct Consonants by Using
Advanced Fuzzy Logic Controller…………………....................................…….. 75 - 88
B.Rama and Santosh Kumar Henge
Mining Fuzzy Association Rules from Web Usage Quantitative Data……….... 89 - 98
Ujwala Manoj Patil and J. B. Patil
Segmentation and Labelling of Human Spine MR Images Using Fuzzy
Clustering………………………………………………………………......…….. 99 - 108
Jiyo.S.Athertya and G.Saravana Kumar

The Second International Conference on Networks & Communications
(NWCOM 2016)
A Cross Layer Based Scalable Channel Slot Re-Utilization Technique for
Wireless Mesh Network…………………….…….....................................…….. 109 - 119
Asha C N and T G Basavaraju
The Second International Conference on Data Mining (DTMN 2016)
Associative Regressive Decision Rule Mining For Predicting Customer
Satisfactory Patterns……………………………...…….…….......................….. 121 - 134
Shubha S and Suresh P
The Seventh International Conference on Applications of Graph Theory
in Wireless Ad hoc Networks and Sensor Networks
(GRAPH-HOC 2016)
A Routing Protocol Orphan-Leach to Join Orphan Nodes in Wireless
Sensor Network…………………….……..................................................…….. 135 - 147
Wassim JERBI, Abderrahmen GUERMAZI and Hafedh TRABELSI

David C. Wyld et al. (Eds) : CSITY, SIGPRO, AIFZ, NWCOM, DTMN, GRAPHHOC - 2016
pp. 01–13, 2016. © CS & IT-CSCP 2016 DOI : 10.5121/csit.2016.60401
COQUEL: A CONCEPTUAL QUERY
LANGUAGE BASED ON THE ENTITY-
RELATIONSHIP MODEL
Rafael Bello and Jorge Lloret
Department of Computer Science, University of Zaragoza, Spain [email protected] and [email protected]
ABSTRACT
As more and more collections of data are available on the Internet, end users but not experts in
Computer Science demand easy solutions for retrieving data from these collections. A good
solution for these users is the conceptual query languages, which facilitate the composition of
queries by means of a graphical interface. In this paper, we present (1) CoQueL, a conceptual
query language specified on E/R models and (2) a translation architecture for translating
CoQueL queries into languages such as XQuery or SQL..
KEYWORDS
Conceptual Query Language, SQL, final user
1. INTRODUCTION
As brilliantly explained in [1], database systems are difficult to use due to a set of five pain points
including (1) the cognitive load of learning the concepts of a query language and (2) the need to
deal with implementation issues of the underlying database.
Moreover, with the spread of the web, more and more collections of data are becoming available
to everyone in fields from biology to economy or geography. End users, but not experts in
Computer Science, demand easy ways to retrieve data from these collections.
In an effort to simplify the query of databases, in this paper we propose to add a conceptual layer
on which the user can specify the queries. For this layer, we have chosen the Entity/Relationship
model (E/R model for short) because it is widely recognized as a tool which facilitates
communications with end users and we would strongly argue that it also facilitates query writing.
To put this into practice, we propose a new architecture which integrates: (1) the CoQueL
language, which allows us to specify conceptual queries on an E/R model (2) a graphical interface
built on the CoQueL language and (3) a translation from the graphical query to a target language
such as XQuery or SQL.
The advance of this paper with respect to other works is twofold. First, it is thought to query data
in several formats as relational or XML from a conceptual level. Second, we have gathered the
best recommendations about visual queries and we have integrated them into our interface.

2 Computer Science & Information Technology (CS & IT)
There have been several papers in the literature about query languages for end users. Some of the
papers such as QBE [2] or spreadsheet algebra [3] lack a conceptual level unlike our paper which
includes it because it facilitates the specification of queries. Other papers such as SQBE [4] or the
query system for NeuronBank [5] are intended for a particular format of data unlike our paper
which is intended for formats such as relational or XML. The paper QueryViz [6] does the
reverse work because it generates conceptual queries from SQL queries. The paper CQL [7] also
includes a conceptual level and we have borrowed from it concepts such as query abbreviation.
However, its interfaces are a bit cluttered, so we offer a more simplified interface.
The rest of the paper is organized as follows. In Section 2, we explain the E/R metamodel and the
relational metamodel as well as a running example. In Section 3, we introduce the CoQueL query
language. Section 4 describes the query architecture and Section 5 its implementation. In Section
6, the graphical interface is presented. Moreover, in Section 7 we detail the related work and in
Section 8 we show the conclusions and future work.
2. METAMODELS
CoQueL queries are specified in a context consisting of an E/R model, the corresponding
relational model and a physical model populated with data in a particular RDBMS against which
the queries are executed. So, let us explain the metamodels for building E/R models and relational
models.
2.1 Entity/Relationship Metamodel
For building E/R models, we will use a conceptual metamodel based on the model proposed by
Chen in [8].
According with the metamodel, an E/R model includes entity types, which are described by
means of attributes. An attribute only describes one entity type and an entity type is described by
one or more attributes.We can establish one or more relationship types between two entity types.
Each entity type participates in a relationship type in the first position or in the second position.
Each entity type participates in a relationship type with a cardinality, which denotes the number
of instances of the other participant with which an instance of the initial participant can be related.
The possible cardinality values are 0-1, 0-N, 1-1, 1-N where the first(second) value indicates the
minimum(maximum) cardinality.
There are some integrity constraints associated to the metamodel: (ic1) two distinct entity types
must have different names, (ic2) two distinct relationship types must have different links and (ic2)
the names of the entity types and the links of the relationship types must be different.
In this paper, we will use as an example the E/R model of Figure 1, about the employees of an
entreprise.

Computer Science & Information Technology (CS & IT) 3
livesIn1
livesIn2
worksFor situatedIn
employee
idEmployee
name
country
idCountry
name
city
idCity
name
department
idDepartment
name
0-1
0-1
0-N
0-N
1-N
0-1
1-N 1-N
Figure 1. First example of an E/R model
2.2 Relational Metamodel
For building relational models, we will use the relational metamodel proposed by Codd in [9].
A relational model includes tables, which are described by means of columns. A column
describes only one table and a table is described by means of two or more columns. Each table
has a name. Each column has a name and a datatype. Each table has a primary key, which is
formed by exactly one column. There are some integrity constraints associated to the metamodel:
(ic4) two distinct tables must have different names, (ic5) two distinct columns of the same table
must have different names. For translating an E/R model to a relational model there are, basically,
two options [10]. The first one consists of translating every relationship type into a table. The
second one translates the relationship types depending on the cardinality of the participants.
When the relationship type is 0-N or 1-N for both participants, it is translated into a table;
otherwise, it is translated into a foreign key. In this paper, we will follow the latter option. So, for
the E/R model of Figure 1 the corresponding relational model is:
employee(idEmployee, name, idCountry, idCity, idDepartment)
country(idCountry, name)
city(idCity, name)
department(idDepartment, name)
situatedIn(idDepartment, idCity)
3. COQUEL LANGUAGE
The CoQueL language allows us to specify three kinds of conceptual queries on E/R models:
linear, star and mixed. The linear queries are those which linearly traverse the E/R model. The
star queries includes a root entity type and several relationship types whose common participant
is the root entity type. The mixed queries are combinations of linear queries and star queries. For
formalizing these intuitive ideas, we first define our notion of path, next the notion of CoQueL
query and finally we show some examples of CoQueL queries.
3.1 Path
For formalizing the notion of CoQueL query, we previously introduce several notions of paths
defined on E/R models. We present some examples of paths on the E/R model of Figure 2, where
for simplicity we have omitted the attributes.

4 Computer Science & Information Technology (CS & IT)
e1 v1 e2 v2 e3
v7 e7 v6 e4 v4 e5v3
e6v5
Figure 2. Second example of an E/R model
Definition 1 A lpath is an expression of the form
e1v1e2v2 . . . envn
where
n >= 1
ei i=1. . . n is an entity type
vi is the link of a relationship type between ei and ei+1
en is an entity type or an spath. If n=1, then e1 is an entity type
When en is an entity type, the lpath is called basic lpath.
Definition 2 A spath is an expression of the form
e(&(v1f1)&(v2f2) . . . &(vmfm))
where
m >= 2
vi is the link of a relationship type between e and fi i=1. . . m
fi is a lpath or a spath
When every fi is an entity type, the spath is called basic spath. An arm of
the path is a linear path of the form evifi
Definition 3 A qpath is an lpath or an spath
Next we show examples of paths on the E/R model of Figure 2.
Three examples of basic lpath are: e1 e1v1e2 e1v1e2v2e3
An example of basic spath is e2(&(v2e3)&(v3e4))
Two examples of qpaths are e2(&(v2e3)&(v3e4(&(v4e5)&(v5e6))))
e1v1e2(&(v2e3)&(v3e4(&(v4e5)&(v5e6))))
3.2 CoQueL Query
A CoQueL query is a qpath with extra information for the entity types of the qpath. A complete
specification of an entity type of a qpath consists of four clauses as follows: entityTypeName(attributes; attributesCondition; attributesGroup;
groupCondition)
where attributes are the attributes which take part of the result of the query, attributesCondition is
a conditional expression on the attributes of the entity type, attributesGroup are the attributes
through which the instances of the entity type are grouped and groupCondition is a conditional
expression on the groups indicated by means of attributesGroup.

Computer Science & Information Technology (CS & IT) 5
Let us explain briefly each component.
Attributes The clause attributes indicates the selected attributes of the entity type to be displayed
in the result. If we want to select all the attributes of the entity type, we can write only an asterisk
instead of the name of all the attributes. It there is no condition on the attributes of the entity type
and we do not want to select any of these attributes, we write the name of the entity type without
parentheses. Let us see some examples. e1 means that we need the entity type e1 for the query but
we do not select any attribute of this entity type and we do not impose any condition on these
attributes. e1(∗) means that all the attributes of e1 are selected but we do not impose any
condition on them. e1(a11) means that the attribute a11 is selected but we do not impose any
condition on the attributes of e1. In this clause, we can also include aggregation functions on the
attributes.
Conditions The conditions on attributes and on groups can be simple or compound. A simple
condition is a comparison condition or a condition with the LIKE predicate. A compound
condition is the union by means of AND, OR or NOT of conditions.
A comparison condition has the form expr1 op expr2 where expr1, expr2 are scalar expressions
and op is a comparison operator. The comparison operators are the usual ones: = < > <> <= >=.
For example, e1(∗; a11 = 1) means that all the attributes of e1 are selected but only for those
instances of e1 for which the value of attribute a11 is 1. e1(a12; a11 = 1) means that attribute a12
of e1 is selected but only for those instances of e1 for which the value of attribute a11 is 1.
A LIKE condition has the form expr1 LIKE pattern where expr1 is a string expression and pattern
is a representation of a set of strings.
Scalar expression The scalar expressions can be numeric expressions or string expressions.
A numeric expression is an arithmetic expression which includes as primaries one or more of the
following: attribute names, possibly qualified, or numeric literals or aggregate functions or
numeric expressions enclosed between parentheses. The aggregate functions, used for elaborating
statistics, are COUNT, SUM, MIN, MAX and AVG.
If the numeric expression is used in an attributesCondition, then the primaries are attribute names,
possibly qualified, or numeric literals or numeric expressions enclosed between parentheses. If
the numeric expression is used in a groupCondition, then the primaries are numeric literals or
aggregate functions or numeric expressions enclosed between parentheses.
A string expression is an expression which includes as primaries one or more of the following:
attribute names, possibly qualified or string literals or the concatenation of several of them.
The complete syntax of a CoQueL query can be seen in Appendix A. To date, the CoQueL
queries are equivalent to SQL single-block query expressions as defined in [3].
3.3.Examples
Let us see some examples of queries on the E/R model of employees shown in Figure 1.
Query 1 (linear). Find the employees who work in the purchasing department in Zaragoza
employee(*) worksFor department(;name=‘Purchasing’)
situatedIn city(;name=‘Zaragoza’)
Query 2 (mixed). For each department, find its name, the name of its employees, the name of the
city and the country where the employees live.
department(name) worksFor employee(name)

6 Computer Science & Information Technology (CS & IT)
(& (livesIn1 country(name)) & (livesIn2 city(name)))
Query 3 (with group conditions). Find the name and identifier of the countries where more than
five employees live.
employee(-;-;-;COUNT(idEmployee)>5) livesIn1
country(idCountry, name;-;idCountry,name;-)
4. ARCHITECTURE FOR TRANSLATING GRAPHIC QUERIES INTO
TARGET QUERIES
One of the main purposes of this work is to facilitate querying databases for non-expert users. To
this end, we have defined a generic architecture which translates graphical queries into queries in
a target language(such as XQuery or SQL) by using the CoQueL language in an intermediate
step. Also, the CoQueL queries can be stored to be retrieved later or to be exchanged between
different systems.
The architecture (see Figure 3) has two components: the models component and the query
component. The models component consists of three models: the E/R model, the logical model
and the correspondence model. The latter stores the correspondence between the E/R elements
and target query language expressions. It is generated by the model translator when the E/R
model is translated into the logical model and by taking into account the translation rules applied
to the E/R model.
The query component includes three modules: the text query generator, the query validator and
the target query generator. It works as follows: the final user graphically builds a query, based on
the E/R model, and sends it to the text query generator, which transforms it into a CoQueL query.
This query is validated syntactically by the query validator module. If the query is wrong, a
message is sent to the user informing about this fact. If the query is right, it is the input for the
target query generator module. This module uses the correspondence between E/R elements and
target expressions of the model component and produces the target query as output.
ER
model
Correspondence between
E/R elements and
target expressions
CoQueL
query
based on
Input
Output
Output
query
validator
Inputtarget query
generator
Outputtarget
querytext query
generator
Inputgraphical
query
CoQueL
query
CoQueL
query
Output
uses
uses
model
translator
Input Output
draws
models
component
query
component
logical
model
Fig. 3.Architecture for conceptual queries
5. AN IMPLEMENTATION OF THE ARCHITECTURE
Next, we specifiy how the models and algorithms of the architecture are implemented for SQL as
target language.
5.1. Models Component Implementation
The E/R model is implemented as a relational database whose tables are entityType,
relationshipType and attribute.

Computer Science & Information Technology (CS & IT) 7
The correspondence between E/R elements and SQL expressions is implemented as a table called
er2SQL. By SQL expressions, we refer to the following expressions which form part of a SQL
query: table names, fully qualified column names and join conditions. The rules for generating
the rows of the table er2SQL are as follows:
– For each entity type, the column table stores the name of the table into which the entity type is
translated. The column expression is always null (see an example in row 1 of Table 1).
– For each relationship type, the column table stores the name of the table into which the entity
type is translated or null if there is no such table. For example, if according to the translation
rules, only the 0-N or 1-N relationship types are translated into a table, then the rest of the
relationship types will have null value in the column. Moreover, the column expression stores
row conceptual
element
table expression
1 employee employee null
2 livesIn1 null employee.idCountry=country.idCountry
3 situatedIn situatedIn situatedIn.idDepartment=department.idDepartme
nt AND situatedIn.idCity=city.idCity
4 idEmployee null employee.idEmployee
Table 1. Some rows of table er2SQL
5.2 Query Component Implementation
The text query generator, the query validator and the target query generator are implemented as
the algorithms graphic2CoQueL, isValid, splitCoQueLQuery and writeTargetQuey. All of them
are specified next.
Algorithm graphic2targetQueryLanguage(p language)
Input: Graphical specification of the query
Output: Query specified in the target query language
Pseudocode
repeat
coquelQuery← graphic2CoQueL()
until isvalid(coquelQuery)
(l entityTypes, l relationshipTypes, ll attributes ,l conditions,
ll groupAttributes, ll groupConditions) ← splitCoQuelQuery(coquelQuery)
writeTargetQuery (l entityTypes, l relationshipTypes, ll attributes,
l conditions, ll groupAttributes, ll groupConditions, p language)
Algorithm splitCoQueLQuery(q)
Input: CoQueL query
Output: Lists of entity types, relationship types, attributes, groups and conditions

8 Computer Science & Information Technology (CS & IT)
involved in the query
Pseudocode
l entityTypes←getEntityTypes(q)
ll attributes←getAttributes(q,l entityTypes)
l relTypes← getRelTypes(q)
l conditions← getConditions(q)
ll groupAttributes← getGroupAttributes(q)
l groupConditions← getGroupConditions(q)
Algorithm writeTargetQuery (pl entityTypes, pl relationshipTypes, pll atttributes,
pl conditions, pll groupAttributes, pl groupConditions, p language)
INPUT: Lists of entity types, relationship types, attributes, groups and conditions
involved in the query
OUTPUT: target query
Pseudocode
IF p language=‘SQL’ THEN
SELECTclause←buildClause(‘SELECT’, pl entityTypes, pll atttributes)
FROMclause←buildClause(‘FROM’, pl entityTypes, pl relTypes)
WHEREclause←buildClause(‘WHERE’,pl entityTypes, pl relTypes,
pl conditions)
GROUPBYclause←buildClause(‘GROUP BY’,pl entityTypes,
pll groupAttributes)
HAVINGclause←buildClause(‘HAVING’,pl entityTypes, pl groupConditions)
SQLquery←buildSQL(SELECTclause, FROMclause, WHEREclause,
GROUPBYclause, HAVINGclause)
return SQLquery
END IF
The way of working is as follows: once the user has specified the graphical query, the
graphic2CoQueL algorithm translates the graphical query into Co- QueL and it is validated until a
correct CoQueL query is obtained. Then, the splitCoQueLQuery extracts the entity types,
relationship types and attributes from the CoQueL queries into variables. Finally, the
writeTargetQuery algorithm uses these variables to generate the SQL query.
Next we offer relevant features of these algorithms. First of all, we have separated the graphical
part from the query generation part. As a consequence, we can improve the query interface and
only the algorithm graphic2CoQueL will have to be modified. The algorithms splitCoQueLQuery
and writeTargetQuery will remain invariable.
The algorithm splitCoQueLQuery extracts the entity types, relationship types and attributes
involved in the query. In this extraction, the path structure is forgotten, as the translation can be
done for the conceptual elements one by one taking into account the er2SQL table.

Computer Science & Information Technology (CS & IT) 9
In some algorithms, there are variables prefixed by l or ll . The prefix l means a list while the
prefix ll means a list of lists. For example, l entityTypes is a list of entity types while ll attributes
is a list of lists of attributes, one list for each entity type. We add the letter p when dealing with a
parameter. Thus, pll means a parameter which is a list of lists.
In the algorithm writeTargetQuery for the language SQL, the clause FROM is obtained from the
list of entity types and of the list of relationship types. It is a comma separated list whose items
are the tables, encountered in the column table of table er2SQL, corresponding to the entity types
and relationship types of the query. If this column is null, nothing is added to the comma
separated list. The clause WHERE is obtained by concatenating by AND two kinds of conditions:
(1) conditions specified on the entity types and (2) conditions arising from the relationship types.
With respect to the first kind, they are obtained by replacing, in the list of conditions, each
attribute by its corresponding column as stored in table er2SQL. With respect to the second
condition, they are retrieved from the column expression of table er2SQL. If this column is null,
nothing is added to the ANDed conditions.
5.3 Examples
Let us suppose the user has specified queries 2 and 3 as in Figures 4 and 5 respectively. Then, the
result of applying the algorithm graphic2targetQueryLanguage are the SQL queries shown next.
Query 1. Find the employees who work in the purchasing department in Zaragoza
SELECT *
FROM employee, department, situatedIn, city
WHERE employee.idDepartment=department.idDepartment AND
department.idDepartment=situatedIn.idDepartment AND
situatedIn.idCity=city.idCity AND city.name=‘Zaragoza’ AND department.name=‘purchasing’
Query 2. For each department, find its name, the name of its employees, the name of the city and
the country where the employees live
Fig. 4.Query 2, about departments, in the CoQueL interface
SELECT department.name, employee.name, country.name, city.name
FROM department, employee, country, city
WHERE country.idCountry=employee.idCountry AND
employee.idDepartment=department.idDepartment AND
country.idCountry=employee.idCountry AND

10 Computer Science & Information Technology (CS & IT)
city.idCity=employee.idCity
Query 3. Find the name and identifier of the countries where more than five employees live
Fig. 5.Query 3, about countries, in the CoQueL interface
SELECT country.idCountry, country.name
FROM country, employee
WHERE country.idCountry=employee.idCountry
GROUP BY country.idCountry
HAVING COUNT(employee.idEmployee)>5
6. GRAPHICAL INTERFACE
For designing the interface, we have gathered recommendations available in the literature such as
the principles of data manipulation [3] or the idea of query abbreviation [7] and we have
integrated them into our interface.
The idea of query abbreviation consists of using built-in metaknowledge to determine the paths
between the entity types involved in the query so that users do not need to know the conceptual
schema. With respect to data manipulation, we have incorporated the principle of offering the
user physical actions or labeled button presses instead of complex syntax. With this purpose, we
have chosen a form-based interface where the user makes physical actions for specifying the
origin and destination of the paths and presses buttons for actions like finding the complete paths
involved in the query. The initial aspect of the interface can be seen in Figure 6.
Fig. 6. Initial aspect of the CoQueL interface
At the beginning, the user has to specify the first path of the query. For doing this, (s)he has two
options: (1) to choose only the origin entity type or (2) to choose both the origin entity type and
the destination entity type. For option (1), when the user clics the ‘Find path’ button, the maximal
basic spath whose origin is the selected entity type appears. There, the user selects the appropriate
arms of the spath for the query. For option (2), when the user clics the ‘Find path’ button, the
collection of lpaths between the entity types origin and destination appears and the user picks one
of them for the query. Regardless of the chosen option, at this moment each line of the interface
corresponds to a basic lpath.

Computer Science & Information Technology (CS & IT) 11
To complete the rest of the paths involved in the query, the following typical actions are available
under the ‘Add/Delete path’ button for each path: Add path. Add a new path just below the path
where the ‘Add/Delete path’ button is. Its aspect is the same as the first path of the query (Figure
4) and the interaction is as previously described for this first path. Delete path. Delete the path
situated next to the ‘Add/Delete path’ button.
Once every path needed for the query has been chosen, the user must complete the query in the
entity types of the paths. To do so, the user double-clicks on the name of the entity types and, in
the frame which appears, (s)he adds the attributes, the conditions about attributes, the groups and
the conditions about groups. For example, for the query examples number 2 and 3, the
specification on entity type country can be seen in Figure 5 and Figure 6.
We are currently implementing a prototype of our CoQueL query system in a laptop with
Windows 7, using the Visual C# programming language.
7. RELATED WORK
Query languages for end users have been widely discussed in papers. The first work on this
subject was QBE [2]. The paper [3] presents a spreadsheet algebra, adapted from relational
algebra, and a spreadsheet interface. The expressive power of expressions in the spreadsheet
algebra is the same as that of core SQL single-blocks query expressions. Unlike our paper, both
papers lack a conceptual level, which facilitates query writing.
The paper ConQuer [11] inspired our work but unlike ConQuer, we have chosen the E/R model
because it is widely extended. ConQuer is a conceptual query language built on ORM models. It
enables end users to formulate queries without needing to know how the information is stored in
the underlying database. ConQuer queries may be represented as outline queries, schema trees or
text.
The papers SQBE [4] and NeuronBank [5] concentrate on a particular data format, unlike our
work, which is intended for formats like relational or XML. SQBE [4] is a visual query interface
intended for the semantic web, where the data model is RDF and the query languagge is
SPARQL. Those users with partial or no knowledge of RDF specify queries visually as a query
graph. Then, the algorithm TRANSLATE translates the query graph into a SPARQL query. In
NeuronBank [5] a visual web query system is presented aimed at meeting the challenges of
extracting information of complex and quickly evolving life science in data. It offers a form-
based interface with which queries on an ontology about neurons of different species are specified
in the web client.
The paper [7] proposes a conceptual query language, called CQL, built on E/R models where
query formulation does not require the user to specify query paths. From the specification, the
system derives the corresponding semantically correct full query. Once specified, conceptual
queries are translated into SQL. A user-centered approach was adopted in the development of
CQL, specifically it was guided through trials and feedback from end-users. Its interface is a bit
cluttered, so we have tried to improve it.
The paper [6] deals with query visualization, that is, the process of visualizing queries starting
from their SQL expression. Queries are visualized by means of familiar UML notations and
incorporate visual metaphors from diagrammatic reasoning. This notation could also be used for
specifying conceptual queries. It has been implemented in the QueryViz tool, which is available
on the web.

12 Computer Science & Information Technology (CS & IT)
8. CONCLUSIONS AND FUTURE WORK As more and more collections of data are available on the Internet, end users but not experts in
Computer Science demand easy solutions for retrieving data from these collections. In this paper,
we have presented a new architecture for querying databases which integrates (1) the CoQueL
language, which allows us to specify conceptual queries on an E/R model (2) a graphical interface
built on the CoQueL language and (3) a translation from the graphical query to a target language
such as XQuery or SQL.
As future work, we plan to extend the expressive power of the CoQueL queries. To date, they are
equivalent to SQL single-block query expressions as defined in [3] and we intend CoQueL
queries to have the same expressive power as SQL. Second, according to [12], the conceptual
query languages have not become widely accepted and one of the reasons is that they lack formal
semantics. So, another future work is to provide a formal semantics for the CoQueL language.
REFERENCES [1] H. V. Jagadish, Adriane Chapman, Aaron Elkiss, Magesh Jayapandian, Yunyao Li, Arnab Nandi, and
Cong Yu. Making database systems usable. In SIGMOD Conference, pages 13–24, 2007.
[2] Mosh´e M. Zloof. Query by example. In AFIPS National Computer Conference, volume 44 of AFIPS
Conference Proceedings, pages 431–438. AFIPS Press, 1975.
[3] Bin Liu and H. V. Jagadish. A spreadsheet algebra for a direct data manipulation query interface. In
Yannis E. Ioannidis, Dik Lun Lee, and Raymond T. Ng, editors, ICDE, pages 417–428. IEEE, 2009.
[4] Inchul Song and Myoung Ho Kim. Semantic query-by-example for rdf data. In Proc. of Emerging
Database Technology, 2009.
[5] Weiling Lee, Rajshekhar Sunderraman, and Paul Katz. A visual web query system for neuronbank
ontology. In VISSW 2011, IUI ’11, pages –, New York, NY, USA, 2011. ACM.
[6] Wolfgang Gatterbauer. Databases will visualize queries too. PVLDB, 4(12):1498– 1501, 2011.
[7] Vesper Owei. Development of a conceptual query language: Adopting the usercentered methodology.
Comput. J., 46(6):602–624, 2003.
[8] Peter P. Chen. The entity-relationship model - toward a unified view of data. ACM Trans. Database
Syst., 1(1):9–36, 1976.
[9] E. F. Codd. A relational model of data for large shared data banks. Commun. ACM, 13(6):377–387,
1970.
[10] Ramez Elmasri and Shamkant Navathe. Fundamentals of Database Systems. Addison-Wesley
Publishing Company, USA, 6th edition, 2010.
[11] Anthony C. Bloesch and Terry A. Halpin. Conquer: A conceptual query language. In Bernhard
Thalheim, editor, ER, volume 1157 of Lecture Notes in Computer Science, pages 121–133. Springer,
1996.
[12] Michael Lawley and Rodney W. Topor. A query language for eer schemas. In Australasian Database
Conference, pages 292–304, 1994.
APPENDIX. COMPLETE SYNTAX OF A COQUEL QUERY
entityType = entityTypeName(attributes; conditional-expression; attributes; conditional-expression)

Computer Science & Information Technology (CS & IT) 13
attributes = * | attribute-expression
attributeexpression = attribute-list | attribute-name
attribute-list = attribute-list, attribute-name
lpath = [entityType link]* {entityType|spath}
spath = entityType ( [&(link{lpath|spath})]+)
CoQueLquery = lpath | spath
conditionalexpression = conditional-term | conditional-expression OR conditional-term
conditional-term = conditional-factor | conditional-term AND conditional-factor
conditional-factor = simple-condition | conditional-expression
simple-condition = comparison-condition | like-condition
like-condition = string-expression LIKE pattern
comparisoncondition = scalar-expression comparison-operator scalar-expression
comparisonoperator = < > <= >= <> =
scalar-expression = numeric-expression | string-expression
numeric-expression = numeric-term | numeric-expression {+|-}numeric-term
numeric-term = numeric-factor|numeric-term{*| /} numeric-factor
numeric-factor = [+|-]primary-number
primary-number = attribute name possibly qualified or numeric literal or aggregate function or numeric
expression between parenthesis
string-expression = concatenation | primary-string
concatenation = string-expression || primary-string
primary-string = attribute name possibly qualified or string literal or string expression between parenthesis
entityTypeName = name of some of the entity types of the E/R model
link = link of some of the relationship types of the E/R model
The entry point is CoQueLquery. The symbols [ ] { } |are part of the metasyntax and are never
written. [. . . ] means one ocurrence at most of the content of the brackets. [. . .]∗ means zero or
more ocurrences of the content of the brackets. [. . .]+ means two or more ocurrences of the
content of the brackets. {a|b} means exactly one ocurrence of the elements separated by the
vertical bars. The symbols ; & ( ) stand for themselves. The same applies to the operators AND
OR ||LIKE =<><=>=<> + − ∗/.

14 Computer Science & Information Technology (CS & IT)
INTENTIONAL BLANK

David C. Wyld et al. (Eds) : CSITY, SIGPRO, AIFZ, NWCOM, DTMN, GRAPHHOC - 2016
pp. 15–25, 2016. © CS & IT-CSCP 2016 DOI : 10.5121/csit.2016.60402
FILESHADER: ENTRUSTED DATA
INTEGRATION USING HASH SERVER
Juhyeon Oh and Chae Y. Lee
Department of Industrial & Systems Engineering, KAIST [email protected]
ABSTRACT
The importance of security is increasing in a current network system. We have found a big
security weakness at the file integration when the people download or upload a file and propose
a novel solution how to ensure the security of a file. In particular, hash value can be applied to
ensure a file due to a speed and architecture of file transfer. Hash server stores all the hash
values which are updated by file provider and client can use these values to entrust file when it
downloads. FileShader detects to file changes correctly, and we observed that it did not show
big performance degradation. We expect FileShader can be applied current network systems
practically, and it can increase a security level of all internet users.
KEYWORDS
SHA-1, File Integration, Web Cloud, File Transfer
1. INTRODUCTION
In the network system, file download and upload procedures are done by packet transfer. Usually
file size is much bigger than normal packet size, and it causes packet fragmentation. When the
file is delivered to other machines such as a server, a lot of fragmented packets will be
transferred. However, some fragmented packet can be changed by eavesdrop and it could have a
malicious attack pattern. In addition, entire file can be changed to malicious attack file during an
uploading process. By this weakness of file transfer procedure, we need to detect file changes due
to a possibility of file changes.
Hash server can be worked to solve this problem. Hashing has two advantages, speed and simple.
Using hash value, we implemented FileShader which detects file changes before and after file
transfer. It gets the correct hash value from the hash server who provided by original file
provider, and compare with calculated hash value of downloaded or uploaded file.
While it checking file changes, a small overhead is possible. We evaluated this overhead and
showed FileShader is practical and possible to be adopted to a current network system, so that
user can prevent malicious attack pattern caused by file changes in the middle step of overall file
transfer.
2. RELATED WORK
We proposed FileShader which is a hash-based solution for file security and network forensics
issues. Below are previous related works.

16 Computer Science & Information Technology (CS & IT)
2.1 Secured File System
The Secure File System (SFS) [1,2] provides strong authentication and a secure channel for
communications. It includes an extensive authentication mechanism for individual users, and
provides strong security for data in transit between clients and servers. It also allows servers to
authenticate their users and clients to authenticate servers.
However, it still relies upon trusted file servers that data is stored by them. If a “trusted” server is
physically compromised by the attacker, the data on it may be changeable to the attacker. In an
environment where data storage is outsourced to companies, this security risk is unacceptable.
2.2 Network Forensics
Network forensics is the act of capturing, recording, and analyzing network audit trails in order to
discover the source of security breaches or other information assurance problems. The term
network forensics was introduced by the computer security expert Marcus Ranum in the early
90’s [3], and is borrowed from the legal and criminology fields where “forensics” pertains to the
investigation of crimes. According to Simson Garfinkel, network forensic systems can be
implemented in two ways: “catch it as you can” and “stop look and listen” systems [4].
The main focus in this paper is to automate the process of detecting all the attacks and to prevent
the damaged caused by further security issues. Our idea is to identify all possible security
violations and prevention mechanisms to prevent further problems.
2.3 Hash Function
According to S. Bakhtiari[5], a one-way hash function, also known as a message digest,
fingerprint or compression function, is a mathematical function which takes a variable-length
input string and converts it into a fixed-length binary sequence. Furthermore, a one-way hash
function is designed in such a way that it is hard to reverse the process, that is, to find a string that
hashes to a given value (hence the name one-way.) A good hash function also makes it hard to
find two strings that would produce the same hash value.
MD4 & MD5: Both MD4 and MD5 were invented by Ron Rivest. [6] MD stands for Message
Digest. Both algorithms produce 128-bit hash values. MD5 is an improved version of MD4.
SHA: SHA[7] stands for Secure Hash Algorithm. It was designed by NIST and NSA. SHA
produces 160-bit hash values, longer than MD4 and MD5. SHA is generally considered more
secure that other algorithms and is the recommended hash algorithm.
3. DATA INTEGRATION
Data center is entrusted to people who have no role in creating and changing the data. Users trust
these servers without any doubt. Security decisions are driven by preventing link level attack
rather than internal data center security. However, most of recent security incidents are shown up
by internal members. In particular, the data centers are operated by hired people who are
physically insecure. They are able to change a data which is stored in a server. Thus, we can say
data centers cannot be trusted anymore.
This paper proposes that how to transfer a file to user safely in unsecured and outsourced data
center companies which is managed by people who have no permission to write data.

Computer Science & Information Technology (CS & IT) 17
3.1 Security
The security is becoming a crucial part of the network. In the common sense, security has no deal
with current network innovation. However, if the security is not managed, unimaginable disaster
could be come up and it can cause huge damages to the network system.
Up to this point, most of the companies are increasing their investment to the security and trying
to build security system by themselves, such as IDS (Intrusion Detection System) or firewalls.
However, security is not an issue of companies anymore. All the network users are facing on the
security issue. We suggest FileShader which can increase a security level of the entire internet
user by using trusted hash server.
3.2 Data Integration
From the user’s point of view, data integration checking by users themselves could have big
overheads to their system itself. However, data integration should prevent various attacks and
eliminate a potential security risk. Furthermore, the data integration process can be done without
changing exist network device in the world.
By adding new secured hash server, data integration checking will be done automatically when
the data transfer is finished. After that, the host can use the file from the unsecured server safely.
If there are some suspicious bits or parts of the file, data integration process will let users know
and let them to decide whether they discard file or not.
3.3 Case Study
The digital information such as image, video and data concerned with security issues require
detection method for tampering data. Image can be modified easily for inappropriate propose.
However, Image is very hard to authenticate its changes. Figure 1 shows how easy it is to modify
and use. In forensic and criminal investigation, Digital data would be the most important evidence
to determine the crime. In Figure 2, three suspects had disappeared in modified video without any
unusual. Therefore, a valuable data such as contract, agreement and CCTV should be protected
and verified by a trusted method.
Figure 1: Huh Kyung-young modifies his picture to increase his fame.
Figure 2: There are three men in first picture but no one in second picture

18 Computer Science & Information Technology (CS & IT)
Some hackers insert malicious code into a normal program to make zombie computer. It can be
used to perform malicious tasks of one sort or another under remote direction and launch
Distributed Denial of Service (DDoS) attacks against targeted systems. Malicious software will
typically install modules to zombie computer. Figure 3 shows that anti-virus programs warn you
about malicious software. However, anti-virus programs can’t find all malicious software because
malicious software may delete itself, or may remain present to update and maintain the modules.
Figure 3: Trojan is flagged as malicious software and removed by anti-virus program.
4. PROBLEM DESCRIPTION
4.1 Hijacking Data
While the file transfer is processing, some malicious hackers can get the packet information doing
Eves-Drop, and send the packet which has malicious code with same flow information, to the
receiver who was getting the file. After the malicious packets are delivered, receiver side will
reconstruct the file with malicious packets. When the receiver runs this reconstructed file, the host
would be injected by virus or bots (Figure 4). Up to this point, we need file a integration process
to ensure the file came from the source.
Figure 4: Receivers will construct the file with malicious packets.

Computer Science & Information Technology (CS & IT) 19
4.2 Problem Definition
The problem of current network is file insurance. When the people download a file, no one knows
this file is exactly same as the file which the file provider uploaded. File can be changed at a lot
of spots and it can contain some malicious attack patterns. Up to this point, we need a file
integration checking tool which can give us the fact that this file is certificated.
4.3 Assumption
Our problem starts with an assumption that transport layer has already supported sufficient
security. Transport Layer Security (TLS) and Secure Sockets Layer (SSL) provide high
communication security over the Internet. There is no longer the data modification in the current
network.
Most of the recent security problems occur from the internal people or infected computer in a data
server. Consequently, we presume the file has been changed in a server if there is the attacker
who accesses to the data server. Furthermore, we suppose the hash server is trusted by users. The
hash server operates in the high secured and validated authority. Hash server has the unique hash
value updated by data owner.
4.4 Goal
The aim of our approach is to guarantee the file-integrity. We envisage warning clients when data
has been changed and dealing with “forensics” issue. In the current network, it is hard to detect
file changes due to the file integration process. Let’s say, the file is fragmented to some packets,
and one of them are changed by eavesdrop or some other attack. The receiver cannot detect file
changes after it integrated the packets to one file.
Up to this point, we propose the FileShader which can detect file changes not in the packet level
but in the file level using hash values. Another possible issue is a malicious file provider. When
the clients are attacked by malicious data, it is important to figure out who provides the malicious
data on the web server. We expect our system is able to identify the exact malicious file provider.
5. SOLUTION
5.1 Problem Approach
Being able to access your files from anywhere and from any computer is one of the great
conveniences of the always-on Internet. These are so cheap and easy to use that there is almost no
reason not to back some of your files up into the cloud. Most online storage providers also give
you the ability to then share these files with your friends and colleagues. Cloud services have a
good track record of keeping your data while providing you easy access to your files from
wherever you are. However, it's dangerous to put data in the cloud as it becomes controlled by the
provider and the company can’t really know how secure the data and the infrastructure are in
general.
Therefore, Client wants to independently prove the integrity of their data when they use public or
sharing data in a web and cloud services environment. Cloud Services platforms can use data
integrity protection of its storage but don’t provide the guarantee of modification caused by an
inappropriate user. For customers to have confidence in cloud service implementations, File
provider need to build security into the structure of their clouds and not totally rely on cloud

20 Computer Science & Information Technology (CS & IT)
vendors to provide those capabilities. Security in the cloud is ultimately the responsibility of the
file provider use cloud vender. File provider will provide security with their customer. Table 1
shows the comparison of each service.
Table 1. Comparative benefit analysis
5.2 FileShader Design
FileShader operates a data integrity protection service that enables users to protect the integrity
and independently verify of their data, files or any digital content throughout hash algorithms. We
design that FileShader is an Internet-based application that can work from any platform without a
lot of changes. We propose the effective process to provide data insurance you can get from any
server. Figure 5 shows our process of FileShader.
Figure 5: Integrity of a file is checked by comparing two hash values
FileShader Sealing and Validating Process
1. FileShader Sealing Process
A. Data Provider creates a hash of a data or file from
B. FileShader sends Hash to hash value server, via secure Internet
connection such as SSL

Computer Science & Information Technology (CS & IT) 21
C. Hash value server securely and verifiably bind the hash, and data
provider to create the data integrity seal.
D. Hash value server sends the data integrity seal to the data provider
E. FileShader of data provider verifies and archives the data integrity seal.
2. FileShader Validating Process
A. Client create a hash value of a file to compare it to the hash value in Hash
value server
B. Client sends a meta-data to Hash value server.
C. Hash value server receives a meta-data from client and finds the data
integrity seal.
D. Hash value server sends the data integrity seal to the client. And then
client compares it and the data integrity seal from validation process.
6. EVALUATION
6.1 Key Factor
Correctness: verifying file changes and show FileShader can detect file changes with exact hash
values.
Performance: comparing between normal network downloading speed without FileShader and
downloading speed with FileShader. It describes FileShader will not take that much overhead so
that the user will not feel any downloading speed degradation and also FileShader is practical.
6.2 Method
We will evaluate the detection accuracy as well as the system overhead. To evaluate how
accurately the system detects the data changed, the data center generates partially changed data.
This data constructs a data pool with normal data. Then, the data center sends any data between
this pool to the client. We check how many times the client detects the file changed accurately.
This will show security robustness of our proposed approach.
As far as the system overhead is concerned, we will record the time taken when sending data with
and without our proposed file integrity method. Accordingly, the system overhead is evaluated by
the number computed by the time taken using our approach over that using existing approach.
Since we add the process of calculating hash values, the number is over 1. Our objective is to
reduce this number as possible as we can.
When using 128-bit hash values, we expect the system to detect the file changes100% since it is
unlikely the hash collision is occurred. The size of hash values is relevant to the system overhead,
however. To deal with the tradeoff between robustness and overhead, we will experiment by
reducing the size of hash values. We will find the optimal point having small enough size where
the detection rate is over the determined threshold.
6.3 Environment Setup
We prototyped client, web server, and hash value server. Different IP addresses and port numbers
are assigned to web server and hash value server. Client tries connecting with these servers with
two different sockets. Client has two functions: upload/download a file to a web server. Unlike

22 Computer Science & Information Technology (CS & IT)
other client/server systems, client connects with hash value server. When uploading a file to a
web server, client computes the hash value of the file and uploads the value to hash value server.
Similarly, client receives the corresponding hash value from a hash value server as soon as
downloading a file from a web server. Then, it compares the hash value to the newly computed
hash value with the downloaded file. SHA-1 hash algorithm outputs completely different hash
values if contents of file is changed. Consequently, client can easily validate files from a web
server by comparing two hash values.
Our objective of the experiments is to reduce the overhead between the systems with/without the
hash value server. To compute the overhead by calculating, uploading, and downloading the hash
values; we measured the time taken with and without hash value server. Since the network is
dynamic, execution time strongly depends on the network environments. File size may also affect
the overhead. Accordingly, we tested a file for 10 times and calculated the average execution time.
7. RESULT
We implemented FileShader using C# to provide graphical user interface, so that user can easily
use the FileShader and also FileShader can be more practical. We had a test with various file
sizes; 64 byte, 512 byte, 1kB, 1MB, and 2MB.
7.1 Environment Setup
Basic user interface of FileShader is as shown below. When we put the file address at the file path
section, FileShader will be automatically connected to web cloud severs and hash server. From
the web cloud server, FileShader will download the file and calculate the hash value. On the other
hand, from the hash server, FileShaer will send a request message to get the hash value of the file
and wait. After FileShader gets the hash value from the hash server, it will compare both hash
values, so that we can verify the downloaded file.
Figure 6: user interface
The next two pictures describe the correctness of the FileShader. We used file1.txt which has the
data as shown left. The client connects to the hash server and gets the hash values to compare
with file1.txt. The hash values were same, so the FileShader says “client_file1.txt is safe” which
means this file is same as the file which uploaded by original file provider.

Computer Science & Information Technology (CS & IT) 23
Figure 7: correct result of file1.txt
What if the file data is changed? We tried to change file1.txt manually with adding one question
mark, ‘?’, and kept experiment. FileShader calculates the hash value of changed file and
compares with the hash value which comes from the hash server. In this time, two hash values are
different, so it prints out file1.txt is not safe. This means this file is different from the file
provider’s uploaded file even the file name is same.
Figure 8: wrong result of file1.txt
FileShader uses hash value to verify the file. Thus, there is no weakness of file name and file size.
Even the file name and file size is same, FileShader will detect the file changes.
7.2 System Overhead
We have done some experiments for the performance of Shader on a typical network system. We
quantified the overheads of FileShader with various file sizes. The file size was changed from
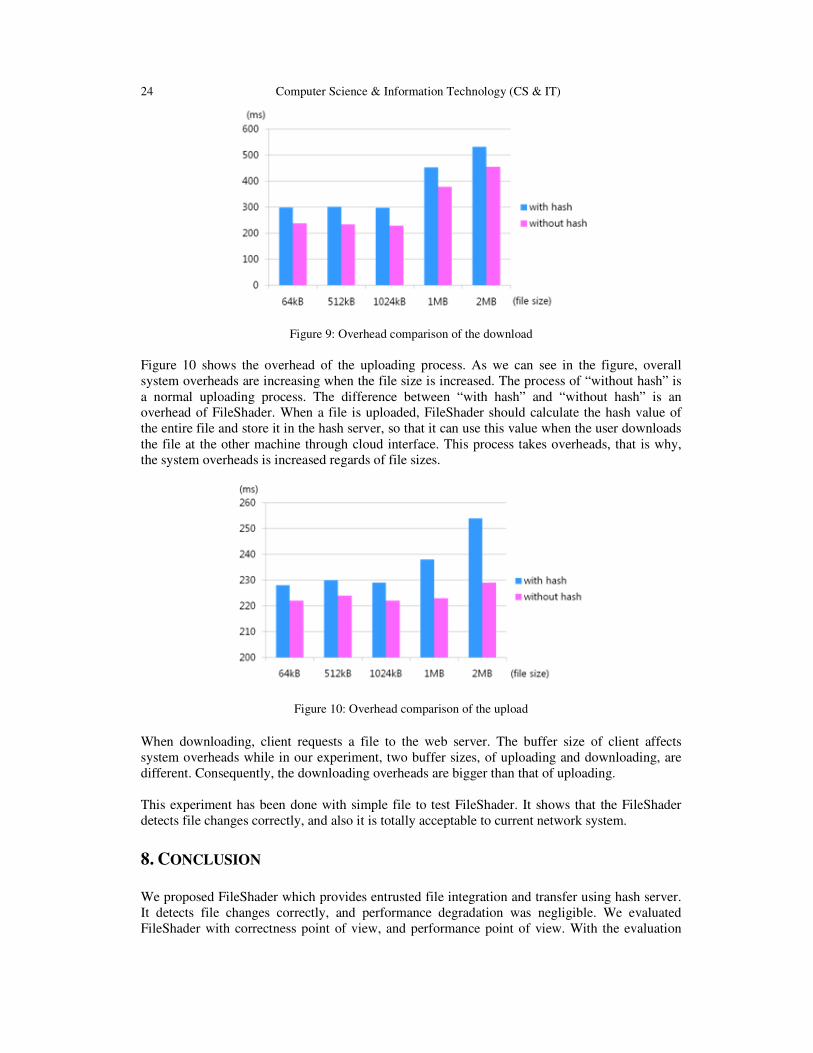
64kB to 2MB. Figure 9 shows the system overhead with different file size in a file downloading
process. The FileShader has a system overhead in a hash calculation and file verifying process.
As we can see that normal download performance and FileShader performance has not big
difference, less than 100ms, regardless of file sizes. This means that hash value calculation
doesn’t overheads a lot, and file verification is also light work due to the comparing hash values
only.
24 Computer Science & Information Technology (CS & IT)
Figure 9: Overhead comparison of the download
Figure 10 shows the overhead of the uploading process. As we can see in the figure, overall
system overheads are increasing when the file size is increased. The process of “without hash” is
a normal uploading process. The difference between “with hash” and “without hash” is an
overhead of FileShader. When a file is uploaded, FileShader should calculate the hash value of
the entire file and store it in the hash server, so that it can use this value when the user downloads
the file at the other machine through cloud interface. This process takes overheads, that is why,
the system overheads is increased regards of file sizes.
Figure 10: Overhead comparison of the upload
When downloading, client requests a file to the web server. The buffer size of client affects
system overheads while in our experiment, two buffer sizes, of uploading and downloading, are
different. Consequently, the downloading overheads are bigger than that of uploading.
This experiment has been done with simple file to test FileShader. It shows that the FileShader
detects file changes correctly, and also it is totally acceptable to current network system.
8. CONCLUSION
We proposed FileShader which provides entrusted file integration and transfer using hash server.
It detects file changes correctly, and performance degradation was negligible. We evaluated
FileShader with correctness point of view, and performance point of view. With the evaluation

Computer Science & Information Technology (CS & IT) 25
result, we showed FileShader is practical and can be applied to current network system. We
expect FileShader can give a higher security level for the file transfer and efficiently prevent
malicious attack from the implied attack pattern in the file which is injected in the file transfer
process.
REFERENCES
[1] K. Fu, M. F. Kaashoek, and D. Mazieres, “Fast and secure distributed read-only file system,” 4th
Sym-posium on Operating Systems Design and Implementation (San Diego, CA), October 2000,
pages 181-196.
[2] D. Mazieres, M. Kaminsky, M. Kaashoek, and E.Witchel, “Separating key management from file
system security,” Proceedings of the 17th ACM Symposium on Operating System Principles
December 1999, pages 124-139.
[3] Marcus Ranum, Network Flight Recorder. http://www.ranum.com/
[4] Simson Garfinkel, Web Security, Privacy & Commerce, 2nd Edition.
[5] S Bakhtiari, "Cryptographic Hash Functions: A Survey", Department of Computer Science,
University of Wollongong, 95-09, July 1995.
[6] Rivest, R., "The MD5 Message-Digest Algorithm", RFC 1321, April 1992.
[7] D. Eastlake 3rd and P. Jones., “US Secure Hash Algorithm 1 (SHA1)”, RFC 3174, September 2001.
AUTHORS Juhyeon Oh received the B.S. degree in Industrial Management Engineering from
Korea University, Seoul, Korea in 2009 and M.S. degree in Industrial & Systems
Engineering from Korea Advanced Institute of Science and Technology (KAIST) in
2011, Daejeon, Korea He is currently a Ph.D ca ndidate at KAIST. The focus of his
current research is network optimization and video streaming over wireless networks.
Chae Y. Lee is a professor of Industrial Engineering at KAIST, Daejon, Korea. He received
the B.S. degree in Industrial Engineering from Seoul National University,Seoul, Korea in
1979, and the M.S. and Ph.D. degrees in Industrial Engineering from Georgia Institute of
Technology, Atlanta in 1981 and 1985, respectively. He is a member of INFORMS and
IEEE Communication Society. His research area includes wireless and mobile communication networks, Internet data communications, heuristic search and optimization.
He has published numerous papers in journals related to wireless communications,
Operations Research and optimizations.

26 Computer Science & Information Technology (CS & IT)
INTENTIONAL BLANK
David C. Wyld et al. (Eds) : CSITY, SIGPRO, AIFZ, NWCOM, DTMN, GRAPHHOC - 2016 pp. 27–34, 2016. © CS & IT-CSCP 2016 DOI : 10.5121/csit.2016.60403
FEATURE SELECTION-MODEL-BASED
CONTENT ANALYSIS FOR COMBATING
WEB SPAM
Shipra Mittal1* and Akanksha Juneja2
Department of Computer Science & Engineering, National Institute of Technology, Delhi, India
*Corresponding Author at - Department of Computer Science & Engineering, National Institute of Technology, Delhi, India
[email protected] ABSTRACT
With the increasing growth of Internet and World Wide Web, information retrieval (IR) has
attracted much attention in recent years. Quick, accurate and quality information mining is the
core concern of successful search companies. Likewise, spammers try to manipulate IR system
to fulfil their stealthy needs. Spamdexing, (also known as web spamming) is one of the
spamming techniques of adversarial IR, allowing users to exploit ranking of specific documents
in search engine result page (SERP). Spammers take advantage of different features of web
indexing system for notorious motives. Suitable machine learning approaches can be useful in
analysis of spam patterns and automated detection of spam. This paper examines content based
features of web documents and discusses the potential of feature selection (FS) in upcoming
studies to combat web spam. The objective of feature selection is to select the salient features to
improve prediction performance and to understand the underlying data generation techniques.
A publically available web data set namely WEBSPAM - UK2007 is used for all evaluations.
KEYWORDS
Web Spamming, Spamdexing, Content Spam, Feature Selection & Adversarial IR
1. INTRODUCTION
As the scope of web grows beyond limits, it is more prone to profanation. From accessing information to interacting and connecting with people, from e-commerce to e-businesses, Internet covers almost each and every aspect of our lives. It helps in bringing new opportunities to people. According to Sam Lucero, analyst at ABI Research in Oyster Bay, "anything intelligent would have an online presence” [1]. But, as it is said, every massive technology has its own benefits and challenges, same is the case with Internet and World Wide Web. Accurate and quality information retrieval is one of those major challenges. As business vendors recognize the value of web for reaching out to millions of customers, they try to gain high visibility for their websites on search engine result page (SERP). This rising need to rank highly in search results in order to recognize among web users, gives birth to the term web spamming (or, spamdexing) [2]. Spamdexing, as the name implies, takes advantage of web indexing system, allowing spammers to deceive search engine (SE) ranking of specific documents.

28 Computer Science & Information Technology (CS & IT)
Ranking system of SEs involves various content-based and graph-based measures. Spammers exploit these parameters to artificially inflate the ranking of web documents. Spam techniques range from stuffing a page with large number of authority references or popular query keywords, thereby causing the page to rank higher for those queries, to setting up a network of pages that mutually reinforce their page value to increase the score of some target pages or the overall group. Recently [3; 4], all major SEs such as Google, Yahoo etc. have identified web spam as a tangible issue in IR process. It not only deteriorates the search quality but also cause wastage of computational and storage resources of a SE provider. A financial loss of $50 billion was caused due to spam in the year 2005 [5]. In the year 2009, it was estimated at $130 billion [6]. Further, it weakens people’s trust and might deprive legitimate websites of user’s visibility and revenue. Therefore, identifying and combating spam becomes a top priority for SE providers. According to web spam taxonomy presented in the work of Spirin and Han [7], web spam is broadly classified into four categories namely content spam [8], link spam [9; 10], cloaking and redirection [11; 12], and click spam [13]. This research work primarily focuses on the detection of content spam which is the most common and frequently occurring spam [14]. IR systems examine the content of pages in the corpus to retrieve the most relevant document with respect to a specific search query. “Term Frequency-Inverse Document Frequency” (TF-IDF) or another similar approach is used to access the “most similar” (relevant) documents to the search query. In TFIDF, “the relevance of the search terms to the documents in corpus is proportional to the number of times the term appeared in the document and inversely proportional to the number of documents containing the term.” Spammers exploit Term Frequency (TF) scoring by overstuffing content fields (title, body, anchor text, URL etc.) of a page with a number of popular search terms so as to boost its relevancy score for any search query. It can be measured as:
where q refers to query, p denotes a web page in the corpus, and t denotes the term. Machine learning is a field of study that deals with automated learning of patterns, within the data belonging to different classes or groups, with an aim to differentiate between the classes or groups. An effective machine learning algorithm is expected to make accurate predictions about categorization of unseen data based on the learnt patterns. Specifically, supervised machine learning involves predicting the class of an unseen (new) data sample based on the decision model learnt using the existing (training) data. Therefore, knowledge of machine learning may be appropriately utilized for web spam detection. Several machine learning methods to combat content spam were introduced in the past researches of adversarial IR and web spam domain. Egele et al. [15] examined the importance of different text and link metrics in web ranking system and utilize C4.5 supervised learning algorithm to remove spam links. They deployed their own mechanism to generate data to carry out the experiment. Ntoulas et al. [16] presented an approach for detecting spam based on content analysis. They extracted several content features and presented a comprehensive study about the influence of these features in web spam domain.

Computer Science & Information Technology (CS & IT) 29
Prieto et.al [17] suggested a number of heuristics to identify all possible kinds of web spam and developed a system called SAAD (Spam Analyzer and Detector) for efficient web spam detection. The beneficial trait is that the system was tested on different data sets and proved to be effective for more accurate classification of spam pages. Araujo and Romo [18] proposed an interesting approach of spam detection by comparing the language models (LM) [19] for anchor text and pages linked from these anchor text. KL-divergence [20] was used to measure the discrepancy between two LMs. However, spammers are continuously adapting themselves to circumvent these barriers. This research work presents a content-based spam detection approach using supervised learning. The aim of this study is to draw a clear understanding of underlying process of web spamming by examining already extracted features. Moreover, the work aims at selecting salient features from the existing ones to stimulate further studies in the domain of “adversarial information retrieval [21]”. A filter based feature selection technique is employed to uncover important patterns in order to classify websites as spam or ham (non-spam). The proposed method is observed to be efficient in terms of both computational complexity and classification accuracy. The rest of the paper organizes as follows. A general methodology of applying feature selection technique for adversarial classification is presented in section 2. Finally, experimental results are shown in section 3 and section 4 concludes the paper.
2. METHODOLOGY 2.1 Experimental Data Set Widely known web spam data set WEBSPAM-UK2007 [22] is used to carry out the experiments. This dataset was released by Yahoo especially for Search Engine Spam project. The data set was also used for “Web Spam Challenge 2008”. It is the biggest known web spam data set having more that 100 M web pages from 114,529 hosts. However, only 6,479 hosts were manually labelled as spam, non-spam and undecided. Among these, approx 6% hosts are spam, i.e., data is imbalanced in nature. The data set consist a separate training and testing data set, but we combined the two sets together to evaluate our model since the percentage of spam hosts were small in both of them. Further, we neglect the hosts labelled as “undecided” and conduct our experiment for a group of 5,797 hosts. The training set was released with pre-extracted content feature set which are examined in this study to select salient and optimal features. Existing content- based heuristics for detecting web spam
The content feature set proposed by Ntoulas et al. [16] comprises of 98 features based on following heuristics:
• Number of words in the page: “Term Stuffing” is a common spamming technique to increase visibility of a web document on typical queries or search terms. Sometimes the proportion of common terms in a page is very high. Therefore, authors suggest counting number of words per page. Very large value of the proposed heuristic indicates the strains of spam in the page.
• Number of words in the title: Many times, a page title is stuffed with unrelated keywords and terms because of its high weightage in search engines text metrics. As a spam detection method, authors propose measure of number of words in the title
• Average word length of the document: In order to combat composite keywords spamming, authors propose to measure the average word length

30 Computer Science & Information Technology (CS & IT)
• Fraction of anchor text in the page: Due to the fact that “anchors” are used to describe the association between two linked pages, spammers misuse them to create false associations
• Ratio of visible text: The authors propose this heuristic to detect “hidden content” in a page
• Compression Ratio: The proposed features helps in determining the level of redundancy in the page
• Independent and Dependent LH: These techniques utilize the independent and dependent n-grams probability to detect spam. More precisely, content of each page is divided into n-g of n consecutive words to calculate the probability of document by individual n-g probabilities. However, this feature is computationally expensive.
The performance analysis of these features and its comparison after applying feature selection techniques is presented in section 3.
2.2 Proposed Methodology
This research work focuses on the contribution of feature selection in adversarial IR applications. The common issues in the spam domain are listed as: small sizes of samples, unbalanced data set and large input dimensionality due to several pages in a single web document. To deal with such problems, a variety of feature selection methods have been designed by researchers in machine learning and pattern recognition. This work employs univariate filter feature selection to improve the prediction performance of decision model. The existing heuristics on which feature selection is performed are already discussed in previous subsection. The idea of applying feature selection in the existing features is two-fold: these features were utilized in many previous studies [16; 17; 18; 23] for effective spam detection; the heuristics recognized as baseline for further studies in the underlying domain. Due to aforementioned reasons, it can be expected that, for spam documents classification, feature selection techniques will be of practical use for later researches in information retrieval and web spam. 2.2.1 Methods for Web Spam Detection
This section describes the algorithms and methods used for evaluation of this work.
Classification Algorithm
For the appropriate prediction, we have tried various classification methods, namely, k-nearest neighbour, linear discriminant analysis, and support vector machine (SVM). As per experiments, SVM is observed to achieve better results for binary classification in comparison to other classifiers. Therefore, this research work SVM is utilised to learn decision model.
SVM [24] classify objects by mapping them to higher dimensional space. In this space, SVM train to find the optimal hyperplane, i.e., the one with the maximum margin from the support vectors (nearest patterns).
Consider a training vector we define a vector y such that decision function can be defined as:

Computer Science & Information Technology (CS & IT) 31
The weight vector w is defined as:
where is the Lagrange’s multiplier used to find the hyperplane with maximum distance from the nearest patterns. Patterns for which are support vectors. The possible choice of decision function when data points are not separable linearly can be expressed as:
where, and C is the penalty parameter. Value of C =10 is used for experimental evaluation.
Performance Evaluation
In order to evaluate the model, 10-fold cross validation technique is used. The results are shown in terms of classification accuracy, sensitivity, and specificity, whose values are obtained by analysing the cost matrix [25].
Sensitivity can be defined as the number of actual positive instances (spam) that are correctly predicted as positive by the classifier. Conversely, specificity determines proportion of actual negatives (non-spam hosts) that are correctly classified. Accuracy can be defined as total number of instances that are correctly predicted by the classifier. Univariate Filter Feature Selection: Simple yet efficient
In order to improve the performance of SVM, feature selection is implemented. Univariate filter based feature selection has been utilised due to the fact that it is computationally simple, fast, efficient, and inexpensive. In filter based feature selection, “features are selected independently to induction algorithm” [26; 27; 28]. The measurement for feature selection is chosen as Mutual Information Maximization (MIM) [29]. It is a simple method to estimate rank of features based on mutual information. Mutual information is defined as a relevancy measure, determining how relevant a feature is for corresponding targets. The criterion can be expressed as follows:
where is the nth feature of training matrix X, c is the class label and refers to mutual information between the two. Mutual Information between two random variables p and q can be determined as:
3. EXPERIMENTAL RESULTS AND DISCUSSION
Table 1 shows the performance of SVM on existing feature set whereas Table 2 shows the prediction performance after feature selection. It is clearly visible that feature selection technique on precompiled measures outperforms the performance of complete feature set. The results show a significant gain in classifier’s accuracy in terms of both valuation measures (i.e., specificity and sensitivity). Approximately 3% increase in specificity and 2% increment in accuracy and sensitivity is reported.

32 Computer Science & Information Technology (CS & IT)
Table 1: Performance of content- based feature sets using SVM
Feature Set Performance Measure (in percentage)
(98 features) Accuracy Sensitivity Specificity
Content 79.9 61.8 79.2
Table 2: Performance of content- based feature sets after feature selection using SVM
Filter based Feature Selection
Number of features
Top 10
Top 20
Top 30
Top 40
Top 50
Top 60
Top
70
Top 80
Top 90
Performance Measure (in percentage)
Accuracy 76.7 78.6 81.6 81.6 81.4 81.1 82.1 80.8 80.7
Sensitivity 46.6 51.2 51.3 55.3 55.3 57.1 63.1 63.1 62.7
Specificity 81.5 81.6 81.6 82.6 82.7 82.7 82.9 80.8 80.7
4. CONCLUSIONS AND FUTURE PERSPECTIV
In this study, we take into account existing heuristics for detecting spam by means of content analysis. This experiment compares the performance results of pre-determined features with the performance of features achieved after feature selection. The experimental results demonstrate that classifier performance increases with reduced (reduced from 98 features to 70 features) set of salient features. Furthermore, we believe that feature selection undermines the inherent risk of imprecision and over-fitting caused due to unbalanced nature of dataset. However, a robust and optimal feature selection model is still a need to uncover. Multivariate feature selection and wrapper based feature selection can be addressed as a prominent future study in web spam community. A second line of future research will be extension of heuristics extracted using both content analysis and web graph mining. Other interesting opportunities oriented towards different machine learning approaches such as fuzzy logic, neural network etc. Since, there is no clear separation between spam and ham pages, i.e., definition of spam may be vary from one person to another, use of fuzzy logic can be seen as a promising line of future work in detection of web spam. REFERENCES
[1] Wood, "Today, the Internet -- tomorrow, the Internet of Things?," Computerworld, 2009.
[Online].Available: http://www.computerworld.com/article/2498542/internet/today--the-internet----tomorrow--the-internet-of-things-.html.
[2] Z. Jia, W. Li and H. Zhang, "Content-based spam web page detection in search engine," Computer
Application and Software, vol. 26, no. 11, pp. 165-167, 2009. [3] M. Cutts, "Google search and search engine spam," Google Official Blog, 2011. [Online]. Available:
https://googleblog.blogspot.in/2011/01/google-search-and-search-engine-spam.html.

Computer Science & Information Technology (CS & IT) 33
[4] M. McGee, "businessWeek Dives Deep Into Google's Search Quality," Search Engine Land, 2009. [Online]. Available: http://searchengineland.com/businessweak-dives-deep-into-googles-search-quality-27317.
[5] D. Ferris, R. Jennings and C. WIlliams, "The Global Economic Impact of Spam," Ferris Research,
2005. [6] R. Jennings, “Cost of Spam is Flattening - Our 2009 Predictions,” 2009. [Online]. Available:
http://ferris.com/2009/01/28/cost-of-spam-is-flattening-our-2009- predictions/. [7] N. Spirin and J. Han, "Survey on web spam detection: principles and algorithms," SIGKDD Explor.
Newsl., vol. 13, no. 2, p. 50-64, 2012. [8] C. Castillo, K. Chellapilla and B. Davison, "Adversarial Information Retrieval on the Web,"
Foundations and trends in Information Retrieval, vol. 4, no. 5, pp. 377-486, 2011. [9] S. Chakrabarti, Mining the Web. San Francisco, CA: Morgan Kaufmann Publishers, 2003. [10] C. Castillo, D. Donato, L. Becchetti, P. Boldi, S. Leonardi, M. Santini and S. Vigna, "A reference
collection for web spam," ACM SIGIR Forum, vol. 40, no. 2, pp. 11-24, 2006. [11] J. Lin, "Detection of cloaked web spam by using tag-based methods," Expert Systems with
Applications, vol. 36, no. 4, pp. 7493-7499, 2009. [12] A. Andrew, "Spam and JavaScript, future of the web," Kybernetes, vol. 37, no. 910, pp. 1463-1465,
2008. [13] C. Wei, Y. Liu, M. Zhang, S. Ma, L. Ru, and K. Zhang, "Fighting against web spam: a novel
propagation method based on click-through data," In Proceedings of the 35th international ACM SIGIR conference on Research and development in information retrieval, pp. 395-404, 2012.
[14] H. Ji and H. Zhang, "Analysis on the content features and their correlation of web pages for spam
detection", China Communications, vol. 12, no. 3, pp. 84-94, 2015. [15] M. Egele, C. Kolbitsch and C. Platzer, "Removing web spam links from search engine results,"
Journal in Computer Virology, vol. 7, no. 1, pp. 51-62, 2011. [16] A. Ntoulas, M. Najork, M. Manasse, and D. Fetterly, "Detecting spam web pages through content
analysis," In Proceedings of the 15th international conference on World Wide Web, ACM, pp. 83-92, 2006.
[17] V. Prieto, M. Álvarez and F. Cacheda, "SAAD, a content based Web Spam Analyzer and Detector,"
Journal of Systems and Software, vol. 86, no. 11, pp. 2906-2918, 2013. [18] L. Araujo and J. M. Romo, "Web spam detection: new classification features based on qualified link
analysis and language models," Information Forensics and Security, IEEE Transactions, vol. 5, no. 3, pp. 581-590, 2010.
[19] J. M.Ponte, and W. B. Croft, "A language modeling approach to information retrieval," In
Proceedings of the 21st annual international ACM SIGIR conference on Research and development in information retrieval, pp. 275-281, 1998.
[20] T. Cover and J. Thomas, Elements of information theory. New York: Wiley, 1991. [21] D. Fetterly, "Adversarial information retrieval: The manipulation of web content," ACM Computing
Reviews, 2007.

34 Computer Science & Information Technology (CS & IT)
[22] Web Spam Collections. http://chato.cl/webspam/datasets/ Crawled by the Laboratory of Web Algorithmics, University of Milan, http://law.di.unimi.it/.
[23] C. Dong and B. Zhou, "Effectively detecting content spam on the web using topical diversity
measures," In Proceedings of the The 2012 IEEE/WIC/ACM International Joint Conferences on Web Intelligence and Intelligent Agent Technology, vol. 01, pp. 266-273, IEEE Computer Society, 2012.
[24] M. A. Hearst, S. T. Dumais, E. Osman, J. Platt, and B. Scholkopf. "Support vector machines,"
Intelligent Systems and their Applications, vol.13, no. 4, pp:18-28, 1998. [25] “Confusion matrix,” Wikipedia, the free Encyclopedia,
Available: https : //en.wikipedia.org/wiki/Confusionmatrix. [26] C.Bishop, Pattern recognition and machine learning, springer, 2006. [27] Guyon and A. Elisseeff, "An introduction to variable and feature selection," The Journal of Machine
Learning Research, vol. 3, pp: 1157-1182, 2003. [28] H. Peng, F. Long and C. Ding, "Feature selection based on mutual information criteria of max-
dependency, max-relevance, and min-redundancy," IEEE Transactions on Pattern Analysis and Machine Intelligence, vol. 27, pp: 1226-1238, 2005.
[29] G. Brown, A. Pocock, M.J. Zhao and M. Lujan, "Conditional likelihood maximization: A unifying
framework for information theoretic feature selection,” Journal of Machine Learning Research, vol. 13, pp: 27-66, 2012.
AUTHORS
Ms. Shipra is currently pursuing her Masters in Analytics (Computer Science and Technology) from National Institute of Technology (NIT), New Delhi, India.Prior to this she has received her B.Tech degree in Computer Science and Engineering and has more than 1 year of work experience in Digital Marketing. Her current area of research is machine learning and pattern recognition problems domains of adversarial information retrieval and search engine spam.
Ms. Akanksha Juneja is currently working as Assistant Professor in Department of Computer Science and Engineering, National Institute of Technology Delhi. She is also a PhD scholar at School of Computer & Systems Sciences (SC&SS), Jawaharlal Nehru University (JN U), New Delhi, India. Prior to this she has received her M.Tech degree (Computer Science & Technology) from SC&SS, JNU, New Delhi. Her current area of research is machine learning and pattern recognition problems domains of image processing and security.

David C. Wyld et al. (Eds) : CSITY, SIGPRO, AIFZ, NWCOM, DTMN, GRAPHHOC - 2016
pp. 35–46, 2016. © CS & IT-CSCP 2016 DOI : 10.5121/csit.2016.60404
GEOMETRIC CORRECTION FOR BRAILLE
DOCUMENT IMAGES
Padmavathi.S1,Aishwarya.A.V
2 and Iswaryah.S
3
Amrita School of Engineering,
Amrita Vishwa Vidyapeetham, Coimbatore, India. [email protected],[email protected] and
ABSTRACT
Braille system has been used by the visually impaired people for reading.The shortage of Braille
books has caused a need for conversion of Braille to text. This paper addresses the geometric
correction of a Braille document images. Due to the standard measurement of the Braille cells,
identification of Braille characters could be achieved by simple cell overlapping procedure. The
standard measurement varies in a scaled document and fitting of the cells become difficult if the
document is tilted. This paper proposes a line fitting algorithm for identifying the tilt (skew)
angle. The horizontal and vertical scale factor is identified based on the ratio of distance
between characters to the distance between dots. These are used in geometric transformation
matrix for correction. Rotation correction is done prior to scale correction. This process aids in
increased accuracy. The results for various Braille documents are tabulated.
KEYWORDS
Braille to text Conversion, Skew detection, skew correction
1. INTRODUCTION
Braille is a system of writing that uses patterns of raised dots to inscribe characters on paper. It
therefore allows visually –impaired people to read and write using touch instead of vision. Its
characters are six- dot cells, two wide by three tall. Any of the dots may be raised, giving 64
possible characters including 26 English alphabets, punctuations, numbers etc. Although Braille
cells are used world-wide, the meaning of each cell depend onthe language that they are being
used to depict.
Figure.1- Braille Cell Dimensions

36 Computer Science & Information Technology (CS & IT)
The dimension of a Braille character is a standard one irrespective of the Language. Each dot in a
Braille cell has a diameter of 1.5 mm. Within each cell the dot centres are placed at a distance of
2.5 mm vertically and 2.3 mm horizontally. Two cells are separated by a distance of 6 to 6.4 mm
horizontally and 10.4 to 12.7mm vertically. These are illustrated in Figure.1.
Since the number of Braille books available are limited in number, when an ordinary text book is
scanned and converted to text or audio, benefits many people who are in need. This also enables
the corresponding document to be sent across the web. Identifying the Braille cells and
decrypting them to the corresponding language are the major processes involved in the
conversion[ 7]. Identifying Braille cells is difficult if the scanned documents are rotated or if
those sheets are at different scale. These issues are briefed as follows
• When tilted to some angle, mapping of Braille to text is inappropriate and hence results
in incorrect text.
• An inverted document may result in different mapping. An example of 2 Tamil letters,
Inverted இis equivalent toஈ. Their Braille representations are in shown in Figure.2.
Figure 2.Inverted symbol mapping
• If the documents are either zoomed or shrunk their scaling varies and the spacing
between the Braille dots or cells will be different from standard measurements.
Hence, the identification of Braille cells becomes difficult.
This paper proposes a technique which corrects the tilting of the Braille documents and brings the
scanned document to the standard scale. The scanned document is converted to binary image
before processing. The tilt or skew angle is identified by fitting a straight line to the set of first
encountered vertical pixels. An inverse rotation matrix is used to correct the tilt. This paper
utilizes the fact that ratio of the between character separation to within character separation
should remain constant irrespective of scaling factor. A wide separation and a narrow separation
horizontally signify the horizontal distance between two Braille cells (i.e. 2 characters and
horizontal distance between the dots of the same Braille cell respectively. These distances cannot
be calculated directly as the presence of dots varies for the characters present in the document.
Since the dots raised may occur in different position, these distances varies for different character
combinations. The ratio of distance between characters to distance between dots is between 2.6 to
2.78 in horizontal direction and 2.08 to 2.54 in vertical direction irrespective of the scaling factor.
The distance pair satisfying these criteria is chosen and compared with the standard values to
calculate the horizontal scale factor. A similar procedure is used for vertical distance and the
vertical scale factor is calculated. An inverse geometric transformation matrix is used to bring the
scale to the standard form. Once the documents are brought to the standard form the Braille
characters could be converted to text as explained in [7].
In this paper, section 2 discusses about some of the methods proposed for finding rotation and

Computer Science & Information Technology (CS & IT) 37
scaling of scanned documents. Third section explains in detail about the solution proposed and
fourth section covers the outcomes of the proposed method. Final section concludes with issues
involved in implementing the proposed method and future works.
2. LITERATURE REVIEW
The issues that must be taken into consideration when implementing Braille to text conversion
are scaling and rotation factors. Some of the methods to find them are as follows: Using the
deviation over the sum of rows, [1] image was slanted over an angle. Each time it was slanted
one pixel in vertical direction, deviation over sum of rows was calculated. When dots are
horizontal, maximum was obtained. In [3], a probabilistic approach was proposed to estimate
skewness and line-spacing of the Braille documents. Idea is to extract locations of the pixels
belonging to shadow regions of dots and consider them as samples drawn from a two-
dimensional Probabilistic Density Function (PDF). Parameters of the PDF are related to skewness
and scale properties of the document. These parameters are estimated in a Maximum-Likelihood
framework using the Expectation Maximum approach. Paper [4] does the following for finding
the rotation angle: Geometric correction aims to bring all scanned Braille document images to a
common reference point. A simple technique is used to solve this issue: manually draw a 15x10
mm rectangle using black ink pen at a fixed position on each page of Braille document. By
detecting the 15x10 mm rectangle in the scanned image and estimating the position and
orientation of the rectangle, transform the scanned image to a common reference point. Abdul
Malik Al-Salman et al.[2] have proposed a probabilistic algorithm to correct any de-skewing in
tilted scanned images. They also mention that maximum degree of recognizing a de-skewed
image is 4 degrees from either the left or the right side.
As referred in [8] Supernova is a window-based magnifier, screen reader and a Braille system
that supports the conversion of text to speech, Braille displays and note-takers. [9] refers to a
paper on Braille word segmentation and transformation of Mandarin Braille to Chinese
character. [10] discuss the main concepts related to OBR systems; list the work of different
researchers with respect to the main areas of an OBR system, such as pre-processing, dot
extraction, and classification. [11] focuses on developing a system to recognize an image of
embossed Arabic Braille and then convert it to text. [12] proposes a software solution prototype
to optically recognise single sided embossed Braille documents using a simple image processing
algorithm and probabilistic neural network. [13] describes an approach to a prototype system that
uses a commercially available flat-bed scanner to acquire a grey-scale image of a Braille
document from which the characters are recognised and encoded for production or further
processing. [14] presents an automatic system to recognize the Braille pages and convert the
Braille documents into English/Chinese text for editing.[15] describes a new technique for
recognizing Braille cells in Arabic single side Braille document. [16] developes a system that
converts, within acceptable consrtraints , (Braille image) to a computer readable form. [17]
provides a detailed description of a method for converting Braille as it is stored as characters in a
computer into print.
3. PROPOSED SOLUTION
Most of the commercial software focuses on converting text to Braille and vice versa. Very few
consider scanned Braille documents as input and the geometric corrections are done based on

38 Computer Science & Information Technology (CS & IT)
probabilistic models. This paper proposes a method that uses a geometric transformation matrix
for rotation and scale correction. The parameters of the matrix are identified using standard
measurement of the Braille cells. The overall block diagram for the method proposed is shown in
Figure 3.
Figure.3. Block diagram of proposed method
The Braille document is scanned and taken as input. The scanned document is converted to gray
scale and the noises are removed using Gaussian filter. To identify the dots, the image is
convolved with the Prewitt filter and thresholding the resulting image. The skew correction of the
document is done in two steps. First the rotation is corrected which is followed by scale
correction. The Braille dots are represented as white and non-dots are represented as black in the
resulting binary image.
3.1 Rotation Correction
Since the document is scanned, the maximum tilt is assumed to be 4 degrees in clockwise or
anticlockwise direction. The extreme coordinate of the white dots are used to identify the
direction of the tilt.
Let xmin and xmax represent the minimum and maximum x coordinates of the white dots. Their
corresponding y values are represented as y(xmin) and y(xmax) respectively. Then the conditions in
Eq(1) and (2) specify the anticlockwise and clockwise rotation as illustrated in Figure.4. and
Figure.5 respectively.
(xmin)<y(xmax) (1)
y(xmin) >y(xmax) (2)

Computer Science & Information Technology (CS & IT) 39
If both conditions fail then the document is not rotated.In the rotated document the global ymin is
identified and vertical lines are drawn to the first encountered white dots from ymin. The dots are
chosen only if its Y value falls in the range [ymin,T], where T represents a threshold.
Figure.4. Sample image for anticlockwise rotation Figure.5. Sample image for clockwise rotation
A straight line is fit on the dots selected such that it minimizes the squared deviations of observed
Y co-ordinates from any alternative line as in Eq(4).
y'i= a + b xi (3)
∑ei2=∑ (yi – y'i)2
(4)
Where yi is actual y value, xi is independent variable x value at ith position, y'i is the predicted
value of dependent variable, a is a constant which representsthe point at which the line crosses
the Y axis when X = 0, b is regression slope, ∑ ei2is the sum of squared errors in prediction. The
angle made by this line with the x-axis is calculated and identified as the tilt angle ‘α’. The sign
of the tilt angle varies based on the direction of rotation. The rotation is corrected by applying the
geometric transformation matrix as given in equation (5).
1
y
x
=
1
0
0
0
cos
sin
0
sin
cos
α
α
α
α
−
x
1
'
'
y
x
(5)
3.2 Scale Correction
The tilt corrected image is used for scale correction to fit the Braille document to standard
measurements. The binary image when projected on to Y axis gives the frequency of the white
dots for each horizontal line. A zero frequency signifies the horizontal blank lines, which may
occur between dots and between characters. A similar projection on X axis gives the frequency of
white dots for each vertical line. A zero frequency here signifies the vertical blank lines that
occur between dots and between characters. The presence of dots varies depending on the Braille
character, hence the distance between the dots and characters also vary. To get a reasonable

40 Computer Science & Information Technology (CS & IT)
judgement of the distances, a sufficiently large sub-window near the top left corner is considered.
This portion of the image is cropped such that the left and top blank lines are removed. The
centroids of the dots in the cropped image are considered for further processing. The ratios of the
horizontal distance between characters to distance between dots remain same irrespective of
horizontal scaling factor. It ranges from 2.6 to 2.78. A similar concept is applicable for vertical
distance ratio, which ranges from 2.08 to 2.54. The horizontal distance between every successive
pair of dot centroids are calculated. If the ratio of the distance falls in the specified range those
distances are considered. Since the ratio falls in a range, the most frequently occurring value is
found and its corresponding distance is used for calculating the scaling factor as shown in
equation (6)
(6)
Where Sf is the scaling factor. The standard distance differs according to the dpi of the input
image.For a 100 dpi image, pixel-mm equivalence could be found as follows. We know,
1 inch=25.4 mm (7)
100 pix/inch=100pix/25.4mm (8)
1mm = 100 pix/25.4=3.93 pix (9)
Hence from the Braille cell dimension the standard horizontal distance between characters varies
from 23.58 to 25.15 pixels, the standard vertical distance between characters varies from 39.3 to
47.16 pixels. Once the scaling factor is known the image is de-scaled to standard size using
scaling inverse transformation matrix in equation (10).
1
y
x
=
1
0
0
0
/1
0
0
0
/1
q
p
x
1
'
'
y
x
(10)
where p and q are the scaling factors obtained in horizontal and vertical direction from the input
image respectively and (x’,y’) are input pixel values and (x, y) are their corresponding output
pixels.
Simple Braille cell overlapping could be done on the scale corrected image. The extracted cells
can converted to Braille characters which can then be mapped to the corresponding alphabet as in
[7].
4. EXPERIMENTAL RESULTS
Several Braille documents of different dpi’s (say 100,300,400,600) were taken as input for both
scaling and rotation correction. The result shown below refers to documents of 100 dpi. A portion
of the scanned Braille document is shown in Figure.6.
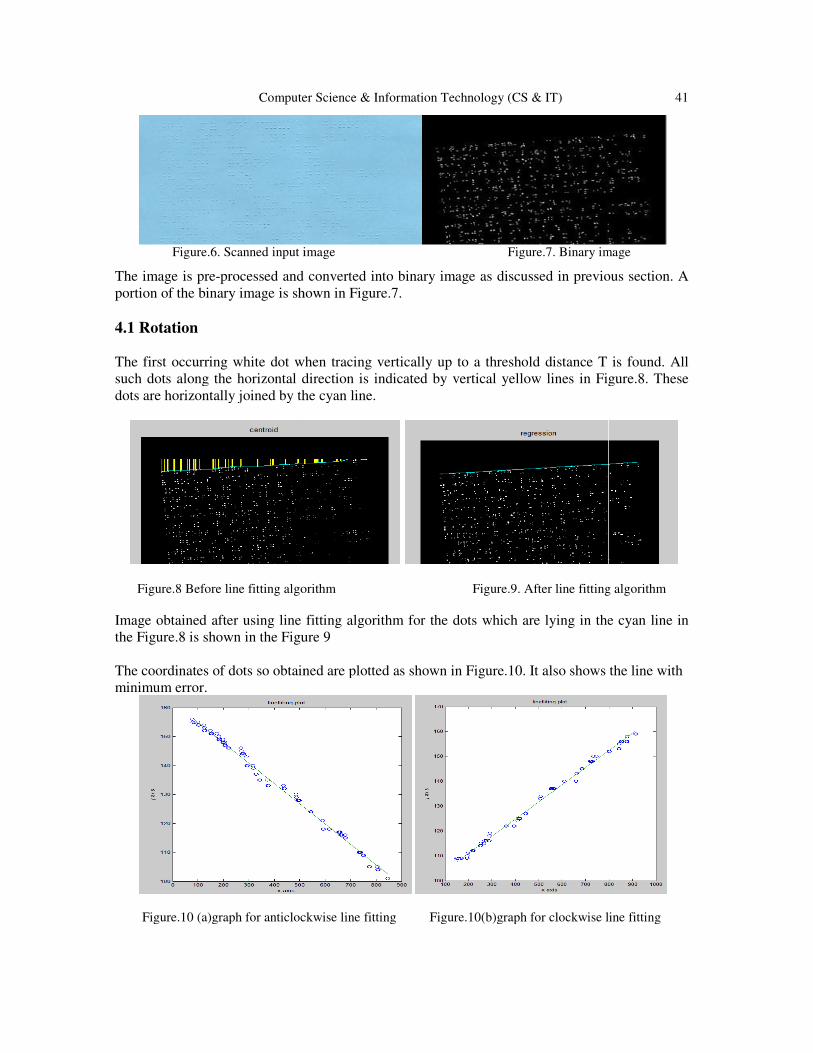
Computer Science & Information Technolo
Figure.6. Scanned input image
The image is pre-processed and converted into binary image as discussed in previous section. A
portion of the binary image is shown in
4.1 Rotation
The first occurring white dot when tracing vertically up to a threshold
such dots along the horizontal direction is indicated by vertical yellow lines in Figure.8. These
dots are horizontally joined by the cyan line.
Figure.8 Before line fitting algorithm
Image obtained after using line fitting algorithm for the dots which are lying in the cyan line in
the Figure.8 is shown in the Figure
The coordinates of dots so obtained are plotted as shown in
minimum error.
Figure.10 (a)graph for anticlockwise line fitting
Computer Science & Information Technology (CS & IT)
Figure.6. Scanned input image Figure.7. Binary image
processed and converted into binary image as discussed in previous section. A
portion of the binary image is shown in Figure.7.
The first occurring white dot when tracing vertically up to a threshold distance T is found. All
such dots along the horizontal direction is indicated by vertical yellow lines in Figure.8. These
dots are horizontally joined by the cyan line.
Figure.8 Before line fitting algorithm Figure.9. After line fitting algorithm
Image obtained after using line fitting algorithm for the dots which are lying in the cyan line in
Figure 9
The coordinates of dots so obtained are plotted as shown in Figure.10. It also shows the line with
Figure.10 (a)graph for anticlockwise line fitting Figure.10(b)graph for clockwise line fitting
41
Figure.7. Binary image
processed and converted into binary image as discussed in previous section. A
distance T is found. All
such dots along the horizontal direction is indicated by vertical yellow lines in Figure.8. These
Figure.9. After line fitting algorithm
Image obtained after using line fitting algorithm for the dots which are lying in the cyan line in
.10. It also shows the line with
Figure.10(b)graph for clockwise line fitting

42 Computer Science & Information Technology (CS & IT)
The final image obtained after removing tilt is shown in
The actual rotation angle (θ) the starting point and end point before line fitting (S
after line fitting (Sl and El), the experimentally calculated angle
Merr are tabulated for different anticlockwise rotation angle in Table.1. A similar listing is done
for clockwise rotation angle in Table.2.
Actual θ
Start point (Sb)
End point (Eb)
Start point (Sl)
End pt (El)
θc
Merr
Actual θ
Start point(Sb)
End point(Eb)
Start point(Sl)
End pt (El)
θc
Merr
4.2 Scaling
The image obtained as a result of rotation correction is given as input for scaling correction.
Horizontal and vertical projections
zero frequency after eliminating consecutive zeros
shown in blue in Figure.12.
Computer Science & Information Technology (CS & IT)
The final image obtained after removing tilt is shown in Figure.11.
θ) the starting point and end point before line fitting (S
), the experimentally calculated angle θc and mean error of line fitting
are tabulated for different anticlockwise rotation angle in Table.1. A similar listing is done
for clockwise rotation angle in Table.2.
Figure.11. Re-rotated image
Table.1 anticlockwise rotation
-4 -3 -2 -1
(79,155) (77, 144) (79,137) (73,116)
(845,101) (843,102) (850,107) (844,103)
(79,156) (77,143) (79,136) (73,115)
(845,103) (844,103) (850,107) (844,102)
-4.01 -2.99 -2.177 -0.97
-2.24 -2.04 5.35 -1.69
Table.2 clockwise rotation
4 3 2 1
) (915,159) (897,144) (883,136) (861,116)
) (149,109) (140,108) (126,110) (141,106)
) (915,160) (897,145) (883,137) (861,116)
(149,107) (140,107) (126,109) (141,105)
3.95 2.89 2.09 0.91
-4.06 5.53 -4.40 8.31
The image obtained as a result of rotation correction is given as input for scaling correction.
Horizontal and vertical projections profiles are calculated. The horizontal and vertical
zero frequency after eliminating consecutive zeros are identified as Braille cell boundary and
) the starting point and end point before line fitting (Sb and Eb) and
and mean error of line fitting
are tabulated for different anticlockwise rotation angle in Table.1. A similar listing is done
The image obtained as a result of rotation correction is given as input for scaling correction.
. The horizontal and vertical lines with
boundary and are

Computer Science & Information Technolo
Figure.12 Image after Profiling
To decide the scaling factor and the ratio, 4 standard distances are considered. These distances
are calculated with the dot centres
Case 1: distance in horizontal direction
for a standard Braille cell (Std w
Case 2: distance in horizontal direction between 2 consecutive cells
to standard measurement ranges from 6
Case 3: distance in vertical direction within the same cell
2.5mm or 9.82 pixels (Std wv).
Case 4: distance in vertical direction between 2 consecutive Braille cells
according to standard measurement ranges 10.4 to 12.7 mm or
Part of the profiled image is cropped
colour as shown in Figure. 13. From the cropped image the distances and ratios are calculated as
specified in section 3. The top 3 most frequently occurring ratios
and their counts are tabulated in Table.3
(wh and bh) for the most frequently occurring ratio is listed in Table.4. Factr1 and Factr2 represent
the horizontal scale factor which are calculated from w
size
%
25
50
75
Orig
125
150
175
Computer Science & Information Technology (CS & IT)
Figure.12 Image after Profiling Figure.13. image with centroids marked
To decide the scaling factor and the ratio, 4 standard distances are considered. These distances
calculated with the dot centres as reference.
distance in horizontal direction within the same cell (wh), which is 2.3 mm or 9.04 pixels
wh).
distance in horizontal direction between 2 consecutive cells (bh). This distance according
to standard measurement ranges from 6-6.4mm i.e. 23.58 to 25.15 pixels (Std bh).
distance in vertical direction within the same cell (wv), whose standard measurement is
e in vertical direction between 2 consecutive Braille cells (bv). This distance
according to standard measurement ranges 10.4 to 12.7 mm or 39.3 to 47.16 pixels (Std
Part of the profiled image is cropped and the centroids of each Braille dot are marked red in
. 13. From the cropped image the distances and ratios are calculated as
3 most frequently occurring ratios that fall within the valid range
r counts are tabulated in Table.3 for various % of scaling. The horizontal distance values
) for the most frequently occurring ratio is listed in Table.4. Factr1 and Factr2 represent
the horizontal scale factor which are calculated from wh and bh respectively using the formula
Factr1 = wh÷ Std(wh)
Factr2 = bh÷ Std(bh)
Table.3. Horizontal Ratio-count
Ratio Count
r1 r2 r3 c1 c2 c3
2.60 2.64 2.69 6 3 2
2.61 2.68 2.72 3 3 2
2.66 2.70 2.60 5 2 1
2.70 2.64 2.67 4 2 2
2.64 2.75 2.68 4 2 1
2.61 2.66 2.73 3 1 1
2.60 2.73 2.76 3 2 1
43
Figure.13. image with centroids marked
To decide the scaling factor and the ratio, 4 standard distances are considered. These distances
which is 2.3 mm or 9.04 pixels
. This distance according
whose standard measurement is
. This distance
(Std bv). he centroids of each Braille dot are marked red in
. 13. From the cropped image the distances and ratios are calculated as
that fall within the valid range
. The horizontal distance values
) for the most frequently occurring ratio is listed in Table.4. Factr1 and Factr2 represent
respectively using the formula
(11)
(12)

44 Computer Science & Information Technology (CS & IT)
Table.4 Horizontal distance and scale factor
Dist
%
Within
char
(wh)
Betwn
char
(bh)
Ratio
bh÷wh
Factr
1
Factr
2
25 2.3 6 2.6 0.25 0.24
50 4.67 12.2 2.61 0.51 0.49
75 6.9 18.36 2.66 0.76 0.75
Orig 9.04 24.47 2.7 1 1
125 11.43 30.25 2.64 1.26 1.24
150 13.56 35.45 2.61 1.5 1.45
175 16.38 42.58 2.6 1.81 1.74
A similar procedure is adopted for vertical distances. The valid vertical ratios range from 2.08 to
2.54. Factr3 and Factr4 in the Table.6 represent the vertical scale factors, calculated from wv and
bv respectively using the formula
Factr3 = wv÷ Std(wv) (13)
Factr4= bv÷ Std(bv) (14)
Table.5 Vertical Ratio-count
size
%
Ratio Count
r1 r2 r3 c1 c2 c3
25 2.16 2.41 2.34 4 2 2
50 2.19 2.22 2.10 3 2 1
75 2.21 2.32 2.25 4 2 1
Orig 2.24 2.43 2.35 3 2 2
125 2.25 2.15 2.41 4 2 1
150 2.26 2.12 2.38 3 1 1
175 2.24 2.36 2.17 3 2 1
Table.6 Vertical distance and scale factor
Dist
%
Withi
n char
(wv)
Between
char
(bv)
Ratio
(bv÷wv)
Fact
r3
Factr
4
25 4.61 10 2.16 0.26 0.25
50 9.04 19.87 2.19 0.50 0.49
75 13.48 29.9 2.21 0.76 0.74
Orig 17.74 39.9 2.24 1.00 1.00
125 22.18 49.8 2.25 1.25 1.24
150 25.9 58.65 2.26 1.46 1.48
175 31.04 69.8 2.24 1.75 1.74
To show the calculated distance between the Braille cells in horizontal and vertical direction, the
centroids of the dots are marked in yellow colour in (Figure.14). The distance between one

Computer Science & Information Technology (CS & IT) 45
Braille character to another which lie in the range of standard measurement in either direction are
marked in yellow colour in the figure.
Figure.14. Horizontal and vertical distances
5. CONCLUSION
Extraction of text from the Braille document images requires skew detection and correction like
normal document images. The skew detection for Braille documents is more challenging because
it consists of dots only. This paper suggests a line fitting based skew correction method. The
presence of noises could be mistaken for dots and hence noise removal and binarization process
plays an important role in skew angle detection. A simple template matching could be used for
Braille character extraction when the scale of the scanned document agrees with the standard
measurement. The scale factor of the skew corrected image is calculated using the ratio of within
character distance to between character distance.The arbitrary presence of dots is eliminated
comparing with standard range and the maximum is calculated by voting system.
Braille documents when created manually, there is a possibility that the Braille dots may not be in
a straight line, can be slanting between characters. This kind of skews could not be corrected by
the method. An algorithm for skew correction for 180 degrees has to be modelled in future.
REFERENCES [1] Jan Mennens, Luc van Tichelen, Guido Francois, and Jan J. Engelen (1994), “Optical Recognition of
Braille Writing Using Standard Equipment”, IEEE Transactions on Rehabiliation Engg, Vol. 2, No. 4,
December 1994.
[2] AbdulMalik Al-Salman, YosefAlOhali, Mohammed AlKanhal, and Abdullah AlRajih, “An Arabic
Optical Braille Recognition System”, ICTA’07, April 12-14, Hammamet, Tunisia.
[3] MajidYoosefiBabadi, Behrooz Nasihatkon1, ZohrehAzimifar, Paul Fieguth, “ Probabilistic
Estimation Of Braille Document Parameters”, ICIP 2009.
[4] Jie Li and Xiaoguang Yan, Dayong Zhang, “Optical Braille Recognition with Haar Wavelet Features
and Support-Vector Machine”, 2010 International Conference on Computer, Mechatronics, Control
and Electronic Engineering (CMCE).
[5] A. Antonacopoulos, D. Bridson, “A Robust BrailleRecognitionSystem” Proceedings of the IAPR
International Workshop on Document Analysis Systems, Italy, 2004.
[6] J.A. Bilmes, “A Gentle Tutorial of the EM Algorithm and Its Application to Parameter Estimation for
Gaussian Mixtureand Hidden Markov Models”, Technical Report, University ofBerkeley,1998.

46 Computer Science & Information Technology (CS & IT)
[7] S.Padmavathi, Manojna K.S.S, Sphoorthy Reddy .S and Meenakshy.D, “Conversion Of Braille To
Text In English, Hindi And Tamil Languages”, in International Journal of Computer Science,
Engineering and Applications (IJCSEA), Volume3 number 3 ,June 2013 pp19-32.
[8] AbdulMalik S. Al-Salman, ”A Bi-directional Bi-Lingual Translation Braille-Text System”, J. King
Saud University, Vol. 20, Comp. & Info. Sci., pp. 13-29,Riyadh(1428H./2008).
[9] Minghu Jiang etal, "Braille to print translations of Chinese",Information and Software Technology 44
(2002) 91-100
[10] Trends And Technologies In Optical Braille Recognition by AbdulMalik S. Al-Salman, Yosef
AlOhali, and Layla O. Al-Abdulkarim, 3'rd Int. Conf. on Information Technology,May 2007,Jordan.
[11] AbdulMalik Al-Salman, Yosef AlOhali, Mohammed AlKanhal, and Abdullah AlRajih,"An Arabic
Optical Braille Recognition System",ICTA’07, April 12-14, Hammamet, Tunisia
[12] Lisa Wong,Waleed Abdulla,Stephan Hussmann,"A Software Algorithm Prototype for Optical
Recognition of Embossed Braille", Pattern Recognition, 2004. ICPR 2004. Proceedings of the 17th
International Conference on 23-26 Aug. 2004, 586- 589 Vol.2
[13] R.T. Ritchings, A. Antonacopoulos and D. Drakopoulos,"ANALYSIS OF SCANNED BRAILLE
DOCUMENTS",In the book: Document Analysis Systems, A. Dengel and A.L. Spitz (eds.), World
Scientific Publishing Co,1995, pp. 413-421
[14] C M Ng, Vincent Ng, Y Lau,"Regular Feature Extraction for Recognition of Braille", Computational
Intelligence and Multimedia Applications, 1999. ICCIMA '99. Proceedings. Third International
Conference, pages 302-306
[15] Zainab I. Authman, Zamen F.Jebr, "Arabic Braille scripts recognition and translation using image
processing techniques", Journal: Journal of College of Education, Year: 2012 Volume: 2 Issue: 3
Pages: 18-26, Publisher: Thi-Qar University
[16] Jan mennues etal.,"Optical Recognition of Braille writing Using Standard Equipment", IEEE
TRANSACTIONS ON REHABILITATION ENGINEERING, VOL. 2, NO. 4, DECEMBER 1994
[17] Paul Blenkhorn,"System For Converting Braille Into Print",IEEE TRANSACTIONS ON
REHABILITATION ENGINEERING, VOL. 3, NO. 2, JUNE 1995

David C. Wyld et al. (Eds) : CSITY, SIGPRO, AIFZ, NWCOM, DTMN, GRAPHHOC - 2016
pp. 47–56, 2016. © CS & IT-CSCP 2016 DOI : 10.5121/csit.2016.60405
GAUSSIAN KERNEL BASED FUZZY C-MEANS
CLUSTERING ALGORITHM FOR IMAGE
SEGMENTATION
Rehna Kalam1, Dr Ciza Thomas
2 and Dr M Abdul Rahiman
3
1Department of Computer Engineering, Kerala University
[email protected] 2Department of Electronics Engineering, Kerala University
[email protected] 3Department of Computer Engineering, Kerala University
ABSTRACT
Image processing is an important research area in computer vision. clustering is an unsupervised
study. clustering can also be used for image segmentation. there exist so many methods for image
segmentation. image segmentation plays an important role in image analysis.it is one of the first
and the most important tasks in image analysis and computer vision. this proposed system
presents a variation of fuzzy c-means algorithm that provides image clustering. the kernel fuzzy
c-means clustering algorithm (kfcm) is derived from the fuzzy c-means clustering
algorithm(fcm).the kfcm algorithm that provides image clustering and improves accuracy
significantly compared with classical fuzzy c-means algorithm. the new algorithm is called
gaussian kernel based fuzzy c-means clustering algorithm (gkfcm)the major characteristic of
gkfcm is the use of a fuzzy clustering approach ,aiming to guarantee noise insensitiveness and
image detail preservation.. the objective of the work is to cluster the low intensity in homogeneity
area from the noisy images, using the clustering method, segmenting that portion separately using
content level set approach. the purpose of designing this system is to produce better segmentation
results for images corrupted by noise, so that it can be useful in various fields like medical image
analysis, such as tumor detection, study of anatomical structure, and treatment planning.
KEYWORDS
CLUSTERING, K-MEANS, FCM, KFCM, GKFCM
1. INTRODUCTION
Image segmentation plays crucial role in many applications, such as image analysis and
comprehension, computer vision, image coding, pattern recognition and medical images analysis.
Many algorithms have been proposed for object segmentation and feature extraction [1]. In this
method, a clustering algorithm for medical and other image segmentation will be considered.
Clustering is useful in several exploratory pattern-analysis, grouping, decision-making, and
machine-learning situations, including data mining, document retrieval, image segmentation, and
pattern classification. However, in many such problems, there is little prior information (e.g.,
statistical models) available about the data, and the decision-maker must make as few assumptions
about the data as possible. It is under these restrictions that clustering methodology is particularly
appropriate for the exploration of interrelationships among the data points to make an assessment
(perhaps preliminary) of their structure. Clustering is a process of partitioning or grouping a given

48 Computer Science & Information Technology (CS & IT)
set of unlabelled objects into a number of clusters such that similar objects are allocated to one
cluster. There are two main approaches to clustering [2].One method is crisp clustering (or hard
clustering) ,and the other one is fuzzy clustering. A characteristic of the crisp clustering method is
that the boundary between clusters is fully defined. However, in many cases, the boundaries
between clusters cannot be clearly defined. Some patterns may belong to more than one cluster. In
such cases, the fuzzy clustering method provides a better and more useful method to classify these
patterns. The FCM employs fuzzy partitioning such that a data pixel can belong to all groups with
different membership grades between 0 and 1.FCM is an iterative algorithm. The aim of FCM is to
find cluster centers (centroids) that minimize objective function. The KFCM is derived from the
original FCM based on the kernel method [3].KFCM algorithm is extended which incorporates the
neighbor term into its objective function [4].Fuzzy clustering is a widely applied method for
acquiring fuzzy patterns from data and become the main method of unsupervised pattern
recognition. Drawback for FCM algorithm is sensitive to noise or outlier. Drawbacks of FCM were
solved by introducing KFCM .In Wu and Gao’s paper [5], the Mercer Kernel based method was
investigated. They proposed the KFCM algorithm which is extended from FCM algorithm. It is
shown to be more robust than FCM .N.A.Mohamed , M.N.Ahmed et al.[6] described the
application of fuzzy set theory in medical imaging. In the proposed system, the content set for the
various MRI real time images is used to calculate the low intensity area in the in homogeneity form
will attain best result for the segmentation and outperforms existing techniques resulting in better
accuracy and predicting factor. This method is applicable in different scale of image for different
orientation in segmenting the images. Intensity In homogeneity images based Clustering approach
is used to overcome the curve in the images, to represent the pure segmented images. Here in
previous approach such as Fuzzy c means it fails to target the clustered set point, which fits in the
imperfect noisy scaled images in the analysis domain, process of imperfection occurrence in the
images due to overlap of the pixel with the different intensity, outcomes lower cluster
segmentation in the minimum level for MRI images. GKFCM clustering approach will calculate
the estimated parameter automatically for the image data. The clustering process is applied in MRI
medical image, for separate group according to their pixel intensity, which is done with the process
called Kernel based Fuzzy C means clustering. Where kernel value is selected based on the
activities of the membership function. Group of features will selected based on the proper tuning
rate of the kernel value, helps in detecting the region separately, level based segmentation is
analyzed to detect the intensity region separately, when it comes to in homogeneity Medical
images, it is a difficult task for this approach to identify the low intensity region, it can be done by
applying the suitable filters to process those images. Initial Impact in clustering of medical images
is the drawback in extracting the biological features and it became difficult in identifying the
clustered region in similar part of the medical images. Reduction of inhomogeneity in the noisy
Medical Images is the extreme end task, and analyzing it feature is open problem and challenging
task which yields less attention of approach, which effect the less segmentation accuracy.
2. LITERATURE SURVEY
2.1 K-Means Algorithm
K-means is one of the simplest unsupervised learning algorithms that solve the well known
clustering problem. The procedure follows a simple and easy way to classify a given data set
through a certain number of clusters (assume k clusters) fixed a priori. The main idea is to define k
centroids, one for each cluster. These centroids shoud be placed in a cunning way because of
different location causes different result. So, the better choice is to place them as much as possible
far away from each other. The next step is to take each point belonging to a given data set and
associate it to the nearest centroid. When no point is pending, the first step is completed and an
early groupage is done. At this point we need to re-calculate k new centroids as barycenters of the

Computer Science & Information Technology (CS & IT) 49
clusters resulting from the previous step. After we have these k new centroids, a new binding has to
be done between the same data set points and the nearest new centroid. A loop has been generated.
As a result of this loop we may notice that the k centroids change their location step by step until no
more changes are done. In other words centroids do not move any more. Finally, this algorithm
aims at minimizing an objective function, in this case a squared error function. The objective
function
2( )
1 1
k nj
i j
j i
J x c= =
= −∑ ∑ ,
ADVANTAGES
1) K-Means algorithm is very fast.
2) It is robust and easier to understand.
3) Relatively efficient in the sense it runs in O(tknd) where t is the number of iterations ,k is
the number of
Clusters ,n is the number of objects and d is the dimension of each object.
DISADVANTAGES
1) K-Means algorithm requires a priori specification of the number of cluster centers.
2) If there are two highly overlapping data then k-means algorithm will not be able to
resolve that there are two clusters and is said to be the use of exclusive assignment.
3) It is not invariant to non-linear transformations in the sense we get different results
with different representation of data. Data represented in form of cartesian
co-ordinates and polar co-ordinates will give different results.
4) It provides the local optima of the squared error function.
5) Randomly choosing of the cluster center cannot lead to the good result.
6) Applicable only when mean is defined.
7) Unable to handle noisy data and outliers.
8) It fails for non-linear data set.
2.2.The Fuzzy C Means Clustering Algorithm(FCM)
The fuzzy c-means (FCM) algorithm is one of the most traditional and classical image
segmentation algorithms. The FCM algorithm can be minimized by the following objective
function. Consider a set of unlabeled patterns X, let X={x1,,x2,. ..,xN}, x ∈ Rf, where N is the
number of patterns and f is the dimension of pattern vectors (features). The FCM algorithm focuses

50 Computer Science & Information Technology (CS & IT)
on minimizing the value of an objective function. The objective function measures the quality of
the partitioning that divides a dataset into c clusters. The algorithm is an iterative clustering method
that produces an optimal c partition by minimizing the weighted within group sum of squared error
objective function. Fuzzy c-means (FCM) is a method of clustering which allows one piece of data
to belong to two or more clusters. This method is frequently used in pattern recognition. It is based
on minimization of the following objective function
2
1 1
N Cm
m ij i j
i j
J u x c= =
= −∑ ∑ ,
where m is any real number greater than 1, uij is the degree of membership of xi in the
cluster j, xi is the ith of d-dimensional measured data, cj is the d-dimension center of the cluster, and
||*|| is any norm expressing the similarity between any measured data and the center. Fuzzy
partitioning is carried out through an iterative optimization of the objective function shown above,
with the update of membership uij and the cluster centers cj by
2
1
1
1ij
mci j
k i k
U
x c
x c
−
=
=
−
− ∑
1
1
ij
ij
Nm
i
ij N
m
j
U x
C
U
=
=
=∑
∑
ADVANTAGES
1) FCM gives best result for overlapped data set.
2) It is comparatively better than k-means algorithm.
3) Data point is assigned membership to each cluster center as a result of which data point may
belong to more than one cluster center whereas in the case of k-means algorithm data point
must exclusively belong to one cluster center.
DISADVANTAGES
1) FCM requires a priori specification of the number of clusters.
2) Euclidean distance measures can unequally weight underlying factors.
3) We get the better result with lower value of β but at the expense of more number of
iterations.
2.3.The Kernel Fuzzy C Means Clustering Algorithm(KFCM)
The KFCM algorithm adds kernel information to the traditional fuzzy c-means algorithm and it
overcomes the disadvantage that FCM algorithm can’t handle the small differences between
clusters. . The kernel method maps nonlinearly the input data space into a high dimensional feature

Computer Science & Information Technology (CS & IT) 51
space. The essence of kernel-based methods involves performing an arbitrary non-linear mapping
from the original d-dimensional feature space Rd to a space of higher dimensionality (kernel
space). The kernel space could possibly be of infinite dimensionality. The rationale for going to
higher dimensions is that it may be possible to apply a linear classifier in the kernel space while the
original problem in the feature space could be highly non-linear and not separable linearly . The
kernel method then takes advantage of the fact that dot products in the kernel space can be
expressed by a Mercer kernel K. Thus the distance in the kernel space does not have to be explicitly
computed because it can be replaced by a Mercer kernel function (typically referred to as a kernel
trick). There are two major forms of kernel-based fuzzy clustering. The first one comes with
prototypes constructed in the feature space. These clustering methods will be referred to as
KFCM-F (with F standing for the feature space). In the second category, abbreviated as KFCM-K,
the prototypes are retained in the kernel space and thus the prototypes must be approximated in the
feature space by computing an inverse mapping from kernel space to feature space. The advantage
of the KFCM-F clustering algorithm is that the prototypes reside in the feature space and are
implicitly mapped to the kernel space through the use of the kernel function.
3. GKFCM
Given, the GKFCM partitions X into fuzzy subsets by minimizing the
following objective function
Equation 1 c n
2m
m ik k i
i 1 k 1
J (U,V) U x v= =
= −∑ ∑
Now consider the proposed Gaussian kernel fuzzy c-means (GKFCM) algorithm. Define a
nonlinear map as
Where . X denotes the data space, and F the transformed feature space with higher even
infinite dimension. GKFCM minimizes the following objective function
Equation 2
c n2m
m ik k i
i 1 k 1
J (U,V) U (x ) (v )= =
= φ − φ∑ ∑
Where
Equation 3
2
k i k k i i k i(x ) (v ) K(x , x ) K(v , v ) 2K(x , v )φ − φ = + −
Where is an inner product kernel function. If we adopt the Gaussian
function as a kernel function, i.e.,

52 Computer Science & Information Technology (CS & IT)
, then , according to Eqs. (3), Eqs. (2) Can be
rewritten as
Equation 4
( )1 1
( , ) 2 1 ( , )c n
m
m ik k i
i k
J U V U k x v= =
= −∑ ∑
Minimizing Eqs. (4) under the constraint of , we have
Equation 5
( )
( )
1
1
1
1
1
1/ (1 ( , ))
1/ (1 ( , ))
mk i
ik c
mk i
j
k x vu
k x v
−
−
=
−=
−∑
Equation 6
1
1
( , )
( , )
nm
ik k i k
ki A
m
ik k i
k
U K x v x
V
U K x v
=
=
=∑
∑
Here we just use the Gaussian kernel function for simplicity. If we use other kernel functions, there
will be corresponding modifications in Eqs. (5) and (6).
In fact, Eqs.(3) can be viewed as kernel-induced new metric in the data space, which is defined as
the following
Equation 7
k id(x, y) (x ) (v ) 2(1 k(x, y))= φ − φ = −
CLUSTERING ALGORITHM APPLICATIONS
• Clustering Algorithm can be used in Identifying the Cancerous Data Set.
• Clustering Algorithm can be used in Search Engines.
• Clustering Algorithm can be used in Academics.
• Clustering Algorithm can be used in Wireless Sensor Network ‘s Based Application.
• Clustering Algorithm can be used in Drug Activity Prediction.

Computer Science & Information Technology (CS & IT) 53
4. RESULTS
The experiments and performance evaluation were performed on medical images including a CT
image of the MR image of brain The GKFCM clustering and the pro-posed kernel based fuzzy
level set method were implemented with Matlab R2013a (MathWorks, Natick, MA, USA) in a
Windows 7 System Ultimate. All the experiments were run on a VAIO Precision 340 computer
with Intel i3 and 4GB RAM.
Figure 1 : Original Image
Figure 2 : Cluster 1

54 Computer Science & Information Technology (CS & IT)
Figure 3 : Cluster 2
Figure 4 : Cluster 3
Figure 5 : Cluster 4

Computer Science & Information Technology (CS & IT) 55
5. CONCLUSION
Clustering is one of the efficient techniques in medical and other image segmentation. The primary
advantage of the research work is that it includes the kernel method, the effect of neighbour pixel
information to improve the clustering accuracy of an image, and to overcome the disadvantages of
the known FCM algorithm which is sensitive to the type of noises. The aim of this paper is to
propose a new kernel-based fuzzy level set algorithm for automatic segmentation of medical
images with intensity in homogeneity. It employs Gaussian kernel-based fuzzy clustering as the
initial level set function. It can approximate the boundaries of ROI with parameter estimation
simultaneously well. It provides noise-immunity and preserves image details. It can be useful in
various fields like medical image analysis, such as tumor detection, study of anatomical structure,
and treatment planning
ACKNOWLEDGEMENTS
We thank everyone who helped us in any way.
REFERENCES [1] X. Munoz, J. Freixenet, X. Cufi, and J. Marti, “Strategies for Image Segmentation Combining Region
and Boundary Information,” PatternRecognition Letters, Vol. 24, No. 1, Pp375–392, 2003.
[2] SteliosKrinidis and VassiliosChatzis,” A Robust Fuzzy Local Information C-Means Clustering
Algorithm” , IEEE Transactions on Image Processing, Vol. 19, No. 5, MAY 2010.
[3] Gimiami M, “Mercer kernel based clustering in feature space”, IEEE Transactions on Neural Networks,
Vol. 3, No. 3, Pp780-784, 2002.
[4] Yang Y., Zheng Ch., and Lin P., "Fuzzy c-means Clustering Algorithm with a Novel Penalty Term for
Image Segmentation", Opto-Electronics Review, Vol.13, No.4, Pp.309-315, 2005.
[5] Wu Z, Xie,W.X Yu J.P. “Fuzzy C-means Clustering Algorithm Based on Kernel Method” In:
Proceedings of Fifth International Conference on Computational Intelligence and Multimedia
Applications Pp 49- 56,2003.
[6] Lee Song Yeow, “Spatial Kernel-Based Generalized C mean Clustering for Medical Image
Segmentation”, School of Computer Sciences, University Sainsmalasia, Dec 2010.
[7] Huynh Van Lung and Jong-Myon Kim, "A generalized spatial fuzzy C-means algorithm for Medical
image segmentation", In proc. 18th Int. Conf. on Fuzzy Systems, pp.409-414, 2009.
[8] Deng-Yaun Haung, Ta- Wei Lin, Wu-Chih-Hu,“ Automatic Multilevel Threshold Based on Two Stage
Otsu’s Method With Cluster Determination With Valley Estimation” , ICIC International @ 2011 ISSN
1349-4198, pp. 5631-5644.
[9] Chun-yan Yu, Ying Li, Ai-lian Liu, Jing-hong Liu, “A Novel Modified Kernel Fuzzy C-Means
Clustering Algorithm on Image Segmentation”, IEEE International Conference on Computational
Science and Engineering CSE/I-SPAN/IUCC 2011.
[10] F. Gibou and R. Fedkiw, “A fast hybrid k-means level set algorithm for segmentation,” in Proceedings of
the 4th Annual Hawaii International Conference on Statistics and Mathematics, pp. 281–291, 2002.

56 Computer Science & Information Technology (CS & IT)
[11] T. Saikumar, B. Shashidhar, V. Harshavardhan, and K. S. Rani, “MRI brain image segmentation
algorithm using watershed transform and kernel fuzzy C-means clustering on level set method,”
International Journal on Computer Science and Engineering, vol. 3, pp. 1591–1598, 2011.
[12] G. R. Reddy, K. Ramudu, S. Zaheeruddin, and R. R. Rao, “Image segmentation using kernel fuzzy
c-means clustering on level set method on noisy images,” in Proceedings of the International Conference
on Communications and Signal Processing (ICCSP ’11), pp. 522–526, ind, February 2011.
[13] M. Rastgarpour and J. Shanbehzadeh, “Automatic medical image segmentation by integrating KFCM
clustering and level set based FTC model,” in IAENG Transactions on Electrical Engineering, Special
Issue of the International Multi Conference of Engineers and Computer Scientists World Scientific, vol.
1, pp. 257–270, 2013.
[14] M. Rastgarpour, M. Rastgarpour, S. Alipour, and J. Shanbehzadeh, “Improved fast two cycle by using
KFCM clustering for image segmentation,” in Proceedings of the 7th International Multiconference of
Engineers and Computer Scientists, Lecture Notes in Engineering and Computer Science, pp. 678–682,
Hong Kong, China, 2012.
[15] Jain, Anil K. "Data clustering: 50 years beyond K-means." Pattern recognition letters 31.8 (2010):
651-666.
[16] Lifflander J, E Meneses, H Menon, P Miller, S Krishnamoorthy, and LV Kale. 2014. “Scalable replay
with partial-order dependencies for message-logging fault tolerance.” In Proceedings of the 2014 IEEE
International Conference on Cluster Computing (CLUSTER), pp. 19-28. September 22-26, 2014,
Madrid, Spain. Instituteof Electrical and Electronics Engineers, Piscataway, New Jersey,2014.
[17] Jiang,D.,Tang, C. & Zhang, “A Cluster analysis for gene expression data: A survey”. IEEE Transactions
on Knowledge and Data Engineering 16,1370-1386,2004.
[18] Prim, H.,Eksioglu,B.,Perkins, A, D. & Yuceer, C.”Clustering of high throughput gene expression
data.”Computers & Operation Research 39,3046-3061 ,2012.
[19] Von Luxburg, U.,Williamson, R. C.& Guyon , I.”Clustering : Science or art?” In ICML Unsupervised
and Transfer Learning, 65-80,2012.
[20] Arbelaitz, O.,Gurrutxaga, I.Muguerza, J.Perez, J. M.& Perona, I.”An extensive comparative study of
cluster validity indices” Pattern Recognition 46,243-256,2013
AUTHOR Rehna Kalam born in 1982 is a full time research scholar at Kerala University. She
received the B.Tech degree in Information Technology from Kerala University in 2005
and the M.Tech degree in Computer Science and Engineering from Anna University,
Coimbatore in 2011.Co Authors are Dr Ciza Thomas, Professor, Department of
Electronics Engineering, College of Engineering, Trivandrum and Dr M Abdul
Rahiman, Professor, Department of Computer Science Engineering, LBS Institute of
Technology for Women, Poojappura, Trivandrum.

David C. Wyld et al. (Eds) : CSITY, SIGPRO, AIFZ, NWCOM, DTMN, GRAPHHOC - 2016 pp. 57–74, 2016. © CS & IT-CSCP 2016 DOI : 10.5121/csit.2016.60406
SELECTION OF BEST ALTERNATIVE IN
MANUFACTURING AND SERVICE SECTOR
USING MULTI GRADE DECISION
APPROACH - A REVIEW
Karuppanna Prasad N.1 and Sekar K.2
1Department of Manufacturing Engineering, Pricol India Ltd, Coimbatore, India
[email protected] 2Department of Mechanical Engineering,
National Institute of Technology, Calicut, India [email protected]
ABSTRACT
Modern manufacturing organizations tend to face versatile challenges due to globalization,
modern lifestyle trends and rapid market requirements from both locally and globally placed
competitors. The organizations faces high stress from dual perspective namely enhancement in
science and technology and development of modern strategies. In such an instance,
organizations were in a need of using an effective decision making tool that chooses out optimal
alternative that reduces time, complexity and highly simplified. This paper explores a usage of
new multi criteria decision making tool known as MOORA for selecting the best alternatives by
examining various case study. The study was covered up in two fold manner by comparing
MOORA with other MCDM and MADM approaches to identify its advantage for selecting
optimal alternative, followed by highlighting the scope and gap of using MOORA approach.
Examination on various case study reveals an existence of huge scope in using MOORA for
numerous manufacturing and service applications.
KEYWORDS
MADM, MCDM, MOORA, optimization, manufacturing sector, service sector
1. INTRODUCTION In modern trend, manufacturing organizations tend to face versatile challenges due to globalization, modern lifestyle trends and rapid market requirements from both locally and globally placed competitors [30] [34]. Modern organizations were in a need to improve their overall performance in market and build up a competitive advantage [32]. To improve the overall performance, organization had to deliver enhanced quality products for pacifying the customers [17]. The delivery of embarked quality products was commonly differentiated into three index values such as customer expected level, satisfaction level and achieved level of quality [12]. The improvement in satisfaction level of quality was declined, since many conventional manufacturing units faces high stress from dual perspectives namely enhancement in science and

58 Computer Science & Information Technology (CS & IT)
technology that consequence towards developing of modern strategies and versatile customer requirements [36] [24]. There exist numerous theories, models and approaches that reveal the change in a paradigm shift from craft manufacturing towards mass manufacturing, lean manufacturing and agile manufacturing [36] [35] that reduces the stress from conventional manufacturing units. The change up in a paradigm shift internally had made managers in conventional units to reconsider their decision making ability for selecting the best production system [24]. The concept selection through decision making was an imperative approach that nurtures creative and innovative ideas by thriving towards choosing of optimal alternative [33], based on values, beliefs and perceptions [7] [11]. Decision makers in manufacturing and service sector select an optimal alternative with a set of conflicting objectives through dynamic mind set [15]. All the aforementioned statements reveals, manufacturing and service organization faces a stressful task on decision making due to dynamic decision makers ability for choosing the best alternative. In present days, organizations were in a need of using an effective decision making tool that gives out optimized results from discrete inputs within a shorter period of time with effective decision making ability. The ameliorating emphasize on decision making purely depends on decision makers mantling of onerous circumstances in versatile competitive environment [23] to choose the optimal alternative with conflicting criteria’s. Optimal selection of alternatives based on set of conflicting criteria’s involves optimization a tool that deals with a kind of problem which either maximizes or minimizes the single or multi objectives was a numerical functions of real or integer variables [3]. The optimization in general was broadly classified into single objective optimization (SOO) and multi objective optimization (MOO) problem. The main goal of SOO was to find the best value of objective function for making up an optimal solution by satisfying set of feasible solution [3]. The SOO selects the best alternative by using approaches such as calculus based techniques, enumerative and random techniques involving genetic algorithm (GA) and simulation annealing (SA) [3]. The numerical methods or calculus based methods uses necessary and sufficient conditions for satisfying solution in optimization problem. Numerical methods were further classified into direct and indirect search methods for selecting optimal solution. Enumerative techniques involve each and every point of finite and infinite search space to attain an optimal solution [3]. In many real life problem, we face a circumstance were improvement in one objective leads to impact on another objective basically known as MOO that perform parallel optimizing of two or more conflicting objectives that leads to automation, semi automation in industrial applications [3] [17]. The MOO were applicable in numerous applications such as product and process design, network analysis, finance, aircraft design [3] [17]. The usage of MOO in above said fields along with maintenance optimization was to choose the best responses through nature of information that can be either qualitative or quantitative [1]. The qualitative measurements of input information to quantitative assessment of output falls upon using multi-criteria decision making (MCDM) method like analytical hierarchy process (AHP), game theory and fuzzy sets that are used for identifying the imperative criteria’s and alternatives [26] [7].There exists approaches like elimination and choice translation reality (ELECTRE), preference ranking organization method for enrichment and evaluation (PROMTHEE) that uses quantitative assessment of data by comparing little criteria. The method like decision making trial and evaluation laboratory (DEMATEL) evaluates and creates the casual relationship within the criteria’s [29]. There are also approaches like verbal decision analysis (VDA) that deals with qualitative data assessment to provide qualitative results [7]. In literature’s their avail usage of other approaches for solving MOO problem they are such as aggregating, population based pareto and non pareto approach, vector evaluated genetic algorithm (VEGA), multi objective GA (MOGA), non-dominated GA (MSGA) and niched pareto GA (PGA) [3].

Computer Science & Information Technology (CS & IT) 59
During the second part of twenty century, MCDM method proves to be an emerging area in operational research for identifying the optimal options that impacts multiple of conflicting criteria’s [31]. The MCDM method was broadly classified into multi attribute decision making (MADM) and multi objective decision making (MODM) approach [31]. The MADM approach was the ranking of best alternative with most attractive attributes [8]. Unlike MADM approaches, MODM method designs the best alternative with multiple objectives that depends on continuous decision variables subject to certain constraints [9]. The endemically used MADM approaches for identifying the optimal solutions with discrete alternatives were namely taguchi method, desirability function, response surface methodology (RSM), inner/outer orthogonal array (I/O OA), technique for order preference by similarity to ideal solution(TOPSIS), VIseKriterijumska Optimizacijai kompromisno Resenje in Serbian (VIKOR), complex proportional assessment(COPRAS), grey relational analysis(GRA),multi objective optimization on the basis of ratio analysis (MOORA) that converts MOO problem into SOO [17]. This paper exposes a use of quantitative assessment method namely MOORA that proves to be a foreseen MADM approach over other approaches with high stability, robustness and less computational time for selecting optimal alternative by satisfying set of conflicting criteria. The study on MOORA is explored in two fold manner, initially the MOORA have been compared with aforesaid MCDM and MADM approaches to identify its usability and advantage for selecting optimal alternative. On other side, paper highlights scope and gap of using MOORA approach through intensify examining of case studies in manufacturing and service sector that propel the empirical benefits of MOORA. The hierarchical nomenclature of the study starts with methodology in part-2,literature review on usage of MOORA in manufacturing and servicing sector in part-3,gap assessment in part-4 and conclusion in part-5.
2. METHODOLOGY An endemic theory and pragmatic evaluation on optimization, SOO and MOO approaches were said to be available in different web of knowledge portals and conference proceedings. There avail accessibility of articles related on applicability of optimization, SOO and MOO in manufacturing and service sector on leading elite citation databases namely Taylor and Francis (www.tandfonline.com), Science direct (www.sciencedirect.com), Springer link (www.springerlink.com), control and cybernetics (http://control.ibspan.waw.pl:3000/mainpage), journal of military and information sciences (www.jmisci.com), engineering economics (www.inzeko.ktu.lt/index.php/EE).In the initial stages of surveying articles, the searching starts with journals titled on optimization, SOO and MOO in manufacturing and service sector from year 2000 to present in aforementioned web of knowledge portals. There exist myriad of articles to limit the search by making a shift from optimization, SOO and MOO towards empirical usage of MOORA that reduces the list to 38.In final list of 38 articles the 23 articles uses the MOORA concept by differentiating 11 cases on manufacturing sector and remaining 12 on service sector as shown in Figure 1.

60 Computer Science & Information Technology (CS & IT)
Figure-1. Papers on MOORA in manufacturing and service sector Finalized list of articles are thoroughly overviewed to identify the intensify realization on using MOORA for achieving good manufacturing growth, profit with high stability, robustness and less computational time for selecting optimal alternative with set of conflicting criteria in discrete cases.
3. MULTI OBJECTIVE OPTIMIZATION ON THE BASIS OF RATIO
ANALYSIS (MOORA)
In real time, making up of optimal decision to satisfy the customer proven to be a focal part in manufacturing sector [11]. MOORA a MADM approach was used to attain the best solution among given discrete alternatives with conflicting objectives [17]. In early stages multiplicative form of generating dimensionless numbers were elaborated by Scharling (1985) and Brauers (1997, 1999, 2002 and 2004) with later stages there evolve a usage of ratio analysis approach with respective to dimensionless measure known as MOORA [8]. MOORA a cardinal approach isolates extreme and non-convex points by providing insight to mid-way solution as per economical law of decreasing marginal utility [10]. MOORA was first introduced by Brauers and Zavadaskas in the year 2006[8] [10] [19]. MOORA was proven to be a robustic approach over minkowski, Euclidean distance metric, tchebycheff min max metric [10]. In MOORA, performing of Multi response optimization or MOO was done by satisfying constraints and feasible solution. The MOORA was viewed as a ratio and reference point system [2]. MOORA as an approach satisfies the seven conditions to be looked foreseen over other MADM or MODM techniques [8] [11]. MOORA proves to be a best MADM approach for attaining optimal decisions within less computational time and no usage of extra parameters like v in VIKOR and ξ in GRA method [11] [2]. The MOORA have merits over other MADM approaches as compared and revealed in Table 1. The comparisons illustrate, MOORA chooses best alternative with high simpleness, less computational time and with basic mathematical calculations [2]. The second phase of this review article will elaborately corroborate on empirical benefits of using MOORA with other MADM methods through various case studies in manufacturing and service sector as discussed briefly.

Computer Science & Information Technology (CS & IT) 61
3.1.Literature Review on MOORA Manufacturing sectors are those involving numerous activities from production of a pin to assembling of part types for making up a complex structure. Manufacturing covers mass production, job shop and batch production that are a real wealth for any country in terms of employment and constitute as the back bone for service sector [37].Service sector are those that pacify the daily commercial need of the human being by catering them with high loyalty. The numerous cases for choosing the best alternative from conflicting objectives by using MOORA in manufacturing and service sectors are discussed through intensify realization.
Table-1. Comparison of MOORA with MADM approaches
3.1.1.MOORA in manufacturing sector
[22] Espouses the study on using AHP and MOORA for choosing the best of wire electronic discharge machining (WEDM) process. The study was conducted by using taguchi OA for identifying the best value for multi objective responses material removal rate, kerb width and surface roughness, on other side AHP a best MCDM approach had been used for conducting the weight and consistency for the three aforesaid responses along with usage of multi criteria decision making approach known as MOORA for choosing the best WEDM. The experimentation using OA choses one among best input parameters such as pulse on time, pulse off time, wire feed rate, wire tension, servo voltage and flushing pressure. Evaluation through AHP reveals the subjective weight for the three criteria as w1 =0.5469, w2=0.3445, w3=0.1085 with consistency ratio (CR<0.1). Similarly the usage of MOORA with Taguchi OW reveals the optimal trial as 19 out of 27 trial to give the best of material removal rate, kerb width and surface roughness in WEDM process. [25] Portrays as study on choosing the best non-traditional machining process for the laboratory in national institute of technology-agartala. The cross functional team had been formed that comprises of individuals from NIT for chosing the best non-traditional machine. The team had used two new multi criteria or attribute decision making approach such as MOORA and multi
MADM
method
Computational
Time Simplicity
Mathematical
calculations
required
MOORA very less very simple Minimum AHP very high very critical Maximum
ANP Moderate Moderately critical
Moderate
GRA very high very critical Maximum VIKOR Less Simple Moderate GTA very high very critical Maximum
ELECTRE High Moderately critical
Moderate
DEA very high very critical Maximum
TOPSIS Moderate Moderately critical
Moderate
PROMTHEE High Moderately critical
Moderate
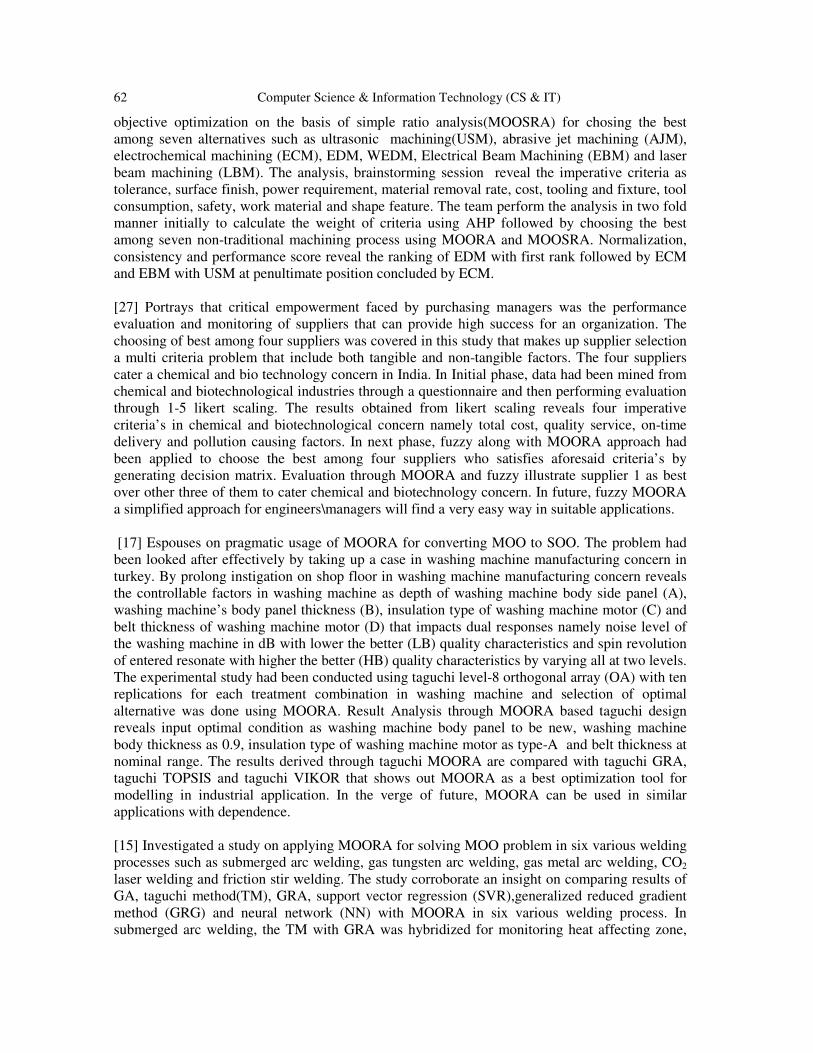
62 Computer Science & Information Technology (CS & IT)
objective optimization on the basis of simple ratio analysis(MOOSRA) for chosing the best among seven alternatives such as ultrasonic machining(USM), abrasive jet machining (AJM), electrochemical machining (ECM), EDM, WEDM, Electrical Beam Machining (EBM) and laser beam machining (LBM). The analysis, brainstorming session reveal the imperative criteria as tolerance, surface finish, power requirement, material removal rate, cost, tooling and fixture, tool consumption, safety, work material and shape feature. The team perform the analysis in two fold manner initially to calculate the weight of criteria using AHP followed by choosing the best among seven non-traditional machining process using MOORA and MOOSRA. Normalization, consistency and performance score reveal the ranking of EDM with first rank followed by ECM and EBM with USM at penultimate position concluded by ECM. [27] Portrays that critical empowerment faced by purchasing managers was the performance evaluation and monitoring of suppliers that can provide high success for an organization. The choosing of best among four suppliers was covered in this study that makes up supplier selection a multi criteria problem that include both tangible and non-tangible factors. The four suppliers cater a chemical and bio technology concern in India. In Initial phase, data had been mined from chemical and biotechnological industries through a questionnaire and then performing evaluation through 1-5 likert scaling. The results obtained from likert scaling reveals four imperative criteria’s in chemical and biotechnological concern namely total cost, quality service, on-time delivery and pollution causing factors. In next phase, fuzzy along with MOORA approach had been applied to choose the best among four suppliers who satisfies aforesaid criteria’s by generating decision matrix. Evaluation through MOORA and fuzzy illustrate supplier 1 as best over other three of them to cater chemical and biotechnology concern. In future, fuzzy MOORA a simplified approach for engineers\managers will find a very easy way in suitable applications. [17] Espouses on pragmatic usage of MOORA for converting MOO to SOO. The problem had been looked after effectively by taking up a case in washing machine manufacturing concern in turkey. By prolong instigation on shop floor in washing machine manufacturing concern reveals the controllable factors in washing machine as depth of washing machine body side panel (A), washing machine’s body panel thickness (B), insulation type of washing machine motor (C) and belt thickness of washing machine motor (D) that impacts dual responses namely noise level of the washing machine in dB with lower the better (LB) quality characteristics and spin revolution of entered resonate with higher the better (HB) quality characteristics by varying all at two levels. The experimental study had been conducted using taguchi level-8 orthogonal array (OA) with ten replications for each treatment combination in washing machine and selection of optimal alternative was done using MOORA. Result Analysis through MOORA based taguchi design reveals input optimal condition as washing machine body panel to be new, washing machine body thickness as 0.9, insulation type of washing machine motor as type-A and belt thickness at nominal range. The results derived through taguchi MOORA are compared with taguchi GRA, taguchi TOPSIS and taguchi VIKOR that shows out MOORA as a best optimization tool for modelling in industrial application. In the verge of future, MOORA can be used in similar applications with dependence. [15] Investigated a study on applying MOORA for solving MOO problem in six various welding processes such as submerged arc welding, gas tungsten arc welding, gas metal arc welding, CO2 laser welding and friction stir welding. The study corroborate an insight on comparing results of GA, taguchi method(TM), GRA, support vector regression (SVR),generalized reduced gradient method (GRG) and neural network (NN) with MOORA in six various welding process. In submerged arc welding, the TM with GRA was hybridized for monitoring heat affecting zone,

Computer Science & Information Technology (CS & IT) 63
bed width, penetration and reinforcement using process input such as slog mix, basicity index and current. The results reveal MOORA gives alike ranking as TM with GRA. Similarly, an experimental study on monitoring front height, front width, back height and back width in gas tungsten arc welding was taken up using TM for getting best weld bead geometry. The optimal condition obtained using TM provide comparable results with MOORA. Study on monitoring ultimate tensile strength (UTS) was done using SVR in gas metal arc welding that provides a reasonable comparable ranking with MOORA. Monitoring of best optimal welding parameters in CO2 laser welding was done using GA and performing generations by NN provides the worthy comparison on ranking with MOORA. Dual studies were done in friction stir welding for monitoring UTS using GRA, whose results were better with MOORA evaluation. The comparison of other MODM approach with MOORA reveals MOORA as a highly flexible, applicable and potential approach in solving complex decision making problems. In future, MOORA method can be used for solving various selection problems in real time manufacturing environment. [2] Illustrate that making up of decision for flexible manufacturing system (FMS) proves to be an intrication of satisfying numerous criteria’s with conflicting attributes. This paper studies out usage of MOORA for performing decision making through sceptical amalgamation of various stratum in production system. The problem on choosing appropriate product design for power electronic device was taken as a case to choose best of ten alternatives by satisfying three different attributes namely manufacturing cost, junction temperature and thermal cycles. The optimal decision on choosing best of ten was done using MOORA. The evaluation through MOORA reveals design 5 and 1 as best that gets correlated with alternative selection already performed using AHP. In similar way, problem on choosing four alternative plant layouts was studied up by considering five performance attributes. The study also makes up a comparison between MOORA and weighed Euclidean distance based approach (WEDBA) that reveals layout design 2 as best and 1 as worst using both approaches. In similar way, choosing of best FMS was studied up by comparing MOORA result with AHP that reveals FMS2 as best with FMS 4 occupies least in performance ranking in both cases. The ranking of best method for performing welding process to join mild steel(0.2% of C) of 6mm thickness was done by considering three welding process namely shield metal arc welding(SMAW), gas tungsten arc welding(GTAW) and gas metal arc welding (GMAW) with six attributes. Optimization analysis through MOORA reveals SMAW as best among three processes with GMAW occupying last position. The study on using MOORA to choose best among twenty suppliers was done by performing evaluation through DEA in agricultural and construction equipment by satisfying five criteria’s. The evaluation illustrate supplier 10 as best among others. In future, MOORA a simple ratio analysis approach with less mathematical calculations have a wide scope of developing using software like C++ language. [18] Conducted a study on selection of material that plays a focal part in design and functioning of products. The study reveals that selection of material can be done in least complicated manner with high applicability, simplicity and accuracy using MOORA, reference point theory and full multiplicative from of MOORA (MULTIMOORA) by looking out four various case studies. In initial case, the choosing of appropriate material for designing a flywheel was done using four criteria’s with ten different materials that was already analyzed through TOPSIS. Analyization reveals material 9 as imperative and 10 as menial. Results obtained through TOPSIS were compared with MOORA, MULTIMOORA and reference point approach that gives out same ranking. In second case, material selection was done for building up a cryogenic storage tank by choosing seven different materials along with seven performance criteria’s for storing nitrogen.

64 Computer Science & Information Technology (CS & IT)
The evaluation made-up through MOORA, reference point and MULTIMOORA reveals material 3 as best and material 2 as worst ranked for building up a cryogenic tank. Third case study chooses a material for a product that was to be operated at high temperature in oxygen rich environment using six various materials and four criteria’s. Analysis through MOORA was compared with MULTIMOORA and reference point approach reveals material 5 as best with material 1 in last position. The final case study uses up a simplified fuzzy logic to choose the best material for sailing boat mast. The study chooses fifteen different materials with five performance criteria’s. Data analysis through fuzzy logic reveals same results as MOORA, MULTIMOORA and reference point by ranking material 15 as best suited material for sailing boat mast. In later days, MOORA, MULTIMOORA and reference point approaches can be applied with other decision making scenario with more criteria’s and alternatives. [28] Espouses that MCDM method provides an opportunity for choosing frequently acceptable alternatives based on conditions that are stated using criteria. There exist numerous MCDM methods such as compromise programming, AHP, TOPSIS, ELECTRE, PROMTHEE, COPRAS, VIKOR and additive ratio assessment (ARAS). This article explores an extension of MOORA method to be used along with triangular fuzzy numbers by integrating with ratio system and reference point system in fuzzy environment. The case was taken up in a mining company that scheduled to start up exploitation of new mine in serbia. The problem faced by mining company was the transportation distance to new mine from existing location for performing grinding that was expensive. To avoid from these problem experts like’s to consider three alternatives of grinding circuit design such as A1,A2 and A3 that should pacify five criteria’s namely grinding efficiency, economic efficiency, technological reliability, capital investment costs and environmental impact. Choosing of best grinding circuit design was done in two fold manner initially by using fuzzy ratio system with MOORA by determining overall fuzzy performance index, de-fuzzyfication and selection of desirable alternatives that reveals grinding circuit design A3 as dominating over A1 and A2.On other side, fuzzy reference point system with MOORA was done for choosing the best design by calculating the distance between fuzzy ratings and reference point that reveals grinding circuit design A3 as dominating in Serbian mining company. In future, MOORA method can be used as a basis for research and authors depending on the problem solved by choosing relevant one. [14] Diligently erudite that decision making process prove to be highly arduous especially in assessing the appropriateness of a project from engineering standpoint. The case covers selecting best of five profitable investment projects that can levy high growth and prosperity for an organization. Selection of projects involves complications that was overcome through newly proposed MOORA method along with standard deviation (SDV) . MOORA a MCDM method was used for choosing the best alternative with conflicting criteria’s whose difference in significance among objectives can be evaluated using SDV. The four important criteria’s chosen for study were net present value (NPV),rate of return(ROR),payback Period(PB) and project risk (PR) in manufacturing organization that can provide profitable investments. Evaluation made-up through MOORA and SDV identifies project 3 as best that provides highest NPV, ROR with lowest PB and PR followed by project 2 and quelled by project 5.In future, MOORA can be combined with other MCDM methods. [11] Illustrate an accustom challenges of global competitiveness in manufacturing organization makes them to spurt over effective decision making ability for identifying and choosing the best alternative. This study acclimatise a new MODM approach namely MOORA for evaluating and choosing six decision making problems in advance manufacturing system (AMS). The initial

Computer Science & Information Technology (CS & IT) 65
selection was made on industrial robot by comparing six various criteria’s. The comparison reveals robot 2 (cybo tech V15) as best and robot 5(PUMA 500/600) occupying the worst ranking. In same implication, the setting up of FMS was done by comparing seven different alternatives such as FMS1 to FMS7 and judging using MOORA reveals alternative FMS7 as best with alternative FMS8 occupying last position. In similar way, MOORA had been used for selecting best machine tool, non traditional machining (NTM) process, rapid prototyping (RP) process, computerized numerical control (CNC) and automated inspection system to obtain the best AMS. In future, MOORA has a huge scope of applying with wide range of problems in real time manufacturing environment. [16] Espouses milling operation was a pure metal cutting process done using a rotary cutter. The productivity and competitiveness of economical usage in machining operations plays a salient role by selecting best cutting parameters in process planning of metal parts. The six different decision making problems in milling process was chosen as a case by using a potential, flexible and applicable MOORA method. The first case uses MOORA evaluation in side milling process to identify the optimal process parameters such as cutting speed, feed rate, axial depth of cut, radial depth of cut for controlling material removal rate (MRR). The evaluation was already done using grey-fuzzy and graph theory matrix analysis (GTMA) that makes up a comparable ranking with MOORA method. Similarly, MOORA was used along with grey-taguchi, TM to evaluate the best process parameters for controlling average surface roughness, average tool life in end milling, side milling, end milling, face milling and milling process. The comparability study on six various decision making problems tangibly illustrate MOORA as highly stable, simple and easy to implement decision making approach with less mathematical calculations. Thus provides the applicability, potentiality and flexibility of using MOORA in milling process.
3.1.2. MOORA in service sector
[13] Concentrate on assessing the performance of Indian technical education system. In modern era, the technical education system faces an onerous task due to liberalization and globalization of Indian economy. The study had been conducted to assess the performance of seven Indian institute of technology (IIT) such as Kharagpur, Bombay, Madras, Kanpur, Delhi, Guwahati and Roorkee. Evaluation parameters to assess the performance of aforesaid IIT had been chosen as faculty strength, student intake, number of Ph.D. awarded, number of patents applied, campus area in acres and tuition fees per semester. Evaluation was done using a nuance multi criteria analysis based performance evaluation known as subjective and objective weight integrated approach (SOWIA) and MOORA, the SOWIA approach had been used for calculating integrated, objective and subjective weights of each criteria for assessing the IIT with MOORA used for ranking the optimal OOT with effective criterion ranking. Usage of SOWIA and MOORA reveals IIT- Kharagpur as best among other six IIT in India. The robustness of obtained output had been assessed using sensitivity analysis and comparison was made with AHP-COPRAS using non parametric spearman test of relationship (rs) and Kendall’s Tau Test (Z) reveals the result as alike obtained from SOWIA-MOORA approach. [21] Espouses a study in special education and rehabilitation centre that were introduced for individuals to create a cosy living environment for nurturing their skills by achieving self reliance. The case was taken up by tapping three different special education and rehabilitation centre namely nida, parilti and ilgim in turkey. The best of choosing mentioned three rehabilitation centres was done by satisfying six various criteria’s such as education, ergonomics, compliance of corporation building, cost, publication with prestige and assessment of personal

66 Computer Science & Information Technology (CS & IT)
prestige. Initially, the weights of criteria were evaluated using triangular fuzzy numbers with AHP followed by choosing a best rehabilitation centre out of three was evaluated using MOORA and MULTIMOORA. Calculation results through MOORA and MULTIMOORA reveals nida as best special education and rehabilitation centre followed by ilgim and parilti. In future, same case can be analysed using grey numbers with subsequent comparison over other MCDM method. [38] Erudite, alternative design solutions for building can be successful by applying MCDM methods with number of quantitative and qualitative criteria’s. The main objective of current research work was to test the reliability of previously proposed methods such as weighed aggregated sum product assessment (WASPAS), orthogonal experimental design (OED), ARAS and multi objective particle swarm optimization algorithm (MOPSO).The case covers the selection of best design for facades in public or commercial buildings. The four building facades were chosen namely cellular concrete masonry covered by Rockwell plates and decorative plaster surface, sandwich facade panels, gas silicate masonry with Rockwell, minerit façade plates and aluminium gazing facades. Evaluation was done initially through WASPAS by varying λ value from 0 to 1 for monitoring the robustness of chosen optimal facade in building design that reveals sandwich facade panels as best in the range of varying λ from 0 to 0.4 and aluminium gazing facade being good with varying λ from 0.5 to 1.Comparable manipulation through MOORA’s ratio, reference point and MULTIMOORA approach reveals “sandwich” panel as best for public façade. [31] Espouses decision making was the searching of optimal alternatives from available feasible solutions. In real time, findings of optimal alternative effects the versatile conflicting criteria’s for judging the decisions which are commonly known as MCDM approach. This paper explores an extension of MOORA, reference point and ratio analysis approach by integrating with interval grey number. Initially, MOORA had been used along with interval grey numbers followed by simultaneous usage of crisp and interval grey numbers and finally with interval grey numbers and whitening coefficient. MOORA also had been compared with simple additive weightage (SAW), TOPSIS, VIKOR and COPRAS. In first case, the optimal alternatives were evaluated using COPRAS compared with MOORA and interval grey numbers that show up both the rankings are alike. The second case takes up a comparison of MOORA with crisp and interval grey numbers along with SAW Grey analysis (SAW-G) by performing normalization, optimization that reveals par in ranking. In third case, MOORA was applied with interval grey numbers to eliminate the uncertainty by comparing with COPRAS Grey analysis (COPRAS-G) that gives out comparable ranking in decision makers pessimistic, optimistic and moderate mind set. The conclusion made up overall is, usage of MOORA with extensive measures provide simple and effective solution for real world problems. [5] Portrays, a country is a group of regions that contributes towards GDP by producing a value added products. The Vilnius gediminas technical university takes up a study on mapping out multiple criteria’s for sustainable development in cities and countries of Lithuania .The study on regional sustainable development in Lithuania cities were done by selecting ten Lithuania cities such as vilinus,klaipeda,Kaunas,telsiai,utena,alytus,panevezys,siauliai,marijampole and taurage. Regional development through GDP contribution on each region’s was identified by selecting sixteen various attributes that rove to be focal. Study uses MOORA over other MADM and MODM approaches, since MOORA was a well-being, cardinal approach that puts up customer sovereignty as an emphasize goal. MOORA chooses best of Ten Lithuania Cities through effective contribution for well-being economy that can provide good material wealth, health, education, all kind of security and concerning the environment. The evaluation through

Computer Science & Information Technology (CS & IT) 67
normalization, optimization and importance leaves Vilnius, Klaipeda and Kaunas as good wellbeing districts with telsiai, taurage and Siauliai occupies poorer position. The paper also shows out an effective project that can be tapped in industrialization and construction, commerce and tourism, labour drain to improve the GDP in Lithuanian country. In future, commercialization and industrialization on Lithuanian cities with decline labour drain over abroad would isolate vulnerability in well-being of inhabitants. [19] Illustrate that pragmatic usage of building design was to acclimatize towards ameliorated and embody living environment conditions with a cosy surrounding by controlling energy losses in building. Heat energy losses in building can be controlled to a large extent by properly selecting external wall and window. This study investigate the selection of six various wall and window for building design such as A1, A2, A3, A4, A5 and A6 on four directions by satisfying seven various criteria such as heat loss through building wall, building windows, bearer thermal bridges, above rated air infiltration, external heat inflows in the building, total heat consumption with external walls and window price ratio. The criteria’s representing heat losses were non-beneficial with heat flow and price ratio being beneficial. Mathematical manipulation through MOORA, MULTIMOORA and reference point theory reveals A2 reduces heat energy losses in building followed by A6 or A3 with A1, A4 and A5 was isolated by decision makers. The MOORA and MULTIMOORA theoretical model proven to be effective in real life situation can be successfully applied in solving utility problem in other sectors. [4] Portrays in a broader sense that transition economies are making up of transition from plan to market. In 1990, countries of Soviet Union and central with Eastern Europe eradicate central planning, liberalized taxation, banking, customers and independent central banking. This study espouse on project management that are commonly used in a market economy. Project management predicts project for analyization that will make up a new economic activity by renovating existing economic activity. Project management involves combination of both micro and macro-economic objectives by selecting a case with multiple objectives in Wuhan, Hubei provenance, china. The empirical problem with Wuhan was to set up an inland seaport, since Wuhan was proximally located 1000 km inland. Choosing a best of three projects for setting up an inland port in Wuhan was a MOO problem that was verified using MOORA ratio system, reference point system, multiplicative form and MULTIMOORA. The chosen micro and macro-economic criteria’s for project selection in this case were such as NPV, internal rate of return (IRR),PB, government income, Employment, value added (VA), risk, balance payment and investment. Technical evaluation through MOORA, multiplicative form and MULTIMOORA reveals project A as good for earning government income with project C increasing employment and project B occupies penultimate position. [6] Reveal definition of robustness in econometrics was an error term in a linear equation that was broadened from a cardinal to qualitative one. The error term in linear equation was initiated by origin for robustness in econometrics. On other side, robustness was connected with residual terms, slack, dummy variables and outliers. The significance of robustness were explained in three fold ways first by considering robustness in cardinal scales, second by indicating the robustness as either vogue or arbitrary and finally by completeness in statistical universe with events and opinions. These interpretations are experimented by taking up a case in facility sector in Lithuania. Facility sectors are those performing servicing operations like acquisition, leasing, renting, managing, supervision, maintenance and repairing of existing buildings in private dwellings of Vilnius, capital of Lithuania. The study was done by selecting 15 largest maintenance contractors for performing facility operation in private dwellings of Vilnius by

68 Computer Science & Information Technology (CS & IT)
having intensified discussion with a panel of 30 random dwelling owners in Vilnius. The panel suggests twenty criteria’s for maintaining and choosing contractors in which eleven were expressed with rejection by choosing other nine criteria for study. Evaluation through MOORA and reference point approach ranks contractor 6 as first for size and experience with second for effectiveness followed by contractor 10 in second position for effectiveness and size succeeded by contractor 1 and contractor 4.A newer research based on newer data, larger samples and large number of quantifiable objective will increase the robustness of outcome. [8] Illustrate that construction projects were reliable venture with peculiar features such as long period, tedious process and changing environment.The study narrowly focus on choosing best contractor, who plays a focal part in customer sovereignty of construction in building’s. The choosing of best contractor was a multi criteria problem that should satisfy eligible criteria in dwellings of Vilnius, capital of Lithuania. This study chooses up the best contractor by using a new MODM approach namely MOORA in two fold manner initially through ratio and then using reference point analysis by making up a decision matrix for selecting best among fifteen contractors who satisfy aforementioned eligible criteria’s. Manipulation through MOORA ratio analysis and reference point theory reveals contractor six as first for size, experience and second on effectiveness followed by contractor ten ranked first for effectiveness and second for size. Ranking on contractors reveals that neither of chosen contractors was cost effective. In later days, a newer research can be done with newer data, large samples and large number of quantified objectives using MOORA. [7] Erudite that decision making proves to be an imperative part of human brain were values, belief and perceptions urge it to be successful. The case study maps out choosing of best road design in expanding a highway of Thuringia, Germany from 4 to 6 lanes using a MODM approach namely MOORA. The MOORA a MODM technique was used for making up the comparison between six various types of road design such as concrete surfacing with changing axis and gradient, asphalt concrete surfacing by changing axis and retaining gradient, concrete surfacing with changing axis and retaining gradient, asphalt concrete surfacing by changing axis and gradient, concrete surfacing with retaining axis and gradient and asphalt concrete surface with axis and retaining radiant. The five performance criteria's chosen for road selection were such as longevity, cost price, environment protection, economic validity and construction duration. Numerical manipulation, optimization and imperativeness through MOORA identifies the auspicious condition for laying road can be done by changing the axis and retaining the gradient of highway with concrete surfacing in Thuringia, Germany. The proposed model leaves a path to apply the MOORA a sceptical ratio analysis approach for solving similar utility problems in construction sector. [20] Espouse that demand for purchasing newly build houses or apartments are growing high day in day out. During purchasing of houses, customers do pay high attention towards price, maintenance cost, living space, location Etc., by ignoring inner climate in houses. A cosy inner climate will eradicate propagating of bacteria’s within the room along with controlling of vapour condensing and moulding. This article takes up a study to analyse the inner climate in five storied house in naujoji, Vilnia. The assessment of inner climate in ten living rooms of a five storied house was done by looking out six important criteria’s such as air turnover ratio, air humidity, air temperature, illumination intensity, air flow rate and dew point. The data on each afore said criteria’s for ten living rooms were obtained using metrel equipment MJ6201EU with calibrated certificate. Calculations were performed using MOORA, initially by making up decision matrix followed by normalizing, determining complex rationality and ranking that leaves out living room
Computer Science & Information Technology (CS & IT) 69
7 as best with good air turnover ratio, air humidity, air temperature, illumination intensity with less air flow rate and dew point in five storied building. In future, the data obtained using MOORA method may be used in determining the market value of flats or apartments. [10] Identifies a transition economy as previous accumulated economies of central and eastern Europe or Asia that were transpired into controlled market economies. This paper narrowly tailors on privatization in transition economy were the government or state enterprises are turned over into private owners. The salient goal of the study was to optimize privatization process in transition economy to increase the effectiveness of internal return rate (IRR), productivity and declining of payback period from management side. On other side, a study contribute on increasing macro economical attributes namely maximum of investments, employment and influence of current balance payment for assessing the privatization in transition economy. The article initially covers the comparison of MOORA with other reference point approaches like rank correlation, minkowski metric (1986), tchebycheff metric (1821-1894), Euclidean distance metric with additive weightage, TOPSIS. The comparison reveals MOORA gives priority to the mid way solutions by ranking it first within the convex zone over other approaches. The mentioned context urges to use MOORA with well being economy of transition in Lithuania, which gives customer sovereignty as highest preference attributes over productivity. The study was conducted by selecting three various projects such as project A,B and C to reveal the difference in ranking between MOORA and reference point approach that selects project A and B as first. The conclusion was made-up with contradicted results from two approaches by having Project A and C first rank for four objectives with no first rank for project B. The herewith comparison on three projects culminate that project A and C would dominate B at four dominating positions to give preference for obtaining better mid way solutions as per economic law of decreasing marginal utility. In later days, a newer research can be done with newer data, large samples and large number of quantified objectives.
4. GAP ASSESSMENT The study conducted by various scholars in manufacturing and service sector illustrate, organization faces accustom challenges due to ineffective decision making that deteriorates priority and worthiness of decision makers. To overcome such a situation, organizations needs an aid of effective decision making tool that involves creative development and identification of options, clarity in judgement, firmness of decision and effective implementation that all can be done using MOORA. MOORA a pure cardinal approach was used effectively for solving real-time complex decision making problem in eleven cases of manufacturing and twelve cases of service sector as shown in Table 2 and Table 3.MOORA with such an empirical benefit have a wide scope of applicability in other manufacturing and service sector such as product and process design, network analysis, aircraft design, automobile design, thermal power plant, nuclear power plant, chemical industry, cement industry, hospitals, banks, schools, finance Etc. The usage of MOORA will allow decision makers to choose the best alternative within less computational time, high stability and reduce cost.
5. CONCLUSIONS In this article, analysis on MOORA a MADM approach was done through various case studies in manufacturing and service sector that corroborate a usage of MOORA in two fold manner

70 Computer Science & Information Technology (CS & IT)
• MOORA was compared with other endemically used MADM approaches that reveal, MOORA chooses best alternative with high simpleness, less computational time and basic mathematical calculations along with no usage of extra parameters like v in VIKOR and ξ in GRA method.
• In the second phase, intensified realization through sparse cases available in using
MOORA was studied out to illustrate the imperative benefits and scope of applicability for solving real time empirical problems.
In future span, providing extension for MOORA,MOOSRA and MULTIMOORA (Multiplicative form of MOORA) using interval grey numbers and fuzzy have an wide scope in manufacturing and service sectors to eradicate vagueness, imprecision in decision maker subjectivity for choosing the best alternative with conflicting criteria.
REFERENCES [1] Asekun & Fourie, (2015) “Selection of a decision model for rolling stock maintenance scheduling”,
South African Journal of Industrial Engineering,Vol.26,No.1,pp 135-149. [2] Attri & Grover,(2013) “Decision making over the production system life cycle:MOORA method”,
International journal System Assurance Engineering Management, Vol.5,No.3,pp 320–328. [3] Bandyopadhyay & Saha,(2013) “Unsupervised Classification”, Springer-verlag Berlin Heidelberg
New York Dordreeht London. [4] Brauers & Zavadskas, (2010) “Project management by multimoora as an instrument for transition
economies”, Technological and Economical Development of. Econonomy,Vol. 16,No.1,pp 5–24. [5] Brauers, Ginevicius & Podvezko, (2010) “Regional development in Lithuania considering multiple
objectives by the MOORA method”, Technological and Economical Development of. Econonomy, Vol.16,No.4,pp 613–640.
[6] Brauers & Zavadskas, (2009) “Robustness of the multi‐objective MOORA method with a test for the facilities sector”, Technological and Economic Development of. Econonomy, Vol.15, No.2, pp 352–375.
[7] Brauers, Zavadaskas, Peldschus & Turskis, (2008) “Multi-objective optimization of road design alternatives with an application of the MOORA method”, The 25th International Symposium on Automation and Robotics in Construction, pp 541–548.
[8] Brauers, Zavadskas, Turskis & Vilutiene, (2008) “Multi‐objective contractor’s ranking by applying the MOORA method”, Journal of Business Economics and Management Vol.9, No.4, pp 245–255.
[9] Bernroider & Stix, (2007) “A method using weight restrections in data envelopment analysis for ranking and validity issues in decision making”, Procedia Engineering, Vol. 34, pp 2637–2647.
[10] Brauers & Zavadskas, (2006) “The MOORA method and its application to privatization in a transition economy”, Control and Cybernetics, Vol. 35, No.2, pp 445–469.
[11] Chakraborty,(2011) “Applications of the MOORA method for decision making in manufacturing environment”, International Journal of Advanced Manufacturing Technolog, Vol.54, No.9–12, pp 1155–1166.
[12] Chen, Chang & Huang, (2009) “Applying six-sigma methodology in the Kano quality model: An example of the stationery industry”, Total Quality Management and Business Excellence, Vol.20, No.2, pp 153-170.
[13] Das, Sarkar and Ray, (2015) “On the performance of indian technical institutions: a combined SOWIA-MOORA approach”, OPSEARCH.
[14] El-Santawy & Ahmed, (2012) “Analysis of project selection by using SDV-MOORA Approach”, Life science Journal, Vol.9, No.2, pp 129–131.

Computer Science & Information Technology (CS & IT) 71
[15] Gadakh, Shinde & Khemnar, (2013) “Optimization of welding process parameters using MOORA method”, International Journal of Advanced Manufacturing Technology, Vol.69,No.9–12,pp 2031–2039.
[16] Gadakh, (2011) “Application of MOORA method for parametric optimization of milling process”, International Journal of Applied Engineering Research, Vol.1, No.4, pp 743–758.
[17] İç & Yıldırım,(2013) “MOORA-based Taguchi optimisation for improving product or process quality”, International journal of Production Reserach, Vol.51, No.11, pp 3321–3341.
[18] Karande & Chakraborty, (2012) “Application of multi-objective optimization on the basis of ratio analysis (MOORA) method for materials selection”, Material and Design, Vol. 37, pp 317–324.
[19] Kracka, Brauers & Zavadaskas, (2010) “Ranking Heating Losses in a Building by Applying the MULTIMOORA”, Engineering Economic, Vol.21, No.4, pp 352–359.
[20] Kalibatas & Turskis, (2008) “Multicriteria evaluation of inner climate by using MOORA method”, Information Technology and Control, Vol.37, No. 1, pp 79–83.
[21] Özçelik, Ayodgan & Gencer, (2014) “A Hybrid Moora-Fuzzy Algorithm For Special Education and Rehabilitation Center Selection”, Journal of Miltary and Information Science, Vol.2, No.3, pp 53–61.
[22] Patel and Maniya (2015) “Application of AHP/MOORA method to select wire cute electrical discharge machining process parameter to cut EN31 alloys steel with brasswire”, Material Today: Proceedings, Vol 2, pp 2496-2503.
[23] Pieterse, Grobbelaar & Visser, (2014) “Evaluating the Ability of Decision Makers to Estimate Risks Effectively in Industrial Applications”, South African Journal of Industrial Engineering, Vol.25, No.3, pp 9-24.
[24] Roghanian & Alipour, (2014) “A fuzzy model for achieving lean attributes for competitive advantages development using AHP-QFD-PROMTHEE”, Journal of Industrial Engineering International, Vol.68, No.10, pp 1-11.
[25] Sarkar, Panja, Das and Sarkar (2015) “Developing an efficient decision support system for non-traditional machine selection: an application of MOORA and MOOSRA”, Production and Manufacturing Research, Vol.3, No.1, pp 324-342.
[26] Shumon & Ahmed, (2015) “Multi criteria model for selection of collection system in reverse logistics: A case for end of life lelectronic products”, International Journal of Industrial Engineering:Theory,Applications and Practise, Vol.22, No.2.
[27] Seema Kaur & Kumar, (2014) “Designing a mathematical model using fuzzy based MOORA method for supplier selection”, International Journal of Advanced Engineering Technology, pp 16-24.
[28] Stanujkic, (2013) “An extension of the MOORA method for solving fuzzy decision making problems”, Technological and Economic Development of Econonomy, Vol.19, No.1, pp S228–S255.
[29] Shieh, Chen & Wu, (2013) “A case study of applying fuzzy dematel method to evaluate performance criteria of employment service outreach program”, International Journal of Industrial Engineering:Theory,Applications and Practise, Vol.20, No.9-10.
[30] Samvedi, Jain & Chan, (2013) “An integrated approach for machine tool selection using fuzzy analyticl hierarchy process and grey relational analysis”, International Journal of Production Research, Vol.50, No.12, pp 3211-3221.
[31] Stanujkic, Magdalinovic, Jovanovic and Stojanovic, (2012) “An objective multi-criteria approach to optimization using MOORA method and interval grey numbers”, Technological and Economic Development of Econonomy, Vol.18, No.2, pp 331–363.
[32] Vinodh, Prasanna & Prakash,(2014) “Integrated Fuzzy AHP-TOPSIS for selecting the best plastic recycling method: A case study”, Applied Mathematical Modelling, Vol.38, No.19-20, pp 4662-4672.
[33] Vinodh, Gautham, Ramiya & Rajanayagam, (2010) "Application of fuzzy analytic network process for agile concept selection in a manufacturing organisation", International journal of Production Reserach.,Vol.48, No.24, pp 7243–7264.
[34] Vinodh, Shivraman & Viswesh, (2012) "AHP-based lean concept selection in a manufacturing organization", Journal of Manufacturing Technology Management, Vol.23, No.1, pp 124–136.
[35] Vinodh & Balaji, (2011) “Fuzzy logic based leanness assessment and its decision support system”, International Journal of Production Research, Vol. 49, No.13, pp 4027-4041.

72 Computer Science & Information Technology (CS & IT)
[36] Vinodh, Devadasan & Reddy, (2010) “Agility index measurement using multi grade fuzzy approach integrated in an 20 criteria agile model”, International Journal of Production Research, Vol.48, No.23, pp 7159-7176.
[37] Viswanadham & Narahari, (2009) “Performance modelling of automated manufacturing systems”, Prentice Hall, Englewood Cliffs, New Jersey 07632.
[38] Zavadskas, Antucheviciene, Saparauskas & Turskis, (2013) “Multi-criteria assessment of facades alternatives: Peculiarities of ranking methodology”, Procedia Engineering, Vol.57, pp 107–112.
Table-2. MOORA applications in manufacturing sector.
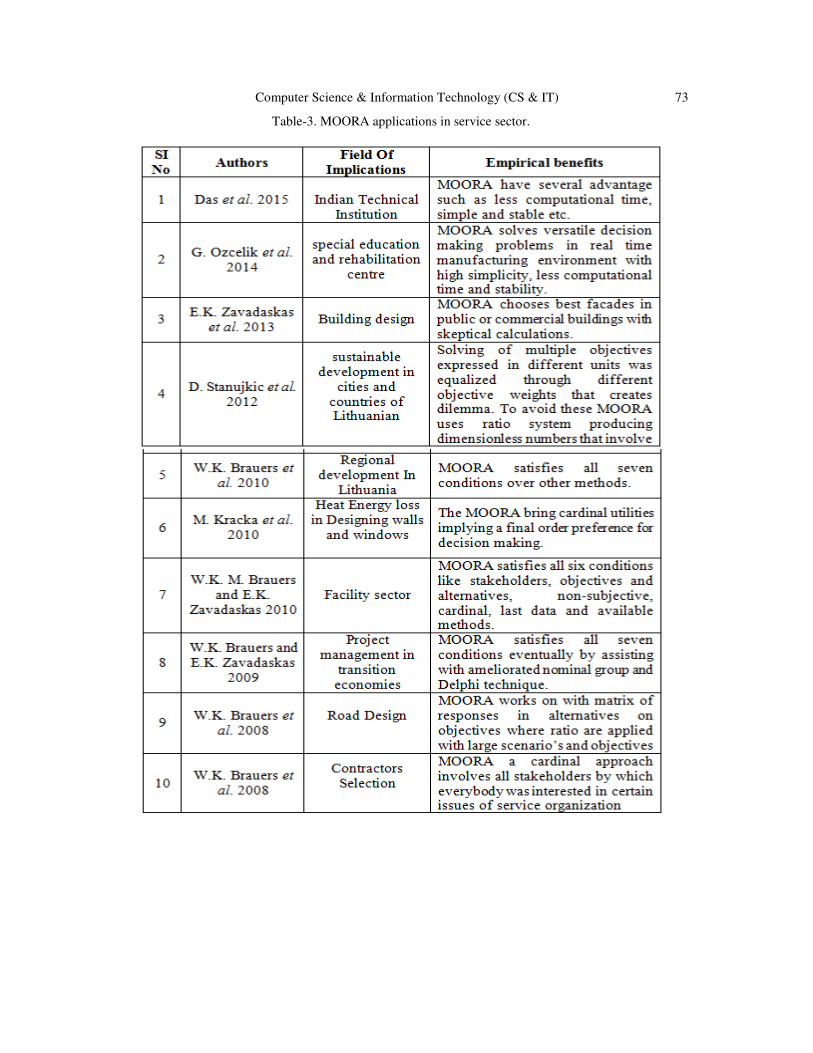
Computer Science & Information Technology (CS & IT) 73
Table-3. MOORA applications in service sector.

74 Computer Science & Information Technology (CS & IT)
AUTHORS
N.Karuppanna Prasad did his M.E from Anna University of Tiruchirapalli and B.E from Anna university of Chennai. He is presently working as a senior engineer in centralized manufacturing engineering department of pricol india Ltd. He Works as an industrial engineer for 4.5 years in the field of Industrial Engineering. His research areas were optimization, quality control, supply chain management.
K.Sekar is an Assistant Professor of Mechanical Engineering Department in National Institute of Technology (NIT) – Calicut, Kerala, India. He had done his PhD at Mechanical Engineering Department in NIT, Calicut, M.E in Manufacturing Engineering Department at Government College of Technology (GCT), Coimbatore and B.Tech from Production Engineering Department at Madras Institute of Technology (MIT), Anna University-Chennai. He had 2 years of industrial experience and 13 years of teaching experience. His research areas were Manufacturing, Materials, Optimization, Metal Casting, welding and Industrial Automation.

David C. Wyld et al. (Eds) : CSITY, SIGPRO, AIFZ, NWCOM, DTMN, GRAPHHOC - 2016
pp. 75–88, 2016. © CS & IT-CSCP 2016 DOI : 10.5121/csit.2016.60407
OCR-THE 3 LAYERED APPROACH FOR
CLASSIFICATION AND IDENTIFICATION OF TELUGU HAND WRITTEN MIXED
CONSONANTS AND CONJUNCT CONSONANTS BY USING ADVANCED
FUZZY LOGIC CONTROLLER
Dr.B.Rama and Santosh Kumar Henge
Department of Computer Science, Kakatiya University, Warangal, India
[email protected], [email protected]
ABSTRACT Optical Character recognition is the method of digitalization of hand and type written or
printed text into machine-encoded form and is superfluity of the various applications of envision
of human’s life. In present human life OCR has been successfully using in finance, legal,
banking, health care and home need appliances. India is a multi cultural, literature and
traditional scripted country. Telugu is the southern Indian language, it is a syllabic language,
symbol script represents a complete syllable and formed with the conjunct mixed consonants in
their representation. Recognition of mixed conjunct consonants is critical than the normal
consonants, because of their variation in written strokes, conjunct maxing with pre and post
level of consonants. This paper proposes the layered approach methodology to recognize the
characters, conjunct consonants, mixed- conjunct consonants and expressed the efficient
classification of the hand written and printed conjunct consonants. This paper implements the
Advanced Fuzzy Logic system controller to take the text in the form of written or printed,
collected the text images from the scanned file, digital camera, Processing the Image with
Examine the high intensity of images based on the quality ration, Extract the image characters
depends on the quality then check the character orientation and alignment then to check the
character thickness, base and print ration. The input image characters can classify into the two
ways, first way represents the normal consonants and the second way represents conjunct
consonants. Digitalized image text divided into three layers, the middle layer represents normal
consonants and the top and bottom layer represents mixed conjunct consonants. Here
recognition process starts from middle layer, and then it continues to check the top and bottom
layers. The recognition process treat as conjunct consonants when it can detect any symbolic
characters in top and bottom layers of present base character otherwise treats as normal
consonants. The post processing technique applied to all three layered characters. Post
processing of the image: concentrated on the image text readability and compatibility, if the
readability is not process then repeat the process again. In this recognition process includes
slant correction, thinning, normalization, segmentation, feature extraction and classification. In
the process of development of the algorithm the pre-processing, segmentation, character
recognition and post-processing modules were discussed. The main objectives to the
development of this paper are: To develop the classification, identification of deference
prototyping for written and printed consonants, conjunct consonants and symbols based on 3
layered approaches with different measurable area by using fuzzy logic and to determine
suitable features for handwritten character recognition.
76 Computer Science & Information Technology (CS & IT)
KEYWORDS Optical Character Recognition (OCR), TopMiddleBottom Layer (TMBL) layer,
BottomMiddleTop Layer (BMTL), Hand written and printed character recognition (HWPCR),
Artificial Neural Network (ANN).
1. INTRODUCTION
Optical Character Recognition is the method of digitalization of hand and type written or printed
text into machine-encoded form. OCR is the most active invention research area in the field of
image processing, character and pattern recognition. In present life OCR has been successfully
using in finance, legal, banking, health care and home need appliances. Character Recognition
classified into two ways, online and offline. Online character and pattern recognition method is
finer to their off mode counterparts in recognition of hand written characters due to the temporal
information available with the formal information. In Off-Line mode character recognition, the
written or printed document can be scanned as an image then it can be digitized then converted it
into machine readable form with different character reorganization algorithmic methodology.
Off-Line mode character recognition process is an active and effective research area towards to
development of new innovations, ideas and techniques that would improve recognition accuracy.
The OCR consists the different levels of processing methods like as Image Pre Acquisition,
Acquisition, Pre-processing, Segmentation, Post processing, Feature Extraction and
Classification. India is a multi cultural, literature and traditional scripted country. 18 official
scripted languages are formed and have many local regional languages in India. Telugu is the
official language of the southern Indian states of Telangana and Andhra Pradesh. Telugu is also
spoken in all over in Malaysia, Bahrain, Oman, Singapore, Fiji, UAE and Mauritius. Officially,
there are 10 numerals, 18 vowels, 36 consonants, and three dual symbols. Telugu is the Dravidian
composed language and it is the third most popular script in India. The Telugu script is closely
related to the Kannada script. In OCR, captured or scanned input image is active from number of
stages like Image Acquisition, pre-processing, processing, post-processing, segmentation, feature
extraction and classification to perform Optical Character Recognition. Scanned Images or
captured photographs taken as input for the OCR system in Image Acquisition stage. Pre-
processing is important and necessary to convert the raw data to correct deficiencies in the data
acquisition process due to limitations of the capturing device sensor. Pre-processing stage step
involves detect text stroke rate, binarization, normalization, noise removal and so on.
Segmentation is the process of dividing the individual cum grouped characters, separating line
spaces, words and mixed characters from scanned image. Feature extraction explores the exact
identification of the characters, can be considered as finding a set of features that define the shape
of the underlying character as precisely and uniquely as possible.
2. EARLIER WORK WITH OPTICAL CHARACTER RECOGNITION
ALGORITHMS
In the past and present invasion of OCR, many algorithms are designed for different ways of
character recognition processes such as Template Matching, Statistical Algorithm, Structural
Algorithm, Neural Network Algorithm and Support Vector Machine. Template Matching
Algorithm proposed only for the recognition of the typewritten characters. The Statistical
Algorithm, Structural Algorithm, Neural Network Algorithm and Support Vector Machine
proposed for recognition of both type and handwritten characters. Each algorithmic methodology
carries both advantages and disadvantages.

Computer Science & Information Technology (CS & IT) 77
2.1 Neural Network Algorithm
An Artificial Neural Network is an innovative methodology for information processing. ANN is
inspired by the biological nervous system, such as the main system act like as brain and its inter-
connected nerve process data. ANN composes huge number of inter-connected neurons for
processing data cum elements working in harmony to solve the problems [25]. A neural network
is a powerful data modelling tool that is able to capture and represent complex input/output
relationships. Neural network algorithm activated and identifies the characters by boosting and
worm-up of trained neuron of the neural network. Feed forward Neural Network, Feedback
neural network and Self Organizing Map are the types of neural network. Neural network
algorithm especially works for new characters can be found when it can middle of recognition
process, and also it is a suitable.
2.2 Support Vector Machine
The Support Vector Machine (SVM) is a related to support vector networks and set of supervised
learning methods used for classification. Support vector machine algorithm activated and
discover the characters by scrutinise and mapping the given input information on with high
priority dimensional future apace and it can be determine a dividing hyper plane with maximum
and minimum margin data. SVM is robust, accurate and very effective even though when the
training samples and models are less and it can perform good result without adding prior data sets
and feed information.
2.3 Structural Algorithm
The initial idea behind the creation of structural algorithms is the recursive description of a
complex pattern in terms of simpler patterns based on the size and shape of the object [23]. This
structural algorithm activated and identifies by recognize compound component of the character.
Structural algorithm classifies the input patterns on the basis of components of the characters and
the relationship among these components. Firstly the primitives of the character are identified
and then strings of the primitives are checked on the basis of pre-decided rules [00]. Structural
pattern recognition is intuitively appealing because in addition to classification, this approach also
provides a description of how the given path constructed from the primitives: [24]. Generally a
character is represented as a production rules structure, whose left-hand side represents character
labels and whose right-hand side represents string of primitives. The right-hand side of rules is
compared to the string of primitives extracted from a word. So classifying a character means
finding a path to a leaf: [22]. This algorithm mainly uses the structural shape pattern of the
objects.
2.4 Statistical Algorithm
The purpose of the Statistical Algorithm is to determine and categorize the given pattern based on
the statistical approach like as pre planned made observations, measurement approaches and a set
of numbers prepared which is used to prepare a measurement vector [22]. Statistical algorithm
uses the statistical decision functions and a set of optimality criteria which to maximizes the
probability of the observed pattern given the model of a certain class.
Statistical algorithms activated and identifies by making the measurement and assumptions.
Statistical algorithm is based on three assumptions. Such as distribution of present cum future set,
sufficient statistics presented in each class and collection of pre-images to extract a set of features
which represents each distinct class of image pattern. The major advantage is, it works even when
prior data or information is not available about the characters in the training data.

78 Computer Science & Information Technology (CS & IT)
2.5 Template Matching Algorithm
Template Matching Algorithm known as pattern matching algorithm. All basic characters and
symbols are pre-stored in the system, and it is system prototype that useful to classify, identifies
the characters by comparing two pattern matching symbols or images. Template matching is the
process of finding the location of sub image called a template inside an image. Template
matching algorithm activated and identifies by Comparing derived image features and templates:
[21]. It is easy to implements but it only works on the pre-stored fonts and templates.
3. GENERAL POINTS OF CLASSIFICATION OF THE CONSONANTS AND
MIXED CONJUNCT CONSONANTS
General points might be concentrated during the process of handwritten character recognition
when digitized input image is, such as handwritten characters.
• Image clarity, quality and range of the pen ink plotted.
• Written text stroke, clarity, and thickness of the text.
• Pen or pencil ink injecting ratio on the paper.
• Local variations, rounded corners, and improper extrusions
• Unreflective and relative size of the character.
• Some characters represents different shapes
• In the translation point of view, it can be entirely or partly and it represents relative shift
of the character.
• Individual and irrelative line pixels, segments and curves.
4. GENERAL TELUGU CHARACTERS, NUMBERS AND SYMBOLS
Figure 1. Telugu characters and numbers

Computer Science & Information Technology (CS & IT) 79
Figure 2. Combinational vowels with consonants
Figure 3. Conjunct consonants
5. PAPER OBJECTIVES The main objectives of this paper is To determine suitable features for decision making state and
identification of Telugu Written and Printed Consonants and Conjunct Consonants based on 3
layer approach with their orientation, alignment method. And also to develop the identification,
classification and deference prototyping for written and printed mixed and conjunct Consonants
characters with their orientation, alignment method by using fuzzy logic system.
6. WORKING METHODOLOGY
The scanned image page contains the different stroke levels of consonants, normal and mixed
conjunct consonants. In this research paper we are concentrated on different stroke levels of
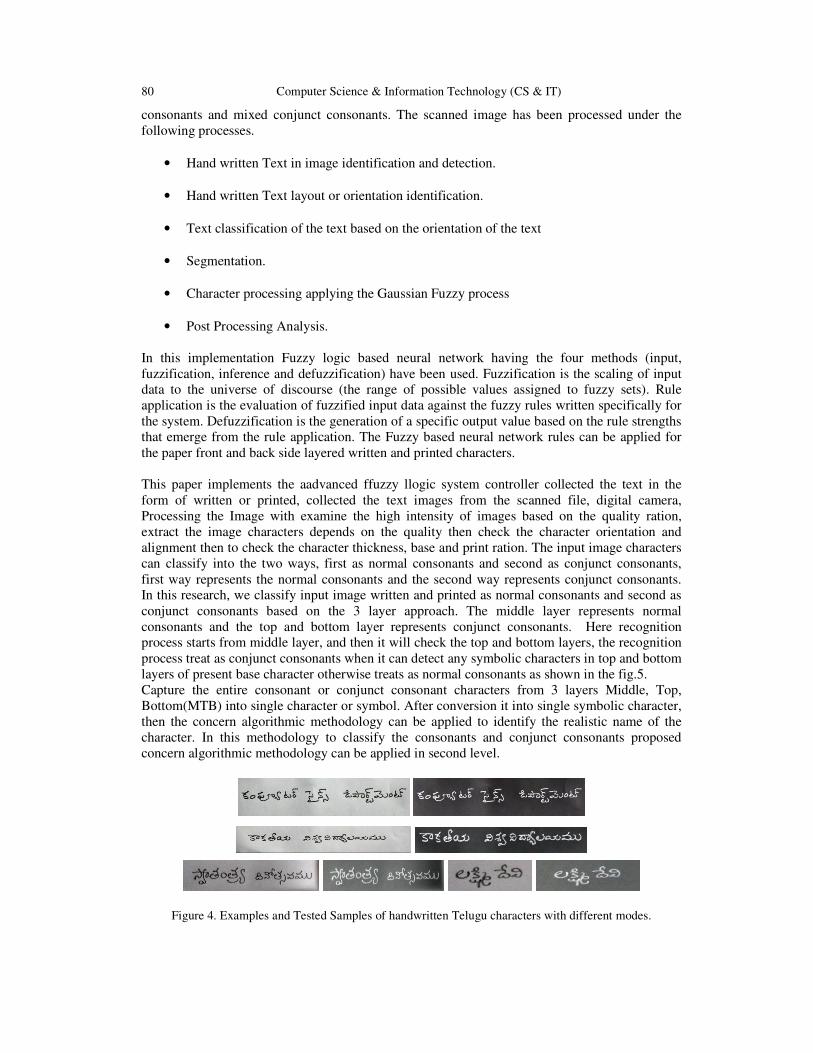
80 Computer Science & Information Technology (CS & IT)
consonants and mixed conjunct consonants. The scanned image has been processed under the
following processes.
• Hand written Text in image identification and detection.
• Hand written Text layout or orientation identification.
• Text classification of the text based on the orientation of the text
• Segmentation.
• Character processing applying the Gaussian Fuzzy process
• Post Processing Analysis.
In this implementation Fuzzy logic based neural network having the four methods (input,
fuzzification, inference and defuzzification) have been used. Fuzzification is the scaling of input
data to the universe of discourse (the range of possible values assigned to fuzzy sets). Rule
application is the evaluation of fuzzified input data against the fuzzy rules written specifically for
the system. Defuzzification is the generation of a specific output value based on the rule strengths
that emerge from the rule application. The Fuzzy based neural network rules can be applied for
the paper front and back side layered written and printed characters.
This paper implements the aadvanced ffuzzy llogic system controller collected the text in the
form of written or printed, collected the text images from the scanned file, digital camera,
Processing the Image with examine the high intensity of images based on the quality ration,
extract the image characters depends on the quality then check the character orientation and
alignment then to check the character thickness, base and print ration. The input image characters
can classify into the two ways, first as normal consonants and second as conjunct consonants,
first way represents the normal consonants and the second way represents conjunct consonants.
In this research, we classify input image written and printed as normal consonants and second as
conjunct consonants based on the 3 layer approach. The middle layer represents normal
consonants and the top and bottom layer represents conjunct consonants. Here recognition
process starts from middle layer, and then it will check the top and bottom layers, the recognition
process treat as conjunct consonants when it can detect any symbolic characters in top and bottom
layers of present base character otherwise treats as normal consonants as shown in the fig.5.
Capture the entire consonant or conjunct consonant characters from 3 layers Middle, Top,
Bottom(MTB) into single character or symbol. After conversion it into single symbolic character,
then the concern algorithmic methodology can be applied to identify the realistic name of the
character. In this methodology to classify the consonants and conjunct consonants proposed
concern algorithmic methodology can be applied in second level.
Figure 4. Examples and Tested Samples of handwritten Telugu characters with different modes.
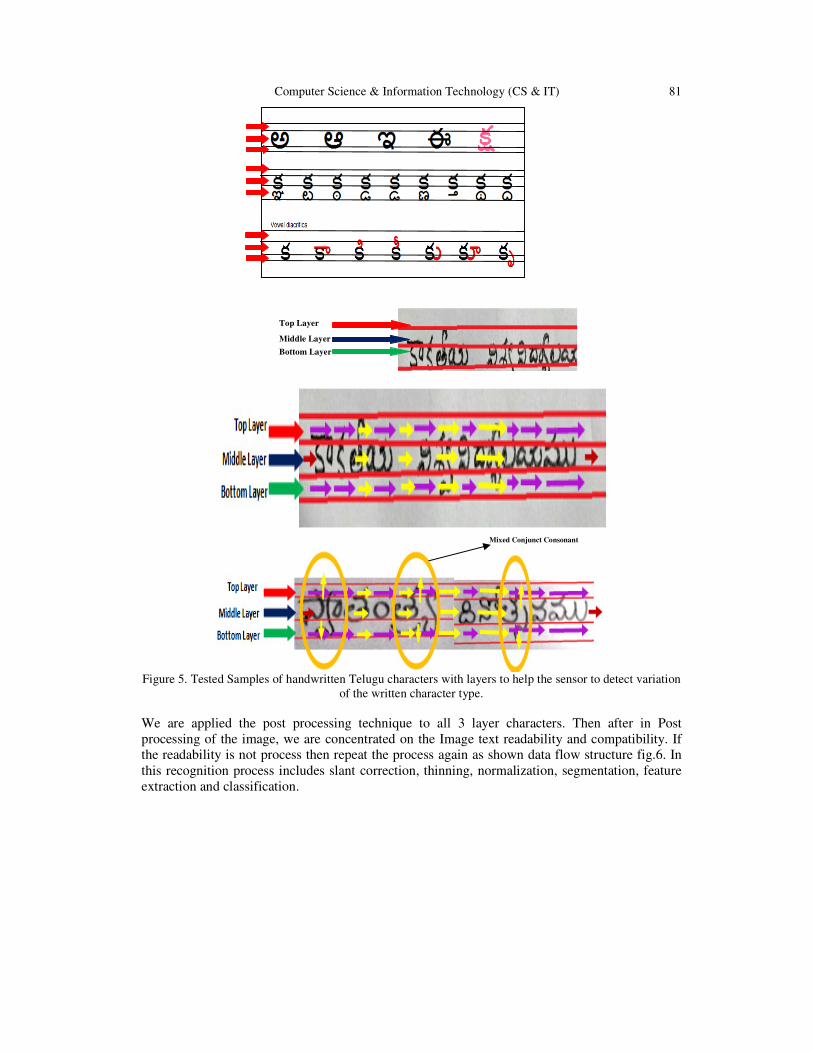
Computer Science & Information Technology (CS & IT) 81
Figure 5. Tested Samples of handwritten Telugu characters with layers to help the sensor to detect variation
of the written character type.
We are applied the post processing technique to all 3 layer characters. Then after in Post
processing of the image, we are concentrated on the Image text readability and compatibility. If
the readability is not process then repeat the process again as shown data flow structure fig.6. In
this recognition process includes slant correction, thinning, normalization, segmentation, feature
extraction and classification.
Top Layer
Middle Layer
Bottom Layer
Mixed Conjunct Consonant

82 Computer Science & Information Technology (CS & IT)
Figure 6. Data Process and next level flow diagram in OCR process.
In the process of development of the algorithm the pre-processing, segmentation, character
recognition and post-processing modules were discussed. The main objectives to the development
of this paper are: To develop the classification, identification of deference prototyping for Written
and Printed Consonants, Conjunct Consonants and symbols based on 3 layer approach with
different measurable area by using fuzzy logic and to determine suitable features for handwritten
character recognition.
7. IMPLEMENTATION
The Fuzzy logic was for the most part an object of skepticism and derision, in part because the
word ‘‘fuzzy” is generally used in a pejorative sense. Fuzzy logic is not fuzzy. Basically, fuzzy
logic is a precise logic of imprecision and approximate reasoning. More specifically, fuzzy logic
may be viewed as an attempt at formalization/mechanization of two remarkable human
False
True, means quality ration is suitable to identify the page back sided text
and symbols
True
False
Extract image depends on the quality and it is ready
to read the machine.
Post processing of the image:
Machine can be read the characters
and text depends on the keystrokes
of text.
If the readability is
not process then
repeat the process
again.
Image text readability and
compatibility is sufficient to
read the text
Examine the intensity of images based
on the quality ration.
Processing the Image Stage 1
Stage 2
Take the text in the form of
written or printed.
Take the text images from the digital
camera/scanned file.
Page Front side text Quality <
Page Back side text Quality
Processing of the image - Stage 2
The character orientation, thickness, base, stroke, print
ration and alignment
Observed and verified. is checked.
Extract image depends on the quality.

Computer Science & Information Technology (CS & IT) 83
capabilities. First, the capability to converse, reason and make rational decisions in an
environment of imprecision, uncertainty, incompleteness of information, conflicting information,
partiality of truth and partiality of possibility – in short, in an environment of imperfect
information. And second, the capability to perform a wide variety of physical and mental tasks
without any measurements and any computations [1].
The three elements required to realize a fuzzy system are fuzzification, rule application, and
defuzzification. Fuzzification is the scaling of input data to the universe of discourse (the range of
possible values assigned to fuzzy sets). Rule application is the evaluation of fuzzified input data
against the fuzzy rules written specifically for the system. Defuzzification is the generation of a
specific output value based on the rule strengths that emerge from the rule application.
In a realized fuzzy system, a microcontroller or other engine runs a linked section of object code
that consists of two segments. One segment implements the fuzzy logic algorithm, performing
fuzzification, rule evaluation, and defuzzification, and thus can be thought of as a generic fuzzy
logic inference engine. The other segment ties the expected fuzzy logic inputs and outputs, as
well as application-specific fuzzy rules, to the fuzzy logic inference engine[1] as shown in the
Figure 7.
Figure 7. Basic block diagram of Fuzzy System Crisp inputs and Outputs.
One may ask where and how fuzzy logic is implemented. here with the layer quadrants location
and three layered quadrants differentiation method for consonants and conjunct consonants with
the set of rules are known and which are the feeds for fuzzy logic controller [8 - 9] fuzzification
rules, these cases and conditions would be implemented as the if cases and for each individual quadrant the processing action is to be done is written as the then-corresponding action Fuzzy-
neural network having the four layers (input, fuzzification, inference and defuzzification) have
been used.
7.1 Basic Configuration of a Fuzzy System
Fuzzy controller in a closed-loop configuration (top panel) consists of dynamic filters and a static
map (middle panel). The static map is formed by the knowledge base, inference mechanism and
fuzzification and defuzzification interfaces.

84 Computer Science & Information Technology (CS & IT)
Figure 8. Fuzzy controller in a closed-loop configuration (top panel) consists of dynamic filters and a static
map (middle panel). The static map is formed by the knowledge base, inference mechanism and
fuzzification and defuzzification interfaces.
7.2 Fuzzy Sets
Fuzzy sets can be effectively used to represent linguistic values, such as low, young, and
complex. A fuzzy set can be defined mathematically by assigning to each possible individual in
the universe of discourse a value representing its grade of membership in the fuzzy set to a
greater or lesser degree as indicated by a larger or smaller membership grade. The fuzzy set is
represented as where x is an element in X and µA(x) is a membership function of set A which
defines the membership of fuzzy set A in the universe of discourse, X.
7.3 Fuzzy Membership Functions
A fuzzy set is characterized by a membership function which associates with each point in the
fuzzy set a real number in the interval [0, 1], called degree or grade of membership. The
membership function may be triangular, trapezoidal, Gaussian etc. A triangular membership is
described by a triplet (a, m, b), where „m‟ is the modal value, „a‟ and „b‟ are the right and left
boundary respectively. The trapezoidal membership function (shown in Figure. 9) is defined as
follows.

Computer Science & Information Technology (CS & IT) 85
Figure 9. Trapezoidal Membership
Function for µ Z (xk, γ k)
Another fuzzy membership function that is often used to represent vague, linguistic terms is the
Gaussian which is called Gaussian membership function (shown in figure 10) is defined as
follows.
Figure 10. Gaussian Membership Function for µ Z(xk, γ k)
7.4 Gaussian Bell curve sets
Give richer fuzzy system with simple learning laws that tune the bell curve variance. The
Gaussian Function is represented by “(equation 1),”

86 Computer Science & Information Technology (CS & IT)
Where Ci is the center of the ith fuzzy set and is the width of the ith fuzzy set.
Figure 11. Representation of DATA Cost driver using Gaussian Membership Function
We define a fuzzy set for each linguistic value with a Gaussian shaped membership function µ is
shown in Figure 10. We have defined the fuzzy sets corresponding to the various associated
linguistic values for each variable / parameter of interest it may be character intensity, orientation,
layout or anything.
In this research, a new fuzzy effort estimation model is proposed by using Gaussian function to
deal with linguistic data or text image with three layered quadrant position analysis, and to
generate fuzzy membership functions and rules for further processing the membership functions
Primitives have been added to find form a character, which is part of the lexicon. The word is not
said to be recognized till it is tested with lexicon containing root words with an efficient
algorithm [7]. The system working model is designed as shown in the flowchart figure 6, and the
process the recognition the consonants and conjunct consonants based the figure 8, figure 9,
figure.10 and figure.11 is repeated till the whole text is reached to get the clarity and in readable
and understandable.
8. DISCUSSION
The proposed algorithmic data flow presented to get the versatility in implementation while
constructing an OCR system; our proposal system can scan the text in different layered approach
with their different directions and orientation. There are many advantages of the proposed system.
First, when there are some feature parts which are related to knowing the decision making stages
and identification of mixed hand written letters and consonant character and the Second,
identification of low rate and low quality written mixed conjunct consonant text.
9. FUTURE SCOPE The proposed 3 layered methodology approach planning to test and it can be implementing either
using the math tool or the LabVIEW VI GUI and MathLab. Our future work aims to improve the
classifier of the mixed and non-mixed conjunct consonants to achieve still better recognition rate
with our future proposal algorithmic methodology and also to improve the better recognition
procedure for low quality readable imaged Telugu mixed-conjunct-consonants.

Computer Science & Information Technology (CS & IT) 87
ACKNOWLEDGEMENTS
I Dr B.Rama would like to thank everyone.
I Mr Santosh Kumar Henge would like to thank everyone.
REFERENCES [1] Lotfi A. Zadeh.: Is there a need for fuzzy logic? Department of EECS, University of California,
Berkeley, CA 94720- 1776, United States, 8 February 2008; 25 February 2008.
[2] H. Swethalakshmi, Anitha Jayaraman, V. Srinivasa Chakravarthy, C. ChandraSekhar, : Online
Handwritten Character Recognition of Devanagari and Telugu Characters using Support Vector
Machines, Department of Computer Science and Engineering, Department of Biotechnology, Indian
Institute of Technology Madras, Chennai - 600 036, India.
[3] RAZALI BIN ABU BAKAR,: Development of Online Unconstrained Handwritten Character
Recognition Using Fuzzy Logic, Universiti Teknologi MARA.
[4] Fuzzy Logic Toolbox User’s Guide, The MathWorks Inc., 2001.
[5] Santosh Kumar Henge, Laxmikanth Ramakrishna, Niranjan Srivastava,: Advanced Fuzzy Logic
controller based Mirror- Image-Character-Recognition OCR, The Libyan Arab International
Conference on Electrical and Electronic 3101/01/32-32 Engineering LAICEEE. 3101/01/32-32. Pg
261 -268.
[6] P.Vanaja Ranjan,: Efficient Zone Based Feature Extration Algorithm for Hand Written Numeral
Recognition of Four Popular South Indian Scripts, Journal of Theoretical and Applied Information
Technology. pg 1171-1181.
[7] RAZALI BIN ABU BAKAR,: Development of Online Unconstrained Handwritten Character
Recognition Using Fuzzy Logic, Universiti Teknologi MARA.
[8] P. Phokharatkul, K. Sankhuangaw, S. Somkuarnpanit, S. Phaiboon, and C. Kimpan: Off-Line Hand
Written Thai Character Recognition using Ant-Miner Algorithm. World Academy of Science,
Engineering and Technology, 8, 2005, Pg 276-281.
[9] Mr.Danish Nadeem & Miss.Saleha Rizvi,: Character Recognition using Template Matching.
DEPARTMENT OF COMPUTER SCIENCE, JAMIA MILLIA ISLAMIA NEW DELHI-25.
[10] Ch. Satyananda Reddy, KVSVN Raju,: An Improved Fuzzy Approach for COCOMO‟s Effort
Estimation using Gaussian Membership Function JOURNAL OF SOFTWARE, VOL. 4, NO. 5,
JULY 2009, pp 452-459.
[11] L.A. Zadeh,: Outline of a new approach to the analysis of complex systems and decision processes,
IEEE Transaction on Systems Man and Cybernetics SMC-3 (1973) 28–44.
[12] L.A. Zadeh,: Generalized theory of uncertainty(GTU)–principal concepts and ideas, Computational
Statistics & Data Analysis 51 (2006) 15–46.
[13] L.A. Zadeh,: On the analysis of large scale systems, in: H. Gottinger (Ed.), Systems Approaches and
Environment Problems, Vandenhoeck and Ruprecht, Gottingen, 1974,pp. 23–37.
[14] L.A. Zadeh,: A fuzzy-algorithmic approach to the definition of complex or imprecise concepts,
International Journal of Man–Machine Studies 8 (1976) 249–291.
[15] L.A. Zadeh,: From imprecise to granular probabilities, Fuzzy Sets and Systems 154 (2005) 370–374.

88 Computer Science & Information Technology (CS & IT)
[16] L.A. Zadeh,: Toward a perception-based theory of probabilistic reasoning with imprecise
probabilities, Journal of Statistical Planning and Inference 105 (2002) 233–264.
[17] I. Perfilieva,: Fuzzy transforms: a challenge to conventional transforms, in: P.W. Hawkes (Ed.),
Advances in Images and Electron Physics, vol.147, Elsevier Academic Press, San Diego 2007,
pp.137-196.
[18] A.P. Dempster,: Upper and lower probabilities induced by a multivalued mapping, Annals of
Mathematical Statistics 38 (1967) 325-329.
[19] G. Shafer,: A Mathematical Theory of Evidence, Princeton University Press, Princeton, NJ, 1976
[20] D. Schum,: Evidential Foundations of Probabilistic Reasoning, Wiley & Sons, 1.
[21] Purna Vithlani , Dr. C. K. Kumbharana, : A Study of Optical Character Patterns identified by the
different OCR Algorithms, International Journal of Scientific and Research Publications, Volume 5,
Issue 3, ISSN 2250-3153 March 2015 .
[22] Rohit Verma and Dr. Jahid Ali, : A-Survey of Feature Extraction and Classification Techniques in
OCR Systems, International Journal of Computer Applications & Information Technology, Vol. 1,
Issue 3, November 2012.
[23] Richa Goswami and O.P. Sharma, : A Review on Character Recognition Techniques, IJCA, Vol. 83,
No. 7, December 2013.
[24] Ms.M.Shalini, Dr.B.Indira, : Automatic Character Recognition of Indian Languages – A brief
Survey, IJISET, Vol. 1, Issue 2, April 2014.
[25] José C. Principe, Neil R. Euliano, Curt W. Lefebvre: Neural and Adaptive Systems: Fundamentals
Through Simulations”, ISBN 0-471-35167
AUTHORS
Dr B.RAMA, She received her Ph.D. Degree in Computer Science from Padmavati
Mahila Visvavidyalayam (Padmavati Women’s University), Thirupathi-India in the year
of 2009. She is working as Assistant Professor in Computer Science since six years at
Department of Computer Science, University Campus College, Kakatiya University.
She was the Chairperson, Board of Studies in Computer Science from 2013-15. She is
having total 11 years of Teaching Experience in Engineering Colleges. She is author or
co-author around 20 scientific papers mainly in IEEE international Conferences and
International Journals. Her area of interest is Artificial Intelligence and Data Mining.
SANTHOSH KUMAR HENGE, He received his M.Phil. Degree in Computer Science
from Periyar University, Salem – presently he is working as Associate Professor in
Computer Science. He is having very good International level teaching experience.
Previously, He worked in various countries Maldives, Libya, Oman and Ethiopia with
different level of positions. He was published more than 16 research papers in
International Journals and Conference Proceedings. He is doing his research in the field
of Artificial Intelligence-Neuro based Fuzzy System. His area of interest is Artificial
Intelligence and Data Mining.

David C. Wyld et al. (Eds) : CSITY, SIGPRO, AIFZ, NWCOM, DTMN, GRAPHHOC - 2016
pp. 89–98, 2016. © CS & IT-CSCP 2016 DOI : 10.5121/csit.2016.60408
MINING FUZZY ASSOCIATION RULES
FROM WEB USAGE QUANTITATIVE DATA
Ujwala Manoj Patil and Prof. Dr. J. B. Patil
Department of Computer Engineering, R.C.P.I.T., Shirpur, Maharashtra, India.
ABSTRACT
Web usage mining is the method of extracting interesting patterns from Web usage log file. Web
usage mining is subfield of data mining uses various data mining techniques to produce
association rules. Data mining techniques are used to generate association rules from
transaction data. Most of the time transactions are boolean transactions, whereas Web usage
data consists of quantitative values. To handle these real world quantitative data we used fuzzy
data mining algorithm for extraction of association rules from quantitative Web log file. To
generate fuzzy association rules first we designed membership function. This membership
function is used to transform quantitative values into fuzzy terms. Experiments are carried out
on different support and confidence. Experimental results show the performance of the
algorithm with varied supports and confidence.
KEYWORDS
Web Usage mining, Data mining, Fuzzy association rules, Web log file, Fuzzy term.
1. INTRODUCTION
With the continued increase in the usage of the World Wide Web (WWW), Web mining has been
established as an important area of research. The WWW is a vast repository of unstructured
information, in the form of interrelated files; those are distributed on several Web servers over
wide geographical regions. Web mining deals with the discovering and analyzing the valuable
information from the WWW. Web usage mining focuses on discovery of the potential knowledge
from the browsing patterns of users to find the correlation between the pages on analysis.
Mining is of three types: Data Mining, Text Mining and Web Mining. There are many
challenging problems in Data, Text, and Web Mining Research. The mining data may be either
structured or unstructured. Data Mining deals with structured data organized in a database
whereas text mining deals with unstructured data. Web mining data handles the combination of
structured and unstructured data. Web Mining uses data mining as well as text mining techniques
and its distinctive approaches. Web data mining is the application of data mining techniques to
discover interesting and potentially useful knowledge from Web data. Web hyperlink structure or
Web log data or both are used by Web data mining process.
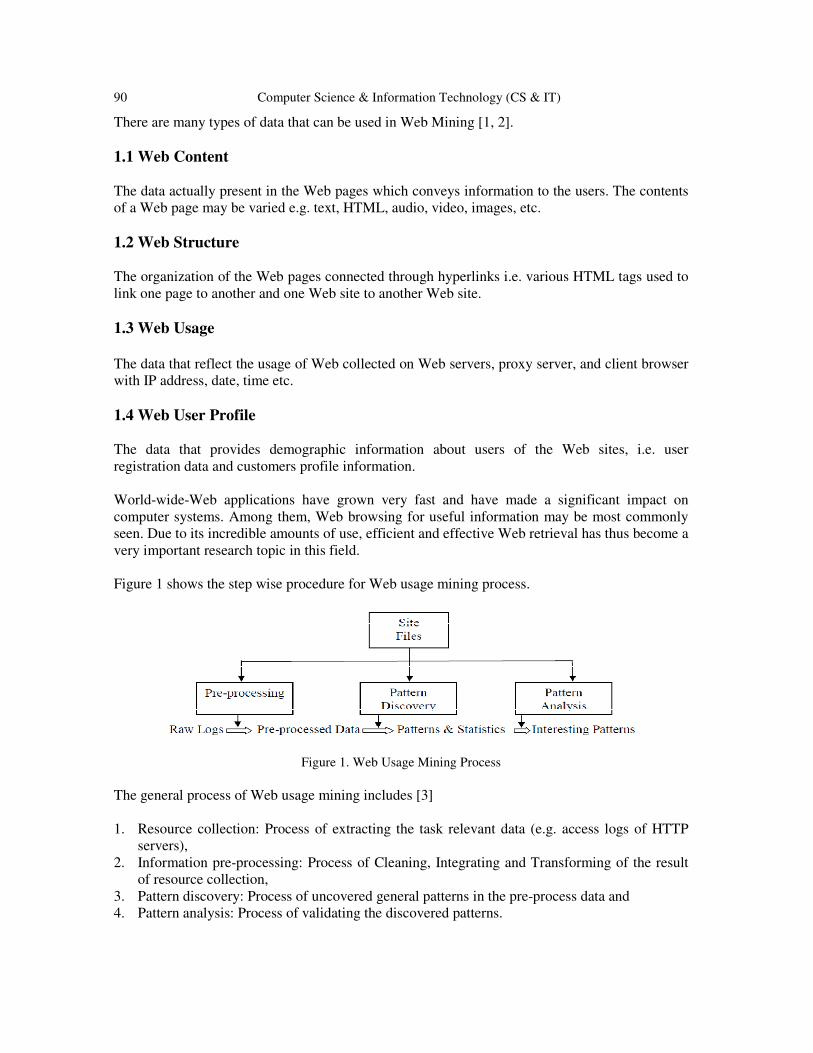
90 Computer Science & Information Technology (CS & IT)
There are many types of data that can be used in Web Mining [1, 2].
1.1 Web Content
The data actually present in the Web pages which conveys information to the users. The contents
of a Web page may be varied e.g. text, HTML, audio, video, images, etc.
1.2 Web Structure
The organization of the Web pages connected through hyperlinks i.e. various HTML tags used to
link one page to another and one Web site to another Web site.
1.3 Web Usage
The data that reflect the usage of Web collected on Web servers, proxy server, and client browser
with IP address, date, time etc.
1.4 Web User Profile
The data that provides demographic information about users of the Web sites, i.e. user
registration data and customers profile information.
World-wide-Web applications have grown very fast and have made a significant impact on
computer systems. Among them, Web browsing for useful information may be most commonly
seen. Due to its incredible amounts of use, efficient and effective Web retrieval has thus become a
very important research topic in this field.
Figure 1 shows the step wise procedure for Web usage mining process.
Figure 1. Web Usage Mining Process
The general process of Web usage mining includes [3]
1. Resource collection: Process of extracting the task relevant data (e.g. access logs of HTTP
servers),
2. Information pre-processing: Process of Cleaning, Integrating and Transforming of the result
of resource collection,
3. Pattern discovery: Process of uncovered general patterns in the pre-process data and
4. Pattern analysis: Process of validating the discovered patterns.

Computer Science & Information Technology (CS & IT) 91
There are different Web mining techniques [1], used for efficient and effective Web retrieval.
Web usage mining is one of the ways for the same. Web-usage mining emphasizes on the
automatic discovery of user access patterns from Web servers [1, 2]. In the past, several Web-
mining approaches for finding sequential patterns and user interesting information from the
World Wide Web were proposed [1, 2, 4].
Real world transactions are commonly seen with quantitative values known as boolean
transactions [5]. A boolean association involves binary attributes; a generalized association
involves attributes that are hierarchically related and a quantitative association involves attributes
that can take on quantitative or categorical values. For example, assume whenever customers in a
supermarket buy bread and butter, they will also buy milk. From the transaction of the
supermarkets, an association rule can be mined out as “Bread and Butter →Milk”. Most of the
previous study focused on such type of boolean transaction data. Transaction data in real-world
applications usually consist of quantitative values. Designing a sophisticated data-mining
algorithm which will handle real-world applications data presents a challenge to data mining
researchers.
Exhaustive research has been done in Web mining. There are many more techniques used to find
association between Web pages. But instead of only page sequence if we consider page view time
while accessing the Web page then the Web log sequence can be seen as quantitative data.
Fuzzy logic, which may be viewed as an extension of traditional logical systems, provides an
effective conceptual framework for dealing with the problem of knowledge representation in an
environment of uncertainty and imprecision [6, 7, 8, 9].
Fuzzy set theory was first introduced by Zadeh in 1965 [6].
Fuzzy set theory is being used more and more frequently in intelligent systems because of its
simplicity and similarity to human reasoning [5, 6, 7, 8, 9]. The theory has been applied in fields
such as manufacturing, engineering, control, diagnosis, and economics, among others [6, 8].
Here first, we applied fuzzy concept to Web usage log data to find fuzzy labels and then applied
Apriori algorithm to find interesting association rules.
The remaining parts of this paper are organized as follows: Basic Apriori algorithm is reviewed in
Section 2. Fuzzy set concepts are reviewed in Section 3. Proposed algorithm is described in
Section 4. Experimental results are shown in Section 5. Conclusions and future work is described
in the last Section 6.
2. REVIEW OF BASIC APRIORI ALGORITHM
Agrawal et.al developed several mining algorithms based on the concept of large itemsets to find
association rules between transaction data [4]. Sequential mining process is based on two phases
a, phase one is used to generate number of candidate itemsets and then its frequency is counted by
scanning the transaction data. The qualifying itemsets i.e. which are equal to or above predefined
threshold value called as min support are called as large itemsets. Initially large-1 itemsets are
generated; these large-1 itemsets are combined to form large-2 itemsets and so on. This process is
repeated until all large itemsets are had been found. In second phase, all association rules are

92 Computer Science & Information Technology (CS & IT)
formed against large itemsets. Then each association rule is checked with min confidence.
Qualifying association rules were output as set of association rules.
Input- L1= {large-1 sequences}
Output- maximal sequences in ∪k Lk
For (k=2;Lk-1;k++) do
begin
Ck=New candidates generated from Lk-1
For each user-sequence c in the database do
Increment the count of all candidates in Ck that are contained in c.
Lk = Candidates in Ck with minimum support.
end
3. REVIEW OF FUZZY SET CONCEPTS
Formally, the process by which individuals from a universal set X are determined to be either
members or non-members of crisp set can be defined by a characteristic or discrimination
function [5, 6]. For a given crisp set A, this function assigns a value ��(x) to every x ∊ X such
that
��(x)=� 1 �� � � � �� � ∊ �0 �� � � � �� � ∉ ��
Thus, this function maps elements of the universal set to the set containing 0 and 1. This kind of
function can be generalized such that the values assigned to the elements of the universal set fall
within specified ranges, referred to as the membership grades of these elements in the set. Higher
the value denotes better degrees of the set membership. Such a function is called membership
function ��(x), by which fuzzy set A is usually defined. This function is represented by
��: X → [0, 1],
Where [0, 1] denotes the interval of real numbers from 0 to 1, inclusive.
A special notation is often used in the literature to represent fuzzy sets, Assume that x1 to xn are
the elements in fuzzy set A, and �� to �� are their grades of membership in A, A is usually
represented as follows:
A= �� �� ⁄ +�� �� ⁄ +…..+�� �� ⁄
3.1 Operations on Fuzzy Sets
Following are the basic and commonly used operations on fuzzy sets as proposed by Zadeh [5].
3.1.1 Complementation
The complementation of a fuzzy set A is denoted by ¬A, and the membership function of ¬A is
given by:
�¬�(x)= 1 − ��(x), ∀� ∈ �

Computer Science & Information Technology (CS & IT) 93
3.1.2 Union
The union of fuzzy sets A and B is denoted by A B, and the membership function of A B is
given by:
��∪�(x)= max { ��(x), ��(x)} ∀� ∈ �
3.1.3 Intersection
The union of fuzzy sets A and B is denoted by A B, and the membership function of A B is
given by:
��∩�(x)= min { ��(x), ��(x)} ∀� ∈ �
4. PROPOSED ALGORITHM
Input: Pre-processed dataset
Output: Set of fuzzy association rules
Get initial membership functions, support value and confidence value
Divide dataset into partitions
Set n to number of partitions to be processed
repeat
Transfer quantitative values into fuzzy terms with fuzzy values
Calculate the counts of fuzzy terms
repeat
for each fuzzy term
Generate the candidate set by counting of each fuzzy term
end for
for each fuzzy term
if count ≥ min support
generate large itemsets
end if
end for
join the large itemsets
until large itemsets = = NULL
until n=0
repeat
for each large itemsets
if confidence ≥ min confidence
Construct association rule
end if
end for
merge all association rules
until n=0

94 Computer Science & Information Technology (CS & IT)
5. EXPERIMENTAL RESULTS
The experimental results are derived from United States Environmental Protection Agency
(EPA). The EPA dataset contains a 24-hour period of Hypertext Transfer Protocol (HTTP)
requests to a Web server [11]. The EPA dataset has HTTP request from 23:53:25 EDT 29th
August 1995 to 23:53:07 30th August 1995. The EPA dataset has total 47748 requests: 46014
GET requests, 1622 POST requests, 107 HEAD requests and 6 invalid requests. Table 1 shows a
sample of records from the EPA dataset after cleaning and preprocessing.
Table 1. Input Transactions
TID Pages with view time in seconds
0 (1,26); (2,260); (3,120); (4,430)
1 (6,220); (7,86); (8,9); (9,101); (10,320)
2 (6,22);(7,520);(8,17)
3 (13,190);(14,74)
4 (15,6);(16,140);(17,133);(18,261)
5 (6,136);(20,880)
The quantitative value of each transaction is transformed into fuzzy set according to the
membership functions defined in figure 2.
Figure 2. A Triangular Membership Functions for Page View Time
All the transactions from table 1 are converted in fuzzy terms (shown in table 2) using the
membership functions defined in figure 2.

Computer Science & Information Technology (CS & IT) 95
Table 2. Input Transactions transformed into the fuzzy sets
TID Fuzzy set
0 (
�.(�.)*+); (
(.,�.)*+ + (..
�./0123/); (�.(
..)*+); ((.45
6./0123/ + (.�56.7287);
1 (
(.9:.)*+ + (.�
:./0123/); (�.(
,.)*+); (�.(
4.)*+); (�.(
9.)*+); ((.6
�(.)*+ + (.:�(./0123/)
2 (
�.(:.)*+);( (.6
,./0123/ + (.:,.7287);( �.(
4.)*+)
3 (
�.(�..)*+);( �.(
�6.)*+)
4 (
�.(�5.)*+);( �.(
�:.)*+);( �.(�,.)*+);( (.,
�4.)*+ + (..�4./0123/)
5 (�.(
:.)*+);( �.(�(.7287)
Calculate the scalar cardinality of each fuzzy term in given transactions as the count value. The
counts for all fuzzy terms are shown in table 3. This fuzzy terms set is called candidate -1 fuzzy
term set. Table 3. Counts for all fuzzy terms
Fuzzy term Count Fuzzy term Count
1.low 1.0 10.medium 0.6
2.low 0.7 7.medium 0.4
2.medium 0.3 7.high 0.6
3.low 1.0 13.low 1.0
4.medium 0.85 14.low 1.0
4.high 0.15 15.low 1.0
6.low 2.9 16.low 1.0
6.medium 0.1 17.low 1.0
7.low 1.0 18.low 0.7
8.low 2.0 18.medium 0.3
9.low 1.0 20.high 1.0
10.low 0.4
The candidate-1 fuzzy term set is checked against predefined minimum support value assume that
the support value is 1.0. The qualified fuzzy terms are called as large-1 fuzzy terms shown in
table 4. Table 4. The set of large-1 fuzzy terms
Fuzzy term count Fuzzy term count
1.low 1.0 13.low 1.0
3.low 1.0 14.low 1.0
6.low 2.9 15.low 1.0
7.low 1.0 16.low 1.0
8.low 2.0 17.low 1.0
9.low 1.0 20.high 1.0

96 Computer Science & Information Technology (CS & IT)
As large-1 fuzzy term set is not null, join large-1 fuzzy terms to generate candidate-2 fuzzy terms.
Then we check candidate-2 fuzzy terms with minimum support to find large-2 fuzzy term set.
Hence we repeat the process of join and generate till we get the largest fuzzy term set null.
Finally we combined all partitions largest fuzzy term sets to form association rules. Then each
association rule is checked with min confidence. Qualifying association rules were output as set
of association rules. For example visitors who viewed page 7 for low amount time also viewed
page 8 for low amount of time.
Figure 3. The relationship between numbers of association rules and minimum support values.
Experiments were conducted with varied support and confidence. From figure 3, it is clear that
the number of association rules decreased along with the increase in minimum support values.
Figure 4. The relationship between numbers of association rules and minimum confidence values.
From figure 4, it is easily seen that the number of association rules decreased as the increase in
minimum confidence values. When we observe the curves of figure 3 and figure 4, it is clear that
the curves for larger minimum support values were smoother than smaller minimum support
values; it means that minimum confidence value had a larger effect on number of association
rules when smaller minimum support values were used.

Computer Science & Information Technology (CS & IT) 97
Figure 5. The Memory Usage Statistics with varied minimum support and confidence.
From figure 5, it is observed that the memory utilization is high when the minimum support is
low and memory utilization gets decreased as minimum support values get increased.
6. CONCLUSIONS AND FUTURE WORK
In this paper, we have proposed a generalized fuzzy data mining algorithm to extract interesting
patterns. The proposed algorithm uses static membership functions to fuzzify the quantitative
Web usage data along with predefined membership function. We also use predefined support and
confidence. In this paper we divided whole database into different partitions based on hours. Each
hour partition, we apply separately fuzzy mining algorithm to extract association rules. Finally all
hours association rules combined to declare total number of rules for given database. There is
possibility to lose some association rules, but in future, we will try to attempt to discover some
interesting temporal association rules based on this partition.
REFERENCES
[1] J. Srivastava, R. Cooley, M. Deshpande, and P. -N. Tan, “Web Usage Mining: Discovery and
Applications of Usage Patterns from Web Data,” ACM SIGKDD Explorations, Vol. 1, no. 2, pp. 1-
12, Jan. 2000.
[2] R. Cooley, B. Mobasher and J. Srivastava, “Web Mining: Information and Pattern Discovery on the
World Wide Web,” Ninth IEEE International Conference on Tools with Artificial Intelligence, pp.
558–567, Nov. 1997.
[3] R. Agrawal and R. Srikant, “Mining Sequential Patterns,” Proceedings of the 11th Conference on
Data Engineering, Taipei Taiwan, IEEE Computer Society Press, pp. 3-14, 1995.
[4] R. Cooley, B. Mobasher, and J. Srivastava, “Data Preparation for Mining World Wide Web Browsing
Patterns,” Knowledge and Information Systems, Vol. 1, No. 1, pp. 5-32, 1999.
[5] T.P. Hong, C.S. Kuo, and S.C. Chi, “Trade-off between computation time and number of rules for
fuzzy mining from quantitative data,” International Journal of Uncertainty, Fuzziness & Knowledge-
Based Systems, vol. 9, no 5, 2001, pp. 587–604.
[6] L.A. Zadeh, “Fuzzy sets,” Information Control, vol. 8, Issue 3, June 1965, pp. 338–353.

98 Computer Science & Information Technology (CS & IT)
[7] T.P. Hong, and C.Y. Lee, “An overview of mining fuzzy association rules,” In: H. Bustince, F.
Herrera, J. Montero (eds.) Studies in Fuzziness and Soft Computing, vol. 220, pp. 397–410. Springer
Berlin/Heidelberg (2008)
[8] L.A. Zadeh, “Knowledge representation in fuzzy logic,” IEEE Transactions on Knowledge and Data
Engineering, vol. 1, no. 1, March 1989, pp. 89-100.
[9] T.P. Hong, K.Y. Lin, and S.L. Wang, “Mining linguistic browsing patterns in the world wide Web,”
Soft Computing – A Fusion of Foundations, Methodologies and Applications, vol. 6, no 5, 2002,
pp.329–336.
[10] T.P. Hong, and C.Y. Lee, “Induction of fuzzy rules and membership functions from training
examples,” Fuzzy Sets and Systems, vol. 84, 1996, pp. 33-47.
[11] Stephen G. Matthews, M.A. Gongora, A.A. Hopgood, and S. Ahmadi, “Web usage mining with
evolutionary extraction of temporal fuzzy association rules,” Knowledge based Systems, vol. 54,
2013, pp. 66-72.
AUTHORS Jayantrao B. Patil has completed master of technology in computer science & data
processing from IIT, Kharagpur and Ph.D. in computer engineering from North
Maharashtra University, Jalgaon, Maharashtra, India. He is working as a principal at
R. C. Patel Institute of Technology, Shirpur (Maharashtra), India. His area of
research is web catching and web prefetching, web data mining, text watermarking,
web usage mining, web personalization, semantic web mining and web security. He
is a life member of Indian Society for Technical Education (ISTE), Computer
Society of India (CSI), the member of Institute of Engineers (IE), India and the
senior member of International Association of Computer Science and Information
Technology (IACSIT), Singapore. Ujwala M. Patil has completed her master of technology in Computer Engineering,
Dr. Babasaheb Ambedkar Technological University, Lonere, Raigad, Maharashtra,
India in 2007 and pursuing her Ph.D. in Computer Engineering from North
Maharashtra University, Jalgaon, Maharashtra, India. She is working as an associate
professor in the Computer Engineering Department at R.C. Patel Institute of
Technology, Shirpur (Maharashtra), India. She has 13 years of teaching experience.
Her research interests lie in machine learning, web usage mining, data mining, and
their applications.

David C. Wyld et al. (Eds) : CSITY, SIGPRO, AIFZ, NWCOM, DTMN, GRAPHHOC - 2016
pp. 99–108, 2016. © CS & IT-CSCP 2016 DOI : 10.5121/csit.2016.60409
SEGMENTATION AND LABELLING OF
HUMAN SPINE MR IMAGES USING FUZZY
CLUSTERING
Jiyo.S.Athertya and G.Saravana Kumar
Department of Engineering Design, IIT-Madras, Chennai, India [email protected], [email protected]
ABSTRACT
Computerized medical image segmentation is a challenging area because of poor resolution
and weak contrast. The predominantly used conventional clustering techniques and the
thresholding methods suffer from limitations owing to their heavy dependence on user
interactions. Uncertainties prevalent in an image cannot be captured by these techniques. The
performance further deteriorates when the images are corrupted by noise, outliers and other
artifacts. The objective of this paper is to develop an effective robust fuzzy C- means clustering
for segmenting vertebral body from magnetic resonance images. The motivation for this work is
that spine appearance, shape and geometry measurements are necessary for abnormality
detection and thus proper localisation and labelling will enhance the diagnostic output of a
physician. The method is compared with Otsu thresholding and K-means clustering to illustrate
the robustness. The reference standard for validation was the annotated images from the
radiologist, and the Dice coefficient and Hausdorff distance measures were used to evaluate the
segmentation.
KEYWORDS
Vertebra segmentation, fuzzy clustering, MRI, labelling
1. INTRODUCTION
Image segmentation is a fundamental building block in an image analysis tool kit. Segmentation
of medical images is in itself an arduous process where the images are prone to be affected by
noise and artifacts. Automatic segmentation of medical images is a difficult task as medical
images are complex in nature and rarely posses simple linear feature characteristic. Further, the
output of segmentation algorithm is affected due to partial volume effect, intensity inhomogeneity
in case of MR images.
Spine is the most complex load bearing structure in our entire human body. It is made up of 26
irregular bones connected in such a way that flexible curved structure results. The vertebral
column is about 70cm long in an average adult and has 5 major divisions. Seven vertebrae found
in the neck region, constitute the cervical part, the next 12 are the thoracic vertebrae and 5
supporting the lower back are the lumbar vertebrae. Inferior to these, is the sacrum which
articulates with the hip bones of pelvis. The entire column is terminated by the tiny coccyx.
Intervertebral disc acts as a shock absorber and allow the spine to extend. These are thickest in
the lumbar and cervical regions, enhancing the flexibility in these regions. Its degeneration is
relatively a common phenomena with aging due to wear and tear and is the major cause for back
pain [1]. Herniated disc, spinal stenosis and degenerative discs are a few of the types, to mention.
These can be imaged and studied from MRI scans. Also it is prescribed most commonly for

100 Computer Science & Information Technology (CS & IT)
patients with excruciating back pain. MR imaging of spine is formally identified with IR
(Inversion Recovery), T1 and T2 weighted images. While water content appears bright in T2 (in
medical lingo, its hyper intense which is clearly seen in the spinal canal), the same appears dark
(hypo intense) in T1 images. MR can detect early signs of bone marrow degeneration with high
spatial resolution where fat and water protons are found in abundance.
Degenerative lumbar spine disease (DLSD) includes spondylotic (arthritic) and degenerative disc
disease of the lumbar spine with or without neuronal compression or spinal instability. Accurate
diagnosis remains a challenge without manual intervention in segmenting the vertebral features. It
can be seen from fig 1. the degenerated state of L5 vertebrae and the associated intensity changes
prevalent. These are primarily due to the end plate degeneration.
Figure 1. Degenerated L5 vertebra in MR sagittal plane
While degenerative changes are a biological phenomena occurring in spinal structure that are
imaged using radiological equipments, certain irrelevant processes are also captured. These
constitute the artifacts caused due to intensity inhomogenities shown in fig 2. The segmentation
process is highly affected by these complexities present in MR images.
Figure 2. Intensity inhomogenity captured in lumbar vertebrae
The current work deals with segmentation of spinal column from MR image using fuzzy means
clustering for identification and labelling of individual vertebral structures. The segmented output
can be refined further and used for classification of degenerative state as well as to diagnose
deformities.

Computer Science & Information Technology (CS & IT) 101
2. LITERATURE
The commonly used segmentation methods are global thresholding, multilevel thresholding and
supervised clustering techniques. In intensity thresholding, the level determined from the grey-
level histogram of the image. The distribution of intensities in medical images, especially in MRI
images is random, and hence global thresholding methods fail due to lack of determining optimal
threshold. In addition, intensity thresholding methods have disadvantage of spatial uncertainty as
the pixel location information is ignored[2]. An edge detection scheme can be used for identifying
contour boundaries of the region of interest(ROI). The guarantee of these lines being contiguous
is very sleek. Also, these methods usually require computationally expensive post-processing to
obtain hole free representation of the objects.
The region growing methods extend the thresholding by integrating it with connectivity by means
of an intensity similarity measure. These methods assume an initial seed position and using
connected neighbourhood, expand the intensity column over surrounding regions. However, they
are highly sensitive to initial seeds and noise. In classification-based segmentation method, the
fuzzy C-means (FCM) clustering algorithm [3], is more effective with considerable amount of
benefits. Unlike hard clustering methods, like k-means algorithm, which assign pixels
exclusively to one cluster, the FCM algorithm allows pixels to have dependence with multiple
clusters with varying degree of memberships and thus more reasonable in real applications. Using
intuitionistic fuzzy clustering(IFC), where apart from membership functions(MF), non
membership values are also defined, [4]have segmented MR images of brain. The heuristic based
segmentation also considers the hesitation degree for each pixel. A similar study on generic gray
scale images is put forth in [5] where the IFC combines several MF's and the uncertainty in
choosing the best MF.
The article deals with elementary fuzzy C-means clustering, attempting to segment vertebral
bodies(VB) with morphological post processing. Also the VB's are labelled accordingly which
can reduce the burden of radiologist while classifying the degenerations involved.
3. METHODS
The proposed method is schematically depicted in fig.3. The input image(s) have been collected
from Apollo Speciality Hospitals, Chennai after going through a formal ethical clearance process.
The T1 weighted images, served as the initial dataset for the proposed algorithm.
Figure 3. Schematic of the proposed segmentation method
3.1. Pre-Processing
The method first smooths the image using the edge preserving anisotropic diffusion filter
presented in. It serves the dual purpose of removing inhomogenities and as an enhancer as well.

102 Computer Science & Information Technology (CS & IT)
3.2. Fuzzy C-Means Clustering
The fuzzy c-means algorithm [2]has been broadly used in various pattern and image processing
studies [6]–[8]. According to fuzzy c-means algorithm, the clustering of a dataset can be obtained
by minimizing an objective function for a known number of clusters. Fuzzy C-means is based on
minimization of the following objective function:
� = � � ����
��
�
�� �� − �� �, 1 ≤ � < ∞
where ;
k is any real number known as the weighting factor,
��� is degree of membership of �� in the cluster j
�� is the ith of p-dimensional measured intensity data
�� is the p-dimensional center of the jth cluster
‖∗‖ is any norm expressing the similarity between measured intensity data and center
N represents number of pixels while M represents the number of cluster centers
Fuzzy clustering is performed through an iterative optimisation of objective function shown
above with update of membership function uij and cluster centers vj by
��� = 1
∑ ���� − ���� − ��
� �
(�"�)��
�� = ∑ ���� �����∑ �������
The algorithm is terminated when maxij{uij at t+1 - uij at t} ≤ ϵ which is between 0 and 1.
3.3. Post Processing
A series of morphological operations are executed for extracting the vertebral bodies (VB) from
the clustered output. Hole filling is the preliminary step followed by an erosion to remove islands.
An area metric is used to extract only Vertebrae from surrounding muscular region Shape
analysis [9] reveals that the aspect ratio of VB varies between 1.5 and 2. This helps in isolating
the ligaments and spinal muscles associated with the spine in the region of interest.
3.4. Labelling
The segmented vertebrae are labelled using the connected component entity. Each VB is
identified with a group number. Starting from L5(Lumbar), the vertebrae are labelled
successively till L1 and then, the thoracic region begin. If the sacrum remains due to improper
segmentation, it can be eliminated based on aspect ration or area criteria. A colored schematic is
also presented for visual calibration.
3.5. Validation
The proposed method was validated using Dice coefficient (DC) and Hausdorff distance (HD) .
The reference standard for comparison was the annotated images from the radiologist. DC
measures the set agreement as described in following equations, where the images constitute the

Computer Science & Information Technology (CS & IT) 103
two sets. The generalized HD provides a means of determining the similarity between two binary
images. The two parameters used for matching the resemblance between the given images are,
• Maximum distance of separation between points, yet that can still be considered close.
• The fraction that determines how much one point set is far apart from the other.
$(%, &) = �|(∩*||(|+|*| (Dice Coefficient)
$(%, &) = ,-�./∈(
{,23.4∈*
{5(-, 6)77 (Hausdorff Distance)
where, a, b are points from the images A,B respectively.
4. RESULTS AND DISCUSSION
The method is tested on sagittal cross-section of T1-weighted MR images of spine.The goal is to
segment the vertebral bodies from the muscular background.
4.1 Fuzzy segmentation
The input MR sagittal slice of spine considered for the current study is shown in fig 4. After the
pre-processing stage, the enhanced input is clustered using the Fuzzy C-means technique and the
final output derived is shown in fig 5(d).
Figure 4. Sagittal plane MR T1 image
The intermediate steps involving the morphological operations are depicted in fig 4. It can be
seen that, the fuzzy clustering provides a closer disjoint VB's owing to which we can erode the
muscular region and thus arrive at delineating the same.

104 Computer Science & Information Technology (CS & IT)
(a) fuzzy c-means (b) Erosion (c) Filtering using (d) Aspect ratio
area criteria based elimination
Figure 5. Post processed output using morphological operations
4.2 Labeling of VB
Automatic labeling of vertebrae is usually performed to reduce the manual effort put in by the
radiologist. It can be seen from fig 6, the labeled vertebrae and its color scheme can help in better
diagnosis given that geometric attributes are also extracted.
Figure 6. Labeling of VB after segmentation
4.3 Case study
Around 4 cases were used for the entire study. The patients complained of mild lower back pain
and are in the age group between 45-60. The population included 2 female and 2 male. An image
overlay of the input and segmented output for various cases is presented in fig 7.

Computer Science & Information Technology (CS & IT) 105
Figure 7. Overlay of segmented image with input for various case studies
4.4 Comparative Analysis
A comparative tabulation amongst the global thresholding, a simple clustering and the Fuzzy
clustering is illustrated in Table 1.
Table 1. Comparison of segmentation methods
Cases SI Segmentation methods
Otsu thresholding K- Means
Clustering
Fuzzy C Means
Clustering
Case I DC 0.36 0.622 0.835
HD 10.23 7.338 3.97
Case II DC 0.43 0.618 0.90
HD 16.9 6.142 4.03
Case III DC 0.57 0.714 0.852
HD 15.8 5.48 3.62
Case IV DC 0.437 0.773 0.83
HD 15.2 5.7 3.95
The ground truth image was manually segmented by the radiologist and is used as the gold
standard for validation. It can be observed that the Fuzzy method provides better DC value (closer

106 Computer Science & Information Technology (CS & IT)
to 1) and HD value (closer to 0) than compared to the rest thus affirming the robustness in
segmentation. Images obtained using Otsu's thresholding and K-means is shown in fig 8.
(a) fuzzy c means (b) Erosion (c) Filtering using (d) Aspect ratio
area criteria based elimination
Figure 8. Comparative analysis using Otsu and K-means
4.5 Failure Case
The method was tested on several images and in some images the segmentation failed to provide
quality results. The transverse and spinous processes are a part of vertebral bodies. Thus, when
they start emerging, with disruption in intensity as well as structure, the fuzzy clustering method
fails to adapt to the complex topology. Apart from this, the presence of anterior and posterior
ligaments also significantly affects the results of the segmentation. fig 9. shows the results of
segmentation of one such case where the ROI has not been delineated clearly.

Computer Science & Information Technology (CS & IT) 107
Figure 9. Failure case of proposed segmentation
5. CONCLUSIONS
In this paper, a fuzzy C-means clustering algorithm followed by morphological operations and
labelling has been presented for segmentation of spine MR images. It is compared with the simple
K-means clustering and Otsu thresholding scheme. Upon validation, it is observed that the fuzzy
C-means gives improved segmentation results as compared to the counterparts.As a part of future
work, we would like to incorporate intuitionistic fuzzy clustering to check if it can enhance the
accuracy. Also extract features from the segmented VB for classifying various deformity.
ACKNOWLEDGEMENTS
The first author would like to thank the Department of Science and Technology [DST], India, for
supporting the research through INSPIRE fellowship
REFERENCES
[1] H. B. Albert, P. Kjaer, T. S. Jensen, J. S. Sorensen, T. Bendix, and C. Manniche, “Modic changes,
possible causes and relation to low back pain,” Med. Hypotheses, vol. 70, no. 2, pp. 361–368, 2008.
[2] S. R. Kannan, S. Ramathilagam, a. Sathya, and R. Pandiyarajan, “Effective fuzzy c-means based
kernel function in segmenting medical images,” Comput. Biol. Med., vol. 40, no. 6, pp. 572–579,
2010.
[3] T. Chaira, “A novel intuitionistic fuzzy C means clustering algorithm and its application to medical
images,” Appl. Soft Comput. J., vol. 11, no. 2, pp. 1711–1717, 2011.
[4] Y. K. Dubey and M. M. Mushrif, “Segmentation of brain MR images using intuitionistic fuzzy
clustering algorithm,” Proc. Eighth Indian Conf. Comput. Vision, Graph. Image Process. - ICVGIP
’12, pp. 1–6, 2012.
[5] V. P. Ananthi, P. Balasubramaniam, and C. P. Lim, “Segmentation of gray scale image based on
intuitionistic fuzzy sets constructed from several membership functions,” Pattern Recognit., vol.
47, no. 12, pp. 3870–3880, 2014.
[6] C. kong chui Bing Nan li, “Integrating spatial fuzzy clustering with level set methods for automated
medical image segmentation,” Comput. Biol. Med., 2011.
[7] I. Nedeljkovic, “Image Classification Based on Fuzzy Logic,” pp. 1–6, 2004.

108 Computer Science & Information Technology (CS & IT)
[8] M. Gong, Y. Liang, J. Shi, W. Ma, and J. Ma, “Fuzzy C-means clustering with local information
and kernel metric for image segmentation,” IEEE Trans. Image Process., vol. 22, no. 2, pp. 573–
584, 2013.
[9] M. Lootus, T. Kadir, and A. Zisserman, “Vertebrae Detection and Labelling in Lumbar MR
Images,” Lect. Notes Comput. Vis. Biomech., vol. 17, pp. 219–230, 2014.

David C. Wyld et al. (Eds) : CSITY, SIGPRO, AIFZ, NWCOM, DTMN, GRAPHHOC - 2016
pp. 109–119, 2016. © CS & IT-CSCP 2016 DOI : 10.5121/csit.2016.60410
A CROSS-LAYER BASED SCALABLE
CHANNEL SLOT RE-UTILIZATION
TECHNIQUE FOR WIRELESS MESH
NETWORK
Asha C N1 and T G Basavaraju
2
1VTU Research Scholar, Department of Electronics and communication
Engineering,
Acharya Institute of Technology, Bangalore, India [email protected]
2T G Basavaraju, Professor in CSE, Govt. SKSJTI, Bangalore, India
ABSTRACT
Due to tremendous growth of the wireless based application services are increasing the demand
for wireless communication techniques that use bandwidth more effectively. Channel slot re-
utilization in multi-radio wireless mesh networks is a very challenging problem. WMNs have
been adopted as back haul to connect various networks such as Wi-Fi (802.11), WI-MAX
(802.16e) etc. to the internet. The slot re-utilization technique proposed so far suffer due to high
collision due to improper channel slot usage approximation error. To overcome this here the
author propose the cross layer optimization technique by designing a device classification
based channel slot re-utilization routing strategy which considers the channel slot and node
information from various layers and use some of these parameters to approximate the risk
involve in channel slot re-utilization in order to improve the QoS of the network. The simulation
and analytical results show the effectiveness of our proposed approach in term of channel slot
re-utilization efficiency and thus helps in reducing latency for data transmission and reduce
channel slot collision.
KEYWORDS
Multi-radio WMN, Radio channel measurement, Scheduling, Routing, Medium access control
(MAC)
1. INTRODUCTION
In current era wireless network gain much attention; research is ongoing day-by-day to improve
more and more wireless technologies. Wireless Mesh Network (WMN) s is a part of this
technologies growth. IEEE 802.15.5 MAC standard for mesh communication in wireless personal
area network. WMN has a quality of dynamically self-organized and it can self-configure which
make it more popular than other wireless network. Multi-hop transmission is one more

110 Computer Science & Information Technology (CS & IT)
characteristic of WMN. In a wireless Mesh network, there is fixed infrastructure over fixed
wireless network which is used by wireless host. Every wireless host is connected with any of the
mesh node; some mesh node may have direct association with internet. Channel quality in WMN
fluctuated due to Doppler Effect, fading and interference [1]. MAC provides the actual benefit of
mesh network. MAC- layer protocol by default chooses the minimum available transmission rate
and it does not protect from error. Mesh network based on CSMA/CA MAC protocol which has
single hop transmission characteristics, cannot provide the quality of service for the application
which is streaming in real time like voice calling, video calling, etc. CSMA/CA has some
limitation due to which we need a new MAC protocol which gives better throughput, capacity
and reduce delay. To achieve better QoS it is needed to use the Time division multiple access
(TDMA) based approach in MAC layer. Total channel (frequency channel or single band) is split
into time-frame slot in TDMA scheduling and assignment of transmitting slot to the node is done.
Power drop, collision, data overhead is prevented by every time slot [2]. TDMA with distributed
approach consist of two different procedures. In first procedure it based on Bellman ford
algorithm [3], each node find a nearest feasible link, which are taken from two-hop routing
information updated by neighbour node. In second approach nearest feasible schedule is used to
analyze the global feasible schedule and it inform the availability of a new schedule to the entire
node.
2. RELATED WORK
Number of MAC-layer multicast mechanism was purposed for mesh network to overcome the
inefficiency of the network. Hop-by-hop recovery on loss of packet is provided by researchers in
various ways. Here [4] author gives the analysis of maximized output for a wireless mesh
network over CSMA/CA in MAC layer protocol. Random access is not accounted in CSMA due
to which collision overhead is increased. New development for optimal capacity analysis of
network done in CSMA/CA with multi commodity flow (MCF), author analyze throughput based
on upper and lower bound of the network capacity over CSMA/CA. the drawback of CSMA/CA
is that it is not suitable for real time data transfer like video calling. In [5] if physical rate is
increases efficiency of the MAC layer is decreases. More efficient MAC layer protocol in terms
of scalability still has issues. Proposed scheme by author is MAC protocol based on dual channel
token called (DT-MAC). This protocol is suitable for large number of user in terms of scalability
and efficiency. Token management is extra overhead for network and it is not suitable for upper
layer. In [6] wireless mesh network high throughput need a TDMA based approach. TDMA
support multichannel transmission, schedule dissemination and routing integration. TDMA based
on routing metrics and stability of routing metrics. Experiment shows that it control the network
overhead and it not affected by external interference. It is not useful for large network. In [3]
TDMA each frame is associated with some slot, and non –conflicting link is transmitted through
these slots. Iterative procedure is used to find the nearest feasible schedule by exchanging the link
information between nodes. Another part is work on wave based termination which is used to
detect the scheduled nearest node and if any new node is scheduled which is activated. Spatial-
TDMA [9] used for reduced the energy consumption and improve the throughput author
formulate offline energy –throughput by the tradeoff curve. Physical interference involved where
node used for controlling the power. Author work is based on single channel or single node, it is
not feasible for multi-channel or multiple node scenario. Here [7] author works for high
throughput and reliable mesh network in multi-hop transmission. Reduce network bandwidth in
multicast tree. Author presents a distributed and centralized algorithm for tackle the problem of
multicasting. Obtained result from expected multicast transmission count (EMTX) method,

Computer Science & Information Technology (CS & IT) 111
shows the effectiveness it reduces the number of hop-by-hop transmission per packet, but it not
considerable for real life or realistic scenario. A hierarchical mesh tree protocol given in [10]
which achieve efficient routing at the MAC layer. Optimal route is chosen by the using of mesh
tree topology. The used new HMTP also used for maintaining the update of new route formed.
The HMTP topology overcomes the drawback cluster-tree. In[8] improvement of QoS by
avoiding the network congestion, an algorithm is designed for that prediction of congestion is
done before it really happen by using different data, analysis of network and used the historical
data of traffic to generate idea of future network traffic. Through network traffic data, load
balancing is done to avoid congestion in wireless mesh network. But author proposed algorithm
is inefficient to response network congestion properly.
2.1 Issues and Challenges Faced in Multi Radio Wireless Mesh Network
Using IEEE 802.15.5 standard WMN in free frequency bands for wireless communications traffic
has the following issue the need to be addressed as in [12]:
Speed of mobile devices. Physical and transport levels of IEEE 802.15.5 developed for fixed
stations, where high speed can lead to large and rapid changes in channel conditions, which in
turn increases the probability of frame error (FER). This occurrence is due to the Rayleigh fading
channel [11].
Distance: IEEE 802.15.5 is used for communications over short distances of several hundred
meters. Together with this limitation there is a necessity in a large number of access
points/roadside stations (remote control) to cover the entire route. Usually 802.15.5 transmits a
plurality of control frames and messages for the association and/or network authentication before
transmitting useful information.
Handover is also difficult to implement due to the high speed of vehicles on the road, where the
handoff occurs very frequently between the remote control for the entire route.
When designing a Mesh network appear the following difficulties:
Difficult to predict the number of subscribers on the network at different intervals. Difficulties in
predicting the amount of traffic generated by nodes, hence the total system capacity. The wireless
channel is stochastic and time-varying according to different parameters.
It is seen from literature that the existing mac based mesh network suffer improper channel slot
re-utilization. To overcome the short coming here the author propose an efficient cross layer
based channel slot re-utilization optimization based on node classification technique to improve
the QoS of WMNs.
The paper organization is as follows: The proposed channel slot re-utilization models are
presented in Section two. The results and the experimental study are presented in the section
three. The concluding remark is discussed in the last section.
3. PROPOSED MODEL Here the author proposes an adaptive cross layer based slot channel re-utilization optimization to
improve the QoS of WMNs. The slot re-utilization helps in reducing latency of data delivery LP

112 Computer Science & Information Technology (CS & IT)
LP but there is a chance or risk of beacon collision to some other devices that may join late to the
wireless mesh network. To address this here the author proposes a node classification based slot
re-utilization technique to reduce latency and propose robust wireless mess tree architecture.
3.1 Proposed Node Classification for Slot Re-utilization for WMN
Here the author classifies the device pair based on the information of parenthood and
neighbourhood relationship. The classified device pair (x, y) is as follows
3.1.1 Connected Inner Relay Node Pair (CIRP):
Here x and y are adjacent device that exist physically in the WMN, and either x and y are not
adjacent device; or, either x or y has a child, but xand y have a conjoint adjacent device which is
a child of either x or y.
3.1.2 Connected Leaf Relay Node Pair (CLRP):
Here x and y are adjacent devices that exist physically in the WMN, but neither x nor y has any
child.
3.1.3 Distant Inner Relay Node Pair (DIRP):
Here x and y are not adjacent devices physically but have a conjoint adjacent physical devices in
common, although all these adjacent physical devices are neither x's nor y's children.
3.1.4 Non-connected leaf node pair (NCLRP):
Here x and y are not adjacent physical devices, neither do they have adjacent physical devices in
common. Now the author propose channel slot reutilization by CLRP, DIRP and NCLRP when
the probability of is risk is small which is explained in below section.
3.2 Proposed Slot Re-Utilization for WMN
It is known fact that the radio coverage of a wireless transmitter suffer from path loss
phenomenon. A practical radio propagation model may consider random variations in path loss at

Computer Science & Information Technology (CS & IT) 113
different direction and location [13] and [14], [16] respectively. Subsequently the packet
transmission among pair of devices becomes a probabilistic task with probability distribution
utility considering direction or distance among the transmitter and the receiver as a parameter.
The proposed node or device-pair classification and communication evaluation are based on the
perception of adjacent physical devices, which represent a binary association considering that the
two nodes are either adjacent physical devices or are not. Such an association needs a setup of a
thresholding on packet or data reception probability for the decision of adjacent physical devices
in accordance to a source or transmitter. Subsequently the sources or transmitter operative range
of communications would be uneven. However, we can estimate the lower bound of the range of
transmission within which any nodes can have an association with the source or transmitter, or a
higher of the range, outside which no nodes will be able to receive the data from sources or
transmitter successfully.
The symbolization is represented as the lower bound, the upper bound, or the average bound of
range of communication, in which case it is essentially the worst case, best case or the mean case
risk parameters of the analytical result presented in the following sturdy.
3.2.1. Scheme 1:
The predictable mesh area of the particular region mutually covered by two devices and is
3.2.2. Proposition 1:
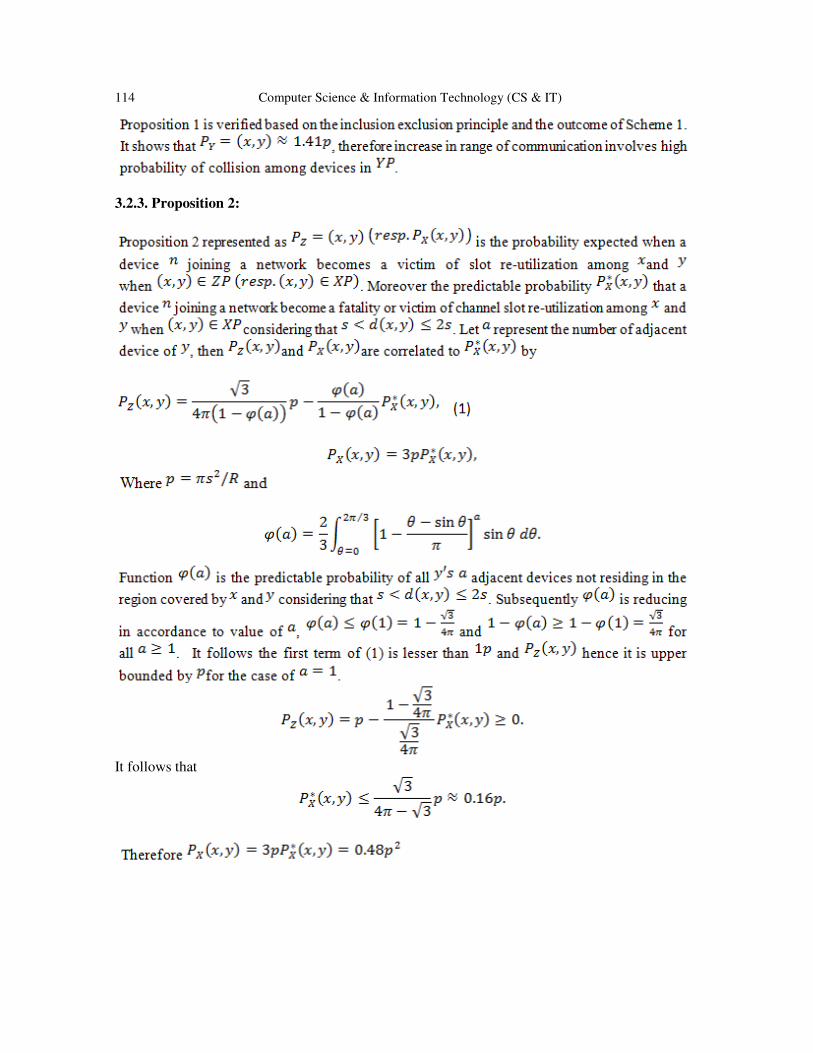
114 Computer Science & Information Technology (CS & IT)
3.2.3. Proposition 2:
It follows that

Computer Science & Information Technology (CS & IT) 115
3.2.4. Proposition 3:
Based on the definition of Proposition 2,
Where
The simulation sturdy of our proposed approach is evaluated in the below section of this paper.
4. SIMULATION RESULT AND ANALYSIS
The system environment used is windows 10 enterprises 64-bit operating system with 16GB of
RAM. The author have used visual studio Dot net framework 4.0, 2010 and used VC++
programming language. The author has conducted simulation study for probability analysis for
channel slot re-utilization by varying the node size and node degree.

116 Computer Science & Information Technology (CS & IT)
In Fig. 1, the author computes the probability of P_Z (x,y) by varying number of node or devices
and node degree value. In figure we can see that when we increase the node degree a value the
probability of collision also increases for all node sizes (50, 100, and 150). The probability of
collision is high for smaller mesh network size (50) when compared to larger network size (150).
Figure 1. Probability analysis for ����, ��
In Fig. 2, the author computes the probability of P_X (x,y)by varying number of node or devices
and node degree value. In figure we can see that when we increase the node degree a value the
probability of collision also increases for all node sizes (50, 100, and 150). The probability of
collision is high for smaller mesh network size (50) when compared to larger network size (150).
Figure 2. Probability analysis for ����, ��

Computer Science & Information Technology (CS & IT) 117
Figure 3. Probability analysis
6. CONCLUSIONS
The paper presents a model that help in the design of MWNs that meets the QoS necessities of
the end user. Here in this work we have presented a cross-layer based channel slot reutilization
model based on node classification technique that minimizes the collision for channel slot re-
utilization and thus helps in reducing latency for data transmission in WMN. The experimental
result shows the impact of proposed model on channel slot re-utilization. In future we would
conduct simulation sturdy for latency and compare our proposed model with other distributed,
centralized or MAC based scheduling algorithm.
REFERENCES [1] Chin-Ya Huang; Ramanathan, P., “Network Layer Support for Gigabit TCP Flows in Wireless Mesh
Networks,” in Mobile Computing, IEEE Transactions on , vol.14, no.10, pp.2073-2085, 2015.
[2] Anusha, M.; Vemuru, S.; Gunasekhar, T., "TDMA-based MAC protocols for scheduling channel
allocation in multi-channel wireless mesh networks using cognitive radio," in Circuit, Power and
Computing Technologies (ICCPCT), International Conference on , vol., no., pp.1-5, 2015.
[3] Djukic, P.; Valaee, S., "Distributed Link Scheduling for TDMA Mesh Networks," in
Communications, 2007. ICC '07. IEEE International Conference on , vol., no., pp.3823-3828, 24-28
2007.

118 Computer Science & Information Technology (CS & IT)
[4] Yu Cheng; Hongkun Li; Peng-Jun Wan; Xinbing Wang, “Wireless Mesh Network Capacity
Achievable Over the CSMA/CA MAC,” in Vehicular Technology, IEEE Transactions on , vol.61,
no.7, pp.3151-3165, 2012.
[5] Teymoori, Peyman; Yazdani, Nasser; Khonsari, Ahmad, “DT-MAC: An Efficient and Scalable
Medium Access Control Protocol for Wireless Networks,” in Wireless Communications, IEEE
Transactions on , vol.12, no.3, pp.1268-1278, 2013.
[6] Sevani, V.; Raman, B.; Joshi, P., “Implementation-Based Evaluation of a Full-Fledged Multihop
TDMA-MAC for WiFi Mesh Networks,” in Mobile Computing, IEEE Transactions on , vol.13, no.2,
pp.392-406, 2014.
[7] Xin Zhao; Jun Guo; Chun Tung Chou; Misra, A.; Jha, S.K., “High-Throughput Reliable Multicast in
Multi-Hop Wireless Mesh Networks,” in Mobile Computing, IEEE Transactions on , vol.14, no.4,
pp.728-741, April 1 2015.
[8] Khasawneh, F.A.; Benmimoune, A.; Kadoch, M.; Khasawneh, M.A., "Predictive Congestion
Avoidance in Wireless Mesh Network," in Future Internet of Things and Cloud (FiCloud), 2015 3rd
International Conference on , vol., no., pp.108-112, 24-26 Aug. 2015
[9] Ouni, A.; Rivano, H.; Valois, F.; Rosenberg, C., “Energy and Throughput Optimization of Wireless
Mesh Networks With Continuous Power Control,” in Wireless Communications, IEEE Transactions
on , vol.14, no.2, pp.1131-1142, 2015.
[10] Rabarijaona, V.H.; Kojima, F.; Harada, H., "Hierarchical mesh tree protocol for efficient multi-hop
data collection," in Wireless Communications and Networking Conference (WCNC), 2014 IEEE ,
vol., no., pp.2008-2013, 6-9 April 2014.
[11] Safronov, R.; Bakhtin, A.; Muravyev, I.; Muratchaev, S., "Designing roadside mesh network with
TDMA," in Ultra-Modern Telecommunications and Control Systems and Workshops (ICUMT), vol.,
no., pp.131-135, 2014.
[12] K. Bilstrup. A survey regarding wireless communication standarts intended for a high-speed mobile
environment// Technical Report IDE, 2007.
[13] G. Zhou, T. He, S. Krishnamurthy, and J.A. Stankovic, “Models and Solutions for Radio Irregularity
in Wireless Sensor Networks,” ACM Trans. Sensor Networks, vol. 2, no. 2, pp. 221-262, 2006.
[14] F. Kuhn, R. Wattenhofer, and A. Zollinger, “Ad Hoc Networks beyond Unit Disk Graphs,” Wireless
Networks, pp. 715-729, 2008.
[15] P. Hall, Introduction to the Theory of Coverage Processes. John Wiley and Sons, 1988.
[16] I. Stojmenovic, A. Nayak, and J. Kuruvila, “Design Guidelines for Routing Protocols in Ad Hoc and
Sensor Networks with a Realistic Physical Layer,” IEEE Trans. Comm., vol. 43, no. 3, pp. 101-106,
2005.
[17] L.-H. Yen and Y.-M. Cheng, “Clustering Coefficient of Wireless Ad Hoc Networks and the Quantity
of Hidden Terminals,” IEEE Comm. Letter, vol. 9, no. 3, pp. 234-236, 2005.
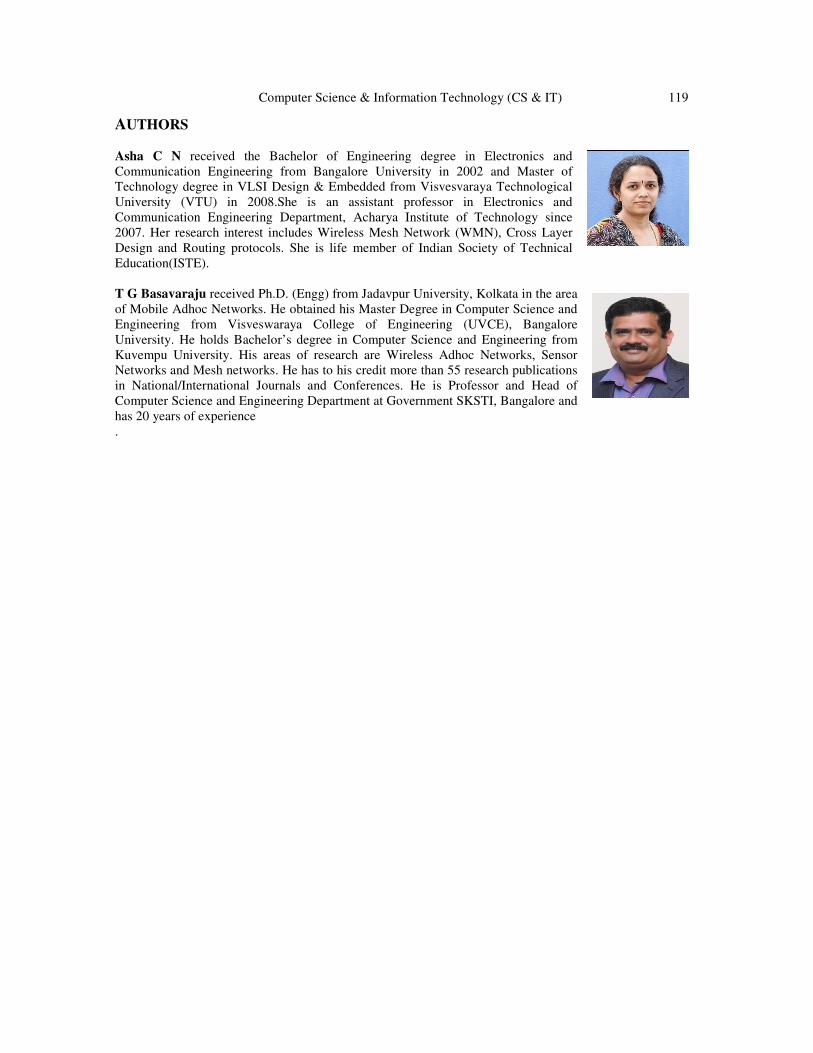
Computer Science & Information Technology (CS & IT) 119
AUTHORS
Asha C N received the Bachelor of Engineering degree in Electronics and
Communication Engineering from Bangalore University in 2002 and Master of
Technology degree in VLSI Design & Embedded from Visvesvaraya Technological
University (VTU) in 2008.She is an assistant professor in Electronics and
Communication Engineering Department, Acharya Institute of Technology since
2007. Her research interest includes Wireless Mesh Network (WMN), Cross Layer
Design and Routing protocols. She is life member of Indian Society of Technical
Education(ISTE).
T G Basavaraju received Ph.D. (Engg) from Jadavpur University, Kolkata in the area
of Mobile Adhoc Networks. He obtained his Master Degree in Computer Science and
Engineering from Visveswaraya College of Engineering (UVCE), Bangalore
University. He holds Bachelor’s degree in Computer Science and Engineering from
Kuvempu University. His areas of research are Wireless Adhoc Networks, Sensor
Networks and Mesh networks. He has to his credit more than 55 research publications
in National/International Journals and Conferences. He is Professor and Head of
Computer Science and Engineering Department at Government SKSTI, Bangalore and
has 20 years of experience
.

120 Computer Science & Information Technology (CS & IT)
INTENTIONAL BLANK

David C. Wyld et al. (Eds) : CSITY, SIGPRO, AIFZ, NWCOM, DTMN, GRAPHHOC - 2016
pp. 121–134, 2016. © CS & IT-CSCP 2016 DOI : 10.5121/csit.2016.60411
ASSOCIATIVE REGRESSIVE DECISION
RULE MINING FOR PREDICTING
CUSTOMER SATISFACTORY PATTERNS
SHUBHA. S
1 and Dr. P. SURESH
2
1Research Scholar, Bharathiar University, Coimbatore & Asst. Prof.,
Dept. of Computer Science, GFGC,
Malleshwaram, Bangalore, Karnataka, India. [email protected]
2Research Supervisor & HOD of Computer Science,
Salem Soudeshwari College, Salem, Tamilnadu, India. [email protected]
ABSTRACT
Opinion mining also known as sentiment analysis, involves customer satisfactory patterns,
sentiments and attitudes toward entities, products, services and their attributes. With the rapid
development in the field of Internet, potential customer’s provides a satisfactory level of
product/service reviews. The high volume of customer reviews were developed for
product/review through taxonomy-aware processing but, it was difficult to identify the best
reviews. In this paper, an Associative Regression Decision Rule Mining (ARDRM) technique is
developed to predict the pattern for service provider and to improve customer satisfaction based
on the review comments. Associative Regression based Decision Rule Mining performs two-
steps for improving the customer satisfactory level. Initially, the Machine Learning Bayes
Sentiment Classifier (MLBSC) is used to classify the class labels for each service reviews. After
that, Regressive factor of the opinion words and Class labels were checked for Association
between the words by using various probabilistic rules. Based on the probabilistic rules, the
opinion and sentiments effect on customer reviews, are analyzed to arrive at specific set of
service preferred by the customers with their review comments. The Associative Regressive
Decision Rule helps the service provider to take decision on improving the customer satisfactory
level. The experimental results reveal that the Associative Regression Decision Rule Mining
(ARDRM) technique improved the performance in terms of true positive rate, Associative
Regression factor, Regressive Decision Rule Generation time and Review Detection Accuracy of
similar pattern.
KEYWORDS
Associative Regression, Decision Rule Mining, Machine Learning, Bayes Sentiment
Classification, Probabilistic rules.
1. INTRODUCTION
Recently, novel method enriching semantic knowledge bases for opinion mining in big data
applications has been evolved. In Opinion mining, sentiment analysis is very difficult to discover like and dislike of people. Hence by learning matrices for words, model can handle unseen word
compositions.

122 Computer Science & Information Technology (CS & IT)
In order to estimate their helpfulness, text mining and predictive modeling techniques toward a
more complete analysis of the information captured by user-generated online reviews has been
presented by many researchers. Taxonomy Aware Catalog Integration (TACI) [1] integrated products coming from multiple providers by making use of provider taxonomy information
ensuring scalability that are typical on the web. However, tuning parameters does not update
unless significant improvement in accuracy to avoid over fitting and it does not use any target or
source taxonomy during training or application of classifier.
Tweet Analysis for Real-Time Event Detection and Earthquake (TA-RTED) [2] designed a
classifier based on the keywords in order to improve the earthquake detection extracted through
tweets. However, the registered location might not be current location of a tweet and it might not
hold for other events such as traffic jams, accidents, and rainbows.
Many researchers have published their study of machine learning approach. Machine learning
approach was developed using naïve Bayes [3] for identifying and distributing healthcare
information. However, the syntactic rule-based relation extraction systems are complex based on
additional tools.
Sara Hajian and Josep Domingo-Ferrer et al., [4] handles discrimination prevention in data
mining and it also used for direct or indirect discrimination prevention. However, it failed to
address the data distribution. An efficient algorithm was designed in [5] for detecting the top-k
totally and partially unsolved sequences. This algorithm also used for reducing the running time
and improving the accuracy while preserving data quality. However, it does not increase the
detection accuracy of similar pattern at a required level.
Opinion mining analyzed people’s opinions, sentiments, and attitudes toward entities products,
services, and their attributes. Characterization of event and prediction based on temporal patterns
are detected using multivariate reconstructed phase space (MRPS) [6] using fuzzy clustering
unsupervised method. However, the MRPS method provides more difficult event function for
different applications.
Intrinsic and extrinsic domain relevance criterion was developed in [7] aimed at improving the
feasibility and effectiveness of the approach. However, it difficult to detect opinion features,
including non-noun features, infrequent features, and implicit features collectively.
Probabilistic Generative Classifiers [8] used two or more classifiers resulting in the improvement
of similarity measure. However, it does not address the various prior distribution investigations.
The classification of trajectories on road networks was analyzed in [9] using frequent pattern-
based classification which improves the accuracy. However, it does not address the pattern-based
classification. The multi-class sentiment classification using that Extreme Learning Machine
(ELM) methods were described in [21] for detecting their respective performance in multi-class
sentiment classification of tweets. However, but it does not increases the classification accuracy
effectively.
The contribution of the paper is organized as follows. Associative Regression Decision Rule
Mining (ARDRM) technique is presented to predict the pattern for service owner and increasing their customer satisfaction based on their review comments. The Machine Learning Bayes
Sentiment Classifier is subjected in ARDRM technique to classify the class labels for each
service reviews. By applying the various probabilistic rules, the regressive factor of the opinion
words and Class labels are verified between the words. This helps to increase the review detection
accuracy.
The rest of the paper is organized as follows. Section 2 introduces several data mining models.
Section 3 introduces our Associative Regression Decision Rule Mining technique based on the customer review comments. Section 4 presents the experimental setting and Section 5 presents
the results of performance evaluation. Finally, the concluding remark is presented in Section 6.

Computer Science & Information Technology (CS & IT) 123
2. RELATED WORK
In [11], a predictive model using three classification algorithms called decision tree, Bayesian
classifier and back propagation neural network was presented. This model improved the diagnosis
and prediction of cerebrovascular disease. Another predictive model using gradient-boosted
regression tree [12] to make prediction aiming at reducing the execution flow. However the
prediction accuracy did not effectively increase.
Many research works were conducted to answer top-k queries using Pareto Based Dominant
Graph (DG) [10] aiming at improving the search efficiency. However, the relationship analysis
remained unaddressed. Fast Distributed Mining (FDM) algorithm was designed in [13] for mining
of association rules in horizontally distributed databases in a secured manner aiming at
minimizing the communication rounds, communication and computational cost.
With the emergence of social media, web users have opened with a venue for expressing and
sharing their thoughts and opinions related to different topics and events. Twitter feeds
classification based on a hybrid approach was presented in [14] to achieve higher accuracy.
However, this approach does not increase the accuracy at a required level.
In [15], a unified framework called, HOCTracker presented a novel density-based approach to
identify hierarchical structure of overlapping communities. Probabilistic neural network and
general regression neural network (PNN/GRNN) data mining model was planned in [16] for
detect and preventing the oral cancer at earlier stage and also provides higher accuracy.
An incremental classification algorithm in [17] with feature space heterogeneity efficiently
removed the outliers and extracted the relevant features at an early time period. In [18], an extensible method to mine experiential patterns from increasing game-logs was designed by
utilizing the growing patterns.
An enhanced k-means clustering was applied in [19] to reduce the coefficient of variation and
execution time using greedy approach for efficient discovery of patterns in health care data. In
[20], random forest predictions were made using random forest algorithm to display prediction
uncertainty. However, the true positive rate was not addressed.
Based on the aforementioned issues such as lack of detection in classification accuracy and
failure in detecting the specified event in customer reviews, Associative Regression Decision Rule Mining (ARDRM) technique is presented. The ARDRM technique helps the service
provider for improving the hotel customer satisfactory level at different cities. The detailed
explanation is presented in forthcoming section.
3. DESIGN OF ASSOCIATIVE REGRESSION DECISION RULE MINING
Our technique Associative Regression based Decision Rule Mining is been done in two step
process. First, the Machine Learning Bayes Sentiment Classification use a base classifier where
the class labels for each product/service reviews is classified. Then the opinion words and class
labels are used to obtain the regressive factor using various probabilistic rules to produce a final
decision on improving the customer satisfaction referred to as the Associative Regression
Decision Rule model. These two steps are now discussed in detail.
Figure 1 shows the workflow of Associative Regression Decision Rule Mining technique. Given
a domain-dependent review comments (i.e. opinion words) extracted from OpinRank dataset that
includes the reviews of hotels in 15 different cities, we first extract a list of class labels from the
Machine Learning Bayes Sentiment Classification via semantic equivalence of sentiments
classification.
For each extracted class labels, we estimate its regression factor which represents the statistical
association between opinion words and class labels. The resultant regressive sequence inferred is

124 Computer Science & Information Technology (CS & IT)
then applied with probabilistic rules to arrive at specific set of services preferred by the
customers.
Figure 1. Workflow of Associative Regression Decision Rule Mining technique
3.1. Design of Regressive Sequencing Model
The first step in the design of ARDRM technique is to obtain the class labels generated from
Machine Learning Bayes Sentiment Classification (MLBSC) techniques. Here the sentiment class
labels are extracted using Probabilistic Bayes Classifier. In MLBSC, Probabilistic Bayes
Classifier is applied on the semantic opinion words to evaluate sentiment class label using the
maximum likelihood estimates (MLE). The MLE of a training list (i.e. bag of words extracted
from OpinRank dataset) belonging to a specific class are mathematically evaluated as given
below.
��� ���� = ��� � �� �� � ���� ��� ��� �� ����� �� ����� �
����� ����� �� ����� � ���� ��� ��� �� ����� �� ����� � (1)
From (1), the maximum likelihood estimates is the ratio of count of semantic opinion words of
class ‘�’ to the total number of words. Followed by this, the class labels generated from MLBSC
are subjected to regressive sequencing to infer the sentiments reflected in the customer reviews.
The regressive sequencing in ARDRM technique is produced with the aid of support and
confidence value.
Let us assume that ‘� = � , �", … , � ’ represents a binary set consisting of opinion words with
‘ � , �", … , � ’ referred to as items. Let us further assume that Transaction ‘ $ ’ (i.e. review

Computer Science & Information Technology (CS & IT) 125
comments) is the itemset with ‘$ ∈ �’. Let ‘&’ be the set containing items in ‘�’ and transaction
‘ $ ’contains ‘& ’ if ‘& ∈ $ ’, then the support denotes the probability of frequent itemsets'
occurrence. Smaller value of minsup results in larger number of rules whereas larger value of
minsup results in smaller number of rules.
The support of rule ‘& → (’ in the transaction database ‘$)’ is the ratio between the transaction
number including ‘&’ and ‘(’ in the transaction sets and all the transaction number, which is then
written as ‘*+& ,& → (-’.
*+& ,& → (- = .��� ,./-0 (2)
The confidence of the rule ‘& → (’ in the transaction sets is the ratio between the transaction
number including ‘&’ and ‘(’ and those including ‘&’, which is written as ‘�123 ,& → (-’. Therefore,
�123 ,& → (- = .��� ,./-.��� ,.- (3)
From (2) and (3), the sentiments reflected in customer reviews are obtained by using support and
confidence value. This aids in achieving the true positive rate of customer reviews in an extensive
manner. Once, the support and confidence value for customer reviews are generated, the
regressive sequencing is designed. In MLBSC, the regressive sequencing model uses two
variables ‘4 ’ and ‘4"’ where ‘4 ’ represents ‘5�6789’ and ‘4"’ represents ‘5�6:;6<’ to infer
the sentiments reflected in the customer reviews. The mathematical formulates for ‘4 ’ and ‘4"’ is
as given below.
= = >? + > � ABC
+ >" � ACC
(4)
= = >? + > � AB
+ >" � AC
(5)
= = >? + > ,4 - + >" ,4"- (6)
The regressive factor (i.e. ‘4 ’ and ‘4"’) of the opinion words with class labels are checked for the
association between the words. This in turn improves the associative regression factor in a
significant manner. Figure 2 shows the algorithmic description of Regressive Sequencing
algorithm.
Input: opinion words ‘� = � , �", … , � ’, Transaction ‘$’,
Output: Optimized true positive rate
Step 1: Begin
Step 2: For each Transaction ‘$’ with opinion words ‘�’
Step 3: Measure the value for support using (2)
Step 4: Measure the value for confidence using (3)
Step 5: Measure ‘5�6789’ and ‘5�6:;6<’ using (6)
Step 6: End for
Step 7: End
Figure 2. Regressive Sequencing algorithm
From the above figure 2, the Regressive Sequencing algorithm performs three steps. For each
transaction, customer reviews obtained from OpinRank dataset that includes hotel reviews is
given as input. The first step evaluates the support value, followed by the measure of confidence
value in order to identify the sentiments reflected in customer reviews. Finally, with the objective

126 Computer Science & Information Technology (CS & IT)
of improving the associative regression factor, sentiments reflected in customer reviews
‘5�6789’ and ‘5�6:;6<’ are evaluated to check the association between the words.
3.2. Design of Associative Regressive Decision Rule
The second step in the design of ARDRM technique is to construct Associative Regressive
Decision Rule. Various probabilistic rules are generated for the class objects in the corresponding
classes with more similar patterns together. Based on the probabilistic rules, the opinion and
sentiments effect on customer reviews are analyzed to arrive at specific set of services preferred by the customers with their review comments. The Associative Regressive Decision Rule helps
the service providers to take decision on how to improve the hotel customer satisfactory level.
Next, the frequent itemset generation algorithm is designed to the regressive sequenced dataset
which is obtained through regressive sequencing model. Redundant regressive rules generated are
eliminated using redundant regressive decision rule testing.
3.2.1. Redundant Regressive Decision Rule Testing
Redundant regressive decision rule testing is performed in ARDRM technique aiming at
minimizing the regressive decision rule generation time and removes the redundancy involved.
This is performed through elimination of redundant decision rule through regressive model.
&� , &�,&� . . , & → ∑ ,4 , F�, G�- �H (7)
First set of QRS�R6:T ,&��- = &� − &� (8)
Second set of variance ,&��- = &� − &� (9)
From (7), ‘F�’ symbolizes the mean of the target review for the class objects and ‘G�’ symbolizes
the variance of the target review for the class objects. In (7), the mean and variance are evaluated.
The variance of the association rules are calculated using (8), (9) where &�, &�,&� are the target
reviews for class object. If the variance (first set) of the association rule is lower than the variance
(second set) of the association rule, then redundancy is said to be occurred in the first set. On
contrary, if the variance (first set) of the association rule is greater than the variance (second set)
of the association rule, then redundancy is said to be occurred in the second set. By using
specified threshold value, the redundant rules are eliminated. If the identified redundancy value is obtained within the threshold value, the redundant rules are eliminated. The Redundancy value is
possibly occurred within the thresholding value. This in turn minimizes the regressive decision
rule generation time.
3.2.2. Associative Regressive Decision Model
Once the redundant rules are eliminated using redundant regressive decision rule testing then,
finally associative regressive decision model is designed to arrive at specific set of service
preferred by the customers. Building an associative regressive decision model requires selection
of a smaller, representative set of rules in order to provide an accurate representation of the
training data.
The frequent itemset generation algorithm is shown in figure 3 to select the rule in an efficient
manner by first sorting the rule, and then remove the occurrences covered by the rule. As shown
in the algorithm, for each itemset, the algorithm starts with the elimination of redundant rule.
Followed by this rule redundant removal, the occurrence of redundancy is observed and removed
in specified threshold value. Then rule sorting is performed based on the pair of rules. Finally,
Associative Regressive Decision model is applied to the generated rules that help the service provider to customer satisfactory level.
Let us consider a pair of rules, ‘\8]T ’ and ‘\8]T"’ where ‘\8]T ≫ \8]T"’. This implies that
‘\8]T ’ has higher preference over ‘\8]T"’ and is formulated as given below.

Computer Science & Information Technology (CS & IT) 127
�<,\8]T ≫ \8]T"- → _\) = \8]T , \8]T" (8)
�<,\8]T" ≫ \8]T - → _\) = \8]T", \8]T (9)
Input: mean of the target review for the class objects ‘F�’, variance of the target review for the
class objects ‘G�’, first set &��, second set &��,
Output: Improved customer satisfactory level
Step 1: Begin
Step 2: For each set &�
Step 3: Perform redundant rule elimination through
Step 4: If G�(&��) < G� (&��)
Step 5: Redundancy is found in said to be occurred in (&��-
Step 6: End if
Step 7: If G�(&��) > G� (&��)
Step 8: Redundancy is found in said to be occurred in (&��-
Step 9 : End if
Step 10: If ( $̀ ≥ STb86bR6:4 QR]8T -
Step 11: The redundant rule is eliminated
Step 12: End if
Step 13: End for
Step 15: Perform rule sorting
Step 16: If ,\8]T ≫ \8]T"-
Step 17: _\) = \8]T , \8]T"
Step 18: End if
Step 19: If ,\8]T" ≫ \8]T -
Step 20: _\) = \8]T", \8]T
Step 21: End if
Step 22: Perform Associative regressive decision model using (10)
Step 23: End
Figure 3. Associative regressive decision-based frequent itemset generation algorithm
On contrary, if ‘\8]T" ≫ \8]T ’, then ‘\8]T" ’ has higher preference over ‘\8]T ’. Once the
sorted rules are obtained, the final step is to design Associative Regressive Decision model. The Associative Regressive Decision model is designed in such a way that, the rule has higher support
value and has lower variance when ‘\8]T ’ and ‘\8]T"’ are applied. Then, the mathematical
formulates
,\8]T , \8]T"- → ,�R=*89 ,\8]T , \8]T"-, ��6cRS ,\8]T , \8]T"- (10)
Based on (10), several probabilistic rules are generated for the class objects with more similar
patterns together and also the rule the service preferred by the customers with their review
comments. This in turn helps the service providers to take decision on improving the customer

128 Computer Science & Information Technology (CS & IT)
satisfactory level, thereby improving the review detection accuracy based on the review
comments of the customers.
4. EXPERIMENTAL SETTINGS
Associative Regression Decision Rule Mining (ARDRM) technique uses JAVA platform with
WEKA tool to predict a predictive pattern for service owner to improve their customer
satisfaction based on their review comments. This method is widely used to perform efficient predictive pattern mining model with the tests and training samples. Hotel Customer Service
Reviews (eg: OpinRank Dataset - Reviews from TripAdvisor) is taken to perform the
experimental work. The training model for OpinRank dataset includes entire hotel reviews
situated in 10 different cities (Dubai, Beijing, London, New York, New Delhi, San Francisco,
Shanghai, Montreal, Last Vegas and Chicago) with the aid of Java platform and with WEKA tool.
This dataset has been chosen because it gives a clear picture that helps in analyzing the comments
made by tourists about hotel rooms and food provided. The total number of reviews included in
OpinRank dataset is 250,000. For experimental purpose, we reviewed using 350 and the extracted
field includes date of review, review title and full review made by the tourists.
The performance of Associative Regression Decision Rule Mining (ARDRM) technique is
compared with Taxonomy-Aware Catalog Integration (TACI) [1], and Tweet Analysis for Real-
Time Event Detection and Earthquake (TA-RTED) [2]. The tests on OpinRank dataset were
conducted to evaluate four parameters: true positive rate, associative regression factor, regressive
decision rule generation time and review detection accuracy of similar pattern.
5. DISCUSSION
The Associative Regression Decision Rule Mining (ARDRM) technique is compared against the
existing Taxonomy-Aware Catalog Integration (TACI) [1] and Tweet Analysis for Real-Time
Event Detection and Earthquake (TA-RTED) [2]. The experimental results using JAVA platform with WEKA are compared and analyzed with the aid of graph form as given below.
5.1. Impact of True positive rate
The true positive rate is the sentiments correctly identified as belonging to a specific class in
customer reviews words correctly identified as belonging to a specific class. The true positive rate
is mathematically formulated as given below.
$&\ = �defghiefgd jkllejgmn hoefghpheo qd remkfshfs gk q jmqdd� ∗ 100 (11)
From (11), the true positive rate ‘$&\’ is obtained using the class ‘�’ where each class consists of
different number of sentiments extracted from user review. It is measured in terms of percentage
(%). The convergence plot for 7 classes is depicted in table 1 and figure 4. From the figure 4 we
can note that the proposed ARDRM technique achieved maximum true positive rate on
sentiments being correctly identified as belonging to a specific class when compared to other
methods.
Table 1. Tabulation for true positive rate
Class (C) True Positive Rate (%)
ARDRM TACI TA-RTED
Class 1 84.32 73.15 68.21
Class 2 88.15 77.12 71.08
Class 3 91.35 80.32 74.28
Class 4 85.21 74.18 68.10
Class 5 87.57 76.54 70.46
Class 6 89.32 78.29 72.22
Class 7 92.14 81.11 75.04

Computer Science & Information Technology (CS & IT) 129
Figure 4 Measure of true positive rate
Figure 4 shows the true positive rate on sentiments being correctly identified as belonging to a
specific class is increased with the application of maximum likelihood estimates when compared
to the existing methods. The maximum likelihood estimates in ARDRM technique effectively
constructs sentiment class label for the testing and training data extracted from OpinRank dataset.
Therefore, the true positive rate is improved by 12.52% compared to TACI [1]. Moreover, by
evaluating the support and confidence value, probability of frequent itemsets occurrence are made
in a significant manner. As a result, the true positive rate is increased by 19.21% compared to TA-RTED [2].
5.2. Impact of associative regression factor
Table 2 shows the associative regression factor using the three methods, ARDRM, TACI [1] and
TA-RTED [2] respectively. The associative regression factor in table 2 was measured with the aid
of 7 classes and 35 rules generated from 350 customer review words extracted from the
OpinRank dataset.
Table 2 Tabulation for associative regression factor
METHODS ASSOCIATIVE REGRESSION FACTOR (%)
ARDRM 81.35
TACI 74.19
TA-RTED 65.18
Figure 5. Measure of associative regression factor

130 Computer Science & Information Technology (CS & IT)
Figure 5 shows the measure of associative regression factor with respect to 350 customer review
words obtained from OpinRank dataset. The associative regression factor using ARDRM is
improved when compared to two other methods [1] and [2]. This is due to the application of Regressive Sequencing algorithm. By applying Regressive Sequencing algorithm, the support
and confidence value are evaluated according to the sentiments reflected in the customer review.
This in turn improves the associative regression factor using ARDRM by 8.80% compared to
TACI and 12.14% compared to TA-RTED respectively.
5.3. Impact of Regressive decision rule generation time
The regressive decision rule generation time is measured using the number of rules and the time
to extract single rule. The mathematical formulation for regressive decision rule generation time
is given as below.
)\w$ = ∑ \8]T� ∗ $�5T , �H \8]T�- (12)
From (12), the execution time ‘)\w$’ is measured using the number of rules ‘\8]T� ’ and
measured in terms of milliseconds. Lower the regressive decision rule generation time more
efficient the method is said to be. Convergence characteristics for the measure of Time to extract
opinions from customer reviews for 35 rules extracted from different customers are considered
and compared with two other methods and are shown in table 3.
Table 3. Tabulation for time to extract opinions from reviews
Number of rules Time to extract opinions from customer reviews (ms)
ARDRM TACI TA-RTED
5 1.31 1.68 1.85
10 2.51 2.81 3.05
15 3.79 4.02 4.22
20 4.96 5.26 5.48
25 5.85 6.15 6.35
30 6.3 6.60 6.80
35 8.32 8.62 8.82
Figure 6 Measure of Regressive decision rule generation time
The targeting results of Regressive decision rule generation time for extracting predictive pattern
using ARDRM technique is compared with two state-of-the-art methods [1], [2] in figure 6 is
presented for visual comparison based on the number of rules. Our method differs from the FM-
TACI [1] and TA-RTED [2] in that we have incorporated associative regressive decision rule.
The associative regressive decision rule applies probabilistic rules using the mean and variance
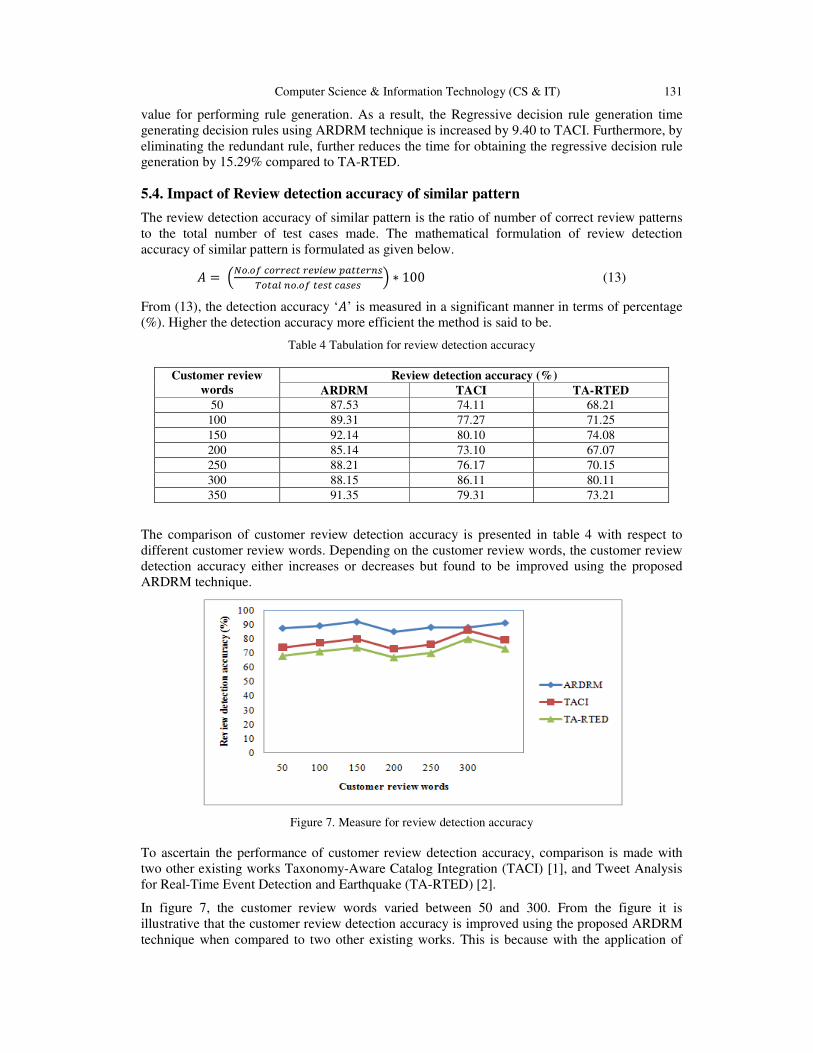
Computer Science & Information Technology (CS & IT) 131
value for performing rule generation. As a result, the Regressive decision rule generation time
generating decision rules using ARDRM technique is increased by 9.40 to TACI. Furthermore, by
eliminating the redundant rule, further reduces the time for obtaining the regressive decision rule generation by 15.29% compared to TA-RTED.
5.4. Impact of Review detection accuracy of similar pattern
The review detection accuracy of similar pattern is the ratio of number of correct review patterns
to the total number of test cases made. The mathematical formulation of review detection
accuracy of similar pattern is formulated as given below.
_ = �0�.�� ������� ��x��� ������ ������ �.�� ���� ����� ∗ 100 (13)
From (13), the detection accuracy ‘_’ is measured in a significant manner in terms of percentage
(%). Higher the detection accuracy more efficient the method is said to be.
Table 4 Tabulation for review detection accuracy
Customer review
words
Review detection accuracy (%)
ARDRM TACI TA-RTED
50 87.53 74.11 68.21
100 89.31 77.27 71.25
150 92.14 80.10 74.08
200 85.14 73.10 67.07
250 88.21 76.17 70.15
300 88.15 86.11 80.11
350 91.35 79.31 73.21
The comparison of customer review detection accuracy is presented in table 4 with respect to
different customer review words. Depending on the customer review words, the customer review
detection accuracy either increases or decreases but found to be improved using the proposed
ARDRM technique.
Figure 7. Measure for review detection accuracy
To ascertain the performance of customer review detection accuracy, comparison is made with
two other existing works Taxonomy-Aware Catalog Integration (TACI) [1], and Tweet Analysis
for Real-Time Event Detection and Earthquake (TA-RTED) [2].
In figure 7, the customer review words varied between 50 and 300. From the figure it is
illustrative that the customer review detection accuracy is improved using the proposed ARDRM
technique when compared to two other existing works. This is because with the application of

132 Computer Science & Information Technology (CS & IT)
Associative regressive decision-based frequent itemset generation algorithm, the ARDRM
technique chooses the rule in a greedy manner by first sorting the rule and detaches the
occurrences covered by the rule.
In this way, the customer review detection accuracy is improved using ARDRM by 12.16% when
compared to TACI [1]. Furthermore, by applying associative regressive decision model when
applied to the generated rules, with higher support value and lower variance improves the
customer satisfactory level, therefore improving the review detection accuracy based on their
review comments of the customers by 18.93% than when compared to TA-RTED [2].
5.5. Performance analysis of customer review classification accuracy using proposed
ARDRM and Extreme Learning Machine
The result analysis of the proposed Associative Regression Decision Rule Mining (ARDRM)
method is compared with existing Multi-class Sentiment Classification using Extreme Learning
Machine (MSC- ELM) [21].
Figure 8. Measure of review classification accuracy
Figure 8 illustrates the customer review classification accuracy of proposed ARDRM and existing Multi-class Sentiment Classification using Extreme Learning Machine (MSC- ELM). From the
figure, the customer review classification accuracy is increased in ARDRM. This is because, the
Machine Learning Bayes Sentiment Classifier (MLBSC) is applied in ARDRM to classify the
class labels for each service reviews. Therefore, the classification accuracy is effectively
increased by 6% in ARDRM method compared to existing Multi-class Sentiment Classification
using Extreme Learning Machine (MSC- ELM) [21].
6. CONCLUSION
In this work, an effective technique called Associative Regression Decision Rule Mining
(ARDRM) is presented. The technique improves the review detection accuracy that in turn
improves the customer satisfaction based on their review comments and associative regression
factor. The goal of Associative Regression Decision Rule Mining is to improve the true positive rate with sentiments correctly identified as belonging to a specific class and therefore to improve
the associative regression factor using the customer review words extracted from OpinRank
dataset which significantly contribute to the relevance. To do this, we first designed a Machine
Learning Bayes Sentiment Classification technique that measures the sentiment class labels based
on the Maximum Likelihood estimates for OpinRank dataset this helps to increases the
classification accuracy. Then, based on this measure, we proposed a Regressive Sequencing
algorithm for improving the association regression factor in an extensive manner. In addition the
associative regressive decision rule with frequent itemset generation algorithm eliminates the
redundant rule and therefore reduces the time ot extract opinions reviews and therefore true
positive rate. Finally, the associative regressive decision model improves the customer review

Computer Science & Information Technology (CS & IT) 133
detection accuracy. Extensive experiments were carried out using JAVA and compared with
existing methods. The results show that ARDRM technique offers better performance with an
improvement of review detection accuracy by 15.55% and reduces the time taken to extract opinions from reviewers by 12.34% compared to TACI and TA-RTED respectively.
ACKNOWLEDGEMENTS
We thank each one of those who are directly or indirectly helpful in the preparation of this paper.
And also we thank our family members for their continuous support and encouragement.
REFERENCES
[1] Panagiotis Papadimitriou, Panayiotis Tsaparas, Ariel Fuxman, and Lise Getoor, “TACI: Taxonomy-
Aware Catalog Integration”, IEEE Transactions on Knowledge and Data Engineering, Volume 25,
Issue 7, July 2013, Pages 1643-1655.
[2] Takeshi Sakaki, Makoto Okazaki, and Yutaka Matsuo, “Tweet Analysis for Real-Time Event
Detection and Earthquake Reporting System Development”, IEEE Transactions on Knowledge and
Data Engineering, Volume 25, Issue 4, April 2013, Pages 919-931.
[3] Oana Frunza, Diana Inkpen, and Thomas Tran, “A Machine Learning Approach for Identifying
Disease-Treatment Relations in Short Texts”, IEEE Transactions on Knowledge and Data
Engineering, Volume 23, Issue 6, June 2011, Pages 801-814.
[4] Sara Hajian and Josep Domingo-Ferrer, “A Methodology for Direct and Indirect Discrimination
Prevention in Data Mining”, IEEE Transactions on Knowledge and Data Engineering, Volume 25,
Issue 7, July 2013, Pages 1445-1459.
[5] Massimiliano Albanese, Cristian Molinaro, Fabio Persia, Antonio Picariello, and V.S. Subrahmanian,
“Discovering the Top-k Unexplained Sequences in Time-Stamped Observation Data”, IEEE
Transactions on Knowledge and Data Engineering, Volume 26, Issue 3, March 2014, Pages 577-594.
[6] Wenjing Zhang, and Xin Feng, “Event Characterization and Prediction Based on Temporal Patterns in
Dynamic Data System”, IEEE Transactions on Knowledge and Data Engineering, Volume 26, Issue
1, January 2014, Pages 144-156.
[7] Zhen Hai, Kuiyu Chang, Jung-Jae Kim, and Christopher C. Yang, “Identifying Features in Opinion
Mining via Intrinsic and Extrinsic Domain Relevance”, IEEE Transactions on Knowledge and Data
Engineering, Volume 26, Issue 3, March 2014, Pages 623-634.
[8] Dominik Fisch, Edgar Kalkowski, and Bernhard Sick, “Knowledge Fusion for Probabilistic
Generative Classifiers with Data Mining Applications”, IEEE Transactions on Knowledge and Data
Engineering, Volume 26, Issue 3, March 2014, Pages 652-666.
[9] Jae-Gil Lee, Jiawei Han, Xiaolei Li, and Hong Cheng, “Mining Discriminative Patterns for
Classifying Trajectories on Road Networks”, IEEE Transactions on Knowledge and Data
Engineering, Volume 23, Issue 5, May 2011, Pages 713-726.
[10] Lei Zou, and Lei Chen, “Pareto-Based Dominant Graph: An Efficient Indexing Structure to Answer
Top-K Queries”, IEEE Transactions on Knowledge and Data Engineering, Volume 23, Issue 5, May
2011, Pages 727-741.
[11] Duen-Yian Yeh , Ching-Hsue Cheng ,Yen-Wen Chen, “A predictive model for cerebro vascular
disease using data mining”, Elsevier, Expert Systems with Applications, Volume 38, Issue 7, July
2011, Pages 8970–8977.
[12] Nima Asadi, Jimmy Lin, Arjen P. de Vries, “Runtime Optimizations for Prediction with Tree-Based
Models”, IEEE Transactions on Knowledge and Data Engineering, Volume 26, Issue 9, September
2014, Pages 2281-2292.
[13] Tamir Tassa, “Secure Mining of Association Rules in Horizontally Distributed Databases”, IEEE
Transactions on Knowledge and Data Engineering, Volume 26, Issue 4, April 2014, Pages 970-983.
134 Computer Science & Information Technology (CS & IT)
[14] Farhan Hassan Khan, Saba Bashir , Usman Qamar, “TOM: Twitter opinion mining framework using
hybrid classification scheme”, Elsevier, Decision Support Systems, Volume 57, January 2014, Pages
245–257.
[15] Sajid Yousuf Bhat and Muhammad Abulaish, “HOCTracker: Tracking the Evolution of Hierarchical
and Overlapping Communities in Dynamic Social Networks”, IEEE Transactions on Knowledge and
Data engineering, Volume 27, Issue 4,April 2014, Pages 1019-1032.
[16] Neha Sharma and Hari Om, “Usage of Probabilistic and General Regression Neural Network for
Early Detection and Prevention of Oral Cancer”, Hindawi Publishing Corporation, The Scientific
World Journal, Volume 2015(2015), May 2015, Pages 1-12.
[17] Yu Wang, “An Incremental Classification Algorithm for Mining Data with Feature Space
Heterogeneity”, Hindawi Publishing Corporation, Mathematical Problems in Engineering, Volume
2014 (2014), February 2014, Pages 1-10.
[18] LiangWang, Yu Wang, and Yan Li, “Mining Experiential Patterns from Game-Logs of Board Game”,
Hindawi Publishing Corporation, International Journal of Computer Games Technology, Volume
2015, December 2014 , Pages 1-21.
[19] Ramzi A. Haraty, Mohamad Dimishkieh and MehediMasud, “An Enhanced k-Means Clustering
Algorithm for Pattern Discovery in Healthcare Data”, Hindawi Publishing Corporation, International
Journal of Distributed Sensor Networks, Volume 2015, December 2014, Pages 1-12.
[20] Mareike Lie, Martin Hitziger, and Bernd Huwe, “The Sloping Mire Soil-Landscape of Southern
Ecuador: Influence of Predictor Resolution and Model Tuning on Random Forest Predictions”,
Hindawi Publishing Corporation, Applied and Environmental Soil Science, Volume 2014, February
2014, Pages 1-11.
[21] Wang, Zhaoxia, and Yogesh Parth "Extreme Learning Machine for Multi-class Sentiment
Classification of Tweets." Proceedings of ELM-2015 Volume 1, Springer International Publishing,
2016. 1-11

David C. Wyld et al. (Eds) : CSITY, SIGPRO, AIFZ, NWCOM, DTMN, GRAPHHOC - 2016
pp. 135–147, 2016. © CS & IT-CSCP 2016 DOI : 10.5121/csit.2016.60412
A ROUTING PROTOCOL ORPHAN-LEACH TO JOIN ORPHAN NODES IN WIRELESS
SENSOR NETWORK
Wassim JERBI
1, Abderrahmen GUERMAZI
2 and Hafedh TRABELSI
3
1Higher Institute of Technological Studies, 3099 El Bustan Sfax, Tunisia.
[email protected] 2Higher Institute of Technological Studies, 3099 El Bustan Sfax, Tunisia.
[email protected] 3CES research unit, National School of Engineering of Sfax,
University of Sfax, Tunisia. [email protected]
ABSTRACT
The hierarchical routing protocol LEACH (Low Energy Adaptive Clustering Hierarchy) is
referred to as the basic algorithm of distributed clustering protocols. LEACH allows clusters
formation. Each cluster has a leader called Cluster Head (CH). The selection of CHs is made
with a probabilistic calculation. It is supposed that each non-CH node join a cluster and
becomes a cluster member. Nevertheless, some CHs can be concentrated in a specific part of the
network. Thus several sensor nodes cannot reach any CH. As a result, the remaining part of the
controlled field will not be covered; some sensor nodes will be outside the network. To solve this
problem, we propose O-LEACH (Orphan Low Energy Adaptive Clustering Hierarchy) a routing
protocol that takes into account the orphan nodes. Indeed, a cluster member will be able to play
the role of a gateway which allows the joining of orphan nodes. If a gateway node has to
connect a important number of orphan nodes, thus a sub-cluster is created and the gateway
node is considered as a CH’ for connected orphans. As a result, orphan nodes become able to
send their data messages to the CH which performs in turn data aggregation and send
aggregated data message to the CH. The WSN application receives data from the entire network
including orphan nodes.
The simulation results show that O-LEACH performs better than LEACH in terms of
connectivity rate, energy, scalability and coverage.
KEYWORDS
WSNs; routing; LEACH; O-LEACH; Orphan nodes; sub-cluster; gateway; CH’
1. INTRODUCTION
LEACH [1] is considered as the basic hierarchical routing protocol (cluster-based approach). It is
also one of the most popular cluster based routing algorithms for (Wireless Sensor Networks)
WSNs. It combines both the efficiency in energy consumption and the quality of access to the
media, and it is based on the division into groups, with a view allowing the use of the concept of
data aggregation for a better performance in terms of lifetime.
Cluster Heads (CH) are randomly chosen in a specific election algorithm based on a probability
function that takes into account various criteria such as the available energy. The routing

136 Computer Science & Information Technology (CS & IT)
protocols are actually divided into two families: central data and hierarchical routing protocols. In
a hierarchical topology, can be cited references protocols, Younis et al. (2004) have proposed a
HEED [2], Lindsey et al. (2002) have proposed a PEGASIS [3], Manjeshwar et al.(2001)
proposed a TEEN [4], and A Manjeshwar et al. (2001) proposed a PTEEN [5].
Leach performs the single-hop inter-cluster, directly from CHs to the BS, routing method, which
is not applicable to large-region networks Akyildiz et al. (2002) [6]. It is not always a realistic
assumption for single-hop inter-cluster routing with long communication range Al-Karaki et al
(2004) [7]. Besides, long-range communications directly from CHs to the BS can breed too much
energy consumption; despite the fact that CHs rotation is performed at each round to achieve load
balancing, LEACH cannot ensure real load balancing in the case of sensor nodes with different
amounts of initial energy, because CHs are elected in terms of probabilities without energy
considerations Xuxun Liu (2012) [8]. The idea of dynamic clustering brings extra overhead. For
instance, CH changes and advertisements may diminish the gain in energy consumption Li, C et
al. (2011) [9]. LEACH is very favorable in terms of energy efficiency. however, controlling the
number and the location of the clusters head (CHs) and also the size of the clusters about the node
number leads to a balance in energy use of the CHs and increasing the lifetime of the network,
Asgarali Bouyer et al (2015)[10].
Nevertheless, in a round, the nodes which are not CH may not join a cluster. In such a case, the
data which must be collected from the node outside the network (orphan node) could have a great
importance in some applications. Hence, these applications will be concrete ones and will satisfy
our needs. Obviously, we need to collect data from all distributed nodes inside the network, hence
allowing taking the suitable decisions.
The large-scale deployment of controlled high Wireless Sensor Networks (WSNs) necessitates an
efficient organization of the networks for high network connectivity and a low orphan node ratio.
Where sensor network are randomly deployed, they are not uniformly distributed inside field. As
a result, some places in the field don’t benefit from a good connectivity. Hence, the routing
protocols conceived for the WSN must have a self organization capacity in order to adapt them to
the random distribution of the nodes and the dynamic topology of the network.
An orphan node which does not belong to any CH sends a message towards its nearest neighbors
which belong to a cluster (belonging application). A member of the cluster will represent a
gateway allowing the link between one or several orphan nodes and the CH.
Among the factors, we must verify that in each round, the number of distributed nodes is
approximately equal to the actual number of connected nodes. If the number of connected nodes
is less than the required number, the nodes that are not within the reach of CH are called orphan
nodes.
In this paper, we propose a protocol called O-LEACH which allows joining the orphan nodes. To
solve the problem, one node member of a cluster receives "Orphan notification". The member of
the CH will be a gateway. The cluster member receives a request message from a node that
belongs to any group and asks for a membership in this group. Different messages are transmitted
between the three processes that are: the CH, the member nodes of the cluster (gateway) and the
nodes without connectivity orphan nodes (orphan nodes). These transactions generate an adequate
link between the orphan nodes and the cluster.
The remainder of this paper is organized as follows: section 2 describes the related work of
routing in WSN and emphasizes on existing CH selection method. Section 3 describes O-LEACH
protocol. In Section 4, we present the performance evaluation of O-LEACH and its comparison
with LEACH. Section 5 concludes the paper.

Computer Science & Information Technology (CS & IT) 137
2. RELATED WORK ON ROUTING PROTOCOL
2.1. Protocol LEACH
In WSNs, the use of routing protocols designed for the traditional ad hoc networks is
inappropriate. This is due to the characteristics allowing distinguishing the two types of networks.
Hence, we need to improve or develop new specific routing protocols for WSN. LEACH is
considered as the first hierarchical routing protocol. It is also one of the most popular hierarchical
routing algorithms for WSN, proposed as part of the project. It combines the efficiency in energy
consumption and the quality of access to the media, and it is based on the division into groups, in
order to allow the use of the concept of data aggregation for a better performance in terms of
lifetime.
Heinzelman proposed that the LEACH cluster formation is made by a centralized algorithm at the
base station (BS).
The aim of the LEACH protocol is to form clusters based on the intensity of the received radio
signal. Indeed, LEACH uses an algorithm which is distributed where each node decides
autonomously whether it will be a Cluster head or not by randomly calculating a probability pu
and comparing it to a threshold T(u); Then, it informs its neighborhood about its decision. Each
node decides which Cluster head to join by using a minimum transmission of energy (i.e the
nearest). The algorithm consists of several rounds and, for each round, a rotation of the role of the
Cluster head is initiated according to the probability pu which is chosen and compared to the
following formula of the threshold:
p: the percentage of CHs on the network, r : the current round number and G: the set of nodes that
was not CH in the (1/p) preceding rounds.
During a period T, a node n chooses a random number of x whose value is between 0 and 1 (0<x
<1). If x is less than a threshold value, then the node n will become a cluster head in the current
period. Otherwise, the node n should join the nearest cluster head in its vicinity.
Rounds in LEACH have predetermined duration, and have a set-up phase and a steady-state
phase. Through synchronized clocks, the nodes know when each round starts.
2.2 Set-up Phase
This phase starts by the announcement of the new round by the sink node, and by taking the
decision for a node to become a CH with a probability pi(t) in the beginning of round r+1 which
starts at the instant t. once a node is chosen CH, it must inform the other CH nodes about its
position in the current round. For this, a warning message ADV containing the identification of
the CH is transmitted to all CH nodes by using the protocol MAC CSMA() in order to avoid the
collisions between the various CH. Each member informs its CH about its decision.
After the grouping operation, each CH acts as a local control center in order to ensure the
coordination between the data transmission inside its group. It creates a schedule TDMA and
assigns to each member node a slot for data transmission. The set of slots assigned to the group
nodes is called a frame.
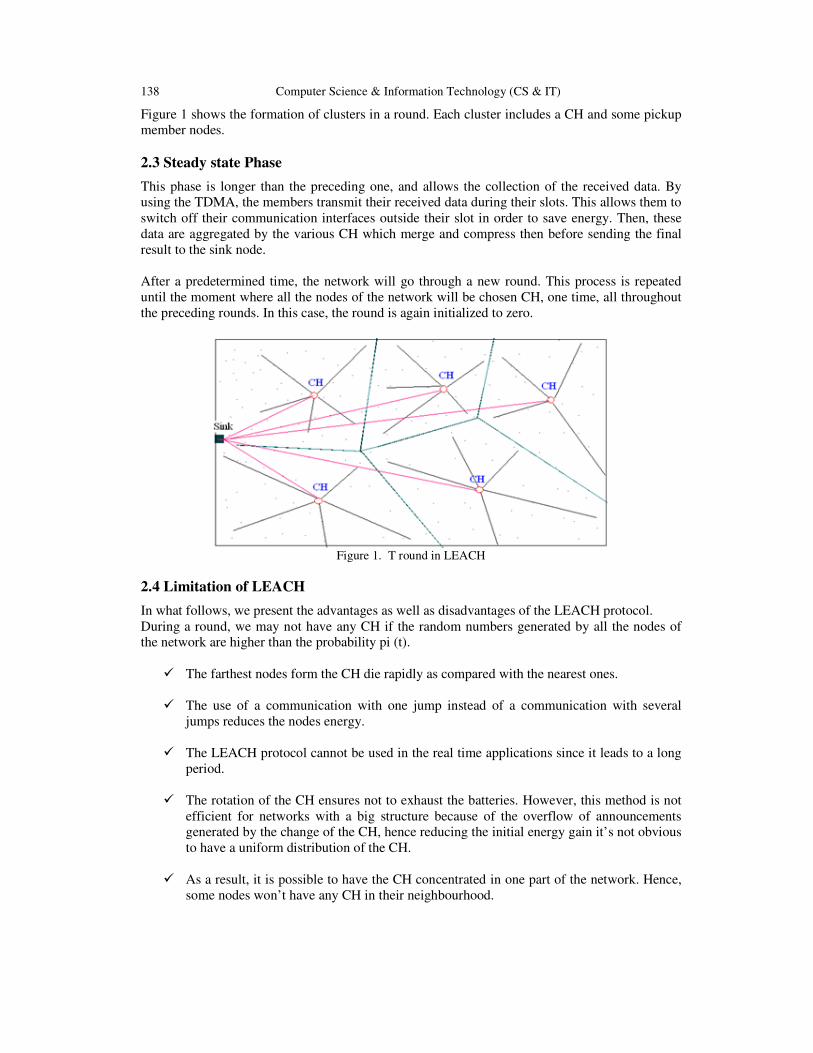
138 Computer Science & Information Technology (CS & IT)
Figure 1 shows the formation of clusters in a round. Each cluster includes a CH and some pickup
member nodes.
2.3 Steady state Phase
This phase is longer than the preceding one, and allows the collection of the received data. By
using the TDMA, the members transmit their received data during their slots. This allows them to
switch off their communication interfaces outside their slot in order to save energy. Then, these
data are aggregated by the various CH which merge and compress then before sending the final
result to the sink node.
After a predetermined time, the network will go through a new round. This process is repeated
until the moment where all the nodes of the network will be chosen CH, one time, all throughout
the preceding rounds. In this case, the round is again initialized to zero.
Figure 1. T round in LEACH
2.4 Limitation of LEACH
In what follows, we present the advantages as well as disadvantages of the LEACH protocol.
During a round, we may not have any CH if the random numbers generated by all the nodes of
the network are higher than the probability pi (t).
� The farthest nodes form the CH die rapidly as compared with the nearest ones.
� The use of a communication with one jump instead of a communication with several
jumps reduces the nodes energy.
� The LEACH protocol cannot be used in the real time applications since it leads to a long
period.
� The rotation of the CH ensures not to exhaust the batteries. However, this method is not
efficient for networks with a big structure because of the overflow of announcements
generated by the change of the CH, hence reducing the initial energy gain it’s not obvious
to have a uniform distribution of the CH.
� As a result, it is possible to have the CH concentrated in one part of the network. Hence,
some nodes won’t have any CH in their neighbourhood.

Computer Science & Information Technology (CS & IT) 139
� LEACH is suitable for small size networks because it assumes that all nodes can
communicate with each other and are able to reach sink, which is not always true for
large size network.
� Since CH election is performed in terms of probabilities, it is hard for the predetermined
CHs to be uniformly distributed throughout the network. Thereby there exist the elected
CHs that are concentrated in one part of the network and some nodes that have not any
CHs in their vicinity Seah (2010) [11].
3. DESCRIPTION OF O-LEACH PROTOCOL
3.1 Orphan Problem and proposed Solution
In Wireless Sensor Networks, low latency, energy efficiency, and coverage problems are
considered as three key issues in designing routing protocols Wafa Akkari et al (2015)[12]. The
choice of the optimal routes ensures the delivery of information to the base station and reduces
the packet delivery delay. Thus, the network must pass across by maximizing the networks life
without decreasing its performance. The drawback of the LEACH protocol is the limited use in a
wide field since many remote CH nodes die rapidly (as compared to a small field) because the
nodes cannot join them.
The optimal percentage of the desired number of CH should be proportional to the total number
of nodes. If this percentage is not met, this will lead to greater energy dissipation in the network.
Indeed, if the number of CH is very high, there will be a large number of nodes (CH) dedicated to
very expensive tasks in energy resources. Hence, there will be considerable energy dissipation in
the network. Moreover, if the number of CH is very small, the latter will manage groups of large
sizes. Thus, these CH will be consumed rapidly in case an important work is required from them.
The routing protocols are actually divided into two families: central data and hierarchical routing
protocols.
During the construction of the clusters the pickup nodes choose randomly the CH which can be
concentrated in a specific part of the work field. As a result, the remaining part of the field will
not be covered (see figure 2) the pickup nodes will be outside the network. The values received
by the orphan nodes will not be transmitted to the base station. The problem of the orphan nodes
requires finding a solution allowing to join these nodes to the remaining part of the network.
Figure 2. T round in O-LEACH

140 Computer Science & Information Technology (CS & IT)
3.2 Set-up Phase extension O-LEACH
The O-LEACH protocol consists of two phases: Set-up phase and steady-state phase as illustrated
in figure 3 and figure 4:
Figure 3. T round in O-LEACH reserved slots
The initialization phase consists in selecting the CH nodes with a certain probability, by the local
decision taken by a node to become a CH. After the construction of clusters, a timer is used in
order to verify the existence of orphan nodes.
If the answer is positive, CH gateway informs the CH’ (the first orphan node having the access to
the gateway) about the number of slots to be reserved to the orphan nodes by the CH. The CH’
play the same role as the CH.
Figure 4. Solution with member gateway CH

Computer Science & Information Technology (CS & IT) 141
3.3 Transaction message Proposed Algorithm
Three processes involved in the resolution of orphan nodes, which are orphan nodes, member
cluster (Gateway CH’) and CH node (figure 5):.
• Orphan nodes send status to member cluster.
• Member cluster says I am a Gateway.
• Orphan nodes join Gateway.
• The Gateway informs the CH node the number of slots.
• CH node reserve number of slots TDMA (Cluster + sub cluster).
• The gateway broadcasts a TDMA slot to each orphan node.
Figure 5. Transaction message
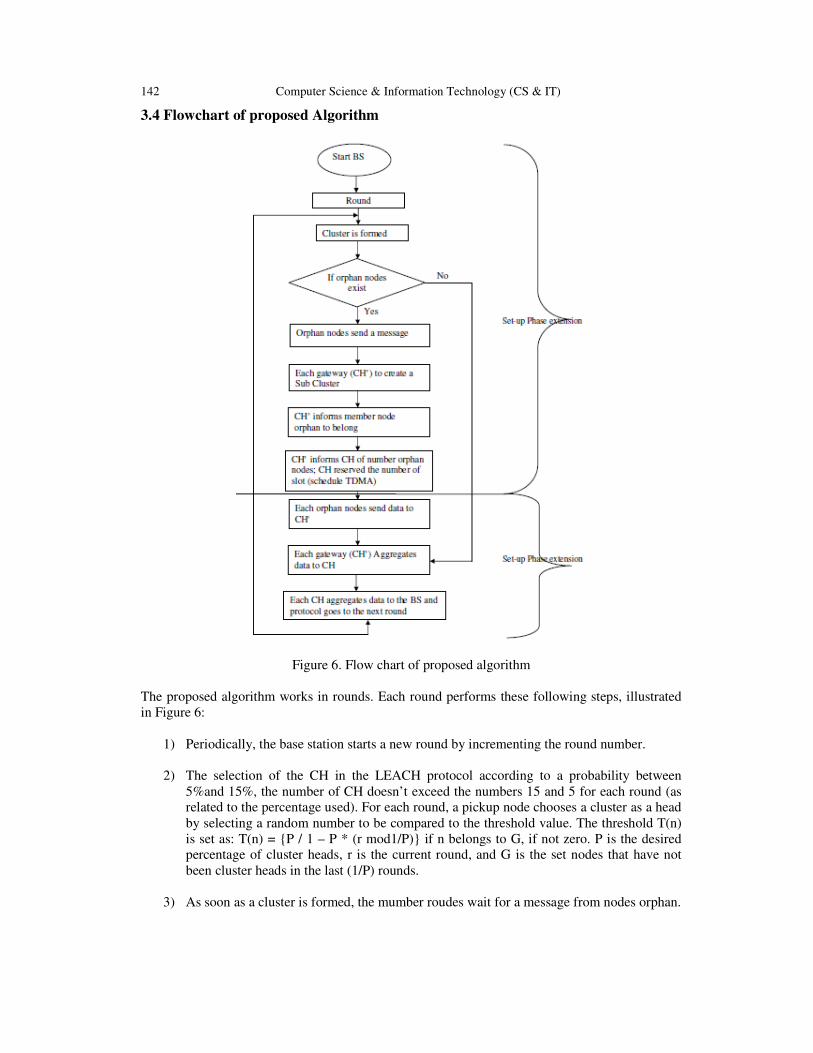
142 Computer Science & Information Technology (CS & IT)
3.4 Flowchart of proposed Algorithm
Figure 6. Flow chart of proposed algorithm
The proposed algorithm works in rounds. Each round performs these following steps, illustrated
in Figure 6:
1) Periodically, the base station starts a new round by incrementing the round number.
2) The selection of the CH in the LEACH protocol according to a probability between
5%and 15%, the number of CH doesn’t exceed the numbers 15 and 5 for each round (as
related to the percentage used). For each round, a pickup node chooses a cluster as a head
by selecting a random number to be compared to the threshold value. The threshold T(n)
is set as: T(n) = {P / 1 – P * (r mod1/P)} if n belongs to G, if not zero. P is the desired
percentage of cluster heads, r is the current round, and G is the set nodes that have not
been cluster heads in the last (1/P) rounds.
3) As soon as a cluster is formed, the mumber roudes wait for a message from nodes orphan.

Computer Science & Information Technology (CS & IT) 143
4) The node member of a cluster will be a gateway and will inform the orphan node to be a
CH’.
5) The construction of sub-clusters with a group leader CH’.
6) The CH’ gathers and aggregates the data toward the gateway.
7) The gateway sends two slots to the CH, the first one includes the data of CH’ whereas the
second one contains the gateway data.
8) The CH gathers the data, makes the necessary treatments and finally transmits them to
the BS.
3.5 Steady state Phase O-LEACH
This phase allows the collection of the pickup data. By using the TDMA the member nodes of the
cluster and the orphan nodes transmit their pickup data during their own slots. The node CH’
gathers the pickup data from the neighboring members. Then, these data are aggregated by the
CH’ which merge and compress them before sending the final result to the CH node through the
gateway. The gathers the data of the pickup nodes (members of the cluster and orphan),
aggregates and transmit then to the base station.
4. O-LEACH PERFORMANCE EVALUATIONS
4.1 Simulation set-up
All simulations have been implemented using TinyOS 1.x, simulator TOSSIM and interface
TinyViz in order to provide a rich simulation platform. Assuming that 100 nodes are randomly
distributed, we used the following metrics to evaluate the proposed protocol O-LEACH compared
with LEACH:
� Orphan Nodes: the number of orphan nodes in each round
� Network Life time: The number of nodes which are alive at the end of the simulation.
� Percentage of gateway nodes: the number of gateway nodes in each round.
� Energy Consumption: the amount of consumed energy by the network in each round.
� Percentage of CH: percentage of adequate CH in a major distribution nodes sensor.
The base station is located at position (0,0), provided with sufficient energy resources. Each node
is equipped with an energy source which is set to 0.5J at the beginning of the simulation. We have
set the percentage of CH between 5% and 25%.
4.2 Simulation results In this section, we present and discuss the simulation results of the protocol O-LEACH, to
evaluate its performance and the execution of the protocol to show that the number of orphan
nodes is almost null. Clustering algorithm distributed as O-LEACH requires that the sensor nodes
are synchronized in their implementation. We carried out experiments on the percentage of the
desired number of CH between 5% and 20%, the result we shows almost zero values. In the

144 Computer Science & Information Technology (CS & IT)
LEACH protocol, if the number of CH is very high, there will be a large number of nodes (CH)
which consume a lot of energy. Thus, there will be considerable energy dissipation in the
network. Also, if the number of CH is very small, the latter will manage groups of large sizes.
Thus, this CH will be consumed rapidly in case an important work is required and there will be a
risk of having a very large number of orphan nodes.
The necessary the timing to search for orphan nodes for a gateway. Each CH receives a message
from a gateway and necessitates the timings for search orphan nodes.
The contribution of O-LEACH as compared to LEACH leads to a better network coverage of the
whole controlled environment in several applications of WSNs. So, for each network organization
(clusters during training set-up phase), we must calculate the total number of orphan nodes and
the number of those who could reach a gateway. The ideal is that 100% of orphan nodes could be
covered in the network. Moreover calculating the number of packets that arrive to the base station
for both algorithms (O-LEACH and LEACH) shows that O-LEACH allows more data
availability. O-LEACH is of a major importance, especially if the observed phenomenon occurs
at orphan nodes.
The collected values by orphan nodes provide more availability of data at the base station. This
enables a better decision in the application and a quick response. The simulation results show that
our protocol outperforms the classic approach LEACH in terms of coverage and lifetime.
In fig 7, show the percentage of covered nodes as a function of the numbers of connected nodes to
a CH. The number of orphan nodes in O-LEACH is much lower as compared to LEACH which is
expected since the major difference comes from the technique used in the gateway.
In fig 8, the number of gateways increases relative to the number of orphan nodes and to the
number of distributed nodes. In a uniform distribution, (with 200 nodes) the number of orphan
nodes can be more than 15 nodes. The number of gateways will be less or equal to the number of
orphans nodes.
In fig. 9, clearly shows the total number of nodes that remain alive over the simulation time.
Using LEACH, the first node’s death occurs after 950 rounds and near to 1240 rounds, all the
nodes are dead. While activating O-LEACH, the first node dies after 1250 rounds and all the
nodes’ energy expires after 1550 rounds, thanks to the number of gateways that connects the
maximum number of nodes to extend the life of the networks.
Figure 7. Number of nodes connected to a CH

Computer Science & Information Technology (CS & IT) 145
Figure 8. Percentage gateway
Figure 9. Number of node alive in LEACH and O-LEACH
5. CONCLUSIONS
Several kinds of existing clustering protocols have been developed to balance and maximize the
lifetime of the sensor nodes in wireless sensor networks. In this paper, we were interested in
designing an O_LEACH routing protocol in order to minimize the orphan nodes in a round. It is
estimated that the optimal and adequate percentage of the desired CH should be between 8% and
12% of the total number of nodes. Simulation results show that our protocol outperforms the
classic approach LEACH in terms coverage and lifetime. Consequently, the cluster will be of a
uniform size or each CH has a limited number of members. This involves optimizing the energy
and the duration of lifetime of the networks. This protocol can improve the connectivity and of
the network reliability with lower orphan nodes. The values collected by orphan nodes provide

146 Computer Science & Information Technology (CS & IT)
more availability of data at the base station. This enables a better decision on the application and
a quick response.
REFERENCES [1] W. Heinzelman, A. Chandrakasan, and H. Balakrishnan, “Energy efficient communication protocol
for wireless microsensor networks”, in Proceedings of the 33rd Annual Hawaii International
Conference on System Sciences, Jan 2000, 10 pp. vol.2.
[2] Younis, O.; Fahmy, S. “HEED: A hybrid, energy-efficient, distributed clustering approach for ad-hoc
sensor networks”. IEEE Trans. Mobile Comput. 2004, vol 3, 366–379.
[3] Lindsey, S.; Raghavendra, C.; Sivalingam, K.M. “Data gathering algorithms in sensor networks using
energy metrics”. IEEE Trans. Parallel Distrib. Syst. 2002, vol 13, 924–935
[4] Manjeshwar, E.; Agrawal, D.P. “TEEN: A Routing Protocol for Enhanced Efficiency in Wireless
Sensor Networks”. In Proceedings of the 15th International Parallel and Distributed Processing
Symposium (IPDPS), San Francisco, CA, USA, 23–27 April 2001; pp. 2009–2015.
[5] Manjeshwar, A.; Agrawal, D. P. “APTEEN: A Hybrid Protocol for Efficient Routing and
Comprehensive Information Retrieval in Wireless Sensor Networks”. In Proceedings of the 2nd
International Workshop on Parallel and Distributed Computing Issues in Wireless Networks and
Mobile computing, Lauderdale, FL, USA, 15–19 April 2002; pp. 195–202.
[6] Akyildiz, I.F.; Su, W.; Sankarasubramaniam, Y.; Cayirci, E. “Wireless sensor networks: A survey”.
Comput.Netw. 2002, vol 38, 393–422.
[7] Al-Karaki, J.N.; Kamal, A.E. Routing techniques in wireless sensor networks: A survey. IEEE Wirel.
Commun. 2004, 11, 6–28.
[8] Xuxun Liu, “A Survey on Clustering Routing Protocols in Wireless Sensor Networks” ,2012, vol 12,
pp. 11113-11153.
[9] Li, C.; Zhang, H.X.; Hao, B.B.; Li, J.D. “A survey on routing protocols for large-scale wireless sensor
networks”. Sensors 2011, vol 11, 3498–3526
[10] Asgarali Bouyer; Abdolreza Hatamlou; Mohammad Masdari “A new approach for decreasing energy
in wireless sensor networks with hybrid LEACH protocol and fuzzy C-means algorithm”, Int. J. of
Communication Networks and Distributed Systems, 2015 Vol.14, No.4, pp.400 - 412
[11] Seah, W., Tan, Y. Eds., “Sustainable Wireless Sensor Networks”, InTech Open Access Publisher:
Rijeka, Croatia, 2010.
[12] Wafa Akkari, Badia Bouhdid, Abdelfettah Belguith, (2015) “LEATCH: Low Energy Adaptive Tier
Clustering Hierarchy”, 6th International Conference on Ambient System, Network and Technologies,
(ANT 2015), procedia computer Science 52 (2015). pp. 365 – 372.
AUTHORS Wassim Jerbi is currently a Principal Professor in computer science at the
Higher Institute of Technological Studies of Sfax –Tunisia. He is preparing
his PhD in computer systems engineering at the National School of Engineers
of Sfax –Tunisia where he is member of Computer and Embedded System
Laboratory. His research and teaching interests focus on Wireless Sensor
Networks, Routing Protocol.

Computer Science & Information Technology (CS & IT) 147
Abderrahmen Guermazi is currently a Technologist Professor in computer
science at the Higher Institute of Technological Studies of Sfax –Tunisia. He
is preparing his PhD in computer systems engineering at the National School
of Engineers of Sfax –Tunisia where he is member of Computer and
Embedded System Laboratory. He received the National Aggregation degree
in computer science at 1998. His research and teaching interests focus on
Wireless Sensor Networks, Routing and Security. He has several publications
in international conferences of high quality.
Hafedh Trabelsi is currently a Full Professor in computer science at the National School of
Engineers of Sfax –Tunisia where he is member of Computer and Embedded. He received the
phd degree in computer science at 1993. He has several publications in international conferences
of high quality.

AUTHOR INDEX
Abderrahmen GUERMAZI 135
Abdul Rahiman M 47
Aishwarya.A.V 35
Akanksha Juneja 27
Asha C N 109
Basavaraju T G 109
Chae Y. Lee 15
Ciza Thomas 47
Hafedh TRABELSI 135
Iswaryah.S 35
Jiyo.S.Athertya 99
Jorge Lloret 01
Juhyeon Oh 15
Karuppanna Prasad N 57
Padmavathi.S 35
Patil J.B 89
Rafael Bello 01
Rama B 75
Rehna Kalam 47
Santosh Kumar Henge 75
Saravana Kumar G 99
Sekar K 57
Shipra Mittal 27
Shubha S 121
Suresh P 121
Ujwala Manoj Patil 89
Wassim JERBI 135