computer simulations to optimize the design of marker...
TRANSCRIPT

Aus dem Institut furPflanzenbau und Pflanzenzuchtung IIder Justus-Liebig-Universitat Gießen
Professur fur Biometrie und PopulationsgenetikProf. Dr. Matthias Frisch
Computer simulations to
optimize the design of
marker-assisted backcrossing
for high-throughput
marker systems
Dissertationzur Erlangung des Grades eines Doktors
der Agrarwissenschaftenim Fachbereich
Agrarwissenschaften, Okotrophologie und UmweltmanagementJustus-Liebig-Universitat Gießen
vonEva Herzog
aus Aschaffenburg
Gießen, 28. Februar 2014

Contents
1 General introduction 1
2 Selection strategies for marker-assisted backcrossing withhigh-throughput marker systems1 10
3 Efficient marker-assisted backcross conversion of seed parentlines to cytoplasmic male sterility2 21
4 Selection strategies for marker-assisted background selectionwith chromosome-wise SSR multiplexes in pseudo-backcrossprograms for grapevine breeding3 31
5 Selection strategies for the development of maize introgres-sion populations4 36
6 General discussion 51
7 Summary 65
8 Zusammenfassung 68
References 71
1Herzog, E, & Frisch, M. 2011. Selection strategies for marker-assisted backcrossingwith high-throughput marker systems. Theor Appl Genet, 123(2), 251-260.
2Herzog, E, & Frisch, M. 2013. Efficient marker-assisted backcross conversion of seed-parent lines to cytoplasmic male sterility. Plant Breeding, 132(1), 33-41.
3Herzog, E, Topfer, R, Hausmann, L, Eibach, R, & Frisch, M. 2013. Selection strategiesfor marker-assisted background selection with chromosomewise SSR multiplexes in pseudo-backcross programs for grapevine breeding. Vitis, 52(4), 193-196.
4Herzog, E, Falke, KC, Presterl, T, Scheuermann, D, Ouzunova, M, & Frisch, M. 2014.Selection strategies for the development of maize introgression populations. PLOS ONE,9(3), e92429.
— i —

Abbreviations
AFLP amplified fragment length polymorphism
cM centimorgan
CMS cytoplasmic male sterility
DArT diversity array technology
DH doubled haploid
DNA desoxyribonucleic acid
HT high-throughput
JKI Julius Kuhn Institute
KASP Competitive Allele Specific PCR
MABC marker-assisted backcrossing
PCR polymerase chain reaction
RFLP restriction fragment length polymorphism
SM single marker
SNP single nucleotide polymorphism
SSR simple sequence repeat
— ii —

Chapter 1
General introduction
Marker-assisted backcrossing in plant breeding
Marker-assisted backcrossing (MABC) is one of the most successful applica-
tions of DNA markers in plant breeding. It is now routinely applied in gene
and transgene introgression, seed parent line conversion to cytoplasmic male
sterility (CMS) and the development of introgression populations for QTL
detection and pre-breeding (Semagn et al., 2006; Xu & Crouch, 2008). A
typical application in public and commercial plant breeding is the introgres-
sion of single or multiple resistance genes to biotic or abiotic stresses, e.g.,
in the major cereals maize (Willcox et al., 2002), rice (Datta et al., 2002;
Neeraja et al., 2007) and wheat (Liu et al., 2000; Wilde et al., 2008). The
importance of MABC is underlined by the fact that in 2013 over 90% of
the total acreage of maize, soybean and cotton in the U.S. was planted with
varieties that were developed with breeding schemes using MABC for trait
introgression (National Agricultural Statistics Service, 2013).
A typical backcross scheme for the introgression of a dominant target al-
lele from a donor into the genome of a recipient line is shown in Figure 1.1.
At the target locus, the donor parent P1 carries the target allele Q in ho-
mozygous state. The recipient P2 carries the allele q in homozygous state.
The donor is crossed with recipient to create a heterozygous F1 population

General introduction
×××
×××
×××
×××...
P1 (Donor) P2 (Recipient)
F1
BC1
BC2
BCn
qq QQ⊗⊗⊗ · · ·
Figure 1.1. Schematic representation of a backcross program for gene in-
trogression with n backcross generations. The donor parent P1 carries
the target allele Q at the target locus. The recipient parent P2 carries
the allele q at the target locus. The genome of the donor parent P1 is
displayed in red. The genome of the recipient parent P2 is displayed in
green. Modified from Becker (2011, p. 198f).
with genotype Qq at the target locus. The F1 is backcrossed to the recip-
ient to create a BC1 population. From this BC1 population, heterozygous
carriers of the target allele with genotype Qq are again backcrossed to the re-
cipient, while BC1 individuals with genotype qq are discarded. This process
is repeated for n backcross generations. To obtain a homozygous carrier of
the target allele with genotype QQ, this process is followed by one or several
generations of selfing. Individuals carrying the target allele Q can be selected
with markers linked to or located in the target gene. This process is called
foreground selection (Hospital & Charcosset, 1997).
Beside foreground selection, fast and complete recovery of the genotype
of the recipient is the major objective of MABC. Without selection for the
recipient genome (in Figure 1.1 displayed in green), the donor genome pro-
portion (in Figure 1.1 displayed in red) is per expectation reduced by 50%
in every backcross generation. The average recipient genome proportion in
— 2 —

General introduction
0.5 0.6 0.7 0.8 0.9 1
0
0.3
0.6
0.9
BC1
BC2
BC3
BC4
Genome proportion of the recipient
Density
Figure 1.2. Distribution of the recipient genome proportion in backcross
populations of generations BC1-BC4. Data generated with simulations
based on a published linkage map of maize (Schon et al., 1994).
generation n is thus (2n+1 − 1) /2n+1. For example, in generation BC1 of a
gene introgression program in maize, the average recipient genome propor-
tion is 75% (Figure 1.2). However, the actual recipient genome proportion
of the individuals in the BC1 population ranges around this expected value
from about 60% to 90%. The possibility to select individuals from the upper
tail of the distribution, having a recipient genome proportion of about 90%,
leads to considerable gains in recipient genome in generation BC2 compared
to no selection.
The actual recipient genome proportion of a backcross individual can be
estimated by genotyping background markers which cover the entire genome
and allow to distinguish between alleles from the donor and the recipient
(Figure 1.3). The individuals with the highest proportion of the green recip-
ient alleles at the background marker loci will be selected as non-recurrent
parents for the following backcross generation. This process was described
by Tanksley et al. (1989) and is referred to as background selection (Hospital
& Charcosset, 1997). Background selection has the potential to speed up the
restoration of the recipient genotype by several generations.
— 3 —

General introduction
C1 C2 C3 C4 C5 C6 C7 C8 C9 C10
Alleles from the donor
Alleles from the recipient
Figure 1.3. Graphical genotype of a diploid backcross plant with ten chro-
mosomes (C1-C10) derived from simulations with a published linkage map
of maize (Schon et al., 1994). The donor alleles are displayed in red. The
recipient alleles are displayed in green.
Since the advent of molecular markers in the 1980’s, it has constantly been
hypothesized that new developments in marker technology will improve the
speed and efficiency of marker-assisted selection (Collard et al., 2005; Ragot
& Lee, 2007). However, during the 1990’s, the large-scale implementation of
marker-assisted background selection in breeding programs proceeded slowly
and to a much lower extent than expected. The reason was that the effort in
the laboratory was very high with the then available marker systems. More-
over, the analysis of a high number of molecular markers was very expensive.
Different types of molecular markers
During the 1980’s, restriction fragment length polymorphisms (RFLPs)
emerged as the first system of DNA markers that was suitable for widespread
use in genetic studies (Botstein et al., 1980; Beckmann & Soller, 1986). Dur-
ing the 1990’s, amplified fragment length polymorphism (AFLP) and simple
sequence repeat (SSR) markers began to replace RFLPs as the markers of
choice in plant breeding (Vos et al., 1995; Zietkiewicz et al., 1994). SSR mark-
ers have up to now been very useful as they are abundant in the genome,
— 4 —

General introduction
highly informative and transferable between crop species and their wild rel-
atives. Nevertheless, the described marker types generally provide informa-
tion only about one locus per assay (Collard & Mackill, 2008). This type of
marker assay is therefore referred to as single marker (SM) assay.
From the early 2000’s on, single nucleotide polymorphisms (SNPs) be-
gan to arise which are the most abundant source of genetic variation in
the genome (Gupta et al., 2001). For SSRs and SNPs, several different high-
throughput (HT) assays have been developed which allow to multiplex several
SSRs in one polymerase chain reaction (PCR), or to genotype ten-thousands
of SNPs with one chip or microarray (Syvanen, 2005; Appleby et al., 2009).
HT assays have considerably reduced the cost and effort of marker analysis,
but their relative efficiency compared to SM assays in background selection
has not yet been determined.
An important difference between SM and HT assays with respect to back-
ground selection is that with SM assays only those markers which have not yet
been fixed for the recipient alleles have to be analyzed in advanced backcross
generations. They are therefore very flexible to use, but have the disadvan-
tage that the analysis of the single locus is comparatively expensive. For
HT assays such as SNP chips, the complete set of markers included in the
assay has to be analyzed in every analysis run. With this type of assay, the
analysis of the single locus is cheaper than with SM assays, but the complete
HT assay is expensive. HT assays are therefore less flexible than SM assays
and only cost-efficient if used at or near full capacity.
Due to their different characteristics, SM and HT assays are suitable for
different applications within a MABC program. However, as they usually are
employed for different types of molecular markers, e.g., SSRs and SNPs, it
is not always possible to combine them efficiently. With Competitive Allele
Specific PCR (KASP) assays, a type of SNP assay has recently emerged which
is suitable for genotyping small subsets of SNP markers originally developed
for analysis with HT assays (Chen et al., 2010; Mammadov et al., 2012).
With this type of assay, new possibilities for the combination of HT and SM
assays have arisen which have not yet been investigated.
— 5 —

General introduction
The theoretical framework of MABC
With the multitude of marker types and marker assays that is now available,
innovative strategies are required to apply them efficiently in the breeding
process (Septiningsih et al., 2013). However, gathering expertise through
field experiments is time-consuming and very costly. Even though the costs of
molecular markers have constantly been decreasing since the beginning of the
millennium, they are still the main factor which limits the implementation
of marker-assisted selection in practice. Beside the financial component,
utilizing molecular markers increases the complexity of breeding programs,
as it requires additional steps of analysis, interpretation and decision-making
within a limited timeframe (Eathington et al., 2007). It is therefore crucial
to develop tools and guidelines beyond “gut-instinct” which help breeders to
decide whether the way in which they plan to incorporate markers in their
breeding programs is likely to be cost-effective (Morris et al., 2003).
An important step towards this goal was the development of a theoreti-
cal framework for MABC by mathematical modelling (Stam & Zeven, 1981;
Hillel et al., 1990; Hospital et al., 1992; Hill, 1993; Visscher, 1996; Markel
et al., 1997; Hospital & Charcosset, 1997; Frisch et al., 1999b; Ribaut et al.,
2002) that was built on classical population-genetical investigations (Bartlett
& Haldane, 1935; Hanson, 1959). However, the numerical solutions pre-
sented in these studies are only valid for unselected populations in which the
donor genome proportions of the individuals are stochastically independent.
They are consequently of little use for small backcross populations under
marker-assisted selection. In 1999, Visscher showed in a simulation study
that marker-assisted selection significantly reduces the variance of the donor
genome proportion compared to the theoretical estimates which assumed the
absence of selection (Visscher, 1999).
A general selection theory for the recipient genome proportion in MABC,
which in contrast to standard normal distribution selection theory takes the
— 6 —

General introduction
reduced variance of the donor genome proportion under marker-assisted se-
lection into account, has more recently been published (Frisch & Melchinger,
2005). Compared to the previously presented numerical solutions, this ap-
proach had the advantage that individuals that were used as non-recurrent
parents were subject to background selection. Nevertheless, it was limited
to a specific marker score as selection index and did not allow a comparison
of alternative selection strategies. Moreover, this approach was developed
for only one backcross generation. Hence, whereas the presented analytical
approaches greatly improved the understanding of the underlying principles
of population genetics and are generally applicable, they are not sufficient
for planning practical breeding programs.
The role of simulations
Simulations are often more powerful than analytical approaches, as they can
be tailored to be closer to real conditions of selection (Moreau et al., 1998).
For more complex breeding designs which take into account many differ-
ent parameters and even interactions thereof, numerical approaches are not
straightforward, and sometimes no exact solution is available (Hospital et al.,
1992). A great advantage of simulations is therefore that they are compar-
atively easy-to-use tools which allow breeders to evaluate the efficiency of
alternative crossing and selection schemes over all generations of a backcross
program without the need to conduct expensive field experiments (Moreau
et al., 1998; Frisch & Melchinger, 2005).
As the scale and complexity of breeding programs increases, the opti-
mization of breeding designs by computer simulations and the development
of decision support tools for breeders is gaining importance for the successful
application of marker-assisted selection (Xu & Crouch, 2008). Its efficient
implementation in practical large-scale plant breeding programs requires,
among other logistical and genetical prerequisites, the design of optimal
— 7 —

General introduction
breeding systems by simulation analysis, and the development of decision
support tools for breeders (Eathington et al., 2007).
Validation studies have shown that simulations are effective and robust
tools to improve the planning process of practical breeding programs (Kuchel
et al., 2007; Prigge et al., 2008; Randhawa et al., 2009). They have been rec-
ognized as useful and integral parts of efficient plant breeding in scientific
literature (Utomo et al., 2012; Septiningsih et al., 2013). Guidelines for opti-
mizing MABC designs have also been used as a basis for more sophisticated
models (Tesfaye et al., 2013; Peng et al., 2014a) and have found their way
into practical breeding programs (Timonova et al., 2013).
To date, a broad range of simulation studies is available which cover im-
portant applications of MABC. They provide guidelines for different aspects
of the introgression of single dominant or recessive target genes (Hospital
et al., 1992; Frisch et al., 1999a; Frisch & Melchinger, 2001b; Prigge et al.,
2009), the combination of two genes (Frisch & Melchinger, 2001c) or several
genes (Ribaut et al., 2002; Servin et al., 2004) and quantitative trait loci
with estimated positions (Hospital & Charcosset, 1997). More recent stud-
ies have dealt with the development of introgression libraries (Falke et al.,
2009) and multiple integration of transgenic traits (Peng et al., 2014a; Peng
et al., 2014b). These studies have focused on optimizing the use of SM as-
says. However, none of these studies has provided guidelines for the efficient
application of HT assays.
Objectives
The aim of my Ph.D. project was to employ computer simulations for the
development of efficient strategies for MABC with HT assays. Guidelines
should be derived for a wide range of applications of MABC and should
be implementable in practical breeding programs. The thesis project was
divided into the following four sub-projects:
— 8 —

General introduction
(1) Application of marker-assisted background selection for gene introgres-
sion is still limited by the high costs of marker analysis. HT assays
promise to reduce these costs, but new selection strategies are required
for their efficient implementation in breeding programs. The objec-
tives of the first study were to investigate the properties of HT assays
compared to SM assays, and to develop optimal selection strategies
for marker-assisted gene introgression with HT assays in maize (Chap-
ter 2).
(2) For many crops, efficient conversion of seed-parent lines to CMS is a
cornerstone of hybrid production. In contrast to gene introgression, no
target genes have to be considered in CMS conversion programs. The
optimal selection strategies for CMS conversion will consequently differ
from those for gene introgression and have not yet been investigated.
The objectives of the second study were to evaluate and optimize the
resource requirements of CMS conversion programs in rye, sugarbeet,
sunflower and rapeseed, and to determine the most cost-effective use of
SM and HT assays (Chapter 3).
(3) Organizing SSR markers located on the same chromosomes into PCR
multiplexes has the potential to reduce the costs of marker analysis and
constitutes an HT assay with a level of throughput between SM assays
and SNP chips. The objectives of the third study were to develop se-
lection strategies for gene introgression in grapevine with chromosome-
wise SSR multiplexes (Chapter 4).
(4) Introgression populations are valuable resources for QTL detection and
breeding, but their development is costly and time-consuming. Selec-
tion strategies for the development of introgression populations with a
limited number of individuals and HT marker assays are required. The
objectives of the fourth study were to design and compare selection
strategies for the development of maize introgression populations with
limited resources for different doubled haploid (DH) and S2 crossing
schemes (Chapter 5).
— 9 —

Chapter 2
Selection strategies formarker-assisted backcrossingwith high-throughput markersystems1
1Herzog, E, & Frisch, M. 2011. Selection strategies for marker-assisted backcrossingwith high-throughput marker systems. Theor Appl Genet, 123(2), 251-260.

ORIGINAL PAPER
Selection strategies for marker-assisted backcrossingwith high-throughput marker systems
Eva Herzog • Matthias Frisch
Received: 10 September 2010 / Accepted: 23 March 2011 / Published online: 8 April 2011
� Springer-Verlag 2011
Abstract Application of marker-assisted backcrossing
for gene introgression is still limited by the high costs of
marker analysis. High-throughput (HT) assays promise to
reduce these costs, but new selection strategies are required
for their efficient implementation in breeding programs.
The objectives of our study were to investigate the prop-
erties of HT marker systems compared to single-marker
(SM) assays, and to develop optimal selection strategies
for marker-assisted backcrossing with HT assays. We
employed computer simulations with a genetic model
consisting of 10 chromosomes of 160 cM length to
investigate the introgression of a dominant target gene. We
found that a major advantage of HT marker systems is that
they can provide linkage maps with equally spaced mark-
ers, whereas the possibility to provide linkage maps with
high marker densities smaller than 10 cM is only of sec-
ondary use in marker-assisted backcrossing. A three-stage
selection strategy that combines selection for recombinants
at markers flanking the target gene with SM assays and
genome-wide background selection with HT markers in the
first backcross generation was more efficient than genome-
wide background selection with HT markers alone.
Selection strategies that combine SM and HT assays were
more efficient than genome-wide background selection
with HT assays alone. This result was obtained for a broad
range of cost ratios of HT and SM assays. A further con-
siderable reduction of the costs could be achieved if the
population size in the first backcross generation was twice
the population size in generations BC2 and BC3 of a three-
generation backcrossing program. We conclude that
selection strategies combining SM and HT assays have the
potential to greatly increase the efficiency and flexibility of
marker-assisted backcrossing.
Introduction
Marker-assisted backcrossing is used for transferring genes
which are responsible for favorable agronomic traits from a
donor line into the genome of a recipient line. Using
molecular markers for selection against the genetic back-
ground of the donor can reduce the time and resources
required for gene introgression. Although background
selection has become a standard tool in plant breeding, the
high costs of marker analysis still limit its use in practice
and are the crucial factor for the experimental designs of
gene introgression programs (Collard and Mackill 2008).
These designs depend on the number of target genes to be
transferred, the employed marker map, and the number of
generations available for the gene introgression. Computer
simulations are a robust tool for optimizing the design
parameters of a marker-assisted backcrossing program
before implementing it in practice (Prigge et al. 2008).
The design of marker-assisted backcrossing programs
was studied with respect to the introgression of single
dominant and recessive genes (Hospital et al. 1992; Frisch
et al. 1999a, b; Frisch and Melchinger 2001a), two genes
(Frisch and Melchinger 2001b), and favorable alleles at
quantitative trait loci (Hospital and Charcosset 1997;
Bouchez et al. 2002). More recently, marker-assisted
backcrossing for developing libraries of near-isogenic lines
was studied (Peleman and van der Voort 2003; Falke et al.
2009; Falke and Frisch 2011). These studies have mainly
Communicated by Y. Xu.
E. Herzog � M. Frisch (&)
Institute of Agronomy and Plant Breeding II,
Justus Liebig University, 35392 Giessen, Germany
e-mail: [email protected]
123
Theor Appl Genet (2011) 123:251–260
DOI 10.1007/s00122-011-1581-0
— 11 —

focused on optimizing the number of genotyped individu-
als as well as the positions and density of background
selection markers with respect to the required number of
marker data points. The optimizations have been carried
out assuming marker systems in which each marker locus
is analyzed in a separate assay (cf. Prigge et al. 2009). We
refer to such systems as single-marker (SM) systems.
Typical examples are the simple sequence repeat (SSR)
and the restriction fragment length polymorphism (RFLP)
marker systems.
Recently, high-throughput (HT) marker systems based
on single nucleotide polymorphisms (SNPs) have been
developed. Due to the high level of automation of systems
such as DNA chips, they allow for cheap and fast analysis
of hundreds of marker loci in a single analysis step (Gupta
et al. 2001; Syvanen et al. 2005). HT marker systems have
been developed for crops (Ragot and Lee 2007) and are
becoming the marker systems of choice in commercial
breeding programs of many economically important crops.
The crucial difference between HT and SM marker
systems is that with SM marker systems, only those
markers are analyzed in advanced backcross generations
which were not already fixed for the recipient alleles in
earlier generations. In contrast, with HT marker systems,
the entire panel of markers used in a gene introgression
program needs to be analyzed also for individuals of
advanced backcross generations, even if 80 or 90% of these
markers have already been fixed for the recipient alleles.
To our knowledge, no study investigating the implications
of this property on the efficiency of marker-assisted
backcrossing is available. The combination of SM marker
systems for the reduction of the chromosome segment
attached to the target gene and HT markers for genome-
wide background selection promises to further enhance
selection efficiency in marker-assisted backcrossing and is
not yet investigated.
The objectives of our simulation study were to (1)
compare the relative costs of genome-wide background
selection with SM and HT marker systems for different
cost ratios of HT:SM markers, (2) compare the efficiency
of equally spaced and randomly distributed markers with
respect to the recovery of the recipient genome, (3) develop
selection strategies combining SM and HT assays, which
are more efficient than genome-wide background selection
with SM or HT assays alone.
Simulations
A genetic model with ten equally sized chromosomes of
160 cM length was used for the simulations. Its genome
length of 1,600 cM is similar to that of published linkage
maps of maize (cf. Schon et al. 1994). Markers for
genome-wide background selection were assumed to be
(a) randomly distributed in the genome or (b) equally
spaced. Average marker distances (randomly distributed
markers) or marker distances (equally spaced markers)
between two adjacent marker loci of dGW = 2, 5, 10,
20 cM were investigated. For equally spaced markers, two
markers were located at the telomeres of each chromo-
some. One dominant target gene to be introgressed was
located on Chromosome 1. It was 81, 82.5, 85, and 90 cM
distant from the telomere for linkage maps with dGW = 2,
5, 10, 20 cM, respectively. Flanking markers for selection
against the donor chromosome segment attached to the
target gene were located on both sides of the target gene.
The distances between target gene and each flanking
marker were dF = 5, 10, 20, 30, 40 cM.
The investigated breeding scheme started with the cross
of two homozygous parents (donor and recipient), which
were polymorphic at all loci. The recipient carried the
desirable alleles at all loci of the genome except for the
target locus, while the donor carried the desirable allele at
the target locus. The donor and recipient were crossed to
create an F1 individual, which was backcrossed to the
recipient. From the BC1 population of size n1, one indi-
vidual was selected with two- or three-stage selection, as
described below, and backcrossed to the recipient. This
procedure was repeated for t backcross generations.
Two-stage selection consisted of pre-selection of carri-
ers of the target gene in the first selection step. The pre-
selected individuals were subjected to genome-wide
background selection in the second step. A selection index
i ¼P
m xm was constructed, where summation is over
markers and xm = 1 if a marker is homozygous for the
recipient allele. A plant with the highest value of i was
selected and backcrossed to the recipient. Two-stage
selection was carried out with SM and HT assays. For SM
assays, only those markers were analyzed in advanced
backcross generations which were not yet fixed for the
recipient allele in the non-recurrent parent.
Three-stage selection combined selection for recombi-
nants between the target gene and its two flanking
markers, genotyped with SM assays, and genome-wide
background selection with HT assays. It consisted of (1)
selection for the target gene followed by (2) pre-selection
with flanking markers and (3) genome-wide selection with
background markers. For selection step (2), a selection
index f was created, which took the values 0, 1, or 2,
depending on whether recombination occurred between
the target gene and none, one, or both flanking markers,
respectively. On the basis of f, pre-selection of individuals
was carried out according to one of two decision rules.
Either (a) individuals with f C 1 were selected, or (b) all
individuals having the maximum observed score of
f (f = max) were selected.
252 Theor Appl Genet (2011) 123:251–260
123— 12 —

Four series of simulations were carried out with soft-
ware Plabsoft (Maurer et al. 2008), assuming no interfer-
ence in crossover formation. Each simulation was
replicated 10,000 times in order to reduce sampling effects
and to obtain results with high numerical accuracy and a
small standard error. The 10% quantile (Q10) of the dis-
tribution of recipient genome (in percent) was determined
in the last backcross generation to measure the success of a
marker-assisted backcrossing program with respect to
restoring the genome of the recipient. The number of SM
and HT assays was determined as a measure for the costs of
a marker-assisted backcrossing program.
In the first series of simulations, the population size nt
(constant across all backcross generations BCt, t =
1, …, 3) and the number of marker assays were determined
which were required to reach Q10 values of 93, 94, 95, 96,
97, 98%, respectively. For 93–96%, we investigated two-
generation backcrossing programs, and for 96–98% three-
generation backcrossing programs. Two-stage selection
with either SM or HT assay or a combination of both
systems (HT in backcross generation BC1 and SM in the
following backcross generations) was carried out for link-
age maps with dGW = 5, 10, 20 cM.
In the second series of simulations, two-stage selection
with HT assays was carried out. Background selection
markers were either equally spaced or randomly distributed
with dGW = 2, 5, 10, 20 cM. We considered three back-
cross generations and constant values of nt ranging from 40
to 200 individuals.
In the third series of simulations, three-stage selection
was carried out either in backcross generation BC1 or
BC3. In the remaining two generations, two-stage selec-
tion with HT assays was carried out. The flanking
markers for three-stage selection had distances of dF = 5,
10, 20, 30, 40 cM from the target gene and individuals
with f C 1 were selected for genome-wide analysis with
HT assays. Distances between genome-wide background
selection markers were dGW = 5 cM. In the generations
with two-stage selection, we investigated population sizes
from nt = 40 to 200. In the generation with three-stage
selection, these population sizes were multiplied by a
factor m = 1, 2, 5.
In the fourth series of simulations, three-stage selection
was carried out in backcross generations BC1 and BC2.
Marker distances of dGW = 5 cM and dF = 20 cM were
employed. Individuals with f C 1 were pre-selected for
genome-wide analysis in backcross generation BC1, while
only individuals having the highest observed number of
recombinations between target gene and flanking markers
(f = max) were pre-selected in backcross generation BC2.
In backcross generation BC3, two-stage selection was
carried out with HT assays. We investigated population
sizes from nt = 40 to 200 for generations BC2 and BC3. In
backcross generation BC1, these population sizes were
multiplied by the factor m = 1, 2, 5.
For comparing the costs of marker-assisted backcrossing
programs with different selection strategies, linkage maps,
and population sizes, the numbers of SM and HT assays
required for the entire backcrossing program were asses-
sed. For SM analyses, only those markers not yet fixed for
the recipient allele in the non-recurrent parent of a back-
cross population were considered. For HT analyses, the
number of assays was the same as the number of individ-
uals subjected to genome-wide background selection.
Calculation of costs was based on five cost ratios of one HT
assay (corresponding to all HT marker loci on the linkage
map) compared to one SM assay (corresponding to one SM
locus). Cost ratios of HT:SM of 200:1, 100:1, 50:1, 20:1,
10:1 were investigated. For example, a cost ratio HT:SM of
100:1 corresponds to a price of 200€ for analyzing all SNP
background marker loci with a DNA chip, and 2€ for
analyzing one SSR marker locus. Comparisons were car-
ried out to compare (a) the costs of two-stage selection with
HT assays to those of two-stage selection with SM assays,
(b) the costs of two-stage selection with HT assays in
generation BC1 and SM assays in BC2 and BC3 to those of
two-stage selection with HT assays in all backcross gen-
erations, (c) the costs of three-stage selection in BC1 to
those of two-stage selection with HT assays in all gener-
ations. For (a) the costs of SM assays were set 1 and the
relative costs of HT assays were determined, for (b) the
costs of using HT assays in all backcross generations were
set 1 and the relative costs of the strategy combing HT and
SM were determined, and for (c) the costs of two-stage
selection were set 1 and the relative costs of three-stage
selection were determined.
Results
For two-stage selection, HT assays were considerably more
expensive (up to factor 4.77) than SM assays for scenarios
with high relative costs of HT markers (200:1, 100:1, and
50:1) in combination with large marker distances and/or
large attempted Q10 values (Table 1). For scenarios with
small marker distances and/or low relative cost ratios of
HT:SM assays and low attempted Q10 values, HT assays
were cheaper. To reach a Q10 value of 96% in two gen-
erations, the number of required marker assays was 9–14
times greater than those required to reach the same Q10
value in three generations. The increase in the required
number of marker assays, which accompanied the short-
ening of a backcrossing program from three to two gen-
erations, was greater for SM than for HT marker systems.
For high cost ratios of HT:SM markers (200:1, 100:1,
and 50:1) and large marker distances, combining HT assays
Theor Appl Genet (2011) 123:251–260 253
123— 13 —

in generation BC1 with SM assays in generations BC2 and
BC3 for genome-wide background selection was cheaper
(up to 60%) than using HT assays alone (Table 2). This
cost reduction was more pronounced for three-generation
than two-generation backcross programs.
To reach a given Q10 value with randomly distributed
background selection markers, linkage maps with two to
four times more markers are required than with equally
spaced markers of marker distances dGW = 20 or 10 cM
(Table 3). With equally spaced markers and dGW = 5 cM,
approximately the same Q10 values were reached as with
randomly distributed markers and dGW = 2 cM. A decrease
in the distance between equally distributed markers from
dGW = 10 to 5 cM resulted in only marginally greater Q10
values in generation BC3. No difference in the Q10 values
was observed for dGW = 5 and 2 cM.
With three-stage selection combining SM and HT assays
in generation BC1, the flanking marker distance dF had
only marginal influence on the recovered genome-wide
Q10 values (Table 4). For population sizes n2 = n3 \ 100
in generations BC2 and BC3, a substantial increase of the
Q10 values was observed, if in generation BC1 larger
populations n1 [ n2 = n3 were employed. Doubling the
population size in generation BC1 (n1 = mn2 = mn3,
m = 2) had approximately the same effect on the Q10
values as increasing a constant population size by about 20
individuals (n10 = n2
0 = n30 = n2 ? 20). The combination
of doubled population sizes in generation BC1 and small
flanking marker distances dF resulted in less required HT
assays at the expense of more required SM assays to reach
a certain Q10 value, compared to backcrossing programs
with constant population sizes across generations.
Three-stage selection in generation BC3 recovered
similar Q10 values as three-stage selection in generation
BC1 for all combinations of nt and m. However, more HT
assays were required (data not shown).
Three-stage selection in generations BC1 and BC2
required more SM assays but less HT assays compared to
three-stage selection only in generation BC1 for all com-
binations of nt and m (Table 5). For population sizes smaller
than 100, slightly lower Q10 values were recovered.
Three-stage selection combining SM and HT assays in
generation BC1 of a three-generation backcrossing program
was cheaper than two-stage selection with HT assays for all
Table 1 Relative costs of a gene introgression program using HT assays in generations BC1 to BC3 (HT[BC1–3]) compared to using SM assays
in BC1 to BC3 (SM[BC1–3]) depending on the cost ratio of HT:SM assays
dGW Q10 (%) No. of BC
generations
nt No. of assays Cost ratio HT:SM
Relative costs
HT[BC1–3] SM[BC1–3] 200:1 100:1 50:1 20:1 10:1
20 cM (nm = 90) 93 2 44 44 2,643 3.33 1.66 0.83 0.33 0.17
94 2 72 72 4,260 3.38 1.69 0.85 0.34 0.17
95 2 133 133 7,737 3.44 1.72 0.86 0.34 0.17
96 2 291 291 16,583 3.51 1.75 0.88 0.35 0.18
96 3 17 26 1,158 4.40 2.20 1.10 0.44 0.22
97 3 30 45 1,975 4.56 2.28 1.14 0.46 0.23
98 3 70 105 4,401 4.77 2.39 1.19 0.48 0.24
10 cM (nm = 170) 93 2 39 39 4,442 1.76 0.88 0.44 0.18 0.09
94 2 62 62 6,960 1.78 0.89 0.45 0.18 0.09
95 2 110 110 12,141 1.81 0.91 0.45 0.18 0.09
96 2 222 222 24,050 1.85 0.92 0.46 0.18 0.09
96 3 16 24 2,070 2.32 1.16 0.58 0.23 0.12
97 3 26 39 3,258 2.39 1.20 0.60 0.24 0.12
98 3 53 80 6,382 2.49 1.25 0.62 0.25 0.12
5 cM (nm = 330) 93 2 38 38 8,406 0.90 0.45 0.23 0.09 0.05
94 2 60 60 13,077 0.92 0.46 0.23 0.09 0.05
95 2 104 104 22,292 0.93 0.47 0.23 0.09 0.05
96 2 206 206 43,361 0.95 0.48 0.24 0.10 0.05
96 3 15 23 3,780 1.19 0.60 0.30 0.12 0.06
97 3 25 38 6,094 1.23 0.62 0.31 0.12 0.06
98 3 50 75 11,719 1.28 0.64 0.32 0.13 0.06
Two-stage selection, nm equally spaced background selection markers with distances dGW, and population sizes nt were used to recover Q10
target values of 93–98% in two or three backcross generations
254 Theor Appl Genet (2011) 123:251–260
123— 14 —

investigated combinations of nt with m = 1 and m = 2
(Fig. 1). The costs were ranging between 75.3–83.0%
(m = 1) and 57.1–89.7% (m = 2) of the costs of two-stage
selection. For m = 5, three-stage selection was only cheaper
for cost ratios of HT:SM from 200:1 to 50:1. Three-stage
selection with doubled population size (m = 2) in generation
Table 2 Relative costs of a gene introgression program using HT assays in backcross generation BC1 and SM assays in backcross generations
BC2 and BC3 (HT[BC1], SM[BC2,3]) compared to using HT assays in all backcross generations (HT[BC1–3], data presented in Table 1)
depending on the cost ratio of HT:SM assays
dGW Q10 (%) No. of BC
generations
nt No. of assays Cost ratio HT:SM
Relative costs
HT[BC1] SM[BC2,3] 200:1 100:1 50:1 20:1 10:1
20 cM (nm = 90) 93 2 44 22 664 0.58 0.65 0.80 1.25 2.01
94 2 72 36 1,019 0.57 0.64 0.78 1.21 1.92
95 2 133 67 1,749 0.57 0.64 0.77 1.16 1.82
96 2 291 146 3,490 0.56 0.62 0.74 1.10 1.70
96 3 17 9 393 0.42 0.50 0.65 1.10 1.86
97 3 30 15 624 0.40 0.47 0.61 1.03 1.72
98 3 70 35 1,250 0.39 0.45 0.57 0.93 1.52
10 cM (nm = 170) 93 2 39 20 1,130 0.66 0.80 1.09 1.96 3.41
94 2 62 31 1,686 0.64 0.77 1.04 1.86 3.22
95 2 110 55 2,787 0.63 0.75 1.01 1.77 3.03
96 2 222 111 5,183 0.62 0.73 0.97 1.67 2.83
96 3 16 8 712 0.48 0.63 0.93 1.82 3.30
97 3 26 13 1,051 0.47 0.60 0.87 1.68 3.03
98 3 53 27 1,880 0.46 0.57 0.81 1.51 2.69
5 cM (nm = 330) 93 2 38 19 2,129 0.78 1.06 1.62 3.30 6.10
94 2 60 30 3,194 0.77 1.03 1.56 3.16 5.82
95 2 104 52 5,138 0.75 0.99 1.49 2.97 5.44
96 2 206 103 9,359 0.73 0.95 1.41 2.77 5.04
96 3 15 8 1,300 0.63 0.91 1.48 3.17 6.00
97 3 25 13 1,969 0.60 0.86 1.38 2.93 5.52
98 3 50 25 3,479 0.57 0.80 1.26 2.65 4.97
Two-stage selection, nm equally spaced background selection markers with distances dGW, and population sizes nt were used to recover Q10
target values of 93–98% in two or three backcross generations
Table 3 Q10 values recovered in generation BC3 for constant population sizes nt in generations BC1 to BC3 and equally spaced or randomly
distributed markers (dGW = 2, 5, 10, 20 cM) applying two-stage selection with HT assays
dGW (cM) Generation Equally spaced markers, nt Randomly distributed markers, nt
40 80 120 160 200 40 80 120 160 200
20 BC1 79.7 81.4 82.4 83.0 83.4 78.0 79.6 80.5 80.9 81.4
BC2 92.8 94.2 94.9 95.3 95.6 91.3 92.6 93.2 93.6 94.0
BC3 97.4 98.1 98.4 98.6 98.7 96.4 97.0 97.3 97.4 97.5
10 BC1 79.9 81.7 82.7 83.3 83.8 78.8 80.5 81.3 81.9 82.3
BC2 93.0 94.5 95.2 95.6 95.9 91.9 93.4 94.1 94.4 94.8
BC3 97.6 98.4 98.7 98.9 99.0 97.0 97.8 98.1 98.3 98.4
5 BC1 80.0 81.7 82.7 83.4 83.9 79.3 81.0 81.9 82.5 83.0
BC2 93.1 94.5 95.3 95.7 96.0 92.4 93.8 94.4 94.8 95.1
BC3 97.8 98.5 98.8 99.0 99.1 97.1 97.9 98.3 98.4 98.6
2 BC1 80.0 81.8 82.8 83.4 83.8 79.8 81.5 82.5 83.1 83.7
BC2 93.2 94.6 95.3 95.7 96.0 93.0 94.4 95.1 95.5 95.9
BC3 97.8 98.5 98.8 99.0 99.1 97.7 98.5 98.7 98.9 99.1
Theor Appl Genet (2011) 123:251–260 255
123— 15 —

BC1 was the optimal selection strategy for reaching Q10
values of 98 and 99%. The only exception was the combi-
nation of a cost ratio of HT:SM assays of 10:1 and a desired
Q10 value of 99%. In this case, constant population size over
generations (m = 1) was optimal.
Discussion
HT marker systems
HT marker systems are expected to increase the cost-effi-
ciency of marker-assisted backcrossing programs (Ragot
and Lee 2007; Collard and Mackill 2008). However, pre-
vious studies on the efficiency of gene introgression pro-
grams have rarely taken differences between marker
systems into account (Ribaut et al. 2002). In this study, we
investigated the different properties of SM and HT marker
systems and their effect on the efficiency of gene intro-
gression. The simultaneous analysis of a large number of
marker loci at comparatively low cost per individual
marker locus is made feasible in HT assays (Syvanen et al.
2005). They, therefore, promise to be a powerful tool for
marker-assisted background selection, especially when the
expected number of required marker analyses is high.
However, HT assays do not provide the possibility to
Table 4 Q10 values recovered in generation BC3 and number of required SM/HT assays for increased population sizes n1 = mnt (m = 1, 2, 5;
t = 2, 3) in generation BC1 and equally spaced markers (dGW = 5 cM) applying three-stage selection (dF = 5, 10, 20, 30, 40 cM; f C 1) in
generation BC1 and two-stage selection in generations BC2 and BC3
m dF (cM) nt
40 60 80 100 120 140 160 180 200
Q10 (%) in generation BC3
1 40 97.8 98.2 98.5 98.7 98.8 98.9 99.0 99.0 99.1
30 97.8 98.2 98.5 98.7 98.8 98.9 99.0 99.0 99.1
20 97.8 98.2 98.6 98.7 98.9 99.0 99.0 99.1 99.1
10 97.6 98.2 98.5 98.7 98.9 99.0 99.1 99.1 99.2
5 97.4 98.0 98.3 98.6 98.8 98.9 99.0 99.1 99.1
2 40 98.0 98.4 98.6 98.8 98.9 99.0 99.0 99.1 99.2
30 98.0 98.4 98.6 98.8 98.9 99.0 99.1 99.1 99.2
20 98.0 98.5 98.7 98.8 99.0 99.1 99.1 99.2 99.2
10 97.9 98.4 98.7 98.8 99.0 99.1 99.2 99.2 99.3
5 97.7 98.2 98.6 98.8 98.9 99.1 99.1 99.2 99.3
5 40 98.2 98.6 98.8 98.9 99.0 99.1 99.1 99.2 99.2
30 98.2 98.6 98.8 98.9 99.0 99.1 99.2 99.2 99.2
20 98.2 98.6 98.8 99.0 99.1 99.1 99.2 99.2 99.3
10 98.2 98.6 98.9 99.0 99.1 99.2 99.3 99.3 99.4
5 98.1 98.6 98.8 99.0 99.1 99.2 99.3 99.3 99.4
No. of required SM/HT assays
1 40 40/49 60/73 80/98 100/123 120/148 140/172 160/197 180/222 200/246
30 40/47 60/71 80/95 100/119 120/143 140/167 160/191 180/215 200/239
20 40/45 60/68 80/91 100/114 120/137 140/160 160/183 180/206 200/229
10 40/43 60/64 80/86 100/108 120/129 140/151 160/173 180/195 200/216
5 40/44 60/64 80/84 100/104 120/125 140/146 160/166 180/187 200/208
2 40 80/58 120/88 160/117 200/146 240/176 280/205 320/235 360/265 400/294
30 80/55 120/83 160/111 200/139 240/167 280/195 320/223 360/251 400/279
20 80/51 120/77 160/103 200/129 240/155 280/181 320/207 360/233 400/259
10 80/46 120/69 160/93 200/116 240/140 280/163 320/187 360/210 400/234
5 80/44 120/65 160/86 200/108 240/130 280/152 320/174 360/196 400/218
5 40 200/86 300/130 400/174 500/218 600/261 700/305 800/349 900/393 1,000/437
30 200/79 300/119 400/159 500/199 600/239 700/279 800/319 900/359 1,000/399
20 200/69 300/104 400/140 500/175 600/210 700/245 800/280 900/315 1,000/350
10 200/56 300/85 400/114 500/142 600/171 700/200 800/228 900/257 1,000/285
5 200/48 300/73 400/98 500/122 600/147 700/172 800/196 900/221 1,000/245
256 Theor Appl Genet (2011) 123:251–260
123— 16 —

selectively analyze individual markers. In contrast to SM
assays, all markers on the linkage map need to be analyzed
for every backcross individual, even if a large proportion of
markers has already been fixed for the recipient alleles, as
is the case in advanced backcross generations.
Comparing two-generation with three-generation gene
introgression programs showed that SM marker systems
require relatively less assays in three-generation programs
than HT assays. For example, in a two-generation gene
introgression program with distances of genome-wide
background selection markers of dGW = 20 cM, both 44
HT and 2,643 SM assays resulted in a Q10 value of 93%,
whereas in a three-generation program, 45 HT or 1,975 SM
assays resulted in a Q10 value of 97% (Table 1). This
effect is expected to be even more pronounced for back-
ground selection in higher backcross generations, and when
background selection is carried out in selfing generations or
during doubled haploid production. In line, using HT
assays for genome-wide background selection in the first
backcross generation, and SM assays in advanced back-
cross generations reduced the costs of marker analysis
compared to using HT assays in all backcross generations
(Table 2). Only 5–9% of all marker analyses in a three-
generation backcross program fell upon backcross gener-
ation BC3. The cost reduction compared to using HT assays
in all backcross generations was consequently greater for
three-generation than for two-generation programs. We
conclude that HT assays are particularly suited for short
gene introgression programs, while SM assays are efficient
for marker-assisted background selection when in
advanced generations already large percentages of the
markers have been fixed for the recipient alleles.
Marker distance and distribution for genome-wide
background selection
HT systems based on SNP markers are often analyzed with
techniques employing marker numbers that are multiples of
96. We did not limit our investigations to these marker
numbers for two reasons. Firstly, usually not all markers of
such a set are polymorphic for a certain cross. Moreover,
reduced representation sequencing approaches have
recently emerged and a trend towards genotyping by
sequencing can be observed. For these systems, fixed
marker numbers are less relevant. Therefore, we focused in
our study on marker distances dGW, but not on the fixed
marker numbers employed by a certain marker technology.
The results discussed below can be regarded as thresholds,
which, if they are surpassed for two parental lines and a
certain HT markers system, result in the presented Q10
values.
SNPs occur in abundance in plant genomes. Dense
linkage maps with marker distances below 5 cM can con-
sequently be established at reasonable costs. However, the
effect of such dense markers on the recipient genome
recovery has not yet been investigated. Decreasing the
marker distances dGW below 10 cM had only marginal
effect on the recipient genome recovery (Table 1). An
explanation for this result is that on expectation one
crossover per meiosis and chromatid occurs on a chromo-
some segment of length 1 M. In two- or three-generation
backcrossing programs, the number of recombination
events resulting in chromosome segments of different
parental origin is therefore limited. To detect these chro-
mosome segments and to efficiently identify the backcross
individuals with the smallest percentage of donor genome,
a marker distance of dGW = 10 cM is sufficient. Smaller
marker distances are not required, because the factor lim-
iting selection response is not the precise estimation of the
donor genome percentage, but the limited number of
crossovers.
The difference in the Q10 values between equally
spaced and randomly distributed markers was considerable
for all marker distances dGW except 2 cM. Less than half
the markers were required to reach a certain Q10 value
with equally spaced markers compared with randomly
Table 5 Q10 values recovered in generation BC3 and number of required SM/HT assays for increased population sizes n1 = mnt (m = 1, 2, 5;
t = 2, 3) in generation BC1 and equally spaced markers (dGW = 5 cM) applying three-stage selection (dF = 5, 10, 20, 30, 40 cM) in genera-
tions BC1 (f C 1) and BC2 (f = max) and two-stage selection in generation BC3
m dF (cM) nt
40 60 80 100 120 140 160 180 200
Q10 (%) in generation BC3
1 20 97.3 98.0 98.4 98.7 98.8 98.9 99.0 99.1 99.1
2 20 97.6 98.3 98.6 98.8 99.1 99.0 99.1 99.2 99.2
5 20 98.0 98.5 98.8 99.0 99.1 99.1 99.2 99.3 99.3
No. of required SM/HT assays
1 20 58/30 86/45 115/61 143/77 172/93 200/109 228/125 256/141 285/157
2 20 97/36 146/55 194/73 242/92 291/111 338/131 387/151 436/169 484/189
5 20 217/54 325/82 433/111 542/138 650/168 758/196 866/224 974/252 1082/281
Theor Appl Genet (2011) 123:251–260 257
123— 17 —

distributed markers (Table 3). This difference can be
explained by the fact that, with random marker distribution,
occasionally the distance between adjacent markers can get
quite large, resulting in random gaps in the marker cov-
erage. The recipient genome content of the chromosome
regions in these gaps is not assessed and, therefore, the
correlation of the marker estimate of the recurrent parent
genome contribution and the true recurrent parent genome
contribution is lower than for equally spaced markers. This
results in a smaller response to marker-assisted background
selection for randomly distributed compared to equally
spaced markers.
We conclude that the possibility to generate linkage
maps with equidistant marker distribution is a major
advantage of HT marker systems, while the possibility to
establish linkage maps with marker distances below 10 cM
is only of secondary importance for gene introgression
programs.
Pre-selection with flanking markers
In three-stage selection, the pre-selection of backcross
plants showing recombination between the target gene and
flanking markers allows an efficient control of the donor
chromosome segment attached to the target gene. This
reduces the probability of introducing negative alleles
linked to the target gene into the genome of the recipient.
Further, three-stage selection reduces the number of
0.6
0.8
1.0
1.2
Q10 = 98 % Q10 = 99 %
Cost ratio 200:1
0.6
0.8
1.0
1.2
Q10 = 98 % Q10 = 99 %
Cost ratio 100:1
Rel
ativ
e co
sts
Rel
ativ
e co
sts
Rel
ativ
e co
sts
Rel
ativ
e co
sts
Rel
ativ
e co
sts
0.6
0.8
1.0
1.2
Q10 = 98 % Q10 = 99 %
Cost ratio 50:1
0.6
0.8
1.0
1.2
Q10 = 98 % Q10 = 99 %
Cost ratio 20:1
0.6
0.8
1.0
1.2
Q10 = 98 %Q10 = 99 %
Cost ratio 10:1
A: Two−stage selectionB: Three−stage selection in BC1, m = 1C: Three−stage selection in BC1, m = 2D: Three−stage selection in BC1, m = 5
A: Two−stage selectionB: Three−stage selection in BC1, m = 1C: Three−stage selection in BC1, m = 2D: Three−stage selection in BC1, m = 5
100 140 180A,B: n1-n3 60
60 100 140D: n2-n3
100 140C: n2-n3 60 180
100 140 180A,B: n1-n3 60
60 100 140D: n2-n3
100 140C: n2-n3 60 180
100 140 180A,B: n1-n3 60
60 100 140D: n2-n3
100 140C: n2-n3 60 180
100 140 180A,B: n1-n3 60
60 100 140D: n2-n3
100 140C: n2-n3 60 180
100 140 180A,B: n1-n3 60
60 100 140D: n2-n3
100 140C: n2-n3 60 180
↓ ↓ ↓ ↓
↓ ↓↓ ↓
↓↓
Fig. 1 Relative costs of three-stage selection with m = 1, 2, 5 in generation BC1 and two-stage selection in generations BC2 and BC3 compared
to two-stage selection in generations BC1 to BC3 for cost ratios for HT:SM assays of 200:1, 100:1, 50:1, 20:1, and 10:1
258 Theor Appl Genet (2011) 123:251–260
123— 18 —

backcross plants subjected to genome-wide background
selection and, therefore, reduces the number of required
marker assays (Frisch et al. 1999a). To take advantage of
these favorable properties of three-stage selection, a pre-
selection for recombination between the target gene and
flanking markers analyzed with SM assays can be com-
bined with genome-wide background selection on the basis
of HT assays. The design decisions required to implement
such a selection strategy are discussed in the following.
Distances of flanking markers
Tightly linked flanking markers result in short donor
chromosome segments attached to the target gene. How-
ever, they also result in a greater reduction of the number
of individuals subjected to genome-wide background
selection than loosely linked flanking markers. This
reduced selection intensity can result in a decline of the
genome-wide recovery of the recurrent parent genome.
Therefore, the smallest dF that has no negative effect on the
genome-wide response to selection can be regarded as an
optimal flanking marker distance.
In backcrossing programs with constant (m = 1) popu-
lation sizes B60, marker distances dF = 20 cM between
each flanking marker and the target gene resulted in high
overall Q10 values while minimizing the number of HT
assays required for background selection (Table 4). For
larger populations, dF = 10 was optimal. With dF = 5 cM,
controlling the donor genome segment attached to the
target gene resulted in a decrease of the overall Q10 values.
For such tightly linked flanking markers, only few
recombinations do occur in a backcross population (see
Frisch et al. 1999a, b for theoretical results) and, hence,
only few plants are pre-selected and subjected to genome-
wide background selection. This small number of indi-
viduals available for genome-wide background selection
results in a smaller response to selection compared with
less tightly linked flanking markers. We conclude that for
gene introgression programs with constant population
sizes, an optimum exploitation of the advantages of three-
stage selection is reached with flanking marker distances of
dF = 20–10 cM, and that with smaller flanking marker
distances, controlling the donor segment attached to the
target gene is only possible at the cost of a lower overall
Q10 value.
Generation of three-stage selection
Carrying out pre-selection for recombinants at markers
flanking the target gene in only some, but not all genera-
tions of a gene introgression program can considerably
reduce the logistic effort required for the marker analysis.
A comparison of three-stage selection in generations BC1
and BC3 showed similar genome-wide Q10 values, but
three-stage selection in generation BC3 required more HT
marker analyses (results not shown). Therefore, carrying
out three-stage selection in generation BC1 can be regarded
as superior to three-stage selection in generation BC3.
Three-stage selection in generations BC1 and BC2
required less HT assays but more SM assays than three-
stage selection in generation BC1 (Tables 4, 5). For pop-
ulation sizes below 100 individuals, this was accompanied
by smaller genome-wide Q10 values. For population sizes
greater than 100, employing three-stage selection in gen-
erations BC1 and BC2 provides a means to reduce the
number of required genome-wide HT assays, by increasing
the number of required SM analysis. Depending on the
actual costs of SM and HT analysis and the work flow in
the lab, this strategy can be used to shift the number of
required marker analyses from HT to SM assays.
Large population sizes in the first backcross generation
As pre-selection with SM assays reduces the number of
required HT assays, it provides a means to handle larger
populations without necessarily increasing the cost of
marker analysis. Increasing the population size in the
generation where pre-selection with flanking markers is
carried out increases the chance to find an individual with a
small donor chromosome segment attached to the target
gene, which has in addition a high proportion of recurrent
parent genome (Frisch et al. 1999b). This theoretical con-
sideration can serve as a rationale for using large popula-
tion sizes in generations with three-stage selection.
We investigated backcrossing programs with three-
stage selection in BC1 populations that had m = 1, 2, or 5
times the size of the BC2 and BC3 populations in which
two-stage selection was employed (Table 4). The Q10
values reached with m = 1 were comparable to those
reached with two-stage selection for constant population
sizes across generations (Table 3). Doubling the popula-
tion size for three-stage selection in generation BC1
(m = 2, n1 = mn2 = mn3) resulted in Q10 values that
were comparable to those reached with constant popula-
tion sizes but using 20 more individuals per generation
(n10 = n2
0 = n30 = n2 ? 20). Using m = 2 required more
SM but less HT assays than m = 1. A similar effect was
observed for m = 5 and n10 = n2
0 = n30 = n2 ? 40.
However, here the increase in the number of required SM
assays was considerable, while the reduction in the
number of required HT assays was only small.
In conclusion, three-stage selection can be employed to
put a stronger emphasis on the reduction of the donor
segment attached to the target gene, and using two times
larger population sizes in generation BC1 (m = 2) than in
BC2 and BC3 allows to shift the effort in the lab from HT to
Theor Appl Genet (2011) 123:251–260 259
123— 19 —

SM assays compared to constant population size in all
backcross generations (m = 1). These effects can be
exploited without a reduction in the overall Q10 values.
However, neither genetic advantages nor a reduction in the
required marker assays supported employing five times
larger populations in generation BC1 (m = 5) than in
generations BC2 and BC3.
Relative costs of three-stage selection
To compare the costs of three-stage selection in generation
BC1 with those of two-stage selection, we assumed cost
ratios of 200:1 to 10:1 for the costs of one HT assay
(comprising all marker loci on the linkage map) in relation
to one SM assay (for one SM locus). First, the number of
marker assays required to reach a given Q10 value with
three-stage selection was determined from the simulations
presented in Table 4, and the number of marker assays
required to reach this Q10 value with two-stage selection
was determined from the simulations presented in Table 3.
Then the costs required with three-stage selection were
determined with the above cost ratios and were set in
relation to the costs that were required with two-stage
selection (Fig. 1). For example, with a cost ratio of 200:1
for HT:SM assays (first diagram in Fig. 1) reaching the
Q10 value of 99% with three-stage selection and m = 5
required 0.85 times the costs that were required to reach the
Q10 value of 99% with two-stage selection. Three-stage
selection with m = 1 required 0.77, and three-stage
selection with m = 2 required 0.74 times the costs of two
stage selection.
From the cost comparisons, we conclude that three-stage
selection reaches a given Q10 value with less cost than
two-stage selection, regardless of the cost ratio of HT:SM
assays. If the aspired Q10 values are 99% or less, then
doubling the population size in generation BC1 provides a
means to further reduce the costs required for the marker
analyses.
Acknowledgements We thank the anonymous reviewers and the
editor for their helpful suggestions. In particular, we gratefully
acknowledge the comments of one reviewer that considerably
improved the manuscript. We thank Gregory Mahone for proof-
reading the manuscript.
References
Bouchez A, Hospital F, Causse M, Gallais A, Charcosset A (2002)
Marker-assisted introgression of favorable alleles at quantitative
trait loci between maize elite lines. Genetics 162:1945–1959
Collard BCY, Mackill DJ (2008) Marker-assisted selection: an
approach for precision plant breeding in the twenty-first century.
Phil Trans R Soc 363:557–572
Falke KC, Frisch M (2011) Power and false positive rate in QTL
detection with near-isogenic line libraries. Heredity
106:576–584
Falke KC, Miedaner T, Frisch M (2009) Selection strategies for the
development of rye introgression libraries. Theor Appl Genet
119:595–603
Frisch M, Melchinger AE (2001) Marker-assisted backcrossing for
introgression of a recessive gene. Crop Sci 41:1485–1494
Frisch M, Melchinger AE (2001) Marker-assisted backcrossing for
simultaneous introgression of two genes. Crop Sci 41:1716–1725
Frisch M, Bohn M, Melchinger AE (1999) Comparison of selection
strategies for marker-assisted backcrossing of a gene. Crop Sci
39:1295–1301
Frisch M, Bohn M, Melchinger AE (1999) Minimum sample size and
optimal positioning of flanking markers in marker-assisted
backcrossing for transfer of a target gene. Crop Sci 39:967–975
Gupta PK, Roy JK, Prasad M (2001) Single nucleotide polymor-
phisms: a new paradigm for molecular marker technology and
DNA polymorphism detection with emphasis on their use in
plants. Curr Sci 80:524–535
Hospital F, Charcosset A (1997) Marker-assisted introgression of
quantitative trait loci. Genetics 147:1469–1485
Hospital F, Chevalet C, Mulsant P (1992) Using markers in gene
introgression breeding programs. Genetics 132:1199–1210
Maurer HP, Melchinger AE, Frisch M (2008) Population genetic
simulation and data analysis with Plabsoft. Euphytica
161:133–139
Peleman JD, van der Voort JR (2003) Breeding by design. Trends
Plant Sci 7:330–334
Prigge V, Maurer HP, Mackill DJ, Melchinger AE, Frisch M (2008)
Comparison of the observed with the simulated distributions of
the parental genome contribution in two marker-assisted back-
cross programs in rice. Theor Appl Genet 116:739–744
Prigge V, Melchinger AE, Dhillon BS, Frisch M (2009) Efficiency
gain of marker-assisted backcrossing by sequentially increasing
marker densities over generations. Theor Appl Genet 119:23–32
Ragot M, Lee M (2007) Marker-assisted selection in maize: current
status, potential, limitations and perspectives from the private
and public sectors. In: Guimaraes EP, Ruane J, Scherf BD,
Sonnino A, Dargie JD (eds) Marker-assisted selection. Current
status and future perspectives in crops, livestock, forestry and
fish. FAO, Rome, pp 117–150
Ribaut JM, Jiang C, Hoisington D (2002) Simulation experiments on
efficiencies of gene introgression by backcrossing. Crop Sci
42:557–565
Schon CC, Melchinger AE, Boppenmaier J, Brunklaus-Jung E,
Herrmann RG, Seitzer JF (1994) RFLP mapping in maize:
quantitative trait loci affecting testcross performance of elite
European flint lines. Crop Sci 34:378–389
Syvanen AC (2005) Toward genome-wide SNP genotyping. Nat
Genet 37:S5–S10
260 Theor Appl Genet (2011) 123:251–260
123— 20 —

Chapter 3
Efficient marker-assistedbackcross conversion of seedparent lines to cytoplasmicmale sterility1
1Herzog, E, & Frisch, M. 2013. Efficient marker-assisted backcross conversion of seed-parent lines to cytoplasmic male sterility. Plant Breeding, 132(1), 33-41.

Efficient marker-assisted backcross conversion of seed-parent lines tocytoplasmic male sterilityE V A H E R Z O G
1 and M A T T H I A S F R I S C H1,2
1Institute of Agronomy and Plant Breeding II, Justus Liebig University, D-35392, Giessen, Germany; 2Corresponding author,E-mail: [email protected]
With 2 figures and 5 tables
Received July 2, 2012 / Accepted September 29, 2012Communicated by H.-P. Piepho
AbstractFor many crops, cytoplasmic male sterility (CMS) is a cornerstone ofhybrid production. Efficient conversion of elite lines to CMS bymarker-assisted backcrossing is therefore desirable. In contrast to geneintrogression, for which donor segments around target genes have to beconsidered, background selection for CMS conversion focuses solely onrecovery of the recurrent parent genome. The optimal selection strategiesfor CMS conversion will consequently differ from those for geneintrogression and have not yet been investigated. The objectives of ourstudy were to evaluate and optimize the resource requirements of CMSconversion programmes and to determine the most cost-effective use ofsingle-marker (SM) and high-throughput (HT) assays for this purpose.We conducted computer simulations for CMS conversion of geneticmodels of sugar beet, rye, sunflower and rapeseed. CMS conversionrequired fewer resources than gene introgression with respect to popula-tion size, marker data points and number of backcross generations. Com-bining HT assays in early backcross generations with SM assays inadvanced backcross generations further increased the cost-efficiency ofCMS conversion for a broad range of cost ratios.
Key words: cytoplasmic male sterility — simulation study —
high-throughput markers — hybrid breeding — marker-assistedbackcrossing
Cytoplasmic male sterility (CMS) in plants is a maternally inher-ited condition, which inhibits the production of functional pollen.It is mediated by plant mitochondrial genomes and the interac-tion of mitochondrial and nuclear genes (Chase 2007). In seedcrops such as rye, sunflower, rice and rapeseed, CMS plusnuclear restoration of male-fertility in F1 progeny is essential forlarge-scale production of hybrid seeds. CMS is a mainstay forhybrid breeding and seed production in sugar beet and rye(Hagihara et al. 2005, Tomerius et al. 2008). For some cropssuch as Brassica oleracea, where the use of CMS in hybridbreeding is a comparatively new system, conversion of existingelite lines to CMS is required. For rapeseed (Brassica napus), inwhich the genetic basis of adapted germplasm is relatively nar-row (Gehringer et al. 2007), CMS conversion of newly devel-oped lines is used after the introduction of new genetic variationinto the breeding pool. Moreover, it has been recognized inmaize and rice that cytoplasmic uniformity can lead to vulnera-bility to pathogens (Pring and Lonsdale 1989, Dalmacio et al.1995). For such crops, it may be important to convert existinglines to newly identified CMS systems to reduce maternallyinherited disease susceptibility.New CMS donors used in early cycles of hybrid breeding pro-
grammes are often poorly adapted or wild relatives of cultivated
crops (Hanson and Bentolila 2004). Complete recovery of theconverted elite genotypes is therefore desirable. Typically, elitelines are selected as fertile maintainers and converted to CMS bybackcrossing. As thousands of lines often are to be converted,breeders will seek to devote as little resources as possible to theconversion of a single line.In commercial breeding programmes, dense marker maps are
available for major crops. In combination with high-throughput(HT) marker systems based on single nucleotide polymorphisms(SNPs), they can speed up the backcross process by marker-assisted background selection (Gupta et al. 2010).In the field of single-marker (SM) assays, the Competitive
Allele Specific PCR (KASPar) assay has quite recently emerged.KASPar is a SNP detection system, which is cost-effective forgenotyping small subsets of SNP markers. It enables the com-bined use of HT and SM assays for SNP genotyping at differentstages in marker-assisted breeding programmes, given that aSNP set exists which is inter-convertible between KASPar andHT marker platforms (Chen et al. 2010, Mammadov et al.2012). An advantage of HT assays is fast and cost-effectivescreening of large populations with a high number of markerdata points. However, while with HT assays such as SNP chips,all markers need to be analysed in every backcross generation,SM assays allow for analysing only those marker loci which arenot yet fixed for the desired alleles in advanced backcrossgenerations. A combination of HT assays in early backcross gen-erations with SM assays in advanced backcross generations hasthe potential to increase the cost-effectiveness of backgroundselection for gene introgression (Herzog and Frisch 2011).For gene introgression, background selection focuses on both
reduction of donor segments around target genes and recurrentparent genome recovery. In contrast, in CMS conversion pro-grammes, background selection solely focuses on fast and com-plete recurrent parent genome recovery. Moreover, as nopreselection for target genes is conducted, all individuals from abackcross are subjected to background selection. This results inhigher selection intensity and hence a greater selection responseper backcross generation. However, it will also substantiallyincrease the number of required marker data points. The optimalstrategies for using molecular markers for CMS conversion willconsequently differ from those for gene introgression and havenot yet been investigated for major CMS crops. Depending on thegenome size of a crop species, population size, marker densityand use of HT and/or SM marker systems need to be optimized.The goal of our study was to investigate, with computer simu-
lations, CMS conversion in sugar beet, rye, sunflower and rape-
wileyonlinelibrary.com
Plant Breeding 132, 33–41 (2013) doi:10.1111/pbr.12021© 2012 Blackwell Verlag GmbH
— 22 —

seed with two to four backcross generations. In particular, ourobjectives were (i) to assess recurrent parent genome recoverywith different marker densities and to investigate the effect ofincreasing population size per backcross generation, (ii) to evalu-ate the resource requirements for recovering varying target levelsof recurrent parent genome while minimizing the number ofmarker data points, and (iii) to determine the most efficient useof SM and HT assays for different cost ratios of HT/SM.
Material and MethodsSimulations were conducted assuming no interference in crossover for-mation. Each simulation was replicated 10 000 times to reduce samplingeffects and to obtain results with high numerical accuracy and a smallstandard error. The 10% quantile (Q10), the arithmetic mean and thestandard deviation of the probability distribution of the proportion ofrecipient genome in the entire genome of selected individuals (in percent-age) were determined in every backcross generation to measure recurrentparent genome recovery.
Q10 values were included as they allow inferences about the probabil-ity to reach a certain level of recurrent parent genome. For example, aQ10 value of 96% can be interpreted as ‘with a probability of 0.9 a recur-rent parent genome proportion >96% can be achieved’. The arithmeticmean does not allow such probability inferences in advanced backcrossgenerations, when the distribution of recurrent parent genome is gettingmore skewed.
We investigated four different genetic models that represent differentcrop species for which CMS is used in hybrid seed production. Model 1represented sugar beet (Beta vulgaris) and cabbage (B. oleracea) and hadn = 9 chromosomes of 100 cM length (cf. Weber et al. 1999, cf. Ini-guez-Luy et al. 2009). Model 2 represented rye (Secale cereale) and hadn = 7 chromosomes of 100 cM length (cf. Gustafson et al. 2009).Model 3 represented sunflower (Helianthus annuus) and had n = 17chromosomes of 80 cM length (cf. Tang et al. 2002). Model 4 repre-sented rapeseed (B. napus) and had n = 19 chromosomes of 140 cMlength (cf. Piquemal et al. 2005). These models are hereafter referred toas sugar beet, rye, sunflower and rapeseed, respectively.
Markers for genome-wide background selection were assumed to beequally spaced. We considered different marker densities: two markersper chromosome (2M/chr), three markers per chromosome (3M/chr), aswell as marker distances between two adjacent loci of 20, 10, 5 and2 cM. For 2M/chr and 3M/chr, markers divided the chromosomes in 3or 4 equal parts, respectively. For marker densities of 20, 10, 5 and2 cM, the first marker and last marker of each chromosome were placedon the telomeres.
Each backcross scheme started by crossing two homozygous parents(CMS donor and recipient), which were polymorphic at all loci. TheCMS recipient carried the desirable alleles at all loci of the genome,while the donor carried no desirable alleles. The CMS recipient wasassumed to be a fertile maintainer. An F1 individual was created bycrossing CMS donor and recipient. This F1 individual was backcrossedto the recipient to create n1 BC1 individuals. The n1 BC1 individualswere subjected to genome-wide background selection. A selection indexi = Σm xm was constructed, where summation is over markers and xm isthe number of recurrent parent alleles at the mth marker. The plant withthe highest value of i was selected and backcrossed to the recipient. Foreach of the four genetic models, we investigated two to four backcrossgenerations t and constant population sizes of nt ranging from 10 to 200individuals.
For calculating the relative costs of different marker strategies, theresource requirements for target Q10 values of 96% in generation BC2
and 99% in generation BC3 with a marker density of 10 cM were deter-mined. One HT assay included genotyping one individual for all markerson the linkage map. One SM assay corresponded to one locus and thusone marker data point. For estimating the total number of required mar-ker data points for SM assays, only marker loci not yet fixed for the reci-pient allele were analysed in advanced backcross generations. We took
into account cost ratios of HT : SM of 200 : 1, 100 : 1, 50 : 1, 20 : 1and 10 : 1. To give an example in absolute costs, a cost ratio of HT/SMof 100 : 1 corresponded to costs of € 50 for analysing all SNP back-ground marker loci with a SNP chip, and € 0.5 for analysing one SNPmarker locus with a KASPar assay. We compared the costs of using onlyHT assays in all generations of the backcross conversion programme(strategy HT) to the costs of using only SM assays in all generations ofthe backcross conversion programme (strategy SM). In this case, thecosts for strategy SM were set to 1.
In addition, for two-generation programmes, we compared the costs ofa combined strategy that relied on HT assays in generation BC1 and SMassays in generation BC2 (strategy Combined A) to the costs of strategySM and strategy HT. In this case, the costs of strategy SM and strategyHT were set to 1, respectively. For three-generation programmes, wecompared the costs of a strategy using HT assays in generation BC1 andSM assays in generations BC2 and BC3 (strategy Combined B) to thecosts of strategy HT. We also compared the costs of a strategy using HTassays in generations BC1 and BC2, and SM assays in generation BC3
(strategy Combined C) to the costs of strategy HT. In both cases, thecosts for strategy HT were set to 1.
ResultsFor a marker density of 20 cM and constant population sizes ofnt = 40, 80, 120, 160, 200 individuals per backcross generation,the Q10 values recovered in generations BC1 and BC2 werehigher for genetic models with shorter genomes (Tables 1–4).Q10 values for rye were 2.9–3.8% higher than for rapeseed,while for sugar beet and sunflower, intermediate Q10 valueswere recovered. The differences in Q10 values between thegenetic models that were observed in generation BC2 diminishin advanced backcross generations.Genetic models with shorter genomes had fewer and shorter
fragments of donor genome in generations BC1 and BC2
(Tables 1–4). In generations BC1 and BC2, the length of donorfragments is decreasing to a greater extent with increasing nt ingenetic models with shorter genomes. The average length ofdonor fragments is decreasing by about 39% in sugar beet, 30%in rye, 28% in sunflower and 20% in rapeseed if nt is increasedfrom 40 to 200 individuals in generation BC2. The averagelength of donor fragments ranged between 32% and 46% ofmarker distance for rye and 88–110% for rapeseed in generationBC2. In advanced backcross generations, the differences in thelength of donor fragments between population sizes and geneticmodels diminish considerably.Genetic models with shorter genomes required fewer marker
data points (Tables 1–4). For a population size of nt = 200,rapeseed required about four times as many marker data pointsas rye, about three times as many marker data points as sugarbeet, and about twice as many marker data points as sunflower.For all genetic models, the major proportion of marker datapoints had to be analysed in generations BC1 and BC2. Forexample, for sugar beet, 98.2–99.8% of marker analyses had tobe conducted in generations BC1 and BC2. From generation BC3
–BC4, marker data points were no longer or only marginallyincreasing, indicating complete fixation. This also held true forhigher marker densities of 10, 5 and 2 cM (data not shown).For all four genetic models, Q10 values of >90% could be
recovered in generation BC2 with low marker densities of 2M/chr or 3M/chr and nt = 10–20 individuals per backcross genera-tion (Fig. 1). Q10 values increased considerably for all fourinvestigated genetic models when population size was increasedfrom nt = 10 to nt = 40–50 individuals per backcross generation,irrespective of marker density.
34 E. HERZOG and M. FR I SCH
— 23 —

For all genetic models, Q10 values of � 96% could bereached in generation BC2. Minimum required marker densitiesfor a Q10 value of 96% were 3M/chr for sugar beet and rye,2M/chr for sunflower and 20 cM for rapeseed. For sugar beetand rye, there was a limit of recurrent parent genome that couldbe recovered, indicated by a plateau in the Q10 curves for mar-ker densities of 2M/chr, 3M/chr and 20 cM. The populationsizes per backcross generation for which the limit was reacheddepended on marker density and lay between nt = 70–200 for
sugar beet and between nt = 50–150 for rye. For sunflower andrapeseed, the plateau was not reached with the highest investi-gated population size of nt = 200.The differences in Q10 values between marker densities were
bigger in sugar beet and rye than in sunflower and rapeseed(Fig. 1). For example, for nt = 100 individuals per backcrossgeneration, the differences in Q10 values between a marker den-sity of 3M/chr and 20 cM were 1.7% for sugar beet, 2.3% forrye, 0.4% for sunflower and 1.0% for rapeseed. The maximum
Table 1: Sugar beet: recovered proportion of recurrent parent genome (Q10, �x, sx), required number of marker data points (MDP) for single-markerassays, number of donor fragments (�x, sx) and length of donor fragments in cM (�x, sx) in generations BC1–BC4 with genome-wide background selec-tion with constant population sizes nt = 40, 80, 120, 160, 200 and equally spaced markers (marker density 20 cM) (Note that the number of requiredhigh-throughput assays can be easily obtained by multiplying nt by the number of backcross generations)
nt BCt
Recurrent parent genome (%)
MDP
No. of donorfragments
Length of donorfragments (cM)
Q10 �x sx �x sx �x sx
40 BC1 84.56 88.08 2.81 2160 6.48 1.71 33.10 28.16BC2 97.23 98.71 1.07 2682 2.00 1.31 11.60 10.20BC3 99.32 99.80 0.32 2732 0.59 0.78 6.01 4.49BC4 99.57 99.90 0.23 2732 0.32 0.58 5.70 4.36
80 BC1 86.30 89.60 2.61 4320 6.06 1.68 30.90 26.79BC2 98.19 99.27 0.75 5233 1.44 1.16 9.19 7.75BC3 99.34 99.82 0.31 5276 0.54 0.74 6.08 4.56BC4 99.62 99.91 0.22 5276 0.28 0.55 5.79 4.38
120 BC1 87.32 90.34 2.45 6480 5.86 1.65 29.65 25.95BC2 98.58 99.46 0.62 7754 1.20 1.09 8.06 6.63BC3 99.38 99.83 0.30 7790 0.50 0.72 6.02 4.55BC4 99.65 99.92 0.21 7790 0.27 0.53 5.64 4.38
160 BC1 87.98 90.89 2.36 8640 5.71 1.64 28.71 25.25BC2 98.81 99.55 0.55 10245 1.10 1.05 7.34 5.91BC3 99.40 99.83 0.30 10273 0.51 0.73 5.89 4.42BC4 99.65 99.91 0.21 10273 0.27 0.54 5.59 4.36
200 BC1 88.46 91.30 2.29 10800 5.60 1.63 27.96 24.76BC2 98.92 99.60 0.51 12723 1.01 1.01 7.07 5.58BC3 99.40 99.84 0.29 12745 0.49 0.71 5.93 4.47BC4 99.65 99.92 0.21 12745 0.27 0.53 5.65 4.35
Table 2: Rye: recovered proportion of recurrent parent genome (Q10, �x, sx), required number of marker data points (MDP), number of donor frag-ments (�x, sx) and length of donor fragments (�x, sx) in generations BC1–BC4 with genome-wide background selection with constant population sizesnt = 40, 80, 120, 160, 200 and equally spaced markers (marker density 20 cM) (Note that the number of required high-throughput assays can be easilyobtained by multiplying nt by the number of backcross generations)
nt BCt
Recurrent parent genome (%)
MDP
No. of donorfragments
Length of donorfragments (cM)
Q10 �x sx �x sx �x sx
40 BC1 85.75 89.73 3.15 1680 4.71 1.51 30.50 26.45BC2 98.05 99.28 0.87 2031 1.11 1.04 9.11 7.80BC3 99.31 99.82 0.35 2047 0.42 0.66 5.93 4.47BC4 99.66 99.91 0.24 2047 0.22 0.48 5.46 4.31
80 BC1 87.79 91.35 2.85 3360 4.32 1.45 28.01 24.64BC2 98.79 99.60 0.58 3953 0.78 0.89 7.23 5.79BC3 99.35 99.84 0.33 3961 0.38 0.63 5.88 4.43BC4 99.69 99.92 0.23 3961 0.20 0.46 5.57 4.34
120 BC1 88.82 92.21 2.67 5040 4.14 1.41 26.34 23.47BC2 98.93 99.66 0.51 5844 0.72 0.87 6.59 4.99BC3 99.38 99.85 0.33 5847 0.36 0.62 5.89 4.50BC4 99.71 99.92 0.23 5847 0.20 0.46 5.53 4.37
160 BC1 89.55 92.78 2.56 6720 3.98 1.42 25.41 22.59BC2 99.01 99.69 0.47 7715 0.68 0.83 6.40 4.72BC3 99.39 99.85 0.32 7716 0.36 0.61 5.87 4.49BC4 99.73 99.93 0.22 7716 0.18 0.45 5.60 4.31
200 BC1 90.14 93.18 2.44 8400 3.88 1.38 24.58 21.87BC2 99.02 99.70 0.46 9576 0.65 0.82 6.39 4.67BC3 99.37 99.85 0.32 9577 0.35 0.60 6.09 4.54BC4 99.72 99.93 0.22 9577 0.18 0.43 5.76 4.38
Efficient CMS conversion 35
— 24 —

Q10 values recovered in generation BC2 depended on genomelength and were 99.60% for sugar beet, 99.99% for rye, 98.09%for sunflower and 96.50% for rapeseed. Increasing marker den-sity from 10 to 5 or 2 cM did not substantially increase Q10 val-ues. This held true for all investigated genetic models.Moreover, marker densities of 5 and 2 cM incurred very highnumbers of marker data points (data not shown).The optimum designs that minimized the required number of
marker data points for target Q10 values of 96–99% in
generation BC2 employed marker densities of 2M/chr–10 cM forsugar beet and rye (Table 5). For the sunflower model, a Q10value of 98% could only be reached with a marker density of5 cM and 68 000 marker data points. For rapeseed, a Q10 valueof 96% in generation BC2 could only be reached with a markerdensity of 20 cM and about 33 000 marker data points. Highertarget Q10 values could not be reached in generation BC2 forthis model. For all four genetic models, two-generation pro-grammes incurred substantially more marker data points than
Table 3: Sunflower: recovered proportion of recurrent parent genome (Q10, �x, sx), required number of marker data points (MDP), number of donorfragments (�x, sx) and length of donor fragments (�x, sx) in generations BC1–BC4 with genome-wide background selection with constant population sizesnt = 40, 80, 120, 160, 200 and equally spaced markers (marker density 20 cM) (Note that the number of required high-throughput assays can be easilyobtained by multiplying nt by the number of backcross generations)
nt BCt
Recurrent parent genome (%)
MDP
No. of donorfragments
Length of donorfragments (cM)
Q10 �x sx �x sx �x sx
40 BC1 82.19 85.06 2.31 3400 11.81 2.17 34.39 26.21BC2 95.46 97.08 1.24 4424 4.94 1.83 16.11 14.47BC3 99.20 99.69 0.36 4620 1.23 1.14 6.84 5.53BC4 99.57 99.87 0.21 4626 0.59 0.80 5.75 4.42
80 BC1 83.61 86.23 2.12 6800 11.35 2.13 32.99 25.73BC2 96.45 97.84 1.04 8692 4.17 1.69 14.12 12.53BC3 99.37 99.77 0.29 8976 1.01 1.03 6.24 4.63BC4 99.59 99.89 0.20 8976 0.53 0.75 5.82 4.41
120 BC1 84.37 86.88 2.03 10200 11.05 2.13 32.30 25.48BC2 96.94 98.20 0.94 12904 3.76 1.64 13.01 11.44BC3 99.40 99.78 0.28 13249 0.98 1.00 6.10 4.49BC4 99.60 99.89 0.19 13249 0.52 0.75 5.63 4.35
160 BC1 84.93 87.36 1.98 13600 10.84 2.11 31.72 25.24BC2 97.29 98.45 0.86 17076 3.47 1.60 12.15 10.65BC3 99.41 99.79 0.27 17464 0.94 1.00 6.06 4.59BC4 99.62 99.90 0.19 17464 0.49 0.71 5.75 4.45
200 BC1 85.30 87.68 1.95 17000 10.72 2.07 31.26 25.02BC2 97.52 98.61 0.81 21244 3.24 1.55 11.64 10.04BC3 99.41 99.79 0.27 21670 0.93 0.98 6.04 4.51BC4 99.61 99.89 0.19 21670 0.49 0.72 5.81 4.45
Table 4: Rapeseed: recovered proportion of recurrent parent genome (Q10, �x, sx), required number of marker data points (MDP), number of donorfragments (�x, sx) and length of donor fragments (�x, sx) in generations BC1–BC4 with genome-wide background selection with constant population sizesnt = 40, 80, 120, 160, 200 and equally spaced markers (marker density 20 cM) (Note that the number of required high-throughput assays can be easilyobtained by multiplying nt by the number of backcross generations)
nt BCt
Recurrent parent genome (%)
MDP
No. of donorfragments
Length of donorfragments (cM)
Q10 �x sx �x sx �x sx
40 BC1 81.07 83.37 1.89 6080 19.60 2.87 45.13 38.58BC2 94.19 95.65 1.11 8116 10.57 2.60 21.92 20.56BC3 98.68 99.29 0.44 8644 3.69 1.86 10.27 9.21BC4 99.64 99.86 0.16 8712 1.28 1.17 5.75 4.46
80 BC1 82.19 84.36 1.78 12160 19.16 2.86 43.45 37.65BC2 95.12 96.39 0.99 15992 9.59 2.53 20.00 18.78BC3 99.07 99.54 0.34 16861 2.88 1.71 8.42 7.34BC4 99.66 99.87 0.15 16926 1.20 1.13 5.74 4.39
120 BC1 82.86 84.89 1.69 18240 18.87 2.87 42.59 37.14BC2 95.62 96.79 0.91 23797 9.09 2.46 18.77 17.61BC3 99.24 99.64 0.30 24955 2.53 1.64 7.47 6.38BC4 99.67 99.88 0.15 25011 1.15 1.11 5.70 4.36
160 BC1 83.26 85.25 1.64 24320 18.71 2.84 41.93 36.68BC2 95.91 97.04 0.86 31551 8.64 2.38 18.23 17.00BC3 99.34 99.70 0.26 32970 2.29 1.55 6.96 5.68BC4 99.68 99.88 0.15 33014 1.09 1.09 5.77 4.40
200 BC1 83.58 85.51 1.58 30400 18.58 2.84 41.50 36.50BC2 96.16 97.22 0.82 39284 8.39 2.37 17.64 16.35BC3 99.40 99.73 0.24 40941 2.18 1.53 6.63 5.33BC4 99.68 99.88 0.14 40974 1.09 1.10 5.69 4.36
36 E. HERZOG and M. FR I SCH
— 25 —

three-generation programmes. The shorter genomes of sugar beetand rye required 3.6–11.2 times as many marker data points fortwo-generation programmes as for three-generation programmes.For sunflower and rapeseed, two-generation programmesrequired 28.8–60.2 times as many marker data points as three-generation programmes.For two-generation programmes, strategy HT was 0.05–4.10
times as expensive as strategy SM for recovering a target Q10value of 96%, depending on genetic model and cost ratio ofHT : SM (Fig. 2a). Strategy Combined A was more cost-effec-tive than strategy HT, indicated by the smaller range of rela-tive costs and the smaller slopes of the cost curves (Fig. 2b).Which marker strategy was cheapest depended on the costratio of HT : SM and the genetic model. For sugar beet, strat-egy HT was the cheapest strategy for cost ratios of HT : SMof 10 : 1–35 : 1 (Fig. 2c). For cost ratios ranging between35 : 1 and 100 : 1, strategy Combined A was cheapest(Fig. 2b). For cost ratios of HT : SM >100 : 1, strategy SMwas cheapest. If the choice was between either strategy HT orstrategy SM, strategy HT should be used for cost ratios ofHT : SM of 10 : 1–60 : 1 (Fig. 2a). For longer genomes,using HT assays became relatively cheaper compared with SM
assays. For rapeseed, strategy HT was the cheapest strategyfor recovering a target Q10 value of 96% for cost ratios ofHT : SM of up to 190 : 1 (Fig. 2a). For cost ratios >190 : 1,strategy Combined A was cheapest (Fig. 2b). Strategy SM wasnever cheaper than strategy Combined A.For three-generation programmes with a target Q10 value of
99%, the use of HT assays became less efficient compared withSM assays (Fig. 2d), indicated by steeper cost curves. StrategyCombined C was equivalent to or cheaper than strategy HT fornearly all investigated scenarios (Fig. 2f).
DiscussionGenetic models
Computer simulations and model calculations are consideredrobust and useful tools for the optimization of breeding pro-grammes (Prigge et al. 2008, Tomerius et al. 2008). However,the validity of simulated results for real breeding applications isinfluenced by the theoretical assumptions for the underlyinggenetic model.We used a Poisson procedure for modelling crossover formation
during meiosis, assuming no interference in crossover formation as
50 100 150 200
9092
9496
9810
0
50 100 150 200
9092
9496
9810
0
Rye
Population size
50 100 150 200
9092
9496
9810
0
Sugar beet
Population size
Sunflower
Population size
50 100 150 200
9092
9496
9810
0
Rapeseed
Population size
2 cM 5 cM 10 cM 20 cM 3M/chr 2M/chr
Q10
[%]
Q10
[%]
Fig. 1: Q10 values recovered in generation BC2 with genome-wide background selection (marker densities 2M/chr, 3M/chr and 2, 5, 10, 20 cM) withconstant population sizes nt = 20–300 and equally spaced markers for four genetic models
Efficient CMS conversion 37
— 26 —
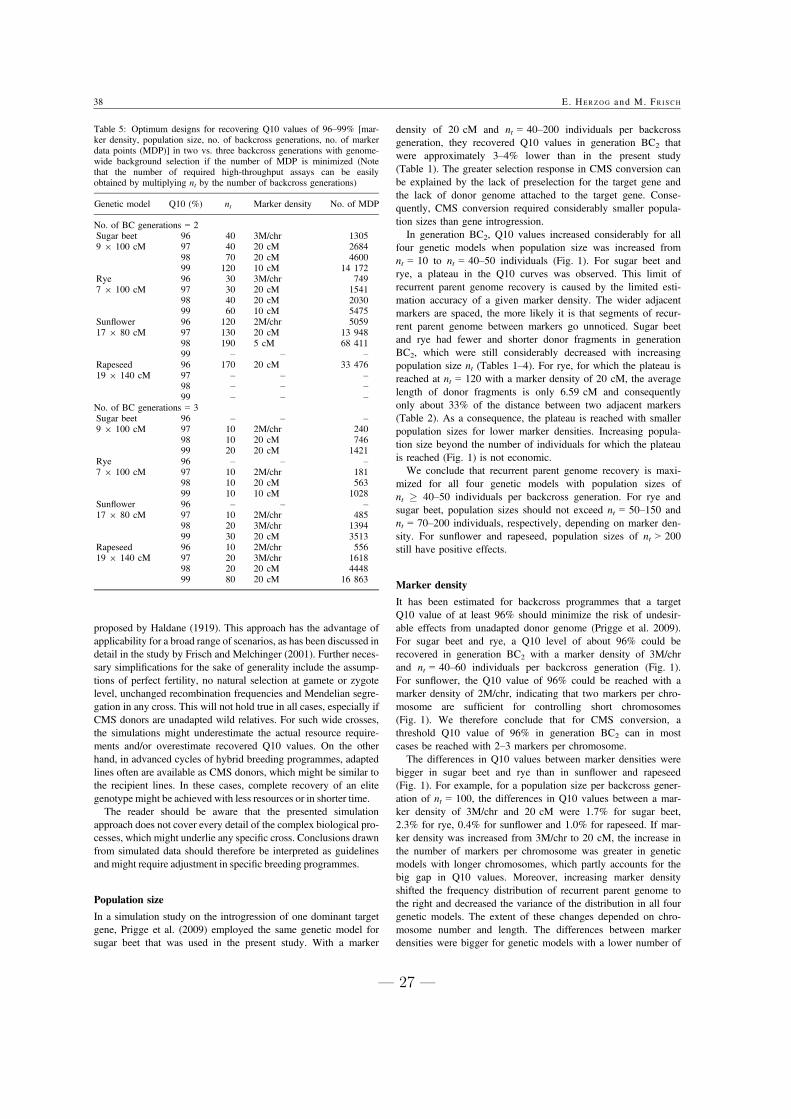
proposed by Haldane (1919). This approach has the advantage ofapplicability for a broad range of scenarios, as has been discussed indetail in the study by Frisch and Melchinger (2001). Further neces-sary simplifications for the sake of generality include the assump-tions of perfect fertility, no natural selection at gamete or zygotelevel, unchanged recombination frequencies and Mendelian segre-gation in any cross. This will not hold true in all cases, especially ifCMS donors are unadapted wild relatives. For such wide crosses,the simulations might underestimate the actual resource require-ments and/or overestimate recovered Q10 values. On the otherhand, in advanced cycles of hybrid breeding programmes, adaptedlines often are available as CMS donors, which might be similar tothe recipient lines. In these cases, complete recovery of an elitegenotype might be achieved with less resources or in shorter time.The reader should be aware that the presented simulation
approach does not cover every detail of the complex biological pro-cesses, which might underlie any specific cross. Conclusions drawnfrom simulated data should therefore be interpreted as guidelinesand might require adjustment in specific breeding programmes.
Population size
In a simulation study on the introgression of one dominant targetgene, Prigge et al. (2009) employed the same genetic model forsugar beet that was used in the present study. With a marker
density of 20 cM and nt = 40–200 individuals per backcrossgeneration, they recovered Q10 values in generation BC2 thatwere approximately 3–4% lower than in the present study(Table 1). The greater selection response in CMS conversion canbe explained by the lack of preselection for the target gene andthe lack of donor genome attached to the target gene. Conse-quently, CMS conversion required considerably smaller popula-tion sizes than gene introgression.In generation BC2, Q10 values increased considerably for all
four genetic models when population size was increased fromnt = 10 to nt = 40–50 individuals (Fig. 1). For sugar beet andrye, a plateau in the Q10 curves was observed. This limit ofrecurrent parent genome recovery is caused by the limited esti-mation accuracy of a given marker density. The wider adjacentmarkers are spaced, the more likely it is that segments of recur-rent parent genome between markers go unnoticed. Sugar beetand rye had fewer and shorter donor fragments in generationBC2, which were still considerably decreased with increasingpopulation size nt (Tables 1–4). For rye, for which the plateau isreached at nt = 120 with a marker density of 20 cM, the averagelength of donor fragments is only 6.59 cM and consequentlyonly about 33% of the distance between two adjacent markers(Table 2). As a consequence, the plateau is reached with smallerpopulation sizes for lower marker densities. Increasing popula-tion size beyond the number of individuals for which the plateauis reached (Fig. 1) is not economic.We conclude that recurrent parent genome recovery is maxi-
mized for all four genetic models with population sizes ofnt � 40–50 individuals per backcross generation. For rye andsugar beet, population sizes should not exceed nt = 50–150 andnt = 70–200 individuals, respectively, depending on marker den-sity. For sunflower and rapeseed, population sizes of nt > 200still have positive effects.
Marker density
It has been estimated for backcross programmes that a targetQ10 value of at least 96% should minimize the risk of undesir-able effects from unadapted donor genome (Prigge et al. 2009).For sugar beet and rye, a Q10 level of about 96% could berecovered in generation BC2 with a marker density of 3M/chrand nt = 40–60 individuals per backcross generation (Fig. 1).For sunflower, the Q10 value of 96% could be reached with amarker density of 2M/chr, indicating that two markers per chro-mosome are sufficient for controlling short chromosomes(Fig. 1). We therefore conclude that for CMS conversion, athreshold Q10 value of 96% in generation BC2 can in mostcases be reached with 2–3 markers per chromosome.The differences in Q10 values between marker densities were
bigger in sugar beet and rye than in sunflower and rapeseed(Fig. 1). For example, for a population size per backcross gener-ation of nt = 100, the differences in Q10 values between a mar-ker density of 3M/chr and 20 cM were 1.7% for sugar beet,2.3% for rye, 0.4% for sunflower and 1.0% for rapeseed. If mar-ker density was increased from 3M/chr to 20 cM, the increase inthe number of markers per chromosome was greater in geneticmodels with longer chromosomes, which partly accounts for thebig gap in Q10 values. Moreover, increasing marker densityshifted the frequency distribution of recurrent parent genome tothe right and decreased the variance of the distribution in all fourgenetic models. The extent of these changes depended on chro-mosome number and length. The differences between markerdensities were bigger for genetic models with a lower number of
Table 5: Optimum designs for recovering Q10 values of 96–99% [mar-ker density, population size, no. of backcross generations, no. of markerdata points (MDP)] in two vs. three backcross generations with genome-wide background selection if the number of MDP is minimized (Notethat the number of required high-throughput assays can be easilyobtained by multiplying nt by the number of backcross generations)
Genetic model Q10 (%) nt Marker density No. of MDP
No. of BC generations = 2Sugar beet 96 40 3M/chr 13059 9 100 cM 97 40 20 cM 2684
98 70 20 cM 460099 120 10 cM 14 172
Rye 96 30 3M/chr 7497 9 100 cM 97 30 20 cM 1541
98 40 20 cM 203099 60 10 cM 5475
Sunflower 96 120 2M/chr 505917 9 80 cM 97 130 20 cM 13 948
98 190 5 cM 68 41199 – – –
Rapeseed 96 170 20 cM 33 47619 9 140 cM 97 – – –
98 – – –99 – – –
No. of BC generations = 3Sugar beet 96 – – –9 9 100 cM 97 10 2M/chr 240
98 10 20 cM 74699 20 20 cM 1421
Rye 96 – – –7 9 100 cM 97 10 2M/chr 181
98 10 20 cM 56399 10 10 cM 1028
Sunflower 96 – – –17 9 80 cM 97 10 2M/chr 485
98 20 3M/chr 139499 30 20 cM 3513
Rapeseed 96 10 2M/chr 55619 9 140 cM 97 20 3M/chr 1618
98 20 20 cM 444899 80 20 cM 16 863
38 E. HERZOG and M. FR I SCH
— 27 —

chromosomes. If chromosome number was comparable, the dif-ferences were bigger for genetic models with longer chromo-somes. For sunflower, 2–3 equally spaced markers perchromosome seemed sufficient to get acceptable genome cover-age for recurrent parent genome recovery. For rapeseed, sugarbeet and rye, at least 6–8 equally spaced markers per chromo-some, corresponding to a marker density of 20 cM, provide anadequate selection response.Given that differences in Q10 values between marker densities
were bigger (Fig. 1) and donor fragments on average shorter(Tables 1–4) in genetic models with shorter genomes, we con-clude that it pays off more to invest in higher marker densitiesfor sugar beet and rye than for sunflower and rapeseed.For all four genetic models, hardly any differences in Q10 val-
ues could be observed between marker densities of 2, 5 and10 cM (Fig. 1). However, marker densities of 5 and 2 cMincurred very high numbers of marker data points (data notshown). This was also observed in a previous simulation study
on gene introgression (Herzog and Frisch 2011). The reason isthat selection response is not limited by precise estimation of thegenetic contribution of the recurrent parent, but by the limitednumber of recombination events that occur in two- or three-gen-eration backcross programmes. We therefore conclude that it isnot efficient to increase effective marker density beyond 10 cM,even though marker maps with higher density are available forSNPs.
Marker fixation
For all four genetic models, the major proportion of marker datapoints was incurred in generations BC1 and BC2. Fromgeneration BC3–BC4, the number of required marker data pointsis only marginally increasing (Tables 1–4). Accordingly, thepopulation sizes at which the plateau of recurrent parent genomerecovery is reached are diminishing in generations BC3 and BC4
due to marker fixation (data not shown). As a consequence, dif-
50 100 150 200
01
23
45 (a)
50 100 150 200
01
23
45
Combined A vs. SM, 2 BC
Cost ratio HT : SM
(b)
50 100 150 200
01
23
45
Combined A vs. HT, 2 BC
Cost ratio HT : SM
(c)
50 100 150 200
01
23
45
HT vs. SM, 2 BC
Cost ratio HT : SM
HT vs. SM, 3 BC
Cost ratio HT : SM
(d)
50 100 150 200
01
23
45
Combined B vs. HT, 3 BC
Cost ratio HT : SM
(e)
50 100 150 200
01
23
45
Combined C vs. HT, 3 BC
Cost ratio HT : SM
(f)
Sugar beet Rye Sunflower Rapeseed
Rel
ativ
e co
stR
elat
ive
cost
Fig. 2: Relative cost of different strategies of marker analysis plotted against the cost ratio of one high-throughput assays to one single-marker assay(Cost ratio HT : SM) for recovering Q10 values of 96% in generation BC2, and Q10 values of 99% in generation BC3 with a marker density of10 cM HT, a strategy using only high-throughput assays in all backcross generations; SM, a strategy using only single-marker assays in all backcrossgenerations; Combined A, a strategy using HT assays in generation BC1 and SM assays in generation BC2; Combined B, a strategy using HT assaysin generation BC1 and SM assays in generations BC2 and BC3; Combined C, a strategy using HT assays in generations BC1 and BC2 and HT assaysin generation BC3. HT, high-throughput; SM, single-marker
Efficient CMS conversion 39
— 28 —

ferences in Q10 values and average length of donor fragmentsbetween the four genetic models disappear in generation BC4.This indicates that recurrent parent genome recovery was nolonger controlled for by markers and resulted in a reduction inselection response.For gene introgression, Prigge et al. (2009) reported that the
optimum backcross designs were characterized by increasingmarker densities and population sizes. Due to the faster rate ofmarker fixation in CMS conversion programmes, we concludethat keeping a constant population size in each backcross genera-tion, or increasing population size in advanced backcross genera-tions, is only efficient for CMS conversion if it is alsoaccompanied by an increase in marker density. Additional mark-ers could be placed between the original markers analysed inprevious generations to increase the precision of selection. Forsugar beet, rye and sunflower, marker densities of 3M/chr ingenerations BC1 and BC2, and 20 cM in advanced backcrossgenerations could decrease the loss of selection response. Forrapeseed, we suggest that CMS conversion programmes couldstart with 20 cM in generations BC1 and BC2, followed by10 cM in advanced backcross generations.
CMS conversion designs for different genetic models
In the present study, Q10 values of 96–98% could be reached ingeneration BC2 for sugar beet and rye with a marker density of20 cM and nt = 30–70 individuals (Table 5). We therefore con-clude that for these crops, two-generation programmes are suit-able for CMS conversion.If Q10 values >96% were aimed for in generation BC2, sun-
flower required nt = 130–190 individuals per backcross genera-tion and marker densities of 20–5 cM. Moreover, a target Q10value of 98% in generation BC2 required about 68 000 markerdata points (Table 5). For rapeseed, a Q10 value of 96% in gen-eration BC2 could only be reached with nt = 170 individuals perbackcross generation, a marker density of 20 cM, and about33 000 marker data points. We conclude that for target Q10 val-ues of 96–99%, three-generation conversion programmes arerequired for the longer genomes of sunflower and rapeseed.With the exception of a Q10 value of 98% for sunflower, all
Q10 levels could be reached with marker densities of 2M/chr–10 cM. Increasing marker density beyond 10 cM incurs highnumbers of marker data points, but will not help to save addi-tional backcross generations (cf. Fig. 1). This confirms that amarker density of 10 cM is sufficient for almost all backcrossdesigns, as has also been previously observed (Herzog and Fris-ch 2011).For all four genetic models, two-generation programmes
required considerably more marker data points than the three-generation programmes (Table 5). We therefore conclude thatthree-generation CMS conversion programmes are also advanta-geous for shorter genomes if the focus of cost reduction is onthe cost of marker analysis.
Relative costs of HT and SM assays
Different strategies of using HT and SM assays for CMS conver-sion with a marker density of 10 cM were compared by calculat-ing their relative costs for cost ratios of HT/SM ranging from200 : 1 to 10 : 1 (Fig. 2). For a Q10 value of 96% in generationBC2, the relative costs of strategy HT compared with strategySM ranged from 0.10 to 2.02 for sunflower (Fig. 2a). In a geneintrogression study on maize with the same parameters, the rela-
tive costs ranged from 0.09 to 1.85 (Herzog and Frisch 2011).These genetic models are comparable with respect to genomelength (1360 vs. 1600 cM) and number of background markers.For a given population size, the number of SM and HT assaysare approximately in the same ratio for gene introgression andCMS conversion in generations BC1 and BC2. It can thereforebe assumed that the relative costs we determined in the presentstudy are to a certain extent also valid for background selectionin gene introgression programmes.For sugar beet and a target Q10 value of 96% in generation
BC2, strategy HT was cheapest up to a cost ratio of HT/SM of35 : 1 (Fig. 2c). From a cost ratio of HT/SM of 35 : 1–100 : 1,strategy Combined A was cheapest (Fig. 2b). For higher costratios of HT/SM, strategy SM was the cheapest option. If thechoice is between either strategy HT or strategy SM, strategyHT should be used up to a cost ratio of HT/SM of 60 : 1(Fig. 2a). For sunflower and rapeseed, strategies involving HTassays became relatively cheaper. We therefore conclude that theuse of HT assays for background selection is cost-efficient fortwo-generation CMS conversion programmes and crops withlong genomes such as sunflower and rapeseed.For three-generation programmes, strategy HT became less
efficient compared with strategy SM, indicated by steeper costcurves (Fig. 2d). For sugar beet and a target Q10 value of 99%in generation BC3, strategy HT was only cheaper than strategySM up to a cost ratio of HT/SM of 45 : 1. This can beexplained by the fact that for sugar beet, 98–99% of marker datapoints are incurred in generations BC1 and BC2 and most mark-ers are already fixed in generation BC3 (Tables 1–4).For three-generation programmes, strategy Combined C was
equivalent to or cheaper than strategy HT for nearly all investi-gated scenarios (Fig. 2f). Combining HT and SM assays in onebackcross programme can pose a challenge as HT and SM plat-forms often require different types of markers. Recently, KASParassays have become available, which allow for inexpensive anal-ysis of small sets of SNPs (Chen et al. 2010). It has been shownthat SNP markers can be inter-converted between KASPar andHT assays (Mammadov et al. 2012). Combinations of HT andSM thus have the potential to make marker-assisted backgroundselection more cost-effective. We conclude that for three-genera-tion CMS conversion programmes, HT assays should be used ingenerations BC1 and BC2, and SM assays in generation BC3 forall investigated genetic models.
Acknowledgements
We thank the anonymous reviewers and the editor for their helpful sug-gestions. We greatly appreciated the comments of one reviewer that con-siderably improved the manuscript. We thank Gregory Mahone forproof-reading the manuscript.
ReferencesChase, C. D., 2007: Cytoplasmic male sterility: a window to the worldof plant mitochondrial-nuclear interactions. Trends Genet. 23, 81—90.
Chen, W., J. Mingus, J. Mammadov, J. E. Backlund, T. Greene, S.Thompson, and S. Kumpatla, 2010: KASPar: a simple and cost-effec-tive system for SNP genotyping. In: Final program, abstract and exhi-bit guide of the XVIII international conference on the status of plantand animal genome research, San Diego, CA, 9–13 Jan 2010.
Dalmacio, R., D. S. Brar, T. Ishii, L. A. Sitch, S. S. Virmani, and G. S.Khush, 1995: Identification and transfer of a new cytoplasmic malesterility source from Oryza perennis into indica rice (O. sativa).Euphytica 82, 221—225.
40 E. HERZOG and M. FR I SCH
— 29 —

Frisch, M., and A. E. Melchinger, 2001: Length of the intact donor chro-mosome segment around a target gene in marker-assisted backcrossing.Genetics 157, 1343—1356.
Gehringer, A., R. Snowdon, T. Spiller, P. Basunanda, and W. Friedt,2007: New oilseed rape (Brassica napus) hybrids with high levels ofheterosis for seed yield under nutrient-poor conditions. Breed. Sci. 57,315—320.
Gupta, P. K., P. Langridge, and R. R. Mir, 2010: Marker-assisted wheatbreeding: present status and future possibilities. Mol. Breeding 26,145—161.
Gustafson, J. P., X. F. Ma, V. Korzun, and J. W. Snape, 2009: A con-sensus map of rye integrating mapping data from five mapping popula-tions. Theor. Appl. Genet. 118, 793—800.
Hagihara, E., N. Itchoda, Y. Habu, S. Iida, T. Mikami, and T. Kubo,2005: Molecular mapping of a fertility restorer gene for Owen cyto-plasmic male sterility in sugar beet. Theor. Appl. Genet. 111, 250—255.
Haldane, J. B. S., 1919: The combination of linkage values and the cal-culation of distance between the loci of linkage factors. J. Genet. 8,299—309.
Hanson, M. R., and S. Bentolila, 2004: Interactions of mitochondrial andnuclear genes that affect male gametophyte development. Plant Cell16, S154—S169.
Herzog, E., and M. Frisch, 2011: Selection strategies for marker-assistedbackcrossing with high-throughput marker systems. Theor. Appl.Genet. 123, 251—260.
Iniguez-Luy, F. L., L. Lukens, M. W. Farnham, R. M. Amasino, and T.C. Osborn, 2009: Development of public immortal mapping popula-tions, molecular markers and linkage maps for rapid cycling Brassicarapa and B. oleracea. Theor. Appl. Genet. 120, 31—43.
Mammadov, J., W. Chen, J. Mingus, S. Thompson, and S. Kumpatla,2012: Development of versatile gene-based SNP assays in maize (Zeamays L.). Mol. Breeding 29, 779—790.
Piquemal, J., E. Cinquin, F. Couton, C. Rondeau, E. Seignoret, I. Dou-cet, D. Perret, M. J. Villeger, P. Vincourt, and P. Blanchard, 2005:Construction of an oilseed rape (Brassica napus L.) genetic map withSSR markers. Theor. Appl. Genet. 111, 1514—1523.
Prigge, V., H. P. Maurer, D. J. Mackill, A. E. Melchinger, and M. Fris-ch, 2008: Comparison of the observed with the simulated distributionsof the parental genome contribution in two marker-assisted backcrossprograms in rice. Theor. Appl. Genet. 116, 739—744.
Prigge, V., A. E. Melchinger, B. S. Dhillon, and M. Frisch, 2009: Effi-ciency gain of marker-assisted backcrossing by sequentially increasingmarker densities over generations. Theor. Appl. Genet. 119, 23—32.
Pring, D. R., and D. M. Lonsdale, 1989: Cytoplasmic male sterility andmaternal inheritance of disease susceptibilty in maize. Annu. Rev.Phytopathol. 27, 483—502.
Tang, S., J. K. Yu, M. B. Slabaugh, D. K. Shintani, and S. J. Knapp,2002: Simple sequence repeat map of the sunflower genome. Theor.Appl. Genet. 105, 1124—1136.
Tomerius, A. M., T. Miedaner, and H. H. Geiger, 2008: A model calcu-lation approach towards the optimization of a standard scheme ofseed-parent line development in hybrid rye breeding. Plant Breeding127, 433—440.
Weber, W. E., D. C. Borchardt, and G. Koch, 1999: Combined linkagemaps and QTLs in sugar beet (Beta vulgaris L.) from different popula-tions. Plant Breeding 118, 193—204.
Efficient CMS conversion 41
— 30 —

Chapter 4
Selection strategies formarker-assisted backgroundselection with chromosome-wiseSSR multiplexes inpseudo-backcross programs forgrapevine breeding1
1Herzog, E, Topfer, R, Hausmann, L, Eibach, R, & Frisch, M. 2013. Selection strategiesfor marker-assisted background selection with chromosomewise SSR multiplexes in pseudo-backcross programs for grapevine breeding. Vitis, 52(4), 193-196.

Vitis 52 (4), 193–196 (2013)
Selection strategies for marker-assisted background selection with chromosome-wise SSR multiplexes in pseudo-backcross programs
for grapevine breeding
E. HERZOG1), R.TÖPFER2), L. HAUSMANN2), R. EIBACH2) and M. FRISCH1)
1) Institute of Agronomy and Plant Breeding II, Justus Liebig University, Giessen, Germany
2) Julius Kühn Institut (JKI), Federal Research Centre for Cultivated Plants, Institute for Grapevine Breeding Geilweilerhof, Siebeldingen, Germany
Correspondence to: Dr. M. FRISCH, Institute of Agronomy and Plant Breeding II, Justus Liebig University, Heinrich-Buff-Ring 26-32, 35392 Giessen, Germany. E-mail: [email protected]
Summary
Organizing SSR markers located on one chromo-some into PCR multiplexes has the potential to reduce the costs of marker analysis. The optimal selection strategies for such chromosome-wise multiplexes have not yet been investigated. We investigated with compu-ter simulations three different selection strategies for gene introgression with a pseudo-backcross scheme and a marker density of one marker every 10 cM. Selecting individuals with the highest number of chromosomes carrying V. vinifera alleles at all background marker loci reduced the number of required multiplexes by 7.24-7.87 % in generations pBC4-pBC6 for population sizes nt = 150-300 individuals per pseudo-backcross generation.
K e y w o r d s : gene introgression, simulation study, multi-plex PCR, microsatellite, marker-assisted selection.
Introduction
American and Asian Vitis species carrying resistance genes against mildew disease have been employed in in-terspecific breeding programs (DI GASPERO and CATTONARO 2010, TÖPFER et al. 2011). Along this line only one example has been described for a systematic development of intro-gression lines as described by the pioneering work of Alain Bouquet (PAUQUET et al. 2001). This work turns out to be very time consuming as well as space and labor demanding. The development of molecular markers for early selection of seedlings with traits of agronomic interest is therefore of particular value (EIBACH et al. 2007). Simple sequence repeats (SSRs) are useful genetic markers, as they are abundant in the genome, highly polymorphic and transfer-able between V. vinifera and related species (SALMASO et al. 2008, VEZZULLI et al. 2008, BLANC et al. 2012). However, they have the disadvantage of low throughput compared to single nucleotide polymorphisms (SNPs), which lim-its their use in large-scale breeding programs. Organizing SSRs into PCR multiplexes considerably reduces the costs of marker analysis (MERDINOGLU et al. 2005). PATOCCHI et al. (2009) suggested that organizing SSR markers locat-ed on one linkage group in one multiplex is applicable and
advantageous. Efficient selection strategies for V. vinifera genome recovery in pseudo-backcross programs for gene introgression with such chromosome-wise multiplexes have not yet been investigated. The objective of our study was to compare with computer simulations different selec-tion strategies for gene introgression with chromosome-wise multiplexes.
Material and Methods
Computer simulations were carried out assuming no interference in crossover formation. Each simulation was run 10,000 times in order to reduce sampling effects and to obtain stable results with small standard error.
The genetic model for grapevine consisted of 19 chro-mosomes (2 x 40 cM, 7 x 60 cM, 5 x 80 cM, 5 x 100 cM). This corresponded to a total genome length of 1400 cM. The marker for the dominant target gene was assumed to be a gene-based marker and was located on a 100 cM chro-mosome at 61 cM from the telomere. Background markers were equidistantly spaced with one marker every 10 cM, the first and last marker of each chromosome being placed on the telomeres.
A pseudo-backcross scheme with changing V. vinifera parents in every generation was investigated up to genera-tion pBC6. The goal was to recover as much V. vinifera genome as possible, irrespective from which of the parents. For chromosome-wise multiplexes it was assumed that one multiplex included genotyping all background marker loci located on one chromosome. This resulted in multiplexes comprising 5 to 11 SSRs. In advanced pseudo-backcross generations only those chromosomes were analyzed which did not yet carry V. vinifera alleles at all background mark-er loci.
The donor was heterozygous for the desired allele at the target locus. The V. vinifera parents could be distin-guished from the donor at all marker loci. Initially, the do-nor and the first V. vinifera parent were crossed to produce nF1 F1 individuals. From this F1 population, one individual that carried the donor allele at the target locus was selected as parent for generation pBC1. This individual was crossed to the second V. vinifera parent to produce n1 pBC1 individ-uals. From this pBC1 population, one best individual was selected with the selection strategies described below (see
— 32 —

194 E. HERZOG et al.
also Fig. 1), and crossed to the next V. vinifera parent. This procedure was repeated for t = 6 pseudo-backcross genera-tions with constant population sizes nF1 = nt
= 50, 100, 150, 200, 250, 300.
For all selection strategies, carriers of the donor allele at the target locus were pre-selected in the first selection step. These individuals were then subjected to one of three genome-wide background selection strategies. For Strat-egy 1, a selection index i = ∑m xm was created, where sum-mation is over background markers and xm is the number of V. vinifera alleles at the mth marker. One individual with the highest value of i was selected in the second selection step and crossed to the next V. vinifera parent of genera-tion pBCt+1. The individual with the highest proportion of V. vinifera alleles at background marker loci was thus se-lected as parent for the next generation pBCt+1.
For Strategy 2, a selection index j = ∑c xc was creat-ed, where summation is over chromosomes and xc = 1 if a chromosome carries V. vinifera alleles at all background marker loci. All individuals with the highest value of j were selected in the second selection step. For these individuals, the value of i was determined as described for Strategy 1 in the third selection step. One individual with the highest value of i was selected and crossed to the next V. vinifera parent of generation pBCt+1. The best individual with the highest number of chromosomes carrying V. vinifera alle-les at all background marker loci was thus selected as par-ent for the next generation pBCt+1.
For Strategy 3, a selection index k = ∑c xc was created, where summation is over chromosomes and xc = length of chromosome c in M if a chromosome carries V. vinifera alleles at all background marker loci. All individuals with the highest value of k were selected in the second selection step. For these individuals, the value of i was determined as described for Strategy 1 in the third selection step. One individual with the highest value of i was selected and crossed to the next V. vinifera parent of generation pBCt+1. The best individual with the highest cumulative length of chromosomes carrying V. vinifera alleles at all background
marker loci was thus selected as parent for the next genera-tion pBCt+1.
To quantify the success of the respective pseudo-back-cross programs, the 10th percentile (Q10), the arithmetic mean (x) and the standard deviation (sx) of the frequency distribution of V. vinifera genome in percentage, the aver-age number of chromosomes carrying V. vinifera alleles at all background marker loci, and the average number and length of donor fragments were determined in every back-cross generation for the selected individuals. In addition, the required number of chromosome-wise multiplexes for the respective pseudo-backcross programs, and the number of individuals ni selected for evaluation with selection in-dex i were determined in every backcross generation.
Results and Discussion
Up to generation pBC3, Strategy 2 required a higher resource input than Strategy 1 for recovering equivalent levels of V. vinifera genome (Fig. 2). Strategy 3 was always inferior to Strategy 2. A Q10 ≥ 98 % required nt = 100 in-dividuals per generation, 1753 multiplexes and three pseu-do-backcross generations with Strategy 1 (Fig. 1). With Strategy 2, a Q10 ≥ 98% required nt = 200 individuals and 3162 multiplexes. With Strategy 3, a Q10 ≥ 98 % required nt = 250 individuals and 3947 multiplexes, or an additional pseudo-backcross generation.
In generations pBC1-pBC3, pre-selection for chromo-somes carrying V. vinifera alleles at all background marker loci considerably reduced the number of individuals ni from which the parent for the next generation was selected (Tab. 1). With Strategy 2 only ni = 1.8, 2.4, 10.5 individuals were evaluated for selection index i. For Strategy 1, ni were all individuals carrying the target gene (Tab. 1). These indi-viduals have on average more, but shorter donor fragments than those selected with Strategy 2, and the probability that an individual with a higher overall proportion of V. vinifera genome is selected is higher than for Strategy 2.
Fig. 1: Strategies and effort required to get Q10 ≥ 98 % of V. vinifera genome in generation pBC3. Number of plants per generation and number of chromosome-wise multiplexes are indicated for each strategy.
— 33 —

Selection strategies for marker-assisted background selection 195
In generations pBC4-pBC6, the differences in V. vini-fera genome between the selection strategies disappeared (Fig. 2 and Tab. 1). For population sizes of nt ≥ 150 indi-viduals per pseudo-backcross generation, the differences in Q10 values were < 0.1% between Strategy 1 and 2 (Fig. 2). Moreover, Strategy 1 then required more chromosome-
wise multiplexes for equivalent levels of V. vinifera ge-nome than Strategy 2 (Tab. 2). For nt = 150-300 individu-als per pseudo-backcross generation, 7.24-7.87 % of multi-plexes were saved in generations pBC4-pBC6 with Strategy 2 compared to Strategy 1 (Tab. 2). In generation pBC4, all non-carrier chromosomes carried V. vinifera alleles at all background marker loci on average, and selection focused on individuals with the shortest donor segment around the target gene for all three strategies (Tab. 1). The number of required multiplexes was then increasing at approximate-ly the same rate for Strategy 1 and Strategy 2. However, Strategy 2 was more efficient than Strategy 1 in selecting for chromosomes which carried V. vinifera alleles at all background marker loci in generations pBC1-pBC3. While for Strategy 2, 9.3, 15.6, and 18.0 chromosomes on aver-age carried V. vinifera alleles at all background marker loci, only 8.1, 14.5, 17.6 chromosomes carried V. vinifera alleles at all background marker loci with Strategy 1. These early savings resulted in an overall saving of chromosome-wise multiplexes in advanced pseudo-backcross generations.
Increasing the number of individuals per pseudo-back-cross generation from nt = 150 to nt = 300 resulted in an ad-ditional V. vinifera genome recovery of 1.2-0.7 % for Strat-egy 1 in generations pBC1-pBC3 (data for pBC1 and pBC2 not shown, for pBC3 see Fig. 2). In contrast, increasing the number of individuals per pseudo-backcross generation beyond nt = 150-200 had little effect on V. vinifera genome recovery in advanced backcross generations for both Strat-egy 1 and Strategy 2 (Tab. 2, see also Fig. 2).
Fig. 2: Tenth percentile Q10 values of V. vinifera genome recov-ered in generations pBC3-pBC5 for Strategies 1, 2, 3 with constant population sizes nt = 50, 100, 150, 200, 250, 300 individuals per pseudo-backcross generation plotted against the required number of chromosome-wise multiplexes.
T a b l e 1
Recovered level of V. vinifera genome (Q10, x, sx) in percentage, required number of chromosome-wise multiplexes (CM), average number of chromosomes carrying V. vinifera alleles at all background marker loci (CCV), number of individuals evaluated for selection index i, number (x, sx) and length (x, sx) of donor fragments (cM) in generations pBC1-pBC6 for Strategies 1, 2, 3 with constant population size nt =
150 individuals per pseudo-backcross generation
Strategy pBCt
V. vinifera genome (%) CM CCV nt
No. donor fragments
Length donor fragments (cM)
Q10 x sx x sx x sx
1 pBC1 82.24 84.59 1.92 1425 8.1 75.0 12.9 2.2 33.55 26.22pBC2 94.90 96.24 1.04 2246 14.5 74.9 5.8 1.8 18.14 17.62pBC3 98.55 99.14 0.43 2585 17.6 75.0 2.2 1.1 10.91 9.71pBC4 99.37 99.64 0.20 2692 18.4 75.0 1.4 0.6 7.05 5.08pBC5 99.54 99.75 0.15 2740 18.7 74.9 1.3 0.5 5.51 3.79pBC6 99.64 99.80 0.13 2761 18.9 74.9 1.2 0.4 4.91 3.26
2 pBC1 79.10 82.75 2.86 1425 9.3 1.8 11.5 1.7 41.96 29.21pBC2 92.89 95.07 1.66 2152 15.6 2.4 4.7 1.5 29.40 26.45pBC3 97.88 98.82 0.69 2407 18.0 10.5 1.8 0.9 18.69 18.39pBC4 99.28 99.60 0.24 2481 18.3 54.9 1.4 0.6 8.25 6.30pBC5 99.52 99.74 0.16 2534 18.7 47.9 1.2 0.5 5.84 4.02pBC6 99.63 99.79 0.13 2558 18.8 61.9 1.2 0.4 5.06 3.34
3 pBC1 78.29 82.19 3.06 1425 9.2 1.1 11.6 1.7 43.04 28.95pBC2 92.02 94.47 1.87 2163 15.5 1.2 4.8 1.5 32.23 27.28pBC3 97.52 98.63 0.80 2428 18.0 8.9 1.8 0.9 20.95 20.68pBC4 99.22 99.57 0.27 2506 18.3 55.3 1.4 0.6 8.67 6.88pBC5 99.51 99.74 0.16 2560 18.6 48.2 1.2 0.5 5.90 4.03pBC6 99.62 99.79 0.13 2586 18.8 61.4 1.2 0.4 5.10 3.35
— 34 —

196 E. HERZOG et al.
We conclude that if SSR markers are analyzed as chro-mosome-wise multiplexes, selecting for individuals with the highest proportion of V. vinifera genome at background marker loci is the most efficient selection strategy for short gene introgression programs of up to three pseudo-back-cross generations. For such short gene introgression pro-grams, population sizes of nt ≥ 300 individuals per pseudo-backcross generation maximize V. vinifera genome recov-ery. For gene introgression programs of four to six pseudo-backcross generations, pre-selecting individuals with the highest number of chromosomes carrying V. vinifera alleles at all background marker loci has the potential to consider-ably reduce the number of required SSR multiplexes. For these longer gene introgression programs, population sizes of nt = 150-200 individuals are sufficient.
Acknowledgements
We thank N. HOFHEINZ for proof-reading the manuscript.
References
BLANC, S.; WIEDEMANN-MERDINOGLU, S.; DUMAS, V.; MESTRE, P.; MER-DINOGLU, D.; 2012: A reference genetic map of Muscadinia rotundi-folia and identification of Ren5, a new major locus for resistance to grapevine powdery mildew. Theor. Appl. Genet. 125, 1663-1675.
DI GASPERO, G.; CATTONARO, F.; 2010: Application of genomics to grape-vine improvement. Aust. J. Grape Wine Res. 16, 122-130.
EIBACH, R.; ZYPRIAN, E.; WELTER, L.; TÖPFER, R.; 2007: The use of molecu-lar markers for pyramiding resistance genes in grapevine breeding. Vitis 46, 120-124.
MERDINOGLU, D.; BUTTERLIN, G.; BEVILACQUA, L.; CHIQUET, V.; ADAM-BLONDON, A. F.; DECROOCQ S.; 2005: Development and characteri-zation of a large set of microsatellite markers in grapevine (Vitis vinifera L.) suitable for multiplex PCR. Mol. Breed. 15, 349-366.
PATOCCHI, A.; FERNÁNDEZ-FERNÁNDEZ, F.; EVANS, K.; GOBBIN, D.; REZZON-ICO, F.; BOUDICHEVSKAIA, A.; DUNEMANN, F.; STANKIEWICZ-KOSYL, M.; MATHIS-JEANNETEAU, F.; DUREL, C. E.; GIANFRANCESCHI, L.; COSTA, F.; TOLLER, C.; COVA, V.; MOTT, D.; KOMJANC, M.; BARBARO, E.; KODDE, L.; RIKKERINK, E.; GESSLER, C.; VAN DE WEG, W. E.; 2009: Develop-ment and test of 21 multiplex PCRs composed of SSRs spanning most of the apple genome. Tree Genet. Genomes 5, 211-223.
PAUQUET, J.; BOUQUET, A.; THIS, P.; ADAM-BLONDON, A. F.; 2001: Es-tablishment of a local map of AFLP markers around the powdery mildew resistance gene Run1 in grapevine and assessment of their usefulness for marker assisted selection. Theor. Appl. Genet. 103, 1201-1210.
SALMASO, M.; MALACARNE, G.; TROGGIO, M.; FAES, G.; STEFANINI, M.; GRANDO, M. S.; VELASCO, R.; 2008: A grapevine (Vitis vinifera L.) genetic map integrating the position of 139 expressed genes. Theor. .Appl. Genet. 116, 1129-1143.
TÖPFER, R.; HAUSMANN, L.; HARST, M.; MAUL, E.; ZYPRIAN, E.; EIBACH, R.; 2011: New horizons for grapevine breeding. In: H. FLACHOWSKY, M. V. HANKE (Eds): Methods in Temperate Fruit Breeding, 79-100. Global Science Books; Fruit, Vegetable and Cereal Science and Bio-technology 5 (Special Issue 1), 79-100.
VEZZULLI, S.; TROGGIO, M.; COPPOLA, G.; JERMAKOW, A.; CARTWRIGHT, D.; ZHARKIKH, A.; STEFANINI, M.; GRANDO, M.S.; VIOLA, R.; ADAM-BLON-DON, A. F.; THOMAS, M.; THIS, P.; VELASCO, R.; 2008: A reference in-tegrated map for cultivated grapevine (Vitis vinifera L.) from three crosses, based on 283 SSR and 501 SNP-based markers. Theor. Appl. Genet. 117, 499-511.
Received February 2, 2013
T a b l e 2
Recovered level of V. vinifera genome (Q10) and percentage of saved chromosome-wise multiplexes (CM (%)) for Strategy 2 compared to Strategy 1 in generations pBC4-pBC6 with
constant population sizes nt = 150, 200, 250, 300
Generationnt = 150 nt = 200 nt = 250 nt = 300
Q10 CM (%) Q10 CM (%) Q10 CM (%) Q10 CM (%)pBC4 99.28 7.84 99.36 7.83 99.40 7.63 99.44 7.87pBC5 99.52 7.52 99.56 7.50 99.61 7.33 99.64 7.52pBC6 99.63 7.35 99.67 7.37 99.68 7.24 99.68 7.47
— 35 —

Chapter 5
Selection strategies for thedevelopment of maizeintrogression populations1
1Herzog, E, Falke, KC, Presterl, T, Scheuermann, D, Ouzunova, M, & Frisch, M. 2014.Selection strategies for the development of maize introgression populations. PLOS ONE,9(3), e92429.

Selection Strategies for the Development of MaizeIntrogression PopulationsEva Herzog1, Karen Christin Falke2, Thomas Presterl3, Daniela Scheuermann3, Milena Ouzunova3,
Matthias Frisch1*
1 Institute of Agronomy and Plant Breeding II, Justus Liebig University, Giessen, Germany, 2 Institute for Evolution and Biodiversity, University of Munster, Munster,
Germany, 3 KWS Saat AG, Einbeck, Germany
Abstract
Introgression libraries are valuable resources for QTL detection and breeding, but their development is costly and time-consuming. Selection strategies for the development of introgression populations with a limited number of individuals andhigh-throughput (HT) marker assays are required. The objectives of our simulation study were to design and compareselection strategies for the development of maize introgression populations of 100 lines with population sizes of 360–720individuals per generation for different DH and S2 crossing schemes. Pre-selection for complete donor chromosomes ordonor chromosome halves reduced the number of simultaneous backcross programs. The investigated crossing andselection schemes differed considerably with respect to their suitability to create introgression populations with clearlyseparated, evenly distributed target donor chromosome segments. DH crossing schemes were superior to S2 crossingschemes, mainly due to complete homozygosity, which greatly reduced the total number of disjunct genome segments inthe introgression populations. The S2 crossing schemes were more flexible with respect to selection and provided economicalternatives to DH crossing schemes. For the DH crossing schemes, increasing population sizes gradually over backcrossgenerations was advantageous as it reduced the total number of required HT assays compared to constant population sizes.For the S2 crossing schemes, large population sizes in the final backcross generation facilitated selection for the targetsegments in the final backcross generation and reduced fixation of large donor chromosome segments. The suggestedcrossing and selection schemes can help to make the genetic diversity of exotic germplasm available for enhancing thegenetic variation of narrow-based breeding populations of crops.
Citation: Herzog E, Falke KC, Presterl T, Scheuermann D, Ouzunova M, et al. (2014) Selection Strategies for the Development of Maize IntrogressionPopulations. PLoS ONE 9(3): e92429. doi:10.1371/journal.pone.0092429
Editor: Lewis Lukens, University of Guelph, Canada
Received October 18, 2013; Accepted February 21, 2014; Published March 19, 2014
Copyright: � 2014 Herzog et al. This is an open-access article distributed under the terms of the Creative Commons Attribution License, which permitsunrestricted use, distribution, and reproduction in any medium, provided the original author and source are credited.
Funding: Funding from the German Federal Ministry of Education and Research (BMBF Grant 0315951) is gratefully acknowledged. [http://www.bmbf.de/en/index.php] The funders had no role in study design, data collection and analysis, decision to publish, or preparation of the manuscript.
Competing Interests: The authors have the following interests: Thomas Presterl, Daniela Scheuermann and Milena Ouzunova are employed by KWS Saat AG.There are no patents, products in development or marketed products to declare related to KWS SAAT AG and the subject matter of the publication. This does notalter the authors’ adherence to all the PLOS ONE policies on sharing data and materials, as detailed online in the guide for authors.
* E-mail: [email protected]
Introduction
Introgression libraries are valuable resources for the identifica-
tion of alleles of agricultural interest in exotic germplasm. They
facilitate the introduction of new genetic variation into elite
breeding germplasm by providing favorable chromosome seg-
ments from wild or exotic species in an adapted genetic
background [1,2]. Ideally, an introgression library consists of a
set of homozygous introgression lines (ILs) which carry short
marker-defined chromosome segments from an exotic donor in a
common genetic background. The concept was first described in
tomato [3]. In the mean time, introgression libraries have been
developed for the model species Arabidopsis thaliana [4,5], and in
many agriculturally important crops, such as rice [6,7], barley
[8,9], wheat [10,11], maize [12,13] and rye [14].
Introgression libraries are usually developed by marker-assisted
backcrossing followed by selfing or production of double haploid
(DH) lines. The backcross process for their development is costly
and labor-intensive if complete coverage of the donor genome by
short evenly distributed target chromosome segments is to be
achieved. Often additional backcross programs have to be run for
the developed ILs in order to close gaps in donor genome
coverage, or to shorten donor chromosome segments by additional
recombination events [3,9]. In spite of the high resource
requirements, only incomplete donor genome coverage has been
achieved for most of the reported introgression libraries [9,14].
In previous simulation studies on introgression libraries, two
generations of selfing were investigated for line development
[15,16]. Recent genetic studies in maize were based on ILs that
underwent two to five generations of selfing [17–19]. The use of
DH technology has to our knowledge not yet been investigated in
simulation studies on the development of introgression libraries.
However, in vivo induction of maternal haploids is currently a
routine method of DH production in commercial maize breeding
programs. The main advantage of the DH technology is that
complete homozygosity can be obtained after only two genera-
tions. Inspite of this time-saving, the production of DH lines is still
considerably more costly than conventional selfing [20]. More-
over, a current drawback of in vivo induction of maternal haploids
in maize is that on average only one viable DH line can be derived
from one backcross individual. It is therefore of economic interest
to compare this method with S2 crossing schemes which require
PLOS ONE | www.plosone.org 1 March 2014 | Volume 9 | Issue 3 | e92429
— 37 —

the same number of generations to evaluate the benefits of DH
lines.
A possible approach to tackle the high costs required for the
development of ideal introgression libraries would be to resort to
introgression populations which are not perfect in appearance, but
carry some additional donor segments outside the actual target
segments. Such introgression populations could be developed with
fewer individuals and marker assays. Complete coverage of the
donor genome is desirable in order to capture the whole wealth of
alleles of agricultural interest in the exotic donor. It is therefore
one component of a minimum standard which introgression
populations should meet. A second component are short, evenly
distributed target donor chromosome segments in a clean adapted
background, as they facilitate the use of the ILs in the following
breeding process.
The design of the crossing scheme and the selection strategy are
the most important factors that influence the distribution of donor
chromosome segments in the introgression population. Falke et al.
[16] suggested for the development of ideal introgression libraries
that a chromosome-based selection strategy which pre-selects
individuals carrying the donor alleles on complete chromosomes in
generation BC1 saves resources. Adapting and advancing this
concept to crossing schemes with small population sizes might be
an efficient approach to develop introgression populations with a
limited number of marker assays.
The objectives of our simulation study were (1) to design
selection strategies and crossing schemes for the development of
maize introgression populations with limited resources, (2) to
compare these selection strategies with respect to the distribution
and length of donor chromosome segments and the required
investments in terms of time, individuals and marker assays, (3) to
give guidelines for the optimal experimental design for construct-
ing introgression populations.
Materials and Methods
SoftwareAll simulations were conducted in R version 3.0.0 [21] with the
software package SelectionTools, which is available from http://
www.uni-giessen.de/population-genetics/downloads.
Genetic ModelA genetic model of maize with 10 equally sized chromosomes of
200 cM length was used for the simulations. Genetic markers for
selection were equally spaced. The distance between two adjacent
marker loci was 1 cM. All markers were polymorphic between
donor and recipient. It was assumed that markers were analyzed
with high-throughput (HT) assays. One HT assay comprised
genotyping one individual at all marker loci in the linkage map.
Recombination was modelled assuming no interference in
crossover formation [22]. Each simulation of an introgression
population of 100 ILs was replicated 1,000 times in order to
reduce sampling effects and to obtain results with high numerical
accuracy and a small standard error.
Crossing SchemesFour crossing schemes were investigated: BC2DH, BC3DH,
BC2S2, BC3S2. Each crossing scheme started with the cross of a
homozygous donor and a homozygous recipient to create one F1
individual. The F1 individual was backcrossed to the recipient to
create a BC1 population of size nBC1. From the BC1 population,
the best individuals with the highest values of selection indices for
the respective selection strategy were selected. Each of the selected
BC1 individuals was backcrossed to the recipient to create BC2
sub-populations of size nBC2. From these BC2 sub-populations, the
best individuals with the highest values of the respective selection
indices were selected. For the DH crossing schemes, in vivo
induction of maternal haploids was assumed with a success rate of
one viable DH line per backcross individual. For the BC2DHschemes, one DH line was thus created from each of the selected
BC2 individuals. For the BC2S2 crossing schemes, the selected
BC2 individuals were selfed to create a fixed number of S1
individuals. Each of the S1 individuals was selfed again and one S2
individual was created. For the BC3 crossing schemes, each of the
selected BC2 individuals was backcrossed to the recipient to create
BC3 sub-populations of size nBC3. From these BC3 sub-popula-
tions, the best individuals with the highest values of the respective
selection indices were selected. The generations S1, S2 or DH of
the BC3 crossing schemes were carried out as described for the
BC2 crossing schemes.
Evaluation of Selection CandidatesThe final introgression populations should consist of 100 ILs
which guarantee an acceptable resolution of QTL detection in
maize, and which can be immediately used in further breeding
steps. Each IL should ideally carry a 20 cM chromosome segment
from the donor to provide a complete and even coverage of the
donor genome without overlap. The 20 cM chromosome
segments are hereafter simply referred to as ‘‘target segments’’.
To determine the selection index for an individual with respect to
a given target segment, we denote with tc the donor genome
proportion of the chromosome on which the target segment is
located, with th the donor genome proportion of the chromosome
half on which the target segment is located and with ts the donor
genome proportion of the target segment itself. The values for the
genetic background bc, bh, bs correspond to tc, th, ts and denote
the recipient genome proportion outside the respective chromo-
some region. Depending on the selection strategy, t and b are used
to define selection indices.
Selection StrategiesWe considered generations g~ BC1,BC2,BC3,DH,S1,S2f g for
selection. Generation DH was the generation in which homozy-
gous diploid DH lines were available for selection. In each
generation g, the genome was divided into selection regions that
could either be 10 complete chromosomes, 20 chromosome halves
or 100 target segments. For selection for complete donor
chromosomes, a fixed number nsel of best individuals for each of
the chromosomes c~1,2,:::,10 with the highest values for selection
index i~tczbc were selected. For selection for donor chromo-
some halves, a fixed number nsel of best individuals for each of the
chromosome halves h~1,2,:::,20 with the highest values for
selection index i~thzbh were selected. For selection for donor
target segments, a fixed number nsel of best individuals for each of
the target segments s~1,2,:::,100 with the highest values for
selection index i~tszbs were selected.
Selection for complete donor chromosomes, donor chromosome
halves and donor target segments were combined to form different
selection strategies. Selection for complete donor chromosomes in
a backcross generation is denoted by a C in the strategy name,
selection for donor chromosome halves is denoted by an H, and
selection for donor target segments is denoted by an S. For
example, for strategy CH, selection for complete donor chromo-
somes was conducted in generation BC1 while selection for donor
chromosome halves was conducted in generation BC2. An
overview of the investigated selection strategies is presented in
Table 1. The investigated combinations of crossing scheme and
selection strategy are listed in the first column of Table 2. For all
Selection Strategies for Introgression Populations
PLOS ONE | www.plosone.org 2 March 2014 | Volume 9 | Issue 3 | e92429
— 38 —

selection strategies, the best 100 ILs for selection index i~tszbs
were selected in generation DH or S2, depending on the crossing
scheme.
Population Sizes and Simulation SeriesWe investigated population sizes of ntot~360{720 individuals
per backcross generation. This should be within a range which can
be realized in practical maize breeding programs. Variations in
population size were investigated to determine both the effect on
preserving the target segments up to line development as well as on
recovering the genotype of the recipient outside the target
segments.
In the first series of simulations, basic crossing schemes were
investigated. Selection was carried out in generation BC1 for basic
crossing schemes with two backcross generations, and in gener-
ations BC1 and BC2 for basic crossing schemes with three
backcross generations. The total population size per generation
was kept constant at ntot~360 individuals in every generation g.
In the second series of simulation, crossing schemes with high
selection intensity were investigated. Population size was doubled
compared to the basic crossing schemes ntot~720ð Þ in every
generation g, while the number of selected individuals was the
same as for the basic crossing schemes. The crossing schemes with
high selection intensity are denoted by BC3{CC0, BC3{HH0
and BC3{CH0 (Table 2). In the first and second series of
simulations, all backcross individuals generated in the final
backcross generation were used for line development for both
DH and S2 crossing schemes. One IL was derived from one
backcross individual.
In the third series of simulations, crossing schemes with selection
in the final backcross generation were investigated. ntot was
doubled to 720 individuals in the final backcross generation
for the DH crossing schemes BC2DH{CC, BC2DH{HH,
BC2DH{CH, BC3DH{CCC, BC3DH{HHH, BC3DH{
CHH. This increase in population size was necessary to enable
selection and to keep ntot at 360 individuals in generation DH. For
the corresponding S2 schemes, ntot was kept at 360 individuals also
in the final backcross generation.
In the fourth series of simulations, crossing schemes with
increasing population sizes were investigated. Selection was
conducted in the final backcross generation. The crossing schemes
with increasing population sizes are denoted by BC3{HHH� and
BC3{HHS�. The details concerning the total population size ntot
and population sizes in the sub-populations ng for all investigated
combinations of crossing scheme and selection strategy are
summarized in Table 2. Schematic representations of the crossing
schemes BC3DH{HHH� and BC3S2{HHS� are given in
Figure 1 and Figure 2 for illustration.
MeasuresTo evaluate and compare introgression populations originating
from different crossing and selection schemes, the following
measures were determined: (a) the genome coverage of the donor
O in percent, which is defined as the proportion of the donor
genome which is covered by the introgression population,
irrespective of whether by the target segments or other donor
segments in the genetic background, (b) the depth of donor
genome coverage T , which is defined as the average number of
ILs in which each donor allele appears in the introgression
population, (c) the number of disjunct genome segments in the
introgression population S, (d) the resolution of the introgression
population R in cM, which is defined as the total genome length of
the genetic model in cM divided by S, (e) the average number of
donor segments per IL N , (f) the average length of donor segments
per IL L in cM, (g) the average total donor genome proportion of
the introgression population Dt in percent, (h) the average donor
genome proportion of the chromosomes carrying the respective
target segments Dc in percent, (i) the average donor genome
proportion of the target segments Ds in percent.
Results
High values for the donor genome coverage O around 99%
were observed for all crossing schemes (Table 3). However, the
resulting introgression populations differed substantially in the
values for the number of disjunct genome segments S, the total
donor genome proportion Dt, the donor genome proportion of the
carrier chromosomes Dc and the donor genome proportion of the
target segments Ds. BC3 crossing schemes resulted in 2–3% lower
values for Dt than BC2 crossing schemes, even if the number of
Table 1. Definition of the selection index i in generations BC1, BC2, BC3, DH, S1, S2 for different selection strategies fordeveloping introgression populations.
Generation
Strategy BC1 BC2 BC3 S1 DH/S2
C tczbc – – – tszbs
H thzbh – – – tszbs
CC tczbc tczbc – – tszbs
HH thzbh thzbh – – tszbs
CH tczbc thzbh – – tszbs
CCC tczbc tczbc tczbc – tszbs
HHH thzbh thzbh thzbh – tszbs
CHH tczbc thzbh thzbh – tszbs
HHS thzbh thzbh tszbs – tszbs
Selection for complete donor chromosomes (C), selection for donor chromosome halves (H) and selection for donor target segments (S) were combined to formdifferent selection strategies (left column). tc , th and ts denote the donor genome proportions of the chromosome on which the target segment is located, of thechromosome half on which the target segment is located and of the target segment itself. bc , bh and bs correspond to tc , th , ts and denote the recipient genomeproportion outside the respective chromosome region.doi:10.1371/journal.pone.0092429.t001
Selection Strategies for Introgression Populations
PLOS ONE | www.plosone.org 3 March 2014 | Volume 9 | Issue 3 | e92429
— 39 —

generations of selection was the same. For example, the basic
crossing scheme BC3DH{CC resulted in a Dt of only 5.0%,
while crossing scheme BC2DH{CC with selection in the final
backcross generation resulted in a Dt of 7.8%. An additional
generation of selection in BC2 schemes only resulted in minor
improvements of Dt of 0.4–1.4% compared to the basic crossing
schemes without selection. For example, scheme BC2DH{CCimproved Dt only by 0.5% compared to scheme BC2DH{C.
The DH crossing schemes had in most cases better values for T ,
Dt, Dc, Ds and especially S than the S2 crossing schemes (Table 3).
Table 2. Subdivision of the total population sizes ntot into sub-population sizes ng in generations g~BC1,BC2,BC3,S1,DH,S2 fordifferent crossing and selection schemes for developing introgression populations.
Generation
Scheme BC1 BC2 BC3 S1 DH/S2
Basic crossing schemes
BC2DH{C 1|1|360 1|10|36 – – 10|36|1
BC2DH{H 1|1|360 1|20|18 – – 20|18|1
BC3DH{CC 1|1|360 1|10|36 10|1|36 – 10|36|1
BC3DH{HH 1|1|360 1|20|18 20|1|18 – 20|18|1
BC3DH{CH 1|1|360 1|10|36 10|2|18 – 20|18|1
Crossing schemes with high selection intensity
BC3DH{CC0 1|1|720 1|10|72 10|1|72 – 10|72|1
BC3DH{HH0 1|1|720 1|20|36 20|1|36 – 20|36|1
BC3DH{CH0 1|1|720 1|10|72 10|2|36 – 20|36|1
Crossing schemes with selection in the final BC generation
BC2DH{CC 1|1|360 1|10|72 – – 10|36|1
BC2DH{HH 1|1|360 1|20|36 – – 20|18|1
BC2DH{CH 1|1|360 1|10|72 – – 10|(2|18)|1
BC3DH{CCC 1|1|360 1|10|36 10|1|72 – 10|36|1
BC3DH{HHH 1|1|360 1|20|18 20|1|36 – 20|18|1
BC3DH{CHH 1|1|360 1|10|36 10|2|36 – 20|18|1
Crossing schemes with increasing population sizes
BC3DH{HHH� 1|1|180 1|20|18 20|1|27 – 20|18|1
BC3DH{HHS� 1|1|180 1|20|18 20|1|30 – 20|(5|3)|1
Basic crossing schemes
BC2S2{C 1|1|360 1|10|36 – 10|36|1 10|36|1
BC2S2{H 1|1|360 1|20|18 – 20|18|1 20|18|1
BC3S2{CC 1|1|360 1|10|36 10|1|36 10|36|1 10|36|1
BC3S2{HH 1|1|360 1|20|18 20|1|18 20|18|1 20|18|1
BC3S2{CH 1|1|360 1|10|36 10|2|18 20|18|1 20|18|1
Crossing schemes with high selection intensity
BC3S2{CC0 1|1|720 1|10|72 10|1|72 10|72|1 10|72|1
BC3S2{HH0 1|1|720 1|20|36 20|1|36 20|36|1 20|36|1
BC3S2{CH0 1|1|720 1|10|72 10|2|36 20|36|1 20|36|1
Crossing schemes with selection in the final BC generation
BC2S2{CC 1|1|360 1|10|36 – 10|1|36 10|36|1
BC2S2{HH 1|1|360 1|20|18 – 20|1|18 20|18|1
BC2S2{CH 1|1|360 1|10|36 – 10|2|18 20|18|1
BC3S2{CCC 1|1|360 1|10|36 10|1|36 10|1|36 10|36|1
BC3S2{HHH 1|1|360 1|20|18 20|1|18 20|1|18 20|18|1
BC3S2{CHH 1|1|360 1|10|36 10|2|18 20|1|18 20|18|1
Crossing schemes with increasing population sizes
BC3S2{HHH� 1|1|180 1|20|18 20|1|27 20|1|18 20|18|1
BC3S2{HHS� 1|1|180 1|20|18 20|1|23 20|5|4 100|1|4
The total population size in generation g is defined as ntot~npop|nsel|ng . npop : number of sub-populations in generation g{1; nsel : number of individuals selectedfrom the sub-populations in generation g{1; ng : population size per sub-population in generation g.
doi:10.1371/journal.pone.0092429.t002
Selection Strategies for Introgression Populations
PLOS ONE | www.plosone.org 4 March 2014 | Volume 9 | Issue 3 | e92429
— 40 —

Selection Strategies for Introgression Populations
PLOS ONE | www.plosone.org 5 March 2014 | Volume 9 | Issue 3 | e92429
— 41 —

Very high values of Sw1000 segments were observed for the basic
crossing schemes BC2S2{C and BC2S2{H. These crossing
schemes had on average N~1 additional donor segment per IL
compared to the corresponding DH crossing schemes. However,
they were also characterized by incomplete homozygosity
(Figure 3B). The S2 crossing schemes with selection in the final
backcross generation required 360 individuals and HT assays less
then the corresponding DH crossing schemes (Tables 2 and 3).
Nevertheless, the differences between DH and S2 crossing schemes
then diminished. For example, scheme BC3S2{HHH resulted in
similar values for most measures as the corresponding scheme
BC3DH{HHH (Table 3).
The differences in the total donor genome proportion Dt
between selection for complete donor chromosomes and selection
for donor chromosome halves ranged only between 0.1–0.7% for
the same number of backcross generations and generations of
selection. However, substantial differences were observed for the
donor genome proportion of the carrier chromosomes Dc and the
donor genome proportion of the target segments Ds. For selection
for complete donor chromosomes, high values for Dc of up to 48%
were observed. They were clearly visible in the graphical
genotypes for schemes BC2S2{CC and BC3DH{CC(Figure 3B and C). For selection for donor chromosome halves,
the values for Dc were much lower and did not exceed 42%
(Table 3). Without selection in the final backcross generation,
selection for donor chromosome halves resulted in substantially
reduced values for Ds. For example, the basic crossing schemes
BC3DH{HH and BC3S2{HH resulted in values for Ds of only
94% and 90%. Moreover, the ranges for Ds for these crossing
schemes were substantially greater (Figure 4 for S2 crossing
schemes, for DH data not shown).
The basic crossing schemes BC3DH{CH and BC3S2{CHwhich combined selection for complete donor chromosomes and
selection for donor chromosome halves resulted in similarly low
values for Ds of 93.7% and 89.9% as selection for donor
chromosome halves only (Table 3). In addition, the combined
strategies CH and CHH resulted in high values for Dc of up to
45.9%. The low values for Ds and the high values for Dc were
reflected in the graphical genotype of scheme BC3DH{CH, e.g.
in ILs 47 and 54 (Figure 3A).
Doubling population sizes ntot from 360 to 720 individuals in
the crossing schemes with high selection intensity reduced the total
donor genome proportion Dt from 5.0–5.1% to 3.6–3.8%
compared to the basic DH crossing schemes, and from 5.3–
5.7% to 4.3–4.4% compared to the basic S2 crossing schemes
(Table 3). The donor genome proportion of the carrier chromo-
somes Dc was reduced by about 4.2–7.5% for the DH crossing
schemes, and by about 0.9–6.9% for the S2 crossing schemes. The
reduction of the donor genome proportion of the target segments
Ds in combination with increased ranges that was observed with
selection for donor chromosome halves in the basic crossing
schemes was not observed in the crossing schemes with high
selection intensity (Table 3 and Figure 4). Ds was increased by
5.2% for crossing scheme BC3DH{HH0 and by 8.6% for
crossing scheme BC3S2{HH0 compared to the basic crossing
schemes BC3DH{HH and BC3S2{HH. However, these
improvements were only achieved with 2160 HT assays compared
to 1080 HT asssays in the basic crossing schemes (Table 3).
The crossing schemes with selection in the final backcross
generation resulted in values for Dt that were 1.1–1.2% higher for
the DH crossing schemes und 0.6–1.4% higher for the S2 crossing
schemes compared to the crossing schemes with high selection
intensity. The ranges of Ds for selection for donor chromosome
halves were about the same size as for the crossing schemes with
high selection intensity (Figure 4). The average values for Ds were
0.5% lower for scheme BC3DH{HHH and 0.3% lower for
scheme BC3S2{HHH (Table 3). The number of required HT
assays was reduced by 360 for the DH crossing schemes and by
720 for S2 crossing schemes compared to the crossing schemes
with high selection intensity. For the crossing schemes with
selection in the final backcross generation, selection for donor
chromosome halves was the most advantageous selection strategy
with respect to the genetic background and to the target segments.
Most notably, the crossing schemes BC3DH{HHH and
BC3S2{HHH resulted in the lowest values for the donor genome
proportion of the carrier chromosomes Dc. Compared to the most
efficient basic crossing schemes BC2DH{C and BC3DH{CC,
the crossing schemes BC2DH{HH and BC3DH{HHH result-
ed in small improvements of both the genetic background and Ds.
However, in both cases 720 additional HT assays had to be
invested. For the S2 crossing schemes with selection in the final
backcross generation, high values of Dc of 38.1–48.3% were
observed. Large donor chromosome segments on the carrier
chromosomes were also visible in the graphical genotypes for
schemes BC2S2{CC and BC3S2{HHH (Figure 3B and D). The
high values for Dc were associated with a considerable reduction of
the number of disjunct genome segments S of w200 segments for
the BC2 crossing schemes and of 100–200 segments for the BC3
crossing schemes compared to the basic S2 crossing schemes
(Table 3).
The crossing schemes with increasing population sizes reduced
the number of required HT assays for DH crossing schemes by
360 in comparison to the crossing schemes with selection in the
final backcross generation and constant population sizes. The
crossing schemes BC3DH{HHH� and BC3DH{HHS� result-
ed in similar values for most measures as the crossing scheme
BC3DH{HHH. However, Dc and Ds were slightly reduced for
crossing scheme BC3DH{HHS�. Compared to the most efficient
basic crossing scheme BC3DH{CC, crossing scheme
BC3DH{HHH� required 360 additional HT assays, but reduced
Dc by 1.9% and increased Ds by 0.6%. The crossing scheme
BC3S2{HHH� resulted with 38.0% in a much higher Dc than
the crossing scheme BC3S2{HHS� with 30.4%. For crossing
scheme BC3S2{HHS�, the average Ds was only 96.2% and the
range for Ds was higher than for the crossing schemes
BC3S2{HHH� and BC3S2{HHH (Figure 4). However, Dt
and Dc were the lowest for all investigated crossing schemes, with
the exception of the crossing schemes with high selection intensity
and ntot~720 (Table 3). The clear-cut separation of the target
segments is also visible in the graphical genotype (Figure 3F).
Figure 1. Schematic representation of crossing scheme BC3DH{HHH�. Crossing scheme BC3DH{HHH� is characterized by increasingpopulation sizes in the backcross generations and selection for donor chromosome halves in the final backcross generation. The parts highlighted ingray represent one branch of the crossing scheme. Sub-populations are indexed by BCg , BCg:c:h and BCg:c:h:s , where g is the respective backcrossgeneration, c is the respective chromosome, h is the respective chromosome half, s is the respective target segment; sBCg:c:h and sBCg:c:h:s denoteindividuals selected for the respective selection regions.doi:10.1371/journal.pone.0092429.g001
Selection Strategies for Introgression Populations
PLOS ONE | www.plosone.org 6 March 2014 | Volume 9 | Issue 3 | e92429
— 42 —

Selection Strategies for Introgression Populations
PLOS ONE | www.plosone.org 7 March 2014 | Volume 9 | Issue 3 | e92429
— 43 —

Discussion
Measures for Characterizing Introgression PopulationsMeasures for the description of introgression populations should
allow to distinguish between introgression populations of different
structure. Complete donor genome coverage O is desirable in
order to make the complete genetic variation of the donor
available for the breeding process. However, high values for O can
also be caused by donor segments outside the target segments
which could not be removed from the genetic background. O is
therefore only informative if interpreted in relation to measures
which reflect the distribution of the donor genome in the
introgression population. A distinctive description of introgression
populations is possible with the total donor genome proportion Dt,
the donor genome proportion on the carrier chromosomes Dc and
the donor genome proportion of the actual target segments Ds.
A high total donor genome proportion Dt is often associated
with a high number of disjunct genome segments S. S determines
the resolution R, which is an important parameter for the accuracy
of QTL detection. However, if S is greater than the number of
ILs, the problem of overparameterization arises with classical
linear model approaches. This issue has only in part been resolved
by using statistical methods which pre-select a reduced number of
ILs for the linear model [23].
High values for the donor genome proportion on the carrier
chromosomes Dc and the depth of donor genome coverage Treflect undesired donor segments attached to the actual target
segments. Such large donor segments which overlap between ILs
have been reported to increase the risk of false-positive effects in
QTL detection and reduce the power of QTL detection [24]. This
is mainly a problem if linkage maps with large distances between
adjacent markers of 10 cM or more are employed, because QTLs
located between the last marker of the target segment and the next
marker outside the target segment are incorrectly assigned to the
target segments. With dense marker maps which are now available
this problem should be overcome. However, large donor segments
also increase the risk of linkage drag in the breeding process and
often require further steps of separation [24].
Low values for the donor genome proportion of the target
segments Ds indicate a loss of target segments and potentially
useful alleles. This is a problem that arises with small population
sizes as were investigated in the present study [16]. Even if the
missing target segments are present in the genetic background of
other ILs, this might impair QTL detection and the further use of
the ILs for the breeding progress.
We therefore argue that short non-overlapping target segments
in a clean recipient background are advantageous also with dense
marker maps. For 20 cM target segments and a genomic model of
10 equally sized chromosomes of 200 cM length, this corresponds
to Dt~1%, Dc~10% and Ds~100% in the ideal case. The effort
and time required for developing introgression populations with
such characteristics is beyond the scope of most breeding
programs. With the limited population sizes and number of HT
assays investigated in this study, these ideal values could not be
achieved with two or three backcross generations (Table 3). We
therefore considered those crossing and selection schemes as
efficient which with a given limited resource input resulted in the
highest coverage of target segments Ds in combination with low
overlap of target segments reflected in Dc and T and a low total
donor genome proportion Dt.
With respect to QTL detection, it can be expected that the
optimal values for the suggested measures will depend on the
statistical method and the genetic architecture of the trait. They
could be determined for a given statistical method by including
QTLs of different number and effect in future simulation studies.
We plan further investigations in this area of research.
Crossing SchemesBC3 crossing schemes had 2–3% lower values for the total
donor genome proportion Dt than BC2 crossing schemes (Table 3),
even if no selection for the genetic background was conducted in
generation BC3. Selection in generation BC2, as was investigated
with the crossing schemes BC2{CC, BC2{HH and BC2{CH,
only resulted in a reduction of Dt of 0.4–1.4% compared to the
basic crossing schemes BC2{C and BC2{H (Table 3). An
explanation for this comparatively small reduction is that the
limiting factor for the reduction of Dt is the number of
recombinations during meiosis. Hence, even though BC2 crossing
schemes have a time advantage, the effect of a third backcross
generation cannot be compensated by investing in additional
marker analyses. We therefore conclude that BC3 crossing
schemes result in introgression populations with an improved
structure, and that the time investment in the additional backcross
generation is worthwhile.
DH crossing schemes were for most measures superior to the
corresponding S2 crossing schemes. The differences were most
pronounced in the number of disjunct genome segments S. Even
though the S2 schemes on average had a slightly higher number of
donor segments per IL N, it seems that the very high values for Sthat were observed especially in the BC2{S2 crossing schemes
mainly had to be attributed to incomplete homozygosity
(Figure 3B). It can be expected that introgression populations
with Sw1000 segments in 100 ILs (Table 3) are not suitable for
effective QTL detection. We therefore conclude that the DH
method is essential for short crossing schemes with only two
backcross generations.
A drawback of the DH method is that with current protocols of
in vivo DH induction of maternal haploids, only a very limited
number of viable DH lines can be derived from one backcross
individual. We expect that our assumption of one DH line per
backcross individual is a conservative, but realistic estimate. In
contrast, with selfing, many progenies can be derived from one
selected backcross individual. In the S2 crossing schemes, it is
consequently comparatively cheap and easy to conduct selection in
the final backcross generation. For the DH schemes, selection in
the final backcross generation could only be conducted if
population size in this generation was higher than the desired
number of final DH lines. As a result, the S2 crossing schemes with
selection in the final backcross generation required 360 HT assays
less than the corresponding DH schemes (Table 3). Moreover, the
selected fractions of best backcross individuals were much greater
for the DH than for the S2 crossing schemes (Table 2). This
resulted in a lower selection intensity for both the selection region
of the final backcross generation and the genetic background in
Figure 2. Schematic representation of crossing scheme BC3S2{HHS�. Crossing scheme BC3S2{HHS� is characterized by increasingpopulation sizes in the backcross generations and selection for target segments in the final backcross generation. The parts highlighted in grayrepresent one branch of the crossing scheme. Sub-populations are indexed by BCg , BCg:c:h and BCg:c:h:s, where g is the respective backcrossgeneration, c is the respective chromosome, h is the respective chromosome half, s is the respective target segment; sBCg:c:h and sBCg:c:h:s denoteindividuals selected for the respective selection regions.doi:10.1371/journal.pone.0092429.g002
Selection Strategies for Introgression Populations
PLOS ONE | www.plosone.org 8 March 2014 | Volume 9 | Issue 3 | e92429
— 44 —

the DH crossing schemes. We therefore suggest that a comparison
of DH and S2 crossing schemes should take the distinctive features
of both methods into account. The evaluation of efficiency should
also be based on the number of required HT assays. Considering
this, S2 crossing schemes which exploit their selection advantages
represent economic and easy-to-handle alternatives to DH
crossing schemes.
Selection Strategies for Small and Constant PopulationSizes
For a given genetic model and crossing scheme, the selection
strategy is the most important factor that influences the structure
of the resulting introgression population. In the following
paragraphs, different aspects such as the length of the selection
Table 3. Measures evaluated for introgression populations resulting from different crossing and selection schemes.
Scheme O T S R N L Dt Dc Ds HT
Basic crossing schemes
BC2DH{C 99.9 8.3 691 2.9 6.2 28.7 8.3 38.9 98.7 720
BC2DH{H 100.0 8.9 751 2.7 6.4 29.2 8.9 37.3 94.1 720
BC3DH{CC 99.2 5.1 457 4.4 3.8 29.8 5.0 35.2 97.8 1080
BC3DH{HH 99.8 5.2 487 4.1 3.9 29.8 5.1 33.3 94.2 1080
BC3DH{CH 99.6 5.2 469 4.3 3.8 30.5 5.1 35.1 93.7 1080
Crossing schemes with high selection intensity
BC3DH{CC0 99.3 3.6 389 5.1 3.0 27.8 3.6 27.7 98.8 2160
BC3DH{HH0 99.9 3.8 406 4.9 3.0 29.7 3.8 29.1 99.4 2160
BC3DH{CH0 99.6 3.9 399 5.0 3.0 30.0 3.8 29.9 99.0 2160
Crossing schemes with selection in the final BC generation
BC2DH{CC 99.9 7.8 676 3.0 5.9 28.7 7.8 41.0 98.9 1440
BC2DH{HH 100.0 8.1 716 2.8 6.0 29.0 8.1 38.9 99.3 1440
BC2DH{CH 99.9 8.5 679 2.9 6.0 30.4 8.5 43.7 98.8 1440
BC3DH{CCC 99.1 4.9 457 4.4 3.7 30.2 4.8 35.8 98.0 1800
BC3DH{HHH 99.9 4.8 464 4.3 3.6 31.0 4.7 33.9 98.9 1800
BC3DH{CHH 99.6 4.8 450 4.4 3.5 31.4 4.7 35.0 98.5 1800
Crossing schemes with increasing population sizes
BC3DH{HHH� 99.9 5.0 492 4.1 3.8 29.7 5.0 33.3 98.4 1440
BC3DH{HHS� 99.8 4.9 484 4.1 3.8 29.4 4.8 32.5 97.5 1440
Basic crossing schemes
BC2S2{C 100.0 11.4 1021 2.0 7.3 26.4 9.3 41.4 97.6 720
BC2S2{H 100.0 11.4 1073 1.9 7.4 25.9 9.3 36.3 90.4 720
BC3S2{CC 99.3 6.9 684 2.9 4.5 27.7 5.7 39.2 97.0 1080
BC3S2{HH 99.9 6.3 702 2.8 4.4 26.3 5.3 33.0 90.3 1080
BC3S2{CH 99.7 6.4 681 2.9 4.3 26.9 5.3 35.0 89.9 1080
Crossing schemes with high selection intensity
BC3S2{CC0 99.5 5.1 585 3.4 3.6 26.6 4.3 32.3 98.8 2160
BC3S2{HH0 99.9 5.1 591 3.4 3.5 27.8 4.4 32.1 98.9 2160
BC3S2{CH0 99.7 5.2 581 3.4 3.5 28.2 4.4 33.4 98.4 2160
Crossing schemes with selection in the final BC generation
BC2S2{CC 99.3 10.5 795 2.5 6.5 27.2 8.3 48.3 98.0 1080
BC2S2{HH 99.9 9.7 785 2.5 6.2 27.0 7.9 42.8 98.8 1080
BC2S2{CH 99.8 9.7 761 2.6 6.1 27.6 7.9 45.9 98.4 1080
BC3S2{CCC 98.3 7.1 588 3.4 4.2 30.5 5.7 44.6 97.5 1440
BC3S2{HHH 99.7 5.9 510 3.9 3.7 31.0 5.0 38.1 98.6 1440
BC3S2{CHH 99.3 6.0 509 3.9 3.7 31.3 5.0 39.5 98.2 1440
Crossing schemes with increasing population sizes
BC3S2{HHH� 99.7 5.8 508 3.9 3.8 30.7 4.9 38.0 98.7 1440
BC3S2{HHS� 99.8 5.1 596 3.4 3.7 26.1 4.3 30.4 96.2 1400
O: donor genome coverage in percent; T : depth of donor genome coverage; S: number of disjunct genome segments; R: resolution; N : number of donor segments perIL; L: length of donor segments per IL in cM; Dt : total donor genome proportion in percent; Dc : donor genome proportion of carrier chromosomes in percent; Ds : donorgenome proportion of target segments in percent; HT: the required number of HT assays. Measures are arithmetic means over 1,000 replications.doi:10.1371/journal.pone.0092429.t003
Selection Strategies for Introgression Populations
PLOS ONE | www.plosone.org 9 March 2014 | Volume 9 | Issue 3 | e92429
— 45 —

Selection Strategies for Introgression Populations
PLOS ONE | www.plosone.org 10 March 2014 | Volume 9 | Issue 3 | e92429
— 46 —

regions, the number of generations of selection and the required
population sizes for effective selection are discussed.
Selection strategies which pre-select individuals carrying com-
plete donor chromosomes reduce the number of simultaneous
backcross programs to the number of chromosomes [16]. They are
therefore suitable for breeding programs with limited resources.
However, for long chromosomes of 200 cM length, selection for
complete donor chromosomes preserved large donor chromosome
segments on the carrier chromosomes up to line development
(Figure 3C and B). This was reflected in high values for the
proportion of donor genome on the carrier chromosomes Dc of up
to 48% (Table 3). The selection regions for selection in the
backcross generations were therefore reduced to donor chromo-
some halves for selection strategies H, HH and HHH. In all four
series of simulations, selection for donor chromosome halves
resulted in the desired reduction of Dc compared to selection for
complete donor chromosomes (Table 3). Other measures for the
genetic background were approximately equivalent. We therefore
conclude that for crop species with long chromosomes such as
maize, wheat or rapeseed, selection for donor chromosome halves
reduces the length of the donor segments attached to the actual
target segments and the risk of linkage drag.
However, for crossing schemes without selection in the final
backcross generation and constant population sizes of ntot~360individuals, selection for donor chromosome halves resulted in a
considerable reduction of the donor genome proportion of the
target segments Ds of up to 7%. Moreover, the estimated values
for Ds were less reliable for these crossing schemes, e.g., in schemes
BC2S2{H and BC3S2{HH (Figure 4). These findings have to be
attributed to the small population sizes ng in the sub-populations
and the structure of the selection index i. In generation DH or S2,
population sizes were reduced to ng~18 individuals with selection
for donor chromosome halves (Table 2). Without selection in the
final backcross generation, around 50% of the ILs developed from
the backcross individuals are expected to carry no donor allele at a
given locus within the respective target segment. The probability
to find five ILs with complete donor target segments for the
introgression population was therefore even further reduced. As
the selection index i~tszbs weighed the target segments and the
genetic background equally, a clean genetic background some-
times outweighed a reduced Ds and led to the observed loss of
target segments in these small sub-populations. We therefore
conclude that a sufficiently large population size is the crucial
Figure 3. Graphical genotypes of introgression populations resulting from six different crossing schemes. A: BC3DH{CH; B:BC2S2{CC; C: BC3DH{CC; D: BC3S2{HHH; E: BC3DH{HHH� ; F: BC3S2{HHS� . The graphical genotypes display the chromosomes 3 to 7 ofILs 41–70 and are examples from one simulation run. Chromosome segments which stem from the donor are displayed in blue, whereaschromosome segments which stem from the recipient are displayed in yellow. The graphical genotypes illustrate the differences between thealternative crossing schemes with respect to their suitability to create introgression populations with complete donor genome coverage and clearlyseparated, evenly distributed target donor chromosome segments.doi:10.1371/journal.pone.0092429.g003
Figure 4. Donor genome proportion of target segments Ds for all investigated S2 crossing schemes. The boxplots represent thedistribution over 1,000 replications of the simulations. The basic crossing schemes BC2S2{H, BC3S2{HH and BC3S2{CH which select for donorchromosome halves are characterized by higher ranges for Ds.doi:10.1371/journal.pone.0092429.g004
Selection Strategies for Introgression Populations
PLOS ONE | www.plosone.org 11 March 2014 | Volume 9 | Issue 3 | e92429
— 47 —

factor for the successful application of selection for donor
chromosome halves.
A loss of target segments caused by small population sizes was
also observed for the basic combined selection strategy CH which
selected for complete donor chromosomes in generation BC1 and
for donor chromosome halves in generation BC2. In addition, the
combined strategies CH and CHH resulted in high values for the
donor genome proportion on the carrier chromosomes Dc of up to
45% (Table 3). This can be explained by the efficient selection for
complete donor chromosomes from the comparatively large BC1
population of ng~ntot~360 individuals (Table 2). The pre-
selected complete donor chromosomes are in large part preserved
up to line development. The combination of missing target
segments with large donor chromosome segments on carrier
chromosomes was also reflected in the graphical genotype for
scheme BC3DH{CH, e.g., in IL 47 and 54 (Figure 3A). The
selection strategies CH and CHH therefore combine the
drawbacks of both selection for complete donor chromosomes
and selection for chromosome halves. They are not suitable for
crossing schemes with small and constant population sizes, in
which the population sizes ng in the sub-populations are
subsequently reduced over the backcross generations. We
conclude that for for small breeding programs with a constant
population size of ntot~360 and a limited number of HT assays
for selection, selection strategies which only select for complete
donor chromosomes in the backcross generations should be
employed in both DH and S2 crossing schemes to avoid the loss of
target segments.
Finding more Carriers of Donor Target Segments for LineDevelopment
To employ selection for donor chromosome halves effectively
for reducing the donor genome proportion of the carrier
chromosomes Dc without losing the target segments, it is necessary
to increase the frequency of carriers of donor target segments for
line development. Using larger population sizes is a straightfor-
ward solution for this problem, which in addition can improve the
overall structure of introgression populations. The crossing
schemes with high selection intensity and double population sizes
of ntot~720 individuals resulted in small improvements of the
total donor genome proportion Dt of about 1–1.5% compared to
the basic crossing schemes (Table 3). The desired increase in the
donor proportion of the target segments Ds was achieved. For
selection for donor chromosome halves, Ds was increased by 5.2–
8.6%. Selection for donor chromosome halves was then even
superior to selection for complete donor chromosomes. Moreover,
the donor genome proportion on the carrier chromosomes Dc was
reduced by up to 7.5%, indicating an improved separation of
target segments. The observed improvements were greater for the
DH than for the S2 crossing schemes. Nevertheless, the
comparatively small improvements of the introgression popula-
tions required 1080 additional HT assays. We therefore conclude
that such large population sizes are only suitable for breeding
programs with access to DH technology, less stringent resource
restrictions and high requirements with respect to the genetic
background. If the requirements concerning the structure of the
introgression population are not that high, it might be more
economic to increase population size only in the final backcross
generation and/or to invest in additional HT assays only in this
generation.
For crossing schemes with selection in the final backcross
generation, the total donor genome proportion Dt was similar to
the values of the basic crossing schemes, and about 1% higher
than for the crossing schemes with higher selection intensity
(Table 3). However, the average values for the donor genome
proportion of the target segments Ds were similar to the crossing
schemes with higher selection intensity (Table 3) and the ranges
were effectively reduced (Figure 4). Moreover, the number of
required HT assays was reduced by 360 for the DH crossing
schemes and by 720 for S2 crossing schemes compared to the
crossing schemes with higher selection intensity (Table 3). The
decision for doubling population sizes requires the same resources
as would be required for generating an additional introgression
population. This large effort seems not to be justified by the
relatively small improvements compared to the basic crossing
schemes. We therefore conclude that selection in the final
backcross generation is the more efficient solution for both DH
and S2 crossing schemes.
Selection for donor chromosome halves was the best strategy
with selection in the final backcross generation for both DH and
S2 crossing schemes (Table 3). However, for the DH schemes, only
small improvements for schemes BC2DH{HH and
BC3DH{HHH were observed compared to the most efficient
basic crossing schemes BC2DH{C and BC3DH{CC (Table 3).
For these small improvements, 720 additional individuals and HT
assays had to be invested. For the S2 schemes, considerable
reductions in S of 174 and 236 segments were observed for
schemes BC2S2{HH and BC3S2{HHH with selection in the
final backcross generation compared to the basic crossing schemes
BC2S2{C and BC2S2{CC. Dt was only slightly reduced.
However, the donor genome proportion on carrier chromosomes
Dc was in general very high for the crossing schemes with selection
in the final backcross generation with 38–48%. This indicates a
fixation of the selection regions of the final backcross generation
(Figure 3B and D). In schemes BC2S2{CC and BC3S2{HH,
complete donor chromosomes and donor chromosome halves still
appear as blocks around the target segments. These blocks lead to
an overlap of donor segments between ILs that reduces the
effective resolution of the introgression population for QTL
detection. The overlap also hampers the further use of the ILs in
the breeding process, as further steps of separation of the target
segments by backcrossing are required. We therefore conclude
that the crossing schemes with selection in the final backcross
generation have the potential to improve the resulting introgres-
sion populations at moderate cost. However, for the DH crossing
schemes, the number of required HT assays and individuals has to
be reduced. For the S2 crossing schemes, the fixation of large
donor chromosome segments has to be avoided. Optimizations of
the respective crossing schemes are presented in the following.
Increasing Population Sizes Over Backcross GenerationsWith constant population sizes of ntot~360 individuals, the
population size in generation BC1 was large in relation to the
genetic gains that could be achieved by selecting a comparatively
small fraction of 10 or 20 individuals (Table 2). Starting with
smaller population sizes in generation BC1 and gradually
increasing population sizes in the following backcross generations
was therefore an efficient option to reduce the overall number of
required individuals and HT assays for selection in the final
backcross generation. Larger population sizes in generation BC3
also enabled selection for target segments, which was investigated
as an option to avoid the fixation of large donor chromosome
segments especially for the S2 crossing schemes.
The schemes BC3DH{HHH� and BC3DH{HHS� resulted
in similar values for all measures (Table 3). However, Dc and Ds
were slightly lower for scheme BC3DH{HHS�. We therefore
conclude that selection for target segments already in the final
backcross generation is not efficient for DH crossing schemes. In
Selection Strategies for Introgression Populations
PLOS ONE | www.plosone.org 12 March 2014 | Volume 9 | Issue 3 | e92429
— 48 —

comparison to the best but also very expensive scheme
BC3DH{HHH with selection in the final backcross generation,
scheme BC3DH{HHH� can be considered equivalent, but
required 360 individuals and HT assays less. In comparison to the
more economic basic crossing scheme BC3DH{CC, scheme
BC3DH{HHH� improved Dc and Ds and thus the separation of
target segments. This is also visible in the graphical genotype
(Figure 3). The investment in the additional 360 HT assays seems
therefore worthwhile (Table 3).
The scheme BC3S2{HHS� resulted in better values than the
schemes BC3S2{HHH and BC3S2{HHH�. Most notably, it
resulted in a much lower Dc of 30% compared to 38%. Scheme
BC3S2{HHS� resulted in a Ds that was 2.4% lower compared to
schemes BC3S2{HHH and BC3S2{HHH� and the ranges for
Ds were higher (Figure 4). Nevertheless, it resulted in the lowest
values of Dt and Dc and the best separation of target genes of all
investigated DH and S2 crossing schemes with comparable
population sizes. The comparatively high value of S of 596
segments in combination with reduced values for Dt can in this
case be explained by a greatly improved separation of target
segments compared to the other S2 schemes with selection in the
final backcross generation. The improved separation of target
segments is also visible in the graphical genotype (Figure 3F). This
was achieved with 40 HT assays less (Table 3). We therefore
expect that scheme BC3S2{HHS� will result in an improved
power of QTL detection, and recommend selection for target
segments in the final backcross generation for S2 crossing schemes.
Compared to the best but expensive comparable DH crossing
scheme BC3DH{HHH, the S2 crossing scheme BC3S2{HHS�
resulted in similar values and required 400 HT assays less. Overall,
we conclude that increasing population sizes over backcross are
advantageous and economic for both DH and S2 crossing
schemes. Moreover, crossing scheme BC3S2{HHS� can provide
a cheap alternative to comparable DH crossing schemes.
ConclusionsOur study has shown that introgression populations with
complete coverage of the donor genome and reasonably clean
recipient background can be developed with a limited number of
backcross individuals and HT assays. It has provided further
insight on how different crossing and selection schemes influence
the structure of the resulting introgression populations. The
guidelines which have been derived for maize are transferable to
other crop species with similar number and length of chromo-
somes. For crops with different genome size, some considerations
are discussed in the following.
Rapeseed is a crop with a large genome of 19 chromosomes, for
which efficient protocols of microspore culture are available for
DH production. For the large genome of rapeseed, it can be
expected that the values for the total donor genome proportion Dt
will be lower than those observed for the smaller genome of maize.
With the investigated selection index i, the selection pressure on
the carrier chromosomes will be reduced with increasing genome
size and number of chromosomes. It might therefore be an
interesting option for rapeseed to put more weight on the
background markers on the carrier chromosomes to achieve an
efficient reduction of Dc. As with microspore culture many DH
lines can usually be derived from one backcross individual, the
advantages of DH production should be more pronounced than
for maize. However, the optimal selection strategies for DH
crossing schemes in rapeseed should then be similar to those for
selfing in maize.
Sugar beet is a crop with a small genome of 9 chromosomes, for
which the guidelines for selfing should be most relevant. In smaller
genomes, equivalent values of Dt can usually be reached with
smaller population sizes and with fewer backcrosses. However, the
average length of the chromosomes in cM is also much shorter
than in maize. This implies that fewer crossovers occur per
meiosis, and that it might require more individuals and backcross
generations to effectively separate the target segments. The
combined effects of genome size and chromosome length will also
depend on the desired number and length of the target segments.
Simulations can considerably facilitate the planning process for
the development of introgression populations in different crop
species. The derived guidelines can help breeders and geneticists
to enhance the genetic variation of narrow based breeding
populations of crops.
Author Contributions
Conceived and designed the experiments: EH KCF TP DS MO MF.
Performed the experiments: EH KCF. Analyzed the data: EH. Wrote the
paper: EH MF.
References
1. Zamir D (2001) Improving plant breeding with exotic genetic libraries. Nat Rev
Genet 2: 983–989.
2. McCouch S (2004) Diversifying selection in plant breeding. PLoS Biol 2: e347.
3. Eshed Y, Zamir D (1994) A genomic library of Lycopersicon pennellii in L. esculentum:
a tool for fine mapping of genes. Euphytica 79: 175–179.
4. Keurentjes JJ, Bentsink L, Alonso-Blanco C, Hanhart CJ, Blankestijn-De Vries
H, et al. (2007) Development of a near-isogenic line population of Arabidopsis
thaliana and comparison of mapping power with a recombinant inbred line
population. Genetics 175: 891–905.
5. Torjek O, Meyer RC, Zehnsdorf M, Teltow M, Strompen G, et al. (2008)
Construction and analysis of 2 reciprocal Arabidopsis introgression line
populations. J Hered 99: 396–406.
6. Lin S, Sasaki T, Yano M (1998) Mapping quantitative trait loci controlling seed
dormancy and heading date in rice, Oryza sativa L., using backcross inbred lines.
Theor Appl Genet 96: 997–1003.
7. Cheema KK, Bains NS, Mangat GS, Das A, Vikal Y, et al. (2008) Development
of high yielding IR646 Oryza rufipogon (Griff.) introgression lines and
identification of introgressed alien chromosome segments using SSR markers.
Euphytica 160: 401–409.
8. Matus I, Corey A, Filichkin T, Hayes P, Vales M, et al. (2003) Development and
characterization of recombinant chromosome substitution lines (RCSLs) using
Hordeum vulgare subsp. spontaneum as a source of donor alleles in a Hordeum vulgare
subsp. vulgare background. Genome 46: 1010–1023.
9. Schmalenbach I, Korber N, Pillen K (2008) Selecting a set of wild barley
introgression lines and verification of QTL effects for resistance to powdery
mildew and leaf rust. Theor Appl Genet 117: 1093–1106.
10. Liu S, Zhou R, Dong Y, Li P, Jia J (2006) Development, utilization of
introgression lines using a synthetic wheat as donor. Theor Appl Genet 112:
1360–1373.
11. Pumphrey MO, Bernardo R, Anderson JA (2007) Validating the Fhb1 QTL for
Fusarium head blight resistance in near-isogenic wheat lines developed from
breeding populations. Crop Sci 47: 200–206.
12. Ribaut JM, Ragot M (2007) Marker-assisted selection to improve drought
adaptation in maize: the backcross approach, perspectives, limitations, and
alternatives. J Exper Bot 58: 351–360.
13. Szalma S, Hostert B, LeDeaux J, Stuber C, Holland J (2007) QTL mapping with
near-isogenic lines in maize. Theor Appl Genet 114: 1211–1228.
14. Falke K, Susic Z, Hackauf B, Korzun V, Schondelmaier J, et al. (2008)
Establishment of introgression libraries in hybrid rye (Secale cereale L.) from an
Iranian primitive accession as a new tool for rye breeding and genomics. Theor
Appl Genet 117: 641–652.
15. Syed N, Pooni H, Mei M, Chen Z, Kearsey M (2004) Optimising the
construction of a substitution library in Arabidopsis thaliana using computer
simulations. Mol Breeding 13: 59–68.
16. Falke KC, Miedaner T, Frisch M (2009) Selection strategies for the development
of rye introgression libraries. Theor Appl Genet 119: 595–603.
17. Welcker C, Sadok W, Dignat G, Renault M, Salvi S, et al. (2011) A common
genetic determinism for sensitivities to soil water deficit and evaporative
Selection Strategies for Introgression Populations
PLOS ONE | www.plosone.org 13 March 2014 | Volume 9 | Issue 3 | e92429
— 49 —

demand: meta-analysis of quantitative trait loci and introgression lines of maize.
Plant Physiol 157: 718–729.18. Belcher AR, Zwonitzer JC, Santa Cruz J, Krakowsky MD, Chung CL, et al.
(2012) Analysis of quantitative disease resistance to southern leaf blight and of
multiple disease resistance in maize, using near-isogenic lines. Theor Appl Genet124: 433–445.
19. Mano Y, Omori F (2013) Flooding tolerance in interspecific introgression linescontaining chromosome segments from teosinte (Zea nicaraguensis) in maize (Zea
mays subsp. mays). Ann Bot-London 112: 1125–1139.
20. Lubberstedt T, Frei UK (2012) Application of doubled haploids for target genefixation in backcross programmes of maize. Plant Breeding 131: 449–452.
21. R Core Team (2013) R: A Language and Environment for Statistical
Computing. R Foundation for Statistical Computing, Vienna, Austria. URL
http://www.R-project.org/.
22. Stam P (1979) Interference in genetic crossing over and chromosome mapping.
Genetics 92: 573–594.
23. Mahone GS, Borchardt D, Presterl T, Frisch M (2012) A comparison of tests for
QTL mapping with introgression libraries containing overlapping and
nonoverlapping donor segments. Crop Sci 52: 2198–2205.
24. Falke K, Frisch M (2011) Power and false-positive rate in QTL detection with
near-isogenic line libraries. Heredity 106: 576–584.
Selection Strategies for Introgression Populations
PLOS ONE | www.plosone.org 14 March 2014 | Volume 9 | Issue 3 | e92429
— 50 —

Chapter 6
General discussion
Relative cost-efficiency of HT and SM assays
Without DNA markers, a backcross program for the introgression of one
target gene was usually completed after six backcross generations (Allard,
1960). Simulations have shown that background selection with DNA mark-
ers can save up to four backcross generations, but at the cost of thousands
of marker data points which could not have been managed with SM assays
(Frisch et al., 1999a). For the introgression of one dominant target gene in
maize, I estimated that approximately 16,000 marker data points are required
to recover 96% of recipient genome in two backcross generations (Herzog &
Frisch, 2011). In a CMS conversion program in rapeseed, 33,000 marker data
points would have been required to recover 96% of recipient genome in two
backcross generations (Herzog & Frisch, 2013). With SNP chips, both appli-
cations of MABC would have required about 150 HT assays per backcross
generation. It can therefore be expected that with the emergence of HT as-
says many applications of MABC which previously were not economic have
now come into reach. Most notably, it is now possible to exploit the time-
saving potential of background selection for fast and complete restoration of
the recipient genotype. The focus of the four studies presented in this thesis
was therefore on short backcross programs with only two or three backcross
generations.

General discussion
Using HT assays for background selection was cheaper than using SM
assays for a wide range of cost ratios of one HT assay compared to one SM
assay (HT:SM), both for gene introgression (Herzog & Frisch, 2011) and
CMS conversion of seed parent lines (Herzog & Frisch, 2013). The relative
costs of using HT assays instead of SM assays were comparable for both
applications for genomes of comparable size. HT assays reduced the cost of
marker analysis by 10-55% for cost ratios of HT:SM of 50:1-100:1 and marker
densities of one marker every 10 cM (Herzog & Frisch, 2011; Herzog & Frisch,
2013). SM assays were only cheaper than HT assays for high cost ratios of
HT:SM of 100:1-200:1 in combination with low marker densities, and in crops
with small genomes such as rye.
The relative costs of HT assays were lowest in short two-generation back-
cross programs with high marker densities of one marker every 5 cM, which
aimed at the recovery of high levels of recipient genome. For these scenar-
ios, SM assays were always more expensive. For example, using HT assays
for recovering 98% of recipient genome in a two-generation CMS conversion
program in sunflower reduced the cost of marker analysis by 44-94% for cost
ratios of 100:1-10:1 (Herzog & Frisch, 2013). In three-generation backcross
programs, the relative cost-efficiency of HT assays decreased compared to
two-generation programs (Herzog & Frisch, 2011). This has to be attributed
to increasing marker fixation in advanced backcross generations. The ef-
fects of marker fixation for the optimum breeding designs in MABC will be
discussed in detail in the following chapters.
HT assays have the potential to increase the relative efficiency of back-
ground selection for many applications of MABC. It can be expected that
this effect will be even more pronounced in the future, as the costs of HT
marker analysis are further decreasing. The biggest advantage of HT assays
over SM assays is that they allow to run highly intense, short backcross pro-
grams with many background markers also in crops with large genomes such
as sunflower, rapeseed or wheat.
— 52 —

General discussion
Optimal breeding designs for HT assays
In older simulation studies based on SM assays, the most efficient selection
strategies were those which reached a given level of recipient genome with
the fewest marker data points (Frisch et al., 1999a; Frisch & Melchinger,
2001c; Falke et al., 2009; Prigge et al., 2009). With HT assays such as SNP
chips, it is possible to genotype all markers on the linkage map in one assay.
The efficiency criterion for these HT assays is therefore not the number of
required marker data points, but the number of individuals subjected to
background selection (Herzog & Frisch, 2011; Herzog & Frisch, 2013). The
most important difference between SM and HT assays is that with SM assays
only those markers are analyzed in advanced backcross generations which are
not yet fixed for the recipient alleles. With HT assays, all markers included
in one assay have to be analyzed in every generation as long as some markers
are segregating. These different characteristics of SM and HT assays have
implications on several aspects of the optimal breeding designs.
Number of backcross generations
For the recovery of recipient genome in MABC, there is a trade-off between
the number of backcross generations and the required resource input. A de-
sired level of recipient genome can usually be recovered with fewer markers
and considerably smaller population sizes if an additional backcross genera-
tion is taken into account (Herzog & Frisch, 2011; Herzog & Frisch, 2013). A
central question for MABC therefore is ’Speed at any cost?’ (Stam, 2003). For
a CMS conversion program in sugarbeet, it was possible to recover 99% re-
cipient genome in three backcross generations with 1,400 marker data points
(Herzog & Frisch, 2013). If the same level of recipient genome was to be
recovered in two backcross generations, the required number of marker data
points was increased ten-fold to 14,000. It therefore seems sensible for SM
assays to conduct an additional backcross in order to reduce the financial and
— 53 —

General discussion
logistic efforts of marker analysis. This principle held also true for HT as-
says, but the reduction in the number of required assays with an additional
backcross was smaller than with SM assays. The increase in the required
number of assays would only have been fourfold, and the backcross program
could have been completed with 240 HT assays. As in plant breeding the ac-
celerated release of superior cultivars often translates into economic benefits
(Morris et al., 2003), it can be expected that the investment in additional HT
assays will pay off. A reduction of the number of backcross generations at
the expense of more marker analyses is therefore advantageous if HT assays
are used.
Variations in population size
Due to increasing marker fixation in advanced backcross generations, the
optimum backcross designs for SM assays were characterized by increas-
ing marker densities and population sizes (Frisch et al., 1999a; Frisch &
Melchinger, 2001c; Prigge et al., 2009). With the less flexible HT assays,
it is difficult or impossible to add markers once an assay has been devel-
oped. For constant marker densities, I observed a limit of recipient genome
recovery which could not be exceeded by further increasing population sizes
(Herzog & Frisch, 2013; Herzog et al., 2013). This limit depended on genome
size and the degree of marker fixation. In general, it is reached with smaller
population sizes in crops with smaller genomes, and in advanced backcross
generations when the number of segregating marker loci and the variance
of recipient genome are decreasing. Increasing population size beyond the
limit of recipient genome recovery is not economic. Population size should
therefore be optimized for every generation of a backcross program. The op-
timum breeding designs for HT assays are characterized by constant marker
densities and decreasing population sizes over backcross generations.
— 54 —

General discussion
Marker density
With SNP markers, densely covered linkage maps with marker densities of
one marker every 5 cM or higher can now be established and genotyped at
reasonable costs. However, for most genetic models, marker densities higher
than one marker every 10 cM resulted in only marginal improvements of
recipient genome recovery (Herzog & Frisch, 2011; Herzog & Frisch, 2013).
Only if recipient genome levels of 98-99% were to be achieved in two backcross
generations for the large genomes of sunflower and rapeseed, a marker density
of one marker every 5 cM was warranted. Beyond this marker density, no
further gains in recipient genome recovery were observed for any investigated
genetic model. An explanation is that the limiting factor for the recovery
of the recipient genome is not the precise estimation of the proportion of
recipient genome. Rather, it is the limited number of crossovers per meiosis
in short backcross programs with only two to three generations (Frisch et al.,
1999a).
However, with marker types that were less abundant in the genome such
as AFLPs and SSRs, it was often not possible to evenly cover the genome
with polymorphic markers. The effect of the resulting gaps in marker spacing
has been studied in simulation studies either by including a random marker
distribution, or by using published linkage maps with incomplete marker
coverage (Hospital et al., 1992; Frisch et al., 1999a; van Berloo et al., 2001;
Herzog & Frisch, 2011). A random marker distribution results in reduced
levels of recipient genome even if the number of markers corresponds to an
average marker density of one marker every 5 cM (Herzog & Frisch, 2011).
The reason is that in uncovered chromosome regions, the content of recipient
genome cannot be estimated precisely (Frisch & Melchinger, 2005). The
main advantage of SNPs and HT assays for MABC is therefore not primarily
that linkage maps with very high marker densities of up to one marker per
1 cM can be generated. Rather, the abundance of SNPs greatly improves the
efficiency of MABC by guaranteeing that maps with sufficient density and
even marker spacing can be generated.
— 55 —

General discussion
Selection strategies combining SM and HT as-
says
Pre-selection on carrier chromosomes
The number of individuals to be genotyped has consistently been identi-
fied in simulation studies as the most important factor for the efficiency of
MABC (Hospital & Charcosset, 1997; Frisch et al., 1999a; van Berloo et al.,
2001; Ribaut et al., 2002). In gene introgression studies based on SM as-
says, the most efficient breeding designs employed selection strategies which
pre-selected a subset of individuals for a few markers located on the chromo-
somes carrying the target genes (Frisch et al., 1999a; Frisch & Melchinger,
2001c; Prigge et al., 2009). Only this smaller subset of the original backcross
population was then subjected to background selection, which resulted in a
considerable reduction of the required number of marker data points of up
to 75%.
This concept is also valid for HT assays, but only cost-efficient if the
pre-selection steps can be conducted with SM assays. In gene introgression
programs, preselecting carriers of the target gene in MABC in a two-stage se-
lection strategy will per expectation already reduce the number of HT assays
for background selection by 50%. A further reduction in the required num-
ber of HT assays can be achieved if an additional selection step at markers
flanking the target gene is conducted before background selection.
With such a three-stage selection strategy, the risk of linkage drag is
decreased, as tightly linked flanking markers will result in a reduction of
the donor chromosome segment attached to the target gene. This donor
segment is responsible for the major part of donor genome remaining in the
recipient background in gene introgression programs and can still be quite
large even in advanced backcross generations (Stam & Zeven, 1981; Young &
Tanksley, 1989). While selection at very tightly linked flanking markers will
— 56 —

General discussion
result in short donor chromosome segments, it can also lead to a reduction
of recipient genome recovery, especially in short backcross programs with
only two or three generations. The reason is that a high selection intensity
on the carrier chromosome can lead to a reduced selection intensity on the
non-carrier chromosomes which form the major part of the genome (Hospital
et al., 1992; Frisch et al., 1999a; Frisch & Melchinger, 2001a). Three-stage
selection therefore entails further design decisions.
In order to reduce selection intensity on the carrier chromosomes, selection
at flanking markers can be conducted in two steps (Young & Tanksley, 1989;
Hospital & Charcosset, 1997). In the first generation of three-stage selection,
all individuals are pre-selected with recombination between the target gene
and at least one flanking marker. In the second generation, individuals with
recombination between the target genes and both flanking markers are pre-
selected. This approach reduces the number of HT assays, but increases the
number of required SM assays and requires more logistic effort in the lab than
conducting three-stage selection only in one backcross generation (Herzog &
Frisch, 2011).
If three-stage selection was only conducted in one backcross generation,
selection in generation BC1 led to a greater reduction in the number of re-
quired HT assays than three-stage selection in generation BC3 (Herzog &
Frisch, 2011). This can be explained by the fact that more individuals with
recombination between the target gene and both flanking markers were found
for background selection in advanced backcross generations. As the recov-
ered levels of recipient genome were approximately equivalent, three-stage
selection in generation BC1 was the more cost-efficient strategy.
The optimal positioning of flanking markers is crucial for efficient con-
trol of the donor chromosome segment attached to the target gene (Hospi-
tal, 2001; Frisch & Melchinger, 2001a). In general, I considered the small-
est distance of flanking markers which had no negative effect on recipient
genome recovery as optimal (Herzog & Frisch, 2011). For constant popula-
tion sizes ranging between 40 and 200 individuals, this was achieved with
— 57 —

General discussion
flanking marker distances of 20-10 cM. Three-stage selection in generation
BC1 with these optimum distances of flanking markers reduced the overall
cost of marker analysis by approximately 20% compared to two-stage selec-
tion, irrespective of population size and cost ratio of HT:SM.
A lower marker distance of 5 cM resulted in a reduced recovery of recipient
genome compared to two-stage selection. If a reduction of the donor chro-
mosome segment attached to the target gene has high priority, for example
because of alleles with negative effect in close proximity, more proximal flank-
ing markers can be chosen in advanced generations (Hospital et al., 1992).
The same effect can be achieved by increasing population size in the gen-
eration in which three-stage selection is conducted. Larger population sizes
increase the probability to find a backcross individual with recombination
between both flanking markers and the target gene plus a high proportion
of recipient genome (Frisch et al., 1999b). Doubling population size in the
generation of three-stage selection shifted the effort in the lab from HT to
SM assays and reduced the cost of marker analysis for recovering 99% recip-
ient genome by approximately 20-25% for cost ratios of HT:SM of 200:1-20:1
(Herzog & Frisch, 2011).
It can be concluded that combining SM assays for pre-selection at flanking
markers with HT assays for genome-wide background selection is an elegant
strategy to efficiently reduce the risk of linkage drag and handle large popu-
lations at low cost.
Combining HT and SM assays for background selection
on non-carrier chromosmes
For many applications of MABC, a small set of reasonably positioned markers
is sufficient for efficient background selection in early backcross generations
(Hospital et al., 1992; Visscher et al., 1996; Herzog & Frisch, 2013). Recently,
it has been suggested that an efficient option to reduce the required number
— 58 —

General discussion
of the still costly HT assays would be to pre-select a certain set of individuals
with a few SM assays at background marker loci. Only this subset is then
subjected to background selection with HT assays (Septiningsih et al., 2013).
This option has not yet been investigated in simulation studies, but seems
promising for CMS conversion without introgression of target genes.
HT assays such as SNP chips have the advantage of very high through-
put, but are only cost-effective if the major proportion of markers is not
yet fixed for the recipient alleles. Simulations have shown that background
markers get rapidly fixed at the high selection intensities which are typical
for backcross programs, the fixed markers then becoming useless (Hospital
et al., 1992). In the studies on gene introgression and CMS conversion, over
90% of the background markers got fixed in the first two backcross genera-
tions (Herzog & Frisch, 2011; Herzog & Frisch, 2013). From generation BC4
on, selection on non-carrier chromosomes in gene introgression programs is
no longer efficient, as 99% of background markers outside the carrier chro-
mosome are fixed (Hospital & Charcosset, 1997; Herzog et al., 2013). The
few remaining segregating marker loci can be genotyped with SM assays at
low cost. It was therefore suggestive to study selection strategies in which
HT assays are used for genome-wide background selection in early backcross
generations, and SM assays in advanced backcross generations.
A prerequisite for this combination of HT and SM assays is that a flexible
marker system exists which can be genotyped with both types of assay. KASP
is a flexible assay which allows cost-effective genotyping also of small sets of
SNPs (Chen et al., 2010). Furthermore, it can be used in combination with
HT assays such as SNP chips, given that a set of versatile SNP markers is
available which can be converted from HT assays to KASP. Such a marker
set has recently been developed for maize (Mammadov et al., 2012).
Using HT assays for background selection in generation BC1 and SM as-
says in the following backcross generations reduced the total cost of marker
analysis compared to using only HT assays. The cost reduction ranged
— 59 —

General discussion
from 1-44% in two-generation backcross programs and from 7-61% in three-
generation backcross programs for cost ratios of HT:SM of 50:1-200:1 (Herzog
& Frisch, 2011). If HT assays were used in generations BC1 and BC2 and
SM assays in generation BC3, the costs were reduced by 18-33%, depending
on the genome size of the studied crop species (Herzog & Frisch, 2013).
It can be concluded that combinations of HT and SM assays have the
potential to considerably reduce the cost of marker analysis. HT assays are
suitable for short, intense backcross programs. SM assays are efficient for
pre-selection at a few marker loci, and in advanced backcross generations
when the major proportion of marker loci is already fixed for the recipient
alleles.
SSR multiplexes: Selection strategies for an
intermediate level of throughput
Beside SNP chips, which allow genotyping ten-thousands of markers in one
assay, different kinds of HT assays with a lower level of throughput are also
available (Appleby et al., 2009). An example is multiplex PCR for SSR mark-
ers, which has been suggested to considerably reduce the cost of PCR-related
reagents (Merdinoglu et al., 2005). With chromosome-wise SSR multiplexes
for background selection, I investigated an example from practical resistance
breeding in grapevine in cooperation with the Julius Kuhn Institute (JKI),
Institute for Grapevine Breeding Geilweilerhof (Herzog et al., 2013). One
multiplex comprised all markers located on one chromosome. This resulted
in multiplexes of 5 to 11 loci, depending on the chromosome length.
In order to reduce the number of multiplexes, a selection strategy was
developed which pre-selected backcross individuals with the highest num-
ber of chromosomes completely fixed for the recipient alleles. This selection
strategy reduced the number of required multiplexes by about 7%, but only
— 60 —

General discussion
in backcross programs with four or more backcross generations. For shorter
backcross programs, it was more advantageous to select for the highest pro-
portion of recipient alleles at all background marker loci. An explanation
is that in early backcross generations the number of individuals with a high
number of chromosomes completely fixed for the recipient alleles was very
low. Only this very small subset was evaluated at all background markers,
which resulted in overall losses of recipient genome.
Frisch et al. (Frisch et al., 1999a; Frisch & Melchinger, 2001c) observed
in accordance with my results that selection for the highest proportion of
recipient alleles at all background marker loci leads to the highest recov-
ery of recipient genome in two-generation backcross programs. In advanced
backcross generations, the differences between different selection strategies
diminish considerably, as early gains or losses in recipient genome are bal-
anced by the higher carry-over rate of recipient genome recovery in advanced
backcross generations.
The general conclusion that can be drawn from investigating marker sys-
tems with different levels of throughput is that the optimal selection strate-
gies and breeding designs are determined by the number of markers included
in one assay, their assortment with respect to genome location, and the du-
ration of the backcross program.
Selection indices for HT assays combining fore-
ground and background selection
Combinations of marker assays with different levels of throughput in one
backcross program require additional effort in the lab and may not be possible
in every breeding program. In these cases, HT assays can be used to analyze
both foreground and background markers in one assay. This does not only
increase the speed and convenience of marker analysis, but allows also more
— 61 —

General discussion
flexible selection decisions with respect to the donor genome content on the
carrier chromosomes in introgression programs.
With pre-selection at flanking markers, the length of the donor chromo-
some segment attached to the target gene can only be evaluated with respect
to the distance of the flanking markers. High marker densities in proximity
to the target gene allow more differentiated selection decisions (van Berloo
et al., 2001). It is then possible to preselect the individuals with the shortest
donor segments attached to the target region. Moreover, the selection pres-
sure against the donor genome on the carrier chromosomes of target genes
decreases with increasing genome size. Hence, it might be advantageous for
crops with large genomes to put higher weight on the markers on the car-
rier chromosomes. This approach allows to discriminate between individuals
with identical background marker scores in order to select individuals with
better carrier chromosomes (Hospital & Charcosset, 1997). The described
increase in flexibility can be achieved by combining foreground and back-
ground selection with HT assays in one selection index. I investigated this in
the context of the development of maize introgression populations (Herzog
et al., 2014). The development of introgression populations had previously
only been investigated with SM assays and pre-selection strategies in several
steps (Falke et al., 2009).
The selection index in my study was defined as the sum of the donor
genome proportion in a selection region plus the recipient genome propor-
tion in the rest of the genome outside the selection region. This index was
used to develop introgression populations of 100 introgression lines with tar-
get regions of 20 cM length in a genome of 2000 cM length with population
sizes of 360 individuals per backcross generation (Herzog et al., 2014). Af-
ter generation BC1, in which 360 backcross individuals were generated, the
population size was divided into sub-populations of equal size, depending on
the length of the selection region. Selection regions could be complete donor
chromosomes, chromosome halves or target segments. Selection for complete
donor chromosomes from a large BC1 population of 360 individuals resulted
— 62 —

General discussion
in a high donor genome proportion on the carrier chromosomes which was
often preserved in the final introgression lines. Selection of introgression lines
carrying the 20 cM target segments from sub-populations of 18 individuals
with the selection index, on the other hand, often resulted in a complete loss
of the target segments.
An explanation for the efficiency of comparatively large selection regions
is that very stringent selection criteria in early backcross generations usu-
ally also require high population sizes (van Berloo et al., 2001). Equivalent
recipient genome levels can usually be recovered with much smaller popula-
tion sizes if selection intensity is not too high in early backcross generations.
Theoretical solutions for the minimum population sizes required to find with
high probability an individual with the desired genotype in the target region
are available (Frisch et al., 1999b). However, to combine this with the re-
quirements for a high recipient genome proportion in the rest of the genome
is not straightforward with mathematical models. The optimal length of the
selection region should therefore be determined with simulations for every
generation of the crossing scheme. For the large chromosomes of maize, the
best strategy was selection for donor chromosome halves during the backcross
generations and selection for the target segments at the stage of introgression
lines (Herzog et al., 2014). The most important criterion for the efficiency of
a selection index for HT assays was to find a balance between the length of
the selection region and population size.
Conclusions
In this thesis, novel strategies for MABC with HT assays have been de-
veloped. The results of my simulations suggest that HT assays have the
potential to increase the efficiency of MABC both with respect to the costs
of marker analysis and selection gain per unit time. HT assays were cheaper
than SM assays for genome-wide background selection for a wide range of
cost ratios of HT:SM and genetic crop models.
— 63 —

General discussion
The optimum breeding designs for HT assays differed from those for SM
assays with respect to marker density, selection strategy and population size
due to the different characteristics of both types of assay. In contrast to
SM assays, the number of required marker data points is only of secondary
importance for HT assays. Rather, the most important cost factor for HT
assays is the number of individuals to be genotyped.
Depending on the level of throughput, the optimum breeding designs for
HT assays were determined by the number of markers included in one assay,
their assortment with respect to genome location, and the duration of the
desired backcross program. HT assays with very high throughput, such as
SNP chips, were most efficient in short, highly intense backcross programs
with only two or three backcross generations.
Nevertheless, SM assays were more cost-efficient whenever the analysis of
only a few marker loci was required. This was the case in foreground selection
for target genes, selection at flanking markers for the control of linkage drag,
or for background selection in advanced backcross generations when only
very few background markers remained segregating. Combining SM and HT
assays for different stages of a MABC program consequently further reduced
the cost of marker analysis compared to using only HT assays.
Using HT assays for foreground and background selection in one combined
index allowed more differentiated selection decisions with respect to the donor
genome proportion on carrier chromosomes. This was especially useful for the
development of introgression populations with a limited number of backcross
individuals and HT assays.
— 64 —

Chapter 7
Summary
Marker-assisted backcrossing (MABC) is the most successful application of
DNA markers in plant breeding. While foreground selection for a few loci
of interest with single-marker (SM) assays has become a routine application
in breeding programs, the large-scale implementation of genome-wide back-
ground selection for the recovery of the genotype of the recipient has lagged
behind expectations due to the high costs of marker analysis. It has been
hypothesized that this problem will be overcome by high-throughput (HT)
marker assays which enable genotyping a high number of marker loci at com-
paratively low cost per individual marker data point. The optimal backcross
designs for HT assays have previously not been investigated. The objective
of the present study was therefore the development of novel selection strate-
gies for the efficient use of HT assays in different applications of MABC. For
this purpose, computer simulations were employed to investigate backcross
programs for different crops.
Gene introgression for maize and conversion of seed parent lines to cy-
toplasmic male sterility (CMS) for rye, sugarbeet, sunflower and rapeseed
were simulated with HT and SM assays. Using HT assays for background
selection was cheaper than using SM assays for a wide range of cost ratios
of one HT assay compared to one SM assay, both for gene introgression and
CMS conversion of seed parent lines. The cost-efficiency of HT assays was
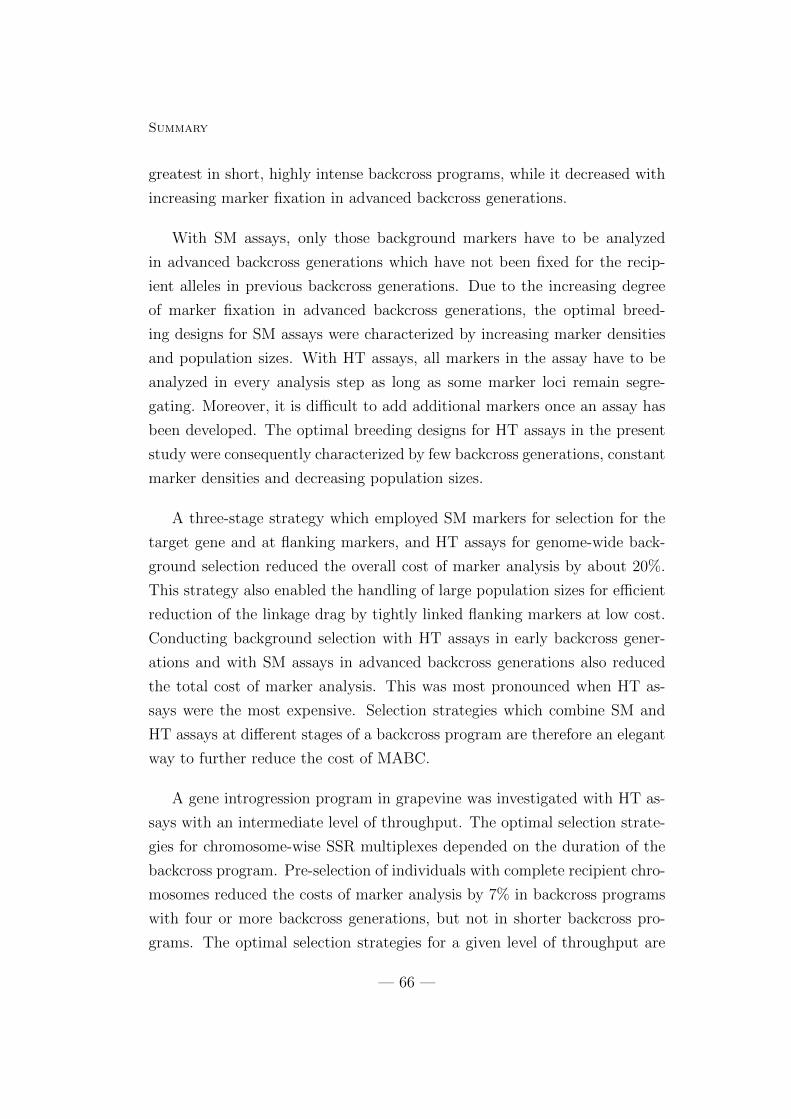
Summary
greatest in short, highly intense backcross programs, while it decreased with
increasing marker fixation in advanced backcross generations.
With SM assays, only those background markers have to be analyzed
in advanced backcross generations which have not been fixed for the recip-
ient alleles in previous backcross generations. Due to the increasing degree
of marker fixation in advanced backcross generations, the optimal breed-
ing designs for SM assays were characterized by increasing marker densities
and population sizes. With HT assays, all markers in the assay have to be
analyzed in every analysis step as long as some marker loci remain segre-
gating. Moreover, it is difficult to add additional markers once an assay has
been developed. The optimal breeding designs for HT assays in the present
study were consequently characterized by few backcross generations, constant
marker densities and decreasing population sizes.
A three-stage strategy which employed SM markers for selection for the
target gene and at flanking markers, and HT assays for genome-wide back-
ground selection reduced the overall cost of marker analysis by about 20%.
This strategy also enabled the handling of large population sizes for efficient
reduction of the linkage drag by tightly linked flanking markers at low cost.
Conducting background selection with HT assays in early backcross gener-
ations and with SM assays in advanced backcross generations also reduced
the total cost of marker analysis. This was most pronounced when HT as-
says were the most expensive. Selection strategies which combine SM and
HT assays at different stages of a backcross program are therefore an elegant
way to further reduce the cost of MABC.
A gene introgression program in grapevine was investigated with HT as-
says with an intermediate level of throughput. The optimal selection strate-
gies for chromosome-wise SSR multiplexes depended on the duration of the
backcross program. Pre-selection of individuals with complete recipient chro-
mosomes reduced the costs of marker analysis by 7% in backcross programs
with four or more backcross generations, but not in shorter backcross pro-
grams. The optimal selection strategies for a given level of throughput are
— 66 —

Summary
consequently determined by the assortment of markers in the assay and the
duration of the backcross program.
Combinations of SM and HT assays in one backcross program increase
the effort in the laboratory and may not be possible in every breeding pro-
gram. In these cases, HT assays can be used to analyze both foreground
and background markers in one assay. This was investigated with a selection
index for the development of introgression populations in maize. The index
was defined as the sum of the donor genome proportion in a selection region
plus the recipient genome proportion in the rest of the genome outside the
selection region. The index allowed more differentiated selection decisions
with respect to the ratio of the donor genome proportion on the carrier chro-
mosomes and the recipient genome on non-carrier chromosomes. The most
important criterion for the efficiency of this selection index for HT assays was
to find a balance between the length of the selection region and population
size.
It can be concluded that HT assays have the potential to increase the
relative efficiency of background selection for many applications of MABC,
as was demonstrated for gene introgression in maize and grapevine, CMS
conversion in rye, sugarbeet, sunflower and rapeseed, and the development
of introgression populations in maize.
— 67 —

Kapitel 8
Zusammenfassung
Markergestutzte Ruckkreuzung ist bislang die erfolgreichste Anwendung von
DNA-Markern in der Pflanzenzuchtung. Wahrend Vordergrundselektion fur
einige wenige Zielgene mit Einzelmarkeranalysen mittlerweile routinemaßig
in Zuchtprogrammen eingesetzt wird, ist die Anwendung der genomweiten
Hintergrundselektion zur Wiederherstellung des Genotyps des Rezipienten
lange Zeit hinter den Erwartungen zuruckgeblieben. Die Ursachen lagen in
den hohen Kosten und dem hohen Aufwand begrundet, der fur die Viel-
zahl der benotigten Einzelmarkeranalysen erforderlich ist. Eine Losung fur
dieses Problem stellen Hochdurchsatzanalysemethoden wie SNP-Chips dar.
Mit diesen Hochdurchsatzmarkeranalysen kann eine hohe Anzahl von Mar-
kern zu vergleichsweise geringen Kosten pro Markerdatenpunkt genotypisiert
werden. Die optimalen Selektionsstrategien fur Hochdurchsatzmarkeranaly-
sen wurden bislang noch nicht untersucht. Das Ziel der vorliegenden Arbeit
war es daher, neue Strategien fur den effizienten Einsatz von Hochdurch-
satzmarkeranalysen in verschiedenen Anwendungen der markergestutzten
Ruckkreuzung zu entwickeln. Zu diesem Zweck wurden Computersimulatio-
nen markergestutzter Ruckkreuzungsprogramme in verschiedenen Kulturar-
ten durchgefuhrt.
Genintrogression bei Mais sowie die Einlagerung cytoplasmatisch-
mannlicher Sterilitat (CMS) bei Roggen, Zuckerrube, Sonnenblume und

Zusammenfassung
Raps wurden sowohl mit Hochdurchsatz- als auch mit Einzelmarkerana-
lysen simuliert. Hochdurchsatzmarkeranalysen reduzierten die Kosten der
Hintergrundselektion fur eine große Bandbreite an Kostenverhaltnissen von
Hochdurchsatz- zu Einzelmarkeranalysen. Dies galt sowohl fur Genintrogres-
sion als auch fur die Einlagerung von CMS. Die Kosteneffizienz war am
großten in kurzen Ruckkreuzungsprogrammen mit dem Ziel hohen Selek-
tionsgewinns in nur zwei Ruckkreuzungsgenerationen, nahm jedoch mit zu-
nehmender Markerfixierung in fortgeschrittenen Ruckkreuzungsgenerationen
ab.
Bei der Verwendung von Einzelmarkeranalysen werden in fortgeschritte-
nen Ruckkreuzungsgenerationen nur die Marker analysiert, die noch nicht fur
das Rezipientenallel fixiert sind. Effiziente Zuchtungsschemata fur Einzelmar-
keranalysen sind daher durch ansteigende Markerdichten und Populations-
großen gekennzeichnet. Bei der Verwendung von Hochdurchsatzmarkeranaly-
sen wird der komplette Markersatz in jedem Analyseschritt analysiert, solan-
ge noch Marker segregieren. Daruber hinaus ist das Hinzufugen neuer Mar-
ker zu einem einmal entwickelten Hochdurchsatzchip nicht einfach umsetz-
bar. Optimale Zuchtungsschemata fur Hochdurchsatzmarkeranalysen waren
in der vorliegenden Arbeit daher durch wenige Ruckkreuzungsgenerationen,
konstante Markerdichte und abnehmende Populationsgroßen charakterisiert.
Eine dreistufige Selektionstrategie, die Einzelmarkeranalysen fur die Se-
lektion am Ziellocus und an flankierenden Markern nutzte, und Hochdurch-
satzmarkeranalysen fur die genomweite Hintergrundselektion, senkte die Ge-
samtkosten fur die Genotypisierung um etwa 20%. Diese Selektionsstrate-
gie ermoglichte auch den Einsatz großer Populationen zur Reduktion des
Donorchromosomensegments am Zielgen durch eng gekoppelte flankierende
Marker zu niedrigen Kosten. Der Einsatz von Hochdurchsatzmarkeranalysen
fur die Hintergrundselektion in fruhen Ruckkreuzungsgenerationen und von
Einzelmarkeranalysen in fortgeschrittenen Ruckkreuzungsgenerationen redu-
zierte ebenfalls die Kosten fur die Genotypisierung. Selektionsstrategien, die
den Einsatz von Einzel- und Hochdurchsatzmarkeranalysen in verschiedenen
— 69 —

Zusammenfassung
Phasen eines Ruckkreuzungsprogramms kombinieren, sind daher eine ele-
gante Moglichkeit, die Kosten der markergestutzten Ruckkreuzung weiter zu
reduzieren.
Ein Genintrogressionsprogramm bei Reben mit einem Markeranalysesys-
tem mit mittlerem Durchsatz wurde ebenfalls untersucht. Die optimalen Se-
lektionsstrategien fur chromosomenweise SSR-Multiplexe wurden durch die
Dauer des Ruckkreuzungsprogramms bestimmt. Die Vorselektion von Indi-
viduen mit kompletten Rezipientenchromosomen reduzierte die Kosten der
Markeranalyse um etwa 7% in Ruckkreuzungsprogrammen mit vier oder
mehr Generationen, nicht aber in kurzeren Ruckkreuzungsprogrammen. Die
optimalen Selektionsstrategien fur ein bestimmtes Durchsatzniveau werden
folglich durch die Anordnung der Marker im Assay sowie durch die Dauer
des Ruckkreuzungsprogramms bestimmt.
Kombinationen von Einzel- und Hochdurchsatzmarkeranalysen in einem
Ruckkreuzungsprogramm erhohen den logistischen Aufwand im Labor und
sind nicht immer umsetzbar. In diesen Fallen konnen sowohl Vordergrund-
als auch Hintergrundselektion mit einem Hochdurchsatzchip durchgefuhrt
werden. Dies wurde anhand eines Selektionsindexes fur die Entwicklung
von Introgressionspopulationen bei Mais untersucht. Der Index war als die
Summe des Donorgenomanteils innerhalb einer bestimmten Selektionsregi-
on und des Rezipientengenomanteils im Rest des Genoms definiert. Der In-
dex ermoglichte differenziertere Selektionsentscheidungen in Hinblick auf das
Verhaltnis von Donorgenomanteil auf den Tragerchromosomen der Zielseg-
mente und Rezipientengenomanteil im Rest des Genoms. Das wichtigste Kri-
terium fur die Effizienz des Selektionsindexes war das Finden einer Balance
zwischen der Lange der Selektionsregion und der Populationsgroße.
Wie an den Beispielen der Genintrogression bei Mais und Reben, der
CMS-Einlagerung bei Roggen, Zuckerrube, Sonnenblume und Raps sowie der
Entwicklung von Introgressionspopulationen bei Mais gezeigt wurde, konnen
Hochdurchsatzmarkeranalysen die Effizienz vieler Anwendungen der marker-
gestutzten Ruckkreuzung im Vergleich zu Einzelmarkeranalysen erhohen.
— 70 —

References
Allard, RW. 1960. Principles of plant breeding. John Wiley & Sons, New
York.
Appleby, N, Edwards, D, & Batley, J. 2009. New technologies for ultra-
high throughput genotyping in plants. Pages 19–39 of: Somers, DJ,
Langridge, P, & Gustafson, JP (eds), Plant Genomics. Methods and
Protocols. Humana Press, New York.
Bartlett, MS, & Haldane, JBS. 1935. The theory of inbreeding with forced
heterozygosis. J Genet, 31(3), 327–340.
Becker, H. 2011. Pflanzenzuchtung. Ulmer, Stuttgart.
Beckmann, JS, & Soller, M. 1986. Restriction fragment length polymor-
phisms and genetic improvement of agricultural species. Euphytica,
35(1), 111–124.
Botstein, D, White, RL, Skolnick, M, & Davis, RW. 1980. Construction of a
genetic linkage map in man using restriction fragment length polymor-
phisms. Am J Hum Genet, 32(3), 314.
Chen, W, Mingus, J, Mammadov, J, Backlund, JE, Greene, T, Thompson,
S, & Kumpatla, S. 2010. KASPar: a simple and cost-effective system
for SNP genotyping. Pages 9–13 of: Final program, abstract and exhibit
guide of the XVIII international conference on the status of plant and
animal genome research, San Diego, CA.
— 71 —

Collard, BCY, & Mackill, DJ. 2008. Marker-assisted selection: an approach
for precision plant breeding in the twenty-first century. Philos T Roy
Soc B, 363(1491), 557–572.
Collard, BCY, Jahufer, MZZ, Brouwer, JB, & Pang, ECK. 2005. An intro-
duction to markers, quantitative trait loci (QTL) mapping and marker-
assisted selection for crop improvement: The basic concepts. Euphytica,
142(1-2), 169–196.
Datta, K, Baisakh, N, Thet, K Maung, Tu, J, & Datta, S. 2002. Pyramiding
transgenes for multiple resistance in rice against bacterial blight, yellow
stem borer and sheath blight. Theor Appl Genet, 106(1), 1–8.
Eathington, SR, Crosbie, TM, Edwards, MD, Reiter, RS, & Bull, JK. 2007.
Molecular markers in a commercial breeding program. Crop Sci, 47(Sup-
plement 3), S154–S163.
Falke, KC, Miedaner, T, & Frisch, M. 2009. Selection strategies for the
development of rye introgression libraries. Theor Appl Genet, 119(4),
595–603.
Frisch, M, & Melchinger, AE. 2001a. The length of the intact donor chro-
mosome segment around a target gene in marker-assisted backcrossing.
Genetics, 157(3), 1343–1356.
Frisch, M, & Melchinger, AE. 2001b. Marker-assisted backcrossing for intro-
gression of a recessive gene. Crop Sci, 41(5), 1485–1494.
Frisch, M, & Melchinger, AE. 2001c. Marker-assisted backcrossing for simul-
taneous introgression of two genes. Crop Sci, 41(6), 1716–1725.
Frisch, M, & Melchinger, AE. 2005. Selection theory for marker-assisted
backcrossing. Genetics, 170(2), 909–917.
Frisch, M, Bohn, M, & Melchinger, AE. 1999a. Comparison of selection
strategies for marker-assisted backcrossing of a gene. Crop Sci, 39(5),
1295–1301.
— 72 —

Frisch, M, Bohn, M, & Melchinger, AE. 1999b. Minimum sample size and
optimal positioning of flanking markers in marker-assisted backcrossing
for transfer of a target gene. Crop Sci, 39(4), 967–975.
Gupta, PK, Roy, JK, & Prasad, M. 2001. Single nucleotide polymorphisms: a
new paradigm in molecular marker technology and DNA polymorphism
detection with emphasis on their use in plants. Curr Sci India, 80(4),
524–535.
Hanson, WD. 1959. Early generation analysis of lengths of heterozygous chro-
mosome segments around a locus held heterozygous with backcrossing
or selfing. Genetics, 44(5), 833.
Herzog, E, & Frisch, M. 2011. Selection strategies for marker-assisted back-
crossing with high-throughput marker systems. Theor Appl Genet,
123(2), 251–260.
Herzog, E, & Frisch, M. 2013. Efficient marker-assisted backcross conversion
of seed-parent lines to cytoplasmic male sterility. Plant Breeding, 132(1),
33–41.
Herzog, E, Topfer, R, Hausmann, L, Eibach, R, & Frisch, M. 2013. Selection
strategies for marker-assisted background selection with chromosome-
wise SSR multiplexes in pseudo-backcross programs for grapevine breed-
ing. Vitis, 52(4), 193–196.
Herzog, E, Falke, KC, Presterl, T, Scheuermann, D, Ouzunova, M, & Frisch,
M. 2014. Selection strategies for the development of maize introgression
populations. PLOS ONE, 9(3), e92429.
Hill, WG. 1993. Variation in genetic composition in backcrossing programs.
J Hered, 84(3), 212–213.
Hillel, J, Schaap, T, Haberfeld, A, Jeffreys, AJ, Plotzky, Y, Cahaner, A, &
Lavi, U. 1990. DNA fingerprints applied to gene introgression in breeding
programs. Genetics, 124(3), 783–789.
— 73 —

Hospital, F. 2001. Size of donor chromosome segments around introgressed
loci and reduction of linkage drag in marker-assisted backcross programs.
Genetics, 158(3), 1363–1379.
Hospital, F, & Charcosset, A. 1997. Marker-assisted introgression of quanti-
tative trait loci. Genetics, 147(3), 1469–1485.
Hospital, F, Chevalet, C, & Mulsant, P. 1992. Using markers in gene intro-
gression breeding programs. Genetics, 132(4), 1199–1210.
Kuchel, H, Fox, R, Reinheimer, J, Mosionek, L, Willey, N, Bariana, H, &
Jefferies, S. 2007. The successful application of a marker-assisted wheat
breeding strategy. Mol Breeding, 20(4), 295–308.
Liu, J, Liu, D, Tao, W, Li, W, Wang, S, Chen, P, Cheng, S, & Gao, D. 2000.
Molecular marker-facilitated pyramiding of different genes for powdery
mildew resistance in wheat. Plant Breeding, 119(1), 21–24.
Mammadov, J, Chen, W, Mingus, J, Thompson, S, & Kumpatla, S. 2012.
Development of versatile gene-based SNP assays in maize (Zea mays L.).
Mol Breeding, 29(3), 779–790.
Markel, P, Shu, P, Ebeling, C, Carlson, GA, Nagle, DL, Smutko, JS, &
Moore, KJ. 1997. Theoretical and empirical issues for marker-assisted
breeding of congenic mouse strains. Nat Genet, 17(3), 280–284.
Merdinoglu, D, Butterlin, G, Bevilacqua, L, Chiquet, V, Adam-Blondon, A-
F, & Decroocq, S. 2005. Development and characterization of a large
set of microsatellite markers in grapevine (Vitis vinifera L.) suitable for
multiplex PCR. Mol Breeding, 15(4), 349–366.
Moreau, L, Charcosset, A, Hospital, F, & Gallais, A. 1998. Marker-assisted
selection efficiency in populations of finite size. Genetics, 148(3), 1353–
1365.
Morris, M, Dreher, K, Ribaut, J-M, & Khairallah, M. 2003. Money matters
(II): costs of maize inbred line conversion schemes at CIMMYT using
— 74 —

conventional and marker-assisted selection. Mol Breeding, 11(3), 235–
247.
National Agricultural Statistics Service. 2013. Acreage. United States De-
partment of Agriculture.
Neeraja, CN, Maghirang-Rodriguez, R, Pamplona, A, Heuer, S, Collard,
BCY, Septiningsih, EM, Vergara, G, Sanchez, D, Xu, K, Ismail, AM, &
Mackill, DJ. 2007. A marker-assisted backcross approach for developing
submergence-tolerant rice cultivars. Theor Appl Genet, 115(6), 767–776.
Peng, T, Sun, X, & Mumm, RH. 2014a. Optimized breeding strategies for
multiple trait integration: I. Minimizing linkage drag in single event
introgression. Mol Breeding, 33(1), 89–104.
Peng, T, Sun, X, & Mumm, RH. 2014b. Optimized breeding strategies for
multiple trait integration: II. Process efficiency in event pyramiding and
trait fixation. Mol Breeding, 33(1), 105–115.
Prigge, V, Maurer, HP, Mackill, DJ, Melchinger, AE, & Frisch, M. 2008.
Comparison of the observed with the simulated distributions of the
parental genome contribution in two marker-assisted backcross programs
in rice. Theor Appl Genet, 116(5), 739–744.
Prigge, V, Melchinger, AE, Dhillon, BS, & Frisch, M. 2009. Efficiency gain of
marker-assisted backcrossing by sequentially increasing marker densities
over generations. Theor Appl Genet, 119(1), 23–32.
Ragot, M, & Lee, M. 2007. Marker-assisted selection in maize: current sta-
tus, potential, limitations and perspectives from the private and public
sectors. Pages 117–150 of: Guimaraes, EP, Ruane, J, Scherf, BD, Son-
nino, A, & Dargie, JD (eds), Marker-assisted selection. Current status
and future perspectives in crops, livestock, forestry and fish. FAO, Rome.
Randhawa, HS, Mutti, JS, Kidwell, K, Morris, CF, Chen, X, & Gill, KS.
2009. Rapid and targeted introgression of genes into popular wheat
— 75 —

cultivars using marker-assisted background selection. PLOS ONE, 4(6),
e5752.
Ribaut, J-M, Jiang, C, & Hoisington, D. 2002. Simulation experiments on
efficiencies of gene introgression by backcrossing. Crop Sci, 42(2), 557–
565.
Schon, CC, Melchinger, AE, Boppenmaier, J, Brunklaus-Jung, E, Herrmann,
RG, & Seitzer, JF. 1994. RFLP mapping in maize: quantitative trait
loci affecting testcross performance of elite European flint lines. Crop
Sci, 34(2), 378–389.
Semagn, K, Bjørnstad, A, & Ndjiondjop, MN. 2006. Progress and prospects
of marker assisted backcrossing as a tool in crop breeding programs. Afr
J Biotechnol, 5(25), 2588–2603.
Septiningsih, EM, Collard, BCY, Heuer, S, Bailey-Serres, J, Ismail, AM, &
Mackill, DJ. 2013. Applying genomics tools for breeding submergence
tolerance in rice. Pages 9–30 of: Varshney, RK, & Tuberosa, R (eds),
Translational Genomics for Crop Breeding. Volume II: Abiotic Stress,
Yield and Quality. John Wiley & Sons, Ames, Iowa.
Servin, B, Martin, OC, Mezard, M, & Hospital, F. 2004. Toward a theory of
marker-assisted gene pyramiding. Genetics, 168(1), 513–523.
Stam, P. 2003. Marker-assisted introgression: speed at any cost? Pages 19–
21 of: Proceedings of the Eucarpia meeting on leafy vegetables genetics
and breeding.
Stam, P, & Zeven, AC. 1981. The theoretical proportion of the donor genome
in near-isogenic lines of self-fertilizers bred by backcrossing. Euphytica,
30(2), 227–238.
Syvanen, A-C. 2005. Toward genome-wide SNP genotyping. Nat Genet, 37,
S5–S10.
— 76 —

Tanksley, SD, Young, ND, Paterson, AH, & Bonierbale, MW. 1989. RFLP
mapping in plant breeding: new tools for an old science. Nat Biotechnol,
7(3), 257–264.
Tesfaye, LM, Bink, MCAM, van der Lans, IA, Gremmen, B, & van Trijp,
HCM. 2013. Bringing the voice of consumers into plant breeding with
Bayesian modelling. Euphytica, 189(3), 365–378.
Timonova, EM, Leonova, IN, Roder, MS, & Salina, EA. 2013. Marker-
assisted development and characterization of a set of Triticum aestivum
lines carrying different introgressions from the T. timopheevii genome.
Mol Breeding, 31(1), 123–136.
Utomo, HS, Wenefrida, I, & Linscombe, SD. 2012. Progression of DNA
Marker and the Next Generation of Crop Development. Pages 1–28 of:
Goyal, A (ed), Crop Plant. InTech.
van Berloo, R, Aalbers, H, Werkman, A, & Niks, RE. 2001. Resistance
QTL confirmed through development of QTL-NILs for barley leaf rust
resistance. Mol Breeding, 8(3), 187–195.
Visscher, PM. 1996. Proportion of the variation in genetic composition in
backcrossing programs explained by genetic markers. J Hered, 87(2),
136–138.
Visscher, PM. 1999. Speed congenics: accelerated genome recovery using
genetic markers. Genet Res, 74(1), 81–85.
Visscher, PM, Haley, CS, & Thompson, R. 1996. Marker-assisted introgres-
sion in backcross breeding programs. Genetics, 144(4), 1923–1932.
Vos, P, Hogers, R, Bleeker, M, Reijans, M, van De Lee, T, Hornes, M, Friters,
A, Pot, J, Paleman, J, Kuiper, M, & Zabeau, M. 1995. AFLP: a new
technique for DNA fingerprinting. Nucleic Acids Res, 23(21), 4407–
4414.
— 77 —

Wilde, F, Schon, CC, Korzun, V, Ebmeyer, E, Schmolke, M, Hartl, L, &
Miedaner, T. 2008. Marker-based introduction of three quantitative-trait
loci conferring resistance to Fusarium head blight into an independent
elite winter wheat breeding population. Theor Appl Genet, 117(1), 29–
35.
Willcox, MC, Khairallah, MM, Bergvinson, D, Crossa, J, Deutsch, JA, Ed-
meades, GO, Gonzalez-de Leon, D, Jiang, C, Jewell, DC, Mihm, JA,
Williams, WP, & Hoisington, D. 2002. Selection for resistance to south-
western corn borer using marker-assisted and conventional backcrossing.
Crop Sci, 42(5), 1516–1528.
Xu, Y, & Crouch, JH. 2008. Marker-assisted selection in plant breeding:
from publications to practice. Crop Sci, 48(2), 391–407.
Young, ND, & Tanksley, SD. 1989. RFLP analysis of the size of chromosomal
segments retained around the Tm-2 locus of tomato during backcross
breeding. Theor Appl Genet, 77(3), 353–359.
Zietkiewicz, E, Rafalski, A, & Labuda, D. 1994. Genome fingerprinting by
simple sequence repeat (SSR)-anchored polymerase chain reaction am-
plification. Genomics, 20(2), 176–183.
— 78 —

Acknowledgments
I am very grateful to my academic supervisor Prof. Dr. Matthias Frisch for
his advise, suggestions and support during this thesis work.
Thanks to Prof. Dr. Dr. h.c. Wolfgang Friedt for serving on my graduate
commitee.
Sincere thanks for sharing information on ongoing research and for good
collaboration in our joint projects to Prof. Dr. Reinhard Topfer, Dr. Ludger
Hausmann and Dr. Rudolf Eibach from the Julius Kuhn Institute, and the
Amaizing team: Priv.-Doz. Dr. Christin Falke, Dr. Thomas Presterl, Dr.
Daniela Scheuermann and Dr. Milena Ouzunova.
Many thanks to my office mate Nina Hofheinz for being excellent company
on travels around the world and suffering and celebrating with me through
the ages.
Many thanks to my colleague Carola Zenke-Philippi for proof-reading.
Thanks to Dr. Gabriel Schachtel for awakening my interest in biometry.
Thanks to Mrs. Renate Schmidt for being of great help in organisational
matters.
Last but not least, I would like to thank all my colleagues, family and friends
for their encouragement and support.

Eidesstattliche Erklarung
Ich erklare:
Ich habe die vorgelegte Dissertation selbstandig und ohne unerlaubte fremde
Hilfe und nur mit den Hilfen angefertigt, die ich in der Dissertation angegeben
habe.
Alle Textstellen, die wortlich oder sinngemaß aus veroffentlichten Schriften
entnommen sind, und alle Angaben, die auf mundlichen Auskunften beruhen,
sind als solche kenntlich gemacht.
Bei den von mir durchgefuhrten und in der Dissertation erwahnten Unter-
suchungen habe ich die Grundsatze guter wissenschaftlicher Praxis, wie sie
in der”Satzung der Justus-Liebig-Universitat Gießen zur Sicherung guter
wissenschaftlicher Praxis“ niedergelegt sind, eingehalten.
Eva Herzog
Gießen, 28. Februar 2014