computers in biology and medicine - iperforms
TRANSCRIPT

Computers in Biology and Medicine 97 (2018) 63–73
Contents lists available at ScienceDirect
Computers in Biology and Medicine
journal homepage: www.elsevier.com/locate/compbiomed
Automatic liver vessel segmentation using 3D region growing and hybridactive contour model
Ye-zhan Zeng a,b, Sheng-hui Liao a,*, Ping Tang a,b, Yu-qian Zhao a,b,**, Miao Liao c, Yan Chen d,Yi-xiong Liang a
a School of Information Science and Engineering, Central South University, Changsha, 410083, Chinab Department of Biomedical Engineering, Central South University, Changsha, 410083, Chinac School of Computer Science and Engineering, Hunan University of Science and Technology, Xiangtan, 411201, Chinad Applied Vision Research Centre, Loughborough University, Loughborough, UK
A R T I C L E I N F O
Keywords:Bi-Gaussian filter3D region growingHybrid active contour modelLiver vessel segmentation
* Corresponding author.** Corresponding author. School of Information S
E-mail addresses: [email protected] (S.-h. Liao), zy
https://doi.org/10.1016/j.compbiomed.2018.04.01Received 16 September 2017; Received in revised0010-4825/© 2018 Elsevier Ltd. All rights reserved
A B S T R A C T
This paper proposes a new automatic method for liver vessel segmentation by exploiting intensity and shapeconstraints of 3D vessels. The core of the proposed method is to apply two different strategies: 3D region growingfacilitated by bi-Gaussian filter for thin vessel segmentation, and hybrid active contour model combined with K-means clustering for thick vessel segmentation. They are then integrated to generate final segmentation results.The proposed method is validated on abdominal computed tomography angiography (CTA) images, and obtainsan average accuracy, sensitivity, specificity, Dice, Jaccard, and RMSD of 98.2%, 68.3%, 99.2%, 73.0%, 66.1%,and 2.56mm, respectively. Experimental results show that our method is capable of segmenting complex livervessels with more continuous and complete thin vessel details, and outperforms several existing 3D vessel seg-mentation algorithms.
1. Introduction
Liver vessel segmentation from abdominal computed tomographyangiography (CTA) images is an essential and key step for liver-relateddisease diagnosis and therapy, liver transplantation, as well as liver-tumor resection [1]. However, influenced by the significant noise, par-tial volume effects, various vessel sizes, and especially by inhomogeneousintensity distribution and highly ramified branches, accurate segmenta-tion of liver vessels from abdominal CTA images is a challenging task. Infact, accurate vessel segmentation in clinical practice usually relies on themanual delineation by radiologists on each CTA slice, which is extremelytedious and time-consuming. Thus, automatic or semi-automatic seg-mentation of liver vessels gains increasing attention.
Usually, three-dimensional (3D) vessels in medical images can bemodeled as tubular structures, whose cross-sections can be described asasymmetrical circular or elliptic shape [2]. Based on this geometricstructure, many efforts have been made for 3D vessel segmentationincluding active contour model/level set-based [3–8] and graphcuts-based techniques [9,10].
Shang et al. [3] described a region competition-based active contour
cience and Engineering, Central [email protected] (Y.-q. Zhao).
4form 20 April 2018; Accepted 20.
mode exploiting a Gaussian mixture model for the segmentation of thickvessels, and introduced a vascular vector field to drive the active contourinto thin and weak vessels. This method is effective in various vesselsegmentation. Cheng et al. [4] developed an active contour frameworkfor vessel segmentation. It starts with an axis tracking technique to detectvessel cross-section, and then applies a B-snake model for boundaryrefinement. With the shape and size constrains on the cross-section ofvessels, this method is able to accurately segment healthy vessels. InRef. [5], Wo�zniak et al. employed a multi-scale Frangi filter and animproved level set method for 3D vessel tree segmentation. In theirmethod, a vessel force generated by Frangi filter is introduced to the levelset formation, which enables the contour to move toward vesselboundaries actively and finds more vessel branches. Lu et al. [6] pro-posed a variational level set method for liver vessel segmentation, whichfirst adopts a K-means clustering to select seed points and extracts vesselfeatures from these seed points, and then uses a variational level setcombined with bias correction for vessel segmentation. Zhao et al. [7]adopted a region-based active contour model combined with aphase-field method and statistical information for vessel networkextraction. This method shows satisfying segmenting results when the
outh University, Changsha, 410083, China.
April 2018

Fig. 1. Flowchart of liver vessel segmentation.
Y.-z. Zeng et al. Computers in Biology and Medicine 97 (2018) 63–73
vessel regions and background are separated in maximum intensityprojection (MIP) image. Based on an analysis of the intensity distributionof magnetic resonance angiography (MRA) images, Gao et al. [8] con-structed a statistical model and applied a fast level set method combinedwith region and gradient information to segment cerebrovascular vessels.Generally, the active contour model can provide a satisfying result for thehigh-contrast image, but the performance may be limited when handlingthe object with serious inhomogeneity.
Recently, graph cuts algorithm has been widely applied in medicalimage segmentation for its efficient computation to the global optimalsolution. Bauer et al. [9] applied a medialness filter together with heightridge traversal method to generate vessel prior which is then incorpo-rated into graph cuts for the segmentation of 3D vessels. Their methodwas verified to be robust to separate different vessel systems and effectiveto determine the surface of tubular structures. Esneault et al. [10]introduced a 3D geometrical moment-based detector of cylindricalshapes to detect tubular structure, followed by graph cuts for liver vessel
Fig. 2. Results of anisotropic diffusion filtering with different gradient modulus thrfiltering results with κ equal to 10, 40, 70, 80, and 90, respectively.
64
segmentation, and their experiments on the medical CTA images show agood segmenting ability. Sangsefidi et al. [11] defined a balanced dataterm of graph cuts to improve segmentation of hepatic vessels. They usedvessel centerlines to estimate the local data term, which can be applied tobalance the total energy in small vessels and low-contrast regions. InRef. [12], the graph cuts is coupled with oriented flux measure andheight ridge traversal to perform the segmentation and identification ofliver vessels. This method works well on the high-contrast CTA images,and the effective extraction of centerline made it adaptive to variousvessel structures. The drawbacks of [12] are its long computing time andsensitivity to image contrast.
Besides, Law and Chung [13] proposed a physics-based deformablesurface model for vessel segmentation by reducing the influence of in-tensity contrast fluctuations along blood vessels. An extreme learningmachine (ELM) algorithm was employed by Zeng et al. [14] for livervessel segmentation beginning with four 3D vessel filters including Sato,Frangi, medialness, and strain energy to extract vessel features, followedby an ELM to recognize liver vessels from the background. Consideringthe equal distances from vessel centerline to the edges, Foruzan et al.[15] defined a medial-axis enhancement filter according to the eigen-values of the Hessian matrix, and applied a dynamic thresholding forvessel segmentation from the noisy CT image. Yang et al. [16] firstlyapplied empirical threshold intervals to extract seed points, and thenpreformed a region growing method integrated in insight segmentationand registration toolkit (ITK) for vessel segmentation. This method canseparate hepatic and port veins, however, requires manual selection ofoptimal segmentation result from six vessel candidates generated fromdifferent threshold intervals. Marcan et al. [17] adopted the Frangi filterand region growing to segment hepatic vessels, which receives anaverage sensitivity of 93.68% on magnetic resonance images (MRI).
These aforementioned methods receive satisfactory segmentationresults for most of 3D vessels; however, to the best of our knowledge, fewmethods consider the elongated and inhomogeneous structures of thinvessels with low contrast. In this paper, we propose an automatic livervessel segmentation method using 3D region growing and hybrid active
esholds. (a) The MIP of original liver vessel image, and (b)–(f) are the MIPs of

Fig. 3. Vessel detecting results of bi-Gaussian filter with different scale ranges [σmin, σmax]. (a) Original liver vessels image, and (b) through (d) detection results withdifferent scale ranges of [1,2] [1,4], and [1,7], respectively.
Y.-z. Zeng et al. Computers in Biology and Medicine 97 (2018) 63–73
contour model. First, an anisotropic diffusion filter is used to removenoise while preserving vessel boundaries. Then, according to vesselgeometrical structure, a bi-Gaussian filter together with a 3D regiongrowing is adopted for thin-vessel segmentation. Next, based on ananalysis of intensity distribution for liver vessels, a combination of K-means clustering and hybrid active contour model is used for automaticsegmentation of thick vessels. Finally, both of the thin and thick vesselsare integrated to generate the final liver vessel segmentation result. Aflowchart of our method is shown in Fig. 1.
The remainder of this paper is organized as follows. Section 2 de-scribes the details of the proposed method for liver vessel segmentation.In Section 3, the experiments and results are presented. Section 4 gives adiscussion, and Section 5 concludes the paper.
2. Methodology
Due to the limitation of imaging techniques of CT scans, the CTAimages are inevitably contaminated by noise. In addition, to reduceharmful radiation effects of x-rays, the CT scans usually work with lowtube voltage, which also leads to the increasing of noise. Therefore, anonlinear anisotropic diffusion filter described in Refs. [12] and [18] isfirstly applied to smooth noise while reserving vessel boundaries, thentwo different strategies are respectively used for the thin and thick vesselsegmentation. For the anisotropic diffusion filter, the parameter ofgradient modulus threshold κ is considered as an important sensitiveparameter and should be chosen carefully. To obtain an optimalthreshold κ, Fig. 2 shows the MIPs of filtering results with different κs. Asobserved, a small κ is unable to deal with the liver vessel imagecontaminated by significant noise, while a large one will lead to a slightlyblurring of the vessel boundary. In our experiments, a default value κ ¼70 can keep a better balance between noise filter and boundary preser-ving for significantly noise-corrupted liver vessel images.
2.1. Thin vessel segmentation
Usually, the thin vessels in CTA images suffer from low contrast andblurring edges and therefore, traditional intensity- and gradient-basedalgorithms, such as the K-means and level set, often fail to segmentthese vessels. To solve these problems, a thin-vessel segmentationmethod is proposed based on an analysis of the geometric structure ofliver vessels, which first utilizes a bi-Gaussian filter to detect the thinvessels, and then a 3D region growing algorithm for segmentation.
To detect vessel structure, typical vessel filters usually rely on a scaledHessian matrix to describe vessel geometry, such as Frangi and medial-ness filters. As is well known, the Hessian matrix usually involves aconvolution operation on the image and second-order derivative ofGaussian kernel [19–21]. However, the Gaussian kernel will lead to theblurring of object boundaries and undesired merging of adjacent objectsbecause of its adopting a single scale on both foreground and back-ground. To deal with the disturbance from adjacent objects, a bi-Gaussian
65
kernel is presented by merging two traditional Gaussian kernels withdifferent scales [19], and is defined as:
BGðσ; σb; xÞ ¼
8>>>><>>>>:
k⋅Gðσb; x� σb þ σÞ; x � �σ
Gðσ; xÞ þ e�1=2ffiffiffiffiffi2π
p�σbσ� 1
� 1σ; jxj < σ
k⋅Gðσb; xþ σb � σÞ; x � σ
(1)
where σ and σb are the foreground and background scales, Gðσ; xÞ theGaussian kernel with the mean 0 and variance σ, Gðσb; x � ðσb � σÞÞ theGaussian kernels with themean�ðσb � σÞ and variance σb, and k ¼ σ2b=σ
2
is set as 0.2 in this paper.Once the bi-Gaussian kernel is determined, the vessel structure can be
described in terms of the eigenvalues of Hessian matrix HðIBGðσ; xÞÞ,where IBGðσ; xÞ is the convolution result of BGðσ; σb; xÞ and IðxÞ, IBGðσ;xÞ¼ BGðσ;σb;xÞ�IðxÞ, and H the Hessian matrix. Assuming the eigenvaluesλi;σ (i ¼ 1; 2; 3) of H are sorted in order, say
��λ1;σ�� � ��λ2;σ�� � ��λ3;σ��, abright vessel structure will satisfy λ1;σ � λ2;σ � 0 and λ3;σ � 0. Accordingto the distribution of eigenvalues, the bi-Gaussian filter [19] is defined as:
VBGðσ; xÞ ¼
8><>:
�λ2;σλ1;σ
⋅ðλ2;σ þ λ1;σÞ;Xi¼3
i¼1λi;σ < 0
0; otherwise
(2)
where the ratio of λ2;σ to λ1;σ is used to punish deviation from the tubularcenter, and the sum of the two eigenvalues (i.e., λ2;σ and λ1;σ) defining thevessel cross-section is applied to measure the strength of vessel structure.
Considering the variety of vessel radii, a multi-scale framework isused to obtain the maximum response of vessels with various sizes:
φBGðxÞ ¼ maxfVBGðσ; xÞ; σmin � σ � σmaxg (3)
where σmin and σmax represent the minimum and maximum scales,respectively, determining the scale range of vessels to be detected.
To better describe the impact of scale ranges on vessel detection,Fig. 3 gives the detecting results performed by multi-scale framework,where Fig. 3 (a) is an original liver vessel image obtained by previousworks [22,23], and Fig. 3(b)-(d) show the detecting results of bi-Gaussianfilter with different scale ranges [σmin, σmax] of [1,2] [1,4], and [1,7],respectively. Here, the visualization of 3D vessel images is implementedin MeVisLab [24], using the volume rendering mode. As observed, awider scale range of [σmin, σmax] is beneficial to detect vessels withdifferent scales, but also leads to a relatively weaker response of thinvessels, i.e., a smaller ratio of the intensity of thin vessels to that of thickones. In this section, as we mainly focus on the detection of thin vessels,the scale range of [σmin, σmax] is set to a narrow one covering most of theradii of thin vessels, instead of a wide one covering all possible radii ofvessels as traditional vessel detection methods do.
To efficiently segment thin vessels, a 3D region growing algorithm isthen applied on the bi-Gaussian filter detected image. First, the voxels

Fig. 4. Influence of salce range [σmin, σmax] on 3D region growing. (a)–(c) Segmentation results of Fig. 3(b)–(d), respectively.
Fig. 5. K-means clustering results of Fig. 3(a). (a)–(c) Clustering results with clustering centers of 2.10, 45.90, and 160.73, respectively.
Y.-z. Zeng et al. Computers in Biology and Medicine 97 (2018) 63–73
with their intensities ranked in the top 2% of the whole image areselected as the seed points. Then, if a voxel xns belonging to the neigh-borhood of seed voxel xs meets the similarity criterion,
��φBGðxns Þ �φBGðxsÞ
�� < thdiff and φBGðxns Þ > thlow, it is added to the object and set as anew seed voxel, where the thresholds thdiff and thlow are set as 5 and 20 inthis paper. The procedure stops until no more voxels satisfy the similaritycriterion. In this way, we can obtain thin vessels efficiently. To furtheranalyze the influence of salce range [σmin, σmax] on segmentation per-formance, Fig. 4(a)-(c) give the corresponding segmentation results ofFig. 3(b)-(d). As seen in Fig. 4, the narrowest scale range [σmin, σmax] caneffectively segment most of the thin vessels, even if some of them sufferfrom low contrast and blurring boundaries. With the increasing of scalerange, the segmentation performance of thin vessels will graduallydecrease. Therefore, the scale range [σmin, σmax] is set as [1,2] for clinicalCTA data set, and Fig. 4(a) shows corresponding thin-vessel segmenta-tion result.
Fig. 6. Thick liver vessel segmentation results by active contour mode
66
2.2. Thick vessel segmentation
In this section, a thick-vessel segmentation method is proposed basedon K-means clustering and hybrid active contour model. Generally, theactive contour model requires an initial segmentation for contour evo-lution and therefore, a K-means clustering method [25] is performed togenerate this initial segmentation. To balance clustering performanceand computing time, the cluster number of K-means is set as 3 in ourexperiments. Fig. 5(a)-(c) show the clustering results of Fig. 3(a), whoseclustering centers are sorted in an ascending order as 2.10, 45.90, and160.73, respectively, and they are intuitively corresponding to thebackground, transition region (from background to thick vessels), andthick vessels, respectively. According to the vessel prior in CTA image,the intensities of the thick vessels are relatively higher than the back-ground and the transition region, and thus we choose the clustering resultwith maximal clustering center as the initial thick vessels, as shown inFig. 5(c).
l with different μ values of (a) 25, (b) 35, and (c) 60, respectively.

Fig. 7. 3D structuring element for erosion operation. It is composed of three3 3 matrices in a symmetrical spatial structure, in which “0” and “1” are thevalues of structuring element.
Y.-z. Zeng et al. Computers in Biology and Medicine 97 (2018) 63–73
2.3. Boundary refinement with hybrid active contour model
Compared with the edge- and region-based active contour model,such as the geodesic active contour (GAC) model and Chan-Vese (CV)model, the hybrid active contour model is more effective to deal with theboundary leakage and intensity inhomogeneity [26]. Therefore, we applyit for the boundary refinement of thick vessels, and its energy function isdefined as:
EðΦÞ ¼ �α1∫Ω
ðI � μÞHðΦÞdΩþ α2∫Ω
gjrHðΦÞjdΩ (4)
where α1 and α2 are the region and boundary weight coefficients,respectively, Φ is the closed contour (or surface in 3D), Ω the imagedomain, μ the lower bound of the intensity in target object, g ¼ 1
1þjrIj2 is
the positive decreasing function, and HðΦÞ is the Heaviside functiondefined as
HðΦÞ ¼�0; Φ < 01; Φ � 0
(5)
According to the theory of gradient descent flow, the partial differ-ential equation (PDE) of the evolution contour is expressed as:
∂Φ∂t ¼ δðΦÞ
�α1ðI � μÞ þ α2div
�grΦ
jrΦj
(6)
Fig. 8. Thick liver vessel segmentation by hybrid active contour model with μ obtainerow their corresponding segmentation results.
67
where δðΦÞ is a Dirac function with δðΦÞ ¼ dHðΦÞ=dΦ.In Eq. (4), μ is a key parameter significantly affects the segmentation
performance. To give an intuitive understanding, Fig. 6(a)–(c) show thesegmentation results of thick liver vessels for Fig. 3(a) with different μvalues of 25, 35, and 60, respectively. As observed, a smaller μ valueeasily leads to serious over-segmentation, as shown in Fig. 6(a), wheremany intertwined or parallel vessels belonging to different vessel systemsare mistakenly classified into one vessel system. On the contrary, a largerμ value results in the loss of many vessel branches, as shown in Fig. 6(c).
To optimize the parameter μ, vessel prior in CTA images is consid-ered. As stated early, the intensities of the thin vessels are lower thanthose of the thick vessels, and the similar situation exists between vesselboundaries and their centers. That is, the intensities of thin-vesselboundaries are the lowest among the whole liver vessels, and there-fore, they can be used to estimate the parameter μ.
To obtain the intensity information of thin-vessel boundaries, amorphology method is firstly adopted to extract the boundary voxelsfrom thin-vessel segmentation result. Let A be the thin-vessel segmen-tation result by bi-Gaussian filter combined with 3D region growing, andβðAÞ be the boundary voxels of thin vessels A, βðAÞ can be expressed as
βðAÞ ¼ A� ðAΘBÞ (7)
where Θ represents the erosion operation, and B is a 3D structuringelement composed of three 3 3 matrices in a symmetrical spatialstructure, as shown in Fig. 7, in which “0” and “1” are the values ofstructuring element. As βðAÞ may include noise with high intensity andsome non-thin-vessel-boundary voxels, to maximally exclude these vox-els, we only consider the voxels in βðAÞ with their intensities in range[Imin,Imax], and use their mean intensity to specify the parameter μ. Bysorting voxels in βðAÞ in an ascending order of their intensities, Imin andImax are set as the intensities with associated voxels ranked in the top 10%and top 40%, respectively, i.e., Imin ¼ Iðx0:1⋅NðβÞÞ, and Imin ¼ Iðx0:4⋅NðβÞÞ,where NðβÞ is the voxel number in βðAÞ, x0:1⋅NðβÞ and x0:4⋅NðβÞ representthe indices in the ordered voxel set.
Next, a hybrid active contour model is applied to refine the vesselboundaries of thick vessels, in which the vessel segmented by K-meansclustering is set as the initial contour and the weigh coefficients α1 and α2are respectively set as 0.1 and 0.2 in this paper. Fig. 8 shows an exampleof boundary refinement, where the first row is the original liver vesselimages, and their corresponding boundary refinement results are given in
d by our method. The first row is the original liver vessel images and the second
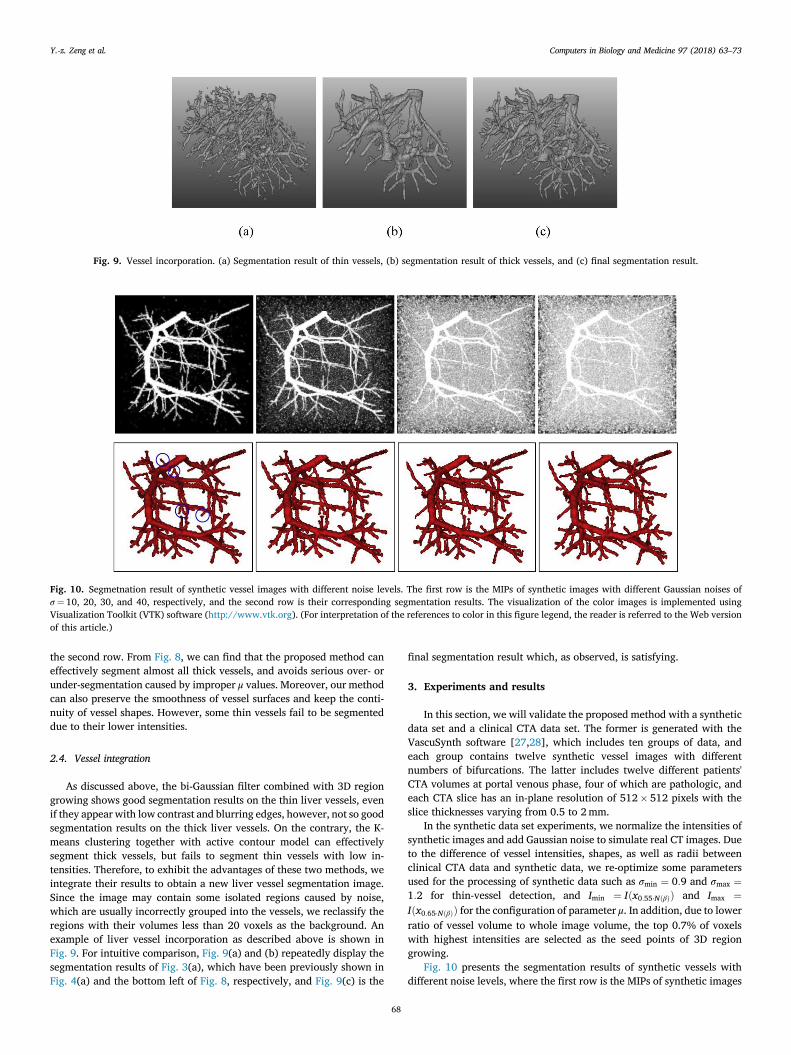
Fig. 9. Vessel incorporation. (a) Segmentation result of thin vessels, (b) segmentation result of thick vessels, and (c) final segmentation result.
Fig. 10. Segmetnation result of synthetic vessel images with different noise levels. The first row is the MIPs of synthetic images with different Gaussian noises ofσ ¼ 10, 20, 30, and 40, respectively, and the second row is their corresponding segmentation results. The visualization of the color images is implemented usingVisualization Toolkit (VTK) software (http://www.vtk.org). (For interpretation of the references to color in this figure legend, the reader is referred to the Web versionof this article.)
Y.-z. Zeng et al. Computers in Biology and Medicine 97 (2018) 63–73
the second row. From Fig. 8, we can find that the proposed method caneffectively segment almost all thick vessels, and avoids serious over- orunder-segmentation caused by improper μ values. Moreover, our methodcan also preserve the smoothness of vessel surfaces and keep the conti-nuity of vessel shapes. However, some thin vessels fail to be segmenteddue to their lower intensities.
2.4. Vessel integration
As discussed above, the bi-Gaussian filter combined with 3D regiongrowing shows good segmentation results on the thin liver vessels, evenif they appear with low contrast and blurring edges, however, not so goodsegmentation results on the thick liver vessels. On the contrary, the K-means clustering together with active contour model can effectivelysegment thick vessels, but fails to segment thin vessels with low in-tensities. Therefore, to exhibit the advantages of these two methods, weintegrate their results to obtain a new liver vessel segmentation image.Since the image may contain some isolated regions caused by noise,which are usually incorrectly grouped into the vessels, we reclassify theregions with their volumes less than 20 voxels as the background. Anexample of liver vessel incorporation as described above is shown inFig. 9. For intuitive comparison, Fig. 9(a) and (b) repeatedly display thesegmentation results of Fig. 3(a), which have been previously shown inFig. 4(a) and the bottom left of Fig. 8, respectively, and Fig. 9(c) is the
68
final segmentation result which, as observed, is satisfying.
3. Experiments and results
In this section, we will validate the proposed method with a syntheticdata set and a clinical CTA data set. The former is generated with theVascuSynth software [27,28], which includes ten groups of data, andeach group contains twelve synthetic vessel images with differentnumbers of bifurcations. The latter includes twelve different patients'CTA volumes at portal venous phase, four of which are pathologic, andeach CTA slice has an in-plane resolution of 512 512 pixels with theslice thicknesses varying from 0.5 to 2mm.
In the synthetic data set experiments, we normalize the intensities ofsynthetic images and add Gaussian noise to simulate real CT images. Dueto the difference of vessel intensities, shapes, as well as radii betweenclinical CTA data and synthetic data, we re-optimize some parametersused for the processing of synthetic data such as σmin ¼ 0:9 and σmax ¼1:2 for thin-vessel detection, and Imin ¼ Iðx0:55⋅NðβÞÞ and Imax ¼Iðx0:65⋅NðβÞÞ for the configuration of parameter μ. In addition, due to lowerratio of vessel volume to whole image volume, the top 0.7% of voxelswith highest intensities are selected as the seed points of 3D regiongrowing.
Fig. 10 presents the segmentation results of synthetic vessels withdifferent noise levels, where the first row is the MIPs of synthetic images

Fig. 11. Segmetnation results of different vessel structures. The first row is the MIPs of synthetic images with noise level equal to 0.1, and the second row shows theircorresponding segmentation results.
Y.-z. Zeng et al. Computers in Biology and Medicine 97 (2018) 63–73
with different Gaussian noises of σ ¼ 10, 15, 20, and 25, respectively, andthe second row is their corresponding segmentation results. As observedfrom the first image of the second row in Fig. 10, both of the thin andthick vessels can be effectively segmented from the images with lowernoise level. With the increasing of noise, some thin vessels fail to besegmented, but the thick vessels can be still correctly segmented.
To illustrate the effectiveness of the proposed method on differentvessel structures, we conduct experiments on these 120 synthetic vesselimages with noise level equal to 0.1, and Fig. 11 shows four typical im-ages and their corresponding segmentation results. As observed, exceptfew vessel branches labeled by blue arrows fail to be extracted, most ofthe vessels can be accurately segmented. For quantitative analysis, theDice overlap and Jaccard measures are used to assess the segmentationperformance, and our method obtains an average Dice overlap and Jac-card of 86.50% and 76.31%, respectively, which are very close to those ofthe recent vessel segmentation methods with average values of 86.76%and 76.61% [11]. Thus, we can conclude that the proposed method is aneffective automatic vessel segmentation method.
For clinical CTA images, the detailed parameters are set as the defaultvalues listed in the methodology section. Fig. 12 presents four differentoriginal liver vessel images and their corresponding segmentation resultsby the methods in Refs. [14] [29], and the proposed method, respec-tively. As observed, compared with the methods in Refs. [14] and [29],the proposed method can segment more thin vessels despite the presenceof weak boundaries and low contrast between thin vessels and liver pa-renchyma, as shown in the closed blue circles in the last row of Fig. 12.This is mainly because the bi-Gaussian filter can effectively highlight thinvessels while suppressing the background by constraining the scale rangeof multi-scale framework. In addition, due to effective exploitation ofboth intensity and gradient information of thick vessels, the proposedmethod also segments the thick vessels more accurately than the othertwo methods.
To compare the segmentation performance of the proposed methodunder the influence of low contrast, an example of liver vessel segmen-tation is given in Fig. 13, where Fig. 13(a)-(b) are the original liver vesselimges with low contrast, Fig. 13(c)-(d) are their corresponding segmen-tation results. Compared with the high contrast CTA volumes shown inFig. 12, the proposedmethod segments fewer vessel branches due to theirobviously lower contrast, but still performs well for the vessels with their
69
intensities slightly higher than those of the background.To further evaluate the segmentation performance, a professional
radiologist is invited to guide the generation of the ground truth of livervessels. First, a trained operator is asked to delineate the initial livervessels with the help of ITK-SNAP tool (http://www.itksnap.org/pmwiki/pmwiki.php), and then, we correct the delineated results sliceby slice under the guidance of the radiologist. Besides Dice overlap andJaccard, three commonly-used evaluation measurements including ac-curacy, sensitivity, and specificity, as well as Root Mean Square Sym-metric Surface Distance (RMSD) are introduced to indicate thesegmentation performance, where RMSD is defined as:
RMSD ¼ffiffiffiffiffiffiffiffiffiffiffiffiffiffiffiffiffiffiffiffiffiffiffiffiffiffiffiffiffiffi
1jSðAÞj þ jSðBÞj
s
ffiffiffiffiffiffiffiffiffiffiffiffiffiffiffiffiffiffiffiffiffiffiffiffiffiffiffiffiffiffiffiffiffiffiffiffiffiffiffiffiffiffiffiffiffiffiffiffiffiffiffiffiffiffiffiffiffiffiffiffiffiffiffiffiffiffiffiffiffiffiXP2SðAÞA
d2ðpA; SðBÞÞ þXP2SðBÞB
d2ðpB; SðAÞÞs
(8)
where A and B represent voxel sets of the segmented and truth livervessel regions, S(A) and S(B) are the sets of the vessel surface voxels of Aand B, respectively, j j is the voxel number, and d (p,S) is the shortestdistance of a set S. Usually, the lower the RMSD, the better the seg-mentation result.
Table 1 shows the segmentation performances on these twelve pa-tients' CTA volumes. It can be found that the average segmentation ac-curacy, sensitivity, specificity, Dice, Jaccard, and RMSD of our methodreach 98.1%, 68.3%, 99.2%, 73.0%, 66.1%, and 2.56mm, respectively.The accuracy and specificity of the proposed method are very close tothose of the methods in Refs. [14] [29], and [30], whereas our methodobtains obviously higher sensitivity, Dice, and Jaccard than the otherthree methods, which indicates our method is capable of segmentingliver vessels effectively. Note that the average RMSD of our method is alittle bigger than that of method in Ref. [14]. The reason is that some thinvessels may be ignored by the trained operator due to the low contrast,but they can be segmented by the proposed method, as shown in Fig. 14,which results in longer distances between the surfaces of segmented andtruth vessels.
There are also some drawbacks in the proposed method. For example,it does not work well for the thick vessels with lower intensities. Asshown in the closed region labeled by a white ellipse in Fig. 15(a), part ofthe thick vessel fail to be segmented (see Fig. 15(b)). This is mainlybecause the hybrid active contour model tends to segment the vessels
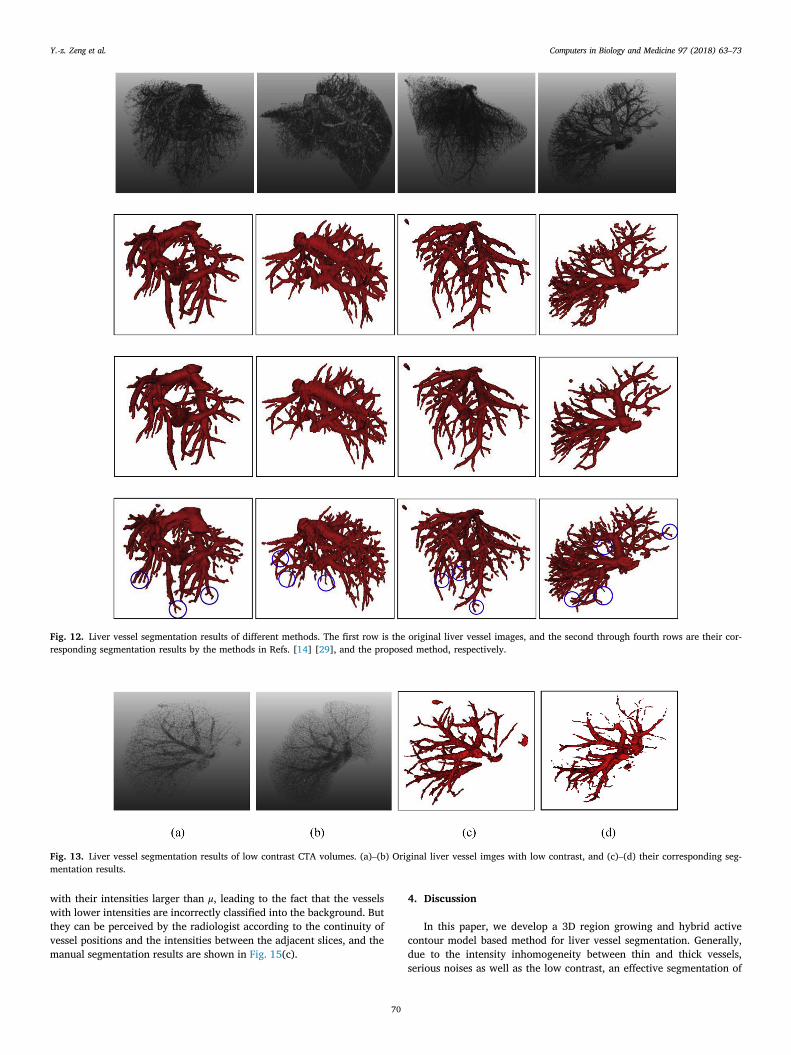
Fig. 12. Liver vessel segmentation results of different methods. The first row is the original liver vessel images, and the second through fourth rows are their cor-responding segmentation results by the methods in Refs. [14] [29], and the proposed method, respectively.
Fig. 13. Liver vessel segmentation results of low contrast CTA volumes. (a)–(b) Original liver vessel imges with low contrast, and (c)–(d) their corresponding seg-mentation results.
Y.-z. Zeng et al. Computers in Biology and Medicine 97 (2018) 63–73
with their intensities larger than μ, leading to the fact that the vesselswith lower intensities are incorrectly classified into the background. Butthey can be perceived by the radiologist according to the continuity ofvessel positions and the intensities between the adjacent slices, and themanual segmentation results are shown in Fig. 15(c).
70
4. Discussion
In this paper, we develop a 3D region growing and hybrid activecontour model based method for liver vessel segmentation. Generally,due to the intensity inhomogeneity between thin and thick vessels,serious noises as well as the low contrast, an effective segmentation of

Table 1Segmentation performances of different methods.
Methods Accuracy Sensitivity Specificity Dice Jaccard RMSD (mm)
Method in Ref. [14] 0.980 0.677 0.994 0.670 0.603 2.27Method in Ref. [29] 0.976 0.657 0.992 0.645 0.554 2.72Method in Ref. [30] 0.970 0.501 0.994 0.540 0.430 3.05Our method 0.981 0.683 0.992 0.730 0.661 2.56
Fig. 14. Comparison between the ground truth and the segmentation result of the proposed method. (a) Original liver vessels, (b) ground truth, and (c) segmentationresult of the proposed method.
Fig. 15. Failed segmentation for thick vessel with lower intensities. (a) Original liver slice, (b) vessel segmentation results of the proposed method, and (c) manualsegmentation results.
Y.-z. Zeng et al. Computers in Biology and Medicine 97 (2018) 63–73
both thin and thick liver vessels is quite difficult. For example, the GACmodel relies on a large propagating coefficient to find more vesselbranches, which easily results in over-segmentation. The graph cuts-based methods usually suffer from the problem of shrinking bias onelongated vessel structures, and the same problem also occurs in level setbased methods [10]. In fact, due to the complex geometrical structuresand intensity distribution, few methods only directly adopt one model oralgorithm for the segmentation of 3D vessels, and thus the combinationor fusion of two or more methods is necessary and considered [3,10,11,14]. Based on this idea, we apply two different strategies to segment bothof the thin and thick vessels.
To deal with the thin vessels with low contrast and blurring bound-aries, a bi-Gaussian filter is used based on the analysis of vessel structure.Unlike classical vessel detection methods, which usually adopt a wide-scale framework covering all possible radii of vessels to generate themaximum response, a bi-Gaussian filter based on a narrow-scale frame-work is adopted to highlight these thin vessels. It can partly overcome theweak response of thin vessels during the procedure of multi-scale opti-mization, as observed in Fig. 3. To avoid manual selection of vessel seeds,an experiential threshold based on vessel prior is performed, followed bya 3D region growing to automatically segment thin vessels. In the thick-vessel segmentation stage, we first adopt a K-means clustering algorithmto yield an initial vessel region, and optimize the parameter μ according
71
to the vessel intensity and position information. Then, by taking advan-tages of region and boundary information of CTA volumes, a hybridactive contour model is used to segment thick vessels. In the end, both ofthin and thick vessels are intergraded to generate the final liver vessels.
The presented method has been evaluated on a synthetic and a clin-ical CTA data set, and the experimental results show that it can effectivelysegment liver vessels, achieving average accuracy, sensitivity, specificity,Dice, Jaccard, and RMSD of 98.1%, 68.3%, 99.2%, 73.0%, 66.1%, and2.56mm, respectively. In addition, our method can segment more thinvessels compared with the methods in Ref. [14], and [29]. Generally, thegood performance of the proposed method is mainly ascribed to theeffective thin-vessel detection by using a narrow scale framework, as wellas optimization of the key parameter μ of hybrid active contour, which isable to accurately driver the active contour to thick-vessel boundaries.
However, there are also some drawbacks in our method. For example,some thick vessels with lower intensities fail to be segmented, which isalso a common problem for other segmentation methods. In addition, thesurface of liver vessels segmented by our method is not so smoothcompared with some existing methods, although a nonlinear anisotropicdiffusion filter is firstly employed to filter image. In the future, we willconsider more vessel priors and develop more effective segmentationschemes to increase the robustness of our method.

Y.-z. Zeng et al. Computers in Biology and Medicine 97 (2018) 63–73
5. Conclusions
This paper presents an effective liver vessel segmentation methodbased on 3D region growing and hybrid active contour model. As theliver vessels in CTA images usually suffer from low contrast, seriousnoise, and intensity inhomogeneity between the thin and thick vessels,two different strategies are adopted for effective segmentation of thesevessels. For thin liver vessel segmentation, a bi-Gaussian filter is appliedto highlight thin vessels based on the selection of narrow scale range inmulti-scale framework, followed by a 3D region growing to segmentthese vessels. For thick liver vessel segmentation, a K-means clusteringalgorithm is first applied to generate the initial thick vessels, and a hybridactive contour model is then used for the boundary refinement accordingto vessel geometric structure and intensity distribution. Finally, both ofthe thin and thick liver vessel segmentation results are integrated togenerate the final liver vessels.
The proposed method does not require any manual selection of seedpoints, and avoids heavy training procedure like the machine learningmethods. The experiments on a clinical CTA data set of portal venousphase show that our method achieves better segmentation performancethan some other 3D vessel segmentation methods in terms of the accu-racy, sensitivity, specificity, Dice, Jaccard, and RMSD. In addition, thesegmentation results of the proposed method contain more thin vesselswith continuous and complete details, even if some of them appear withlow contrast and blurring boundaries, which are very difficult to besegmented by traditional algorithms. Moreover, our method can alsoaccurately segment thick vessels by employing both of their intensity andgradient information.
Conflicts of interest
None Declared.
Acknowledgments
This work is supported by the National Natural Science Foundation ofChina (Grant nos. 61772555, 61379107, 61772556, 61172184, and61702179), China Postdoctoral Science Foundation (Grant no.2012M521554), Program for Hunan Province Science and TechnologyBasic Construction (Grant no. 20131199), Hunan Provincial NaturalScience Foundation of China (Grant no. 2017JJ3091), and ScientificResearch Fund of Hunan Provincial Education Department (Grantno.17C0645).
The authors would like to acknowledge radiological experts Drs. ZhenYang and Tie-xiang Lai for their valuable suggestion and the ground truthestablishment of liver vessels, and thank the anonymous reviewers fortheir valuable suggestions.
References
[1] D. Selle, B. Preim, A. Schenk, H.O. Peitgen, Analysis of vasculature for liver surgicalplanning, IEEE Trans. Med. Imag. 21 (11) (2002) 1344–1357.
[2] C.Y. Xiao, M. Staring, D. Shamonin, J.H.C. Reiber, J. Stolk, B.C. Stoel, A strainenergy filter for 3D vessel enhancement with application to pulmonary CT images,Med. Image Anal. 15 (1) (2011) 112–124.
[3] Y. Shang, R. Deklerck, E. Nyssen, A. Markova, M.J. De, X. Yang, K. Sun, Vascularactive contour for vessel tree segmentation, IEEE Trans. Biomed. Eng. 58 (4) (2011)1023–1032.
[4] Y. Cheng, X. Hu, J. Wang, Y. Wang, S. Tamura, Accurate vessel segmentation withconstrained B-snake, IEEE Trans. Image Process. 24 (8) (2015) 2440–2455.
[5] T. Wo�zniak, M. Strzelecki, A. Majos, L. Stefa�nczyk, 3D vascular tree segmentationusing a multiscale vesselness function and a level set approach, Biocybern. Biomed.Eng. 37 (2017) 66–77.
[6] S. Lu, H. Huang, P. Liang, G. Chen, L. Xiao, Hepatic vessel segmentation usingvariational level set combined with non-local robust statistics, Magn. Reson.Imaging 36 (2016) 180–186.
[7] S. Zhao, M. Zhou, Y. Tian, P. Xu, Z. Wu, Q. Deng, Extraction of vessel networksbased on multiview projection and phase field model, Neurocomputing 162 (C)(2015) 234–244.
72
[8] X. Gao, Y. Uchiyama, X. Zhou, T. Hara, T. Asano, H. Fujita, A fast and fullyautomatic method for cerebrovascular segmentation on time-of-flight (TOF) MRAimage, J. Digit. Imag. 24 (4) (2011) 609–625.
[9] C. Bauer, T. Pock, E. Sorantin, H. Bischof, R. Beichel, Segmentation of interwoven3d tubular tree structures utilizing shape priors and graph cuts, Med. Image Anal.14 (2) (2010) 172–184.
[10] S. Esneault, C. Lafon, J.L. Dillenseger, Liver vessels segmentation using a hybridgeometrical moments/graph cuts method, IEEE Trans. Biomed. Eng. 57 (2) (2010)276–283.
[11] N. Sangsefidi, A.H. Foruzan, A. Dolati, Balancing the data term of graph-cutsalgorithm to improve segmentation of hepatic vascular structures, Comput. Biol.Med. 93 (2017) 117–126.
[12] Y.Z. Zeng, Y.Q. Zhao, P. Tang, M. Liao, Y.X. Liang, S.H. Liao, B.J. Zou, Liver vesselsegmentation and identification based on oriented flux symmetry and graph cuts,Comput. Meth. Progr. Biomed. 150 (2017) 31–39.
[13] M.W. Law, A.C. Chung, A deformable surface model for vascular segmentation, in:Med. Image Comput. Comput.-Assist. Intervention, 2009, pp. 59–67.
[14] Y.Z. Zeng, Y.Q. Zhao, M. Liao, B.J. Zou, X.F. Wang, W. Wang, Liver vesselsegmentation based on extreme learning machine, Phys. Med. 32 (5) (2016)709–716.
[15] A.H. Foruzan, R.A. Zoroofi, Y. Sato, M. Hori, A Hessian-based filter for vascularsegmentation of noisy hepatic CT scans, Int. J. Comput. Assist. Radiol. Surg. 7 (2)(2012) 199–205.
[16] X. Yang, J.D. Yang, P.H. Hong, H.C. Yu, S. Ahn, B.W. Kim, H. You, Segmentation ofliver and vessels from CT images and classification of liver segments forpreoperative liver surgical planning in living donor liver transplantation, Comput.Meth. Progr. Biomed. 158 (2017) 41–52.
[17] M. Marcan, D. Pavliha, M.M. Music, I. Fuckan, R. Magjarevic, D. Miklavcic,Segmentation of hepatic vessels from MRI images for planning of electroporation-based treatments in the liver, Radiol. Oncol. 48 (3) (2014) 267–281.
[18] P. Perona, J. Malik, Scale-space and edge detection using anisotropic diffusion, IEEETrans. Pattern Anal. Mach. Intell. 12 (7) (1990) 629–639.
[19] C. Xiao, M. Staring, Y. Wang, D.P. Shamonin, B.C. Stoel, Multiscale bi-Gaussianfilter for adjacent curvilinear structures detection with application to vasculatureimages, IEEE Trans. Image Process. 22 (1) (2012) 174–188.
[20] K. Krissian, G. Malandain, N. Ayache, R. Vaillant, Y. Trousset, Model-baseddetection of tubular structures in 3D images, Comput. Vis. Image Understand. 80(2) (1999) 130–171.
[21] A. Frangi, W. Niessen, K. Vincken, M. Viergever, Multiscale vessel enhancementfiltering, in: Med. Image Comput. Comput.-Assist. Intervention, 1998, pp. 130–137.
[22] T. Heimann, G.B. Van, M.A. Styner, Y. Arzhaeva, V. Aurich, C. Bauer, A. Beck,C. Becker, R. Beichel, G. Bekes, Comparison and evaluation of methods for liversegmentation from CT datasets, IEEE Trans. Med. Imag. 28 (8) (2009) 1251–1265.
[23] M. Liao, Y.Q. Zhao, X.Y. Liu, Y.Z. Zeng, B.J. Zou, X.F. Wang, F.Y. Shih, Automaticliver segmentation from abdominal CT volumes using graph cuts and bordermarching, Comput. Meth. Progr. Biomed. 143 (2017) 1–12.
[24] I. Bitter, U.R. Van, I. Wolf, L. Ib�a~nez, J.M. Kuhnigk, Comparison of four freelyavailable frameworks for image processing and visualization that use ITK, IEEETrans. Visual. Comput. Graph. 13 (3) (2007) 483–493.
[25] E. Lee, M. Schmidt, J. Wright, Improved and simplified inapproximability for K-means, Inf. Process. Lett. 120 (2017) 40–43.
[26] Y. Zhang, B.J. Matuszewski, L.K. Shark, C.J. Moore, Medical image segmentationusing new hybrid level-set method, in: BioMedical Visualization, 2008. MEDIVIS'08. Fifth International Conference, 2008, pp. 71–76.
[27] G. Hamarneh, P. Jassi, VascuSynth: simulating vascular trees for generatingvolumetric image data with ground-truth segmentation and tree analysis, Comput.Med. Imag. Graph. 34 (8) (2010) 605–616.
[28] P. Jassi, G. Hamarneh, VascuSynth: vascular tree synthesis software, Insight J.(2011) 1–12. January-June.
[29] F. Conversano, R. Franchini, C. Demitri, L. Massoptier, F. Montagna, A. Maffezzoli,A. Malvasi, S. Casciaro, Hepatic vessel segmentation for 3D planning of liversurgery experimental evaluation of a new fully automatic algorithm, Acad. Radiol.18 (4) (2011) 461–470.
[30] E. Smistad, A.C. Elster, F. Lindseth, GPU accelerated segmentation and centerlineextraction of tubular structures from medical images, Int. J. Comput. Assist. Radiol.Surg. 9 (4) (2014) 561–575.
Ye-zhan Zeng received the B.S. degree in 2003, andM.S. degreein 2010 from Hunan Normal University, Changsha, China, andPh.D. degree in 2017 from Central South University, Changsha,China. He is currently a lecturer at Hunan University of Tech-nology. His research interests include computer vision, digitalimage processing and machine learning.

Y.-z. Zeng et al. Computers in Biology and Medicine 97 (2018) 63–73
Sheng-hui Liao received the B.S. degree and Ph.D degree inComputer Science and Engineering from Zhejiang University in2003 and 2008, and continued his research as a postdoctoralresearcher at Zhejiang University. He is currently a professor inthe School of Information Science and Engineering, CentralSouth University, China. His research interests include medicalimage analysis, computer-aided surgery, biomechanicalmodeling and analysis, and machine learning.
Ping Tang received the B.S. degree in 2016 and is currently amaster student in the department of Biomedical Engineering,Central South University. Her research interests include ma-chine learning, deep learning, and medical image processing.
Yu-qian Zhao received the B.S. degree in 1997, M.S. degree in2002, and Ph.D. degree in 2006 from Central South University,Changsha, China, and was awarded New Century ExcellentTalents in University of Education Ministry in China in 2013. Heengaged in postdoctoral research at Xiangya School of Medi-cine, Changsha, China, from July 2007 to July 2009, at NewJersey Institute of Technology, Newark, USA, from July 2009 toJuly 2010, and at National Engineering Research Center ofAdvanced Energy Storage Materials, Changsha, China, fromJuly 2012 to September 2015. He was a visiting Professor in�Ecole Centrale de Lyon, France, from January to February 2015.He is currently a Professor in the School of Information Scienceand Engineering, Central South University, China. His researchinterests include medical image analysis, computer-aided diag-nosis and surgery, medical AI, pattern recognition, computer
vision, video text detection, image forensics, and machinelearning. Email: [email protected].Miao Liao received the B.S. degree in 2010, M.S. degree in2013, and Ph.D. degree in 2016 from Central South University,Changsha, China. She is currently a lecturer at Hunan Universityof Science and Technology. Her research interests includemedical image analysis, computer-aided diagnosis and surgery,medical AI, computer vision, and pattern recognition.
73
Yan Chen received the Ph.D. degree from Loughborough Uni-versity, Loughborough, United Kingdom in 2010. She wasawarded Honorary Member by the president of RCR (RoyalCollege of Radiologists) in 2014 and Honorary Member of theBritish Society of Breast Radiology, the leading internationalmedical imaging conference: SPIE conference committeemember, Winner of the Cum Laude prize for best research at theSPIE Medical Imaging conference (2007 and 2012). The PER-FORMS team, of which she is the Director, was awarded ThePresident's Medal, Institute of Ergonomics & Human Factors(2010), Lord Stafford award for ‘Innovation Achieved’ finalist(2010), Loughborough University's Enterprise Award for Con-sultancy Enterprise (2009), ‘Highly Commended’ Lough-borough University Enterprise award (2015). She is currently anAssociate Professor, the Director of the Applied Vision Research
Center at the Loughborough University, UK. And she is a visitingprofessor in the Central South University (2018–2022), China.Her research interests chiefly concern human performanceevaluations in medical imaging applications and also the Arti-ficial intelligence in Medicine. This currently encompasses theradiological areas of: breast screening (mammography, tomog-raphy, MRI, CESM); prostate cancer imaging (mpMRI), lungcancer imaging and pathology as well as surgical areas of: or-thopaedic and laparoscopic surgery, as well as dental surgicalimaging.Yi-xiong Liang received the B.S. degree in 1999, M.S. degree in2002, and Ph.D. degree in 2005 from Chongqing University,China. Between 2011 and 2012, he was a visitor at the RoboticsInstitute, Carnegie Mellon University. From 2005 to 2007, hewas a Postdoctoral Fellow in Institute of Automation, ChineseAcademy of Science. He is currently an Associate Professor ofComputer Science in Central South University, Changsha,China. His research interests include computer vision and ma-chine learning.