comstar uts 1q2010 corporate presentation final-0
TRANSCRIPT

8/3/2019 Comstar UTS 1Q2010 Corporate Presentation Final-0
http://slidepdf.com/reader/full/comstar-uts-1q2010-corporate-presentation-final-0 1/30
Comstar‐UTSCor orate resentation. 1 2010 results.
Integration Expansion Traditional segment

8/3/2019 Comstar UTS 1Q2010 Corporate Presentation Final-0
http://slidepdf.com/reader/full/comstar-uts-1q2010-corporate-presentation-final-0 2/30

8/3/2019 Comstar UTS 1Q2010 Corporate Presentation Final-0
http://slidepdf.com/reader/full/comstar-uts-1q2010-corporate-presentation-final-0 3/30
p.4
Strategy p.14
.
Appendixes p. 24
Integration Expansion Traditional segment 3

8/3/2019 Comstar UTS 1Q2010 Corporate Presentation Final-0
http://slidepdf.com/reader/full/comstar-uts-1q2010-corporate-presentation-final-0 4/30
Comstar at a Glance
Part of MTS Group (62%)
Revenue2009 – US$ 1,484.8 mln, OIBDA margin2009 – 39.9 %
evenue1Q2010 – . , marg n1Q2010 – .
Over 7.8 million households passed, of which 6.2 million are active subscribers
The leading national broadband provider: ~ 1.4 m n residential broadband subs +
over 2.1 mln residential pay‐TV subs
e ea ng xe ‐ ne te ecommun cat ons prov er or corporates – over . m n act ve nes
>90% of revenues & opex, >80% of capex and 99% of total debt are RUR‐denominated
> 1 mln m of real estate in Moscow
Owner of 25% + 1 share in state‐owned Svyazinvest national fixed line incumbent
Integration Expansion Traditional segment 4
8/3/2019 Comstar UTS 1Q2010 Corporate Presentation Final-0
http://slidepdf.com/reader/full/comstar-uts-1q2010-corporate-presentation-final-0 5/30
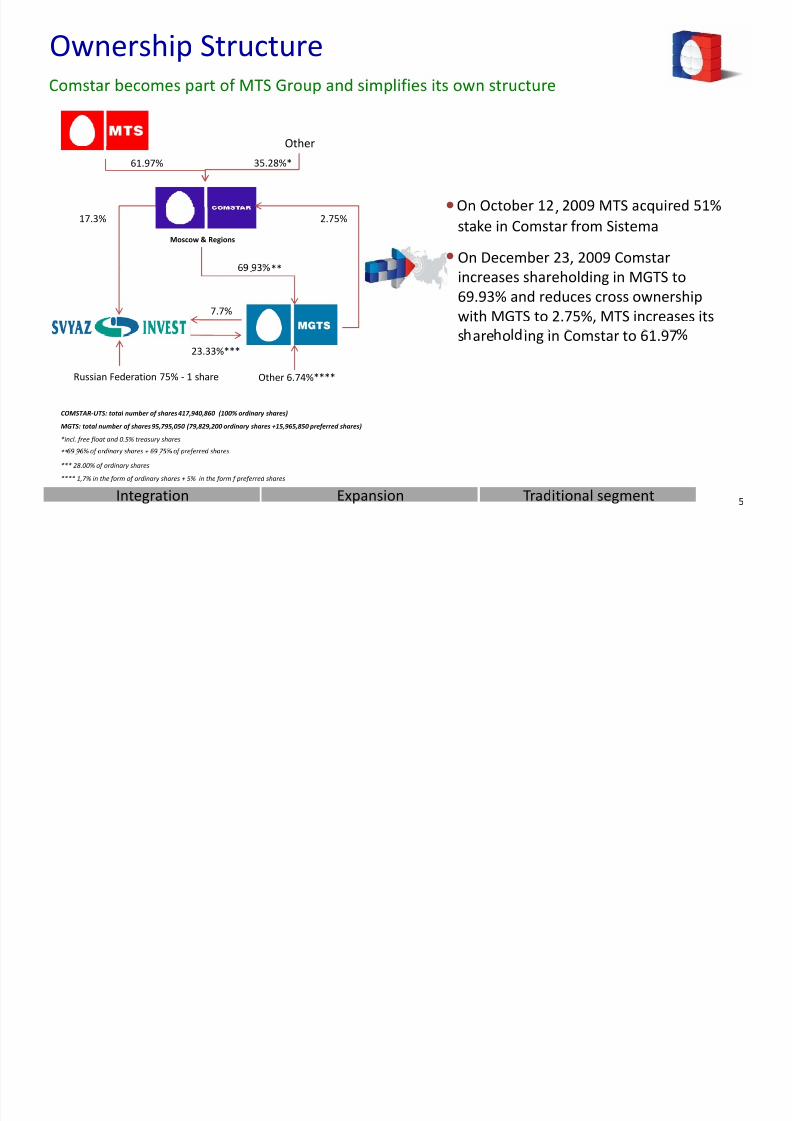
Ownership Structure
Other
•
61.97% 35.28%*
,
stake in Comstar from Sistema
• On December 23, 2009 Comstar
Moscow & Regions
2.75%
**
17.3%
increases
shareholding
in
MGTS
to
69.93% and reduces cross ownership
with MGTS to 2.75%, MTS increases its
.
7.7%
s are o ing in Comstar to 61.9723.33%***
Other 6.74%****Russian Federation 75% ‐ 1 share
COMSTAR‐UTS: total number of shares 417,940,860 (100% ordinary shares)
MGTS: total number of shares 95,795,050 (79,829,200 ordinary shares +15,965,850 preferred shares)
*incl. free float and 0.5% treasury shares
** . .
*** 28.00% of ordinary shares
**** 1,7% in the form of ordinary shares + 5% in the form f preferred shares
Integration Expansion Traditional segment 5

8/3/2019 Comstar UTS 1Q2010 Corporate Presentation Final-0
http://slidepdf.com/reader/full/comstar-uts-1q2010-corporate-presentation-final-0 6/30
Operational Structure
57% of Group revenues STATE HOLDING
Alternative segmentin Moscow
Alternative segmentin regions and CIS
26% of Group revenues 18% of Group revenues
Traditional segmentin Moscow (MGTS)
70 o Group OIBDA
>4.9 mln installed lines:
Comstar owns 25%+1 share
•7ILECs + Rostelecom +
17 o Group OIBDA
>658 th. installed lines
13 o Group OIBDA
>4.1 mln households
•3.6 mln residential
lines, (incl.276 th.
voice+BB users)
+ Central Telegraph
+ 23% in MGTS
•Owner of the “last mile”
•583 th. residential
accounts (incl. 583 th.
premium BB
•2.6 mln residential subs:
• 2.0 mln pay‐TV users
• . corpora e
lines(70 th. accounts)
>90% of lines are ADSL
in the regions
•>35 million installed
lines covering 90% of
,
MGTS infrastructure)•27 th. corporate
accounts
•
426
th.
BB
users•58 th. corporate
accounts
~80% of BB users can get
20 Mb/sec
uss a•>6 000 km fiber
backbone
digital
>11 000 km fiber
Integration Expansion Traditional segment 6

8/3/2019 Comstar UTS 1Q2010 Corporate Presentation Final-0
http://slidepdf.com/reader/full/comstar-uts-1q2010-corporate-presentation-final-0 7/30
1Q2010 results
Q1 2010 Q1 2009 Growth Q4 2009 Growth 12m 2009
Revenues 12,167 11,343 7% 12,133 0% 46,925
(RUR Million)
OIBDA 5,337 4,291 24% 4,847 10% 18,719Margin (%) 43.9% 37.8% 40.0% 39.9%
Operating Income 3,881 2,798 39% 3,175 22% 12,740 . . . .
Net income/(loss) attributable to Comstar
UTS' shareholders
1,794 494 263% (8,821) - (6,518)
Cash Capex 495 2,024 (76%) 800 (38%) 3,889% of Revenues 4.1% 17.8% 6.6% 8.3%
Free CF 3,925 1,436 173% 3,472 13% 10,849
● 7% year on year revenue growth in RUR
• Growing DLD/ILD and fixed‐to‐mobile traffic, increase in MGTS BB subscriber base
• Ongoing up‐selling of regional pay‐TV subscribers to broadband Internet services
• Increase in RUR prices
● 24% year on year OIBDA growth in RUR
● 263% year on year Net Income attributable to Comstar‐UTS’ shareholders growth in RUR
● 173% year on year Free Cash Flow growth in RUR
Integration Expansion Traditional segment 7

8/3/2019 Comstar UTS 1Q2010 Corporate Presentation Final-0
http://slidepdf.com/reader/full/comstar-uts-1q2010-corporate-presentation-final-0 8/30
High profitability and revenue growth
Breakdown of revenues, 1Q2010 Breakdown of OIBDA, 1Q2010
13%
17%Comstar‐UTS
Traditional
Alternative in the re ions57 %
26 %
Alternative in Moscow
*
18%
28,2%32,3%
Q1
,
8%
37,8%
48,2%
18,9%28,2%
Q1
2009211 258
91 110120160
200240
10%
mln
43,9%
,2010
04080
Q1 2009 Q1 2010*Revenue in US$ millions, growth in rubles
*Revenue in US$ millions, growth in rublesIntegration Expansion Traditional segment 8
Stable traditional MGTS business provides sustainable cash flows and high profitability, regionsdrive revenue growth

8/3/2019 Comstar UTS 1Q2010 Corporate Presentation Final-0
http://slidepdf.com/reader/full/comstar-uts-1q2010-corporate-presentation-final-0 9/30
Liquidity
• Operating cash flow RUR 4.4 bln (US$ 148 mln)
1Q 2010 Debt structure as of March 31, 2010
Debt by currency US$ million
• Cash, cash equivalents & short‐term investments RUR 16.0 bln
(US$ 545 mln)
• Cash CAPEX RUR 0.5 bln (US$ 17 mln)
Russian Ruble 973
Euro 5
US Dollar 3
Total debt * 981
• Free cash flow RUR 3.9 bln (US$ 132 mln)
• Total debt RUR 28.8 bln (US$ 981 mln)
• Total RUR debt/OIBDA 1.3
US$,
mln
In the currency of debt,
mln
• Net debt RUR 12.8 bln (US$ 436 mln)
• RUR Net debt/OIBDA of 0.6
er an cre t ne ac ty ,
MTS 1,815 RUR 62Vendor financing 436 RUR 15
Others various 19
*
* RUR/$ = 29.3638 as at March 31, 2010
e repaymen s sc e u e , m n
21 947
1753 353
3 31715 102
6 720
2Q2010 3Q2010 4Q2010 2011 2012 2013 >
2013
Integration Expansion Traditional segment 9

8/3/2019 Comstar UTS 1Q2010 Corporate Presentation Final-0
http://slidepdf.com/reader/full/comstar-uts-1q2010-corporate-presentation-final-0 10/30
Outlook for 2010*
14821648
14852000
,
Mid
single
digit %
mln $ 6%1%
1120
0
500
100032,7%
42,4% 41,8% 39,9% 40%
35%
30%
40%
2006 2007 2008 2009 2010
*Revenue in US$ millions, organic growth in rubles
2006 2007 2008 2009 2010
as , m n
27.4% 23.3% 21.5% 8.1% 20% 10-12% % of Revenues
1 120 1 482 1 648 1 485 1 485 Revenues mln $
Regions152
170156 Others
127 132
68
Moscow
16 26
80
3
1117 50
29
78
eg ons
Development of Broadband DN (incl.
FTTX)
MGTS network upgrade and development
2006 2007 2008 2009 2010 After the end of
digitalization
Integration Expansion Traditional segment 10
8/3/2019 Comstar UTS 1Q2010 Corporate Presentation Final-0
http://slidepdf.com/reader/full/comstar-uts-1q2010-corporate-presentation-final-0 11/30
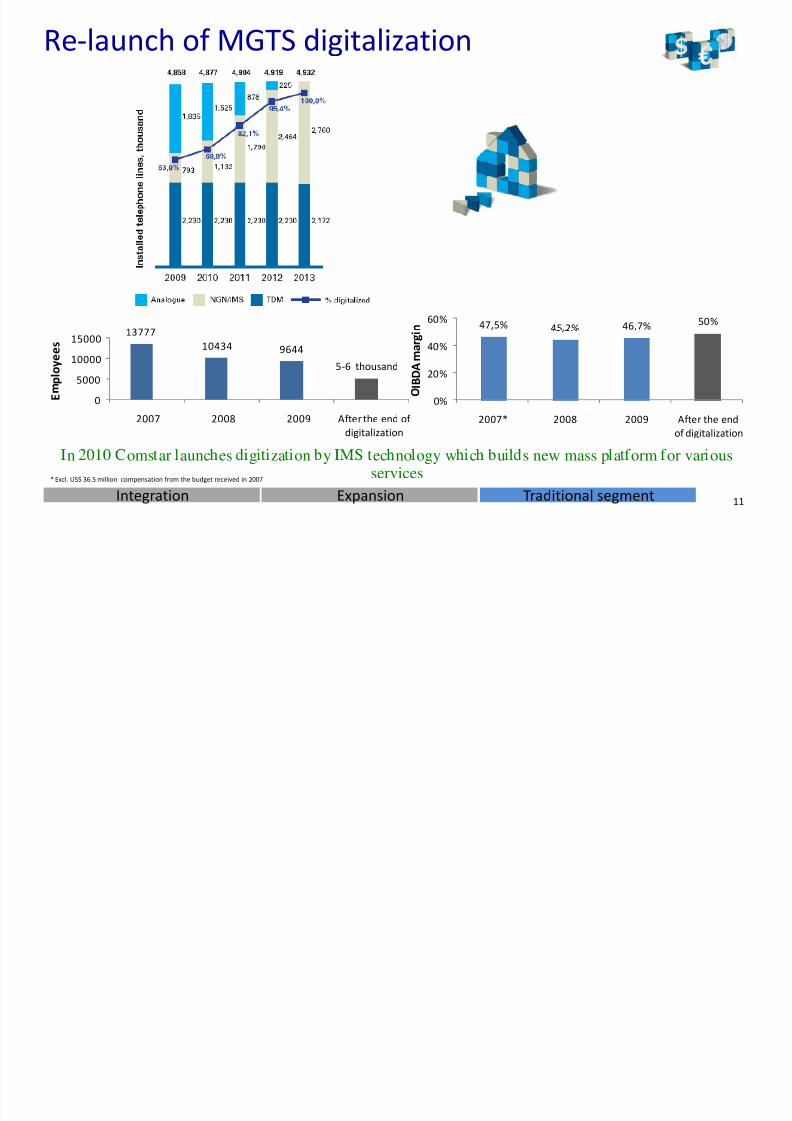
Re‐launch of MGTS digitalization
47,5% 45 2% 46,7% 50%60% n
10434 9644
5‐6 thousand
5000
10000
15000
p
l o y e e s
20%
40%
I B
D A m a r g i
0
2007 2008 2009 After the end of
digitalization
E 0%
2007* 2008 2009 After the end
of digitalization
Integration Expansion Traditional segment 11
n oms ar aunc es g za on y ec no ogy w c u s new mass p a orm or var ous
services* Excl. US$ 36.5 million compensation from the budget received in 2007

8/3/2019 Comstar UTS 1Q2010 Corporate Presentation Final-0
http://slidepdf.com/reader/full/comstar-uts-1q2010-corporate-presentation-final-0 12/30
MGTS real estate potential
Location of the real estate
• 2 1st zone ; 1% 2nd zone ;
.
• 5000 m2 – average size of the building
• –
r zone ;
10%
5th zone
;
• > 50% will be freed up after the end of
digitalization
•∼ US$ 1000 – current selling price/1m2 (office
space class B/C) 4th zone ;
64%
•∼ US$ 430 – current rental rate/1m2
1st zone ‐ Boulevard Ring
2nd zone
‐Garden
Ring
Road
3rd zone ‐ Third Ring Road
4th zone ‐ Moscow Ring Road
5th zone ‐ outside Moscow Ring Road
Integration Expansion Traditional segment 12
After the end of digitalization significant real estate potential will be unlocked

8/3/2019 Comstar UTS 1Q2010 Corporate Presentation Final-0
http://slidepdf.com/reader/full/comstar-uts-1q2010-corporate-presentation-final-0 13/30
Overview p.4
p.14
Broadband p.18
Appendixes p.24
Integration Expansion Traditional segment 13

8/3/2019 Comstar UTS 1Q2010 Corporate Presentation Final-0
http://slidepdf.com/reader/full/comstar-uts-1q2010-corporate-presentation-final-0 14/30
Strategy: “5 Angles of Attack” (2008)
Penetration into the mass market in Moscow
Increasin ARPU in the remium se ment
3K: Comstar → Client → Quality
BB development in the regions
Restructuring of regional operations
2 legal entities : Comstar & MGTS
STRUCTUREBROADBAND MGTSREGIONS SVYAZINVEST
Integration of Stream‐ Ca italizin on
Enhancing existing
operations via
strate ic M&As
ost opt m zat on
increase in efficiency
Regulated tariff increases
Svyazinvest stake
Integration Expansion Traditional segment 14

8/3/2019 Comstar UTS 1Q2010 Corporate Presentation Final-0
http://slidepdf.com/reader/full/comstar-uts-1q2010-corporate-presentation-final-0 15/30
Priorities in crisis (2009)
2009 resultsActions
towards maximizing cash flows and integration of the assets
• Maximizing cash flows
• Optimization of capital investments
• Service the debt
Ensure financial
stabilit
1• RUR 10.8 bln free cash flow
• Cash CAPEX of 8.1% of revenues
• Timel a ment of interest
• Reduction of debt level
2
• Restructuring of terms of Sberbank
loan repayment
Refocus from
expansion
to optimization
• eep an eve op e ex s ng su scr er
base• 3K programme of quality enhancement
‐ ‐
with no promo• 9% y‐o‐y residential BB RUR
ARPU rowth in Moscow‐
VAS
• Ac uisition of re ional o erators
3
• Increase in ownership in MGTS to 70%
from 56%
restructuring
• Restructuring of ownership in Svyazinvest• ecrease n cross‐owners p w t
to 3% from 14%
• Restructuring of ownership in Svyazinvest
‐ ,
financials
Integration Expansion Traditional segment 15

8/3/2019 Comstar UTS 1Q2010 Corporate Presentation Final-0
http://slidepdf.com/reader/full/comstar-uts-1q2010-corporate-presentation-final-0 16/30
Priorities for 2010
Integration with MTS in orderto extract synergies
Aggressive expansion on the Russian market, revenue growth
of cable‐TV and BB assets
2) Green‐field
3) Leadership in corporate segment
1) Re‐branding in alternative
segment
2) Cross‐sales
(excl. SVI)
4) Aggressive development on the
long‐distance market
mass‐market
4) Optimization of expenses
through intercompany
business‐models to create growth potential
outsourcing
5) Streamlining of business‐
processes
Managing traditional segment (MGTS+SVI)
to ensure stable free cash flow generation1) Increase in ownership in MGTS/completion of SVI ownership restructuring
2) Completion of digitalization/IT optimization
3) Strengthen leadership position on the mass‐market broadband
4) Optimization and stabilization of revenues from infrastructure
Integration Expansion Traditional segment 16

8/3/2019 Comstar UTS 1Q2010 Corporate Presentation Final-0
http://slidepdf.com/reader/full/comstar-uts-1q2010-corporate-presentation-final-0 17/30
Overview p.4
.
p.16p.18
Appendixes p.24
Integration Expansion Traditional segment 17

8/3/2019 Comstar UTS 1Q2010 Corporate Presentation Final-0
http://slidepdf.com/reader/full/comstar-uts-1q2010-corporate-presentation-final-0 18/30
Growth in subscriber base is driven by the mass‐market segment (MGTS),
Residential BB market In Moscow
94%100%
ARPU development is driven by the premium segment (Comstar)
Moscow Residential Fixed‐line BB Market, 3Q2009 Broadband penetration, %
83%
74%74%73%71%66%66%
62%61%60%59%57%55%55%52%51%49%45%43%42%
39%38%36%35%
50%
60%
70%
80%
90%
Comstar;
32%Net
by
Net
;
9%
Qwerty; 7%Others; 8%
European
average 55%
31%
23%
0%
10%
20%
30%
Vimpelcom;
Moscow 3Q2009
Direct
Info
OECD Communications Outlook 2008Total
market:
2.6
mn
subsDirect Info
Penetration of BB among MGTS subscriber base, %Comstar residential subscriber base, ‘000
Akado; 23%
BB
+voice
24%Saturation of the market
Active increase in subs
Launch of IPTV
Increasing
speeds
Launch of
140 262 360 651 784 847 860Voice
76%
mass‐market
offering
*
2004 2005 2006 2007 2008 2009 1 2010* incl.
583
thousand
premium
segment
subs
and
276
thousand
mass
‐market
segment
subs
Integration Expansion Traditional segment 18

8/3/2019 Comstar UTS 1Q2010 Corporate Presentation Final-0
http://slidepdf.com/reader/full/comstar-uts-1q2010-corporate-presentation-final-0 19/30
Rationalization of BB model in Moscow
Mass‐market segmentPremium segment
Current
Fixed voice is the main service in the bundleMobile voice is the main service in the bundle
• Fixed voice+BB from MGTS + VAS from Comstar and
MTS (DLD/ILD, IPTV, Wi‐Fi, WiMAX, 3G, mobile voice
etc)
• Mobile voice + ADSL BB+VAS from MTS• One bill from MTS
• Mostly pre‐paid
• Post paid• Direct marketing via MGTS bills• MGTS will start selling 3Mb/sec+•
‐
Integration Expansion Traditional segment 19

8/3/2019 Comstar UTS 1Q2010 Corporate Presentation Final-0
http://slidepdf.com/reader/full/comstar-uts-1q2010-corporate-presentation-final-0 20/30
Scale of regional development
## 2-3 regional BB Player (excl. Svyazinvest)
Vimpelcom5%
Multiregion
3%
Other
14%
Санкт‐Петербург
Svyazinvest
62%R‐Telecom
11%
oms ar‐
5%
Source: Direct-Info, AC&M Consulting, J’son &
Partners, companies’ data
Comstar‐UTS
21%
#1 Player on the regional Pay-TV market
R‐Telecom
10%
Multiregion
Other
57%
8%
Svyazinvest
4%20 Integration Expansion Traditional segment
Excl. satellite TV
20
8/3/2019 Comstar UTS 1Q2010 Corporate Presentation Final-0
http://slidepdf.com/reader/full/comstar-uts-1q2010-corporate-presentation-final-0 21/30
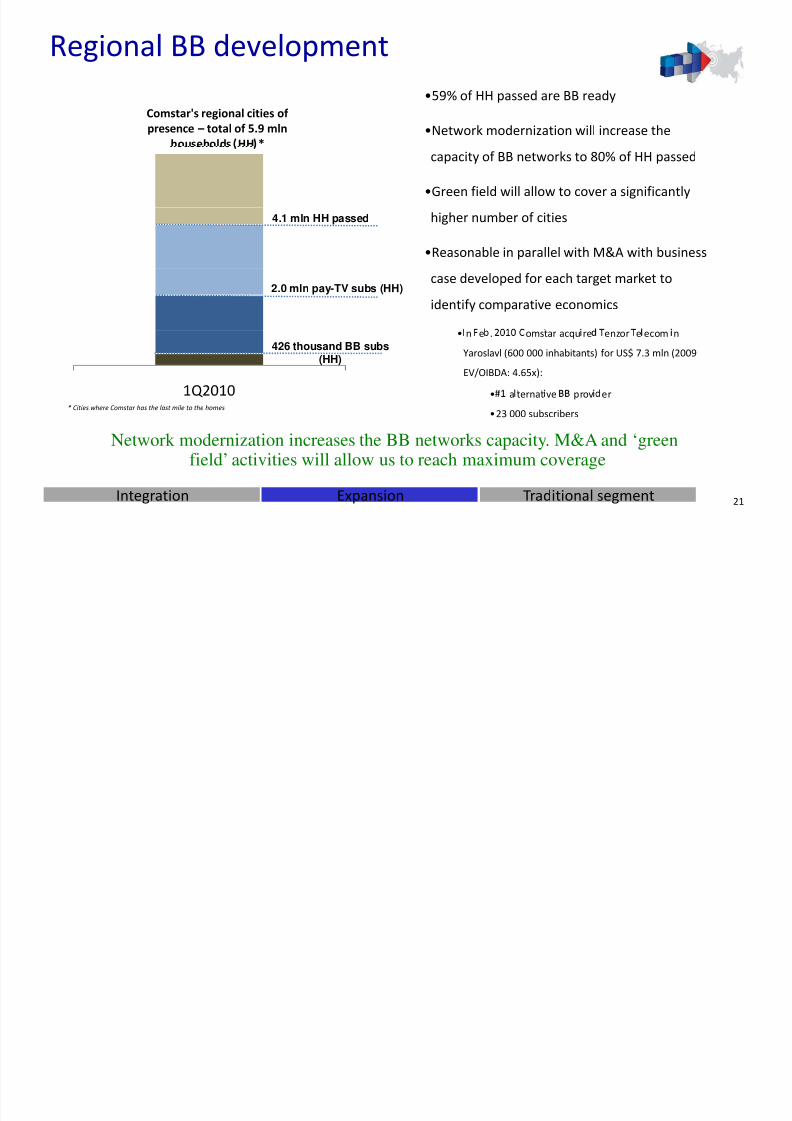
Regional BB development
Comstar's regional cities of
presence – total of 5.9 mln
households HH *
•59% of HH passed are BB ready
•Network modernization will increase the
capacity of BB networks to 80% of HH passed
•Green field will allow to cover a significantly
higher number of cities
•Reasonable in parallel with M&A with business
4.1 mln HH passed
case developed for each target market to
identify comparative economics2.0 mln pay-TV subs (HH)
• n e . omstar acqu re enzor e ecom n
Yaroslavl (600 000 inhabitants) for US$ 7.3 mln (2009
EV/OIBDA: 4.65x):
426 thousand BB subs(HH)
Network modernization increases the BB networks capacity. M&A and ‘green
• a ternat ve prov er
•23 000 subscribers* Cities where Comstar has the last mile to the homes
field’ activities will allow us to reach maximum coverage
Integration Expansion Traditional segment 21

8/3/2019 Comstar UTS 1Q2010 Corporate Presentation Final-0
http://slidepdf.com/reader/full/comstar-uts-1q2010-corporate-presentation-final-0 22/30
Investment Case
National fixed‐line provider with operations in 83 cities of Russia with combined population of >48 mln people
Low exposure to forex risks – all business in RUR
Unique combination of Regulated and non‐regulated business
High profitable incumbent business and growing altnet business
‐ ‐
telecommunication space
Balanced mix of customer types (residential, corporates, operators)
After MTS/SSA deal:
Sell SI stake/Increase the stake in MGTS
+ Branding
+ Backbone
+ Bundling
Integration Expansion Traditional segment 22

8/3/2019 Comstar UTS 1Q2010 Corporate Presentation Final-0
http://slidepdf.com/reader/full/comstar-uts-1q2010-corporate-presentation-final-0 23/30
Contacts
For additional information please visit
. ‐ .
or contact Masha Eliseeva
Head of Investor Relations
E‐mail: ir@comstar‐uts.ru
Integration Expansion Traditional segment 23
8/3/2019 Comstar UTS 1Q2010 Corporate Presentation Final-0
http://slidepdf.com/reader/full/comstar-uts-1q2010-corporate-presentation-final-0 24/30
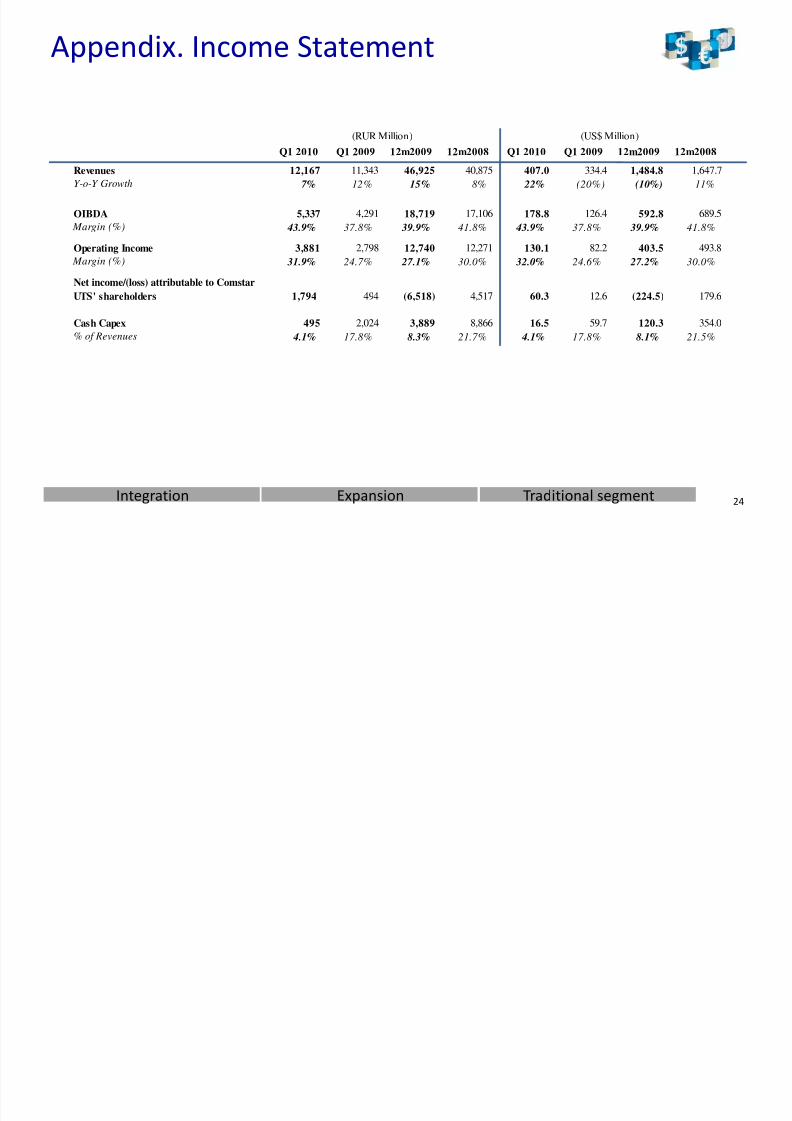
Appendix. Income Statement
(RUR Million) (US$ Million)
Q1 2010 Q1 2009 12m2009 12m2008 Q1 2010 Q1 2009 12m2009 12m2008
Revenues 12,167 11,343 46,925 40,875 407.0 334.4 1,484.8 1,647.7
Y-o-Y Growth 7% 12% 15% 8% 22% (20%) (10%) 11%
OIBDA 5,337 4,291 18,719 17,106 178.8 126.4 592.8 689.5
Margin (%) 43.9% 37.8% 39.9% 41.8% 43.9% 37.8% 39.9% 41.8%
Operating Income 3,881 2,798 12,740 12,271 130.1 82.2 403.5 493.8
Margin (%) 31.9% 24.7% 27.1% 30.0% 32.0% 24.6% 27.2% 30.0%
Net income/(loss) attributable to Comstar
UTS' shareholders 1,794 494 (6,518) 4,517 60.3 12.6 (224.5) 179.6
Cash Capex 495 2,024 3,889 8,866 16.5 59.7 120.3 354.0
% of Revenues 4.1% 17.8% 8.3% 21.7% 4.1% 17.8% 8.1% 21.5%
Integration Expansion Traditional segment 24

8/3/2019 Comstar UTS 1Q2010 Corporate Presentation Final-0
http://slidepdf.com/reader/full/comstar-uts-1q2010-corporate-presentation-final-0 25/30
Appendix. Resilience to FX movements
Revenue breakdown Operating expenses breakdown
10%
10%
RUR >
90%
RUR >
90%
Total debt breakdown CAPEX breakdown
Other
1%
other
20%
RUR >
RUR >
80%
99%
Integration Expansion Traditional segment 25

8/3/2019 Comstar UTS 1Q2010 Corporate Presentation Final-0
http://slidepdf.com/reader/full/comstar-uts-1q2010-corporate-presentation-final-0 26/30
Appendix. Segmental Breakdown
Q1 2010 Q1 2009 12m2009 12m2008 Q1 2010 Q1 2009 12m2009 12m2008
Revenue
Traditional se ment in Moscow MGTS
(RUR Million) (US$ Million)
, , . , .
Alternative segment in Moscow (Comstar & Comstar-Direct) 3,296 3,077 13,178 12,893 110.3 90.7 417.3 519.5
Alternative segment in the regions & CIS (Comstar) 2,186 1,984 8,230 4,109 73.1 58.5 260.5 164.9
Intersegment Sales (1,031) (869) (3,811) (4,282) (34.5) (25.6) (120.9) (172.6)
ota evenue 12,167 11,343 46,925 40,875 407.0 334.4 1,484.8 1,647.7
OIBDA
Traditional segment in Moscow (MGTS) 3,716 3,180 13,680 12,726 124.4 93.8 433.0 513.9
Alternative segment in Moscow (Comstar & Comstar-Direct) 929 582 2,770 3,079 31.2 17.2 87.9 123.4
Alternative segment in the regions & CIS (Comstar) 705 560 2,323 1,400 23.6 16.3 73.4 56.4
Effect of eliminations and other consolidation adjustments (12) (31) (54) (99) (0.4) (0.9) (1.6) (4.1)
Total OIBDA 5,337 4,291 18,719 17,106 178.8 126.4 592.8 689.5
Integration Expansion Traditional segment 26

8/3/2019 Comstar UTS 1Q2010 Corporate Presentation Final-0
http://slidepdf.com/reader/full/comstar-uts-1q2010-corporate-presentation-final-0 27/30
Q1 2010 Q1 2009 Change Q4 2009 Change
Traditional segment in Moscow (MGTS)
Appendix. Operating highlights
Residential
Number of subscribers / active lines (000s ) 3,609 3,595 0% 3,608 0%
incl. BB subscribers 276 160 73% 246 12%
ARPU (RUR) 349 309 13% 335 4%
Number of subscribers (000s) 70 96 -27% 70 1%
incl. BB subscribers 30 33 -7% 32 -4%
ARPU (excl. revenue from points of interconnect) (RUR) 6,468 4,457 45% 6,485 0%
Alternative segment in Moscow
Residential subscribers
Number of subscribers (000s) 583 666 -12% 607 -4%
incl. BB subscribers 583 635 -8% 601 -3%
ARPU (RUR) 527 367 44% 549 -4%
Corporate subscribers
Number of subscribers (000s) 27 30 -8% 27 2%
incl. BB subscribers 15 18 -18% 15 -2%
ARPU (RUR) 13,668 11,951 14% 14,737 -7%
Alternative segment in the regions & CIS
Number of subscribers (000s) 2,630 2,524 4% 2,606 1%
incl. pay-TV subscribers 1,997 1,952 2% 1,996 0%
incl. BB subscribers 426 300 42% 378 13%
ARPU (RUR) 158 152 4% 150 5%Corporate subscribers
Number of subscribers (000s) 58 52 13% 52 12%
incl. BB subscribers 28 23 20% 26 9%
ARPU (RUR) 3,299 3,532 -7% 3,579 -8%
Total number of households passed (000s) 7,756 7,173 8% 7,502 3%
Total number of broadband internet subscribers (000s) 1,359 1,169 16% 1,298 5%
Total number of pay-TV subscribers (000s) 2,122 2,090 2%
2,1240%
Integration Expansion Traditional segment 27

8/3/2019 Comstar UTS 1Q2010 Corporate Presentation Final-0
http://slidepdf.com/reader/full/comstar-uts-1q2010-corporate-presentation-final-0 28/30
Appendix. Segmental Operating Expenses &
2007 2008 2009#Employees *
Traditional segment 13,777 10,434 9,644
Alternative segment in M oscow 2,154 2,231 2,041
Alternative segment in the regions & CIS 1,084 2,878 5,595
Average salary
Traditional segment $ 956.0 $ 1,257.5 $ 1,131.5, . , . , .
Alternative segment in the regions & CIS $ 1,340.0 $ 1,099.3 $ 880.6
Average monthly revenue per Employee
Traditional segment $ 6,729.1 $ 9,071.4 $ 8,017.5
Alternative segment in M oscow $ 17,506.3 $ 19,404.7 $ 17,039.5
Alternative segment in the regions & CIS $ 3,601.9 $ 4,774.8 $ 3,880.3
Alternative Segment, mln US$Traditional Segment, mln US$
235
232
175
Eliminations
233185 Eliminations
156 164 162
59 61 4288
142115
132139
114
‐1‐30 ‐16
SGA
Interconnection costs
Network maintenance 94153 160
7191 87114
111 147
‐
Interconnection costs
Employee costs
SGA
Other expenses, net
2007 2008 2009
Other expenses, net
* At the end of period Integration Expansion Traditional segment 28
‐ ‐
2007 2008 2009
A di CF S & BS
8/3/2019 Comstar UTS 1Q2010 Corporate Presentation Final-0
http://slidepdf.com/reader/full/comstar-uts-1q2010-corporate-presentation-final-0 29/30
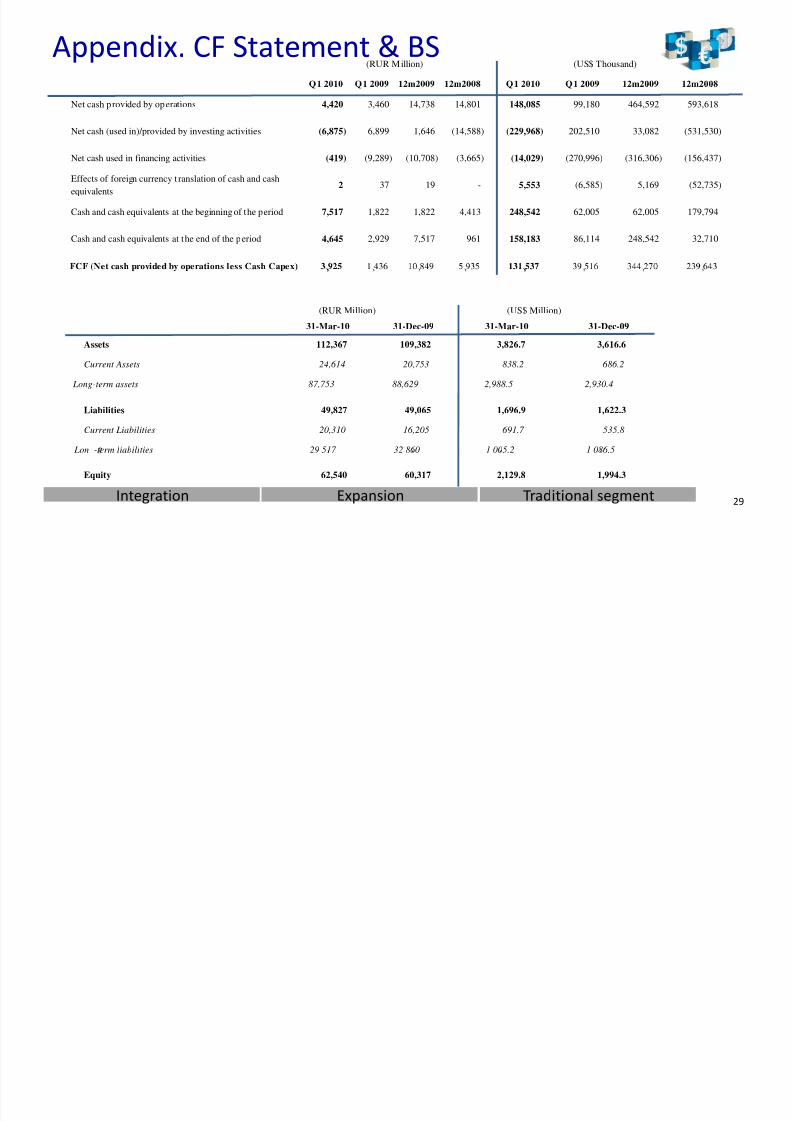
(RUR Million) (US$ Thousand)Appendix. CF Statement & BS
Net cash provided by operations 4,420 3,460 14,738 14,801 148,085 99,180 464,592 593,618
Net cash (used in)/provided by investing activities (6,875) 6,899 1,646 (14,588) (229,968) 202,510 33,082 (531,530)
Net cash used in financing activities (419) (9,289) (10,708) (3,665) (14,029) (270,996) (316,306) (156,437)
Effects of foreign currency t ranslation of cash and cash
equivalents
2 37 19 - 5,553 (6,585) 5,169 (52,735)
Cash and cash equivalents at the beginning of the period 7,517 1,822 1,822 4,413 248,542 62,005 62,005 179,794
Cash and cash equivalents at the end of the period 4,645 2,929 7,517 961 158,183 86,114 248,542 32,710
31-Mar-10 31-Dec-09 31-Mar-10 31-Dec-09
(RUR Million) (US$ Million)
, , , , , , , ,
Assets 112,367 109,382 3,826.7 3,616.6
Current Assets 24,614 20,753 838.2 686.2
Long-term assets 87,753 88,629 2,988.5 2,930.4
Liabilities 49,827 49,065 1,696.9 1,622.3
Current Liabilities 20,310 16,205 691.7 535.8
Lon -term liabilities 29 517 32 860 1 005.2 1 086.5
Equity 62,540 60,317 2,129.8 1,994.3
Integration Expansion Traditional segment 29

8/3/2019 Comstar UTS 1Q2010 Corporate Presentation Final-0
http://slidepdf.com/reader/full/comstar-uts-1q2010-corporate-presentation-final-0 30/30
Appendix. Glossary
ADSL....................................... Asymmetric digital subscriber line
ADSL technology using the ITU G.992.5 standard. Allows for ................................... .
Docsis……………………............... Data Over Cable Service Interface Specifications
Ethernet.................................. Packet based transmission rotocol rimaril used in LANs
FTTB........................................ Fiber‐to‐the‐Building
‐.........................................
MMDS..................................... Microwave Multipoint Distribution System
Integration Expansion Traditional segment 30