comtrade scom management pack for nutanix user … management pack enables it teams to monitor...
TRANSCRIPT
Comtrade SCOM Management Pack for Nutanix
Version 2.0
USER GUIDE

Legal Notices
Copyright Notice
© 2017 Comtrade Software. All rights reserved.
This document contains proprietary information, which is protected by copyright. No part of this document may be photocopied, reproduced, distributed, transmitted, stored in a retrieval system, modified or translated to another language in any form by any means, without the prior written consent of Comtrade Software (Comtrade).
Trademarks
Comtrade Software logos, names, trademarks and/or service marks and combinations thereof are the property of Comtrade or its affiliates. Other product names are the property of their respective trademark or service mark holders and are hereby acknowledged.
Citrix, the Citrix Receiver logo, StoreFront, XenApp, and XenDesktop are trademarks of Citrix Systems, Inc. and/or one or more of its subsidiaries, and may be registered in the United States Patent and Trademark Office and in other countries.
Microsoft, SharePoint, SQL Server, Windows, Windows Design 2001, and Windows Server are either registered trademarks or trademarks of Microsoft Corporation in the United States and/or other countries.
Nutanix and Prism are trademarks of Nutanix, Inc. in the United States and/or other jurisdictions.
Disclaimer
The details and descriptions contained in this document are believed to have been accurate and up to date at the time the document was written. The information contained in this document is subject to change without notice.
Comtrade Software provides this material "as is" and makes no warranty of any kind, expressed or implied, including, but not limited to, the implied warranties of merchantability and fitness for a particular purpose. Comtrade shall not be liable for errors and omissions contained herein. In no event shall Comtrade be liable for any direct, indirect, consequential, punitive, special or incidental damages, including, without limitation, damages for loss and profits, loss of anticipated savings, business interruption, or loss of information arising out of the use or inability to use this document, or any action taken based on the information contained herein, even if it has been advised of the possibility of such damages, whether based on warranty, contract, or any other legal theory.
The only warranties for Comtrade Software products and services are set forth in the express warranty statements accompanying such products and services. Nothing herein should be construed as constituting an additional warranty.

3
Notice
This document is provided in connection with Comtrade Software products. Comtrade may have copyright, patents, patent applications, trademark, or other intellectual property rights covering the subject matter of this document.
Except as expressly provided in any written license agreement from Comtrade Software, the furnishing of this document does not give you any license to these patents, trademarks, copyrights, or other intellectual property on Comtrade Software products. Use of underlying Comtrade Software product(s) is governed by their respective Software License and Support Terms.
Important: Please read Software License and Support Terms before using the accompanying software product(s).
Comtrade Software www.comtradesoftware.com

Contents INTRODUCTION .................................................................................................................................................. 6
ABOUT NUTANIX ........................................................................................................................................................ 7 ABOUT SYSTEM CENTER OPERATIONS MANAGER .............................................................................................................. 7 ABOUT COMTRADE SCOM MANAGEMENT PACK FOR NUTANIX .......................................................................................... 7
Product Architecture .......................................................................................................................................... 9
INSTALLATION AND CONFIGURATION .............................................................................................................. 10
OVERVIEW ............................................................................................................................................................... 11 PREPARING FOR THE INSTALLATION ............................................................................................................................... 12 INSTALLING THE PRODUCT ON SCOM MANAGEMENT SERVER ........................................................................................... 14
Verifying Installation on the Management Server ........................................................................................... 15 MANUALLY IMPORTING INCLUDED MANAGEMENT PACKS ................................................................................................. 17
Verifying Import of Included Management Packs ........................................................................................... 18 CONFIGURING NUTANIX MANAGEMENT PACK ................................................................................................................ 19
Configuring Comtrade Nutanix Management Pool ......................................................................................... 20 Configuring Nutanix Management Pack Connections ..................................................................................... 20 Configuring the Application Awareness Feature ............................................................................................. 22
Using Single Account for Application Awareness .......................................................................................................... 22 Using Multiple Accounts for Application Awareness ..................................................................................................... 24
Configuring Low-Level Hardware Monitoring .................................................................................................. 26
PRODUCT LICENSING ........................................................................................................................................ 28
ABOUT PRODUCT LICENSING ....................................................................................................................................... 29 Evaluation Licensing ........................................................................................................................................ 29 Permanent Licensing ........................................................................................................................................ 29
Permanent Licensing Procedure .................................................................................................................................... 29 Adding Licenses ............................................................................................................................................................. 30 Managing Licenses Used Within the Nutanix Environment ........................................................................................... 30
UNINSTALLATION ............................................................................................................................................. 31
OVERVIEW ............................................................................................................................................................... 32 Removing Included Management Packs .......................................................................................................... 32 Uninstalling Nutanix Management Pack from Management Server ............................................................... 33
USAGE .............................................................................................................................................................. 34
NUTANIX MANAGEMENT PACK DISCOVERY AND MONITORING .......................................................................................... 35 Discovered Objects ........................................................................................................................................... 35 Monitors .......................................................................................................................................................... 38 Rules................................................................................................................................................................. 40 Reports ............................................................................................................................................................. 47 Tasks ................................................................................................................................................................ 48 Tuning Thresholds for Performance Monitors and Rules ................................................................................. 48
Override Default Values in Monitors and Rules ............................................................................................................ 48 SuperPacks: Citrix XenApp and XenDesktop .................................................................................................... 49 SuperPacks: Microsoft Exchange Server .......................................................................................................... 50 SuperPacks: Microsoft SQL Server ................................................................................................................... 50
TROUBLESHOOTING .......................................................................................................................................... 52

ABOUT TROUBLESHOOTING......................................................................................................................................... 53 GENERAL TROUBLESHOOTING GUIDELINES ..................................................................................................................... 53 PRODUCT LOG FILES .................................................................................................................................................. 53
Log Files Location ............................................................................................................................................. 53 Logging Severity Levels .................................................................................................................................... 53
PROBLEMS AND ACTIONS ........................................................................................................................................... 54 Comtrade Nutanix MP Accessor node for Nutanix Cluster is not visible ....................................................................... 54 Nutanix Management Pack discovers nothing .............................................................................................................. 55 Graphs User Virtual Machine CPU Load and User Virtual Machine Memory Usage are empty .................................... 55 Applications hosted on some virtual machines are not discovered by Application Awareness .................................... 55
GETTING ASSISTANCE................................................................................................................................................. 56 Licensing Assistance ......................................................................................................................................... 56 Support ............................................................................................................................................................ 57
GETTING ADDITIONAL INFORMATION AND LATEST UPDATES .............................................................................................. 58 BEFORE CONTACTING COMTRADE SOFTWARE CUSTOMER SUPPORT ................................................................................... 58
MANUAL CONFIGURATION PROCEDURES ......................................................................................................... 59
SETTING UP ACCOUNTS MANUALLY .............................................................................................................................. 60 Setting up Action Account for Monitoring Nutanix Infrastructure................................................................... 60 Setting up Action Account for Application Awareness ..................................................................................... 61 Setting up Action Account for Individual Monitored Applications ................................................................... 61
COMTRADE SOFTWARE CUSTOMER SUPPORT AND INFORMATION ................................................................. 63
CONTACTING COMTRADE SOFTWARE ............................................................................................................................ 64 CUSTOMER SUPPORT ................................................................................................................................................. 64 COMPANY WEBSITE AND VIDEO CHANNEL ..................................................................................................................... 64 GENERAL INFORMATION ............................................................................................................................................. 64 FEEDBACK ................................................................................................................................................................ 65

Chapter 1
Introduction

Introduction 7
About Nutanix
Nutanix delivers enterprise computing and storage featuring built-in virtualization.
Nutanix hyperconverged infrastructure natively integrates servers, storage network, and storage into a single x86-based server deployed in scale-out clusters. Nodes (hosts) that are part of enterprise scale computing clusters run industry-standard or native hypervisors and the Nutanix operating system (AOS, formerly NOS). Each server contains x86-64 processors, memory, solid state drives (SSDs), and traditional hard disk drives (HDDs) that aggregate storage resources into a single storage pool. Capacity is added by adding nodes to the cluster.
Built-in virtualization allows applications and data to move freely between on-premises environments and public clouds. All data, metadata, and operations are distributed across the entire cluster combining physical and virtual storage. Such combined functionality eliminates performance bottlenecks, enables predictable and unlimited scalability, reduces power and space consumption, and removes storage complexity.
Nutanix Enterprise Cloud Platform features predictable performance, cloud-like infrastructure consumption, robust security, and application mobility for a broad range of enterprise applications without infrastructure constraints. The infrastructure is truly invisible, shifting focus back to applications.
About System Center Operations Manager
System Center Operations Manager (SCOM), a component of Microsoft System Center, is a cross-platform data center management system that helps you monitor services, devices, and operations for many computer systems from a single console. Using SCOM you can check health, performance, and availability of all monitored objects in an environment as well as identify and resolve problems. It also provides alerts generated in specific circumstances, based on their availability, performance, configuration, or security aspects. SCOM informs you which monitored objects are not healthy, sends alerts when problems are detected, and provides information to help you identify the problem cause and define effective solutions.
About Comtrade SCOM Management Pack for Nutanix
Comtrade SCOM Management Pack for Nutanix (Nutanix Management Pack) is an availability and performance management solution that extends end-to-end service monitoring capabilities of SCOM to include Nutanix infrastructure.
Nutanix Management Pack enables IT teams to monitor Nutanix hyperconverged infrastructure with SCOM. It provides an extensive set of features needed by IT for health, availability, infrastructure, and application performance monitoring:
Discovery, visualization, and updates for Nutanix nodes, clusters, virtual machines, storage, data protection, and replication

Introduction 8
Health monitoring for Nutanix nodes, clusters, virtual machines, storage, data protection, and replication, using descriptive alerts and knowledge base
Detection and grouping of the application-specific virtual machines, by using the Application Awareness feature
Complete, quick, and convenient overview of Nutanix environment by using intuitive high-level dashboards
With Nutanix Management Pack you can:
Monitor disk health and performance Disk health and performance may not impact the VMs due to the replication and redundancy, but you need visibility to make sure the device is at its full capability. You can continually monitor disk health and performance by referencing the hardware topology view which shows a complete overview of Nutanix storage, current status, and any alerts.
Assure high availability of business-critical applications Monitoring of replication for protection domain is the key to the service high availability. Having an up-to-date replica of the protection domain will maintain optimal service and reference any alerts that occur in relation to it. You can quickly identify any of the replication issues and proactively remediate by acting on alerts containing resolution steps.
Detect business-critical applications running on Nutanix infrastructure Knowing which business critical applications are running within Nutanix cluster helps you understand the roles of each virtual machine and resources consumed. You can quickly identify application environments running on Nutanix and related virtual machines with their roles in the application dashboard, which groups related virtual machines together.
Monitor virtual machines Nutanix infrastructure relies on the CVM (Nutanix Controller VM), which makes monitoring of CVM status vital to the flow of key resources to Nutanix clusters. You can immediately identify CVM status which contains detailed information about the health, alerts, and possible resolution steps which keep your Nutanix environment at maximum resources.
Monitor hardware components By monitoring statuses of hardware sensors, for example, fan rotation speed sensor, CPU temperature sensor, and power supply voltage sensor, you can quickly notice conditions that might eventually cause a system halt and reduce availability at inconvenient times. Reacting to such alerts in time can help you prevent such unplanned occurrences.
Nutanix Management Pack fully integrates topology, health, and performance data into SCOM Operations console.

Introduction 9
Product Architecture
Nutanix Management Pack is installed on a SCOM management server. It uses a sophisticated component called Comtrade SCOM Data Collector for Nutanix (Nutanix SCOM Data Collector), which also gets installed on a SCOM management server or on a different system (proxy system). Nutanix SCOM Data Collector connects to one or more Nutanix clusters through REST Web services interface. It optimizes the interface's response by filtering redundant data from data stream, thus optimally reducing load on SCOM workflows is. Nutanix SCOM Data Collector makes the product application-aware through the Application Awareness feature.
The following diagram shows how Nutanix Management Pack connects SCOM platform and Nutanix infrastructure.
Figure 1.1 A high-level view of the Nutanix Management Pack architecture

Chapter 2
Installation and Configuration

Installation and Configuration 11
Overview
Nutanix Management Pack consists of the following components (presented as features and subfeatures by the product's Setup Wizard):
General components: A container of general-purpose components.
Application Awareness: A component that provides identification of the applications installed on Nutanix virtual machines. It contains charts and tables with infrastructure and virtual machines-related data. It also gives you an option of generating lists of most intensive processes with regards to CPU usage or memory consumption. This is a subfeature of General components.
Dashboards: A component that provides presentation dashboards for overview of Nutanix hardware, storage, virtual machines, and data protection. This is a subfeature of General components.
Advanced dashboards: A component that provides presentation dashboards for overview of the entire Nutanix environment. This is a subfeature of General components.
Hardware monitors: A component that provides detailed information on current Nutanix hardware condition. This is a subfeature of General components.
Reports: A component that provides detailed information about the monitored Nutanix environment. It contains charts and tables with infrastructure and virtual machines-related data. This is a subfeature of General components.
SuperPacks: A container of dashboards that correlate information collected by Nutanix Management Pack and other SCOM add-ins (Management Pack products).
Citrix XenApp and XenDesktop: A component that provides dashboards for correlation of information from Nutanix Management Pack with information from Citrix SCOM Management Pack for XenApp and XenDesktop. It bridges the gap between the Nutanix infrastructure and Citrix as a Nutanix workload by providing dashboards for various scenarios, for example, correlating Citrix site session data with Nutanix cluster resource usage. These dashboards combine data from the Nutanix and Citrix infrastructures. This is a subfeature of SuperPacks.
Microsoft Exchange Server: A component that provides dashboards for correlation of information from Nutanix Management Pack with information from Microsoft Exchange Server Management Pack. This is a subfeature of SuperPacks.
Microsoft SQL Server: A component that provides dashboards for correlation of information from Nutanix Management Pack with information from Microsoft System Center Management Pack for SQL Server. This is a subfeature of SuperPacks.
Data Collector service: Nutanix SCOM Data Collector. A component that collects data from Nutanix clusters and makes it available for monitoring in SCOM. It is implemented as a service which listens for requests and acts as a proxy. SCOM and Nutanix SCOM Data Collector communicate with each other by using HTTPS or HTTP, through the default port that can be changed during product installation. Nutanix SCOM Data Collector uses REST Web services interface to connect to Nutanix clusters. It uses filtering of redundant data to optimize interface response and reduce load on SCOM workflows. Nutanix SCOM Data Collector makes the product application-aware through the Application Awareness feature.
Complete the following tasks to install, configure, and cover licensing of Nutanix Management Pack:
1. Ensure that the installation prerequisites are fulfilled. See “Preparing for the Installation”.
2. Install Nutanix Management Pack on the SCOM management server. See “Installing the Product on SCOM Management Server”.
3. Manually import included management packs to SCOM management server (if automatic import is not

Installation and Configuration 12
performed). See “Manually Importing Included Management Packs”.
4. Perform mandatory configuration procedures. See “Configuring Nutanix Management Pack".
5. Cover licensing of the product. See “Product Licensing”.
Preparing for the Installation
Before installing Nutanix Management Pack, make sure that: – Product requirements documented in Comtrade SCOM Management Pack for Nutanix Release Notes are met. – Prerequisites listed in this section are fulfilled.
Nutanix Enterprise Cloud Platform prerequisites
Nutanix clusters are installed and configured.
An operating system account is chosen that has local administrative privileges on target virtual machines.
SCOM prerequisites
Listed or newer versions of the management packs specified in the tables that follow are present in the SCOM resource pool designated to monitor Nutanix clusters (Comtrade Nutanix Management Pool). They enable operation of different product components.
NOTE Default management packs should not be removed from the SCOM management group due to dependencies. If a removal occurs, you must import them from the SCOM installation directory.
The management packs included in the product depend on the following default management packs:
Microsoft.SystemCenter.DataWarehouse.Library 7.0.8427.0
Microsoft.SystemCenter.Library 7.0.8427.0
Microsoft.SystemCenter.OperationsManager.Library 7.0.8560.0
Microsoft.SystemCenter.Visualization.Library 7.0.8560.0
Microsoft.Windows.Library 7.5.8501.0
System.Health.Library 7.0.8427.0
System.Library 7.5.8501.0
System.NetworkManagement.Library 7.0.8560.0
System.Performance.Library 7.0.8427.0
System.Snmp.Library 7.0.8427.0
The Advanced dashboards subfeature of General components depends on the following management packs:
Microsoft.EnterpriseManagement.CompositionEngine 7.0.5000.0
Microsoft.EnterpriseManagement.CompositionEngine.Extensibility 7.0.5000.0
Microsoft.EnterpriseManagement.Core 7.0.5000.0
Microsoft.EnterpriseManagement.Monitoring.Components 7.0.5000.0
Microsoft.EnterpriseManagement.OperationsManager 7.0.5000.0
Microsoft.EnterpriseManagement.Presentation.Core 7.0.5000.0

Installation and Configuration 13
Microsoft.EnterpriseManagement.Presentation.Security 7.0.5000.0
Microsoft.EnterpriseManagement.Runtime 7.0.5000.0
Microsoft.SystemCenter.Visualization.Component.Library 7.1.10226.1015
Microsoft.SystemCenter.Visualization.Configuration.Library 7.0.8560.0
Microsoft.SystemCenter.Visualization.Library 7.1.10226.1015
The Citrix XenApp and XenDesktop subfeature of SuperPacks depends on the following management packs:
Comtrade.Citrix.Library 1.0.6.0
Comtrade.Citrix.XenApp.And.XenDesktop 3.5.19354.0
Comtrade.Nutanix.AppAwareness 2.0.0.0
Comtrade.Nutanix.Base 2.0.0.0
Microsoft.SystemCenter.InstanceGroup.Library 7.5.8501.0
The Microsoft Exchange Server subfeature of SuperPacks depends on the following management packs:
Comtrade.Nutanix.AppAwareness 2.0.0.0
Comtrade.Nutanix.Base 2.0.0.0
Microsoft.Exchange.15 15.0.668.20
The Microsoft SQL Server subfeature of SuperPacks depends on the following management packs:
Comtrade.Nutanix.AppAwareness 2.0.0.0
Comtrade.Nutanix.Base 2.0.0.0
Microsoft.SQLServer.Library 6.6.0.0
Nutanix SCOM Data Collector (Data Collector service) prerequisites
Firewall is configured to enable inbound network traffic on the required port. Nutanix SCOM Data Collector comes preconfigured to use port 56500.
Application Awareness prerequisites
Applications that you plan to detect and monitor are installed and configured. For a list of the supported application versions, see Comtrade SCOM Management Pack for Nutanix Compatibility Matrix.
SuperPacks prerequisites
Applications that you plan to detect and monitor are installed and configured. For a list of the supported application versions, see Comtrade SCOM Management Pack for Nutanix Compatibility Matrix.
Additionally required SCOM add-ins (Management Pack products) for collecting data from the monitored applications are installed on the SCOM management server. For a list of the required Management Pack products, see Comtrade SCOM Management Pack for Nutanix Compatibility Matrix.

Installation and Configuration 14
Installing the Product on SCOM Management Server
To install Nutanix Management Pack on the SCOM management server, do the following:
1. From the managementpacks.comtrade.com/downloadarea/nutanixmp/release/index.html webpage, download the Nutanix Management Pack installation package and save it on the management server system.
2. Log on to the management server with a user account that is member of the Operations Manager Administrators role.
3. In Windows Explorer, locate the ComtradeNutanixMP.msi file and double-click it. The Setup Wizard starts.
4. Follow instructions provided in the Setup Wizard pages.
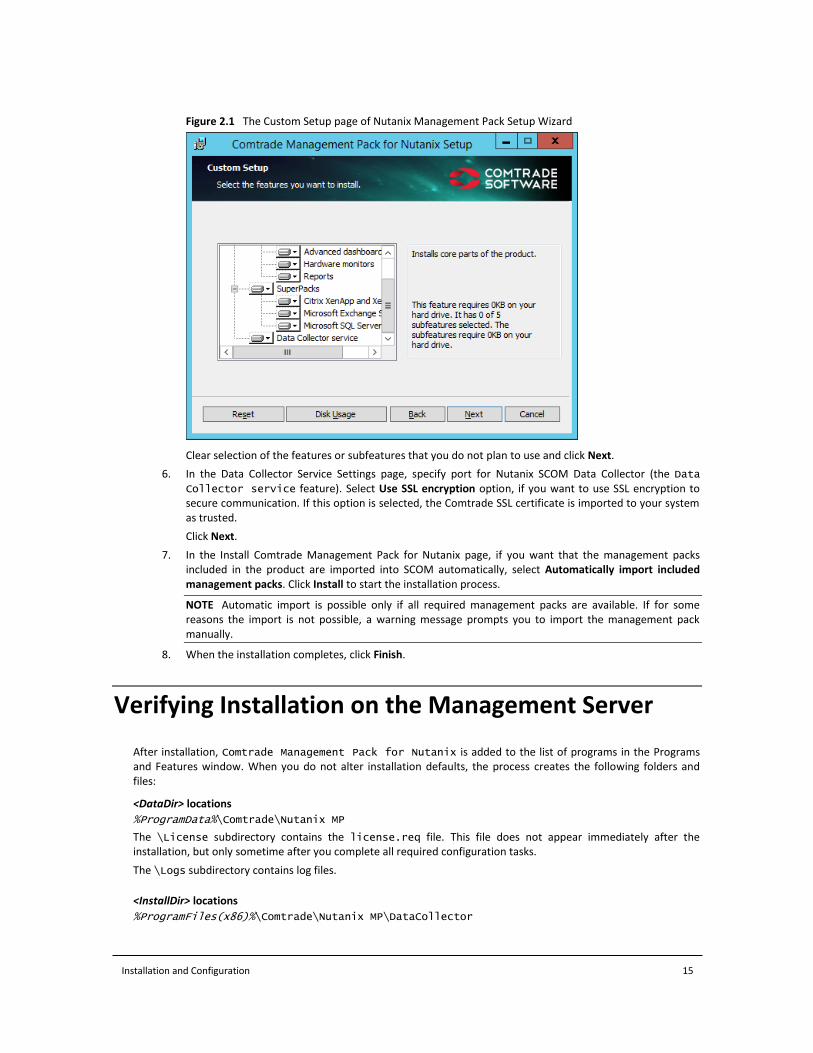
5. In the Custom Setup page, when prompted to select features for installation, consider the following points:
By default, all features and subfeatures are selected for installation.
The General components feature is required for initial deployment. It can be installed on one SCOM management server and later added to other SCOM management servers if needed. It can also be installed without its subfeatures. To install Data Collector service only, omit this feature completely.
This feature includes the following subfeatures: o Application Awareness o Dashboards o Advanced dashboards o Hardware monitors o Reports
SuperPacks includes the following subfeatures: o Citrix XenApp and XenDesktop o Microsoft Exchange Server o Microsoft SQL Server
Any subfeature of SuperPacks requires the Application Awareness subfeature of General components to be installed as well.
Data Collector service should be installed on every SCOM management server that will be included in Comtrade Nutanix Management Pool.
Installation and Configuration 15
Figure 2.1 The Custom Setup page of Nutanix Management Pack Setup Wizard
Clear selection of the features or subfeatures that you do not plan to use and click Next.
6. In the Data Collector Service Settings page, specify port for Nutanix SCOM Data Collector (the Data Collector service feature). Select Use SSL encryption option, if you want to use SSL encryption to secure communication. If this option is selected, the Comtrade SSL certificate is imported to your system as trusted.
Click Next.
7. In the Install Comtrade Management Pack for Nutanix page, if you want that the management packs included in the product are imported into SCOM automatically, select Automatically import included management packs. Click Install to start the installation process.
NOTE Automatic import is possible only if all required management packs are available. If for some reasons the import is not possible, a warning message prompts you to import the management pack manually.
8. When the installation completes, click Finish.
Verifying Installation on the Management Server
After installation, Comtrade Management Pack for Nutanix is added to the list of programs in the Programs and Features window. When you do not alter installation defaults, the process creates the following folders and files:
<DataDir> locations
%ProgramData%\Comtrade\Nutanix MP
The \License subdirectory contains the license.req file. This file does not appear immediately after the installation, but only sometime after you complete all required configuration tasks.
The \Logs subdirectory contains log files.
<InstallDir> locations
%ProgramFiles(x86)%\Comtrade\Nutanix MP\DataCollector

Installation and Configuration 16
The directory contains the following files within \bin:
Comtrade.Common.dll Comtrade.EnterpriseManagement.Applications.dll Comtrade.EnterpriseManagement.Applications.Exchange.dll Comtrade.EnterpriseManagement.Applications.SharePoint.dll Comtrade.EnterpriseManagement.Applications.SqlServer.dll Comtrade.EnterpriseManagement.Applications.StoreFront.dll Comtrade.EnterpriseManagement.Applications.XenDesktop.dll Comtrade.EnterpriseManagement.ApplicationsManager.dll Comtrade.EnterpriseManagement.RemoteSystem.dll Comtrade.EnterpriseManagement.RemoteSystem.Execution.dll Comtrade.Nutanix.Connector.dll Comtrade.Nutanix.ConnectorSvc.exe Comtrade.Nutanix.ConnectorSvc.exe.config ComtradeConnector.pfx (when the Use SSL encryption option is selected) ComtradeNutanixMP.cer (when the Use SSL encryption option is selected) ComtraRootCA.cert (when the Use SSL encryption option is selected) Microsoft.Bcl License.rtf Microsoft.Bcl.Async License.rtf Microsoft.Net.Http License.rtf Microsoft.Threading.Tasks.dll Microsoft.Threading.Tasks.Extensions.Desktop.dll Microsoft.Threading.Tasks.Extensions.Desktop.xml Microsoft.Threading.Tasks.Extensions.dll Microsoft.Threading.Tasks.Extensions.xml Microsoft.Threading.Tasks.xml Newtonsoft.Json License.txt Newtonsoft.Json.dll Newtonsoft.Json.xml NLog License.txt NLog.config NLog.dll Renci.SshNet License.txt Renci.SshNet.dll System.IO.dll System.IO.xml System.Net.Http.dll System.Net.Http.Extensions.dll System.Net.Http.Extensions.xml System.Net.Http.Primitives.dll System.Net.Http.Primitives.xml System.Net.Http.WebRequest.dll System.Net.Http.WebRequest.xml System.Net.Http.xml System.Runtime.dll System.Runtime.xml System.Threading.Tasks.dll System.Threading.Tasks.xml
%ProgramFiles(x86)%\Comtrade\Nutanix MP\Documentation
The directory contains the following files:
ComtradeSoftware_SoftwareLicenseAndSupportTerms.pdf Comtrade_MPNTX_DocumentationOnTheWeb.pdf Comtrade_MPNTX_OpenSourceThirdPartySoftwareComponents.pdf
%ProgramFiles(x86)%\Comtrade\Nutanix MP\MP
The directory contains the following files:
Comtrade.Nutanix.AppAwareness.mpb Comtrade.Nutanix.Base.mpb Comtrade.Nutanix.Hardware.mpb Comtrade.Nutanix.Presentation.Advanced.mpb Comtrade.Nutanix.Presentation.mpb Comtrade.Nutanix.Reports.mbp Comtrade.Nutanix.SuperPack.Citrix.mpb Comtrade.Nutanix.SuperPack.Citrix.Resources.mpb Comtrade.Nutanix.SuperPack.Library.mpb Comtrade.Nutanix.SuperPack.MSExchange.mpb Comtrade.Nutanix.SuperPack.MSSQL.mpb Comtrade.Nutanix.SuperPack.Widgets.mpb Comtrade.Nutanix.Widgets.mpb
%ProgramFiles(x86)%\Comtrade\Nutanix MP\tools
The directory contains the following files within \ipmiutil-3.0.0-win64:

Installation and Configuration 17
buildsamp.cmd ChangeLog.txt checksel.cmd getopt.h ialarms.cmd icmd.cmd iconfig.cmd idiscover.cmd ievents.exe ifru.cmd igetevent.cmd ihealth.cmd ilan.cmd install.cmd ipmicmd.h ipmiutil.dll ipmiutil.exe ipmiutil.lib ipmiutillib.dll ipmiutillib.exp ipmiutillib.lib ipmiutil_wdt.cmd ipmi_sample.c ipmi_sample.exe ipmi_sample.mak ipmi_sample2.exe ipmi_sample_evt.exe ireset.cmd isel.cmd isensor.cmd iserial.cmd isol.cmd iwdt.cmd libeay32.dll LICENSE.txt showsel.reg showselmsg.dll showselun.reg ssleay32.dll uninstall.cmd UserGuide.txt
If you selected to automatically import the included management packs, check the import success. For instructions, see "Verifying Import of Included Management Packs".
Manually Importing Included Management Packs
Nutanix Management Pack Setup Wizard provides automatic import of the sealed management packs that are included in the product. If the automatic import fails or you rather want to import the management packs into SCOM manually, do the following:
1. Launch the SCOM Operations console and connect to the management server.
2. In the Administration view, right-click Management Packs, and then select Import Management Packs. The Import Management Packs wizard opens.
3. In the Import Management Packs wizard, click Add and then select Add from disk.
When prompted to search the online catalog for dependencies, click No. The Select Management Packs to import window opens.
4. In the Select Management Packs to import window, browse to the installation folder of the included management packs (default path: %ProgramFiles (x86)%\Comtrade\Nutanix MP\MP\), select all the Nutanix Management Pack-related packages, and then click Open.

Installation and Configuration 18
5. On the Import Management Packs page, click Install.
The management pack packages are downloaded and imported.
If there is a problem at any stage of the import process, select the management pack to view the status details. When the import process is complete, the status of the management pack changes to Imported. Click Close.
NOTE Import is possible only if all required SCOM-default management packs are available. You can import missing management packs from the System Center Operations Manager installation directory.
Verifying Import of Included Management Packs
In the Monitoring view of the SCOM Operations console, the following elements should appear (the list of elements in your environment may differ based on your actual selection of features for the installation):
Figure 2.2 Elements of Nutanix Management Pack, as seen in the console tree of SCOM Operations console (part 1)

Installation and Configuration 19
Figure 2.3 Elements of Nutanix Management Pack, as seen in the console tree of SCOM Operations console (part 2)
Configuring Nutanix Management Pack
Before configuring Nutanix Management Pack, make sure that the prerequisites listed in this section are fulfilled.
General prerequisites
A Nutanix Prism user account is chosen that has privileges only for collecting (reading) data.
Application Awareness prerequisites
The product's Application Awareness feature is installed.
You know credentials of local administrative user accounts on target virtual machines.
Target virtual machines host applications that you plan to detect and monitor.
You know credentials of the administrative user account of the monitored application. For example, if you plan to detect and monitor Microsoft Exchange Server, you must know credentials of the Microsoft Exchange Server administrator account.
Linux-specific prerequisites
To be able to get information about the respective top processes in alerts and to run Nutanix-specific tasks for target virtual machines that are running Linux, the operating system on the virtual machines is configured such that:
o SSH server is enabled and running o SSH server is configured so that password authentication is required to log on o Inbound network traffic on the port 22 is enabled in the firewall
To configure Nutanix Management Pack, perform the following procedures:
1. Configure Comtrade Nutanix Management Pool (mandatory). See "Configuring Comtrade Nutanix Management Pool".
2. Configure Nutanix Management Pack connections (mandatory). See "Configuring Nutanix Management Pack Connections".

Installation and Configuration 20
3. Configure the Application Awareness feature (optional). See "Configuring the Application Awareness Feature".
4. Configure low-level hardware monitoring (optional). See "Configuring Low-Level Hardware Monitoring".
Configuring Comtrade Nutanix Management Pool
By default, all SCOM management servers are involved in monitoring the Nutanix infrastructure using Nutanix Management Pack. They are automatically added to a custom resource pool named Comtrade Nutanix Management Pool. Optionally, you can define which management servers to involve by specially configuring Comtrade Nutanix Management Pool and manually adding the management servers to it.
To manually add management servers to Comtrade Nutanix Management Pool, do the following:
1. Launch the SCOM Operations console and connect to the management server.
2. In the Administration view, expand Resource Pools, right-click Comtrade Nutanix Management Pool, and then select Manual Membership. In the Manual Membership dialog, click Yes.
3. Right-click Comtrade Nutanix Management Pool again and select Properties.
4. In the Comtrade Nutanix Management Pool Properties wizard, in the General Properties page, click Next.
5. In the Pool Membership page, click Add to select desired management servers.
6. In the Comtrade Nutanix Management Pool Properties – Member Selection dialog box, enter you search criterion, and click Search to retrieve a list of the available management servers.
7. Under Available items, select the management servers you want in the resource pool, click Add, and then click OK.
8. In the Pool Membership page, click Next.
9. Review your configuration and then click Save to save the changes.
Configuring Nutanix Management Pack Connections
To be able to use Nutanix Management Pack, you must configure its connections to Nutanix clusters by using the Comtrade Nutanix MP Configuration wizard. For Nutanix environments that consist of multiple clusters, you must repeat the configuration procedure for each cluster that you plan to monitor.
To configure Nutanix Management Pack connection for a Nutanix cluster, do the following:
1. Launch the SCOM Operations console and connect to the management server.
2. In the Authoring view, in the Authoring pane, expand Authoring > Management Pack Templates.
3. In the template list, right-click Comtrade Nutanix MP Configuration, and then select Add Monitoring Wizard.
4. In Add Monitoring Wizard, in the Monitoring Type page, select Comtrade Nutanix MP Configuration and then click Next.
5. In the Template Name and Description page, specify a name and description of the template. Do one of the following:
o To select an existing management pack, select it from the Select destination management pack drop-down list.
o To create a new management pack, follow the steps: a. Click New. b. In the Create a Management Pack wizard, in the General Properties page, specify the
name, version, and description. Click Next.

Installation and Configuration 21
c. In the Knowledge page, click Create. Click Next.
6. In the Nutanix Cluster Details page, in the Nutanix Cluster Details section, specify the following: o Fully qualified domain name or IP address of the cluster o Credentials of the chosen Nutanix Prism user account
Figure 2.4 The Nutanix Cluster Details page of Add Monitoring Wizard
Click Test to verify the connection to the cluster: o In case of connection success (green checkmark icon appears), the cluster's name and UUID
(universally unique identifier) appear in the Cluster Configuration Page section. Verify the values in the respective text boxes.
o Else (red cross icon appears), update values in the Cluster address, Prism user, and Password text boxes and retry connecting until successful.
Select the Create RunAsAccount using above credentials option and then click Create to apply configuration and complete the wizard.
7. In the Administration view of the SCOM Operations console, in the Administration pane, expand Administration > Run as Configuration > Accounts, and verify that the ComtradeNutanixPrismAccount_<NutanixClusterUUID> entry is present in the Type: Basic Authentication list. In this instance, <NutanixClusterUUID> is universally unique identifier of the Nutanix cluster.
Installation and Configuration 22
Configuring the Application Awareness Feature
You must configure the Application Awareness feature of Nutanix Management Pack to use the following functionality:
Inclusion of details about the current top processes on your virtual machines in alerts
Ability to run Nutanix-specific tasks in SCOM Operations console
Detection and monitoring of application environments running on virtual machines This use case requires an additional application-specific configuration step (marked Optional in the configuration procedure).
Inclusion of information on application roles in alerts and graphs This use case requires an additional application-specific configuration step (marked Optional in the configuration procedure).
Nutanix Management Pack also detects systems outside Nutanix environment that are part of application environments which include at least one Nutanix cluster node; such systems are treated as external and are not monitored.
IMPORTANT Application discovery on virtual machines usually takes approximately 24 hours to complete. Application objects are therefore not available immediately after the product is installed. Before you start configuring Application Awareness, ensure that application objects are discovered (present in SCOM).
Application Awareness configuration procedures are different for the following environments:
Application environments running on virtual machines that use a single administrative user account in the same cluster For the corresponding configuration procedure, see "Using Single Account for Application Awareness".
Application environments running on virtual machines that use multiple administrative user accounts in the same cluster For the corresponding configuration procedure, see "Using Multiple Accounts for Application Awareness".
NOTE For each virtual machine, you can configure no more than one administrative user account. To configure a different administrative user account, first delete configuration of the existing one.
Using Single Account for Application Awareness
If you want to detect application environments running on virtual machines within the same cluster and the virtual machines are using a single administrator account, use the Use single account option. With this option, an application group with all virtual machines on the selected cluster is created.
For every Nutanix cluster with application environments that you plan to monitor, do the following:
1. Launch the SCOM Operations console and connect to the management server.
2. In the Authoring view, in the Management Pack Templates list, locate and right-click Comtrade Nutanix MP Application Awareness Configuration, and then select Add Monitoring Wizard.
3. In Add Monitoring Wizard, select Comtrade Nutanix MP Application Awareness Configuration and then click Next.
4. Specify a template name and description, then select one of the existing management packs or create a new one. If you select an existing management pack, click Next.
5. Select Use single account and then click Next.

Installation and Configuration 23
Figure 2.5 The Account Definition page of Add Monitoring Wizard
6. Select the Nutanix cluster for which you create account. Click Next.
7. Specify credentials of the WinRM account that has access to virtual machines hosted on the same domain in the Nutanix cluster. Select Create corresponding Run As account and then click Next.
Installation and Configuration 24
Figure 2.6 The WinRM Account Configuration page of Add Monitoring Wizard
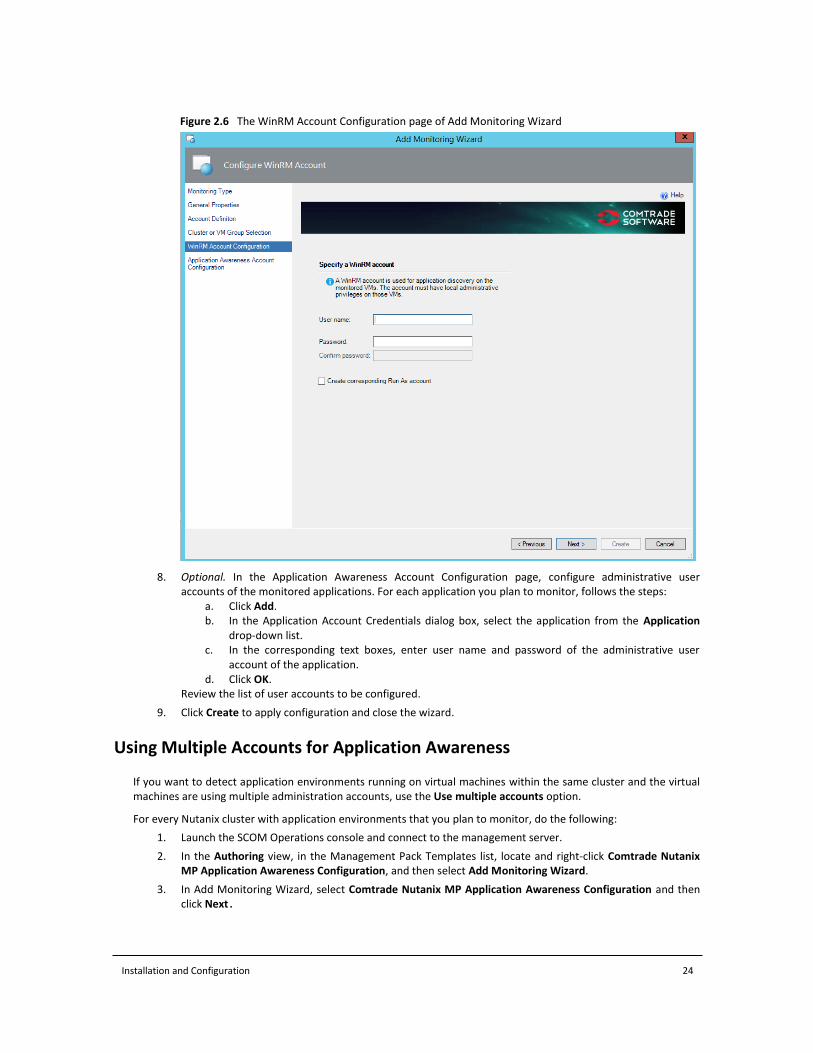
8. Optional. In the Application Awareness Account Configuration page, configure administrative user accounts of the monitored applications. For each application you plan to monitor, follows the steps:
a. Click Add. b. In the Application Account Credentials dialog box, select the application from the Application
drop-down list. c. In the corresponding text boxes, enter user name and password of the administrative user
account of the application. d. Click OK.
Review the list of user accounts to be configured.
9. Click Create to apply configuration and close the wizard.
Using Multiple Accounts for Application Awareness
If you want to detect application environments running on virtual machines within the same cluster and the virtual machines are using multiple administration accounts, use the Use multiple accounts option.
For every Nutanix cluster with application environments that you plan to monitor, do the following:
1. Launch the SCOM Operations console and connect to the management server.
2. In the Authoring view, in the Management Pack Templates list, locate and right-click Comtrade Nutanix MP Application Awareness Configuration, and then select Add Monitoring Wizard.
3. In Add Monitoring Wizard, select Comtrade Nutanix MP Application Awareness Configuration and then click Next.

Installation and Configuration 25
4. Specify a template name and description, then select one of the existing management packs or create a new one. If you select an existing management pack, click Next.
5. Select option Use multiple accounts and then click Next.
Figure 2.7 The Account Definition page of Add Monitoring Wizard
6. Specify the Group name. Click Next.
7. Specify credentials of the WinRM account that has access to virtual machines from the domain. Select Create corresponding Run As account and then click Next.

Installation and Configuration 26
Figure 2.8 The WinRM Account Configuration page of Add Monitoring Wizard
8. Optional. In the Application Awareness Account Configuration page, configure administrative user accounts of the monitored applications. For each application you plan to monitor, follows the steps:
a. Click Add. b. In the Application Account Credentials dialog box, select the application from the Application
drop-down list. c. In the corresponding text boxes, enter user name and password of the administrative user
account of the application. d. Click OK.
Review the list of user accounts to be configured.
9. Click Create to apply configuration and close the wizard.
Configuring Low-Level Hardware Monitoring
Hardware monitors of Nutanix Management Pack use Intelligent Platform Management Interface (IPMI) to collect low-level monitoring data from Nutanix cluster nodes: fan rotation speed, temperature, power supply voltage. To retrieve this data, interface implementation on a node is queried by a third-party tool (ipmiutil), after authenticating with configured credentials. Nutanix Management Pack comes preconfigured to use the following default IPMI credentials of Nutanix cluster nodes:
– User name: ADMIN – Password: ADMIN
If cluster nodes use non-default IPMI credentials, you must supply them to Nutanix Management Pack. You can do this by reconfiguring a dedicated SCOM Run As profile so that a proper Run As account is added to it.
To configure a new Run As account for hardware monitoring through IPMI, do the following:
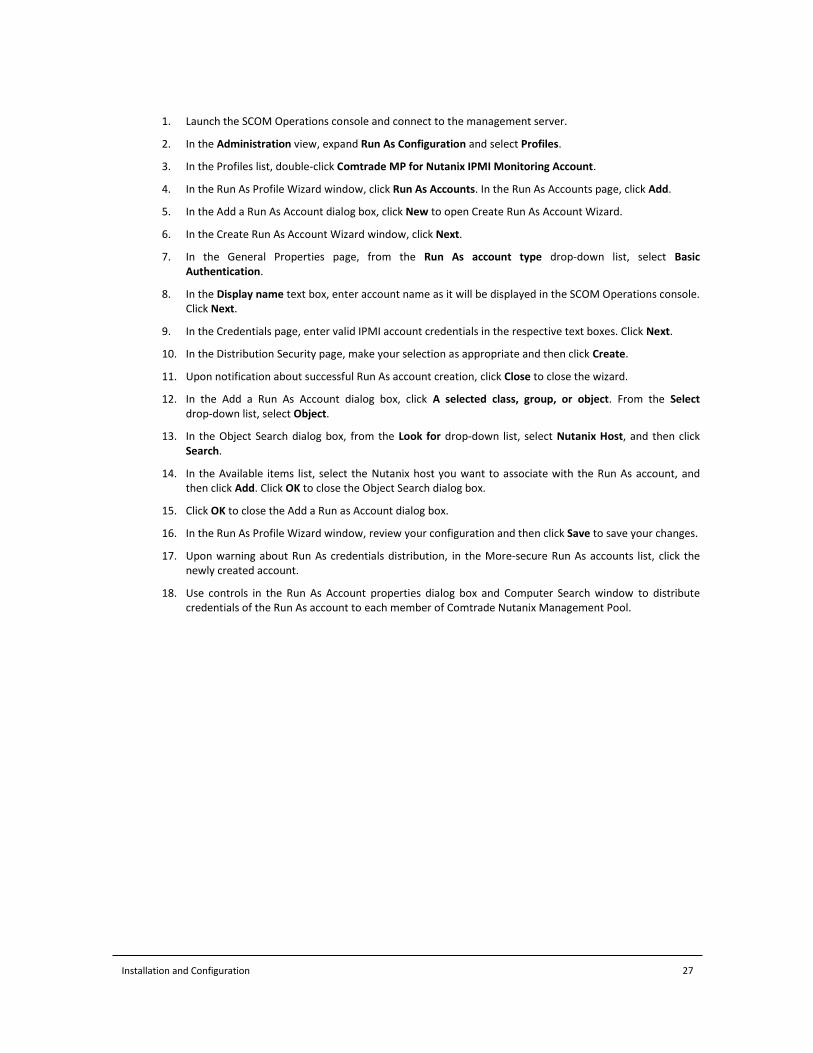
Installation and Configuration 27
1. Launch the SCOM Operations console and connect to the management server.
2. In the Administration view, expand Run As Configuration and select Profiles.
3. In the Profiles list, double-click Comtrade MP for Nutanix IPMI Monitoring Account.
4. In the Run As Profile Wizard window, click Run As Accounts. In the Run As Accounts page, click Add.
5. In the Add a Run As Account dialog box, click New to open Create Run As Account Wizard.
6. In the Create Run As Account Wizard window, click Next.
7. In the General Properties page, from the Run As account type drop-down list, select Basic Authentication.
8. In the Display name text box, enter account name as it will be displayed in the SCOM Operations console. Click Next.
9. In the Credentials page, enter valid IPMI account credentials in the respective text boxes. Click Next.
10. In the Distribution Security page, make your selection as appropriate and then click Create.
11. Upon notification about successful Run As account creation, click Close to close the wizard.
12. In the Add a Run As Account dialog box, click A selected class, group, or object. From the Select drop-down list, select Object.
13. In the Object Search dialog box, from the Look for drop-down list, select Nutanix Host, and then click Search.
14. In the Available items list, select the Nutanix host you want to associate with the Run As account, and then click Add. Click OK to close the Object Search dialog box.
15. Click OK to close the Add a Run as Account dialog box.
16. In the Run As Profile Wizard window, review your configuration and then click Save to save your changes.
17. Upon warning about Run As credentials distribution, in the More-secure Run As accounts list, click the newly created account.
18. Use controls in the Run As Account properties dialog box and Computer Search window to distribute credentials of the Run As account to each member of Comtrade Nutanix Management Pool.

Chapter 3
Product Licensing
Product Licensing 29
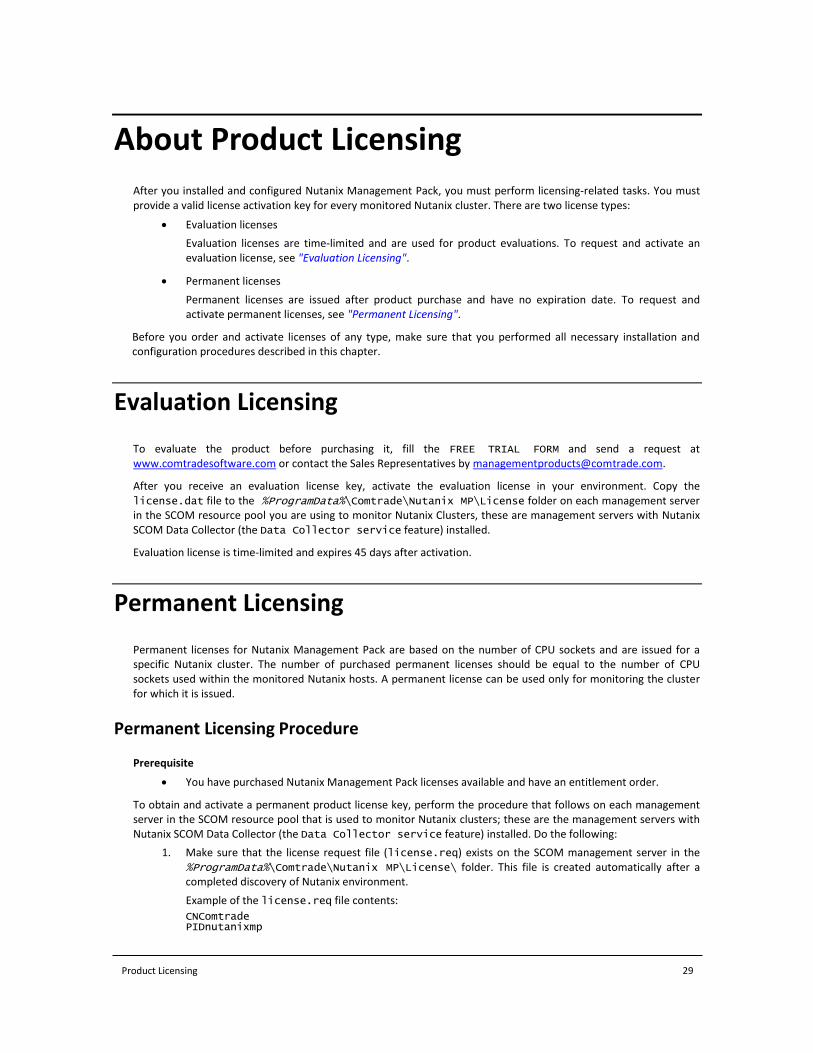
About Product Licensing
After you installed and configured Nutanix Management Pack, you must perform licensing-related tasks. You must provide a valid license activation key for every monitored Nutanix cluster. There are two license types:
Evaluation licenses
Evaluation licenses are time-limited and are used for product evaluations. To request and activate an evaluation license, see "Evaluation Licensing".
Permanent licenses
Permanent licenses are issued after product purchase and have no expiration date. To request and activate permanent licenses, see "Permanent Licensing".
Before you order and activate licenses of any type, make sure that you performed all necessary installation and configuration procedures described in this chapter.
Evaluation Licensing
To evaluate the product before purchasing it, fill the FREE TRIAL FORM and send a request at www.comtradesoftware.com or contact the Sales Representatives by [email protected].
After you receive an evaluation license key, activate the evaluation license in your environment. Copy the license.dat file to the %ProgramData%\Comtrade\Nutanix MP\License folder on each management server in the SCOM resource pool you are using to monitor Nutanix Clusters, these are management servers with Nutanix SCOM Data Collector (the Data Collector service feature) installed.
Evaluation license is time-limited and expires 45 days after activation.
Permanent Licensing
Permanent licenses for Nutanix Management Pack are based on the number of CPU sockets and are issued for a specific Nutanix cluster. The number of purchased permanent licenses should be equal to the number of CPU sockets used within the monitored Nutanix hosts. A permanent license can be used only for monitoring the cluster for which it is issued.
Permanent Licensing Procedure
Prerequisite
You have purchased Nutanix Management Pack licenses available and have an entitlement order.
To obtain and activate a permanent product license key, perform the procedure that follows on each management server in the SCOM resource pool that is used to monitor Nutanix clusters; these are the management servers with Nutanix SCOM Data Collector (the Data Collector service feature) installed. Do the following:
1. Make sure that the license request file (license.req) exists on the SCOM management server in the %ProgramData%\Comtrade\Nutanix MP\License\ folder. This file is created automatically after a completed discovery of Nutanix environment.
Example of the license.req file contents:
CNComtrade PIDnutanixmp

Product Licensing 30
ND00052DB8-098A-DCE0-6D8F-0CC47AB05798 NRP18 VERV1N HSUDADCD74F0359FB4B6EA683AEDCFCEE9745E164D3C9BC216754562712B3583D326 NEXTNODE CNComtrade PIDnutanixmp ND00052DC5-E8CB-811F-3BB6-0CC47A55B2AC NRP24 VERV1N HSUDBB6141BDECD6075AA860B4B32D2D4CC3BFC20019716666B5B1A8B43DC8295271 NEXTNODE
2. To submit the license request, go to the Comtrade licensing portal at the following web address: managementpacks.comtrade.com/mp-licensing
3. If you already have a licensing portal account, click Sign in and enter your username and password. If you do not have an account yet, create it.
4. To generate the permanent license, click Permanent Licenses, enter Purchase Order Number, and then click Next.
5. To upload the license request file, click Choose File, select the license request file (%ProgramData%\Comtrade\Nutanix MP\License\license.req), and then click Send Request.
6. In the Activate permanent licenses page, review the list of clusters and the number of required CPU sockets within each cluster for which you want to activate permanent licenses.
You can change the number of clusters by selecting and deselecting them as well as the number of required CPU sockets for each cluster by typing a new number.
Click Activate Licenses.
7. Within a few minutes, you should receive an email with a license activation file (license.dat) attached.
8. Copy the license activation file to the same location where the license request file resides in %ProgramData%\Comtrade\Nutanix MP\License.
Your permanent licenses are activated, so you can start using Nutanix Management Pack.
Adding Licenses
When your environment monitored with Nutanix Management Pack grows, you must add new licenses to enable monitoring of additional Nutanix clusters or hosts.
To add new Nutanix Management Pack licenses, do the following:
1. Estimate how many licenses you must acquire in addition to already purchased ones. You can find current number of CPU sockets in the %ProgramData%\Comtrade\Nutanix MP\License\license.req file in the line starting with the NRP string (for example, NRP24). Calculate the difference between current number of CPU sockets and the purchased licenses.
2. Buy the required number of licenses.
3. When you have an entitlement order, obtain and activate additional permanent product licenses. For detailed steps, see "Permanent Licensing Procedure".
Managing Licenses Used Within the Nutanix Environment
You can change the scope of the Nutanix clusters monitored with Nutanix Management Pack. As the product licenses are issued for individual Nutanix clusters, you must update licensing. To arrange any license management related activities, contact your Sales Representative at the following email address: [email protected].

Chapter 4
Uninstallation
Uninstallation 32
Overview
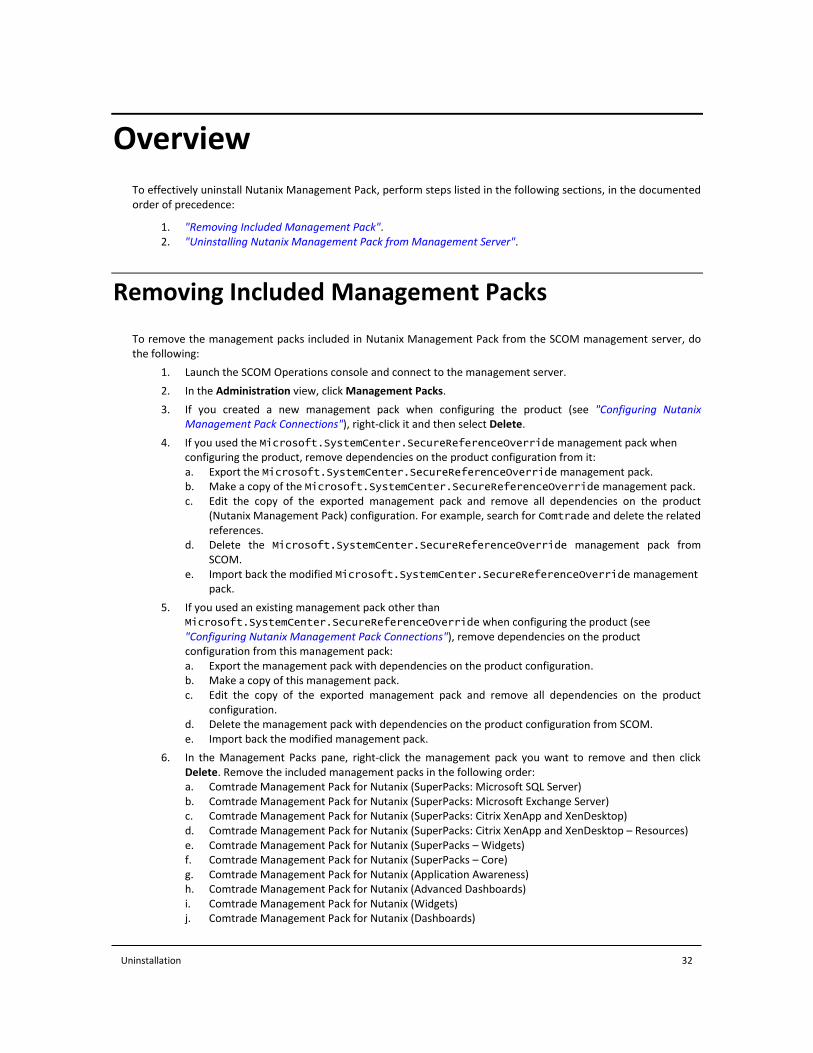
To effectively uninstall Nutanix Management Pack, perform steps listed in the following sections, in the documented order of precedence:
1. "Removing Included Management Pack". 2. "Uninstalling Nutanix Management Pack from Management Server".
Removing Included Management Packs
To remove the management packs included in Nutanix Management Pack from the SCOM management server, do the following:
1. Launch the SCOM Operations console and connect to the management server.
2. In the Administration view, click Management Packs.
3. If you created a new management pack when configuring the product (see "Configuring Nutanix Management Pack Connections"), right-click it and then select Delete.
4. If you used the Microsoft.SystemCenter.SecureReferenceOverride management pack when configuring the product, remove dependencies on the product configuration from it: a. Export the Microsoft.SystemCenter.SecureReferenceOverride management pack. b. Make a copy of the Microsoft.SystemCenter.SecureReferenceOverride management pack. c. Edit the copy of the exported management pack and remove all dependencies on the product
(Nutanix Management Pack) configuration. For example, search for Comtrade and delete the related references.
d. Delete the Microsoft.SystemCenter.SecureReferenceOverride management pack from SCOM.
e. Import back the modified Microsoft.SystemCenter.SecureReferenceOverride management pack.
5. If you used an existing management pack other than Microsoft.SystemCenter.SecureReferenceOverride when configuring the product (see "Configuring Nutanix Management Pack Connections"), remove dependencies on the product configuration from this management pack: a. Export the management pack with dependencies on the product configuration. b. Make a copy of this management pack. c. Edit the copy of the exported management pack and remove all dependencies on the product
configuration. d. Delete the management pack with dependencies on the product configuration from SCOM. e. Import back the modified management pack.
6. In the Management Packs pane, right‐click the management pack you want to remove and then click Delete. Remove the included management packs in the following order: a. Comtrade Management Pack for Nutanix (SuperPacks: Microsoft SQL Server) b. Comtrade Management Pack for Nutanix (SuperPacks: Microsoft Exchange Server) c. Comtrade Management Pack for Nutanix (SuperPacks: Citrix XenApp and XenDesktop) d. Comtrade Management Pack for Nutanix (SuperPacks: Citrix XenApp and XenDesktop – Resources) e. Comtrade Management Pack for Nutanix (SuperPacks – Widgets) f. Comtrade Management Pack for Nutanix (SuperPacks – Core) g. Comtrade Management Pack for Nutanix (Application Awareness) h. Comtrade Management Pack for Nutanix (Advanced Dashboards) i. Comtrade Management Pack for Nutanix (Widgets) j. Comtrade Management Pack for Nutanix (Dashboards)
Uninstallation 33
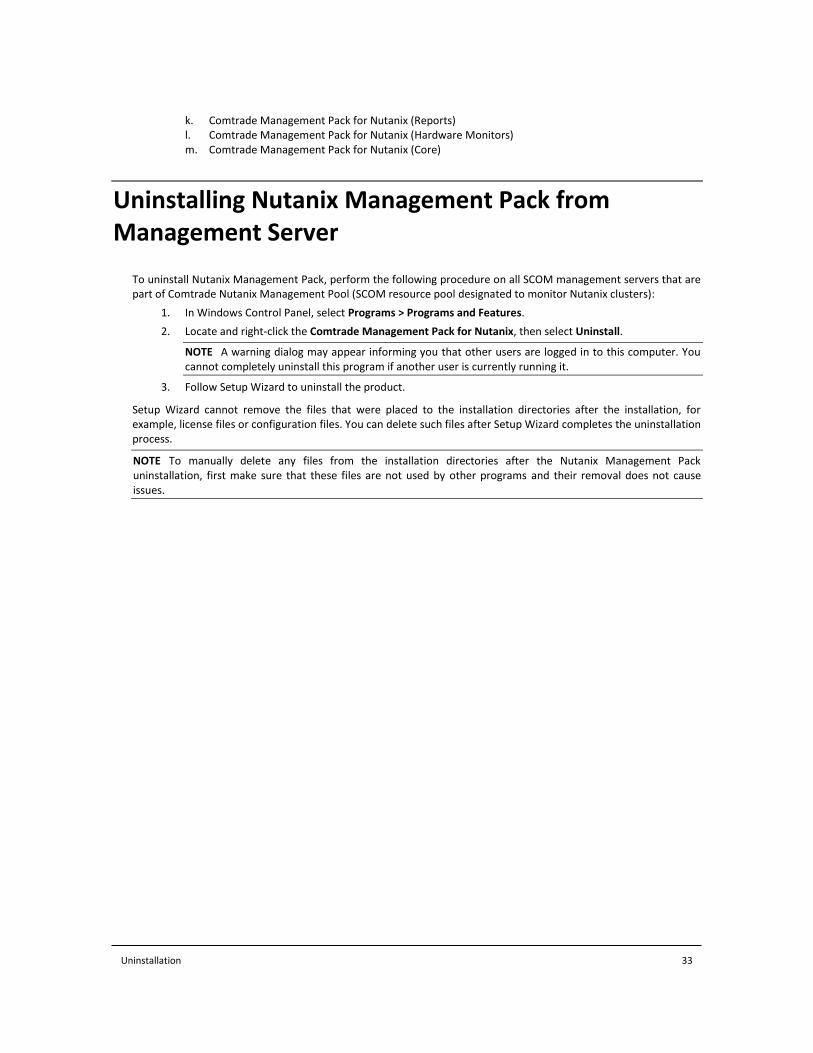
k. Comtrade Management Pack for Nutanix (Reports) l. Comtrade Management Pack for Nutanix (Hardware Monitors) m. Comtrade Management Pack for Nutanix (Core)
Uninstalling Nutanix Management Pack from Management Server
To uninstall Nutanix Management Pack, perform the following procedure on all SCOM management servers that are part of Comtrade Nutanix Management Pool (SCOM resource pool designated to monitor Nutanix clusters):
1. In Windows Control Panel, select Programs > Programs and Features.
2. Locate and right-click the Comtrade Management Pack for Nutanix, then select Uninstall.
NOTE A warning dialog may appear informing you that other users are logged in to this computer. You cannot completely uninstall this program if another user is currently running it.
3. Follow Setup Wizard to uninstall the product.
Setup Wizard cannot remove the files that were placed to the installation directories after the installation, for example, license files or configuration files. You can delete such files after Setup Wizard completes the uninstallation process.
NOTE To manually delete any files from the installation directories after the Nutanix Management Pack uninstallation, first make sure that these files are not used by other programs and their removal does not cause issues.

Chapter 5
Usage
Usage 35
Nutanix Management Pack Discovery and Monitoring
As a SCOM add-in, Nutanix Management Pack is comparable to other Management Pack products that complement SCOM. This chapter describes specifics of the Nutanix Management Pack feature set and advises on available configuration options. The following topics are described:
"Discovered Objects"
"Monitors"
"Rules"
"Reports"
"Tasks"
"Tuning Thresholds for Performance Monitors and Rules"
Nutanix Management Pack includes the SuperPacks feature with application-specific dashboards that correlate information from Nutanix Management Pack and other SCOM add-ins (Management Pack products). The following sections cover this functionality:
"SuperPacks: Citrix XenApp and XenDesktop"
"SuperPacks: Microsoft Exchange Server"
"SuperPacks: Microsoft SQL Server"
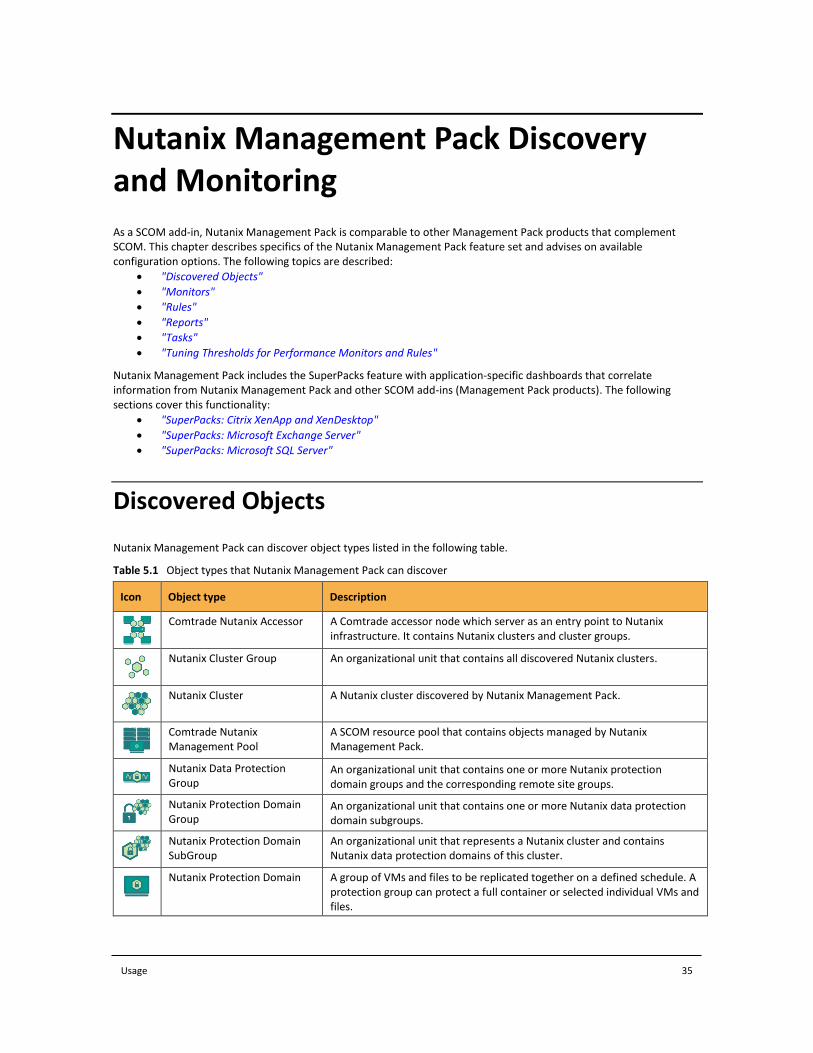
Discovered Objects
Nutanix Management Pack can discover object types listed in the following table.
Table 5.1 Object types that Nutanix Management Pack can discover
Icon Object type Description
Comtrade Nutanix Accessor A Comtrade accessor node which server as an entry point to Nutanix infrastructure. It contains Nutanix clusters and cluster groups.
Nutanix Cluster Group An organizational unit that contains all discovered Nutanix clusters.
Nutanix Cluster A Nutanix cluster discovered by Nutanix Management Pack.
Comtrade Nutanix Management Pool
A SCOM resource pool that contains objects managed by Nutanix Management Pack.
Nutanix Data Protection Group
An organizational unit that contains one or more Nutanix protection domain groups and the corresponding remote site groups.
Nutanix Protection Domain Group
An organizational unit that contains one or more Nutanix data protection domain subgroups.
Nutanix Protection Domain SubGroup
An organizational unit that represents a Nutanix cluster and contains Nutanix data protection domains of this cluster.
Nutanix Protection Domain A group of VMs and files to be replicated together on a defined schedule. A protection group can protect a full container or selected individual VMs and files.

Usage 36
Nutanix Replication Link A connection from the data protection domain to its remote site.
Nutanix Remote Site Group An organizational unit that contains Nutanix remote site subgroups.
Nutanix Remote Site Subgroup
An organizational unit that represents a Nutanix cluster and contains Nutanix remote sites of this cluster.
Nutanix Remote Site A remote Nutanix cluster or public cloud which can be leveraged as a target for backup or data replication purposes.
Nutanix Host Group An organizational unit for one or more Nutanix host subgroups; it contains all discovered Nutanix hosts for a single cluster.
Nutanix Host SubGroup An organizational unit that represents one cluster and contains one or more Nutanix blocks of this cluster.
Nutanix Block An object that contains one, two, or four server nodes.
Nutanix Host A physical Nutanix host (cluster node) configured in the Nutanix cluster.
Disk SubGroup A group of discovered disks (HDD and SSD devices) for a single Nutanix host.
HDD A hard disk drive (HDD) in the Nutanix environment. It is primarily used for bulk storage and stores: — Curator Reservation (curator storage) — Extent Store (persistent storage)
SSD A solid state drive (SSD) in the Nutanix environment. It stores the following key items: — Nutanix Home (CVM core) — Cassandra (metadata storage) — OpLog (persistent write buffer) — Unified Cache (SSD cache portion) — Extent Store (persistent storage)
Nutanix Storage Pool Group A group of all discovered Nutanix storage pools of all clusters.
Nutanix Storage SubGroup An organizational unit that represents a Nutanix cluster and contains one or more Nutanix storage pools of this cluster.
Nutanix Storage Pool A group of physical storage devices of the cluster, including PCIe SSD, SSD, and HDD devices. A storage pool may span multiple Nutanix hosts (cluster nodes) and is expanded as the cluster scales. Most often a single storage pool is leveraged.
Nutanix Storage Container A logical segmentation of the storage pool. It contains a group of VMs or files (vDisks).
Nutanix VM A virtual machine discovered in the Nutanix environment.
Nutanix VM Group A group of all discovered Nutanix virtual machines.
Nutanix User VM A user virtual machine discovered in the Nutanix environment.
Nutanix User VM SubGroup A group of all discovered Nutanix user virtual machines.
Usage 37
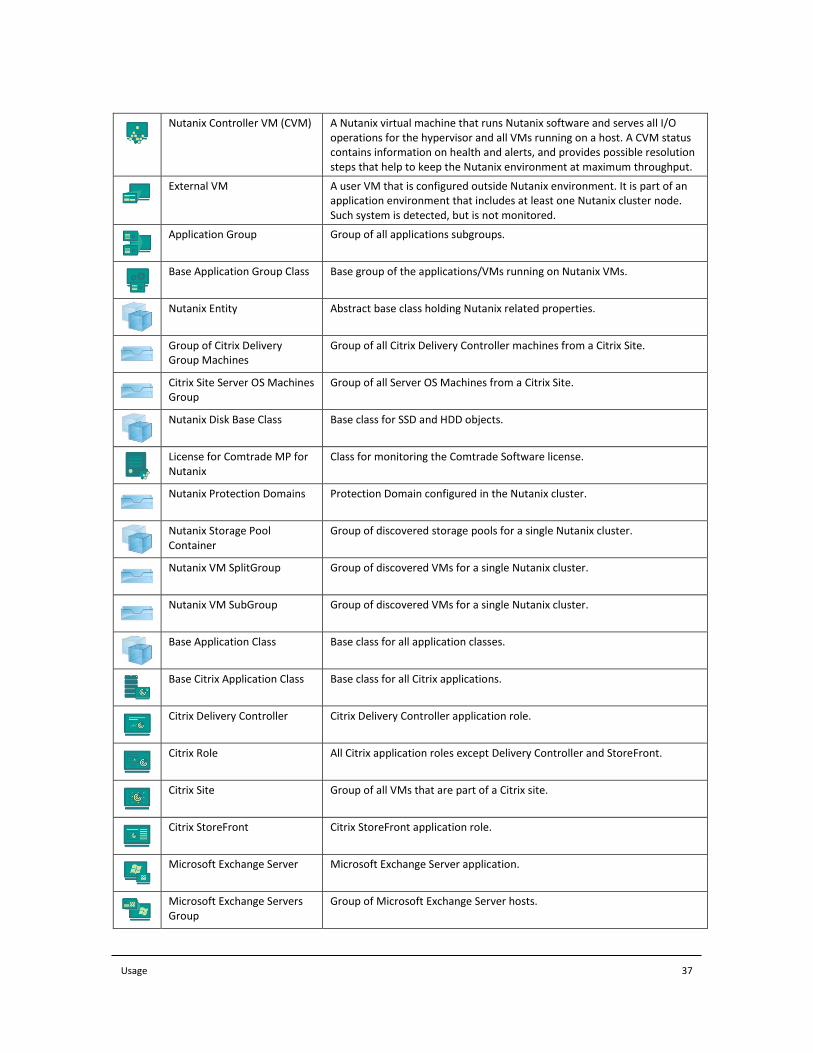
Nutanix Controller VM (CVM) A Nutanix virtual machine that runs Nutanix software and serves all I/O operations for the hypervisor and all VMs running on a host. A CVM status contains information on health and alerts, and provides possible resolution steps that help to keep the Nutanix environment at maximum throughput.
External VM A user VM that is configured outside Nutanix environment. It is part of an application environment that includes at least one Nutanix cluster node. Such system is detected, but is not monitored.
Application Group Group of all applications subgroups.
Base Application Group Class Base group of the applications/VMs running on Nutanix VMs.
Nutanix Entity Abstract base class holding Nutanix related properties.
Group of Citrix Delivery Group Machines
Group of all Citrix Delivery Controller machines from a Citrix Site.
Citrix Site Server OS Machines Group
Group of all Server OS Machines from a Citrix Site.
Nutanix Disk Base Class Base class for SSD and HDD objects.
License for Comtrade MP for Nutanix
Class for monitoring the Comtrade Software license.
Nutanix Protection Domains Protection Domain configured in the Nutanix cluster.
Nutanix Storage Pool Container
Group of discovered storage pools for a single Nutanix cluster.
Nutanix VM SplitGroup Group of discovered VMs for a single Nutanix cluster.
Nutanix VM SubGroup Group of discovered VMs for a single Nutanix cluster.
Base Application Class Base class for all application classes.
Base Citrix Application Class Base class for all Citrix applications.
Citrix Delivery Controller Citrix Delivery Controller application role.
Citrix Role All Citrix application roles except Delivery Controller and StoreFront.
Citrix Site Group of all VMs that are part of a Citrix site.
Citrix StoreFront Citrix StoreFront application role.
Microsoft Exchange Server Microsoft Exchange Server application.
Microsoft Exchange Servers Group
Group of Microsoft Exchange Server hosts.

Usage 38
Microsoft SharePoint Server Microsoft SharePoint Server application.
Microsoft SharePoint Servers Group
Group of the Microsoft SharePoint Server hosts.
Microsoft SQL Server Microsoft SQL Server application.
Microsoft SQL Servers Group Group of Microsoft SQL Server hosts.
Comtrade Nutanix Application VM Group Base
Group of all virtual machines with applications.
Hardware Sensor Base class for hardware sensors.
Fan SubGroup Subgroup of fans.
Fan Sensor Hardware fan sensor.
Temperature SubGroup Subgroup of temperature sensors.
Temperature Sensor Hardware temperature sensor.
Voltage SubGroup Subgroup of power supplies.
Voltage Sensor Power supply voltage sensor.
Monitors
Nutanix Management Pack provides monitors listed in the table that follows. The monitors have default thresholds that you can fine-tune to better suit conditions in your environment. For instructions on changing change the default thresholds, see "Tuning Thresholds for Performance Monitors and Rules".
Table 5.2 Nutanix Management Pack monitors
Monitor name Description Default values
Cluster Memory Usage Monitor Memory usage monitor of Nutanix cluster.
Update Interval in Seconds – 300 Timeout in Seconds – 120 Synchronization Time – 12:00 Warning Threshold – 80 Critical Threshold – 90
Cluster CPU Load Monitor
CPU load monitor of Nutanix cluster.
Update Interval in Seconds – 300 Timeout in Seconds – 120 Synchronization Time – 12:00 Warning Threshold – 60 Critical Threshold – 75 Number Of Samples – 3
Cluster I/O Latency Monitor
I/O latency of Nutanix cluster. Update Interval in Seconds – 300 Timeout in Seconds – 120
Usage 39
Synchronization Time – 12:00 Warning Threshold – 5 Critical Threshold – 10 Number Of Samples – 3
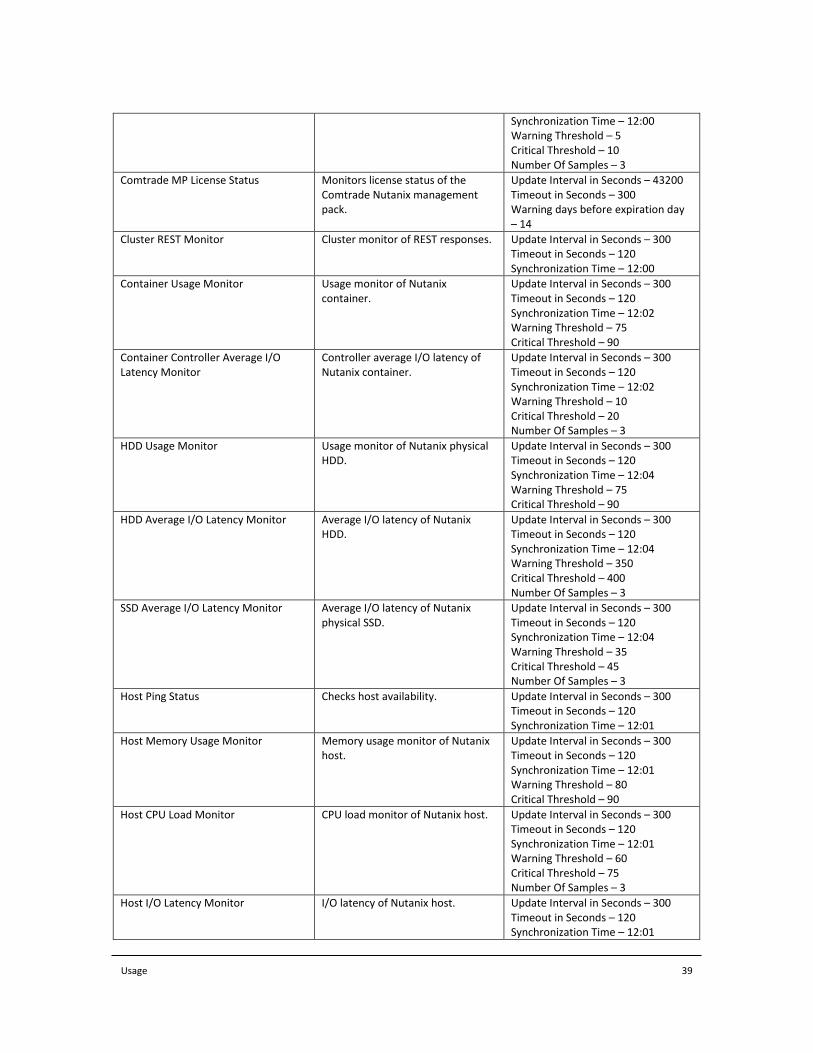
Comtrade MP License Status
Monitors license status of the Comtrade Nutanix management pack.
Update Interval in Seconds – 43200 Timeout in Seconds – 300 Warning days before expiration day – 14
Cluster REST Monitor
Cluster monitor of REST responses. Update Interval in Seconds – 300 Timeout in Seconds – 120 Synchronization Time – 12:00
Container Usage Monitor
Usage monitor of Nutanix container.
Update Interval in Seconds – 300 Timeout in Seconds – 120 Synchronization Time – 12:02 Warning Threshold – 75 Critical Threshold – 90
Container Controller Average I/O Latency Monitor
Controller average I/O latency of Nutanix container.
Update Interval in Seconds – 300 Timeout in Seconds – 120 Synchronization Time – 12:02 Warning Threshold – 10 Critical Threshold – 20 Number Of Samples – 3
HDD Usage Monitor
Usage monitor of Nutanix physical HDD.
Update Interval in Seconds – 300 Timeout in Seconds – 120 Synchronization Time – 12:04 Warning Threshold – 75 Critical Threshold – 90
HDD Average I/O Latency Monitor
Average I/O latency of Nutanix HDD.
Update Interval in Seconds – 300 Timeout in Seconds – 120 Synchronization Time – 12:04 Warning Threshold – 350 Critical Threshold – 400 Number Of Samples – 3
SSD Average I/O Latency Monitor
Average I/O latency of Nutanix physical SSD.
Update Interval in Seconds – 300 Timeout in Seconds – 120 Synchronization Time – 12:04 Warning Threshold – 35 Critical Threshold – 45 Number Of Samples – 3
Host Ping Status
Checks host availability. Update Interval in Seconds – 300 Timeout in Seconds – 120 Synchronization Time – 12:01
Host Memory Usage Monitor
Memory usage monitor of Nutanix host.
Update Interval in Seconds – 300 Timeout in Seconds – 120 Synchronization Time – 12:01 Warning Threshold – 80 Critical Threshold – 90
Host CPU Load Monitor
CPU load monitor of Nutanix host.
Update Interval in Seconds – 300 Timeout in Seconds – 120 Synchronization Time – 12:01 Warning Threshold – 60 Critical Threshold – 75 Number Of Samples – 3
Host I/O Latency Monitor
I/O latency of Nutanix host. Update Interval in Seconds – 300 Timeout in Seconds – 120 Synchronization Time – 12:01

Usage 40
Warning Threshold – 70 Critical Threshold – 150 Number Of Samples – 3
Storage Pool Usage Monitor
Usage monitor of the Nutanix storage pool.
Update Interval in Seconds – 300 Timeout in Seconds – 120 Synchronization Time – 12:01 Warning Threshold – 75 Critical Threshold – 90
Storage Pool Average I/O Latency Monitor
Disk average I/O latency of the Nutanix storage pool.
Update Interval in Seconds – 300 Timeout in Seconds – 120 Synchronization Time – 12:01 Warning Threshold – 5 Critical Threshold – 10 Number Of Samples – 3
VM Memory Usage Monitor
Memory usage of the virtual machine.
Update Interval in Seconds – 300 Timeout in Seconds – 120 Synchronization Time – 12:02 Warning Threshold – 80 Critical Threshold – 90
User VM CPU Load Monitor
CPU load monitor of the user virtual machine.
Update Interval in Seconds – 300 Timeout in Seconds – 120 Synchronization Time – 12:02 Warning Threshold – 80 Critical Threshold – 90
VM I/O Latency Monitor
I/O latency of virtual machine. Update Interval in Seconds – 300 Timeout in Seconds – 120 Synchronization Time – 12:02 Warning Threshold – 120 Critical Threshold – 150 Number Of Samples – 3
CVM CPU Load Monitor
CPU load monitor of the controller VM.
Update Interval in Seconds – 300 Timeout in Seconds – 120 Synchronization Time – 12:02 Warning Threshold – 60 Critical Threshold – 75 Number Of Samples – 3
Rules
Nutanix Management Pack provides rules listed in the table that follows. The rules have default thresholds that you can tune to better suit conditions in your environment. For instructions on changing the default thresholds, see Tuning Thresholds for Performance Monitors and Rules.
Table 5.3 Nutanix Management Pack rules
Rule name Description Default values
Cluster CPU Usage
This rule collects the cluster CPU load in percentage.
Update Interval in Seconds – 300 Timeout in Seconds – 120 Synchronization Time – 12:00 Tolerance Type – Absolute Tolerance – 10 Maximum Sample Separation – 3
Cluster Controller I/O Bandwidth This rule collects the total cluster Update Interval in Seconds – 300
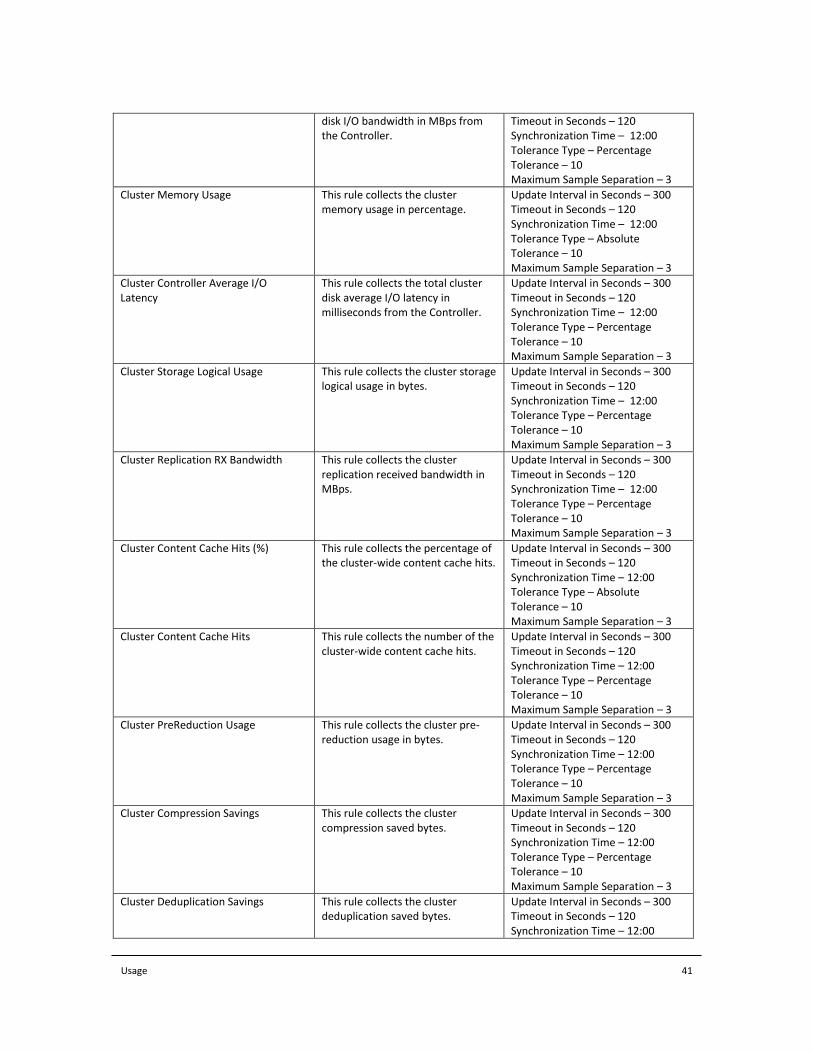
Usage 41
disk I/O bandwidth in MBps from the Controller.
Timeout in Seconds – 120 Synchronization Time – 12:00 Tolerance Type – Percentage Tolerance – 10 Maximum Sample Separation – 3
Cluster Memory Usage
This rule collects the cluster memory usage in percentage.
Update Interval in Seconds – 300 Timeout in Seconds – 120 Synchronization Time – 12:00 Tolerance Type – Absolute Tolerance – 10 Maximum Sample Separation – 3
Cluster Controller Average I/O Latency
This rule collects the total cluster disk average I/O latency in milliseconds from the Controller.
Update Interval in Seconds – 300 Timeout in Seconds – 120 Synchronization Time – 12:00 Tolerance Type – Percentage Tolerance – 10 Maximum Sample Separation – 3
Cluster Storage Logical Usage
This rule collects the cluster storage logical usage in bytes.
Update Interval in Seconds – 300 Timeout in Seconds – 120 Synchronization Time – 12:00 Tolerance Type – Percentage Tolerance – 10 Maximum Sample Separation – 3
Cluster Replication RX Bandwidth
This rule collects the cluster replication received bandwidth in MBps.
Update Interval in Seconds – 300 Timeout in Seconds – 120 Synchronization Time – 12:00 Tolerance Type – Percentage Tolerance – 10 Maximum Sample Separation – 3
Cluster Content Cache Hits (%)
This rule collects the percentage of the cluster-wide content cache hits.
Update Interval in Seconds – 300 Timeout in Seconds – 120 Synchronization Time – 12:00 Tolerance Type – Absolute Tolerance – 10 Maximum Sample Separation – 3
Cluster Content Cache Hits This rule collects the number of the cluster-wide content cache hits.
Update Interval in Seconds – 300 Timeout in Seconds – 120 Synchronization Time – 12:00 Tolerance Type – Percentage Tolerance – 10 Maximum Sample Separation – 3
Cluster PreReduction Usage
This rule collects the cluster pre-reduction usage in bytes.
Update Interval in Seconds – 300 Timeout in Seconds – 120 Synchronization Time – 12:00 Tolerance Type – Percentage Tolerance – 10 Maximum Sample Separation – 3
Cluster Compression Savings
This rule collects the cluster compression saved bytes.
Update Interval in Seconds – 300 Timeout in Seconds – 120 Synchronization Time – 12:00 Tolerance Type – Percentage Tolerance – 10 Maximum Sample Separation – 3
Cluster Deduplication Savings
This rule collects the cluster deduplication saved bytes.
Update Interval in Seconds – 300 Timeout in Seconds – 120 Synchronization Time – 12:00

Usage 42
Tolerance Type – Percentage Tolerance – 10 Maximum Sample Separation – 3
Cluster Storage SSD Usage
This rule collects the cluster storage SSD tier usage in bytes.
Update Interval in Seconds – 300 Timeout in Seconds – 120 Synchronization Time – 12:00 Tolerance Type – Percentage Tolerance – 10 Maximum Sample Separation – 3
Cluster Storage HDD Capacity
This rule collects the cluster storage HDD tier capacity in bytes.
Update Interval in Seconds – 300 Timeout in Seconds – 120 Synchronization Time – 12:00 Tolerance Type – Percentage Tolerance – 10 Maximum Sample Separation – 3
Cluster Storage SSD Capacity
This rule collects the cluster storage SSD tier capacity in bytes.
Update Interval in Seconds – 300 Timeout in Seconds – 120 Synchronization Time – 12:00 Tolerance Type – Percentage Tolerance – 10 Maximum Sample Separation – 3
Cluster Storage HDD Usage This rule collects the cluster storage HDD tier usage in bytes.
Update Interval in Seconds – 300 Timeout in Seconds – 120 Synchronization Time – 12:00 Tolerance Type – Percentage Tolerance – 10 Maximum Sample Separation – 3
Cluster Erasure Savings This rule collects the cluster erasure saved bytes.
Update Interval in Seconds – 300 Timeout in Seconds – 120 Synchronization Time – 12:00 Tolerance Type – Percentage Tolerance – 10 Maximum Sample Separation – 3
Cluster Storage Usage Free This rule collects the cluster free storage in percentage.
Update Interval in Seconds – 300 Timeout in Seconds – 120 Synchronization Time – 12:00 Tolerance Type – Percentage Tolerance – 10 Maximum Sample Separation – 3
Cluster Replication TX Bandwidth This rule collects the cluster replication transmitted bandwidth in MBps.
Update Interval in Seconds – 300 Timeout in Seconds – 120 Synchronization Time – 12:00 Tolerance Type – Percentage Tolerance – 10 Maximum Sample Separation – 3
Cluster Controller IOPS
This rule collects the total cluster disk Input/Output operations per second from the Controller.
Update Interval in Seconds – 300 Timeout in Seconds – 120 Synchronization Time – 12:00 Tolerance Type – Percentage Tolerance – 10 Maximum Sample Separation – 3
Container Reserved Space This rule collects the container reserved space in percentage.
Update Interval in Seconds – 300 Timeout in Seconds – 120 Synchronization Time – 12:02 Tolerance Type – Absolute Tolerance – 10

Usage 43
Maximum Sample Separation – 3
Container Space Usage This rule collects the container space usage in percentage.
Update Interval in Seconds – 300 Timeout in Seconds – 120 Synchronization Time – 12:02 Tolerance Type – Absolute Tolerance – 10 Maximum Sample Separation – 3
Container Unreserved Space Usage Container unreserved space usage in percentage.
Update Interval in Seconds – 300 Timeout in Seconds – 120 Synchronization Time – 12:02 Tolerance Type – Absolute Tolerance – 10 Maximum Sample Separation – 3
Container Controller IOPS
This rule collects the container Controller IOPS.
Update Interval in Seconds – 300 Timeout in Seconds – 120 Synchronization Time – 12:02 Tolerance Type – Percentage Tolerance – 10 Maximum Sample Separation – 3
Container Controller I/O Bandwidth This rule collects the container controller I/O bandwidth in kBps.
Update Interval in Seconds – 300 Timeout in Seconds – 120 Synchronization Time – 12:02 Tolerance Type – Percentage Tolerance – 10 Maximum Sample Separation – 3
Container Controller Average I/O Latency
This rule collects the container controller average I/O latency in milliseconds.
Update Interval in Seconds – 300 Timeout in Seconds – 120 Synchronization Time – 12:02 Tolerance Type – Percentage Tolerance – 10 Maximum Sample Separation – 3
Container Logical Usage This rule collects the container logical usage in bytes.
Update Interval in Seconds – 300 Timeout in Seconds – 120 Synchronization Time – 12:02 Tolerance Type – Percentage Tolerance – 10 Maximum Sample Separation – 3
Host CPU Usage This rule collects the host CPU usage in percentage.
Update Interval in Seconds – 300 Timeout in Seconds – 120 Synchronization Time – 12:01 Tolerance Type – Absolute Tolerance – 10 Maximum Sample Separation – 3
Host Memory Usage This rule collects the host memory usage in percentage.
Update Interval in Seconds – 300 Timeout in Seconds – 120 Synchronization Time – 12:01 Tolerance Type – Absolute Tolerance – 10 Maximum Sample Separation – 3
Host Disk Average I/O Latency This rule collects the host disk average I/O latency in milliseconds.
Update Interval in Seconds – 300 Timeout in Seconds – 120 Synchronization Time – 12:01 Tolerance Type – Percentage Tolerance – 10 Maximum Sample Separation – 3
Host Content Cache Hits This rule collects the number of the Update Interval in Seconds – 300

Usage 44
content cache hits on a host. Timeout in Seconds – 120 Synchronization Time – 12:01 Tolerance Type – Percentage Tolerance – 10 Maximum Sample Separation – 3
Host Disk I/O Bandwidth This rule collects the host disk I/O bandwidth in MBps.
Update Interval in Seconds – 300 Timeout in Seconds – 120 Synchronization Time – 12:01 Tolerance Type – Percentage Tolerance – 10 Maximum Sample Separation – 3
Host Disk IOPS This rule collects the host disk IOPS. Update Interval in Seconds – 300 Timeout in Seconds – 120 Synchronization Time – 12:01 Tolerance Type – Percentage Tolerance – 10 Maximum Sample Separation – 3
Host Content Cache Hits This rule collects the percent of content cache hits on a host.
Update Interval in Seconds – 300 Timeout in Seconds – 120 Synchronization Time – 12:01 Tolerance Type – Absolute Tolerance – 10 Maximum Sample Separation – 3
Disk Usage This rule collects the disk usage in percentage.
Update Interval in Seconds – 300 Timeout in Seconds – 120 Synchronization Time – 12:04 Tolerance Type – Absolute Tolerance – 10 Maximum Sample Separation – 3
Disk Free Space This rule collects the total free disk space in percentage.
Update Interval in Seconds – 300 Timeout in Seconds – 120 Synchronization Time – 12:04 Tolerance Type – Absolute Tolerance – 10 Maximum Sample Separation – 3
Disk IOPS This rule collects the total disk IOPS.
Update Interval in Seconds – 300 Timeout in Seconds – 120 Synchronization Time – 12:04 Tolerance Type – Percentage Tolerance – 10 Maximum Sample Separation – 3
Disk I/O Bandwidth This rule collects the total disk I/O bandwidth in MBps.
Update Interval in Seconds – 300 Timeout in Seconds – 120 Synchronization Time – 12:04 Tolerance Type – Percentage Tolerance – 10 Maximum Sample Separation – 3
Disk Average I/O Latency This rule collects the disk average I/O latency in milliseconds.
Update Interval in Seconds – 300 Timeout in Seconds – 120 Synchronization Time – 12:04 Tolerance Type – Percentage Tolerance – 10 Maximum Sample Separation – 3
Remote Site Bytes – Transmitted This rule collects the Remote Site transmitted bytes.
Update Interval in Seconds – 300 Timeout in Seconds – 120 Synchronization Time – 12:01
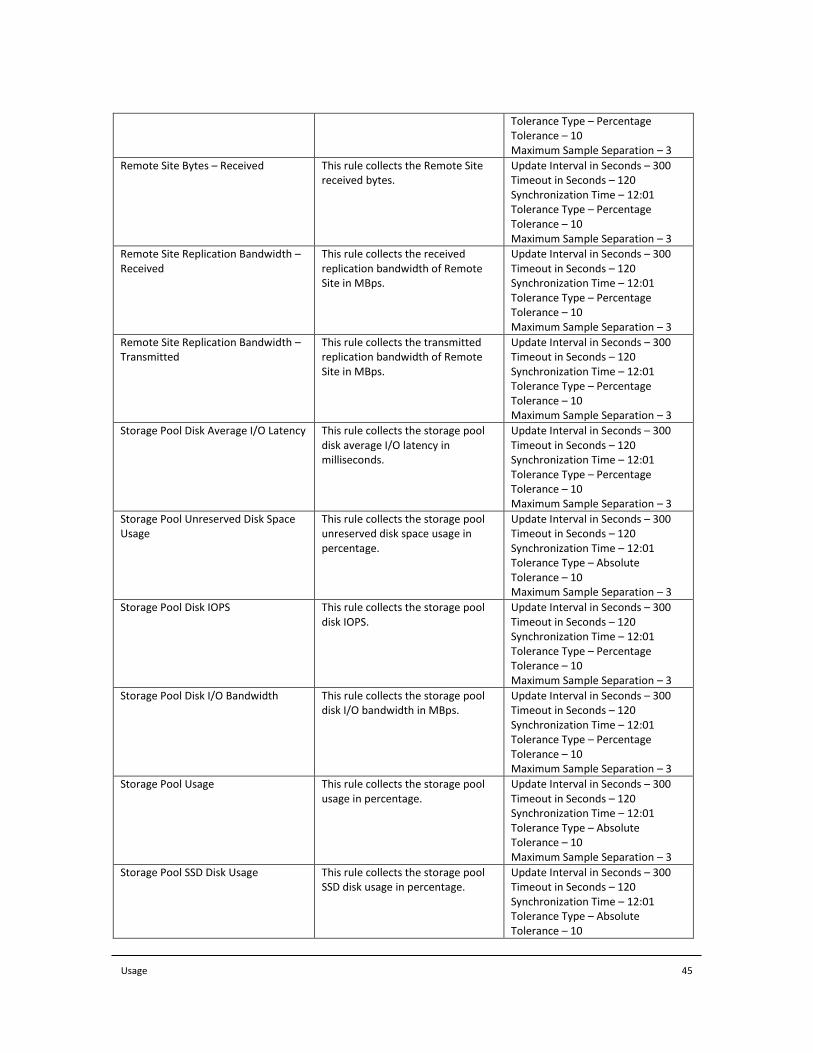
Usage 45
Tolerance Type – Percentage Tolerance – 10 Maximum Sample Separation – 3
Remote Site Bytes – Received This rule collects the Remote Site received bytes.
Update Interval in Seconds – 300 Timeout in Seconds – 120 Synchronization Time – 12:01 Tolerance Type – Percentage Tolerance – 10 Maximum Sample Separation – 3
Remote Site Replication Bandwidth – Received
This rule collects the received replication bandwidth of Remote Site in MBps.
Update Interval in Seconds – 300 Timeout in Seconds – 120 Synchronization Time – 12:01 Tolerance Type – Percentage Tolerance – 10 Maximum Sample Separation – 3
Remote Site Replication Bandwidth – Transmitted
This rule collects the transmitted replication bandwidth of Remote Site in MBps.
Update Interval in Seconds – 300 Timeout in Seconds – 120 Synchronization Time – 12:01 Tolerance Type – Percentage Tolerance – 10 Maximum Sample Separation – 3
Storage Pool Disk Average I/O Latency This rule collects the storage pool disk average I/O latency in milliseconds.
Update Interval in Seconds – 300 Timeout in Seconds – 120 Synchronization Time – 12:01 Tolerance Type – Percentage Tolerance – 10 Maximum Sample Separation – 3
Storage Pool Unreserved Disk Space Usage
This rule collects the storage pool unreserved disk space usage in percentage.
Update Interval in Seconds – 300 Timeout in Seconds – 120 Synchronization Time – 12:01 Tolerance Type – Absolute Tolerance – 10 Maximum Sample Separation – 3
Storage Pool Disk IOPS This rule collects the storage pool disk IOPS.
Update Interval in Seconds – 300 Timeout in Seconds – 120 Synchronization Time – 12:01 Tolerance Type – Percentage Tolerance – 10 Maximum Sample Separation – 3
Storage Pool Disk I/O Bandwidth This rule collects the storage pool disk I/O bandwidth in MBps.
Update Interval in Seconds – 300 Timeout in Seconds – 120 Synchronization Time – 12:01 Tolerance Type – Percentage Tolerance – 10 Maximum Sample Separation – 3
Storage Pool Usage This rule collects the storage pool usage in percentage.
Update Interval in Seconds – 300 Timeout in Seconds – 120 Synchronization Time – 12:01 Tolerance Type – Absolute Tolerance – 10 Maximum Sample Separation – 3
Storage Pool SSD Disk Usage
This rule collects the storage pool SSD disk usage in percentage.
Update Interval in Seconds – 300 Timeout in Seconds – 120 Synchronization Time – 12:01 Tolerance Type – Absolute Tolerance – 10

Usage 46
Maximum Sample Separation – 3
Storage Pool SATA Disk Usage
This rule collects the storage pool SATA disk usage in percentage.
Update Interval in Seconds – 300 Timeout in Seconds – 120 Synchronization Time – 12:01 Tolerance Type – Absolute Tolerance – 10 Maximum Sample Separation – 3
Storage Pool Free Disk Space This rule collects the storage pool unreserved free disk space in percentage.
Update Interval in Seconds – 300 Timeout in Seconds – 120 Synchronization Time – 12:01 Tolerance Type – Percentage Tolerance – 10 Maximum Sample Separation – 3
Storage Pool Reserved Disk Space This rule collects the storage pool reserved disk space in percentage.
Update Interval in Seconds – 300 Timeout in Seconds – 120 Synchronization Time – 12:01 Tolerance Type – Absolute Tolerance – 10 Maximum Sample Separation – 3
Protection Domain Bytes – Transmitted
This rule collects the Protection Domain transmitted bytes.
Update Interval in Seconds – 300 Timeout in Seconds – 120 Synchronization Time – 12:01 Tolerance Type – Percentage Tolerance – 10 Maximum Sample Separation – 3
Protection Domain Bytes – Received This rule collects the Protection Domain received bytes.
Update Interval in Seconds – 300 Timeout in Seconds – 120 Synchronization Time – 12:01 Tolerance Type – Percentage Tolerance – 10 Maximum Sample Separation – 3
Protection Domain Replication Bandwidth – Transmitted
This rule collects the transmitted replication bandwidth of the Nutanix Protection Domain in MBps.
Update Interval in Seconds – 300 Timeout in Seconds – 120 Synchronization Time – 12:01 Tolerance Type – Percentage Tolerance – 10 Maximum Sample Separation – 3
Protection Domain Replication Bandwidth – Received
This rule collects the received replication bandwidth of the Nutanix Protection Domain in MBps.
Update Interval in Seconds – 300 Timeout in Seconds – 120 Synchronization Time – 12:01 Tolerance Type – Percentage Tolerance – 10 Maximum Sample Separation – 3
Virtual Machine CPU Usage This rule collects the virtual machine CPU load in percentage.
Update Interval in Seconds – 300 Timeout in Seconds – 120 Synchronization Time – 12:02 Tolerance Type – Absolute Tolerance – 10 Maximum Sample Separation – 3
Virtual Machine Memory Usage
This rule collects the virtual machine memory usage in percentage.
Update Interval in Seconds – 300 Timeout in Seconds – 120 Synchronization Time – 12:02 Tolerance Type – Absolute Tolerance – 10 Maximum Sample Separation – 3
Virtual Machine Controller Average This rule collects the virtual Update Interval in Seconds – 300

Usage 47
I/O Latency machine controller average I/O latency in milliseconds.
Timeout in Seconds – 120 Synchronization Time – 12:02 Tolerance Type – Percentage Tolerance – 10 Maximum Sample Separation – 3
Virtual Machine Controller IOPS This rule collects the virtual machine controller IOPS.
Update Interval in Seconds – 300 Timeout in Seconds – 120 Synchronization Time – 12:02 Tolerance Type – Percentage Tolerance – 10 Maximum Sample Separation – 3
Virtual Machine Controller I/O Bandwidth
This rule collects the virtual machine controller I/O bandwidth in MBps.
Update Interval in Seconds – 300 Timeout in Seconds – 120 Synchronization Time – 12:02 Tolerance Type – Percentage Tolerance – 10 Maximum Sample Separation – 3
Reports
Nutanix Management Pack provides reports listed in the table that follows. The reports are available in the SCOM Operations console in the Reporting view, in the Comtrade Management Pack for Nutanix (Reports) folder.
To generate and view a report, double-click its name. You can export reported data from SCOM in various formats: XML, CSV (comma delimited), PDF, MHTML (web archive), Excel, TIFF file, Word.
Table 5.4 Nutanix Management Pack reports
Report name Description
Nutanix Enterprise Cloud Infrastructure Capacity Planning Report
This report provides retrospective data on utilization of the Nutanix resources, such as storage capacity, memory capacity, and CPU capacity per each cluster and for the entire environment in total. It also helps you recognize when you can run out of these resources, so that you can plan sizing of Nutanix Cluster and add more resources to the cluster when needed. The data is presented in tables and graphs.
Nutanix Enterprise Cloud Infrastructure Report
This report provides information on current resource consumption for Nutanix Clusters and detailed data on the Nutanix hosts and their hardware configuration, CPU capacity, CPU Cores, memory, storage, and VMs per each cluster and for the entire environment in total. It also describes the Nutanix resource utilization per cluster. This report is used for quickly get a list of your available Nutanix hardware used in Nutanix Clusters. The data is presented in tables and charts.
Nutanix Enterprise Clouds VM Sizing Report
This report provides detailed data on CPU and memory sizing of the virtual machines hosted in the Nutanix environment. This report identifies VMs that are oversized or undersized regarding CPU or memory and it also suggests the recommended resource allocation for them. Knowing which VMs are oversized and get their sizing recommendation helps freeing some of their resources, so that they are available for other VMs. The data is presented in tables and charts.
Nutanix Storage VM Density Report This report lists utilization of the Nutanix Storage pools and containers, sorts them by number of VMs that are hosted on them,

Usage 48
displays some historic utilization trends and SSD Vs HDD ratio, which prompts you whether you must add more SSD drives to the system or not. It helps you identify which containers are not active and can be deleted to release their reserved space for other containers.
Tasks
Through its Application Awareness feature, Nutanix Management Pack provides Nutanix virtual machines-related tasks. The tasks are available in the SCOM Operations console in the Monitoring view, in the Tasks pane, when a virtual machine is selected in the Table User VMs table.
Table 5.5 Nutanix Management Pack tasks
Task name Description
Processes on VM By CPU Usage A list of the currently running top processes by CPU usage on a VM. With this information, you can immediately recognize the process that causes high resource consumption and decide, whether there is some unwanted software on a VM causing this high resource consumption or if this is a consequence of a bigger load for applications running on it and more resources should be assigned to the VM.
Processes on VM By Memory Usage A list of the currently running top processes by memory usage on a VM. With this information, you can immediately recognize the process that causes high resource consumption and decide, whether there is some unwanted software on a VM causing this high resource consumption or if this is a consequence of a bigger load for applications running on it and more resources should be assigned to the VM.
Tuning Thresholds for Performance Monitors and Rules
Some monitors and rules have default thresholds that might need additional tuning to suit your environment. You should evaluate monitors and rules to determine whether the default thresholds are appropriate. If a default threshold is not appropriate, baseline the relevant performance counters and then adjust the thresholds by overriding them.
For the detailed procedure on how to override the monitor or rule default values, see the SCOM documentation. For an example on how to override a monitor, see Override Default Values in Monitors and Rules. For a list of the monitors and rules which default parameters you can adjust, see Monitors and Rules.
Override Default Values in Monitors and Rules
There are several approaches on how to change the default thresholds in monitors and rules. You can make changes from different contexts and for different sets of objects. For the detailed and up-to-date procedures on how to override the monitor or rule default values, see the SCOM documentation.
For example, to change the default monitor thresholds for all objects of the same class, do the following:

Usage 49
1. Launch the SCOM Operations console and connect to the management server.
2. In the Authoring view, expand Authoring and then click Monitors. A list of the available monitors appears.
3. In the Look for text box, type the name of the monitor you want to update and then click Find Now.
4. In the results pane, right-click the monitor you want to update and then select Overrides > Override the Monitor > For all objects of class.
5. In the Override Properties window, locate and select the parameter you want to override.
6. For the selected parameter, change the default value in the Override Value column.
7. From the Management pack drop-down list, select an existing management pack (for example, Microsoft.SystemCenter.SecureReferenceOverride) or create a new one, and then click Apply to apply a new threshold value.
8. Click OK.
SuperPacks: Citrix XenApp and XenDesktop
The Citrix XenApp and XenDesktop (SuperPacks) dashboards are available in the SCOM Operations console in the Monitoring view, in the Comtrade Nutanix SuperPacks folder.
Table 5.6 Citrix XenApp and XenDesktop (SuperPacks) dashboards
Dashboard name Description
Citrix Delivery Groups and Nutanix Resources
The dashboard displays Citrix delivery groups with the corresponding available load and average logon duration. For each delivery group, top 10 server or desktop OS machines per CPU, Memory, IOPS, and I/O latency are listed to enable detecting of any excessive machine resource usage. All information on the dashboard is the latest snapshot of the environment. With this dashboard, you are able to detect potential resource issues for the delivery groups and remediate the situation by, for example, giving more resources to the server and desktop OS machines.
Citrix Logon Duration and Nutanix Resources
The dashboard displays how Citrix site logon duration and number of logons is related to the Nutanix cluster resource usage parameters like CPU, Memory, I/O latency, etc. during the last 24 hours. It helps you to detect any potential resource bottlenecks during the logon storm.
Citrix Machines IO Latency Alerts The dashboard displays alerts generated due to poor I/O latency detected in the monitored Nutanix infrastructure. It also presents lists of Nutanix storage pools and Nutanix containers with impact on performance of Citrix server OS or desktop OS machines, together with a list of such OS machines. A graph is included that shows I/O latency for each depicted storage pool or container through the last 24 hours.
Citrix Machines Storage Capacity Alerts The dashboard displays alerts generated due to high storage utilization detected in the monitored Nutanix infrastructure. It also presents lists of Nutanix storage pools and Nutanix containers with impact on performance of Citrix server OS or desktop OS machines, together with a list of such OS machines. A graph is included that shows storage utilization for each depicted storage pool or container through the last 24 hours.
Citrix Server OS Machines and Nutanix Resources
The dashboard displays all server OS machines for the selected Citrix site with Citrix load information. In addition, the top 10 server or desktop OS machines per CPU, Memory, IOPS, and I/O latency are listed with the basic Nutanix cluster resource usage information. All information on the dashboard is the latest snapshot of the environment. With this

Usage 50
dashboard you can detect any server OS machines with excessive resource usage.
Citrix Sessions and Nutanix Resources The dashboard displays how Citrix site sessions are related to the Nutanix cluster resource usage parameters like CPU, Memory, I/O latency, etc. during the last 24 hours. It helps you to detect any potential resource bottlenecks during normal usage and allows you to plan resources based on the real usage pattern.
SuperPacks: Microsoft Exchange Server
The Microsoft Exchange Server (SuperPacks) dashboards are available in the SCOM Operations console in the Monitoring view, in the Comtrade Nutanix SuperPacks folder.
Table 5.7 Microsoft Exchange Server (SuperPacks) dashboards
Dashboard name Description
Exchange Server IO Latency Alerts The dashboard displays alerts generated due to poor I/O latency detected in the monitored Nutanix infrastructure. It also presents lists of Nutanix storage pools and Nutanix containers with impact on performance of computers that host Microsoft Exchange Server, together with a list of such computers. A graph is included that shows I/O latency for each depicted storage pool or container through the last 24 hours.
Exchange Server Storage Capacity Alerts The dashboard displays alerts generated due to high storage utilization detected in the monitored Nutanix infrastructure. It also presents lists of Nutanix storage pools and Nutanix containers with impact on performance of computers that host Microsoft Exchange Server, together with a list of such computers. A graph is included that shows storage utilization for each depicted storage pool or container through the last 24 hours.
SuperPacks: Microsoft SQL Server
The Microsoft SQL Server (SuperPacks) dashboards are available in the SCOM Operations console in the Monitoring view, in the Comtrade Nutanix SuperPacks folder.
Table 5.8 Microsoft SQL Server (SuperPacks) dashboards
Dashboard name Description
Overview SQL Server Database Latency The dashboard displays application groups of the Microsoft SQL Server deployments on Nutanix infrastructure. It also presents member computers, Nutanix storage pools, and Nutanix containers associated with the selected application group. A graph is included that shows database disk read/write latency through the last 24 hours. Additional graphs show I/O latency for the selected storage pool and the selected container through the last 24 hours.
SQL Server IO Latency Alerts The dashboard displays alerts generated due to poor I/O latency detected in the monitored Nutanix infrastructure. It also presents lists of Nutanix storage pools and Nutanix containers with impact on performance of computers that host Microsoft SQL Server, together with a list of such computers. A graph is included that shows I/O latency for

Usage 51
each depicted storage pool or container through the last 24 hours.
SQL Server Storage Capacity Alerts The dashboard displays alerts generated due to high storage utilization detected in the monitored Nutanix infrastructure. It also presents lists of Nutanix storage pools and Nutanix containers with impact on performance of computers that host Microsoft SQL Server, together with a list of such computers. A graph is included that shows storage utilization for each depicted storage pool or container through the last 24 hours.

Chapter 6
Troubleshooting

Troubleshooting 53
About Troubleshooting
If you encounter problems with using Nutanix Management Pack, you can often solve them yourself. This chapter is intended to help you.
General Troubleshooting Guidelines
When investigating an issue, first verify that:
All installation prerequisites are fulfilled and the product is configured according to the provided instructions.
You are not running into a known product limitation. Check Comtrade SCOM Management Pack for Nutanix Release Notes.
Your issue is not related to third-party (Nutanix, Microsoft) software or hardware. Otherwise, contact the respective vendor for assistance.
You have the latest operating system and software application patches installed on the affected systems. Else, install the patches and check if the issue persists.
The affected systems are not running out of memory or storage space.
Product Log Files
Nutanix Management Pack records actions performed by Nutanix SCOM Data Collector into log files. Occurrences of unexpected behavior are also added as entries into the log files. You can use the logged information to investigate issues.
Log Files Location
Nutanix Management Pack creates and maintains log files in the %ProgramData%\Comtrade\Nutanix MP\Logs directory. The log file names contain the log file creation date, for example, 2017-04-10.txt. A log file is archived once its size reaches one gigabyte (1 GB). For each day, a maximum of five (5) log files are preserved.
Logging Severity Levels
Log entries have different severity levels. In Nutanix Management Pack, six different severity levels are available.
Table 6.1 Logging severity levels in Nutanix Management Pack
Severity level Log entry meaning
Fatal Severe error
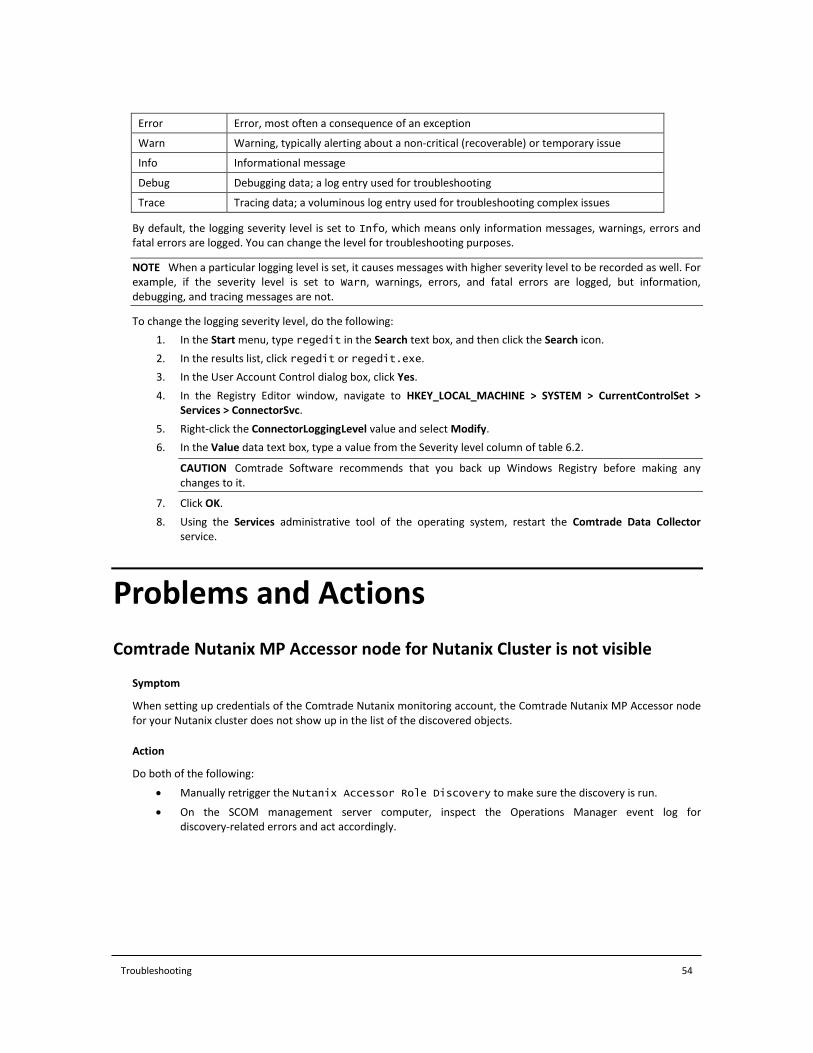
Troubleshooting 54
Error Error, most often a consequence of an exception
Warn Warning, typically alerting about a non-critical (recoverable) or temporary issue
Info Informational message
Debug Debugging data; a log entry used for troubleshooting
Trace Tracing data; a voluminous log entry used for troubleshooting complex issues
By default, the logging severity level is set to Info, which means only information messages, warnings, errors and fatal errors are logged. You can change the level for troubleshooting purposes.
NOTE When a particular logging level is set, it causes messages with higher severity level to be recorded as well. For example, if the severity level is set to Warn, warnings, errors, and fatal errors are logged, but information, debugging, and tracing messages are not.
To change the logging severity level, do the following:
1. In the Start menu, type regedit in the Search text box, and then click the Search icon.
2. In the results list, click regedit or regedit.exe.
3. In the User Account Control dialog box, click Yes.
4. In the Registry Editor window, navigate to HKEY_LOCAL_MACHINE > SYSTEM > CurrentControlSet > Services > ConnectorSvc.
5. Right-click the ConnectorLoggingLevel value and select Modify.
6. In the Value data text box, type a value from the Severity level column of table 6.2.
CAUTION Comtrade Software recommends that you back up Windows Registry before making any changes to it.
7. Click OK.
8. Using the Services administrative tool of the operating system, restart the Comtrade Data Collector service.
Problems and Actions
Comtrade Nutanix MP Accessor node for Nutanix Cluster is not visible
Symptom
When setting up credentials of the Comtrade Nutanix monitoring account, the Comtrade Nutanix MP Accessor node for your Nutanix cluster does not show up in the list of the discovered objects.
Action
Do both of the following:
Manually retrigger the Nutanix Accessor Role Discovery to make sure the discovery is run.
On the SCOM management server computer, inspect the Operations Manager event log for discovery-related errors and act accordingly.

Troubleshooting 55
Nutanix Management Pack discovers nothing
Symptom
Nothing is discovered by Nutanix Management Pack after the product (including the monitoring user accounts) is configured. Action
Do both of the following:
On the SCOM management server computer, inspect the Operations Manager event log for discovery-related errors and act accordingly.
Verify that the Nutanix Accessor objects were successfully discovered as follows:
a. Launch the SCOM Operations console and connect to the management server.
b. In the Monitoring view, in the Monitoring pane, expand Monitoring and click Discovered Inventory.
c. Right-click into the blank area of the Results pane and select Change Target Type.
d. In the Select Items to Target window, select View all targets and then enter the string Accessor into the Look for text box.
e. Locate and select the Comtrade Nutanix Accessor target and then click OK.
f. Verify that the Nutanix Accessor node matches the listed Nutanix Cluster. If the Accessor node is missing, follow instructions in the "Comtrade Nutanix MP Accessor node for Nutanix Cluster is not visible" section.
Graphs User Virtual Machine CPU Load and User Virtual Machine Memory Usage are empty
Symptom
Two graphs from the User VM Performance folder do not contain any data: User Virtual Machine CPU Load, User Virtual Machine Memory Usage. In the Operations Manager event log, an event with the Event ID 22402 is logged.
Action
Increase values of the Update Interval and Timeout Seconds parameters in the respective monitors: User VM CPU Load Monitor, User VM Memory Usage Monitor. Note that value of the Timeout Seconds parameter should be less or equal to value of the Update Interval parameter.
Applications hosted on some virtual machines are not discovered by Application Awareness
Symptom
In the Monitoring view of the SCOM Operations console, in Table: User VMs in the Monitoring > Comtrade Nutanix > Virtual Machines (VMs) folder, indicators of discovered applications are missing for some VMs. When you run the Processes on VM By CPU Usage task for such virtual machine, it reports the following error:
Unable to connect to the remote virtual machine since AppAwareness WinRM Account is not set.
Action
Do the following:

Troubleshooting 56
1. In the SCOM Operations console, switch to the Authoring view.
2. In the console tree, expand Authoring > Management Pack Templates and then select Comtrade Nutanix MP Application Awareness Configuration.
3. Check if management pack templates exist for this monitoring scenario:
If the templates do not exist, see "Configuring the Application Awareness Feature" for instructions on how to configure an appropriate WinRM account.
If the templates already exist, proceed to the next step.
4. In the SCOM Operations console, switch to the Administration view.
5. In the console tree, expand Administration > Run As Configuration > Accounts.
6. In the results pane, in the Type: Basic Authentication list, check each configured ComtradeNutanixAppAwarenessAccount_<Name> account for correct credentials:
a. Double-click the account to open the Run As Account Properties dialog box, then click the Credentials tab.
b. Verify the user name and re-enter the password. If the target VM is a member of a domain, ensure the user name is specified in the <UserName>@<DomainName> format.
c. Click OK to save your changes.
7. Wait until the next discovery cycle and check if the applications are discovered as expected.
Getting Assistance
Depending on the required type of assistance, do the following:
If you need assistance with product evaluation, contact your Account Owner and Sales Representative.
If you already purchased the product, you have a valid support agreements, and:
o You need assistance with product licensing, see "Licensing Assistance".
o You have an issue with the product or your monitored environment, see "Support".
Licensing Assistance
Depending on the service that you need, refer to the following:
To generate license request files and activate them, follow instructions in the "Product Licensing" chapter.
To change license scope and arrange any license management activities, contact your Sales Representatives at the email address [email protected].
To redesignate licenses (deactivate existing licenses), go to the MP Licensing Portal website at managementpacks.comtrade.com/mp-licensing/. Sign in to your account and follow the License Redesignation steps.
For any licensing-related issues or questions about the licensing process, send an email with detailed issue description (expected behavior, symptoms, screen shots, log files, and similar) or list of questions to [email protected].
NOTE Make sure to include your company name and purchase order (PO) number in communication with the Licensing Department.
Troubleshooting 57
Support
If you have an issue with the product or your monitored environment, collect the following data before contacting the Customer Support department:
1. General information: o Your company name o Purchase order (PO) number
2. Basic information about the environment such as: o Host operating system o Microsoft System Center Operations Manager version o Nutanix AOS version o Version of the installed Nutanix Management Pack (the product) o Whether you are still evaluating or already using the product o Whether the product is installed in a development or production environment
3. Additional information such as: o Whether the product was installed or it was upgraded from an earlier version o Time when the product was installed o Time when the product was most recently reconfigured o Time when you first noticed issue symptoms o Versions of the monitored applications o Operating systems on which monitored applications are running o Whether the host operating system or managed environment were updated recently
4. Detailed explanation of the issue, including: o Expected behavior o Issue symptoms o Screen shots of the user interfaces o List of troubleshooting actions that you have already taken
The above data is required by the Customer Support department so that a Customer Support engineer can efficiently investigate the issue from the very beginning. Pack collected support information into an archive and send it to support‐[email protected].
IMPORTANT If the email attachment is too large or the email is getting rejected by the company email server, deliver the archive by using Comtrade File Sharing Facility.
To deliver data by using Comtrade File Sharing Facility, do the following:
1. Go to the filex.comtrade.com website.
2. Click SHARE A FILE NOW and then click Browse.
3. In the Choose File to Upload dialog box, browse to and select your archive file, and then click Open.
4. Repeat step 3 for each additional file you want to send.
5. On the Comtrade File Sharing Facility webpage, click Upload Now and then allow file processing to finish.
6. In the To: text box, type [email protected] and leave other text boxes blank.
7. At the bottom of the webpage, type the given anti-spam verification code in the corresponding text box.
8. Click Process Details Now.

Troubleshooting 58
Getting Additional Information and Latest Updates
For additional information about Nutanix Management Pack, visit the product webpage at: www.comtradesoftware.com/nutanix-scom-mp
For the latest product version and most up-to-date documentation, go to the product download webpage at: managementpacks.comtrade.com/downloadarea/nutanixmp/release/index.html
Before Contacting Comtrade Software Customer Support
If you cannot solve your issue, report it. Before contacting Comtrade Software Customer Support, make sure that:
You have performed the general checks. See "General Troubleshooting Guidelines".
You have verified that your problem is not documented in this chapter. See "Problems and Actions".
You have collected relevant data that might be required to send to Comtrade Software Customer Support: a description of your problem, configuration specification of your environment, and similar information. For a complete list, see "Customer Support".
The Comtrade Software Customer Support personnel will then provide you with further instructions. Among other things, you may be asked to perform diagnostic operations in your environment and collect specific data from your systems and send it to Comtrade Software.
NOTE The Comtrade Software Customer Support personnel are not qualified to solve issues related to third-party software or hardware.
For information on how to reach Comtrade Software Customer Support, see "Comtrade Software Customer Support and Information".

Appendix A
Manual Configuration Procedures

Manual Configuration Procedures 60
Setting up Accounts Manually
Nutanix Management Pack provides configuration wizards to simplify and automate configuration tasks. For information on automatic configuration, see "Configuring Nutanix Management Pack Connections" and "Configuring the Application Awareness Feature". However, you can also perform some configuration tasks manually. This appendix contains procedures for setting up accounts that are specific for Nutanix Management Pack.
Setting up Action Account for Monitoring Nutanix Infrastructure
Before manually setting up action account for monitoring Nutanix infrastructure, make sure that the Application Awareness prerequisites listed in "Configuring Nutanix Management Pack" are fulfilled.
To set up Nutanix monitoring action account (Comtrade MP for Nutanix Monitoring Account), do the following:
1. Launch the SCOM Operations console and connect to the management server.
2. In the Administration view, expand Run As Configuration, and then click Profiles.
3. In the results pane, double-click Comtrade MP for Nutanix Monitoring Account.
4. In the Run As Profile Wizard window, click Run As Accounts. In the Run As Accounts page, click Add.
5. In the Add a Run As Account dialog box, click New to open Create Run As Account Wizard.
6. In the Create Run As Account Wizard window, click Next.
7. In the General Properties page, from the Run As account type drop-down list, select Basic Authentication.
8. In the Display name text box, enter account name as it will be displayed in the SCOM Operations console. Click Next.
9. In the Credentials page, enter valid Nutanix Prism user account credentials in the respective text boxes. Click Next.
10. In the Distribution Security page, make your selection as appropriate and then click Create.
11. Upon notification about successful Run As account creation, click Close to close the wizard.
12. In the Add a Run As Account dialog box, click A selected class, group, or object. From the Select drop-down list, select Object.
13. In the Object Search dialog box, from the Look for drop-down list, select Comtrade Nutanix Accessor, and then click Search.
14. In the Available items list, select the Nutanix cluster you want to associate with this account, and then click Add. Click OK to close the Object Search dialog box.
NOTE If a name of the cluster node is listed instead of the cluster name, select the node name.
15. Click OK to close the Add a Run as Account dialog box.
16. In the Run As Profile Wizard window, review your configuration and then click Save to save your changes.
17. Upon warning about Run As credentials distribution, in the More-secure Run As accounts list, click the newly created account.
18. Use controls in the Run As Account properties dialog box and Computer Search window to distribute credentials of the Run As account to each member of Comtrade Nutanix Management Pool.

Manual Configuration Procedures 61
Setting up Action Account for Application Awareness
Before manually setting up action account for Application Awareness, make sure that the Application Awareness prerequisites listed in "Configuring Nutanix Management Pack" are fulfilled.
To set up Application Awareness action account (Comtrade MP for Nutanix AppAwareness WinRM Account) and enable application discovery and monitoring, do the following:
1. Launch the SCOM Operations console and connect to the management server.
2. In the Administration view, expand Run As Configuration, and then click Profiles.
3. In the results pane, double-click Comtrade MP for Nutanix AppAwareness WinRM Account.
4. In the Run As Profile Wizard window, click Run As Accounts. In the Run As Accounts page, click Add.
5. In the Add a Run As Account dialog box, click New to open Create Run As Account Wizard.
6. In the Create Run As Account Wizard window, click Next.
7. In the General Properties page, from the Run As account type drop-down list, select Basic Authentication.
8. In the Display name text box, enter account name as it will be displayed in the SCOM Operations console. Click Next.
9. In the Credentials page, enter valid local administrative user account credentials in the respective text boxes. Click Next.
10. In the Distribution Security page, make your selection as appropriate and then click Create.
11. Upon notification about successful Run As account creation, click Close to close the wizard.
1. In the Add a Run As Account dialog box, click A selected class, group, or object. From the Select drop down list, select one of the following:
o Object, to use the user account in all your environments in the single domain in the cluster. In the Object Search window, search for Comtrade Nutanix Accessor, then select the cluster you want to associate with this account, click Add, and then click OK.
NOTE If a name of the cluster node is listed instead of the cluster name, select the node name.
o Groups, to use the user account in a specific domain within the cluster. In the Group Search window, search for the group that was created with the Comtrade Nutanix MP Application Awareness Configuration wizard to associate with this account. Select a group created with a template and then click OK.
12. Click OK to close the Add a Run as Account dialog box.
13. In the Run As Profile Wizard window, review your configuration and then click Save to save your changes.
14. Upon warning about Run As credentials distribution, in the More-secure Run As accounts list, click the newly created account.
15. Use controls in the Run As Account properties dialog box and Computer Search window to distribute credentials of the Run As account to each member of Comtrade Nutanix Management Pool.
Setting up Action Account for Individual Monitored Applications
To complete configuration of Application Awareness, you must perform additional configuration steps for each application that you plan to monitor. For a list of the supported applications, see Comtrade SCOM Management Pack for Nutanix Compatibility Matrix Guide.
IMORTANT To configure different application administrative user accounts for use in different environments, make sure that application objects are already discovered and available. Application discovery on virtual machines usually

Manual Configuration Procedures 62
takes approximately 24 hours to complete. Application objects are therefore not available immediately after the product is installed.
To set up action accounts for individual monitored applications, do the following:
2. Launch the SCOM Operations console and connect to the management server.
3. In the Administration view, expand Run As Configuration, and then click Profiles.
4. Depending on the application you plan to monitor, double-click one of the following: – Comtrade MP for Nutanix AppAwareness Citrix Admin Account – Comtrade MP for Nutanix AppAwareness Microsoft Exchange Admin Account – Comtrade MP for Nutanix AppAwareness Microsoft SharePoint Admin Account – Comtrade MP for Nutanix AppAwareness Microsoft SQL Admin Account
5. In the Run As Profile Wizard window, click Run As Accounts. In the Run As Accounts page, click Add.
6. In the Add a Run As Account dialog box, click New to open Create Run As Account Wizard.
7. In the Create Run As Account Wizard window, click Next.
8. In the General Properties page, from the Run As account type drop-down list, select Basic Authentication.
9. In the Display name text box, enter account name as it will be displayed in the SCOM Operations console. Click Next.
10. In the Credentials page, enter valid application administrative user account credentials in the respective text boxes. Click Next.
11. In the Distribution Security page, make your selection as appropriate and then click Create.
12. Upon notification about successful Run As account creation, click Close to close the wizard.
13. In the Add a Run As Account dialog box, click A selected class, group, or object. From the Select drop down list, select one of the following:
o Object, to use the user account in all your environments in the single domain in the cluster. In the Object Search window, search for Comtrade Nutanix Accessor, then select the cluster you want to associate with this account, click Add, and then click OK.
NOTE If a name of the cluster node is listed instead of the cluster name, select the node name.
o Groups, to use the user account in a specific domain within the cluster. In the Group Search window, search for the group that was created with the Comtrade Nutanix MP Application Awareness Configuration wizard to associate with this account. Select a group created with a template and then click OK.
14. Click OK to close the Add a Run as Account dialog box.
15. In the Run As Profile Wizard window, review your configuration and then click Save to save your changes.
16. Upon warning about Run As credentials distribution, in the More-secure Run As accounts list, click the newly created account.
17. Use controls in the Run As Account properties dialog box and Computer Search window to distribute credentials of the Run As account to each member of Comtrade Nutanix Management Pool.
Appendix B
Comtrade Software Customer Support and Information

Comtrade Software Customer Support and Information 64
Contacting Comtrade Software
Use the following email and webpage addresses if you need:
Additional information about this product
Help with the product licensing process
Assistance while using the product
Information about other Comtrade Software products
Customer Support
Should you require additional information or assistance while using the product, contact the vendor that shipped it. If you have purchased the product directly from Comtrade Software, submit your query through the following webpage: www.comtradesoftware.com/tech-support/
Important: Before contacting support department, perform a health check on all systems that are in failed (critical, red) state and have the following information ready:
Symptoms
Sequence of events leading to the problem
Commands and options that you used
Messages you have received (a description with the date and time)
For a complete list of required support information, check troubleshooting sections in the product documentation.
Company Website and Video Channel
For more information about our company and other products we offer, visit Comtrade Software website at: www.comtradesoftware.com
For additional product-related information, check out videos on the Comtrade Software channel on YouTube: www.youtube.com/user/comtradeproducts
General Information
For questions related to product business or purchase of this or other Comtrade Software products, send an email to: [email protected]

Support Services and Product Information 65
Feedback
For comments or suggestions about this product, including its documentation, send an email to: [email protected]
We will be glad to hear from you!