concentration of dissolved gases in the willamette ... · concentration of dissolved gases in the...
TRANSCRIPT
NMFS DATA REPORT 102
Concentration of Dissolved Gases in the Willamette Cowlitz and Boise Rivers 1970-72
BRUCE H MONK EARL DAWLEY and KIRK BEININGEN
SEATTLE WA
June 1975
~~
c
UNITED STATES NATIONAL OCEANIC AND National Marine DEPARTMENT OF COMMERCE ATMOSPHERIC ADMINISTRATION Fisheries Service Roprs C B MortH SecFltary Robert M White Administrator Robert W Schon lng Director
~ nATM(JS~111~ -1 11
~ ~ ~
- P ltlOl iY
1~iIltoNT Of c
CONTENTS Page
Introduction 1Procedure 1 Presentation of data 2 Literature cited 2
Figures
1 Map of Columbia River drainage showing locations of tributaries sampled to determine concentration of dissolved atmospheric gases 3
2 Map of Willamette River drainage Numbers indicate dams where water was sampled to determine concentration of dissolved atmospheric gases 4
3 Map of Cowlitz River and Boise River Numbers indicate dams where water was sampled to determine concentration of dissolved atmospheric gases 5
Tables
1 Concentrations of dissolved atmospheric gases and related water temperatures at Hills Creek Dam bull 6shy
2 Concentrations of dissolved atmospheric gases and related water temperatures at Lookout Point Dam ~ 7
3 Concentrations of dissolved atmospheric gases and related water temperatures at Dexter Dam 8
4 Concentrations of dissolved atmospheric gases and related water temperatures at Fall Creek Dam 9
5 Concentrations of dissolved atmospheric gases and related water temperatures at Cougar Dam 10
6 Concentrations of dissolved atmospheric gases and related water temperatures at Blue River Dam 11
7 Concentrations of dissolved atmospheric gases and related water temperatures at Green Peter Dam 12
8 Concentrations of dissolved atmospheric gases and related water temperatures at Foster Dam 14
9 Concentrations of dissolved atmospheric gases and related water temperatures at Detroit Dam 16
10 Concentrations of dissolved atmospheric gases and related water temperatures at Big Cliff Dam 17
11 Concentrations of dissolved atmospheric gases and r~lated water temperatures at Lucky Peak Dam 18
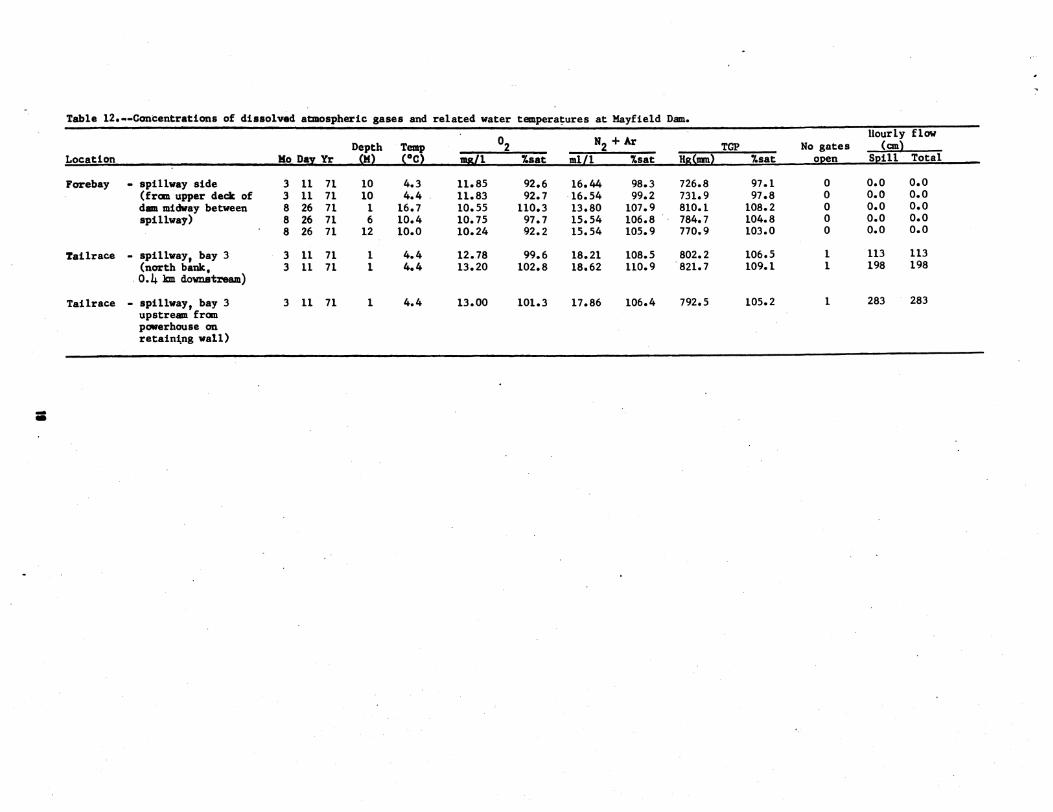
12 Concentrations of dissolved atmospheric gases and related water temperatures at Mayfield Dam 19
The National Marine Fisheries Service (NMFS) does not approve recshyommend or endorse any proprietary product or proprietary material mentioned in this publication No reference shall be made to NMFS or to this publication furnished by NMFS in any advertising or sales proshymotion which would indicate or imply that NMFS approves recommends or endorses any proprietary product or proprietary material mentioned herein or which has ~~ its purpose an intent to cause directly or indirectly the advertised product to be used or purchased because of this NMFS publication
iii
-
t 1
Concentration of Dissolved Gases in the Willamette Cowlitz and Boise Rivers 1970-72
BRUCE H MONK1 EARL DAWLEY1 and KIRK BEININGEN2
ABSTRACT Data on dissolved nitrogen dissolved oxygen total gas pressure and water
temperatures are presented for the Wlllamette Cowlitz and Boise rivers Water samples were taken upstream and downstream of dams and over a wide range of river and dam discharges to obtain data on the relation between river flow and dam discharges and their effect on the total gas regime of the rivers
INTRODUCTION
In recent years fishery scientists have shown that high concentrations of dissolved atmospheric gases in the Columbia and lower Snake rivers cause gas bubble disease and during years of high flow can result in up to 68 mortality of juvenile and adult Pacific salmon Oncorhynchus spp and steelhead trout Samo gairdneri (Ebel 1971 1973) The high concentrations occur when air is entrained in water passing over spillways and forced into solution by high pressures in the stilling basin (Ebel 1969 Beiningen and Ebel 1970)
In 1970 fishery agencies and the US Army Corps of Engineers became concerned that heavy spilling of water over Lost Creek Dam (now under construction 247 km from the mouth of th~ Rogue River) would create supersaturated concentrashytions of dissolved gas harmful to native stocks of salmon and steelhead trout and to hatcheryshyreleased stocks of coho salmon O kisutch and fall chinook salmon O tshawytscha Hatchery stocks could also be affected by supersaturated water supplied to the hatchery by a regulating reservoir downstream from the dam Therefore a nitrogen monitoring program was established at various hydroelectric projects which would be pertinent to spillway design modifications at Lost Creek Dam The program included many projects on the Willamette Valley system Lucky Peak Dam on the Boise River and Mayfield Dam on the Cowlitz River (Figs 1 2 3) There was also concern over the possibility of high concenshytrations in the reservoirs below Green Peter Dam and Lookout Point Dam (Fig 2) which supply
1 Northwest Fisheries Center National Marine Fisheries Service NOAA Seattle WA 98112
2Fish CommiSSion of Oregon Clackamas OR 97015
water for South Santlam Hatchery and Dexter Rearing Ponds respectively (operated by Fish Commission of Oregon)
To determine whether discharges from the dams on the Willamette and Cowlitz River systems would create supersaturated concenshytrations of dissolved gas extensive sampling and analysis for dissolved gases was done during 1970 1971 and 1972 Samples were taken near dams over a wide range of river flow and spillway and regulating outlet discharges (regulating outlets are low level valved gates used to draw down reservoir water levels farther than pOSsible by spilling) to obtain data on the relation between river flow and dam discharges and their effect on the total gas regime of the rivers
Atlditlonal samples were taken at Lucky Peak Dam on the Boise River (Fig 3) to determine the concentrations of dissolved gases below a flip bucket designed to diSSipate energy In the spillrace and thereby eliminate supersaturated concentrations The US Army Corps of Engishyneers felt that such deflectors if effective could be a possible answer to the potential supershysaturation problem at Lost Creek Dam
This report presents data on gas concentrations and related water temperatures of water samples taken at forebays and tailraces of dams In the Willamette River drainage Mayfield Dam on the Cowlitz River and Lucky Peak Dam on the Boise River All sampling and analysiS were done by the National Marine Fisheries Service under contract with the US Army Corps of Engineers
PROCEDURE Water samples were collected with a modified
Van Dorn sampler and then put In standard bioshychemical-oxygen-demand sample bottles (300
1
ml) by means of a tube running from the bottom of the sampler The air interface and agitation of sample were minimized by placing the tube at the bottom of the sample bottle The bottles were allowed to overflow up to 3 times their volume and were immediately placed in a chilled Ice chest
All of the samples were analyzed within 24 h of the time of collection Dissolved nitrogen analshyyses were done with an Arthur H Thomas modishyfication of the Van Slyke-Nelll manometric blood gas analyzer (Van Slyke and Neill 1924) and with a Fisher-Hamilton gas partitloner model No 29 The method used was that described by Swlnnershyton Linnenbom and Cheek (1962)
The gas partitioner was calibrated by analyzing at least three samples on the partltioner and the Van Slyke A graph of partltloner units versus Van Slyke concentration values (milligrams per liter) was established so that other samples could be run on the partitioner and resulting saturation values derived from the graph An Alsterburg modified Winkler method was used for the determination of the dissolved oxygen levels and similar calibration techniques were used to calibrate the partitioner (American Public Health Association 1971)
PRESENTATION OF DATA Tables 1-12 correspond to the numbers in
Figures 2 and 3 which indicate the dams where water was sampled These tables give the locations of the various sample stations at each dam and the dates on which samples were taken They also give dissolved oxygen concentrations (mgll and of saturation) dissolved nitrogen plus argon concentrations (mill N2 + Ar and of saturation) total gas pressure (mm Hg and of saturation) and related water temperature (0C) Saturation values were calculated from tables by
Weiss (1970) and then corrected for altitude In cases where hourly spill flow and hourly total flow are equal the samples were taken directly from spillway discharge and there was no possibility of dilution by turbine discharge When the total hourly flow Is larger than the hourly spill the sample was taken during both spilling and powerhouse operation and there was a good
possibility of the discharges mixing
LITERATURE CITED American Public Health Association
1971 Standard methods for the examination of water and wastewater 13th ed Am Publ Health Assoc NY 874 p
Belnlngen K T and W J Ebel 1970 Effect of John Day Dam on dissolved nitrogen
concentrations and salmon In the Columbia River 1968 Trans Am Fish Soc 99664-671
Ebel W J 1969 Supersaturation of nitrogen In the Columbia
River and Its effect on salmon and steelhead trout US Fish Wlldl Serv Fish Bull 681-11
1971 Dissolved nitrogen concentratlonsln the Columshybia and Snake Rivers In 1970 and their effect on chishynook salmon and steel head trout US Dep Commer NOAA Tech Rep NMFS SSRF-848 7 p
1973 Relations between fish behavior bioassay Inshyformation and dissolved gas concentrations on surshyvival of Juvenile salmon and steelhead trout In Snake River Proc 53rd Annu Conf West Assoc State Game Fish Comm p 516-527
Swlnnerton JWVJ Llnnenbom and C H Cheek 1962 Determination of dissolved gases In aqueous
solutions by gas chromatography Anal Chern 34 483-485
Van Slyke D D and J M Nelli 1924 The determination of gases In blood and other
solutions by vacuum extraction and manometric measurement J BioI Chern 61 523-574
WeiSS R F 1970 The solubility of nitrogen oxygen and argon In
water and seawater Deep-Sea Res 17721-735
2
See Fi92
----- shy
CANADA
Oregon
o 40 80 120 160 I I I I I
Kilometers
II- ____ ----l_____
Figura 1-Map of Columbia Rlvr dralnag bullbullhowlng location of trlbutarl bullbullbullampled to dtrmln concntratlon of dlbullbullolved atmophrlc gbullbullbullbull
3
o 16 I I
Kilometers
Figure 2- Mp of WIIImette River dralnge Numbers Indicate dams where water was sampled to determine concentration of dissolved atmospheric gases
4
WASHINGTON
OREGON
o 16 32 48 64 80 I I I I I I
Kilomtrs
LuckyR Peak
11
FIgure 3-Mp of Cowlitz RIver (top) nd Bolbullbull Rlvr (bottom) Numbell Indlcat dim where wlter WIbullbullImpled to dtrmln concentratIon of dllolvedltmopherlc g
5
Table 1--Concentrations of dissolved atmospheric gases and related water temperatures at Hills Creek Dam
Hourly flow N2 + ArDepth Temp deg2 TGP No gates (em)
Location Mo DaI Yr (OC~ ~M~ sat sat SO mIll Hg~lIIIl) sat oEen 512111 Total
Forebay - spillway side (in 2 2 71 4 47 1150 946 1576 991 7055 981 0 00 00 front of intake for regulating outlets)
Tailrace - regulating outlet 2 2 71 1 48 1330 1084 1728 1077 7834 1077 1 136 136 (01 kIn downstream) 2 2 71 1 48 1310 1068 1728 1077 7809 1074 1 181 181
-
Table 2~-Concentrations of dissolved acnospheric gases and related water temperatures at Lookout Point Dam
Location Mo Day Yr Depth ~Ml
Temp ~oC2 mgll
O2 sat
N2 + Ar
mIll sat Hs~nm2 TGP
sat No gates
oEen
Hourly flow~ 5Ei11 Total
Forebay ~ powerhouse side (from upper deck of dam in front of
7 7 7
27 71 28 71 29 71
37 37 37
128 114 114
930 980
1000
910 928 947
1376 1416 1352
1013 1013
967
7291 7315 7081
992 995 963
0 0 0
00 00 00
00 00 00
turbine intakes)
Forebay - spillway side (from upper deck of dam midway between spillways)
2 7 7 7 7 8 8 8 3 3 3
271 27 71 28 71 28 71 29 71 371 471 471
15 72 15 72 20 72
18 16 15 15 16 64 64 64
6 6 6
50 150 140 126 136 88 92 92 68 68 80
1220 910 900 920 970 875 915 950
1180 1180 1230
989 934 904 896 966 780 823 855
1001 1001 1075
1608 1344 1336 1328 1328 1448 1504 1424 1592 1592 1552
996 1035 1008
974 994 979
1026 971
1028 1028 1030
7308 7453 7255 7044 7267 6893 7228 6963 7514 7514 7639
994 1014
987 958 988 973 983 947
1028 1028 1039
0 0 0 0 0 0 0 0 0 0 0
00 00 00 00 00 00 00 00 00 00 00
00 00 00 00 00 00 00 00 00 00 00
Tailrace ~ spillway
(north bank 05 lan downstream)
2 7 7 7 7 3 3 3 3
5 70 27 71 28 71 29 71 29 71 15 72 20 72 20 72 20 72
1 1 1 1 1 1 1 1 1
67 153 169 170 181 68 81 80 80
1360 1030 1050 1000 1040 1320 1330 1340 1360
1141 1055 1113 1062 1130 1110 1155 1161 1178
1792 1384 1424 1392 1456 1752 1744 1800 1800
1145 1063 1128 1105 1180 1122 1151 1185 1185
8471 7861 8324 8114 8647 8290 8524 8732 8758
1142 1060 1123 1094 1166 1118 1149 1178 1181
1 2 5 5 1 5 5 5 5
71 57
113 184
57 57 85
113 170
71 57
113 184
57 57 85
113 170
Tailrace - regulating outlet (north bank 05 lan downstream)
2 2 8 8 8 8 8
271 271 371 371 471 471 471
1 1 1 1 1 1 1
53 52
103 113 128 109 110
1510 1549 1270 1260 1130 1290 1310
1223 1251 1163 1181 1096 1198 1219
2032 1965 1664 1680 1496 1695 1720
1257 1212 1152 1189 1092 1189 1209
9244 9031 8545 8781 8093 8810 8960
1247 1218 1152 1184 1091 1188 1208
1 1 3 2 3 3 2
113 184 113 113 ~7
184 113
113 184 113 113
57 184 113
Tailrace ~ powerhouse (fram tailrace deck of powerhouse in turbine discharge)
7 7 7 8
27 71 28 71 29 71 3 71
1 1 1 1
99 119 131 118
1010 1000
980 970
916 950 957 920
1416 1432 1400 1480
972 1026 1029 1058
7123 7488 7512 7627
961 1010 1013 1029
0 0 0 0
00 00 00 00
67 67 67
00
Table 3_~Concentrations of dissolved atmospheric gases and related water temperatures at Dexter Dam
Location ~MQDay Yr Depth
(M) Temp (OC) mgtl
deg2 sat
N2 + Ar
m1t1 sat Hg(nm) TGP
sat No gates
open
Hourly flow(em)
Spill Total
Forebay - middle (from upper deck between spillway and powerhouse)
2 5 70 2 5 70 7 28 71 7 29 71 3 15 72 3 15 72
1 5
13 13
8 8
63 63
126 120 66 66
1240 1230 990 950
1210 1210
1030 1022 956 905
1013 1013
1664 1054 1640 1038 1360 989 1352 971 1648 1051 1648 1051
7768 7667 7282 7100 7725 7725
1048 1034
982 958
1042 1042
0 0 0 0 0 0
00 00 00 00 00 00 00 00 00 00 n n vv 00
Forebay - spillway side (in front of water intake for Dexter Rearing Ponds)
8 3 71 8 471 3 15 72 3 15 72 3 20 72
13 13 11 11 11
126 127 65 65 74
910 950
1260 1260 1170
879 919
1052 1052
999
1359 988 1379 1005 1640 1043 1640 1043 1648 1070
middot7159 7318 7742 7742 7817
966 987
1044 1044 1054
0 0 0 0 0
00 00 00 00 00 00 00 00 00 00
Forebay - Dexter Rearing Pond (from first rearing pond water supplies from forebay)
2 5 70 2 2 71 3 15 72 3 15 72 3 15 72 3 15 72 3 20 72
1 1 1 1 3 3 3
61 54 70 71 70 71 83
1200 1163 1190 1100 1190 1100 1120
990 942
1004 930
1004 930 978
1616 1016 165 1021 1616 1038 1616 1040 1616 1038 1616 1040 1576 1045
7505 7458 7652 7552 7652 7552 7636
1010 1004 1030 1017 1030 1017 1030
0 0 0 0 0 0 0
00 00 00 00 00 00 00 00 00 00 00 00 00 00
Tailrace - powerhouse (01 km downstream of powerhouse in turbine discharge)
3 15 72 1 70 1230 1038 164 1053 7794 1049 0 00 39
Tailrace - spillway (north bank 05 km downstream)
6 2 70 6 2 70 3 15 72 3 20 72
1 4 1 1
138 135 69 70
1210 1220 1400 1390
1l97 1199 1l78 1173
1672 1244 1672 1236 1808 1158 1832 1177
9139 9099 8621 8719
1230 1255 1160 1173
3 3 6 4
67 67 67 67
187 187 215 215
Tailrace - spillway (north bank 37 km downstream)
3 15 72 1 75 1340 1l45 1728 1123 8361 1125 6 187 297
Tailrace - spillway (north bank 74 km downstream)
3 3
15 20
72 72
1 1
78 78
1270 1280
1093 1102
1632 1704
1094 1115
8113 8248
1092 1110
6 4
187 215
297326
-
bull
Table 4--Concentrations of dissolved atmospheric gases and related water temperatures at Fall Creek Dam Hourly flow
O2 N2 + ArDepth Temp TGP No gates ~cm) Location Mo DaI Yr ~M2 ~oC2 mgll sat mILL sat Hg~llIIll sat o2en SEUI Total
Forebay - spillway side 8 6 70 1 223 850 1010 1192 1048 7666 1039 0 00 00 (in front of intake 8 6 70 11 213 84Q 979 1208 1043 7593 1029 0 00 00 for regulating 8 6 70 22 161 380 398 1368 1073 6881 933 0 00 00 outlet) 11 20 70 1 82 1069 930 1608 1063 7673 1034 0 00 00
12 16 70 11 61 1188 987 1598 1012 7424 1006 0 00 00 2 2 71 22 59 1170 962 1624 1018 7461 1006 0 00 00
Tailrace - regulating outlets 8 6 70 1 173 920 983 1400 1117 8066 1087 1 14 14 (from primary 11 20 70 1 81 1162 1009 1551 1023 7561 1019 1 14 14 stilling basin) 12 16 70 8 61 l322 1092 1768 1113 8216 1107 1 42 42
12 16 70 1 61 1230 1016 1750 1102 8034 1083 1 42 42 12 16 70 3 61 1317 1088 1792 1129 8298 1118 1 42 42 12 16 70 1 61 1307 1080 1778 1120 8234 1110 1 57 57 12 16 70 2 61 1331 1099 1792 1129 8316 1121 1 57 57 12 16 70 1 61 1290 1066 1708 1076 7956 1072 1 28 28 12 16 70 3 61 1275 1053 1720 1083 7981 1076 1 28 28 12 16 70 2 61 1237 1022 1627 1025 7593 1023 1 14 14 12 16 70 1 61 1201 992 1604 1010 7463 1006 1 14 14 - 2 271 1 61 l380 1140 1856 1169 8612 1161 1 99 99
2 2 71 1 61 1410 1165 1864 1174 8679 1170 1 127 127
Tailrace - regulating outlets 8 6 70 1 172 910 970 1392 1108 7998 1078 4 14 14 (from secondary 12 16 70 1 61 1304 1052 1732 1065 8062 UJ61 1 42 42 stilling basin)
Tailrace - regulating outlets 11 20 70 1 82 1192 1037 1713 1132 8240 1110 1 14 14 (from west bank 12 16 70 1 61 1299 1073 1741 1096 8088 1090 1 42 42 01 len downstream) 12 16 70 1 61 1316 1087 1738 1095 8099 1092 1 57 57
12 16 70 1 61 1279 1056 1675 1055 7822 1054 1 28 28 12 16 70 1 61 1241 1025 1613 1016 7547 1017 1 14 14
Tailrace - regulating outlets 11 20 70 1 82 1140 992 1556 1028 7568 1020 1 14 14 (fran bridge 12 16 70 1 61 1297 107~1 1720 1083 8009 1079 1 42 42 09 len downstream)
Tailrace - regulating outlets 8 6 70 1 176 960 1032 l344 1078 7919 1067 1 14 14 (from bridge 11 20 70 1 82 1139 991 1603 1059 7747 1044 1 14 14 18 km downstream) 12 16 70 1 61 1279 1056 1720 1083 7986 1076 1 42 42
Table 5 __Goncentrations of dissolved atmospheric gases and related water temperatures at Cougar Dam
Depth Temp O2 N2 + Ar TGP No gates Hourly flow~
Location Mo DaI Yr ~M2 ~oC2 mgl1 sat mIll sat H8~mn2 sat oEen SEi11 Total
Forebay - spillway side (in front of
9 10 70 9 10 70
1 47
188 103
930 970
1064 921
1264 1077 1520 1092
7672 7546
1073 1056
0 0
00 00 00 00
intake for r~gu1ating 11 19 70 21 92 1017 937 1428 997 7070 985 0 00 00 outlets)
Tailrace - powerhouse ( bull 1 ian downstream
9 11
10 70 19 70
1 1
84 90
990 1031
884 934
1544 1440
1047 989
7355 7105
1012 978
0 0
00 00
00 62
of powerhouse in 11 19 70 1 86 1017 913 1532 1043 7378 1016 0 00 62 turbine discharge)
Tailrace - regulating outlets (fran primary
9 9
10 70 10 70
1 1
101 102
1190 1230
1107 1147
1648 1704
1160 1202
8332 8630
1147 1188
1 1
8 20
8 20
stilling basin) 9 9
10 70 10 70
1 1
103 107
1310 1270
1224 1198
1768 1760
1250 1255
9018 9007
1241 1240
1 1
33 48
33 48
11 19 70 1 96 1275 1172 1695 1180 8544 1176 1 31 31
is 11 11
19 70 19 70
1 1
96 95
1272 1289
1169 1182
1693 1712
1179 1189
8532 8612
1174 1185
1 1
31 71
3171
11 19 70 1 98 1275 1177 1714 1198 8657 1192 1 90 90 2 371 1 47 1450 1180 1952 1214 8755 1205 1 99 99 2 3 71 1 44 1470 1187 1960 1211 8744 1203 1 127 127 2 3 71 1 44 1440 1163 1880 1161 8426 1160 1 170 170
Tailrace - regulating outlets (east bank 09 kin downstream)
11 11 11 11
19 70 19 70 19 70 19 70
1 1 1 1
90 89 94 93
1048 1122 1240 1252
949 1014 1134 1142
1466 1550 1676 1682
1007 1062 1162 1163
7230 7641 8384 8405
995 1052 1154 1157
1 1 1 1
33 48 71 90
33 48 71 90
Tailrace - regulating outlets (from bridge 44 ian downstream)
9 11 11 11
10 70 19 70 19 70 19 70
1 1 1 1
114 92 95 96
1170 1120 1157 1142
1122 1020 1061 1050
1576 1505 1546 1514
1140 1039 1074 1054
8244 7513 7776 7646
1135 1034 1070 1052
1 1 1 1
48 33 90 48
48 33 90 62
11 19 70 1 96 1145 1052 1575 1096 7891 1086 1 71 71 2 371 1 44 1330 1074 1776 1097 7927 1091 1 110 170
~
Table 6--Concentrations of dissolved atmospheric gases and related water temperatures at Blue River Dam
Depth Temp O2 N2 + Ar
location Mo Day Yr (M) (OC) mgl sat ml11 sat HgllIII) TGP
sat No gates
open
llourl1flow (an
Spill Total
Forebay - spillway side (in front of intake for regulating outlet)
3 3
7 72 16 72
15 1
50 54
1190 1205
980 1002
1648 1628
1037 1034
7413 7431
1024 1027
0 0
00 00
00 00
Tailrace - regulating outlets (east bank 01 km downstream)
2 3
371 7 72
1 1
50 50
1311 1440
1068 1174
1739 1944
1083 1211
7888 8778
1079 1200
1 1
42 105
42 105
Tailrace - regulating outlets (east bank 025 km downstream)
3 3 3
7 72 16 72 16 72
1 1 1
50 56 60
1440 1336 1300
1174 1106 1094
1052 1789 1751
1215 1130 1116
8807 8213 8118
1204 1123 1110
1 1 1
105 71 71
105 71 71
Tailrace - regulating outlet (fran bridge 19 km downstream)
3 3
7 72 16 72
1 1
50 60
1370 1316
1117 1100
1848 1688
1151 1076
8349 7898
1142 1080
1 1
105 71
105 71
--
Table 7-~Concentrations of dissolved atmospheric gases and related water temperatures at Green Peter Dam
Hourly Depth Temp
O2 N2 + Ar TGP No gates flow
~ Location Mo DaI Yr Ml ~oCl Sll sat mIll sat Hg(_L_ sat open Spill Total
Forebay - powerhouse side (fran upper deck
7 27 71 7 29 71
61 37
81 75
1110 10S0
97S 900
1488 993 lSS2 1022
72S1 7316
989 998
0 0
00 00 00 00
of dam in front 7 30 71 61 7S 1020 883 1504 990 7095 968 0 00 00 of turbine intakes)
Forebay - spillway side (fran upper deck of
1 1
22 71 22 71
1 11
47 47
1170 1180
944 952
1616 1624
996 1001
7222 7262
985 991
0 0
00 00
00 00
dam midway between 1 2S 71 1 50 1180 9S9 1624 1009 731S 998 0 00 00 spillways) 1
7 lS 71 27 71
49 12
48 124
1180 1030
9S4 1001
1632 1404
1009 1028
7308 7494
997 1022
0 0
00 00
00 00
7 27 71 12 114 1010 960 1440 1033 74S6 1017 0 00 00 7 28 71 12 108 1010 946 1432 1014 7329 1000 0 00 00 7 28 71 1 122 10lS 982 1392 101S 7391 1008 0 00 00 7 29 71 12 112 1000 946 1432 1023 7378 1006 0 00 00 7 29 71 12 lS8 840 880 1167 91S 6670 910 0 00 00 8 271 80 75 950 822 lS41 101S 7143 974 0 00 00 8 271 61 76 1020 88S lS20 1003 7171 978 0 00 00
- 8 8
271 371
80 78
76 7S
980 910
851 788
1504 lS20
992 1001
70S8 7011
963 9S6
0 0
00 00
0000
8 371 78 80 910 798 1512 1007 7061 963 0 00 00 3 7 72 15 51 1220 994 1680 1046 7582 1034 0 00 00 3 14 72 8 62 1290 1081 1712 1094 7990 1090 0 00 00 3 17 72 5 88 1170 1046 lS36 1041 7634 1042 0 00 00
Tailrace - regulating outlets (from deck of fish evaluator 2 kin downstream)
2 1 7 8 8
3 70 25 71 30 71 271 371
3 1 1 1 1
68 51 70 81 80
1470 1460 1290 1300 1420
1237 1177 1091 1129 1231
1992 2064 1643 1735 17S2
1276 1271 lOS7 114S l1S4
9376 92S3 7883 8449 86SS
126S 1248 1063 1140 1167
2 2 2 2 2
190 184
S7 113 184
190 184
S7 113 184
Tailrace - spillway (from deck of fish evaluator
2 1 1
3 70 22 71 22 71
3 1 1
69 48 49
1420 lS4O lS30
1198 1231 1227
1928 2000 2056
1238 1222 1260
9094 90S7 9266
1227 1222 1250
2 2 2
190 184 184
190184 184
02 km downstream) 7 7
27 71 28 71
1 1
160 160
11 OS 1114
1149 l1S9
1448 1544
1128 1202
8376 8821
1130 1190
2 2
57 113
S7 113
7 29 71 1 1S3 1160 1189 1576 1210 8913 1202 2 184 184 3 7 72 1 S6 1480 1208 1976 1231 9070 1223 2 312 312 3 1472 1 70 1470 1243 2000 1287 94S0 127S 2 113 113 3 14 72 1 65 lS10 1261 1960 1247 9244 1247 2 184 184
~
Table 7-~Continued
Location Mo Day Yr Depth
(M) remp (OC) mgt1
deg2 sat
N2 + Ar
m11 sat Hg(lIIII) rGP
sat No gates
open
Hour ly flow ~ Spill Total
Tailrace - powerhouse 1 22 71 1 48 1270 1016 1792 1095 7987 1077 0 00 116 (from deck of fish 1 25 71 1 49 1280 1026 1776 1088 7961 1074 0 00 184 evaluator 7 27 71 1 81 1190 1034 1552 1024 7603 1025 0 00 00 02 kIn downstream)
Tailrace - spillway (north bank of South Santiam River
1 22 71 7 27 71 7 28 71
1 1 1
49 134 159
1430 1100 1059
1146 1081 1099
1904 1166 1378 1019 1400 1088
8602 7645 8072
1160 1031 1089
2 2 2
184 184 57 57
113 113 just above mouth of Goal Creek)
7 29 71 3 7 72 3 7 72
1 1 1
153 57 57
1070 1410 1420
1096 1154 1162
1396 1072 1872 1169 1896 1184
7977 8627 8726
1076 1164 1177
2 2 2
184 184 312 312 312 312
3 14 72 1 67 1390 1167 1816 1161 8598 1160 2 113 113 3 14 72 1 64 1420 1183 1856 1178 8724 1177 2 184 184
Tailrace - regulating outlets (north bank of South Santiam River just above mouth of Coal
1 7 8 8
25 71 30 71
2 71 3 71
1 1 1 1
51 78 98 80
1410 1210 1250 1340
1136 1044 1131 1161
1920 1552 1632 1624
1182 1017 1118 1069
8676 7577 8297 8060
1170 1022 1119 1087
2 2 2 2
184 57
113 184
184 57
113 184
Creek)w-
Table 8~-Concentrations of dissolved atmospheric gases and related water temperatures at Foster Dam
X
Depth Temp O2 N2 + Ar TGP No gates
Hourly flow~
Location Mo DaX Yr ~Ml ~oCl ilL sat m1ll 1-sat HS~IIIII~ sat Olen SEill Total
Forebay - spillway side (north bank of
2 2
3 3
70 70
1 5
69 69
1360 1330
1145 1120
1808 1816
1159 1164
8570 8561
1154 1152
0 0
00 00
00 00
forebay just 2 3 70 10 67 1330 1114 1808 1153 8491 1143 0 00 00 above confluence with South Fork)
Forebay - spillway side (in front of water
intake for South
2 1 7
3 22 21
70 71 71
16 16 20
69 57 94
1310 1240 1004
1103 1013 898
1808 1688 1492
1159 1052 1011
8505 7746 7336
1145 1043 987
0 0 0
00 00 00
00 00 00
Santiam Hatchery) 7 7
27 28
71 71
6 2
159 188
1010 890
1046 979
1440 1264
1117 1036
8173 7605
1100 1024
0 0
00 00
00 00
7 28 71 18 93 1015 906 1513 1023 7417 998 0 00 00 7 29 71 2 186 910 997 1247 1018 7530 1014 0 00 00 7 29 71 18 87 990 871 1520 1015 7312 984 0 00 00 8 2 71 2 230 810 968 1152 1018 7486 1008 0 00 00 8 2 71 18 102 950 866 1488 1026 7374 993 0 00 00 8 3 71 2 228 720 857 1047 922 6769 911 0 00 00 8 3 71 18 102 1020 930 1480 1021 7440 1002 0 00 00 3 7 72 10 58 1420 1163 1864 1164 8631 1162 0 00 00
Tailrace - spillway 1 25 71 1 54 1550 1252 2120 1307 9633 1292 2 249 249(north bank of South Santiam 06 km downstream)
Tailrace - spillway 3 7 72 1 58 1420 1159 1864 1160 8631 1158 2 334 41l (north bank of South Santiam 19 km downstream)
Tailrace - spillway 3 7 72 1 56 1390 1107 1880 1142 8610 1133 2 334 425(north bank of South Santiam 56 km downstream)
Table 8--Continued
Depth Temp deg2 N2 + Ar TGP No gates Ilourl) flow
(an Location Ho Day Yr (M) (Oe) mgl ~sat mlll ~sat Hg(mn) sat open Spill Total
Wiley Creek-from creek itself 3 7 72 1 51 1250 1002 1688 1034 7648 1026 0 00 00 (01 kin above confluence with South Santimn not influenced by any dmn)
South Santiam Hatchery -incubator tray
1 3
25 7
71 72
1 1
53 59
1280 1320
1031 1079
1735 1728
1067 1077
7891 8030
1059 1076
0 0
00 00
00 00
South Santiam Hatchery pond 8
- 2 1 1
3 22 23
70 71 71
1 1 1
69 57 67
1250 1270 1320
1049 1034 1102
1808 1704 1776
1155 1058 1129
8427 7842 8360
1131 1052 1122
0 0 0
00 00 00
00 00 00
1 25 71 1 58 1310 1069 1792 1116 8230 1104 0 00 003 7 72 1 55 1310 1060 1792 1107 8173 1096 0 00 00
South Santiam Hatchery pond 2
- 1 1 1
22 25 25
71 71 71
1 16
1
57 53 59
1090 1320 1100
887 1064 900
1656 1808 1695
1029 1112 1058
7441 8203 763i
998 1101 1024
0 0 0
00 00 00
00 00 00
South Santiam River - 3 7 72 1 55 1260 1001 1712 1038 7821 1029 0 00 00 2 kill upstremn from Cascadia dam site (not influenced by any dam)
-
Table 9-~Concentrations of dissolved atmospheric gases and related water temperatures at Detroit Dam
Depth Temp deg2 N2 + Ar TGP No gates Hour1~ flow
an Location Ho DaI Yr ~H~ ~oC~ Ill 1sat mIll 1sat H8~nm2 sat oeen Seill Total
Forebay - spillway side 8 5 71 (frOOI upper deck of dam 8 5 71
8 8
194 172
870 850
1002 936
1152 988 1247 1026
7122 7236
992 1008
0 0
00 00 00 00
midway between 8 6 71 8 185 860 973 1192 1005 7176 999 0 00 00 spillways) 8 6 71
3 8 72 8
12 186
45 910
l210 1032 991
1216 1027 1680 1052
7385 7462
1028 1039
0 0
00 00 00 00
Forebay - powerhouse side (frOOI upper deck of
8 5 71 50 83 1000 901 1456 996 7014 977 0 00 00
dam in front of turbine intakes)
Tailrace - spillway 3 8 72 1 48 1450 1181 1904 1185 8606 1182 6 201 201 (frOOI boat launch ramp
- Tailrace
12 km downstream)
- powerhouse 8 5 71 1 90 1010 913 1416 971 6983 959 0 00 55 (frOOI bridge 03 kIn downstream)
Tailrace - spillway (frOOI bridge 033 kIn downstream)
8 8 8 8
5 5 5 6
71 71 71 71
1 1 1 1
171 185 176 168
1020 1010 1050 1080
1106 1127 1150 1164
1384 1408 1440 1368
1121 1171 1178 llO2
8124 8438 8509 8102
1116 1159 1169 ~113
6 6 6 1
57 113 184
57
57113 184
57 8 6 71 1 177 1030 1131 1392 1140 8271 1136 1 113 113 8 6 71 1 172 1020 1108 1392 1130 8177 1123 1 184 184 3 8 72 1 46 1450 1175 1920 1189 8621 1184 6 201 201
c
Table 10--Concentrations of dissolved atmospheric gases and related water temperatures at Big Cliff Dam
Location Ho DaI Yr Depth ~Hl
Temp ~oC~ Sll
deg2 laat
N2 + Ar
nUll aat H8~nml TGP
sat No gates
oln
Hourly flow ~ SEi11 Total
Forebay - apillway side (from upper deck of dam midway between spillways)
8 8 3
5 6 8
71 71 72
8 16 10
9bull 1 101
45
1010 1020 1410
916 947
1140
1600 1376 1888
1100 967
1167
7717 7009 8439
1060 963
1159
0 0 0
00 00 00
00 00 00
Tailrace - spillway (from north bank 32 Ian downstream)
3 8 72 1 51 1450 1186 1935 1209 8779 1202 2 241 326
Tailrace - spillway (from north bankJ 03 km downstream)
3 8 72 1 52 1580 1296 2064 1293 9424 1290 2 241 326
Tailrace - spillway (from north bank 006 km downstream)
3 8 72 1 47 1450 1174 1912 1183 8613 1179 2 241 241
-
Table ll~-Concentrations of dissolved atmospheric gases and related water temperatures at Lucky Peak Dam
Location Mo Dar Yr Depth ~M2
Temp ~OC) Sll
deg2 sat
N2 + Ar
mIll sat HB~mm2 TGP
sat No gates
oEen
Hourly flow ~ SEi11 Total
Forebay - spillway side (intake for regulating outlet)
8 8 1
13 13 19
70 70 71
10 1
31
183 193
22
872 900
1160
1040 1095 944
1200 1192 1567
1066 1079 979
7206 7350 6612
1062 1083 972
0 0 0
00 00 00
00 00 00
1 19 71 31 21 1l58 939 1561 973 6573 966 0 00 00 1 19 71 1 21 1158 939 1586 988 6656 978 0 00 00 1 19 71 40 21 1160 941 1588 990 6665 980 0 00 00 1 28 71 43 22 1190 970 1642 1028 6897 1016 0 00 00
Tailrace - regulating outlet bay 1
8 8
13 13
70 70
1 1
150 150
957 961
1055 1059
1309 1306
1082 1079
7372 7365
1076 1075
1 1
122 122
122 122
(from LSGS cable way 08 kIll downstream)
Tailrace - regulating outlet bay 3 (from USGS cable way 08 kIll downstream)
1 1 1
19 19 19
71 71 71
1 1 1
23 28 32
1311 1294 1309
1062 1063 1086
1752 1704 1726
1090 1074 1098
7422 7334 7500
1084 1071 1095
1 1 1
85 57
113
85 57
113
Tailrace - regulating outlet bay 5
1 1
28 28
71 71
1 1
24 28
1280 1305
1040 1071
1701 1726
1061 1087
7234 7421
1056 1083
1 1
85 113
85 113
(from USGS cable way 08 kIll downstream)
Tailrace - regulating outlet bay 3 (upstream of
1 1 1
19 19 19
71 71 71
1 1 1
24 28 32
1298 l300 1293
1054 1067 1073
1712 1719 1707
1068 1083 1086
7292 7391 7416
1065 1079 1083
1 1 1
85 57
113
85 57
113 diversion dam 32 km downstream)
Tailrace - regulating outlet 1 28 71 1 25 1300 1059 1726 1079 7360 1074 1 85 85
bay 5 (upstream of diversion dam 32 km downstream)
(
bull
Table 12--Concentrations of dissolved atmospheric gases and related water temperatures at Mayfield Dam
Location
Forebay
Tailrace
Tailrace
__--shy ~- __ __ _ Ifo Day Yr
- spillway side 3 11 71 (from upper deck of 3 11 71 dam midway between 8 26 71 spillway) 8 26 71
8 26 71
- spillway bay 3 3 11 71 (north bank 3 11 71
o 4 kID downstJe8lll)
- spillway bay 3 upstream from
3 11 71
powerhouse on retainfng wall)
Depth ~lfl
10 10
1 6
12
1 1
1
Temp ~oCl
43 44
167 104 100
44 44
44
Sll
1185 1183 1055 1075 1024
1278 1320
1300
O2 4sat
926 927
1103 977 922
996 1028
1013
H2 + Ar
m1ll 4sat
1644 983 1654 992 1380 1079 1554 1068 1554 1059
1821 1085 1862 1109
1786 1064
TGP HSlIIIll sat
7268 971 7319 978 8101 1082 7847 1048 7709 1030
8022 1065 8217 1091
7925 1052
No gates 02en
0 0 0 0 0
1 1
1
lIourly flow ~ S2i11middot Total
00 00 00 00 00 00 00 00 00 00
113 113 198 198
283 283
--

CONTENTS Page
Introduction 1Procedure 1 Presentation of data 2 Literature cited 2
Figures
1 Map of Columbia River drainage showing locations of tributaries sampled to determine concentration of dissolved atmospheric gases 3
2 Map of Willamette River drainage Numbers indicate dams where water was sampled to determine concentration of dissolved atmospheric gases 4
3 Map of Cowlitz River and Boise River Numbers indicate dams where water was sampled to determine concentration of dissolved atmospheric gases 5
Tables
1 Concentrations of dissolved atmospheric gases and related water temperatures at Hills Creek Dam bull 6shy
2 Concentrations of dissolved atmospheric gases and related water temperatures at Lookout Point Dam ~ 7
3 Concentrations of dissolved atmospheric gases and related water temperatures at Dexter Dam 8
4 Concentrations of dissolved atmospheric gases and related water temperatures at Fall Creek Dam 9
5 Concentrations of dissolved atmospheric gases and related water temperatures at Cougar Dam 10
6 Concentrations of dissolved atmospheric gases and related water temperatures at Blue River Dam 11
7 Concentrations of dissolved atmospheric gases and related water temperatures at Green Peter Dam 12
8 Concentrations of dissolved atmospheric gases and related water temperatures at Foster Dam 14
9 Concentrations of dissolved atmospheric gases and related water temperatures at Detroit Dam 16
10 Concentrations of dissolved atmospheric gases and related water temperatures at Big Cliff Dam 17
11 Concentrations of dissolved atmospheric gases and r~lated water temperatures at Lucky Peak Dam 18
12 Concentrations of dissolved atmospheric gases and related water temperatures at Mayfield Dam 19
The National Marine Fisheries Service (NMFS) does not approve recshyommend or endorse any proprietary product or proprietary material mentioned in this publication No reference shall be made to NMFS or to this publication furnished by NMFS in any advertising or sales proshymotion which would indicate or imply that NMFS approves recommends or endorses any proprietary product or proprietary material mentioned herein or which has ~~ its purpose an intent to cause directly or indirectly the advertised product to be used or purchased because of this NMFS publication
iii
-
t 1
Concentration of Dissolved Gases in the Willamette Cowlitz and Boise Rivers 1970-72
BRUCE H MONK1 EARL DAWLEY1 and KIRK BEININGEN2
ABSTRACT Data on dissolved nitrogen dissolved oxygen total gas pressure and water
temperatures are presented for the Wlllamette Cowlitz and Boise rivers Water samples were taken upstream and downstream of dams and over a wide range of river and dam discharges to obtain data on the relation between river flow and dam discharges and their effect on the total gas regime of the rivers
INTRODUCTION
In recent years fishery scientists have shown that high concentrations of dissolved atmospheric gases in the Columbia and lower Snake rivers cause gas bubble disease and during years of high flow can result in up to 68 mortality of juvenile and adult Pacific salmon Oncorhynchus spp and steelhead trout Samo gairdneri (Ebel 1971 1973) The high concentrations occur when air is entrained in water passing over spillways and forced into solution by high pressures in the stilling basin (Ebel 1969 Beiningen and Ebel 1970)
In 1970 fishery agencies and the US Army Corps of Engineers became concerned that heavy spilling of water over Lost Creek Dam (now under construction 247 km from the mouth of th~ Rogue River) would create supersaturated concentrashytions of dissolved gas harmful to native stocks of salmon and steelhead trout and to hatcheryshyreleased stocks of coho salmon O kisutch and fall chinook salmon O tshawytscha Hatchery stocks could also be affected by supersaturated water supplied to the hatchery by a regulating reservoir downstream from the dam Therefore a nitrogen monitoring program was established at various hydroelectric projects which would be pertinent to spillway design modifications at Lost Creek Dam The program included many projects on the Willamette Valley system Lucky Peak Dam on the Boise River and Mayfield Dam on the Cowlitz River (Figs 1 2 3) There was also concern over the possibility of high concenshytrations in the reservoirs below Green Peter Dam and Lookout Point Dam (Fig 2) which supply
1 Northwest Fisheries Center National Marine Fisheries Service NOAA Seattle WA 98112
2Fish CommiSSion of Oregon Clackamas OR 97015
water for South Santlam Hatchery and Dexter Rearing Ponds respectively (operated by Fish Commission of Oregon)
To determine whether discharges from the dams on the Willamette and Cowlitz River systems would create supersaturated concenshytrations of dissolved gas extensive sampling and analysis for dissolved gases was done during 1970 1971 and 1972 Samples were taken near dams over a wide range of river flow and spillway and regulating outlet discharges (regulating outlets are low level valved gates used to draw down reservoir water levels farther than pOSsible by spilling) to obtain data on the relation between river flow and dam discharges and their effect on the total gas regime of the rivers
Atlditlonal samples were taken at Lucky Peak Dam on the Boise River (Fig 3) to determine the concentrations of dissolved gases below a flip bucket designed to diSSipate energy In the spillrace and thereby eliminate supersaturated concentrations The US Army Corps of Engishyneers felt that such deflectors if effective could be a possible answer to the potential supershysaturation problem at Lost Creek Dam
This report presents data on gas concentrations and related water temperatures of water samples taken at forebays and tailraces of dams In the Willamette River drainage Mayfield Dam on the Cowlitz River and Lucky Peak Dam on the Boise River All sampling and analysiS were done by the National Marine Fisheries Service under contract with the US Army Corps of Engineers
PROCEDURE Water samples were collected with a modified
Van Dorn sampler and then put In standard bioshychemical-oxygen-demand sample bottles (300
1
ml) by means of a tube running from the bottom of the sampler The air interface and agitation of sample were minimized by placing the tube at the bottom of the sample bottle The bottles were allowed to overflow up to 3 times their volume and were immediately placed in a chilled Ice chest
All of the samples were analyzed within 24 h of the time of collection Dissolved nitrogen analshyyses were done with an Arthur H Thomas modishyfication of the Van Slyke-Nelll manometric blood gas analyzer (Van Slyke and Neill 1924) and with a Fisher-Hamilton gas partitloner model No 29 The method used was that described by Swlnnershyton Linnenbom and Cheek (1962)
The gas partitioner was calibrated by analyzing at least three samples on the partltioner and the Van Slyke A graph of partltloner units versus Van Slyke concentration values (milligrams per liter) was established so that other samples could be run on the partitioner and resulting saturation values derived from the graph An Alsterburg modified Winkler method was used for the determination of the dissolved oxygen levels and similar calibration techniques were used to calibrate the partitioner (American Public Health Association 1971)
PRESENTATION OF DATA Tables 1-12 correspond to the numbers in
Figures 2 and 3 which indicate the dams where water was sampled These tables give the locations of the various sample stations at each dam and the dates on which samples were taken They also give dissolved oxygen concentrations (mgll and of saturation) dissolved nitrogen plus argon concentrations (mill N2 + Ar and of saturation) total gas pressure (mm Hg and of saturation) and related water temperature (0C) Saturation values were calculated from tables by
Weiss (1970) and then corrected for altitude In cases where hourly spill flow and hourly total flow are equal the samples were taken directly from spillway discharge and there was no possibility of dilution by turbine discharge When the total hourly flow Is larger than the hourly spill the sample was taken during both spilling and powerhouse operation and there was a good
possibility of the discharges mixing
LITERATURE CITED American Public Health Association
1971 Standard methods for the examination of water and wastewater 13th ed Am Publ Health Assoc NY 874 p
Belnlngen K T and W J Ebel 1970 Effect of John Day Dam on dissolved nitrogen
concentrations and salmon In the Columbia River 1968 Trans Am Fish Soc 99664-671
Ebel W J 1969 Supersaturation of nitrogen In the Columbia
River and Its effect on salmon and steelhead trout US Fish Wlldl Serv Fish Bull 681-11
1971 Dissolved nitrogen concentratlonsln the Columshybia and Snake Rivers In 1970 and their effect on chishynook salmon and steel head trout US Dep Commer NOAA Tech Rep NMFS SSRF-848 7 p
1973 Relations between fish behavior bioassay Inshyformation and dissolved gas concentrations on surshyvival of Juvenile salmon and steelhead trout In Snake River Proc 53rd Annu Conf West Assoc State Game Fish Comm p 516-527
Swlnnerton JWVJ Llnnenbom and C H Cheek 1962 Determination of dissolved gases In aqueous
solutions by gas chromatography Anal Chern 34 483-485
Van Slyke D D and J M Nelli 1924 The determination of gases In blood and other
solutions by vacuum extraction and manometric measurement J BioI Chern 61 523-574
WeiSS R F 1970 The solubility of nitrogen oxygen and argon In
water and seawater Deep-Sea Res 17721-735
2
See Fi92
----- shy
CANADA
Oregon
o 40 80 120 160 I I I I I
Kilometers
II- ____ ----l_____
Figura 1-Map of Columbia Rlvr dralnag bullbullhowlng location of trlbutarl bullbullbullampled to dtrmln concntratlon of dlbullbullolved atmophrlc gbullbullbullbull
3
o 16 I I
Kilometers
Figure 2- Mp of WIIImette River dralnge Numbers Indicate dams where water was sampled to determine concentration of dissolved atmospheric gases
4
WASHINGTON
OREGON
o 16 32 48 64 80 I I I I I I
Kilomtrs
LuckyR Peak
11
FIgure 3-Mp of Cowlitz RIver (top) nd Bolbullbull Rlvr (bottom) Numbell Indlcat dim where wlter WIbullbullImpled to dtrmln concentratIon of dllolvedltmopherlc g
5
Table 1--Concentrations of dissolved atmospheric gases and related water temperatures at Hills Creek Dam
Hourly flow N2 + ArDepth Temp deg2 TGP No gates (em)
Location Mo DaI Yr (OC~ ~M~ sat sat SO mIll Hg~lIIIl) sat oEen 512111 Total
Forebay - spillway side (in 2 2 71 4 47 1150 946 1576 991 7055 981 0 00 00 front of intake for regulating outlets)
Tailrace - regulating outlet 2 2 71 1 48 1330 1084 1728 1077 7834 1077 1 136 136 (01 kIn downstream) 2 2 71 1 48 1310 1068 1728 1077 7809 1074 1 181 181
-
Table 2~-Concentrations of dissolved acnospheric gases and related water temperatures at Lookout Point Dam
Location Mo Day Yr Depth ~Ml
Temp ~oC2 mgll
O2 sat
N2 + Ar
mIll sat Hs~nm2 TGP
sat No gates
oEen
Hourly flow~ 5Ei11 Total
Forebay ~ powerhouse side (from upper deck of dam in front of
7 7 7
27 71 28 71 29 71
37 37 37
128 114 114
930 980
1000
910 928 947
1376 1416 1352
1013 1013
967
7291 7315 7081
992 995 963
0 0 0
00 00 00
00 00 00
turbine intakes)
Forebay - spillway side (from upper deck of dam midway between spillways)
2 7 7 7 7 8 8 8 3 3 3
271 27 71 28 71 28 71 29 71 371 471 471
15 72 15 72 20 72
18 16 15 15 16 64 64 64
6 6 6
50 150 140 126 136 88 92 92 68 68 80
1220 910 900 920 970 875 915 950
1180 1180 1230
989 934 904 896 966 780 823 855
1001 1001 1075
1608 1344 1336 1328 1328 1448 1504 1424 1592 1592 1552
996 1035 1008
974 994 979
1026 971
1028 1028 1030
7308 7453 7255 7044 7267 6893 7228 6963 7514 7514 7639
994 1014
987 958 988 973 983 947
1028 1028 1039
0 0 0 0 0 0 0 0 0 0 0
00 00 00 00 00 00 00 00 00 00 00
00 00 00 00 00 00 00 00 00 00 00
Tailrace ~ spillway
(north bank 05 lan downstream)
2 7 7 7 7 3 3 3 3
5 70 27 71 28 71 29 71 29 71 15 72 20 72 20 72 20 72
1 1 1 1 1 1 1 1 1
67 153 169 170 181 68 81 80 80
1360 1030 1050 1000 1040 1320 1330 1340 1360
1141 1055 1113 1062 1130 1110 1155 1161 1178
1792 1384 1424 1392 1456 1752 1744 1800 1800
1145 1063 1128 1105 1180 1122 1151 1185 1185
8471 7861 8324 8114 8647 8290 8524 8732 8758
1142 1060 1123 1094 1166 1118 1149 1178 1181
1 2 5 5 1 5 5 5 5
71 57
113 184
57 57 85
113 170
71 57
113 184
57 57 85
113 170
Tailrace - regulating outlet (north bank 05 lan downstream)
2 2 8 8 8 8 8
271 271 371 371 471 471 471
1 1 1 1 1 1 1
53 52
103 113 128 109 110
1510 1549 1270 1260 1130 1290 1310
1223 1251 1163 1181 1096 1198 1219
2032 1965 1664 1680 1496 1695 1720
1257 1212 1152 1189 1092 1189 1209
9244 9031 8545 8781 8093 8810 8960
1247 1218 1152 1184 1091 1188 1208
1 1 3 2 3 3 2
113 184 113 113 ~7
184 113
113 184 113 113
57 184 113
Tailrace ~ powerhouse (fram tailrace deck of powerhouse in turbine discharge)
7 7 7 8
27 71 28 71 29 71 3 71
1 1 1 1
99 119 131 118
1010 1000
980 970
916 950 957 920
1416 1432 1400 1480
972 1026 1029 1058
7123 7488 7512 7627
961 1010 1013 1029
0 0 0 0
00 00 00 00
67 67 67
00
Table 3_~Concentrations of dissolved atmospheric gases and related water temperatures at Dexter Dam
Location ~MQDay Yr Depth
(M) Temp (OC) mgtl
deg2 sat
N2 + Ar
m1t1 sat Hg(nm) TGP
sat No gates
open
Hourly flow(em)
Spill Total
Forebay - middle (from upper deck between spillway and powerhouse)
2 5 70 2 5 70 7 28 71 7 29 71 3 15 72 3 15 72
1 5
13 13
8 8
63 63
126 120 66 66
1240 1230 990 950
1210 1210
1030 1022 956 905
1013 1013
1664 1054 1640 1038 1360 989 1352 971 1648 1051 1648 1051
7768 7667 7282 7100 7725 7725
1048 1034
982 958
1042 1042
0 0 0 0 0 0
00 00 00 00 00 00 00 00 00 00 n n vv 00
Forebay - spillway side (in front of water intake for Dexter Rearing Ponds)
8 3 71 8 471 3 15 72 3 15 72 3 20 72
13 13 11 11 11
126 127 65 65 74
910 950
1260 1260 1170
879 919
1052 1052
999
1359 988 1379 1005 1640 1043 1640 1043 1648 1070
middot7159 7318 7742 7742 7817
966 987
1044 1044 1054
0 0 0 0 0
00 00 00 00 00 00 00 00 00 00
Forebay - Dexter Rearing Pond (from first rearing pond water supplies from forebay)
2 5 70 2 2 71 3 15 72 3 15 72 3 15 72 3 15 72 3 20 72
1 1 1 1 3 3 3
61 54 70 71 70 71 83
1200 1163 1190 1100 1190 1100 1120
990 942
1004 930
1004 930 978
1616 1016 165 1021 1616 1038 1616 1040 1616 1038 1616 1040 1576 1045
7505 7458 7652 7552 7652 7552 7636
1010 1004 1030 1017 1030 1017 1030
0 0 0 0 0 0 0
00 00 00 00 00 00 00 00 00 00 00 00 00 00
Tailrace - powerhouse (01 km downstream of powerhouse in turbine discharge)
3 15 72 1 70 1230 1038 164 1053 7794 1049 0 00 39
Tailrace - spillway (north bank 05 km downstream)
6 2 70 6 2 70 3 15 72 3 20 72
1 4 1 1
138 135 69 70
1210 1220 1400 1390
1l97 1199 1l78 1173
1672 1244 1672 1236 1808 1158 1832 1177
9139 9099 8621 8719
1230 1255 1160 1173
3 3 6 4
67 67 67 67
187 187 215 215
Tailrace - spillway (north bank 37 km downstream)
3 15 72 1 75 1340 1l45 1728 1123 8361 1125 6 187 297
Tailrace - spillway (north bank 74 km downstream)
3 3
15 20
72 72
1 1
78 78
1270 1280
1093 1102
1632 1704
1094 1115
8113 8248
1092 1110
6 4
187 215
297326
-
bull
Table 4--Concentrations of dissolved atmospheric gases and related water temperatures at Fall Creek Dam Hourly flow
O2 N2 + ArDepth Temp TGP No gates ~cm) Location Mo DaI Yr ~M2 ~oC2 mgll sat mILL sat Hg~llIIll sat o2en SEUI Total
Forebay - spillway side 8 6 70 1 223 850 1010 1192 1048 7666 1039 0 00 00 (in front of intake 8 6 70 11 213 84Q 979 1208 1043 7593 1029 0 00 00 for regulating 8 6 70 22 161 380 398 1368 1073 6881 933 0 00 00 outlet) 11 20 70 1 82 1069 930 1608 1063 7673 1034 0 00 00
12 16 70 11 61 1188 987 1598 1012 7424 1006 0 00 00 2 2 71 22 59 1170 962 1624 1018 7461 1006 0 00 00
Tailrace - regulating outlets 8 6 70 1 173 920 983 1400 1117 8066 1087 1 14 14 (from primary 11 20 70 1 81 1162 1009 1551 1023 7561 1019 1 14 14 stilling basin) 12 16 70 8 61 l322 1092 1768 1113 8216 1107 1 42 42
12 16 70 1 61 1230 1016 1750 1102 8034 1083 1 42 42 12 16 70 3 61 1317 1088 1792 1129 8298 1118 1 42 42 12 16 70 1 61 1307 1080 1778 1120 8234 1110 1 57 57 12 16 70 2 61 1331 1099 1792 1129 8316 1121 1 57 57 12 16 70 1 61 1290 1066 1708 1076 7956 1072 1 28 28 12 16 70 3 61 1275 1053 1720 1083 7981 1076 1 28 28 12 16 70 2 61 1237 1022 1627 1025 7593 1023 1 14 14 12 16 70 1 61 1201 992 1604 1010 7463 1006 1 14 14 - 2 271 1 61 l380 1140 1856 1169 8612 1161 1 99 99
2 2 71 1 61 1410 1165 1864 1174 8679 1170 1 127 127
Tailrace - regulating outlets 8 6 70 1 172 910 970 1392 1108 7998 1078 4 14 14 (from secondary 12 16 70 1 61 1304 1052 1732 1065 8062 UJ61 1 42 42 stilling basin)
Tailrace - regulating outlets 11 20 70 1 82 1192 1037 1713 1132 8240 1110 1 14 14 (from west bank 12 16 70 1 61 1299 1073 1741 1096 8088 1090 1 42 42 01 len downstream) 12 16 70 1 61 1316 1087 1738 1095 8099 1092 1 57 57
12 16 70 1 61 1279 1056 1675 1055 7822 1054 1 28 28 12 16 70 1 61 1241 1025 1613 1016 7547 1017 1 14 14
Tailrace - regulating outlets 11 20 70 1 82 1140 992 1556 1028 7568 1020 1 14 14 (fran bridge 12 16 70 1 61 1297 107~1 1720 1083 8009 1079 1 42 42 09 len downstream)
Tailrace - regulating outlets 8 6 70 1 176 960 1032 l344 1078 7919 1067 1 14 14 (from bridge 11 20 70 1 82 1139 991 1603 1059 7747 1044 1 14 14 18 km downstream) 12 16 70 1 61 1279 1056 1720 1083 7986 1076 1 42 42
Table 5 __Goncentrations of dissolved atmospheric gases and related water temperatures at Cougar Dam
Depth Temp O2 N2 + Ar TGP No gates Hourly flow~
Location Mo DaI Yr ~M2 ~oC2 mgl1 sat mIll sat H8~mn2 sat oEen SEi11 Total
Forebay - spillway side (in front of
9 10 70 9 10 70
1 47
188 103
930 970
1064 921
1264 1077 1520 1092
7672 7546
1073 1056
0 0
00 00 00 00
intake for r~gu1ating 11 19 70 21 92 1017 937 1428 997 7070 985 0 00 00 outlets)
Tailrace - powerhouse ( bull 1 ian downstream
9 11
10 70 19 70
1 1
84 90
990 1031
884 934
1544 1440
1047 989
7355 7105
1012 978
0 0
00 00
00 62
of powerhouse in 11 19 70 1 86 1017 913 1532 1043 7378 1016 0 00 62 turbine discharge)
Tailrace - regulating outlets (fran primary
9 9
10 70 10 70
1 1
101 102
1190 1230
1107 1147
1648 1704
1160 1202
8332 8630
1147 1188
1 1
8 20
8 20
stilling basin) 9 9
10 70 10 70
1 1
103 107
1310 1270
1224 1198
1768 1760
1250 1255
9018 9007
1241 1240
1 1
33 48
33 48
11 19 70 1 96 1275 1172 1695 1180 8544 1176 1 31 31
is 11 11
19 70 19 70
1 1
96 95
1272 1289
1169 1182
1693 1712
1179 1189
8532 8612
1174 1185
1 1
31 71
3171
11 19 70 1 98 1275 1177 1714 1198 8657 1192 1 90 90 2 371 1 47 1450 1180 1952 1214 8755 1205 1 99 99 2 3 71 1 44 1470 1187 1960 1211 8744 1203 1 127 127 2 3 71 1 44 1440 1163 1880 1161 8426 1160 1 170 170
Tailrace - regulating outlets (east bank 09 kin downstream)
11 11 11 11
19 70 19 70 19 70 19 70
1 1 1 1
90 89 94 93
1048 1122 1240 1252
949 1014 1134 1142
1466 1550 1676 1682
1007 1062 1162 1163
7230 7641 8384 8405
995 1052 1154 1157
1 1 1 1
33 48 71 90
33 48 71 90
Tailrace - regulating outlets (from bridge 44 ian downstream)
9 11 11 11
10 70 19 70 19 70 19 70
1 1 1 1
114 92 95 96
1170 1120 1157 1142
1122 1020 1061 1050
1576 1505 1546 1514
1140 1039 1074 1054
8244 7513 7776 7646
1135 1034 1070 1052
1 1 1 1
48 33 90 48
48 33 90 62
11 19 70 1 96 1145 1052 1575 1096 7891 1086 1 71 71 2 371 1 44 1330 1074 1776 1097 7927 1091 1 110 170
~
Table 6--Concentrations of dissolved atmospheric gases and related water temperatures at Blue River Dam
Depth Temp O2 N2 + Ar
location Mo Day Yr (M) (OC) mgl sat ml11 sat HgllIII) TGP
sat No gates
open
llourl1flow (an
Spill Total
Forebay - spillway side (in front of intake for regulating outlet)
3 3
7 72 16 72
15 1
50 54
1190 1205
980 1002
1648 1628
1037 1034
7413 7431
1024 1027
0 0
00 00
00 00
Tailrace - regulating outlets (east bank 01 km downstream)
2 3
371 7 72
1 1
50 50
1311 1440
1068 1174
1739 1944
1083 1211
7888 8778
1079 1200
1 1
42 105
42 105
Tailrace - regulating outlets (east bank 025 km downstream)
3 3 3
7 72 16 72 16 72
1 1 1
50 56 60
1440 1336 1300
1174 1106 1094
1052 1789 1751
1215 1130 1116
8807 8213 8118
1204 1123 1110
1 1 1
105 71 71
105 71 71
Tailrace - regulating outlet (fran bridge 19 km downstream)
3 3
7 72 16 72
1 1
50 60
1370 1316
1117 1100
1848 1688
1151 1076
8349 7898
1142 1080
1 1
105 71
105 71
--
Table 7-~Concentrations of dissolved atmospheric gases and related water temperatures at Green Peter Dam
Hourly Depth Temp
O2 N2 + Ar TGP No gates flow
~ Location Mo DaI Yr Ml ~oCl Sll sat mIll sat Hg(_L_ sat open Spill Total
Forebay - powerhouse side (fran upper deck
7 27 71 7 29 71
61 37
81 75
1110 10S0
97S 900
1488 993 lSS2 1022
72S1 7316
989 998
0 0
00 00 00 00
of dam in front 7 30 71 61 7S 1020 883 1504 990 7095 968 0 00 00 of turbine intakes)
Forebay - spillway side (fran upper deck of
1 1
22 71 22 71
1 11
47 47
1170 1180
944 952
1616 1624
996 1001
7222 7262
985 991
0 0
00 00
00 00
dam midway between 1 2S 71 1 50 1180 9S9 1624 1009 731S 998 0 00 00 spillways) 1
7 lS 71 27 71
49 12
48 124
1180 1030
9S4 1001
1632 1404
1009 1028
7308 7494
997 1022
0 0
00 00
00 00
7 27 71 12 114 1010 960 1440 1033 74S6 1017 0 00 00 7 28 71 12 108 1010 946 1432 1014 7329 1000 0 00 00 7 28 71 1 122 10lS 982 1392 101S 7391 1008 0 00 00 7 29 71 12 112 1000 946 1432 1023 7378 1006 0 00 00 7 29 71 12 lS8 840 880 1167 91S 6670 910 0 00 00 8 271 80 75 950 822 lS41 101S 7143 974 0 00 00 8 271 61 76 1020 88S lS20 1003 7171 978 0 00 00
- 8 8
271 371
80 78
76 7S
980 910
851 788
1504 lS20
992 1001
70S8 7011
963 9S6
0 0
00 00
0000
8 371 78 80 910 798 1512 1007 7061 963 0 00 00 3 7 72 15 51 1220 994 1680 1046 7582 1034 0 00 00 3 14 72 8 62 1290 1081 1712 1094 7990 1090 0 00 00 3 17 72 5 88 1170 1046 lS36 1041 7634 1042 0 00 00
Tailrace - regulating outlets (from deck of fish evaluator 2 kin downstream)
2 1 7 8 8
3 70 25 71 30 71 271 371
3 1 1 1 1
68 51 70 81 80
1470 1460 1290 1300 1420
1237 1177 1091 1129 1231
1992 2064 1643 1735 17S2
1276 1271 lOS7 114S l1S4
9376 92S3 7883 8449 86SS
126S 1248 1063 1140 1167
2 2 2 2 2
190 184
S7 113 184
190 184
S7 113 184
Tailrace - spillway (from deck of fish evaluator
2 1 1
3 70 22 71 22 71
3 1 1
69 48 49
1420 lS4O lS30
1198 1231 1227
1928 2000 2056
1238 1222 1260
9094 90S7 9266
1227 1222 1250
2 2 2
190 184 184
190184 184
02 km downstream) 7 7
27 71 28 71
1 1
160 160
11 OS 1114
1149 l1S9
1448 1544
1128 1202
8376 8821
1130 1190
2 2
57 113
S7 113
7 29 71 1 1S3 1160 1189 1576 1210 8913 1202 2 184 184 3 7 72 1 S6 1480 1208 1976 1231 9070 1223 2 312 312 3 1472 1 70 1470 1243 2000 1287 94S0 127S 2 113 113 3 14 72 1 65 lS10 1261 1960 1247 9244 1247 2 184 184
~
Table 7-~Continued
Location Mo Day Yr Depth
(M) remp (OC) mgt1
deg2 sat
N2 + Ar
m11 sat Hg(lIIII) rGP
sat No gates
open
Hour ly flow ~ Spill Total
Tailrace - powerhouse 1 22 71 1 48 1270 1016 1792 1095 7987 1077 0 00 116 (from deck of fish 1 25 71 1 49 1280 1026 1776 1088 7961 1074 0 00 184 evaluator 7 27 71 1 81 1190 1034 1552 1024 7603 1025 0 00 00 02 kIn downstream)
Tailrace - spillway (north bank of South Santiam River
1 22 71 7 27 71 7 28 71
1 1 1
49 134 159
1430 1100 1059
1146 1081 1099
1904 1166 1378 1019 1400 1088
8602 7645 8072
1160 1031 1089
2 2 2
184 184 57 57
113 113 just above mouth of Goal Creek)
7 29 71 3 7 72 3 7 72
1 1 1
153 57 57
1070 1410 1420
1096 1154 1162
1396 1072 1872 1169 1896 1184
7977 8627 8726
1076 1164 1177
2 2 2
184 184 312 312 312 312
3 14 72 1 67 1390 1167 1816 1161 8598 1160 2 113 113 3 14 72 1 64 1420 1183 1856 1178 8724 1177 2 184 184
Tailrace - regulating outlets (north bank of South Santiam River just above mouth of Coal
1 7 8 8
25 71 30 71
2 71 3 71
1 1 1 1
51 78 98 80
1410 1210 1250 1340
1136 1044 1131 1161
1920 1552 1632 1624
1182 1017 1118 1069
8676 7577 8297 8060
1170 1022 1119 1087
2 2 2 2
184 57
113 184
184 57
113 184
Creek)w-
Table 8~-Concentrations of dissolved atmospheric gases and related water temperatures at Foster Dam
X
Depth Temp O2 N2 + Ar TGP No gates
Hourly flow~
Location Mo DaX Yr ~Ml ~oCl ilL sat m1ll 1-sat HS~IIIII~ sat Olen SEill Total
Forebay - spillway side (north bank of
2 2
3 3
70 70
1 5
69 69
1360 1330
1145 1120
1808 1816
1159 1164
8570 8561
1154 1152
0 0
00 00
00 00
forebay just 2 3 70 10 67 1330 1114 1808 1153 8491 1143 0 00 00 above confluence with South Fork)
Forebay - spillway side (in front of water
intake for South
2 1 7
3 22 21
70 71 71
16 16 20
69 57 94
1310 1240 1004
1103 1013 898
1808 1688 1492
1159 1052 1011
8505 7746 7336
1145 1043 987
0 0 0
00 00 00
00 00 00
Santiam Hatchery) 7 7
27 28
71 71
6 2
159 188
1010 890
1046 979
1440 1264
1117 1036
8173 7605
1100 1024
0 0
00 00
00 00
7 28 71 18 93 1015 906 1513 1023 7417 998 0 00 00 7 29 71 2 186 910 997 1247 1018 7530 1014 0 00 00 7 29 71 18 87 990 871 1520 1015 7312 984 0 00 00 8 2 71 2 230 810 968 1152 1018 7486 1008 0 00 00 8 2 71 18 102 950 866 1488 1026 7374 993 0 00 00 8 3 71 2 228 720 857 1047 922 6769 911 0 00 00 8 3 71 18 102 1020 930 1480 1021 7440 1002 0 00 00 3 7 72 10 58 1420 1163 1864 1164 8631 1162 0 00 00
Tailrace - spillway 1 25 71 1 54 1550 1252 2120 1307 9633 1292 2 249 249(north bank of South Santiam 06 km downstream)
Tailrace - spillway 3 7 72 1 58 1420 1159 1864 1160 8631 1158 2 334 41l (north bank of South Santiam 19 km downstream)
Tailrace - spillway 3 7 72 1 56 1390 1107 1880 1142 8610 1133 2 334 425(north bank of South Santiam 56 km downstream)
Table 8--Continued
Depth Temp deg2 N2 + Ar TGP No gates Ilourl) flow
(an Location Ho Day Yr (M) (Oe) mgl ~sat mlll ~sat Hg(mn) sat open Spill Total
Wiley Creek-from creek itself 3 7 72 1 51 1250 1002 1688 1034 7648 1026 0 00 00 (01 kin above confluence with South Santimn not influenced by any dmn)
South Santiam Hatchery -incubator tray
1 3
25 7
71 72
1 1
53 59
1280 1320
1031 1079
1735 1728
1067 1077
7891 8030
1059 1076
0 0
00 00
00 00
South Santiam Hatchery pond 8
- 2 1 1
3 22 23
70 71 71
1 1 1
69 57 67
1250 1270 1320
1049 1034 1102
1808 1704 1776
1155 1058 1129
8427 7842 8360
1131 1052 1122
0 0 0
00 00 00
00 00 00
1 25 71 1 58 1310 1069 1792 1116 8230 1104 0 00 003 7 72 1 55 1310 1060 1792 1107 8173 1096 0 00 00
South Santiam Hatchery pond 2
- 1 1 1
22 25 25
71 71 71
1 16
1
57 53 59
1090 1320 1100
887 1064 900
1656 1808 1695
1029 1112 1058
7441 8203 763i
998 1101 1024
0 0 0
00 00 00
00 00 00
South Santiam River - 3 7 72 1 55 1260 1001 1712 1038 7821 1029 0 00 00 2 kill upstremn from Cascadia dam site (not influenced by any dam)
-
Table 9-~Concentrations of dissolved atmospheric gases and related water temperatures at Detroit Dam
Depth Temp deg2 N2 + Ar TGP No gates Hour1~ flow
an Location Ho DaI Yr ~H~ ~oC~ Ill 1sat mIll 1sat H8~nm2 sat oeen Seill Total
Forebay - spillway side 8 5 71 (frOOI upper deck of dam 8 5 71
8 8
194 172
870 850
1002 936
1152 988 1247 1026
7122 7236
992 1008
0 0
00 00 00 00
midway between 8 6 71 8 185 860 973 1192 1005 7176 999 0 00 00 spillways) 8 6 71
3 8 72 8
12 186
45 910
l210 1032 991
1216 1027 1680 1052
7385 7462
1028 1039
0 0
00 00 00 00
Forebay - powerhouse side (frOOI upper deck of
8 5 71 50 83 1000 901 1456 996 7014 977 0 00 00
dam in front of turbine intakes)
Tailrace - spillway 3 8 72 1 48 1450 1181 1904 1185 8606 1182 6 201 201 (frOOI boat launch ramp
- Tailrace
12 km downstream)
- powerhouse 8 5 71 1 90 1010 913 1416 971 6983 959 0 00 55 (frOOI bridge 03 kIn downstream)
Tailrace - spillway (frOOI bridge 033 kIn downstream)
8 8 8 8
5 5 5 6
71 71 71 71
1 1 1 1
171 185 176 168
1020 1010 1050 1080
1106 1127 1150 1164
1384 1408 1440 1368
1121 1171 1178 llO2
8124 8438 8509 8102
1116 1159 1169 ~113
6 6 6 1
57 113 184
57
57113 184
57 8 6 71 1 177 1030 1131 1392 1140 8271 1136 1 113 113 8 6 71 1 172 1020 1108 1392 1130 8177 1123 1 184 184 3 8 72 1 46 1450 1175 1920 1189 8621 1184 6 201 201
c
Table 10--Concentrations of dissolved atmospheric gases and related water temperatures at Big Cliff Dam
Location Ho DaI Yr Depth ~Hl
Temp ~oC~ Sll
deg2 laat
N2 + Ar
nUll aat H8~nml TGP
sat No gates
oln
Hourly flow ~ SEi11 Total
Forebay - apillway side (from upper deck of dam midway between spillways)
8 8 3
5 6 8
71 71 72
8 16 10
9bull 1 101
45
1010 1020 1410
916 947
1140
1600 1376 1888
1100 967
1167
7717 7009 8439
1060 963
1159
0 0 0
00 00 00
00 00 00
Tailrace - spillway (from north bank 32 Ian downstream)
3 8 72 1 51 1450 1186 1935 1209 8779 1202 2 241 326
Tailrace - spillway (from north bankJ 03 km downstream)
3 8 72 1 52 1580 1296 2064 1293 9424 1290 2 241 326
Tailrace - spillway (from north bank 006 km downstream)
3 8 72 1 47 1450 1174 1912 1183 8613 1179 2 241 241
-
Table ll~-Concentrations of dissolved atmospheric gases and related water temperatures at Lucky Peak Dam
Location Mo Dar Yr Depth ~M2
Temp ~OC) Sll
deg2 sat
N2 + Ar
mIll sat HB~mm2 TGP
sat No gates
oEen
Hourly flow ~ SEi11 Total
Forebay - spillway side (intake for regulating outlet)
8 8 1
13 13 19
70 70 71
10 1
31
183 193
22
872 900
1160
1040 1095 944
1200 1192 1567
1066 1079 979
7206 7350 6612
1062 1083 972
0 0 0
00 00 00
00 00 00
1 19 71 31 21 1l58 939 1561 973 6573 966 0 00 00 1 19 71 1 21 1158 939 1586 988 6656 978 0 00 00 1 19 71 40 21 1160 941 1588 990 6665 980 0 00 00 1 28 71 43 22 1190 970 1642 1028 6897 1016 0 00 00
Tailrace - regulating outlet bay 1
8 8
13 13
70 70
1 1
150 150
957 961
1055 1059
1309 1306
1082 1079
7372 7365
1076 1075
1 1
122 122
122 122
(from LSGS cable way 08 kIll downstream)
Tailrace - regulating outlet bay 3 (from USGS cable way 08 kIll downstream)
1 1 1
19 19 19
71 71 71
1 1 1
23 28 32
1311 1294 1309
1062 1063 1086
1752 1704 1726
1090 1074 1098
7422 7334 7500
1084 1071 1095
1 1 1
85 57
113
85 57
113
Tailrace - regulating outlet bay 5
1 1
28 28
71 71
1 1
24 28
1280 1305
1040 1071
1701 1726
1061 1087
7234 7421
1056 1083
1 1
85 113
85 113
(from USGS cable way 08 kIll downstream)
Tailrace - regulating outlet bay 3 (upstream of
1 1 1
19 19 19
71 71 71
1 1 1
24 28 32
1298 l300 1293
1054 1067 1073
1712 1719 1707
1068 1083 1086
7292 7391 7416
1065 1079 1083
1 1 1
85 57
113
85 57
113 diversion dam 32 km downstream)
Tailrace - regulating outlet 1 28 71 1 25 1300 1059 1726 1079 7360 1074 1 85 85
bay 5 (upstream of diversion dam 32 km downstream)
(
bull
Table 12--Concentrations of dissolved atmospheric gases and related water temperatures at Mayfield Dam
Location
Forebay
Tailrace
Tailrace
__--shy ~- __ __ _ Ifo Day Yr
- spillway side 3 11 71 (from upper deck of 3 11 71 dam midway between 8 26 71 spillway) 8 26 71
8 26 71
- spillway bay 3 3 11 71 (north bank 3 11 71
o 4 kID downstJe8lll)
- spillway bay 3 upstream from
3 11 71
powerhouse on retainfng wall)
Depth ~lfl
10 10
1 6
12
1 1
1
Temp ~oCl
43 44
167 104 100
44 44
44
Sll
1185 1183 1055 1075 1024
1278 1320
1300
O2 4sat
926 927
1103 977 922
996 1028
1013
H2 + Ar
m1ll 4sat
1644 983 1654 992 1380 1079 1554 1068 1554 1059
1821 1085 1862 1109
1786 1064
TGP HSlIIIll sat
7268 971 7319 978 8101 1082 7847 1048 7709 1030
8022 1065 8217 1091
7925 1052
No gates 02en
0 0 0 0 0
1 1
1
lIourly flow ~ S2i11middot Total
00 00 00 00 00 00 00 00 00 00
113 113 198 198
283 283
--
-
t 1
Concentration of Dissolved Gases in the Willamette Cowlitz and Boise Rivers 1970-72
BRUCE H MONK1 EARL DAWLEY1 and KIRK BEININGEN2
ABSTRACT Data on dissolved nitrogen dissolved oxygen total gas pressure and water
temperatures are presented for the Wlllamette Cowlitz and Boise rivers Water samples were taken upstream and downstream of dams and over a wide range of river and dam discharges to obtain data on the relation between river flow and dam discharges and their effect on the total gas regime of the rivers
INTRODUCTION
In recent years fishery scientists have shown that high concentrations of dissolved atmospheric gases in the Columbia and lower Snake rivers cause gas bubble disease and during years of high flow can result in up to 68 mortality of juvenile and adult Pacific salmon Oncorhynchus spp and steelhead trout Samo gairdneri (Ebel 1971 1973) The high concentrations occur when air is entrained in water passing over spillways and forced into solution by high pressures in the stilling basin (Ebel 1969 Beiningen and Ebel 1970)
In 1970 fishery agencies and the US Army Corps of Engineers became concerned that heavy spilling of water over Lost Creek Dam (now under construction 247 km from the mouth of th~ Rogue River) would create supersaturated concentrashytions of dissolved gas harmful to native stocks of salmon and steelhead trout and to hatcheryshyreleased stocks of coho salmon O kisutch and fall chinook salmon O tshawytscha Hatchery stocks could also be affected by supersaturated water supplied to the hatchery by a regulating reservoir downstream from the dam Therefore a nitrogen monitoring program was established at various hydroelectric projects which would be pertinent to spillway design modifications at Lost Creek Dam The program included many projects on the Willamette Valley system Lucky Peak Dam on the Boise River and Mayfield Dam on the Cowlitz River (Figs 1 2 3) There was also concern over the possibility of high concenshytrations in the reservoirs below Green Peter Dam and Lookout Point Dam (Fig 2) which supply
1 Northwest Fisheries Center National Marine Fisheries Service NOAA Seattle WA 98112
2Fish CommiSSion of Oregon Clackamas OR 97015
water for South Santlam Hatchery and Dexter Rearing Ponds respectively (operated by Fish Commission of Oregon)
To determine whether discharges from the dams on the Willamette and Cowlitz River systems would create supersaturated concenshytrations of dissolved gas extensive sampling and analysis for dissolved gases was done during 1970 1971 and 1972 Samples were taken near dams over a wide range of river flow and spillway and regulating outlet discharges (regulating outlets are low level valved gates used to draw down reservoir water levels farther than pOSsible by spilling) to obtain data on the relation between river flow and dam discharges and their effect on the total gas regime of the rivers
Atlditlonal samples were taken at Lucky Peak Dam on the Boise River (Fig 3) to determine the concentrations of dissolved gases below a flip bucket designed to diSSipate energy In the spillrace and thereby eliminate supersaturated concentrations The US Army Corps of Engishyneers felt that such deflectors if effective could be a possible answer to the potential supershysaturation problem at Lost Creek Dam
This report presents data on gas concentrations and related water temperatures of water samples taken at forebays and tailraces of dams In the Willamette River drainage Mayfield Dam on the Cowlitz River and Lucky Peak Dam on the Boise River All sampling and analysiS were done by the National Marine Fisheries Service under contract with the US Army Corps of Engineers
PROCEDURE Water samples were collected with a modified
Van Dorn sampler and then put In standard bioshychemical-oxygen-demand sample bottles (300
1
ml) by means of a tube running from the bottom of the sampler The air interface and agitation of sample were minimized by placing the tube at the bottom of the sample bottle The bottles were allowed to overflow up to 3 times their volume and were immediately placed in a chilled Ice chest
All of the samples were analyzed within 24 h of the time of collection Dissolved nitrogen analshyyses were done with an Arthur H Thomas modishyfication of the Van Slyke-Nelll manometric blood gas analyzer (Van Slyke and Neill 1924) and with a Fisher-Hamilton gas partitloner model No 29 The method used was that described by Swlnnershyton Linnenbom and Cheek (1962)
The gas partitioner was calibrated by analyzing at least three samples on the partltioner and the Van Slyke A graph of partltloner units versus Van Slyke concentration values (milligrams per liter) was established so that other samples could be run on the partitioner and resulting saturation values derived from the graph An Alsterburg modified Winkler method was used for the determination of the dissolved oxygen levels and similar calibration techniques were used to calibrate the partitioner (American Public Health Association 1971)
PRESENTATION OF DATA Tables 1-12 correspond to the numbers in
Figures 2 and 3 which indicate the dams where water was sampled These tables give the locations of the various sample stations at each dam and the dates on which samples were taken They also give dissolved oxygen concentrations (mgll and of saturation) dissolved nitrogen plus argon concentrations (mill N2 + Ar and of saturation) total gas pressure (mm Hg and of saturation) and related water temperature (0C) Saturation values were calculated from tables by
Weiss (1970) and then corrected for altitude In cases where hourly spill flow and hourly total flow are equal the samples were taken directly from spillway discharge and there was no possibility of dilution by turbine discharge When the total hourly flow Is larger than the hourly spill the sample was taken during both spilling and powerhouse operation and there was a good
possibility of the discharges mixing
LITERATURE CITED American Public Health Association
1971 Standard methods for the examination of water and wastewater 13th ed Am Publ Health Assoc NY 874 p
Belnlngen K T and W J Ebel 1970 Effect of John Day Dam on dissolved nitrogen
concentrations and salmon In the Columbia River 1968 Trans Am Fish Soc 99664-671
Ebel W J 1969 Supersaturation of nitrogen In the Columbia
River and Its effect on salmon and steelhead trout US Fish Wlldl Serv Fish Bull 681-11
1971 Dissolved nitrogen concentratlonsln the Columshybia and Snake Rivers In 1970 and their effect on chishynook salmon and steel head trout US Dep Commer NOAA Tech Rep NMFS SSRF-848 7 p
1973 Relations between fish behavior bioassay Inshyformation and dissolved gas concentrations on surshyvival of Juvenile salmon and steelhead trout In Snake River Proc 53rd Annu Conf West Assoc State Game Fish Comm p 516-527
Swlnnerton JWVJ Llnnenbom and C H Cheek 1962 Determination of dissolved gases In aqueous
solutions by gas chromatography Anal Chern 34 483-485
Van Slyke D D and J M Nelli 1924 The determination of gases In blood and other
solutions by vacuum extraction and manometric measurement J BioI Chern 61 523-574
WeiSS R F 1970 The solubility of nitrogen oxygen and argon In
water and seawater Deep-Sea Res 17721-735
2
See Fi92
----- shy
CANADA
Oregon
o 40 80 120 160 I I I I I
Kilometers
II- ____ ----l_____
Figura 1-Map of Columbia Rlvr dralnag bullbullhowlng location of trlbutarl bullbullbullampled to dtrmln concntratlon of dlbullbullolved atmophrlc gbullbullbullbull
3
o 16 I I
Kilometers
Figure 2- Mp of WIIImette River dralnge Numbers Indicate dams where water was sampled to determine concentration of dissolved atmospheric gases
4
WASHINGTON
OREGON
o 16 32 48 64 80 I I I I I I
Kilomtrs
LuckyR Peak
11
FIgure 3-Mp of Cowlitz RIver (top) nd Bolbullbull Rlvr (bottom) Numbell Indlcat dim where wlter WIbullbullImpled to dtrmln concentratIon of dllolvedltmopherlc g
5
Table 1--Concentrations of dissolved atmospheric gases and related water temperatures at Hills Creek Dam
Hourly flow N2 + ArDepth Temp deg2 TGP No gates (em)
Location Mo DaI Yr (OC~ ~M~ sat sat SO mIll Hg~lIIIl) sat oEen 512111 Total
Forebay - spillway side (in 2 2 71 4 47 1150 946 1576 991 7055 981 0 00 00 front of intake for regulating outlets)
Tailrace - regulating outlet 2 2 71 1 48 1330 1084 1728 1077 7834 1077 1 136 136 (01 kIn downstream) 2 2 71 1 48 1310 1068 1728 1077 7809 1074 1 181 181
-
Table 2~-Concentrations of dissolved acnospheric gases and related water temperatures at Lookout Point Dam
Location Mo Day Yr Depth ~Ml
Temp ~oC2 mgll
O2 sat
N2 + Ar
mIll sat Hs~nm2 TGP
sat No gates
oEen
Hourly flow~ 5Ei11 Total
Forebay ~ powerhouse side (from upper deck of dam in front of
7 7 7
27 71 28 71 29 71
37 37 37
128 114 114
930 980
1000
910 928 947
1376 1416 1352
1013 1013
967
7291 7315 7081
992 995 963
0 0 0
00 00 00
00 00 00
turbine intakes)
Forebay - spillway side (from upper deck of dam midway between spillways)
2 7 7 7 7 8 8 8 3 3 3
271 27 71 28 71 28 71 29 71 371 471 471
15 72 15 72 20 72
18 16 15 15 16 64 64 64
6 6 6
50 150 140 126 136 88 92 92 68 68 80
1220 910 900 920 970 875 915 950
1180 1180 1230
989 934 904 896 966 780 823 855
1001 1001 1075
1608 1344 1336 1328 1328 1448 1504 1424 1592 1592 1552
996 1035 1008
974 994 979
1026 971
1028 1028 1030
7308 7453 7255 7044 7267 6893 7228 6963 7514 7514 7639
994 1014
987 958 988 973 983 947
1028 1028 1039
0 0 0 0 0 0 0 0 0 0 0
00 00 00 00 00 00 00 00 00 00 00
00 00 00 00 00 00 00 00 00 00 00
Tailrace ~ spillway
(north bank 05 lan downstream)
2 7 7 7 7 3 3 3 3
5 70 27 71 28 71 29 71 29 71 15 72 20 72 20 72 20 72
1 1 1 1 1 1 1 1 1
67 153 169 170 181 68 81 80 80
1360 1030 1050 1000 1040 1320 1330 1340 1360
1141 1055 1113 1062 1130 1110 1155 1161 1178
1792 1384 1424 1392 1456 1752 1744 1800 1800
1145 1063 1128 1105 1180 1122 1151 1185 1185
8471 7861 8324 8114 8647 8290 8524 8732 8758
1142 1060 1123 1094 1166 1118 1149 1178 1181
1 2 5 5 1 5 5 5 5
71 57
113 184
57 57 85
113 170
71 57
113 184
57 57 85
113 170
Tailrace - regulating outlet (north bank 05 lan downstream)
2 2 8 8 8 8 8
271 271 371 371 471 471 471
1 1 1 1 1 1 1
53 52
103 113 128 109 110
1510 1549 1270 1260 1130 1290 1310
1223 1251 1163 1181 1096 1198 1219
2032 1965 1664 1680 1496 1695 1720
1257 1212 1152 1189 1092 1189 1209
9244 9031 8545 8781 8093 8810 8960
1247 1218 1152 1184 1091 1188 1208
1 1 3 2 3 3 2
113 184 113 113 ~7
184 113
113 184 113 113
57 184 113
Tailrace ~ powerhouse (fram tailrace deck of powerhouse in turbine discharge)
7 7 7 8
27 71 28 71 29 71 3 71
1 1 1 1
99 119 131 118
1010 1000
980 970
916 950 957 920
1416 1432 1400 1480
972 1026 1029 1058
7123 7488 7512 7627
961 1010 1013 1029
0 0 0 0
00 00 00 00
67 67 67
00
Table 3_~Concentrations of dissolved atmospheric gases and related water temperatures at Dexter Dam
Location ~MQDay Yr Depth
(M) Temp (OC) mgtl
deg2 sat
N2 + Ar
m1t1 sat Hg(nm) TGP
sat No gates
open
Hourly flow(em)
Spill Total
Forebay - middle (from upper deck between spillway and powerhouse)
2 5 70 2 5 70 7 28 71 7 29 71 3 15 72 3 15 72
1 5
13 13
8 8
63 63
126 120 66 66
1240 1230 990 950
1210 1210
1030 1022 956 905
1013 1013
1664 1054 1640 1038 1360 989 1352 971 1648 1051 1648 1051
7768 7667 7282 7100 7725 7725
1048 1034
982 958
1042 1042
0 0 0 0 0 0
00 00 00 00 00 00 00 00 00 00 n n vv 00
Forebay - spillway side (in front of water intake for Dexter Rearing Ponds)
8 3 71 8 471 3 15 72 3 15 72 3 20 72
13 13 11 11 11
126 127 65 65 74
910 950
1260 1260 1170
879 919
1052 1052
999
1359 988 1379 1005 1640 1043 1640 1043 1648 1070
middot7159 7318 7742 7742 7817
966 987
1044 1044 1054
0 0 0 0 0
00 00 00 00 00 00 00 00 00 00
Forebay - Dexter Rearing Pond (from first rearing pond water supplies from forebay)
2 5 70 2 2 71 3 15 72 3 15 72 3 15 72 3 15 72 3 20 72
1 1 1 1 3 3 3
61 54 70 71 70 71 83
1200 1163 1190 1100 1190 1100 1120
990 942
1004 930
1004 930 978
1616 1016 165 1021 1616 1038 1616 1040 1616 1038 1616 1040 1576 1045
7505 7458 7652 7552 7652 7552 7636
1010 1004 1030 1017 1030 1017 1030
0 0 0 0 0 0 0
00 00 00 00 00 00 00 00 00 00 00 00 00 00
Tailrace - powerhouse (01 km downstream of powerhouse in turbine discharge)
3 15 72 1 70 1230 1038 164 1053 7794 1049 0 00 39
Tailrace - spillway (north bank 05 km downstream)
6 2 70 6 2 70 3 15 72 3 20 72
1 4 1 1
138 135 69 70
1210 1220 1400 1390
1l97 1199 1l78 1173
1672 1244 1672 1236 1808 1158 1832 1177
9139 9099 8621 8719
1230 1255 1160 1173
3 3 6 4
67 67 67 67
187 187 215 215
Tailrace - spillway (north bank 37 km downstream)
3 15 72 1 75 1340 1l45 1728 1123 8361 1125 6 187 297
Tailrace - spillway (north bank 74 km downstream)
3 3
15 20
72 72
1 1
78 78
1270 1280
1093 1102
1632 1704
1094 1115
8113 8248
1092 1110
6 4
187 215
297326
-
bull
Table 4--Concentrations of dissolved atmospheric gases and related water temperatures at Fall Creek Dam Hourly flow
O2 N2 + ArDepth Temp TGP No gates ~cm) Location Mo DaI Yr ~M2 ~oC2 mgll sat mILL sat Hg~llIIll sat o2en SEUI Total
Forebay - spillway side 8 6 70 1 223 850 1010 1192 1048 7666 1039 0 00 00 (in front of intake 8 6 70 11 213 84Q 979 1208 1043 7593 1029 0 00 00 for regulating 8 6 70 22 161 380 398 1368 1073 6881 933 0 00 00 outlet) 11 20 70 1 82 1069 930 1608 1063 7673 1034 0 00 00
12 16 70 11 61 1188 987 1598 1012 7424 1006 0 00 00 2 2 71 22 59 1170 962 1624 1018 7461 1006 0 00 00
Tailrace - regulating outlets 8 6 70 1 173 920 983 1400 1117 8066 1087 1 14 14 (from primary 11 20 70 1 81 1162 1009 1551 1023 7561 1019 1 14 14 stilling basin) 12 16 70 8 61 l322 1092 1768 1113 8216 1107 1 42 42
12 16 70 1 61 1230 1016 1750 1102 8034 1083 1 42 42 12 16 70 3 61 1317 1088 1792 1129 8298 1118 1 42 42 12 16 70 1 61 1307 1080 1778 1120 8234 1110 1 57 57 12 16 70 2 61 1331 1099 1792 1129 8316 1121 1 57 57 12 16 70 1 61 1290 1066 1708 1076 7956 1072 1 28 28 12 16 70 3 61 1275 1053 1720 1083 7981 1076 1 28 28 12 16 70 2 61 1237 1022 1627 1025 7593 1023 1 14 14 12 16 70 1 61 1201 992 1604 1010 7463 1006 1 14 14 - 2 271 1 61 l380 1140 1856 1169 8612 1161 1 99 99
2 2 71 1 61 1410 1165 1864 1174 8679 1170 1 127 127
Tailrace - regulating outlets 8 6 70 1 172 910 970 1392 1108 7998 1078 4 14 14 (from secondary 12 16 70 1 61 1304 1052 1732 1065 8062 UJ61 1 42 42 stilling basin)
Tailrace - regulating outlets 11 20 70 1 82 1192 1037 1713 1132 8240 1110 1 14 14 (from west bank 12 16 70 1 61 1299 1073 1741 1096 8088 1090 1 42 42 01 len downstream) 12 16 70 1 61 1316 1087 1738 1095 8099 1092 1 57 57
12 16 70 1 61 1279 1056 1675 1055 7822 1054 1 28 28 12 16 70 1 61 1241 1025 1613 1016 7547 1017 1 14 14
Tailrace - regulating outlets 11 20 70 1 82 1140 992 1556 1028 7568 1020 1 14 14 (fran bridge 12 16 70 1 61 1297 107~1 1720 1083 8009 1079 1 42 42 09 len downstream)
Tailrace - regulating outlets 8 6 70 1 176 960 1032 l344 1078 7919 1067 1 14 14 (from bridge 11 20 70 1 82 1139 991 1603 1059 7747 1044 1 14 14 18 km downstream) 12 16 70 1 61 1279 1056 1720 1083 7986 1076 1 42 42
Table 5 __Goncentrations of dissolved atmospheric gases and related water temperatures at Cougar Dam
Depth Temp O2 N2 + Ar TGP No gates Hourly flow~
Location Mo DaI Yr ~M2 ~oC2 mgl1 sat mIll sat H8~mn2 sat oEen SEi11 Total
Forebay - spillway side (in front of
9 10 70 9 10 70
1 47
188 103
930 970
1064 921
1264 1077 1520 1092
7672 7546
1073 1056
0 0
00 00 00 00
intake for r~gu1ating 11 19 70 21 92 1017 937 1428 997 7070 985 0 00 00 outlets)
Tailrace - powerhouse ( bull 1 ian downstream
9 11
10 70 19 70
1 1
84 90
990 1031
884 934
1544 1440
1047 989
7355 7105
1012 978
0 0
00 00
00 62
of powerhouse in 11 19 70 1 86 1017 913 1532 1043 7378 1016 0 00 62 turbine discharge)
Tailrace - regulating outlets (fran primary
9 9
10 70 10 70
1 1
101 102
1190 1230
1107 1147
1648 1704
1160 1202
8332 8630
1147 1188
1 1
8 20
8 20
stilling basin) 9 9
10 70 10 70
1 1
103 107
1310 1270
1224 1198
1768 1760
1250 1255
9018 9007
1241 1240
1 1
33 48
33 48
11 19 70 1 96 1275 1172 1695 1180 8544 1176 1 31 31
is 11 11
19 70 19 70
1 1
96 95
1272 1289
1169 1182
1693 1712
1179 1189
8532 8612
1174 1185
1 1
31 71
3171
11 19 70 1 98 1275 1177 1714 1198 8657 1192 1 90 90 2 371 1 47 1450 1180 1952 1214 8755 1205 1 99 99 2 3 71 1 44 1470 1187 1960 1211 8744 1203 1 127 127 2 3 71 1 44 1440 1163 1880 1161 8426 1160 1 170 170
Tailrace - regulating outlets (east bank 09 kin downstream)
11 11 11 11
19 70 19 70 19 70 19 70
1 1 1 1
90 89 94 93
1048 1122 1240 1252
949 1014 1134 1142
1466 1550 1676 1682
1007 1062 1162 1163
7230 7641 8384 8405
995 1052 1154 1157
1 1 1 1
33 48 71 90
33 48 71 90
Tailrace - regulating outlets (from bridge 44 ian downstream)
9 11 11 11
10 70 19 70 19 70 19 70
1 1 1 1
114 92 95 96
1170 1120 1157 1142
1122 1020 1061 1050
1576 1505 1546 1514
1140 1039 1074 1054
8244 7513 7776 7646
1135 1034 1070 1052
1 1 1 1
48 33 90 48
48 33 90 62
11 19 70 1 96 1145 1052 1575 1096 7891 1086 1 71 71 2 371 1 44 1330 1074 1776 1097 7927 1091 1 110 170
~
Table 6--Concentrations of dissolved atmospheric gases and related water temperatures at Blue River Dam
Depth Temp O2 N2 + Ar
location Mo Day Yr (M) (OC) mgl sat ml11 sat HgllIII) TGP
sat No gates
open
llourl1flow (an
Spill Total
Forebay - spillway side (in front of intake for regulating outlet)
3 3
7 72 16 72
15 1
50 54
1190 1205
980 1002
1648 1628
1037 1034
7413 7431
1024 1027
0 0
00 00
00 00
Tailrace - regulating outlets (east bank 01 km downstream)
2 3
371 7 72
1 1
50 50
1311 1440
1068 1174
1739 1944
1083 1211
7888 8778
1079 1200
1 1
42 105
42 105
Tailrace - regulating outlets (east bank 025 km downstream)
3 3 3
7 72 16 72 16 72
1 1 1
50 56 60
1440 1336 1300
1174 1106 1094
1052 1789 1751
1215 1130 1116
8807 8213 8118
1204 1123 1110
1 1 1
105 71 71
105 71 71
Tailrace - regulating outlet (fran bridge 19 km downstream)
3 3
7 72 16 72
1 1
50 60
1370 1316
1117 1100
1848 1688
1151 1076
8349 7898
1142 1080
1 1
105 71
105 71
--
Table 7-~Concentrations of dissolved atmospheric gases and related water temperatures at Green Peter Dam
Hourly Depth Temp
O2 N2 + Ar TGP No gates flow
~ Location Mo DaI Yr Ml ~oCl Sll sat mIll sat Hg(_L_ sat open Spill Total
Forebay - powerhouse side (fran upper deck
7 27 71 7 29 71
61 37
81 75
1110 10S0
97S 900
1488 993 lSS2 1022
72S1 7316
989 998
0 0
00 00 00 00
of dam in front 7 30 71 61 7S 1020 883 1504 990 7095 968 0 00 00 of turbine intakes)
Forebay - spillway side (fran upper deck of
1 1
22 71 22 71
1 11
47 47
1170 1180
944 952
1616 1624
996 1001
7222 7262
985 991
0 0
00 00
00 00
dam midway between 1 2S 71 1 50 1180 9S9 1624 1009 731S 998 0 00 00 spillways) 1
7 lS 71 27 71
49 12
48 124
1180 1030
9S4 1001
1632 1404
1009 1028
7308 7494
997 1022
0 0
00 00
00 00
7 27 71 12 114 1010 960 1440 1033 74S6 1017 0 00 00 7 28 71 12 108 1010 946 1432 1014 7329 1000 0 00 00 7 28 71 1 122 10lS 982 1392 101S 7391 1008 0 00 00 7 29 71 12 112 1000 946 1432 1023 7378 1006 0 00 00 7 29 71 12 lS8 840 880 1167 91S 6670 910 0 00 00 8 271 80 75 950 822 lS41 101S 7143 974 0 00 00 8 271 61 76 1020 88S lS20 1003 7171 978 0 00 00
- 8 8
271 371
80 78
76 7S
980 910
851 788
1504 lS20
992 1001
70S8 7011
963 9S6
0 0
00 00
0000
8 371 78 80 910 798 1512 1007 7061 963 0 00 00 3 7 72 15 51 1220 994 1680 1046 7582 1034 0 00 00 3 14 72 8 62 1290 1081 1712 1094 7990 1090 0 00 00 3 17 72 5 88 1170 1046 lS36 1041 7634 1042 0 00 00
Tailrace - regulating outlets (from deck of fish evaluator 2 kin downstream)
2 1 7 8 8
3 70 25 71 30 71 271 371
3 1 1 1 1
68 51 70 81 80
1470 1460 1290 1300 1420
1237 1177 1091 1129 1231
1992 2064 1643 1735 17S2
1276 1271 lOS7 114S l1S4
9376 92S3 7883 8449 86SS
126S 1248 1063 1140 1167
2 2 2 2 2
190 184
S7 113 184
190 184
S7 113 184
Tailrace - spillway (from deck of fish evaluator
2 1 1
3 70 22 71 22 71
3 1 1
69 48 49
1420 lS4O lS30
1198 1231 1227
1928 2000 2056
1238 1222 1260
9094 90S7 9266
1227 1222 1250
2 2 2
190 184 184
190184 184
02 km downstream) 7 7
27 71 28 71
1 1
160 160
11 OS 1114
1149 l1S9
1448 1544
1128 1202
8376 8821
1130 1190
2 2
57 113
S7 113
7 29 71 1 1S3 1160 1189 1576 1210 8913 1202 2 184 184 3 7 72 1 S6 1480 1208 1976 1231 9070 1223 2 312 312 3 1472 1 70 1470 1243 2000 1287 94S0 127S 2 113 113 3 14 72 1 65 lS10 1261 1960 1247 9244 1247 2 184 184
~
Table 7-~Continued
Location Mo Day Yr Depth
(M) remp (OC) mgt1
deg2 sat
N2 + Ar
m11 sat Hg(lIIII) rGP
sat No gates
open
Hour ly flow ~ Spill Total
Tailrace - powerhouse 1 22 71 1 48 1270 1016 1792 1095 7987 1077 0 00 116 (from deck of fish 1 25 71 1 49 1280 1026 1776 1088 7961 1074 0 00 184 evaluator 7 27 71 1 81 1190 1034 1552 1024 7603 1025 0 00 00 02 kIn downstream)
Tailrace - spillway (north bank of South Santiam River
1 22 71 7 27 71 7 28 71
1 1 1
49 134 159
1430 1100 1059
1146 1081 1099
1904 1166 1378 1019 1400 1088
8602 7645 8072
1160 1031 1089
2 2 2
184 184 57 57
113 113 just above mouth of Goal Creek)
7 29 71 3 7 72 3 7 72
1 1 1
153 57 57
1070 1410 1420
1096 1154 1162
1396 1072 1872 1169 1896 1184
7977 8627 8726
1076 1164 1177
2 2 2
184 184 312 312 312 312
3 14 72 1 67 1390 1167 1816 1161 8598 1160 2 113 113 3 14 72 1 64 1420 1183 1856 1178 8724 1177 2 184 184
Tailrace - regulating outlets (north bank of South Santiam River just above mouth of Coal
1 7 8 8
25 71 30 71
2 71 3 71
1 1 1 1
51 78 98 80
1410 1210 1250 1340
1136 1044 1131 1161
1920 1552 1632 1624
1182 1017 1118 1069
8676 7577 8297 8060
1170 1022 1119 1087
2 2 2 2
184 57
113 184
184 57
113 184
Creek)w-
Table 8~-Concentrations of dissolved atmospheric gases and related water temperatures at Foster Dam
X
Depth Temp O2 N2 + Ar TGP No gates
Hourly flow~
Location Mo DaX Yr ~Ml ~oCl ilL sat m1ll 1-sat HS~IIIII~ sat Olen SEill Total
Forebay - spillway side (north bank of
2 2
3 3
70 70
1 5
69 69
1360 1330
1145 1120
1808 1816
1159 1164
8570 8561
1154 1152
0 0
00 00
00 00
forebay just 2 3 70 10 67 1330 1114 1808 1153 8491 1143 0 00 00 above confluence with South Fork)
Forebay - spillway side (in front of water
intake for South
2 1 7
3 22 21
70 71 71
16 16 20
69 57 94
1310 1240 1004
1103 1013 898
1808 1688 1492
1159 1052 1011
8505 7746 7336
1145 1043 987
0 0 0
00 00 00
00 00 00
Santiam Hatchery) 7 7
27 28
71 71
6 2
159 188
1010 890
1046 979
1440 1264
1117 1036
8173 7605
1100 1024
0 0
00 00
00 00
7 28 71 18 93 1015 906 1513 1023 7417 998 0 00 00 7 29 71 2 186 910 997 1247 1018 7530 1014 0 00 00 7 29 71 18 87 990 871 1520 1015 7312 984 0 00 00 8 2 71 2 230 810 968 1152 1018 7486 1008 0 00 00 8 2 71 18 102 950 866 1488 1026 7374 993 0 00 00 8 3 71 2 228 720 857 1047 922 6769 911 0 00 00 8 3 71 18 102 1020 930 1480 1021 7440 1002 0 00 00 3 7 72 10 58 1420 1163 1864 1164 8631 1162 0 00 00
Tailrace - spillway 1 25 71 1 54 1550 1252 2120 1307 9633 1292 2 249 249(north bank of South Santiam 06 km downstream)
Tailrace - spillway 3 7 72 1 58 1420 1159 1864 1160 8631 1158 2 334 41l (north bank of South Santiam 19 km downstream)
Tailrace - spillway 3 7 72 1 56 1390 1107 1880 1142 8610 1133 2 334 425(north bank of South Santiam 56 km downstream)
Table 8--Continued
Depth Temp deg2 N2 + Ar TGP No gates Ilourl) flow
(an Location Ho Day Yr (M) (Oe) mgl ~sat mlll ~sat Hg(mn) sat open Spill Total
Wiley Creek-from creek itself 3 7 72 1 51 1250 1002 1688 1034 7648 1026 0 00 00 (01 kin above confluence with South Santimn not influenced by any dmn)
South Santiam Hatchery -incubator tray
1 3
25 7
71 72
1 1
53 59
1280 1320
1031 1079
1735 1728
1067 1077
7891 8030
1059 1076
0 0
00 00
00 00
South Santiam Hatchery pond 8
- 2 1 1
3 22 23
70 71 71
1 1 1
69 57 67
1250 1270 1320
1049 1034 1102
1808 1704 1776
1155 1058 1129
8427 7842 8360
1131 1052 1122
0 0 0
00 00 00
00 00 00
1 25 71 1 58 1310 1069 1792 1116 8230 1104 0 00 003 7 72 1 55 1310 1060 1792 1107 8173 1096 0 00 00
South Santiam Hatchery pond 2
- 1 1 1
22 25 25
71 71 71
1 16
1
57 53 59
1090 1320 1100
887 1064 900
1656 1808 1695
1029 1112 1058
7441 8203 763i
998 1101 1024
0 0 0
00 00 00
00 00 00
South Santiam River - 3 7 72 1 55 1260 1001 1712 1038 7821 1029 0 00 00 2 kill upstremn from Cascadia dam site (not influenced by any dam)
-
Table 9-~Concentrations of dissolved atmospheric gases and related water temperatures at Detroit Dam
Depth Temp deg2 N2 + Ar TGP No gates Hour1~ flow
an Location Ho DaI Yr ~H~ ~oC~ Ill 1sat mIll 1sat H8~nm2 sat oeen Seill Total
Forebay - spillway side 8 5 71 (frOOI upper deck of dam 8 5 71
8 8
194 172
870 850
1002 936
1152 988 1247 1026
7122 7236
992 1008
0 0
00 00 00 00
midway between 8 6 71 8 185 860 973 1192 1005 7176 999 0 00 00 spillways) 8 6 71
3 8 72 8
12 186
45 910
l210 1032 991
1216 1027 1680 1052
7385 7462
1028 1039
0 0
00 00 00 00
Forebay - powerhouse side (frOOI upper deck of
8 5 71 50 83 1000 901 1456 996 7014 977 0 00 00
dam in front of turbine intakes)
Tailrace - spillway 3 8 72 1 48 1450 1181 1904 1185 8606 1182 6 201 201 (frOOI boat launch ramp
- Tailrace
12 km downstream)
- powerhouse 8 5 71 1 90 1010 913 1416 971 6983 959 0 00 55 (frOOI bridge 03 kIn downstream)
Tailrace - spillway (frOOI bridge 033 kIn downstream)
8 8 8 8
5 5 5 6
71 71 71 71
1 1 1 1
171 185 176 168
1020 1010 1050 1080
1106 1127 1150 1164
1384 1408 1440 1368
1121 1171 1178 llO2
8124 8438 8509 8102
1116 1159 1169 ~113
6 6 6 1
57 113 184
57
57113 184
57 8 6 71 1 177 1030 1131 1392 1140 8271 1136 1 113 113 8 6 71 1 172 1020 1108 1392 1130 8177 1123 1 184 184 3 8 72 1 46 1450 1175 1920 1189 8621 1184 6 201 201
c
Table 10--Concentrations of dissolved atmospheric gases and related water temperatures at Big Cliff Dam
Location Ho DaI Yr Depth ~Hl
Temp ~oC~ Sll
deg2 laat
N2 + Ar
nUll aat H8~nml TGP
sat No gates
oln
Hourly flow ~ SEi11 Total
Forebay - apillway side (from upper deck of dam midway between spillways)
8 8 3
5 6 8
71 71 72
8 16 10
9bull 1 101
45
1010 1020 1410
916 947
1140
1600 1376 1888
1100 967
1167
7717 7009 8439
1060 963
1159
0 0 0
00 00 00
00 00 00
Tailrace - spillway (from north bank 32 Ian downstream)
3 8 72 1 51 1450 1186 1935 1209 8779 1202 2 241 326
Tailrace - spillway (from north bankJ 03 km downstream)
3 8 72 1 52 1580 1296 2064 1293 9424 1290 2 241 326
Tailrace - spillway (from north bank 006 km downstream)
3 8 72 1 47 1450 1174 1912 1183 8613 1179 2 241 241
-
Table ll~-Concentrations of dissolved atmospheric gases and related water temperatures at Lucky Peak Dam
Location Mo Dar Yr Depth ~M2
Temp ~OC) Sll
deg2 sat
N2 + Ar
mIll sat HB~mm2 TGP
sat No gates
oEen
Hourly flow ~ SEi11 Total
Forebay - spillway side (intake for regulating outlet)
8 8 1
13 13 19
70 70 71
10 1
31
183 193
22
872 900
1160
1040 1095 944
1200 1192 1567
1066 1079 979
7206 7350 6612
1062 1083 972
0 0 0
00 00 00
00 00 00
1 19 71 31 21 1l58 939 1561 973 6573 966 0 00 00 1 19 71 1 21 1158 939 1586 988 6656 978 0 00 00 1 19 71 40 21 1160 941 1588 990 6665 980 0 00 00 1 28 71 43 22 1190 970 1642 1028 6897 1016 0 00 00
Tailrace - regulating outlet bay 1
8 8
13 13
70 70
1 1
150 150
957 961
1055 1059
1309 1306
1082 1079
7372 7365
1076 1075
1 1
122 122
122 122
(from LSGS cable way 08 kIll downstream)
Tailrace - regulating outlet bay 3 (from USGS cable way 08 kIll downstream)
1 1 1
19 19 19
71 71 71
1 1 1
23 28 32
1311 1294 1309
1062 1063 1086
1752 1704 1726
1090 1074 1098
7422 7334 7500
1084 1071 1095
1 1 1
85 57
113
85 57
113
Tailrace - regulating outlet bay 5
1 1
28 28
71 71
1 1
24 28
1280 1305
1040 1071
1701 1726
1061 1087
7234 7421
1056 1083
1 1
85 113
85 113
(from USGS cable way 08 kIll downstream)
Tailrace - regulating outlet bay 3 (upstream of
1 1 1
19 19 19
71 71 71
1 1 1
24 28 32
1298 l300 1293
1054 1067 1073
1712 1719 1707
1068 1083 1086
7292 7391 7416
1065 1079 1083
1 1 1
85 57
113
85 57
113 diversion dam 32 km downstream)
Tailrace - regulating outlet 1 28 71 1 25 1300 1059 1726 1079 7360 1074 1 85 85
bay 5 (upstream of diversion dam 32 km downstream)
(
bull
Table 12--Concentrations of dissolved atmospheric gases and related water temperatures at Mayfield Dam
Location
Forebay
Tailrace
Tailrace
__--shy ~- __ __ _ Ifo Day Yr
- spillway side 3 11 71 (from upper deck of 3 11 71 dam midway between 8 26 71 spillway) 8 26 71
8 26 71
- spillway bay 3 3 11 71 (north bank 3 11 71
o 4 kID downstJe8lll)
- spillway bay 3 upstream from
3 11 71
powerhouse on retainfng wall)
Depth ~lfl
10 10
1 6
12
1 1
1
Temp ~oCl
43 44
167 104 100
44 44
44
Sll
1185 1183 1055 1075 1024
1278 1320
1300
O2 4sat
926 927
1103 977 922
996 1028
1013
H2 + Ar
m1ll 4sat
1644 983 1654 992 1380 1079 1554 1068 1554 1059
1821 1085 1862 1109
1786 1064
TGP HSlIIIll sat
7268 971 7319 978 8101 1082 7847 1048 7709 1030
8022 1065 8217 1091
7925 1052
No gates 02en
0 0 0 0 0
1 1
1
lIourly flow ~ S2i11middot Total
00 00 00 00 00 00 00 00 00 00
113 113 198 198
283 283
--
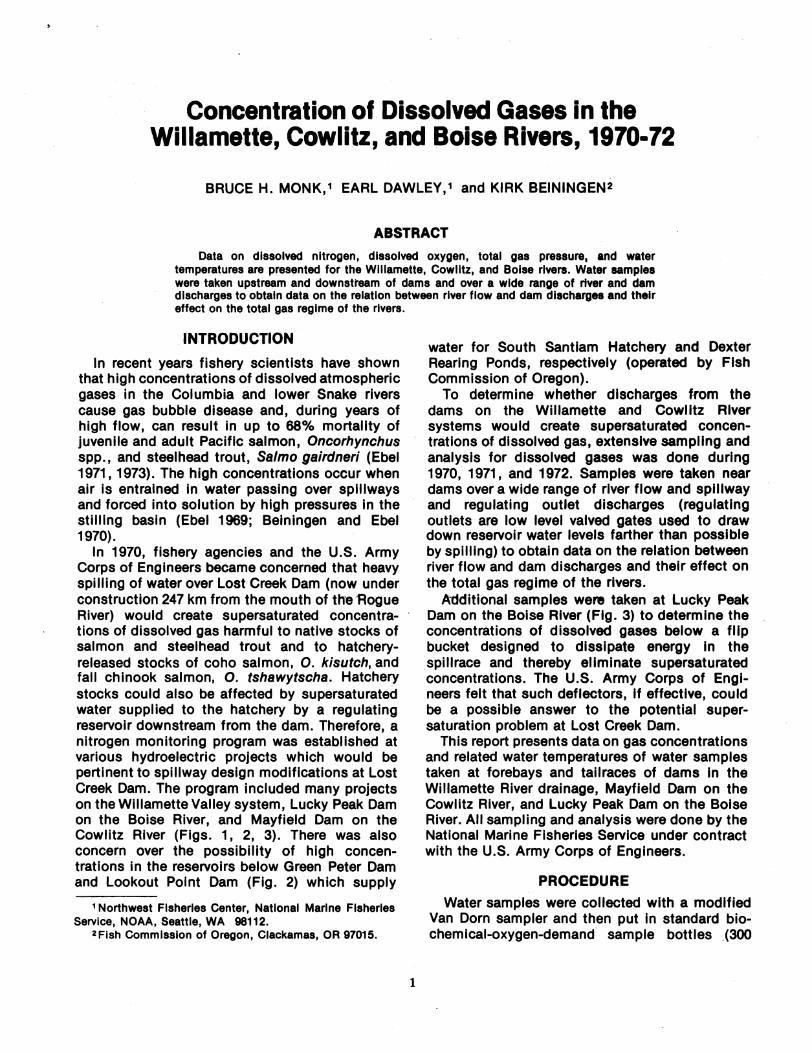
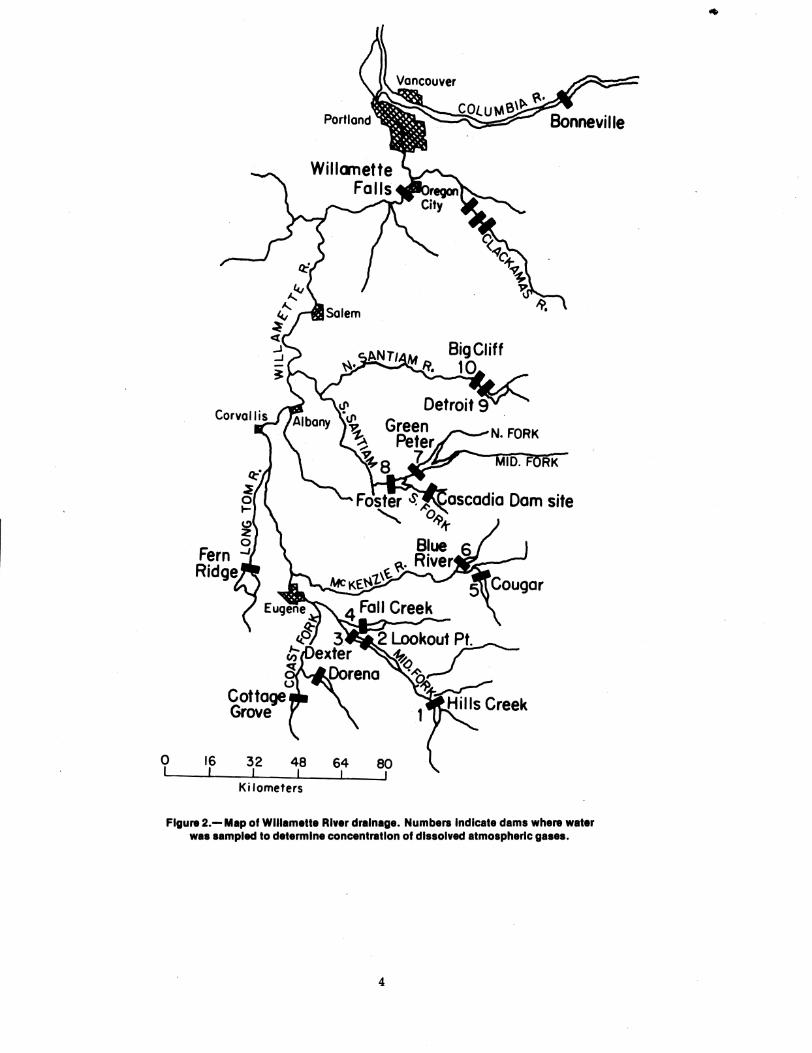
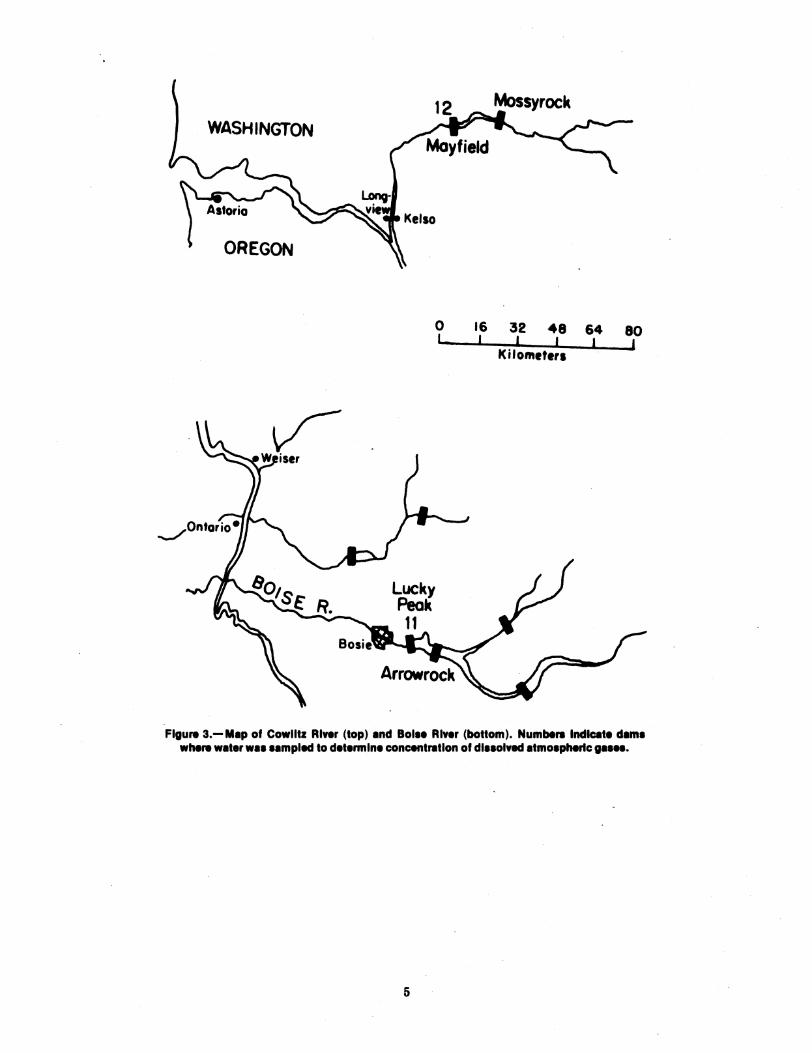
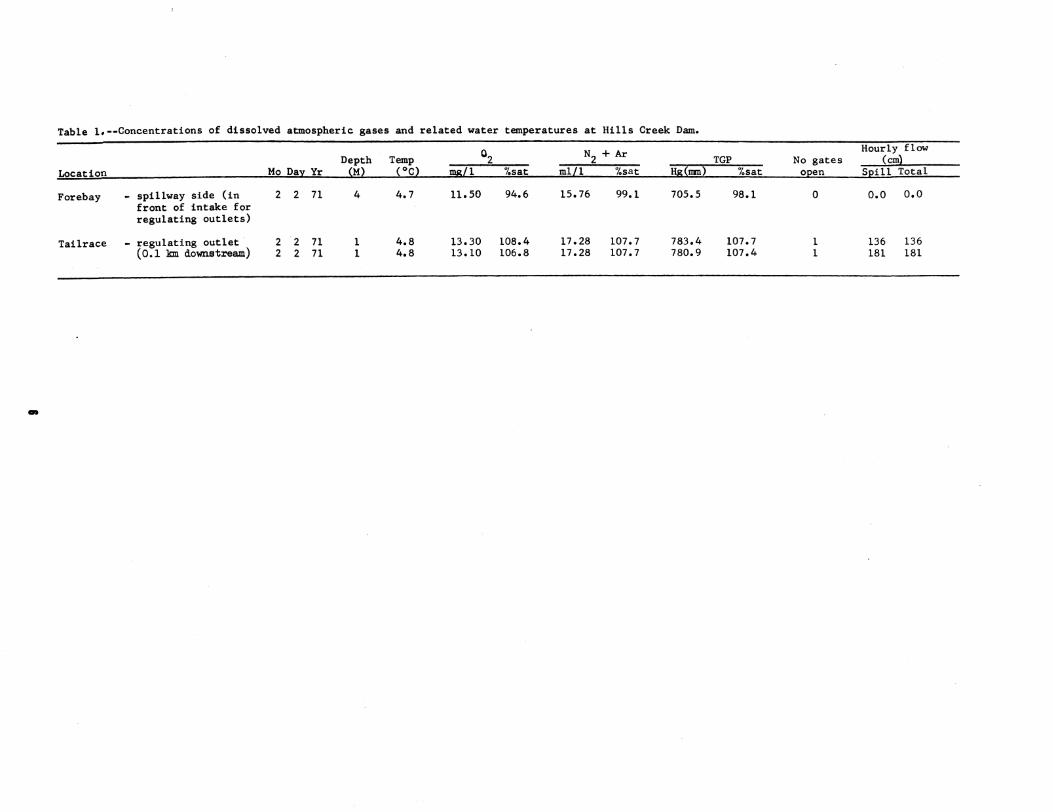
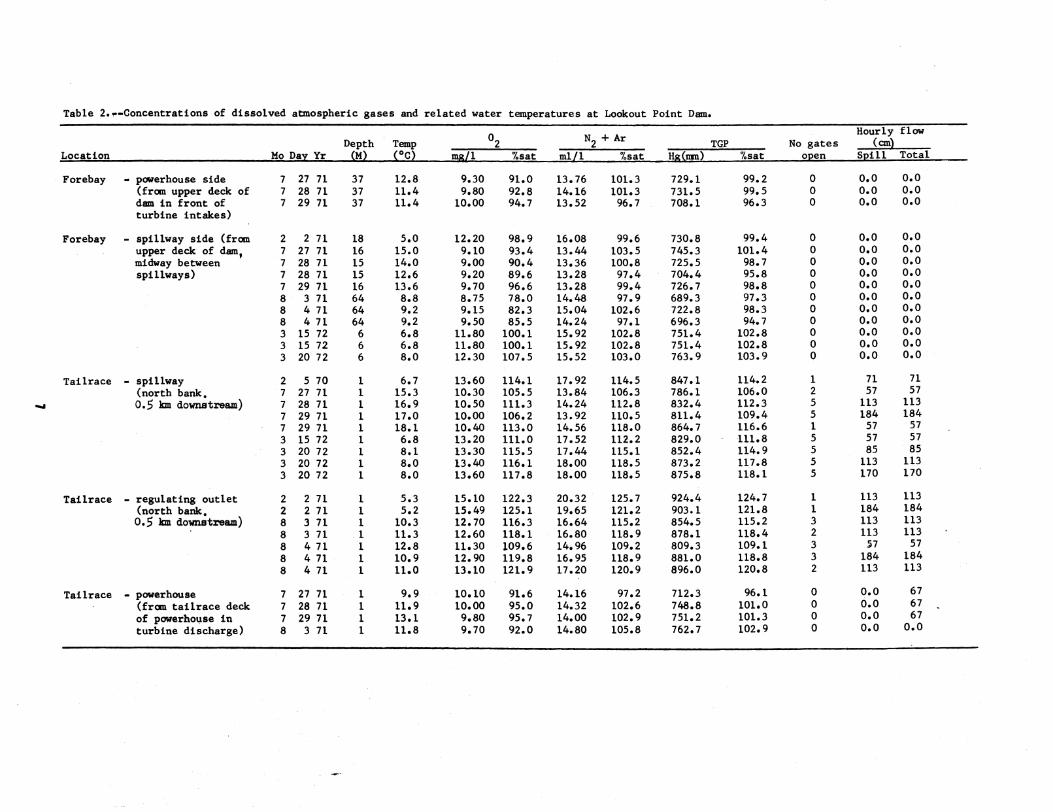
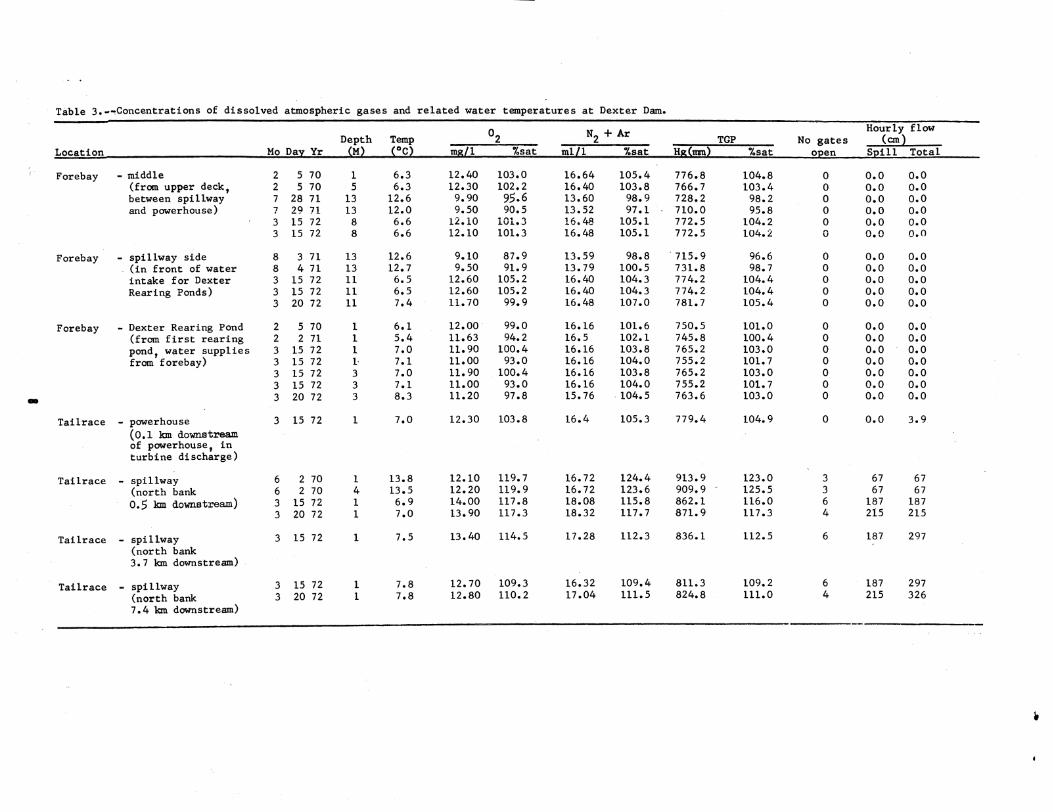
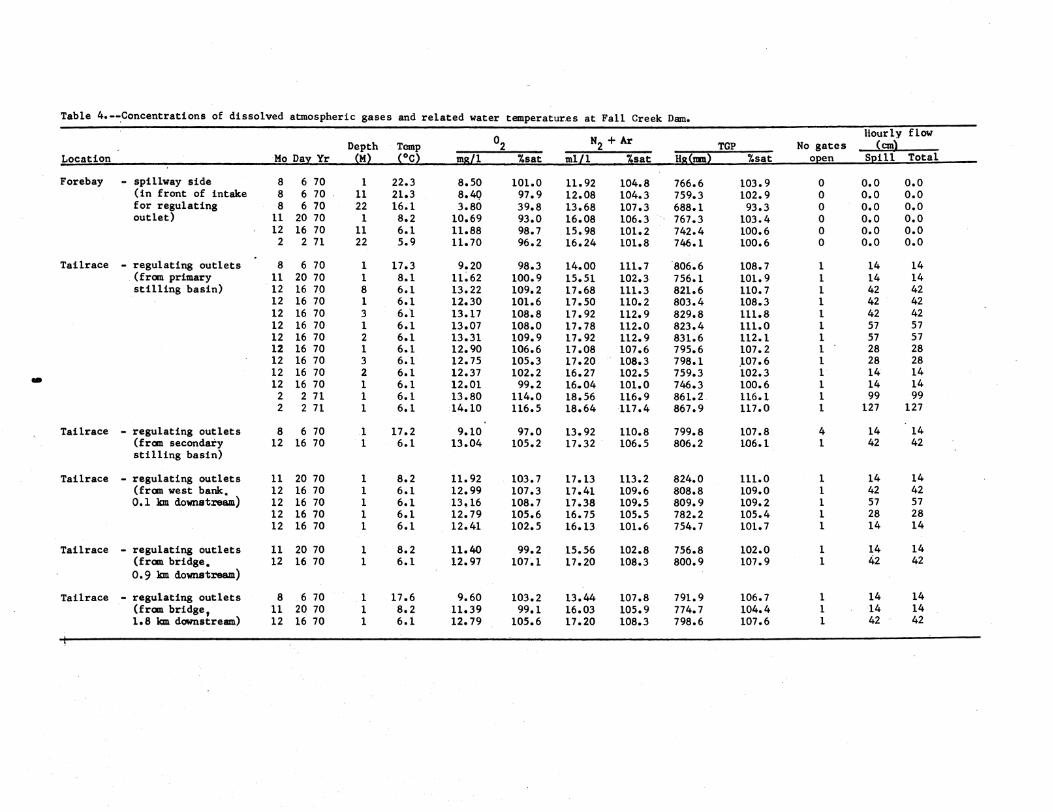
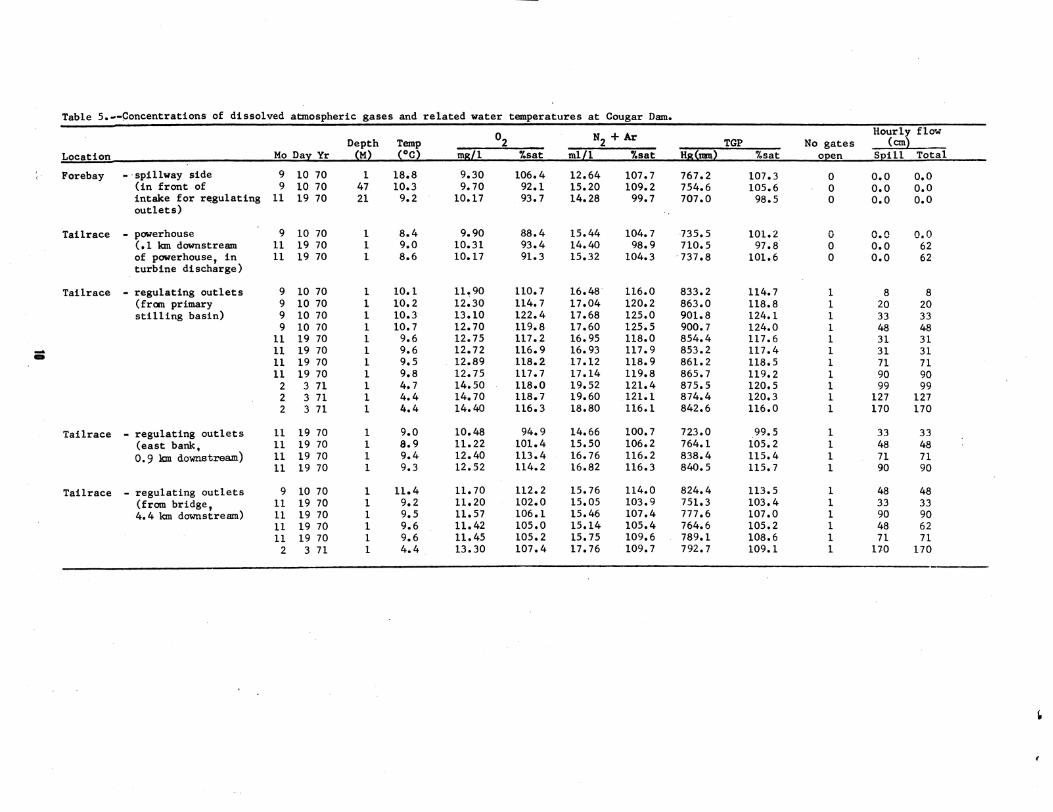
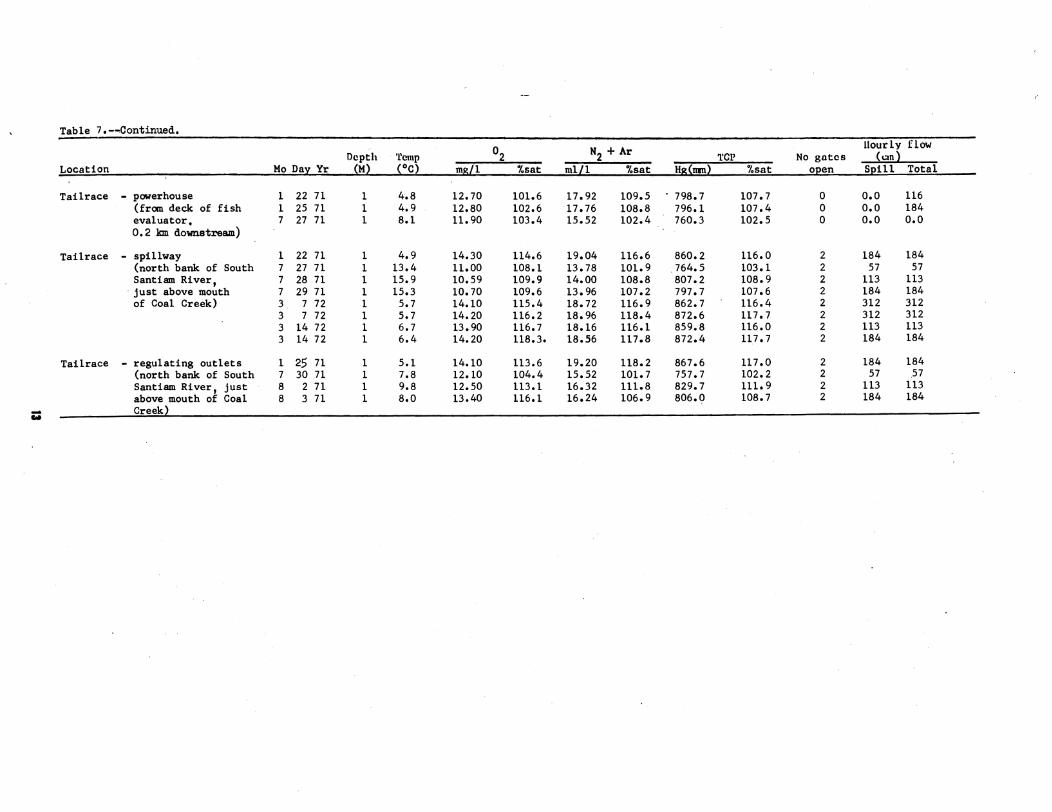
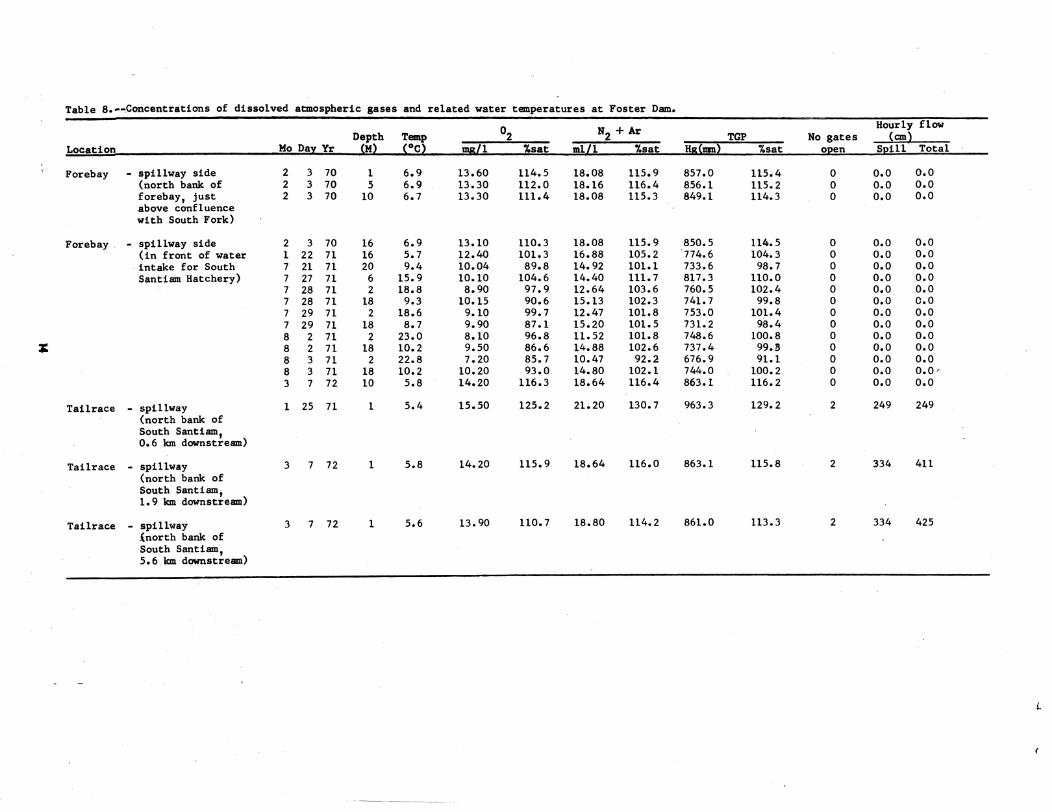
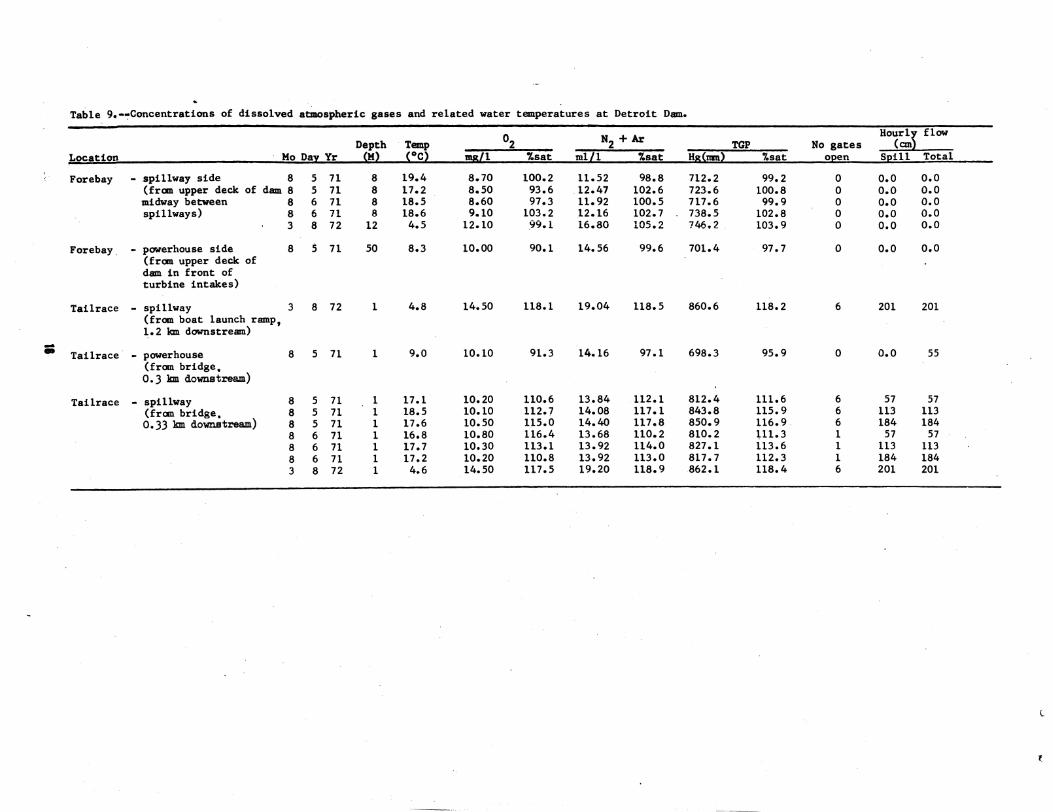
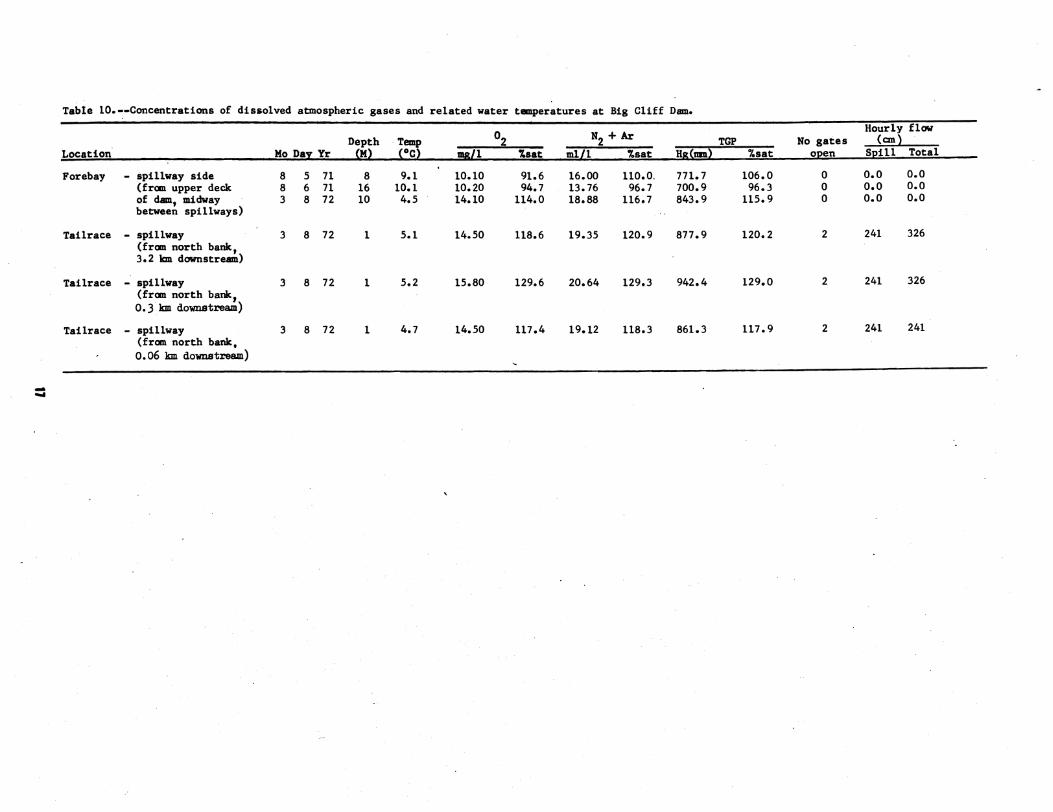
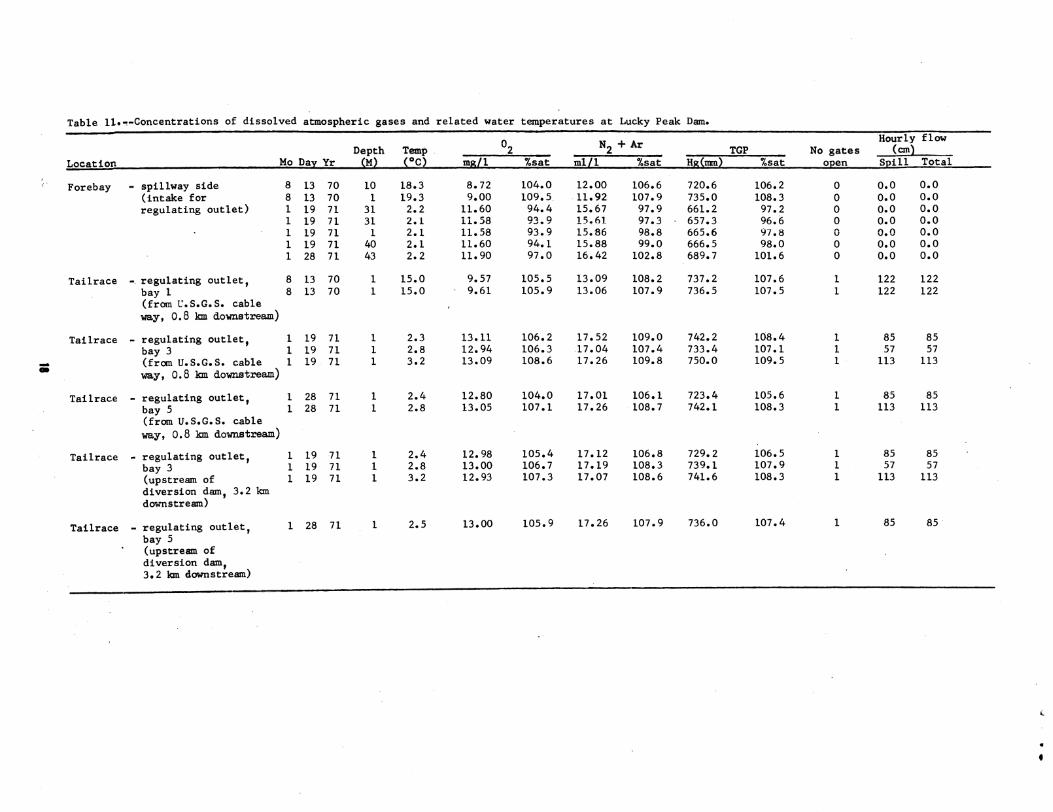