concept modeling and analysis of body in …€¦ · launch the hypermesh software. using...
TRANSCRIPT

http://www.iaeme.com/IJDMT/index.asp 23 [email protected]
International Journal of Design and Manufacturing Technology (IJDMT)
Volume 7, Issue 1, January-April 2016, pp. 23–36, Article ID: IJDMT_07_01_003
Available online at
http://www.iaeme.com/IJDMT/issues.asp?JType=IJDMT&VType=7&IType=1
Journal Impact Factor (2016): 5.7682 (Calculated by GISI) www.jifactor.com
ISSN Print: 0976 – 6995 and ISSN Online: 0976 – 7002
© IAEME Publication
__________________________________________________________________
CONCEPT MODELING AND ANALYSIS OF
BODY IN WHITE USING BEAM ELEMENTS
Praveen Padagannavar and Manohara Bheemanna
School of Aerospace, Mechanical & Manufacturing Engineering
Royal Melbourne Institute of Technology (RMIT University)
Melbourne, VIC 3001, Australia
ABSTRACT
In this paper, Concept Modeling and Analysis of Body in White by using
Hpermesh software is discussed. The companies first design the concept model
of the car by using a CAD software. Altair Hyperworks software is used to
create models. Beam and shell elements have been used to design the Body-in-
white structure of the vehicle. The modeling has done by using beam elements
for creating the structural frame of the car, the model is imported and solved
using MD Nastran. In order to perform the modal analysis of the model SOL
103 is used. The mode shapes and natural resonance frequencies can be
visualised using Hyperview software. The frequency response functions of
Inphase, Outphase and Single node are detailed. The SOL 111 is used to
obtain the Frequency response functions under different conditions. The
graphs are visualised using Hypergraph software. Based on the structural
integrity the design of structure, alterations are done to it to get satisfactory
values which can make the car stiffer. The results obtained confirms to the
actual model, which can be compared with any hatchback vehicle.
Key words: Beam Elements, Steel, Hypermesh Model, Modeshapes-
SOL103, FRF Graphs- SOL111, Cavity Modeling.
Cite this Article: Praveen Padagannavar and Manohara Bheemanna, Concept
Modeling and Analysis of Body In white Using Beam Elements. International
Journal of Design and Manufacturing Technology 7(1), 2016, pp. 23–36. http://www.iaeme.com/IJDMT/issues.asp?JType=IJDMT&VType=7&IType=1
1. INTRODUCTION
Concept Modeling is the abstraction of the vehicle model from the real model. The
detailed Finite Element model may or may not exist when the concept model is
designed. It implies the need for simplification of the real system and assumptions
about unknown quantities. The concept model can be used to test future designs or
make design changes to existing models.
Praveen Padagannavar and Manohara Bheemanna
http://www.iaeme.com/IJDMT/index.asp 24 [email protected]
Modal analysis is the process of evaluating the natural frequencies, damping
factors and mode shapes, in order to study the systems dynamic behavior. The natural
modes of the vibration are completely determinant on the physical properties such as
mass, stiffness and damping. The basis of testing is upon establishing the relation
between the vibration response at one location and the excitation at the same or
different location. This relationship is called as Frequency Response Function. In
automotive engineering, modal analysis is an important role in studying vehicle noise
and vibration harshness.
Companies usually make a concept model or a prototype before making the final
product and with the help of software the particular model is analyzed and tested to
check its stability. Earlier there was no software to test the prototype and to do the
crash analysis. Often it was required lot of initial investment of money and time. In
order to overcome with this problem, companies started using software & as a result it
saved a huge amount of money and time.
Altair Hyperworks is a design platform for optimization, performance data
management and process automation. It provides integrated tools for modeling,
analysis, optimization, visualization, and reporting performance data management.
Hpermesh is a powerful tool for creating and understanding finite-element models and
Hyperview is a general purpose visualization tool for viewing the output of CAE
results. Hypergraph provides a data analyzing platform for plotting and testing data in
various formats.
2. METHODOLOGY OF MODELLING
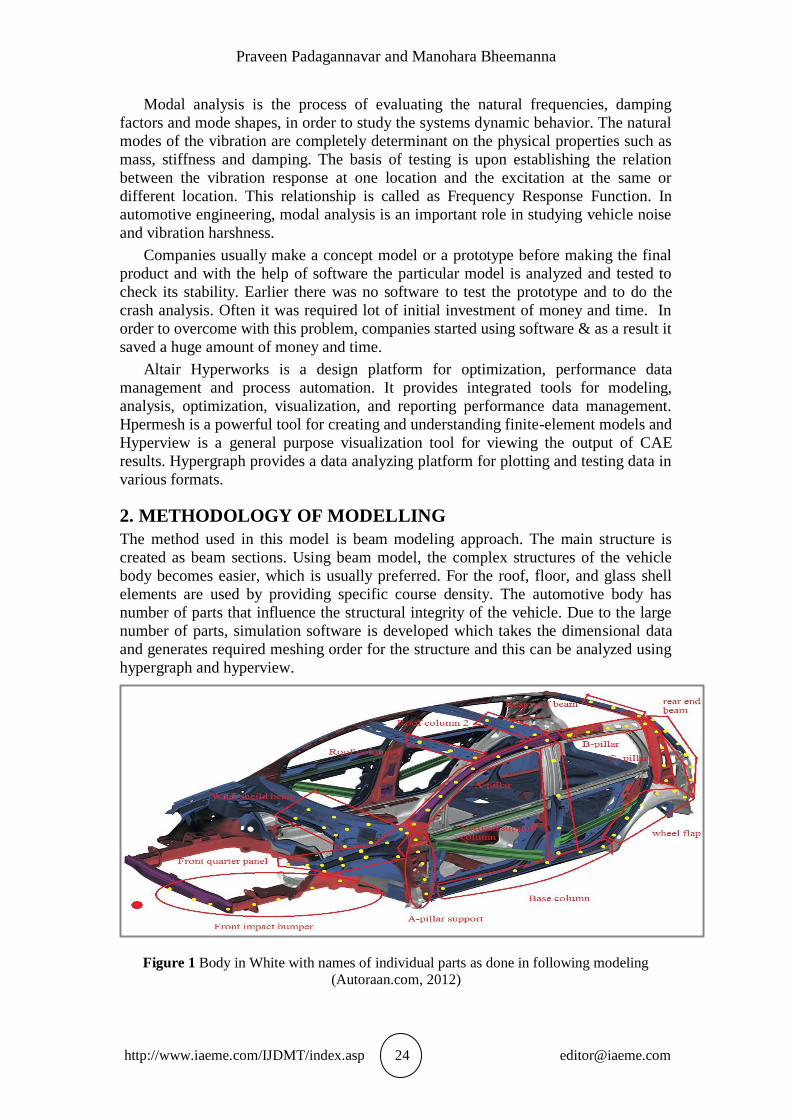
The method used in this model is beam modeling approach. The main structure is
created as beam sections. Using beam model, the complex structures of the vehicle
body becomes easier, which is usually preferred. For the roof, floor, and glass shell
elements are used by providing specific course density. The automotive body has
number of parts that influence the structural integrity of the vehicle. Due to the large
number of parts, simulation software is developed which takes the dimensional data
and generates required meshing order for the structure and this can be analyzed using
hypergraph and hyperview.
Figure 1 Body in White with names of individual parts as done in following modeling
(Autoraan.com, 2012)

Concept Modeling and Analysis of Body In white Using Beam Elements
http://www.iaeme.com/IJDMT/index.asp 25 [email protected]
2.1: CREATING NODES AND CONNECTING LINES
Launch the Hypermesh software.
Using “Geometry” options create the “Nodes” according to the required model and according to the dimensions. Draw all the nodes of one side as per the
model requirement. This is important step because we need to concentrate on
coordinates and ensure avoiding overlapping of nodes.
On creating the nodes, the half model of the vehicle is created and then
translated according to the dimensions.
In order to translate nodes, select the required nodes and click on “Translate+”.
To reflect the nodes, select all the required nodes, duplicate and then reflect it.
The nodes will be connected by lines to form the connections. The lines
formed will represent the wireframe model of the car. Straight lines and
smooth lines are used to connect the nodes.
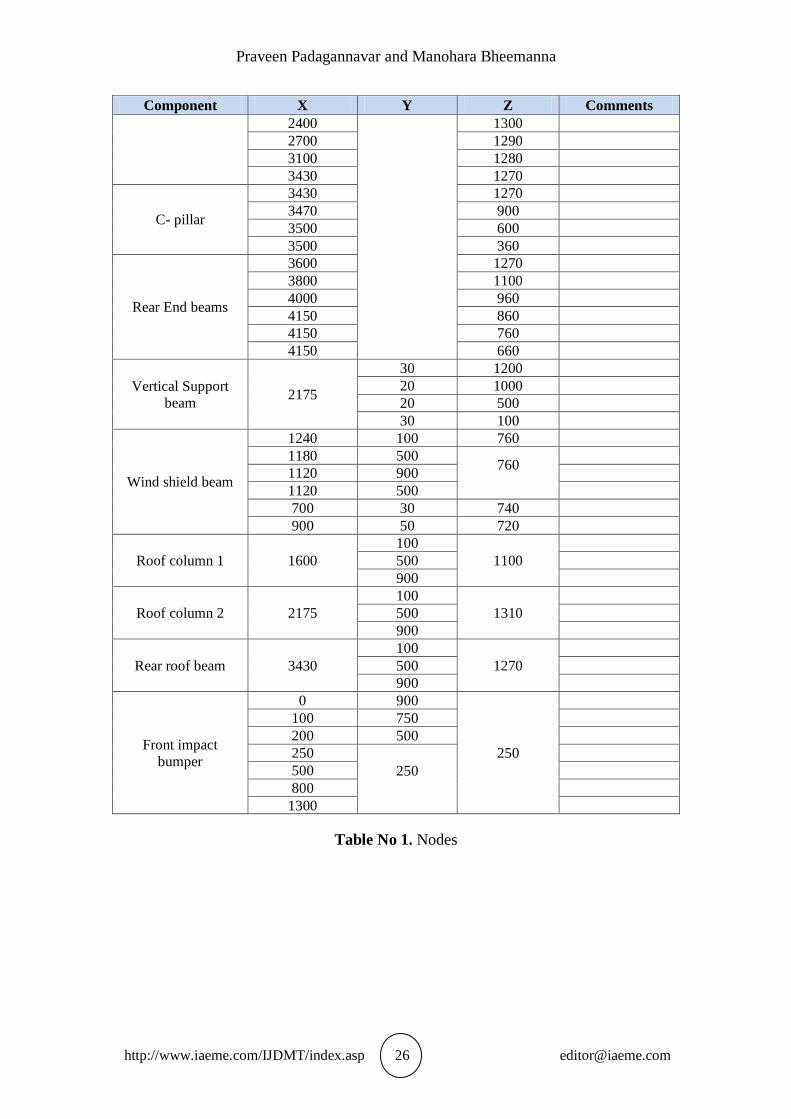
Nodes for BIW:
Component X Y Z Comments
Front Quarter panel
420 100 720 Need translation
on Y axis
450 70 720
500
30
720
600 730
800 740
1000 745
600 600
420 600
A – pillar support
1240 760
1240 700
1300 500
1350 250
1400 50
Base column
1500
50
1800
2000
2300
2500
2990
Wheel flap
3000 100
Adjust the node
height to get
curvature
3200 200
3500 290
3800 380
4000 290
4150 200
A - Pillar
1300 760
1200 800
1250 1000
1400 1050
2000 1250
2175 1310
B- Pillar 2300 1300
Praveen Padagannavar and Manohara Bheemanna
http://www.iaeme.com/IJDMT/index.asp 26 [email protected]
Component X Y Z Comments
2400 1300
2700 1290
3100 1280
3430 1270
C- pillar
3430 1270
3470 900
3500 600
3500 360
Rear End beams
3600 1270
3800 1100
4000 960
4150 860
4150 760
4150 660
Vertical Support
beam 2175
30 1200
20 1000
20 500
30 100
Wind shield beam
1240 100 760
1180 500 760
1120 900
1120 500
700 30 740
900 50 720
Roof column 1 1600
100
1100
500
900
Roof column 2 2175
100
1310
500
900
Rear roof beam 3430
100
1270
500
900
Front impact
bumper
0 900
250
100 750
200 500
250
250
500
800
1300
Table No 1. Nodes
Concept Modeling and Analysis of Body In white Using Beam Elements
http://www.iaeme.com/IJDMT/index.asp 27 [email protected]
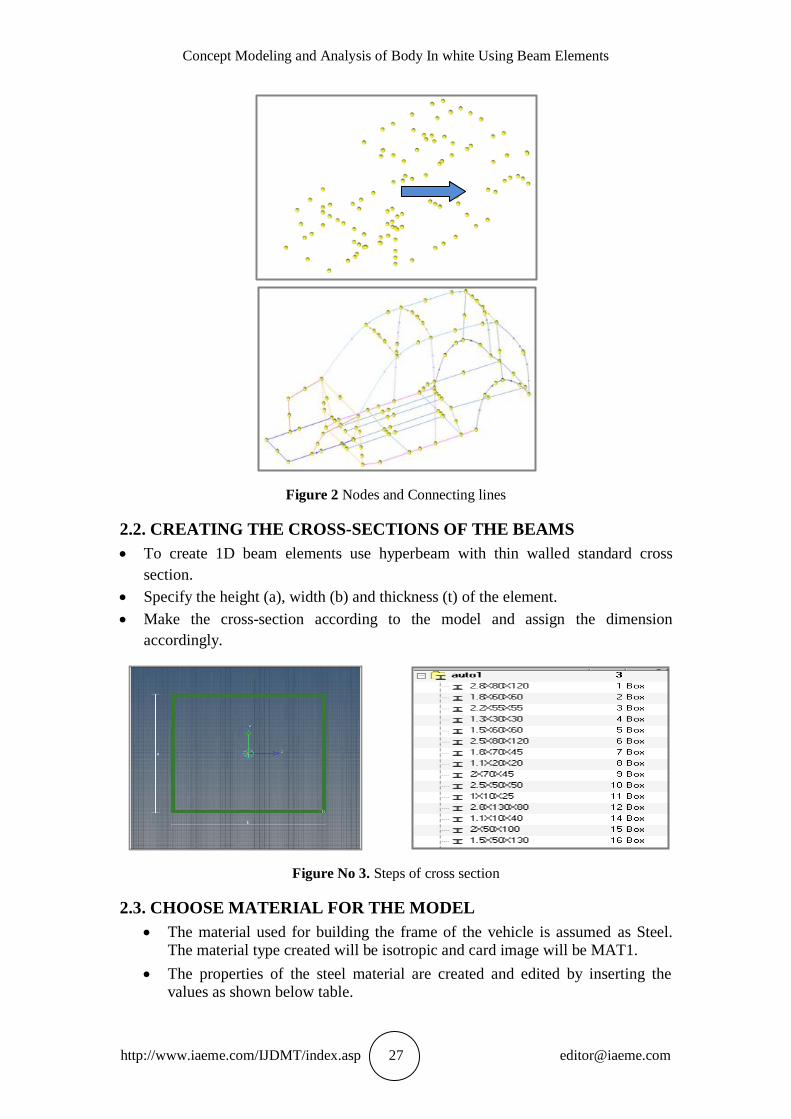
Figure 2 Nodes and Connecting lines
2.2. CREATING THE CROSS-SECTIONS OF THE BEAMS
To create 1D beam elements use hyperbeam with thin walled standard cross
section.
Specify the height (a), width (b) and thickness (t) of the element.
Make the cross-section according to the model and assign the dimension
accordingly.
Figure No 3. Steps of cross section
2.3. CHOOSE MATERIAL FOR THE MODEL
The material used for building the frame of the vehicle is assumed as Steel. The material type created will be isotropic and card image will be MAT1.
The properties of the steel material are created and edited by inserting the values as shown below table.

Praveen Padagannavar and Manohara Bheemanna
http://www.iaeme.com/IJDMT/index.asp 28 [email protected]
Table No 2 Material property selected for the model
2.4. CREATING PROPERTIES
The properties of the component are created by assigning the material, type of the element, colour, card image, and cross section for the required body part.
The element type of beam members '1D' and card image is 'PBEAM'.
For cavity use 'AIR' as the element and use 3D FLUID.
For shell members use the element type as '2D' and card image as 'PSHELL'.
2.5. CREATING COMPONENTS
Create the components which are required for the modelling. Likewise front impact bumper, A-pillar, B-pillar, Floor panel, Front quarter panel, Rear beam
and wheel flap.
After creating the components, each property is assigned to a component of individual parts.
The card image is assigned from the property that is selected from the list.
Figure No 4 List of the properties for this model
2.6. CREATING MESH
Using line mesh, lines are meshed by assigning the corresponding hyperbeams. The element configuration selected is bar2, because it helps in
determining bending or torsional movements between any two nodes.
All parallel lines are meshed in auto mesh mode. All vertical lines, inclined lines and smooth lines are meshed by vector mesh with x-axis as the reference.
This is because the system cannot identify the direction by itself.
Meshing the model will divide the components into small elements which optimizes the model results.
STEEL
Young’s modulus, E 2.1e+08
Poissons ratio, Nu 0.3
Density, RhO 7.8e-6
GE 0.01
Concept Modeling and Analysis of Body In white Using Beam Elements
http://www.iaeme.com/IJDMT/index.asp 29 [email protected]
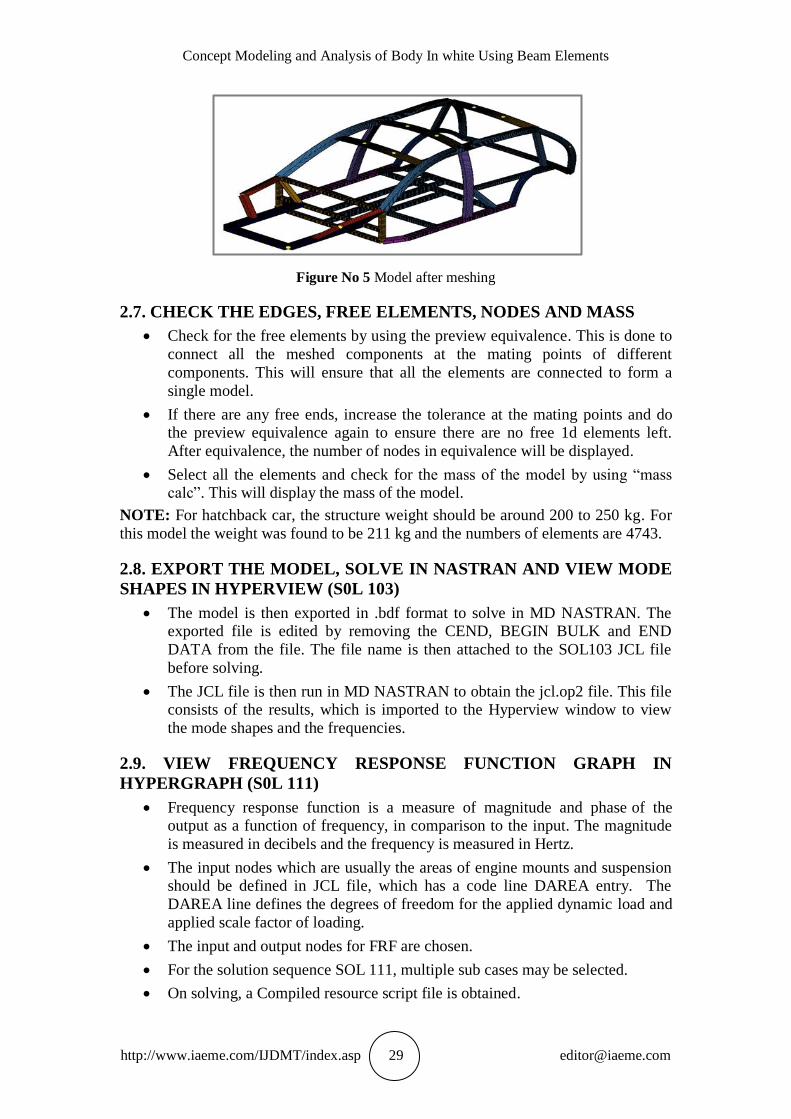
Figure No 5 Model after meshing
2.7. CHECK THE EDGES, FREE ELEMENTS, NODES AND MASS
Check for the free elements by using the preview equivalence. This is done to
connect all the meshed components at the mating points of different
components. This will ensure that all the elements are connected to form a
single model.
If there are any free ends, increase the tolerance at the mating points and do the preview equivalence again to ensure there are no free 1d elements left.
After equivalence, the number of nodes in equivalence will be displayed.
Select all the elements and check for the mass of the model by using “mass calc”. This will display the mass of the model.
NOTE: For hatchback car, the structure weight should be around 200 to 250 kg. For
this model the weight was found to be 211 kg and the numbers of elements are 4743.
2.8. EXPORT THE MODEL, SOLVE IN NASTRAN AND VIEW MODE
SHAPES IN HYPERVIEW (S0L 103)
The model is then exported in .bdf format to solve in MD NASTRAN. The exported file is edited by removing the CEND, BEGIN BULK and END
DATA from the file. The file name is then attached to the SOL103 JCL file
before solving.
The JCL file is then run in MD NASTRAN to obtain the jcl.op2 file. This file consists of the results, which is imported to the Hyperview window to view
the mode shapes and the frequencies.
2.9. VIEW FREQUENCY RESPONSE FUNCTION GRAPH IN
HYPERGRAPH (S0L 111)
Frequency response function is a measure of magnitude and phase of the output as a function of frequency, in comparison to the input. The magnitude
is measured in decibels and the frequency is measured in Hertz.
The input nodes which are usually the areas of engine mounts and suspension should be defined in JCL file, which has a code line DAREA entry. The
DAREA line defines the degrees of freedom for the applied dynamic load and
applied scale factor of loading.
The input and output nodes for FRF are chosen.
For the solution sequence SOL 111, multiple sub cases may be selected.
On solving, a Compiled resource script file is obtained.

Praveen Padagannavar and Manohara Bheemanna
http://www.iaeme.com/IJDMT/index.asp 30 [email protected]
The .res file is imported in Hypergraph to plot the graph of acceleration of all the output nodes in Mag Z direction.
3. RESULTS OF THE MODEL
3.1. MODE SHAPES OF THE MODEL -- SOL 103
SOL 103: It is a solution sequence used to execute normal modal analysis
and natural frequency calculation.
The SOL 103 statement is used in the JCL file for the analysis of the mode
frequencies of car structure. In JCL file the EIGRL value is defined as 200 to attain a
larger frequency range. The EIGRL entry defines the method and selects the
parameters that control the Eigen values which are the number of modes.
The first six modes are not considered as the values are below zero and they are
rigid modes. Which means no movement of the car body can be observed. From
mode 7 to mode 12, proper mode shapes are observed which consists of bending and
torsion.
Mode #7
Mode #10 Mode #9
Mode #8

Concept Modeling and Analysis of Body In white Using Beam Elements
http://www.iaeme.com/IJDMT/index.asp 31 [email protected]
Figure No 6 Mode shapes
3.2 RESULTS OF FREQUENCY RESPONSE FUNCTION OF THE
MODEL-- SOL 111
SOL 111: It is a solution sequence used to solve modal frequency response
problems like vehicle noise, rocket launch and earthquake analysis.
SOL111 is used to obtain the frequency response function and the analysis of In-
phase, Out-phase and Single node frequencies of selected nodes on structure of the
car. Its main purpose is to confirm with the resonant frequencies obtained using
SOL103 are bending, torsional or lateral. The input nodes are on front impact bumper
and output nodes are on base column. In this model the nodes used to obtain the
Frequency Response Function is shown in the below figures.
Figure No 7. Input and Output nodes
Single-node Excitation: The peaks of the graph show the excitation at the output
nodes. The peaks are the resultant of torsion & bending moments that have reflected
from the model. The peak of the graphs shows both the bending and torsional moment
at the output nodes in the form of Frequency Response Function.
Mode #12 Mode #11

Praveen Padagannavar and Manohara Bheemanna
http://www.iaeme.com/IJDMT/index.asp 32 [email protected]
SINGLE NODE EXCITATION
Figure No 8. Single node FRF graph (linear and db 20)
NOTE: For single node, the input node is 25584 and the output nodes are 25479,
25905, 27615, and 27796.
In-phase Excitation: In order to obtain the results for bending resonant frequencies
we need to do in-phase excitation and for this both input nodes are given in same
direction. The peak of the graphs shows the bending moment at the output nodes in
the form of Frequency Response Function.
INPHASE
Figure No 9. In-phase FRF graph (linear and db20)
NOTE: For in phase, the input node is 25584 and 25479 and the output nodes are
25905, 27615, 27796.
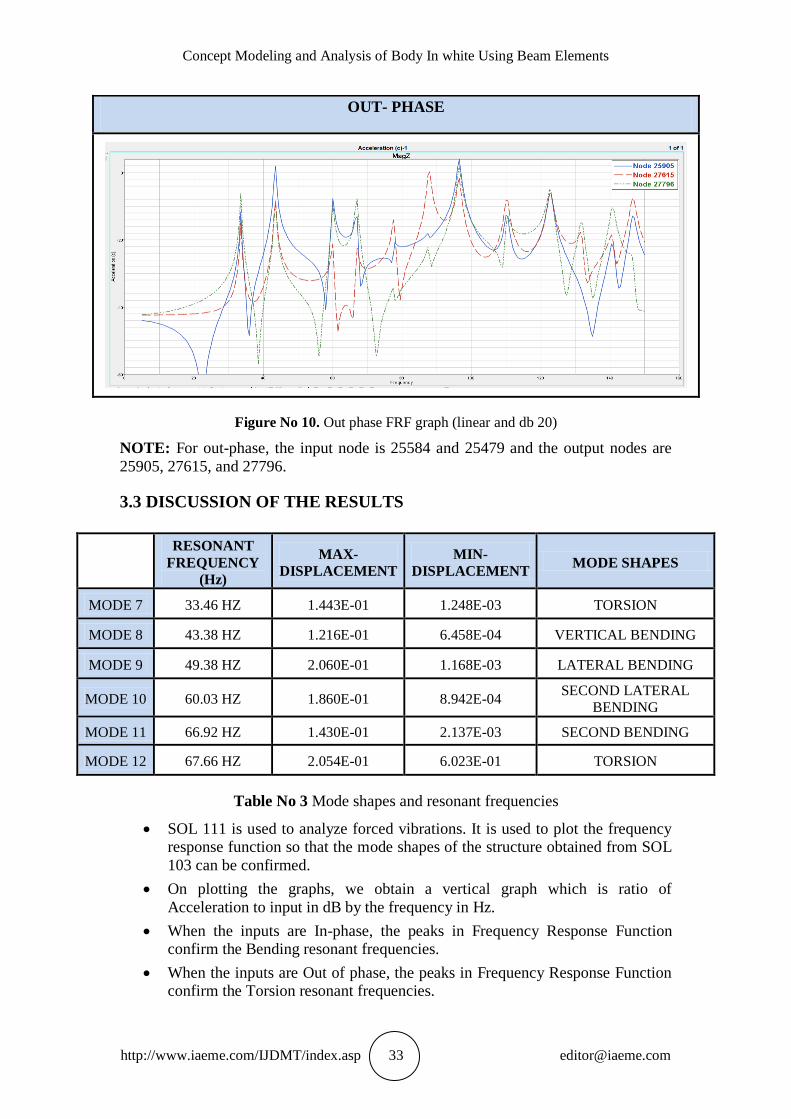
Out-phase Excitation: The Frequency Response Function (FRF) for the torsion
moment is obtained by making the excitation on the input nodes in opposite
directions. The peak of the graphs shows the torsional bending moment at the output
nodes in the form of Frequency Response Function.
Concept Modeling and Analysis of Body In white Using Beam Elements
http://www.iaeme.com/IJDMT/index.asp 33 [email protected]
OUT- PHASE
Figure No 10. Out phase FRF graph (linear and db 20)
NOTE: For out-phase, the input node is 25584 and 25479 and the output nodes are
25905, 27615, and 27796.
3.3 DISCUSSION OF THE RESULTS
RESONANT
FREQUENCY
(Hz)
MAX-
DISPLACEMENT
MIN-
DISPLACEMENT MODE SHAPES
MODE 7 33.46 HZ 1.443E-01 1.248E-03 TORSION
MODE 8 43.38 HZ 1.216E-01 6.458E-04 VERTICAL BENDING
MODE 9 49.38 HZ 2.060E-01 1.168E-03 LATERAL BENDING
MODE 10 60.03 HZ 1.860E-01 8.942E-04 SECOND LATERAL
BENDING
MODE 11 66.92 HZ 1.430E-01 2.137E-03 SECOND BENDING
MODE 12 67.66 HZ 2.054E-01 6.023E-01 TORSION
Table No 3 Mode shapes and resonant frequencies
SOL 111 is used to analyze forced vibrations. It is used to plot the frequency response function so that the mode shapes of the structure obtained from SOL
103 can be confirmed.
On plotting the graphs, we obtain a vertical graph which is ratio of
Acceleration to input in dB by the frequency in Hz.
When the inputs are In-phase, the peaks in Frequency Response Function confirm the Bending resonant frequencies.
When the inputs are Out of phase, the peaks in Frequency Response Function confirm the Torsion resonant frequencies.
Praveen Padagannavar and Manohara Bheemanna
http://www.iaeme.com/IJDMT/index.asp 34 [email protected]
When the input is at a single node, the peaks in Frequency Response Function have both bending and torsion resonant frequencies.
When the input and output are at the same node, Inertance is noticed.
4. CAVITY MODELLING
The main aim of the cavity modeling is to analyze the resonant frequencies of the
interior cavity and make adjustments to the panels so that cabin noise can be
minimum or reduced.
Steps for creating cavity model:
Nodes are selected for the car cavity.
Create material and property card.
Create solid mesh and update the component to ensure that the property is
assigned properly.
Ensure all the fluid grid points are CD-1 and export the model.
To determine the fluid elements, we need to select the MAT10 property and specify the Bulk modulus and speed of sound.
Nastran can be used to perform a fully coupled fluid-structure analysis. The
interface between the fluid and structure can be modeled such that the grid
points of fluid and structure are coincident.
Finally, run the JCI file in the Nastran software and open the ‘.op2’ file in hyperview to visualize the modes.
The equation for cavity resonant is:
F=Sound speed/(interior length*2)
f=340/(interior length*2)
where,
speed of sound=340m/s
interior length=2.5 m
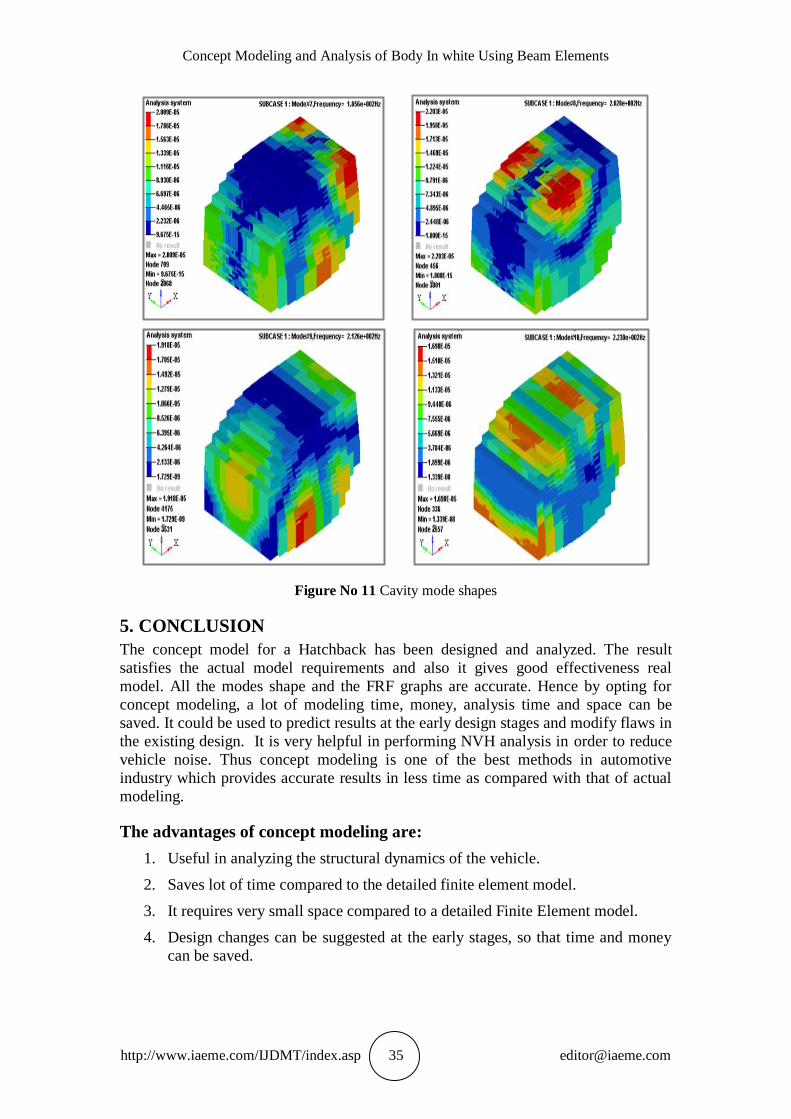
4.1 RESULTS OF CAVITY MODELING
The cavity represents the interior model of the vehicle. Using Nastran Solvent
(SOL103) various resonance frequencies and its mode shapes of the given model is
determined. The mode shapes represents the pressure difference that the cavity
experiences for different frequencies. Air is used as Fluid in the cavity, it becomes
necessary to increase the deformation points to higher values so that modes shape at
various resonance frequencies are determined. The cavity model is simulated and
observed as shown below.
Concept Modeling and Analysis of Body In white Using Beam Elements
http://www.iaeme.com/IJDMT/index.asp 35 [email protected]
Figure No 11 Cavity mode shapes
5. CONCLUSION
The concept model for a Hatchback has been designed and analyzed. The result
satisfies the actual model requirements and also it gives good effectiveness real
model. All the modes shape and the FRF graphs are accurate. Hence by opting for
concept modeling, a lot of modeling time, money, analysis time and space can be
saved. It could be used to predict results at the early design stages and modify flaws in
the existing design. It is very helpful in performing NVH analysis in order to reduce
vehicle noise. Thus concept modeling is one of the best methods in automotive
industry which provides accurate results in less time as compared with that of actual
modeling.
The advantages of concept modeling are:
1. Useful in analyzing the structural dynamics of the vehicle.
2. Saves lot of time compared to the detailed finite element model.
3. It requires very small space compared to a detailed Finite Element model.
4. Design changes can be suggested at the early stages, so that time and money
can be saved.

Praveen Padagannavar and Manohara Bheemanna
http://www.iaeme.com/IJDMT/index.asp 36 [email protected]
REFERENCES
[1] Robinson (2010), Conceptual modeling [online]. Available at:
http://www.scs.org/magazines/2010-04/index_file/Files/Robinson.pdf.
[2] http://en.wikipedia.org/wiki/Bending
[3] Dr.Thota, J., n.d. Lecture 5: Altair: Material Model and Units.
[4] Robinson, S., 2010. Conceptual Modelling: Who Needs It?. SCS M&S
Magazine.
[5] Cartype.com, (2015). Car Line Art | Car type. [online] Available at:
http://cartype.com/pages/4507/car_line_art [Accessed 21 Oct. 2015].
[6] Bhavik M.Patel, Ashish J. Modi and Prof. (Dr.) Pravin P. Rathod, Analysis
of Engine Cooling Waterpump of Car & Significance of Its Geometry.
International Journal of Design and Manufacturing Technology 4(3), 2014,
pp. 100–107.
[7] Autoraan.com, (2012). The new Volkswagen Golf – „Das Auto” is now
VW Golf 7 | AUTOraan.com. [online] Available at:
http://www.autoraan.com/the-new-volkswagen-golf-das-auto-is-now-vw-
golf-7/ [Accessed 21 Oct. 2015].