concept testing teaching materials to accompany: product design and development chapter 8 karl t....
TRANSCRIPT

Concept Testing
Teaching materials to accompany:
Product Design and DevelopmentChapter 8
Karl T. Ulrich and Steven D. Eppinger2nd Edition, Irwin McGraw-Hill, 2000.

Product Design and DevelopmentKarl T. Ulrich and Steven D. Eppinger2nd edition, Irwin McGraw-Hill, 2000.
Chapter Table of Contents
1. Introduction2. Development Processes and Organizations3. Product Planning4. Identifying Customer Needs5. Product Specifications6. Concept Generation7. Concept Selection8. Concept Testing9. Product Architecture10. Industrial Design11. Design for Manufacturing12. Prototyping13. Product Development Economics 14. Managing Projects

PlanningPlanning
Product Development Process
ConceptDevelopment
ConceptDevelopment
System-LevelDesign
System-LevelDesign
DetailDesign
DetailDesign
Testing andRefinement
Testing andRefinement
ProductionRamp-Up
ProductionRamp-Up
QualitativeConceptTesting
QuantitativeConceptTesting

Concept Development Process
Perform Economic Analysis
Benchmark Competitive Products
Build and Test Models and Prototypes
IdentifyCustomer
Needs
EstablishTarget
Specifications
GenerateProduct
Concepts
SelectProduct
Concept(s)
Set Final
Specifications
PlanDownstreamDevelopment
MissionStatement Test
ProductConcept(s)
DevelopmentPlan

Concept Testing is Used for Several Purposes
• Go/no-go decisions• What market to be in?• Selecting among alternative concepts• Confirming concept selection decision• Benchmarking• Soliciting improvement ideas• Forecasting demand• Ready to launch?

Concept Testing Process
• Define the purpose of the test
• Choose a survey population
• Choose a survey format
• Communicate the concept
• Measure customer response
• Interpret the results
• Reflect on the results and the process

Concept Testing Example:emPower Electric Scooter
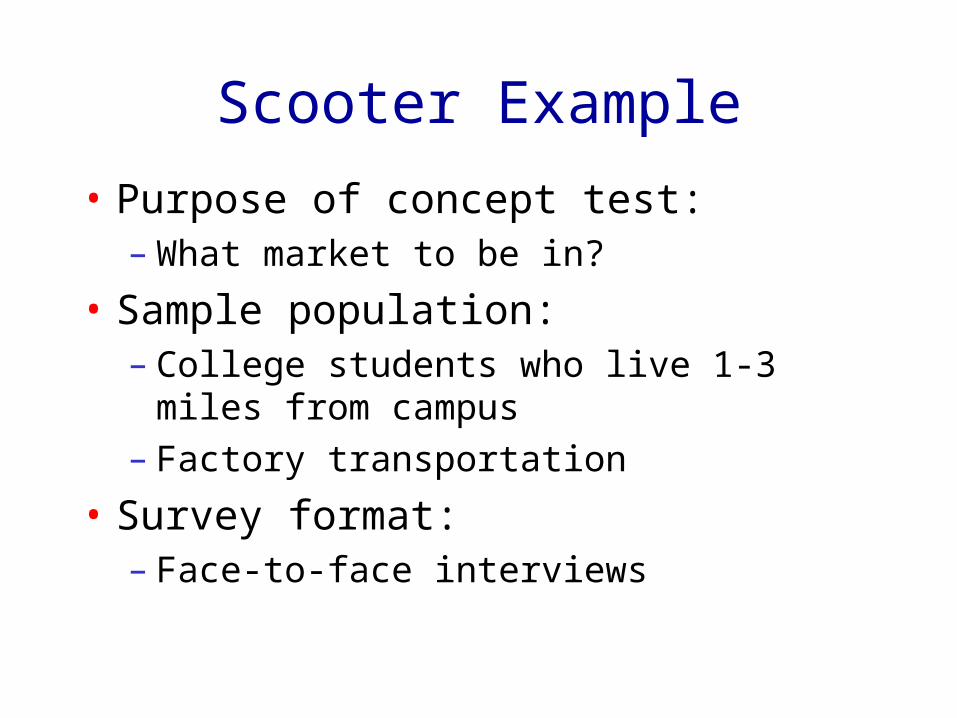
Scooter Example
• Purpose of concept test:– What market to be in?
• Sample population: – College students who live 1-3 miles from
campus– Factory transportation
• Survey format:– Face-to-face interviews

Communicating the Concept• Verbal description• Sketch• Photograph or rendering• Storyboard• Video• Simulation• Interactive multimedia• Physical appearance model• Working prototype

Verbal Description
• The product is a lightweight electric scooter that can be easily folded and taken with you inside a building or on public transportation.
• The scooter weighs about 25 pounds. It travels at speeds of up to 15 miles per hour and can go about 12 miles on a single charge.
• The scooter can be recharged in about two hours from a standard electric outlet.
• The scooter is easy to ride and has simple controls — just an accelerator button and a brake.

Sketch

Rendering

Storyboard

3D Solid CAD Model

Appearance Model
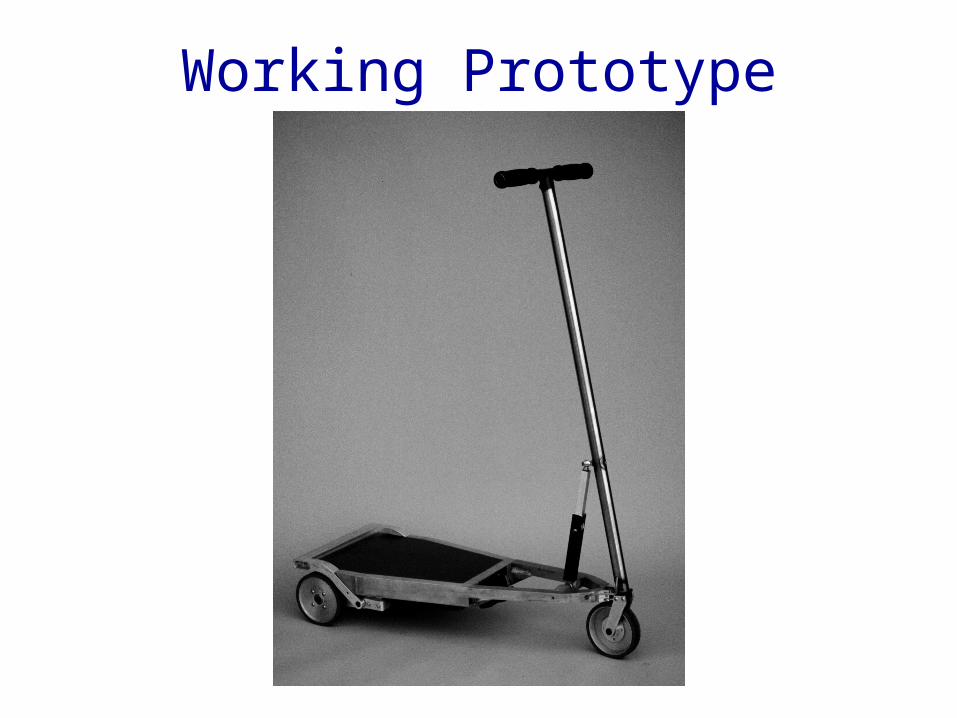
Working Prototype

Beta Prototype

VideoAnimation
Interactive MultimediaLive Demonstration

Survey Format
• PART 1, Qualification– How far do you live from campus?
• <If not 1-3 miles, thank the customer and end interview.>
– How do you currently get to campus from home?– How do you currently get around campus?
• PART 2, Product Description
– <Present the concept description.>

Survey Format
• PART 3, Purchase Intent– If the product were priced according to your
expectations, how likely would you be to purchase the scooter within the next year?
I would definitely not
purchase the scooter.
I might or might not purchase the scooter.
I would definitely purchase the scooter.
I would probably not
purchasethe scooter.
I would probably purchase the scooter.
“top box”“second box”
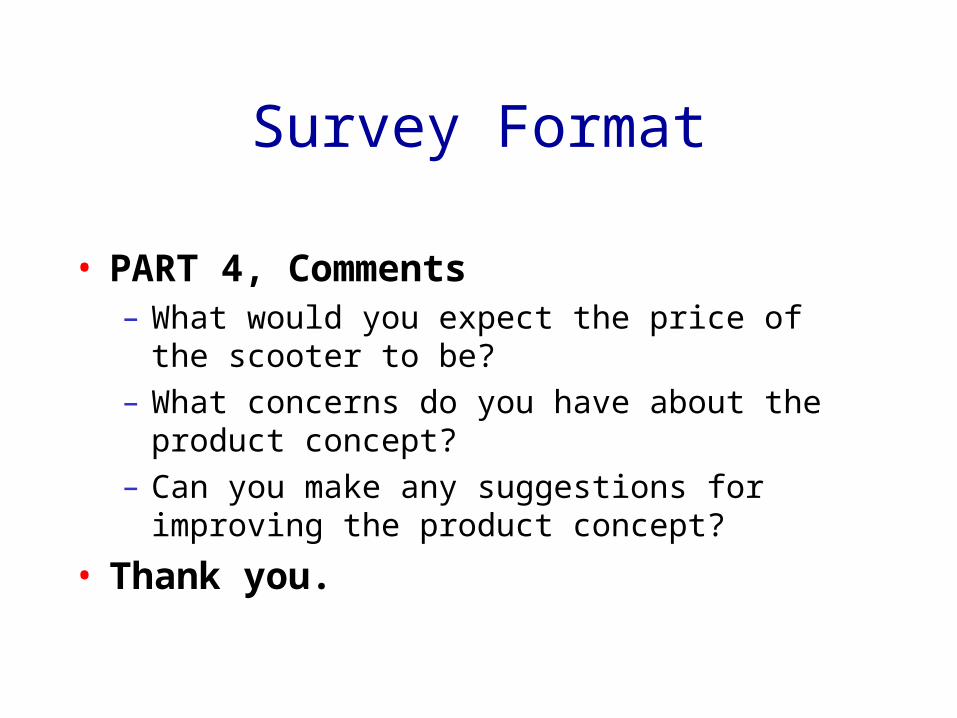
Survey Format
• PART 4, Comments– What would you expect the price of the scooter to
be?– What concerns do you have about the product
concept?– Can you make any suggestions for improving the
product concept?
• Thank you.

Interpreting the Results:Forecasting Sales
Q = N x A x P• Q = sales (annual)• N = number of (annual) purchases• A = awareness x availability (fractions)• P = probability of purchase (surveyed)
= Cdef x Fdef + Cprob x Fprob
“second box”“top box”

Forecasting Example:College Student Market
• N = off-campus grad students (200,000)• A = 0.2 (realistic) to 0.8 (every bike shop)• P = 0.4 x top-box + 0.2 x second-box• Q =• Price point $795

Forecasting Example:Factory Transport Market
• N = current bicycle and scooter sales to factories (150,000)
• A = 0.25 (single distributor’s share)• P = 0.4 x top-box + 0.2 x second-box• Q = 150,000 x 0.25 x [0.4 x 0.3 + 0.2 x 0.2]
= 6000 units/yr• Price point $1500

emPower’s Market Decision: Factory Transportation

Production Product

Sources of Forecast Error
• Word-of-Mouth Effects
• Quality of Concept Description
• Pricing
• Level of Promotion
• Competition

Discussion• Why do respondents typically overestimate
purchase intent?– Might they ever underestimate intent?
• How to use price in surveys?• How much does the way the concept is
communicated matter?– When shouldn’t a prototype model be shown?
• How do you increase sales, Q?• How does early (qualitative) concept testing differ
from later (quantitative) testing?