conceptions of geographic information systems (gis) held by … · 2010-06-09 · how gis manages...
TRANSCRIPT

Conceptions of geographic information systems (GIS)
held by Senior Geography students in
Queensland.
A thesis
submitted in fulfilment of the requirements for the degree of
Doctor of Philosophy
by
Bryan Andrew West
BSc (ANU), DipEd (UQ)
Faculty of Education
School of Cultural and Language Studies in Education
Queensland University of Technology
2008
ii
ABSTRACT
Geographical Information Systems (GIS) represent one of the major
contributions to spatial analysis and planning of the new technologies. While
teachers and others have viewed its potential contribution to geographical
education as considerable, it has not been known with any certainty whether they
present a valuable educational tool that aids geographical education. The value
of GIS to geographical education is viewed as depending on a geographical
education being, in itself, valuable.
Within this context, synergetic focus groups are employed to explore the
conceptions of GIS held by 109 secondary school students studying Senior
Geography in metropolitan and regional Queensland, Australia. A
phenomenographic approach is adopted to identify the six qualitatively different
ways, or conceptions, in which the participating students experience GIS as:
1. Maps and a source of maps in geography.
2. Mapping in geography: a way to use and create maps.
3. A professional mapping tool: exceeding the needs of senior
geography.
4. Frustrating geography: irksome and presenting many challenges
to the student-user.
5. Relevant geography: within and beyond the school experience.
6. A better geography: offering a superior curriculum, and broader
geographical education, when contrasted to a senior geography
that omits its use.
The structural and referential elements of each of these conceptions are
elucidated within corresponding Categories of Description. The qualitatively
different ways in which the conceptions may be experienced are illustrated
through an Outcome Space, comprising a metaphoric island landscape. This
structural framework reveals that for the Senior Geography students who
participated in this investigation, the extent to which GIS may augment the
iii
curriculum is influenced by the nature of students’ individual understandings of
how GIS manages spatial data.
This research project is a response to repeated calls in the literature for teachers
of geography themselves to become researchers and for a better understanding of
GIS within geography education. It reviews the salient literature with respect to
geography and geography education generally, and GIS within geographical
education specifically. The investigation has confirmed that qualitatively
different conceptions of GIS exist amongst students and that these are not
consistently aligned with assumptions about its use and benefits as presented by
current literature.
The findings of the study contribute to knowledge of the potential educational
outcomes associated with the use of GIS in geography education and decisions
related to current and potential geography curricula. It provides guidance for
future curriculum development involving GIS and argues for additional research
to inform educators and the spatial sciences industry about the actual and
perceived role of GIS within geography education.

iv
KEYWORDS
conceptions of GIS, geographical information systems, GIS, geography
education, information and communications technologies, maps and mapping,
phenomenography, senior geography, students, teaching and learning,
qualitative research methods

v
TABLE OF CONTENTS
Abstract ...............................................................................................................ii
Keywords ........................................................................................................... iv
Table of Contents.................................................................................................v
List of Tables...................................................................................................... ix
List of Figures.....................................................................................................xi
List of Abbreviations ..........................................................................................xi
Acknowledgements & Dedication.....................................................................xiii
Publications Arising From This Research..........................................................xiv
CHAPTER ONE - THE NATURE OF THE STUDY ....................... 1
BACKGROUND TO THE ISSUE............................................................................1
Preamble......................................................................................................1
The Role of a Geographical Education.........................................................3
GEOGRAPHIC INFORMATION SYSTEMS ...........................................................5
ORIGIN OF THE STUDY: PERSONAL EXPERIENCE ...........................................8
RATIONALE FOR THE CURRENT STUDY .........................................................11
Theoretical Imperative ...............................................................................11
Personal Imperative ...................................................................................15
DEFICIENCIES IN CURRENT RESEARCH .........................................................16
CENTRAL PHENOMENON AND RESEARCH QUESTIONS ..................................19
STUDY DESIGN...............................................................................................19
Methodology ..............................................................................................19
The Role of Phenomenography in Educational Research............................21
Sampling and Data Collection....................................................................22
STRUCTURE OF THE THESIS...........................................................................22
CHAPTER TWO - REVIEW OF LITERATURE ............................ 24
INTRODUCTION..............................................................................................24
THE NATURE OF GEOGRAPHY EDUCATION ...................................................27
Geography Described ................................................................................27

vi
Geography: Its Multidisciplinarity and Interconnectedness........................31
Geography and its Skills.............................................................................35
Geography and Problem Solving................................................................45
Geography’s Role in the World; Citizenship and Participation ..................49
Geography: a Misunderstood Subject.........................................................53
TEACHING GEOGRAPHY: METHODS, MOTIVATION AND FIELDWORK............59
GEOGRAPHIC INFORMATION SYSTEMS .........................................................66
GIS: What it is and isn’t .............................................................................66
GIS in Education........................................................................................69
GIS and Student Learning ..........................................................................72
Issues Affecting GIS Use ............................................................................85
QUESTIONS ARISING FROM THE LITERATURE ...............................................96
CENTRAL PHENOMENON AND RESEARCH QUESTIONS ..................................98
CHAPTER THREE - INVESTIGATIVE FRAMEWORK............. 100
OVERVIEW OF THE CHAPTER ...................................................................... 100
SUMMARY OF METHODOLOGY..................................................................... 100
Epistemology............................................................................................ 100
Phenomenography: A Research Specialisation......................................... 104
SUMMARY OF METHOD ............................................................................... 109
Understanding the Context: Conversations with Teachers........................ 109
Data Collecting: Conducting Interviews................................................... 110
The Role of the Interviewer and Implementation of the Synergetic Focus
Groups ..................................................................................................... 113
Analysis: Finding and Describing Categories of Description ................... 116
TRUSTWORTHINESS OF RESEARCH OUTCOMES .......................................... 121
ETHICAL CONSIDERATIONS......................................................................... 124
SELECTING THE PARTICIPANTS FOR THE STUDY ......................................... 125
The Schools and their Characteristics ...................................................... 127
The Participants and their Characteristics ............................................... 136
CHAPTER SUMMARY ................................................................................... 140
CHAPTER FOUR - CONCEPTIONS OF GIS REVEALED ......... 142
INTRODUCTION............................................................................................ 142

vii
THE CATEGORIES OF DESCRIPTION ............................................................ 142
GIS as Maps and a Source of Maps in Geography.................................... 144
GIS as Mapping in Geography . ............................................................... 149
GIS as a Professional Mapping Tool . ...................................................... 153
GIS as Frustrating Geography. ................................................................ 160
GIS as Relevant Geography. .................................................................... 174
GIS as a Better Geography....................................................................... 183
SUMMARY.................................................................................................... 192
DESCRIPTION OF THE OUTCOME SPACE...................................................... 195
The Chosen Metaphor .............................................................................. 196
The Overall Visual Schema of the Outcome Space.................................... 206
Deconstructing the Mapped Island Landscape ......................................... 206
Extending the Metaphor ........................................................................... 213
CHAPTER SUMMARY ................................................................................... 216
CHAPTER FIVE - DISCUSSION.................................................. 217
INTRODUCTION............................................................................................ 217
RESEARCH OUTCOMES................................................................................ 218
The Nature of Geography......................................................................... 220
Geography and Problem Solving.............................................................. 226
Geography's Role in the World: Citizenship and Participation................. 229
Geography: a Misunderstood Subject....................................................... 230
Teaching Geography: Methods, Motivation and Fieldwork ...................... 232
GIS and Student Learning ........................................................................ 235
Issues Affecting the Use of GIS................................................................. 243
STRENGTHS OF THE RESEARCH ................................................................... 247
LIMITATIONS OF THE RESEARCH ................................................................ 248
DIRECTIONS FOR FUTURE RESEARCH ......................................................... 250
CONCLUSION ............................................................................................... 251
APPENDIX A ............................................................................................. 255
APPENDIX B ............................................................................................. 256
APPENDIX C ............................................................................................. 256
APPENDIX D ............................................................................................. 259
APPENDIX E ............................................................................................. 261

viii
APPENDIX F ............................................................................................. 263
APPENDIX G ............................................................................................. 265
APPENDIX H ............................................................................................. 266
REFERENCES............................................................................... 267

ix
LIST OF TABLES
Table 1 Themes, Topics and Scales of Study prescribed by the 1999
Queensland Senior Geography Syllabus...........................................34
Table 2 Assessment criteria associated with Queensland Senior Geography
syllabus ...........................................................................................36
Table 3 Visual images of the Queensland Senior Geography Syllabus,
classified according to Catling’s (2003) nomenclature. ....................39
Table 4 Queensland Year 12 student enrolment data, 1993-2003. .................57
Table 5 Comparison of the system requirements of ArcView GIS .................68
Table 6 Sample GIS activities undertaken in Australian secondary schools. .71
Table 7 The relationship between ArcView GIS, Bloom’s taxonomy and the
geographical route of inquiry ...........................................................78
Table 8 Difference between quantitative and qualitative approaches to
research ......................................................................................... 102
Table 9 Nine steps involved in conducting interviews ............................... 115
Table 10 Mitigation of ethical issues common to research. ........................... 126
Table 11 The location of GIS within School A Senior Geography curricula.. 129
Table 12 The location of GIS within School B Senior Geography curricula.. 132
Table 13 The location of GIS within School D Senior Geography curricula.. 135
Table 14 Characteristics of School A participants......................................... 137
Table 15 Characteristics of School B participants. ........................................ 138
Table 16 Characteristics of School C participants. ........................................ 139
Table 17 Characteristics of School D participants......................................... 139
Table 18 Summary of Categories of Description. ......................................... 193
Table 19 Relationship between categories of description and the Mapped
Island Landscape metaphor............................................................ 197
Table 20 Metaphoric and literal student experiences of Element One. .......... 200
Table 21 Metaphoric and literal student experiences of Element Two........... 203
Table 22 Metaphoric and literal student experiences of Element Three.. ....... 205

x
LIST OF FIGURES
Figure 1. Three foci of Chapter Two................................................................24
Figure 2. Seven elements of discussion about The Nature of Geography..........25
Figure 3. Elements of discussion about Geographical Information Systems. ....26
Figure 4. Defining geography. .........................................................................41
Figure 5 Key Geographic Ideas.......................................................................44
Figure 6. The major features of geography education about which GIS’ role
remains uncertain. ............................................................................96
Figure 7. Two approaches to research, and their emphases. ........................... 101
Figure 8. Quantitative versus qualitative approaches to research.................... 104
Figure 9. First and second order perspectives, as they relate to the investigation
of phenomena. ................................................................................ 105
Figure 10. The aim and objects of phenomenography ...................................... 107
Figure 11. The three elements included in each Category of Description. ......... 143
Figure 12. Salient elements of conception........................................................ 144
Figure 13. Salient elements of Conception One. .............................................. 149
Figure 14. Salient elements of Conception Two............................................... 149
Figure 15. Salient elements of Conception Three. ............................................ 154
Figure 16. Salient elements of Conception Four. .............................................. 161
Figure 17. Salient elements of Conception Five. .............................................. 175
Figure 18. Salient elements of Conception Six. ................................................ 183
Figure 19. Elements of an Outcome Space. ...................................................... 195
Figure 20. The three constituent elements of the outcome space....................... 198
Figure 21. Element One. .................................................................................. 199
Figure 22. Element Two................................................................................... 202
Figure 23. Element Three................................................................................. 204
Figure 24. The Outcome Space. ....................................................................... 207
xi
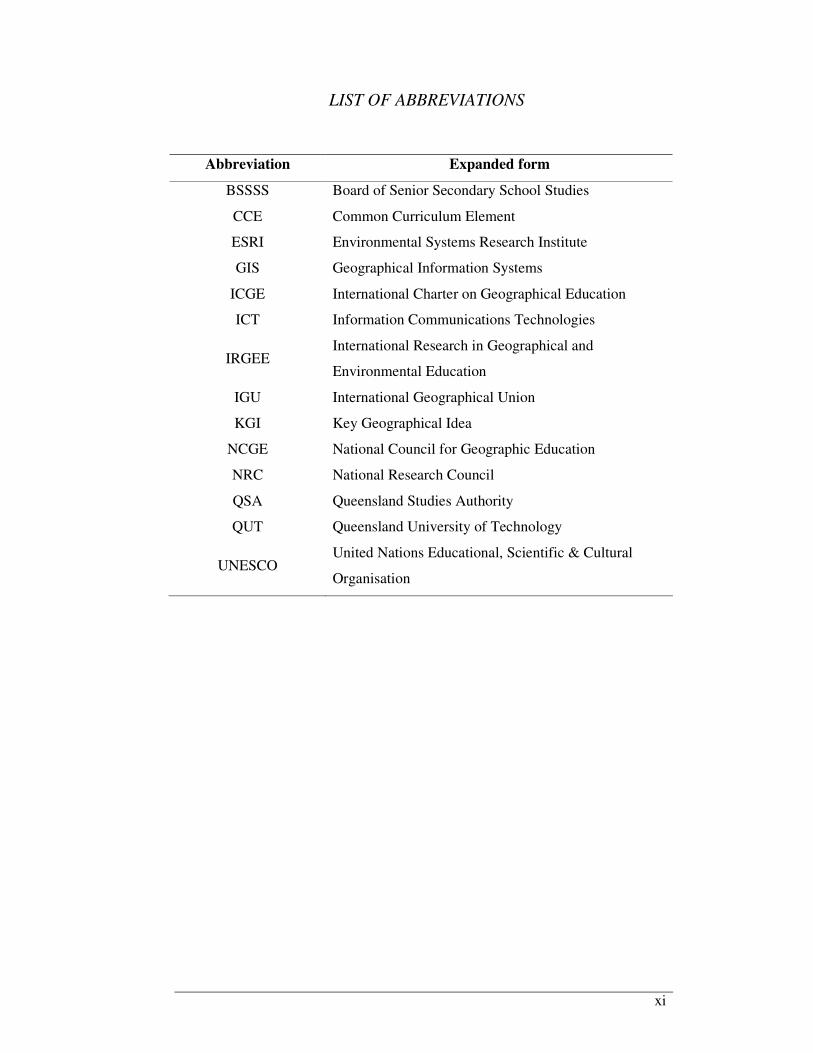
LIST OF ABBREVIATIONS
Abbreviation Expanded form
BSSSS Board of Senior Secondary School Studies
CCE Common Curriculum Element
ESRI Environmental Systems Research Institute
GIS Geographical Information Systems
ICGE International Charter on Geographical Education
ICT Information Communications Technologies
IRGEE International Research in Geographical and
Environmental Education
IGU International Geographical Union
KGI Key Geographical Idea
NCGE National Council for Geographic Education
NRC National Research Council
QSA Queensland Studies Authority
QUT Queensland University of Technology
UNESCO United Nations Educational, Scientific & Cultural
Organisation
xii
STATEMENT OF ORIGINAL AUTHORSHIP
The work contained in this thesis has not been previously submitted to meet requirements for an award at this or any other higher education institution. To the best of my knowledge and belief, the thesis contains no material previously published or written by another person except where due reference is made.
Signature:
Date:
January 31, 2008
xiii
ACKNOWLEDGEMENTS
Thanks are due to a number of people, without whom this thesis would have been neither conceived nor commenced, let alone completed. My supervisor, Associate Professor John Lidstone, has maintained a keen academic interest in my use of GIS in geography education since my first forays into secondary teaching. His keen academic interest has been more than amply matched by an interest that extends more personally. The constancy of John’s emphasis on me first as human and second as student enabled these four years of doctoral study to form a certain, if not curious, indulgence. More than a decade ago, Gina Palmer introduced me to the idea of using GIS in the geography classroom. In that time, she has been a constant source of encouragement and motivation. Her steadfast belief in me has, doubtlessly, precipitated the following pages. For their various roles, I thank Brad Ritchie, Bob Rogers, Neville Spears, Perry Molloy, Russell Smerdon, Deb Brownson, John Anderson, Paul Thomson, and the many other staff of the schools of my employ during the time of this study. Margie Carthew and Andrew Turier made things happen with a computer that I couldn’t, and would do so with a sense of humour when I wouldn’t. Naturally, the participating schools and students were essential to this project. The enthusiasm of key staff was particularly appreciated, as was their willingness to accommodate the incursion of my needs in their already full schedules. While it often seemed to be a lonely venture, no undertaking of this nature can occur in a vacuum. My family and friends, whose frequent inquiries as to my progress - and polite attempts at understanding and interest - offered a constant supply of motivation, confidence and humour. Special thanks go to Chris Gribble and Michael Gregory. Concurrent with this project have been the births of my two children. It is fair to say that I have learned more from being with Charlotte and Thomas in the sandpit than being with countless learned tomes in the library. But, it is my wife, Amy who has earned not just the greatest gratitude, but the greatest admiration, for without her there would be little purpose in much at all. Finally, this thesis is dedicated to ‘Nowhere’ (June 1997 – November 2006).

xiv
PUBLICATIONS ARISING FROM THIS RESEARCH
2006. Forum: Issues affecting the adoption of GIS within Australian and New
Zealand schools. International Research in Geographical and
Environmental Education, 15(3), 255-258.
2006. Conceptions of the "Role of Geography in the Future" held by
Queensland Senior Geography students. International Research in
Geographical and Environmental Education, 15(2), 104-123.
2006. Towards an understanding of the conceptions of GIS held by Senior
Geography students in Queensland. In Proceedings of a Conference on
Changes in Geographical Education: Past, Present & Future Symposium
(pp. 467-471). Brisbane, Qld, Australia: International Geographical
Union – Commission on Geographical Education.
2006. Conceptions of "productive classroom environment" held by middle
school students at one independent Queensland school. Australian
Journal of Middle Schooling, 6(3), 8-14.
2004. GIS goes to high school. Position Magazine, 13(October), 24-27.
2004. The contribution of a geographical education to regional sustainability.
Geographical Education, 17, 15-23.
2003. Conceptions of the 'Role of Geography in the Future' held by Year 12
Geography students. Geographical Education, 16, 26-32.
2003. Student Attitudes and the Impact of GIS on Thinking Skills and
Motivation. Journal of Geography, 102(6), 267-274.

1
CHAPTER ONE
INTRODUCTION: THE NATURE OF THE
STUDY
This is a call for geography and environmental educators to think critically
about the value of GIS (Bednarz 2004, p. 192).
Background to the issue
Preamble
The Queensland Senior Geography syllabus states that geography contributes to
the development of content, cognitive processes, skills and values that “help
students to better explore, understand and evaluate the social and environmental
dimensions of the world” (Queensland, 1999a, p. 2). More specifically, Standard
One of the US National Geography Standards stipulates that a geographically
informed person knows and understands “how to use maps and other
geographical representations, tools and technologies to acquire, process and
report information from a spatial perspective” (Geography Education Standards
Project, 1994). While it seems like a good idea, teaching these spatial skills is at
once the most difficult and, yet, arguably the most important aspect of a
geographical education (Oldakowski, 2001).
Since much of what is taught and the manner in which it is taught in geography
classrooms is motivated by each teacher’s perceptions of purposefulness (Salter,
1995), we need, as educators, to ensure that decisions regarding the geography
curriculum are based on correct assumptions. As yet, however, and despite
frequent assertions in professional literature, it is not known with any certainty
the extent to which increasingly commonly used technologies present valuable
educational tools that allow students to develop spatial skills.
Geographical Information Systems (GIS) represent one of the major
contributions of the new technologies to spatial analysis and planning. However,
while its impact on the nature of geography education in schools has been, as yet,

2
“negligible” (Dascombe, 2006; Kidman & Palmer, 2006; Wiegand, 2001, p. 68),
it is generally viewed as offering a positive contribution to both geography
students and the subject itself (Baker, 2005; Baker & Bednarz, 2003; Jenner,
2006; Kerski, 2001; Nellis, 1995; West, 1998a, 2003b). While issues of cost,
access, skill and time present obstacles for many teachers, the teachers
themselves view the technology as offering many more positives than negatives
to learning (Freeman, 2006; Kerski, 2001; Meaney, 2006; McInerney &
Shepherd, 2006; Smerdon, 2006).
Ten years ago, Murphy (1997) called for systematic research to evaluate the
contribution of computer-based instructional systems to student learning. In
2000, Shields & Behrman (2000) and Subrahmanyan, Krant, Greenfield and
Gross (2000) both highlighted the need for increased access to increasingly
sophisticated technologies to be matched with an increase in research to
determine whether this access has a demonstrably favourable influence on
learning experiences at school. More recently, and of specific relevance to the
current study, the editors of a 2003 special edition of Journal of Geography,
focusing on research in GIS in education, noted that the merits and barriers of
including GIS in the classroom had been frequently identified (Baker and
Bednarz, 2003). However, they also observed that despite the widespread
promotion of its use, GIS technologies remain peripheral to most geography
education. One reason, they claim, is the “paucity of research on its
effectiveness in promoting significant learning” (p. 232).
In response to this, the present study explores the nature of geography and the
possible role of a geographical education. It will then investigate the potential
role that GIS could play in a geographical education. Within this context,
discursive analysis of student conceptions of GIS will identify whether using GIS
in Queensland Senior Geography aids in students’ geographical education.

3
The Role of a Geographical Education
Three decades ago, Blachford (1971) asserted that “it is in the fullest
development of the mind that geography seems to have a place in the
curriculum” (p. 216). To justify the continued validity of such a statement
requires that the study of geography be shown to be worthwhile. In this regard,
Naish, Rawling and Hart (1987) more recently devised three criteria by which
the inclusion of any subject in the school curriculum could be justified:
1. it should be concerned with a body of knowledge of genuine significance;
2. it should be capable of developing students’ skills and capabilities; and,
3. it should open up opportunities for values education.
Research over the past century has shown that school geography can meet all
three criteria. Through the study of physical and cultural environments at a range
of scales, students are exposed to a diversity of knowledge. In Queensland’s
Senior Geography syllabus, for example, this knowledge extends beyond naming
places and describing physical phenomena to developing students’ conceptual
understandings of the relationships inherent in human-environment interaction.
Also, the value statements included in most Australian syllabuses suggest that the
final criterion of Naish et al. is an integral goal of school geography. For
example, the Queensland Senior Geography syllabus includes six educational
assumptions, the fourth of which declares that “[e]ducation for societies and
environments also entails affective aspects of human behaviour in which feelings
and values are prominent. They include feeling for and enjoyment of landscape
and the formation of values underpinning human and environmental justice” (p.
3). Assumption two also refers to the role of values in geographical education,
whereby “students already have a range of geographical skills and values simply
because of their daily experiences with people and environments. Geography
develops these understandings and abilities to enable students to fulfil their
potential as inhabitants of a finite world” (p. 2).

4
In these regards, to resolve issues arising from human-environment interactions,
students of geography are encouraged to analyse the values underlying the
various points of view contributing to the conflict. Hence, through studying real-
world issues, students can be exposed to the influence of attitudes and societal
power structures upon decision-making processes. Consequently, they may be
well positioned to acquire the skills necessary to consider the role of their
personal values and attitudes in shaping the world in which they live.
Beyond the three stated criteria, geography has further extended its value in the
school curriculum. As Naish et al. (1987) expound:
geography’s function in the curriculum [is] as a discipline which asks and
tries to answer questions specific to its own interests, but at the same time
provides the opportunity for the development of more general understanding
and capabilities.
In this regard, Geography is at once a social and a physical science. Through a
geographical investigation, students identify processes from many disciplines,
examine human impacts, and devise recommendations for the resolution of
issues. To this, Piper (1994, p. 346) adds that geography should
focus on [the] potential contribution to an education for social competence
and initiation into the life of the wider society, not in specialised knowledge
and initiation into an academic culture.
To foster skills in social competence, Macaulay (1994) asserts that students in
geography should be encouraged both to practise a wide range of skills and to
make “frequent use of higher-level thinking skills” (p. 23). As such, geographical
study provides a mechanism by which the individual may reason both in and with
geography (Gregg, 1997, original emphasis); generating other geographical
information, and providing spatial insight.
Assuming Piper’s assertion is credible, and effective investigation requires
student use of various skills and tools, it becomes incumbent upon geographers
5
to identify and apply those skills and tools that meet his inferred criteria. To this
end, Kam (1996) emphasises the importance of spatial patterns, spatial
interactions and spatial processes; concepts and skills which might be better
understood through interactive manipulation of spatially referenced data
(Laurence, Shaffer, Morrill & Fox, 1993).
Geographic Information Systems
One tool which may assist geography students to achieve the aims of their
chosen subject is that provided by geographic information systems (GIS).
Indeed, some would argue that “it is essential for students to have exposure to
good geography using current resources, ... and with easy access to integrated
technologies such as GIS” (Freeman, 2006, p. 187).
It is the domain of GIS to unite any spatial data that can be referenced by
geographical coordinates. In its purest form, GIS refers to the combination of
various forms of geographical data, such as aerial photographs, statistics and
maps. In recent years, however, GIS has become more synonymous with
computer technology. Although possessing different degrees of sophistication,
the various GIS software products perform essentially the same function:
encoding, management and manipulation of spatial data (Curran, 1985). Similar
definitions are proffered by ESRI (1991), Gerber (1995a), National Research
Council (2006), Pun-Cheng and Kwan (2001), and West (2003b).
GIS configure data to link place with meaning clearly. As with all maps, maps
developed using GIS are meaningless without their features being defined. For
example, in the ArcView GIS package, each discrete element of the map
constitutes an Attribute. Attributes are grouped to form Themes. Within this
GIS, the meaning of each attribute is linked with its spatial position through a
Table of Attributes, with one table for each Theme. A single attribute could be
part of many Themes, depending on the scale of the map and needs of the user.
Links through the table also allow each attribute to be connected with other data,
including, but not limited to, other tables of attributes, word-processed

6
documents, photographs, spreadsheets, graphs, videos, multimedia presentations
and websites.
For example, Longreach Police Station is an attribute. It could belong to the
Theme, Police Stations, on a map of Queensland. Its address, staffing allocation,
budgetary allocation, photograph and links to active case files could be included
in its Table of Attributes. Similarly, the same attribute could also be part of the
Theme, Government Buildings, on a map of Longreach town centre. In this
situation, it may have other information stored in its Table of Attributes, such as
address, garbage collection dates and date of last fire extinguisher inspection.
While much has been written about the application of GIS to resource
management and planning, and of the need to create professionals skilled in its
use (Baker, 1997a, 1997b; Skelly, 1996; West, 2004a), its role in geography
education is yet to be clarified.
Recent work regarding its use in schools has, however, suggested that it offers
some educational benefits. GIS may support increased intrinsic motivation and
higher level thinking processes. Such motivation may arise from student
involvement in tasks that: possess relevance to their immediate studies (Meaney,
2006); are more appropriate to their needs (Jenner, 2006); use contemporary
technologies (Baker, 2005); and, offer clear benefits beyond Senior Geography
and beyond school (Kidman & Palmer, 2006).
Higher order thinking is necessary if geographical study is to provide a
mechanism by which students may reason both in and with geography (Gregg et
al., 1997, original emphases). Unless “frequent use of higher level thinking
skills” occurs (Macaulay, 1994, p. 23), students will generate neither the
additional geographical information nor the spatial insight needed to manage
uncertainty and resolve contemporary geographical issues. For higher level
thinking to occur efficiently, the information being recalled must first have been
configured (West, 1998a, 1999). Configuration involves the prioritisation of
information and its subsequent placement into recognisable groupings. In
geography, this commonly involves clusters or sequences being derived by

7
attaching meaning to an object’s relative or absolute placement (Gregg et al.,
1997).
Gregg et al. (1997) further suggest that the way that information is taught
influences how that information becomes available. It is important to view the
teaching of thinking in terms of what is required to enable efficient higher level
thinking processes to occur. Heuristics are the generic cognitive strategies that
we use to interpret information. If efficient heuristics are needed to allow
successful evaluation and synthesis, then we are responsible for teaching the
skills necessary for this to occur (West, 1999). If efficient evaluation and
synthesis rely upon orderly configuration of data, then we should start there.
Because GIS configures information based upon its spatial characteristics, it
potentially models the thinking processes involved in geographical problem
solving; GIS exposes students to more efficient heuristics. Since the successful
use of GIS requires the use of these processes, it may be asserted that GIS users
are likely themselves to develop more efficient processes for reasoning in and
with geography (West, 1998a, 2003b).
Whilst such ideas may seem logical in theory, there exists an obligation for
educators to be aware of students’ attitudinal responses to various learning
experiences. Indeed, attitudinal surveys of students in Australia and USA have
failed to confirm categorically these assumptions (Baker & White, 2003; West,
2003b). While the results suggested statistically significant positive changes
following use of GIS, the breadth of impacts was minimal.
More generally, more than a decade ago Jones & Clarke (1994) highlighted that
simply providing secondary school students with access to computers does not
guarantee their participation. This is a sentiment that has been echoed more
recently by, amongst others, Baker and White (2003). Rather, it is essential for
educators to determine the extent to which information and communications
technologies (ICTs) offer more conceptually and cognitively relevant learning
experiences.
8
Accordingly, investigation of students’ conceptions of GIS is required. This is a
call made also by the editors of the recent Journal of Geography special edition
“Research on GIS in Education” (2003), who identified “the need for teachers to
have a clearer understanding of students’ cognitive processes, misconceptions
and ability to make meaning from learning experiences using GIS” (Baker &
Bednarz, 2003, p. 232). Specifically, the role of GIS in enhancing thinking in
and with geography may be investigated through phenomenographic analyses.
Mapping these conceptions will better define the likely educational outcomes
associated with using GIS. Given the considerable costs involved in introducing
and maintaining such technology in schools and the time that its use requires,
decisions regarding the nature and extent of the further integration of GIS into
curricula may be better informed.
Origin of the Study: Personal Experience
My first involvement with GIS was through analyses of remotely sensed
(satellite) data using the microBRIAN software as part of a subject that I was
undertaking as part of the Bachelor of Science degree in 1989. As with many
undergraduate courses at the time, limited access to the computer hardware
necessitated hour-long shifts in late night and early morning hours, booked
weeks in advance. Binary data were classified into layers, classes allocated and
maps generated. Accuracy was evaluated by the tedious process of ground-
truthing; checking that the class edges matched the actual boundaries evident in
the phenomena being mapped. These maps allowed greater confidence in
decisions about resource use, since they enabled visual representation of the
resources and related variables under various options. But it was tedious.
Eight years later, in 1997, I was charged with the introduction of ArcView GIS
software to Windaroo Valley State High School’s (WVSHS) Geography
program. This required a great many hours reminding myself of the conceptual
bases for encoding, managing and manipulating a range of spatially referenced
data. Further hours were spent ploughing through commercially and publicly
available data sets and creating smaller data sets suitable for in-class use.
9
Using GIS with students required the use of time that had been otherwise
allocated for the prescribed curriculum. Specifically, the then (Queensland)
Board of Senior Secondary School Studies (BSSSS) stipulated a minimum of 55
hours per semester for Senior Geography. The Work Program that WVSHS had
developed in order to be accredited by BSSSS to offer Senior Geography did not
allocate time to GIS. However, the school’s administration supported risk-
taking; would spending this time produce educational benefits at least equal to
those produced by not using it?
Competition with other departments for access to the necessary computer
resources was high. The network administrator needed to understand ArcView’s
data handling procedures in order to determine how best to network the software
and data to enable my learning objectives to be achieved. This required time.
Students had no experience of digitised GIS. A task that would take a reasonably
competent user one hour would take between four and six times as long with
students. Student level of engagement at any one time could vary between
highly occupied to using an Internet chat-room while waiting for me to get
through the long queue of other students’ technical questions.
However, repeated exposure of students reduced the instructional time required.
Tasks became possible that were not otherwise available in class; the amount of
data that could be analysed in the process of geographical inquiry greatly
exceeded that available in the form commonly used in class. Tasks afforded a
greater degree of relevance; students appeared to become more interested.
Anecdotal observations over the next few years suggested that students who had
used GIS were ‘better’ at thinking. These students seemed to be able to use
geographical information in such a way that they could generate plausible
conclusions more rapidly than those students who lacked this experience. These
experiences led me to question whether ArcView’s data handling and
manipulation procedures also served to model a way of thinking efficiently for
students.

10
Other teachers expressed interest. I presented a number of workshops and
seminars, and hosted many teacher visits to introduce others to my experiences
of using GIS. I believed that involving others would reduce the time and
resource burden on any one teacher; that, somehow, a critical mass could be
achieved, where schools would use GIS with as much ease as a word processor.
Since, 1997, I have spent many hundreds of hours planning and preparing GIS
based learning experiences for students. Many more have been involved in
sharing my experiences with others. The schools in which I have used GIS have
committed very considerable amounts of both physical and human resources to
supporting me in doing so.
However, whether using GIS is worth the effort for students is something that I
have until now yet to determine. With this in mind, I have prepared a number of
published manuscripts that discuss the potential impacts of GIS when used in
secondary education. These identified the likely positives as being drawn from a
combination of improved motivation and engagement . Motivation is seen as a
potential result of being able to study a range of issues in greater detail and at a
range of scales not otherwise possible, and by using computers. Engagement
was suggested as arising from students being able to undertake aspects of
geographical investigation at a level commensurate with their ability (West,
1999, 2003b).
Between 1999 and 2002, I undertook a quantitative study of over one hundred
students from three-year levels at two Queensland schools. Students were
surveyed using a five point Likert scale before and after exposure to GIS-related
learning experiences. This revealed attitudinal improvements in three of these:
perceived usefulness of computers, perceived control of computers and
behavioural attitude to computers. The weighted average declined for the
remaining two constructs: attitude to subject and affective attitude toward
computers (West, 2003b).
While these data suggest that the use of GIS can exert a positive influence on
students, since these data do not distinguish between the impact of using GIS and

11
that of simply using computers, it remains unclear whether it was the GIS or the
computers with which the GIS was used that had the greatest impact on student
attitudes. If improved attitudes simply come from using computers rather than
GIS specifically, perhaps it is worthwhile considering other, less technically
difficult ICTs. In this regard, it remains of interest to me what students do think
about GIS.
Rationale for the Current Study
Theoretical Imperative
Consideration of published opinion over the past decade would lead a reader to
conclude that geography is a misunderstood subject with an image problem (see,
for example, Conolly, 2000; Crabb, 1995; Dale, 1995; Fernald, 2002; Gerber,
1997; Hutchinson, 2006; Murphy, Morrison & Conolly, 2001; Rawling, 1997;
Sabelli, 2001; Smerdon, 2006). Many authors suggest that to address its
outdated image, curriculum development is required which emphasises
geography’s positive role in responding to many contemporary societal demands
(Bliss, 2006; Rawling, 2000). Indeed, Harman (2003) asserts that “geography is
only as valuable as its products are valued” (p. 419).
Four decades ago, Chorley and Haggett (1965) suggested that geographical
research is one of the “main growth ingredients for the subject” (p. 375). Others
have echoed this call. For example, in their review of the place of Geography
within the Australian context, Hutchinson and Pritchard (2006) argued:
for a future in which Australians are well-equipped to understand and adapt
to the rapidly changing world, educational bureaucracies cannot afford to
neglect geography. Not surprisingly in light of the fact that we inhabit an
island continent like no other place on earth, the teaching and research of
Geography in Australia traditionally has had a rich intellectual edge. Re-
energising this edge … should be a national educational priority (p. 10).
12
Not long before, Baker (2003) called for further research to support the place of
geography in the curriculum, specifying the need for data based upon appropriate
research designs and methodologies; data that can be exposed to and withstand
significant scrutiny. This research in geography education should establish an
empirically sound, theoretically grounded, practical and relevant base of
knowledge for geography (Downs, 1994).
Teachers would benefit from research which engenders for them greater
confidence to make choices about which applications to use in their geography
lessons, and how they can be used (Shields & Behrmann, 2000). International
Geography Union (IGU) supports classroom-based research, publicly stating that
it contributes to the “development and evaluation of teaching programs,
processes and resources” (Stoltman, 1997, p. 38). To support teachers, this
research would best consider actual classroom practice, including so-called new
instructional techniques (Bednarz, 1997).
Education is costly. Research in any curriculum area ought to demonstrate that
its cost is more than outweighed by its benefit (Downs, 1994). However,
insufficient research exists about the effective teaching - subject knowledge
relationship; how can teachers teach so that students learn what is intended
(Rawling, 2000). Research should also be secondary in importance to the
education (Underwood, 2004). In terms of the effectiveness and value of ICT
educational research generally, Underwood discovered that a “lack of theoretical
grounding and [its] individual, often idiosyncratic, nature” presented a significant
weakness (p. 135). To address this, she emphasises the need for researchers to
avoid four common pitfalls:
1. Disconnect between their research and theory;
2. Lack of consideration of the history of the issue being researched;
3. Focus on technology instead of learners and learning; and
4. Focus on quantitative methods.
Beyond research supporting its subject value, greater attention to learning
processes is also required in geography (Sack and Petersen, 1998). Research is
13
needed to “define which teaching strategies are most effective” (Nellis, 1995, p.
304). If we can accept that meaningful teaching involves “leading students
beyond superficialities, through the adoption of appropriate teaching-learning
activities” (Cox, 1997, p. 50), perhaps we require empirical research to address
questions that are relevant for both classroom and real-world (Bednarz, 1997).
And, research should make links between geographical literacy and vocational
opportunities (Downs, 1994).
Indeed, over a decade ago it was identified that increasing connectedness of
global communities through more efficient information technologies provides an
opportunity to rethink our approaches to teaching geography (Nellis, 1995).
However, an adjunct to increased access to technology in education is the
increased need to demonstrate that such access provides demonstrably positive
learning experiences at school (Shields, & Behrmann, 2000; Subrahmanyan,
Krant, Greenfield & Gross, 2000). With regard to information and
communications technologies (ICT) in education, there exists an, as yet limited,
understanding of how computer based systems can best be designed to enhance
learning (Murphy, 1997; Zandvliet & Fraser, 2004). While recognising the
importance of collecting evidence related to the potential of computers to
enhance learning, Murphy further demands systemic research which considers
qualitative observation of how theories of learning can be used to design
computer based learning environments which enable the intended types of
learning to be achieved (p. 4).
In this regard, access to hardware and software and basic technical competence
does not guarantee effective use of ICTs in the geography classroom. With
respect to the development of graphicacy, Gerber (1995a) suggests that “the
selection, generation, interpretation and use of graphics within geography
classrooms involves many more complicated aspects… Selective cognitive
decisions by the users of a graphic, in the form of spatial representations and
sequences in learning, all impinge on the use of technology in geography
lessons” (p. 52). Hence, understanding the cognitive processes inherent in the
use of ICTs is necessary to inform technology decisions. Failure to comprehend

14
fully these processes may lead to both decisions and curriculum that may not
lead to the desired learning outcomes.
With reference to this dearth of research-based data, Downs (1994) asserts that
“we must develop an inventory of the range and depth of geography skills and
knowledge among students in order to offer a benchmark against which the
impact of educational investments in geography can be measured” (p. 59).
Further, by understanding emerging trends, geography can ensure that it
encompasses instructional methods and experiences that meet the future needs of
individual students and society generally.
Analyses of student conceptions of GIS will make a contribution to this
benchmark. It will enable decisions to be made about whether GIS is a
worthwhile investment. To do this requires that research related to GIS must
reflect its application to practical problems and its role in geographical education
(Nellis, 1995). A key area for research is identifying the most effective strategies
for raising the level of students’ conceptual understanding of what mapped data
mean (Wiegand, 2003). By examining the process of map construction using
GIS, for example, we can begin to uncover the extent to which students
understand spatial relationships such as those found in maps (Bausmith and
Leinhardt, 1998).
It is widely accepted that using geographical technologies might “enhance our
ability to think spatially at the same time we prepare our students at all levels to
live in an information-oriented society” (Fernald, 1996, p. 302). Similar views
are offered by, among others, Dascombe (2006), Jenner (2006) and Kidman and
Palmer (2006). West (1998a, 2003b) suggests the potential of GIS in modeling
efficient thinking processes for students. Hence, research is required that
considers student perceptions of places, patterns and processes under a range of
instructional techniques (Bednarz, 1997). To this, Nellis (1995) specifies the
need for research into the impact of GIS’ use on learning in geography.
Following his study of GIS’ impact on student attitudes, West (2003b)
recommends qualitative appraisal of the development of student thinking skills
15
while using GIS. However, there is no sense in examining the benefits of a tool
that has at its base the promotion of interconnectedness of knowledge “by
looking at its impact in small unconnected pieces that bypass the cognitive and
networking uses of technology” (Sabelli, 2001, p. 3). How well geography
education can exploit opportunities for technological inclusion depends on
teacher understanding of conceptualisation afforded by it (Gerber, 1995a).
Personal Imperative
I am a teacher of geography. It is, therefore, incumbent upon me to internalise
and act on this theoretical imperative. Indeed, to do so may not only benefit my
students and me, but may offer a contribution to the subject itself. In this regard,
Rawling (1997, pp. 11-13) highlights six curriculum challenges for geography
and its educators:
1. confirmation of the distinctive nature of geography (e.g., subject matter,
skills, approaches);
2. recognition of geography as an educational medium (ie, the wider
contribution of geography to developing skills useful for society);
3. development of a public image of geography;
4. emphases on quality geography teaching and learning;
5. maintaining a strong professional base; and
6. commitment to an international community of geography educators.
Investigating what students think about GIS will enable me to contribute further
to each of the above six challenges. Downs (1994) states that more geography
teachers are needed to undertake relevant research within their career. As a
teacher of geography, I want to know whether the instructional methods I employ
and the resources that I use will enable students to successfully develop and
demonstrate the learning outcomes that I intend. While my anecdotal experience
suggests that GIS models for students the efficient encoding, management and
manipulation of spatially referenced data (West, 2003b), the educational value in
terms of what students are actually thinking while using GIS remains unclear.
16
Since quality teaching depends on quality research (Downs, 1994), it is
incumbent on geography teachers to investigate areas of professional interest and
significance. A declaration of the IGU is for geography teachers to not merely
be specialists in geography, but also in geography education (IGU, 1997).
Indeed, when reflecting over his ten years as editor of the Journal of Geography,
Robert S. Bednarz wrote that “one of the goals that geography educators should
establish for the next era is to conduct and publish research that will support
geography education’s continued progress” (Bednarz, 1997, p. 279).
Crabb (1995) believes that the quality of geography in secondary education is
adversely affected by teachers following short-lived trends. Few would argue
against the urgent need for research to ensure that GIS doesn’t just become
another, costly and resource intensive, trend. My role as a geography teacher has
already involved extensive application of GIS in my own and other schools. I
have quantitatively and qualitatively explored GIS’ impacts and student
conceptions of geography’s role in their futures (see, for example, West, 1998b,
2003a, 2003b).
Burns (2000) provides a number of justifications for basing research projects on
the everyday experiences of the researcher: it is easier to sustain motivation to
complete research related to an area of personal interest; research projects based
on everyday experiences may contribute to the researcher’s own understanding
of those experiences; and, by yielding worthwhile problems, investigating
everyday experiences can lead to improved professional practice.
Further research of student conceptions of GIS will contribute to my own
professionalism as a geography educator and the internationalisation of a
geography curriculum that can withstand external scrutiny.
Deficiencies in Current Research
My first refereed article related to GIS’ potential role in geography education
was published in 1998 (West, 1998a). In it, I suggested that the dearth of
17
research in GIS reflected the relatively recent interest of educators in it.
However, in the nine years since, little progress has been made. This is not to
say that only a few authors have considered its possible impacts. Rather, there
has been widespread communication about the potential of GIS in education.
There has simply been little empirical research undertaken on this topic, as noted
by Baker and Bednarz (2003).
Literature related to this topic is drawn from a range of fields related to
geography education. However, global data suggest that geography has not
embraced as many contemporary educational directions as it could have (Gerber,
2001). In 1994, Downs claimed that research current at that time was “largely
incidental and therefore peripheral” to actual geography education (Downs,
1994, p. 58). In a recent reflection on Downs’ lament, Baker and Bednarz (2003)
suggested that “this call remains relevant, pressing, and still unmet” (p. 231).
In 2006, I edited a Forum section on issues affecting the uptake of GIS in
Australian and New Zealand schools for International Research in Geographical
and Environmental Education. The message from its contributing authors was
not new. For example, three years earlier, in 2003, the Journal of Geography
published an edition focusing on Research on GIS in Education. Its editors noted
how frequently the merits and barriers of including GIS in the classroom have
been identified since the (US) First National Conference of the Educational
Application of Geographic Information Systems in 1994 (Baker and Bednarz,
2003). They also observe that despite widespread promotion of its use, GIS
technologies remained peripheral to most geography education. One reason, they
claim, is the “paucity of research on its effectiveness in promoting significant
learning” (p. 232). Specifically mentioned was what they perceived to be
inadequate knowledge of the potential impacts of GIS on such things as spatial
cognition, knowledge acquisition and process skills. To this, they highlight the
“need for teachers to have a clearer understanding of student’s cognitive
processes, misconceptions, and ability to make meaning from learning
experiences using GIS” (p. 232).

18
Deficiencies in research about GIS’ role in geography education revolve around
two main issues. First, the absence of sufficient substantive research on the topic
(Baker & Bednarz, 2003). Second, the apparent emphasis on reproducible
projects that constrain the questions that researchers have chosen to ask and
answer. Gritzner (2003) supports this, adding that the results of such analyses
may not “inform classroom instructors about how…people acquire spatial
knowledge and skill in real world environments” (p. 279).
According to Harman (2003), geography research must have an applied value if
it is to be justifiable. This research was described by Downs (1994, p. 57) as
“sadly lacking” and remains so a decade later. Perhaps unfortunately, there is
not a single empirical study that categorically answers the question of whether
GIS should be used in schools. Rather, a raft of impacts of GIS in education has
been observed and these relate to several themes: student/teacher attitudes,
motivation, geographic and cartographic knowledge. To a lesser extent, data
suggest a role in the processing of spatial information. Most research has
quantitatively emphasised the so-called middle years of schooling, within a
United States and British context. Design has largely been limited by external
curriculum constraints and the need for replicability. Most authors undertaking
GIS research to date have identified limitations in their own research designs and
the need for a greater awareness of GIS’ role in education. This is a need that is
best balanced with the need for research based upon appropriate methodologies,
such that the data obtained may “be analysed in ways that will stand up to
significant scrutiny” (Baker and Bednarz, 2003, p. 233). Indeed, in her recent
evaluation of the potential educational implications of GIS' use in school
geographies, Sarah Witham Bednarz (2004, p. 191) observed that:
the geography and environmental education research community do not
know the exact contribution of GIS to substantive geographic and
environmental learning. Nor are we able to state unequivocally that GIS in
elementary and secondary education has a clear, positive effect on the ...
central goals of geography and environmental education.

19
In short, we do not yet know where, if anywhere, GIS belongs in the geography
curriculum. On the basis of this argument, attention now turns to the nature of the
present investigation.
Central Phenomenon and Research Questions
The central phenomenon of the present study is student conceptions of GIS. The
specific research question being investigated is:
What are the conceptions of geographic information systems (GIS) held by
Senior Geography students?
The answers to this question will contribute to:
1. Knowledge of the spatial understandings held by students of geography;
2. Understanding how students gain an understanding of spatial phenomena
of varying levels of complexity;
3. Awareness of the potential educational outcomes associated with using
GIS;
4. Current discussions about the merit of using ICTs in education, with
specific emphasis on the use of GIS in geography education;
5. Decisions related to current and potential geography curricula; and
6. Understanding how the subject Geography is and can better be
understood.
Study Design
Methodology
The need for qualitative research is argued by Bruhn (1989), who asserts the
need to “develop more explicit and systematic methodologies which refer to
language and communication as the central categories of analysis”. Dahlin
(1994) further argues for such methodologies, adding that “theoretical reflections
on the nature of conceptions [possess] an epistemological character”. More

20
specific to the present research, Gerber (1993) notes that qualitative research
methods are a well-established form of research in social sciences, offering
potential for geography educators (emphasis added).
Phenomenography is one qualitative research specialisation. Phenomenographic
research approaches developed in the late 1970s and early 1980s (Bruce, 1995).
While it does not appear to “reconcile the search for authentic understanding
with the search for scientific rigour” (Richardson, 1999, p. 53), it is a research
methodology that has presented a number of benefits.
In 1995, Gerber (1995b) suggested that phenomenographic research has yielded
results that offer alternative descriptions of people’s conceptions of a range of
phenomena. The value of the phenomenographic methodology in educational
and social science research has also been discussed by several authors (see, for
example, Bruce, 1995; Dahlin, 1994; Irvine, 2005; Mailler, 2006; Nagel, 2005;
Pramling, 1995).
Methodologically, phenomenography relies upon the discursive accounts of
participants (Richardson, 1999). This reflects the view that language is a “device
for representing the world” (Ekeblad, 1995). Although more than a decade ago,
Gerber perhaps best captured the foundation of phenomenography when he
stated that people’s experiences of phenomena “are recorded in the words of
other experiences by the participants in a specific context” (Gerber, 1992b).
Because of this, interview transcripts can be analysed to detect the “qualitatively
different variations in the [interviewees’] experiences” (Gerber, 1995b).
Bruhn (1989) suggests that this qualitative analysis of data as discourse may, in
many ways, serve the functions traditionally performed by statistics in
quantitative analyses. Discourse analysis allows the variation in experiences of
the participants to be revealed, which, Gerber (1995b) claims, enables this
methodology to “adopt a supra-individual orientation in the investigation of
human experience” (p. 1). Gerber continues to clarify the objective of
phenomenographic research as being “human experience as it is remembered
from a second-order perspective” (p. 1). Moreover, by emphasising the

21
relationships between subject and object within a specific context, he argues that
phenomenography offers a distinctive relational nature (p. 1). In this regard,
phenomenography fundamentally “accepts that people develop their knowledge
of the world through personal experience…all knowledge is subjective in nature”
(Gerber, 1992b).
The Role of Phenomenography in Educational Research
The issue of context is important in educational research (Ekeblad and Bond,
1995). Ekeblad and Bond continue to suggest that processes of learning are not
always internal and mental but, rather, they “unfold in interaction with the world
around us”. Within phenomenographic research, the form of knowledge of the
world around us is represented through conceptions (Dahlin, 1994). Hence,
within educational research, phenomenography can inform pedagogical decisions
to effect conceptual changes by the learner in a particular context (Bowden,
1990).
Two decades ago, Dahlgren (1984) stated that “student learning outcomes vary in
terms of their understanding of the phenomena being studied”. An adjunct to this
is that an understanding of student conceptions of phenomena may influence
those outcomes. Gerber (1992b) more recently noted that variations in the
phenomenographic approach may be used in geography education research, such
as to investigate different conceptions that learners hold of different concepts; to
consider the types of learning that occur in the classroom; and, to investigate the
processes that learners use. For the present study, phenomenography can be used
to gain an understanding of student conceptions of GIS; and, therefore, provide
some indication of the extent to which its use enables educational outcomes to be
achieved.
Although GIS’ technical potential and educational application have evolved
since the early 1990s, it was even then that Gerber and Boulton-Lewis noted that
graphically represented data, generally, are very complex (Gerber, 1992a).
Developing an understanding of such data representations is equally complex.

22
As such, these authors claim, teachers need to understand this process if they
wish to support student learning. The proposed research responds to this call by
investigating student experiences of using graphic representations, as depicted by
GIS.
Sampling and Data Collection
The research question is investigated using an opportunistic sample of 109 Year
11 and Year 12 students from four metropolitan and regional schools in south
east and north Queensland, Australia. All participants are enrolled in courses of
Senior Geography that incorporate a GIS component. The investigation
proceeds as follows:
1. Students are interviewed to explore their conceptions of GIS
2. Interviews are transcribed and their text analysed to identify
Categories of Description
3. Conceptions are distilled from within these Categories of Description
4. Categories of description are modelled to determine an Outcome
Space, representing the relationships between the conceptions
Specific details related to each of these stages will be included in Chapter Three.
Structure of the Thesis
Chapter One has contextualised the research. The research problem has been
outlined: will using GIS within the geography classroom contribute to students’
geographical education. The specific research question being investigated in this
study is: what are the conceptions of GIS held by Senior Geography students?
Chapter Two critically evaluates the literature related to three aspects of this
research. First, it evaluates geographical education, generally, and its potential
contribution within the Queensland curriculum, specifically. Second, it evaluates
the potential role of GIS in contributing to a geographical education. Finally,

23
Chapter Two culminates in an overview of: questions that arise from the
literature; and, the central phenomenon and research question specific to this
thesis.
The methods and design of research that address the research question is then
introduced in Chapter Three. Chapter Three also describes the characteristics of
participants, their schools, communities and the place of GIS within the Senior
Geography curricula within their schools.
In Chapter Four, the conceptions of GIS are distilled from within categories of
description. Chapter Four concludes with the emergence of an outcome space
that delineates the interrelationships between the conceptions.
Chapter Five concludes the thesis by: positioning the research findings within the
context of the reviewed literature; evaluating the implications of the findings for
Queensland Senior Geography in particular, and geographical education in
general; reviewing the investigative method to identify its limitations; and, by
recommending future research. References and Appendices follow Chapter Five.

24
CHAPTER TWO
REVIEW OF LITERATURE
“As society has evolved, so has the use of geographical information” (Miller et al., 2005, p. 258).
Introduction
With respect to the (1974) recommendations made by UNESCO, geography
education makes a tremendous contribution to international education (IGU,
1997). This international nature of geography’s contribution is in itself an
example of geography’s broad reach across scales of study. To this, Gritzner
(2003) adds that “every day of our lives, we live geography” (p. 90).
Naish et al. (1987) stipulate that the inclusion of any subject in a school’s
curriculum should be justified through elucidation of not only the body of
knowledge with which it is concerned, but also its potential for development of
broader capabilities for participation in the world. The manner by which this
knowledge can be learned and capabilities developed thus becomes integral to
the effective ‘teaching’ of that subject (Gregg et al., 1997).
Figure 1. Three foci of Chapter Two.
In this regard, it is important to determine whether the nature of geography is
such that its place in the curriculum is justifiable. This constitutes the first of
I. The Nature of
Geography Education
II. Geographic Information
Systems
III. Questions Remaining

25
three foci elucidated by this chapter (Figure 1). Specifically, this chapter reviews
the literature to argue that Geography:
� is concerned with a multidisciplinary body of knowledge of global
significance;
� emphasises a range of technical and problem-solving skills; and,
� encourages its students to develop capabilities to participate actively in
the world about which they are learning.
If geography and a geographical education can be shown to be valuable, then the
way it is taught requires consideration. Once this has been ascertained, the
chapter will move to evaluate published findings about classroom practices and
the extent to which they afford teachers confidence that students are learning
what is intended. This discussion will emphasise seven elements of a geography
education (Figure 2).
Figure 2. Seven elements of discussion about The Nature of Geography.
Associated with the discussion of teaching methods in geography is the chapter’s
second focus: investigating the role of Geographic Information Systems in
contributing to geographical education. This discussion will emphasise four
elements (Figure 3).
Citizenship & Participation
Natu
re o
f G
eo
gra
ph
y
Ed
ucati
on
Problem Solving
Methods, Motivation & Fieldwork
Skills
Misunderstood
Multidisciplinarity & Interconnectedness
Geography Described

26
Figure 3. Elements of discussion about Geographical Information Systems.
Emerging from the review of Focus I and Focus II will be the chapter’s final
focus: questions that indicate potential for further research. These questions will
be revised to identify a central phenomenon and research question for this
project.
What it is and isn’t Student Learning
Issues Affecting Use
Role in Education
Ge
og
rap
hic
In
form
ati
on
S
yste
ms

27
The Nature of Geography Education
Focus I, The Nature of Geography Education, will be explored through
investigation of seven elements (Figure 2).
Geography Described
Geography as a discipline is defined at once by its spatial emphases and its
reliance upon methodology more so than its content. More specifically, Fernald
(2002) states that geography is “the analysis of the areal distribution of a
phenomenon [that involves the examination of] the location and distribution of
phenomena in space, or place, by means of identifying their density, pattern,
diffusion, and dispersion” (p. 126). He continues that geography is “the unique
discipline that examines the earth from the spatial point of view” (p. 127).
Because the features that represent the focus of geographical study are dispersed
across the surface of the earth, the study of geography encompasses a great deal
of interconnectivity. In this regard, its study is about how local, national and
international scales interact (Rawling, 2000). Three years earlier, Stoltman
(1997) cited the International Charter on Geographical Education which asserts
that “geography is the science which seeks to explain the character of places and
the distribution of people, features and events as they occur and develop over the
surface of the earth” (p. 33). According to Fernald (1996), geography is involved
Misunderstood
Citizenship & Participation
Natu
re o
f G
eo
gra
ph
y
Ed
ucati
on
Skills
Problem Solving
Multidisciplinarity & Interconnectedness
Methods, Motivation & Fieldwork
Geography Described
28
with two sets of spatial activities: location and distribution, and interaction and
relationships. The US definition (Geography Education Standards Project, 1994)
provides further detail still, delineating geography as
an integrative discipline that brings together the physical and human
dimensions of the world in the study of people, places and environments. Its
subject matter is Earth’s surface and the processes that shape it, the
relationships between people and environments, and the connections
between people and places (p. 18).
To this, the Australian Geography Teachers’ Association adds that geography
“involves how people in certain situations may be influenced by environmental
circumstances … [and] … the way that people have sought to control physical
and social environments” (Gerber, 1997, p. 38).
Evident from the above summary of geography’s definition is that its unifying
element is the spatial context. This context is explored further by Dale (1995),
Murphy, Morrisson and Conolly (2001), Rawling (1997) and Tamagno (2000).
Earlier than most others, Fernald (1996) articulated succinctly this commonality
with the claim that geography “utilises the spatial approach to the understanding
and analysis of Earth as the home of humans” (p. 3). Within this, Gerber (1997)
recognises that geography’s many definitions possess four common elements:
location, pattern, distribution and land-people interaction. The study of these
four elements within geography usually involves a regional emphasis, where a
region is delineated through classifying spatially arranged features as similar or
dissimilar (Gritzner, 2003).
Rawling (1997) also notes that a distinctive feature of geography is its emphasis
on understanding skills, its relevance to real-world issues at a variety of scales
and its contribution to the development of vocational skills. Through these skills,
geography provides the framework for making sense of the spatial data that we
encounter in our daily lives (Conolly, 2000; Salter, 1995), and which form the
basis of the subject’s content. More simply, to the geographically illiterate,
places are meaningless (Gritzner, 2003).
29
Geography’s value extends beyond itself. This is because most variables in both
the sciences and the humanities have a spatial context (Oldakowski, 2001). By
emphasising this spatial perspective, geographers can describe, and therefore
seek to explain patterns that are evident within human-natural environments
(Conolly, 2000; International Charter on Geographical Education, 1992;
Tamagno, 2000). Consequently, “geography occupies a distinctive place in the
world of learning, offering an integrated study of the complex reciprocal
relationships between human societies and the non-human components of the
world” (Quality Assurance Agency, 1999). This crossing of the cultural-physical
divide is essential to an understanding of geography’s potential (Healey et al.,
2000); an understanding that will come through “the determination to grapple
with the complexities of human-environmental interactions in small
communities, within nation states and at a global scale” (Young, 1995, p. 7).
Geography is also a reflective discipline (Healey et al., 2000). Many definitions
of geography include reference to its contribution to the development of a futures
perspective (Fitzpatrick, 2001; Gritzner, 2003; Howitt, 2002). Gritzner (2002, p.
240) states that “Geography is the study of what is where, why there and why
care?” Similarly, Fitzpatrick (2001) classifies geography as a discipline
characterised by three questions: ‘What’s where?’, ‘Why is it there?’ and ‘So
what?’ Howitt (2002) echoes the first two of these three questions, stating that
geography teaches us where we are and why we are here. By comparison with
the previous two authors, Howitt also clarifies the reflective nature of the third
question by arguing that geography also teaches us what we might become.
This reflective nature of geography is developed through its adherence to four
basic steps (Casinader and Casinader, 1994):
1. collection of primary and secondary data;
2. identification of trends and patterns;
3. analysis to determine reasons for the trends and patterns; and,
4. evaluation of the importance of these reasons.

30
With respect to the final, evaluative, step, Casinader and Casinader (1994)
continue that this process enables “students to create their own set of future
situation characteristics by extrapolating from what they know” (p. 42).
Evaluation is also one of the five thinking skills integral to thinking
geographically (Catling, 2003); its integral nature is evidenced by its inclusion
in secondary geography curricula around Australia (Casinader and Casinader,
1994).
Beyond the investigation and evaluation of spatial information, the role of
geography is widely lauded as considerable. Indeed, Gritzner (2003) observes
that most Western urban-industrial world countries have placed geography at the
core of social-science curriculum. The US Geography Education Standards
Project (de Souza and Downs, 1994) cites four reasons for the study of
geography: existential (to help us understand where we are); ethical (to provide
us a basis for cooperation to ensure sustainable futures); intellectual (to enhance
decisions by creating better informed citizens); practical (to respond to increasing
global interconnectedness by increasing the knowledge and skill that is needed to
solve these issues). Similarly, Marran (2003, pp. 42-43) offers five reasons for
the continued existence of geography education:
1. it provides a spatial perspective that is not provided in any other
discipline;
2. it describes and seeks to explain changing patterns;
3. it is “eminently useful” – emphasising problem-solving in real-
world contexts;
4. it provides an effective context for life-long learning; and,
5. it provides an opportunity to develop a perspective of the world
from both scientific and humanistic viewpoints.
This chapter has, thus far, described what geography is. With respect to this, the
remainder of this section will argue for its inclusion in school curriculum, by
examining what its students are both exposed to and engaged in.

31
Geography: its multidisciplinarity and interconnectedness
In terms of its contribution to education, and regardless of its name, geography
essentially provides “a socially critical classroom pedagogy” (Rawling, 2000, p.
210). This is achieved through its emphases upon both interdisciplinarity and
diversity (Healey et al., 2000). According to the International Geographic
Union, geography is unique for three reasons, the first of which is its synthesis of
other, science and humanity, disciplines (Stoltman, 1997). This is also discussed
by de Souza and Downs (1994), Healey et al. (2000), Murphy et al., (2001),
Oldakowski (2001) and Young (1995).
Healey et al. (2000) provide a particularly lengthy discussion about this. Since
all disciplines seek to explain some aspect of our existence, all disciplines must
be, in some way at least, connected. The connections are explored through
disciplinary specialisation. In this manner, each discipline provides a small
contribution to a collective understanding of a greater picture. Healey et al.
(2000) conclude that “the nature of geography means that geographers are used
to borrowing and adapting ideas from outside their discipline” (p. 5).
Indeed, some would argue that geography is the most converging of all school
subjects (Marran, 2003). He argues that this is because it joins together aspects of
all other subjects to enable a coherent understanding of “the causes, effects, and
meanings of the physical and human events that occur across the Earth’s surface”
(p. 43). By using the ideas and methods of many, traditionally discrete,
Misunderstood
Citizenship & Participation
Geography Described
Natu
re o
f G
eo
gra
ph
y
Ed
ucati
on
Skills
Problem Solving
Methods, Motivation & Fieldwork
Multidisciplinarity & Interconnectedness
32
disciplines, geographers can synthesise knowledge in an holistic sense; as a
discipline it possesses “sensitivity and understanding needed to work with people
of other disciplines” (Young, 1995, p. 7), enabling it to assist other disciplines in
their own attempts at increased understanding of phenomena (Murphy et al.,
2001, p. 42). By corollary, Gritzner (2003) asserts that geographical illiteracy
precludes an understanding of the interconnectedness of global phenomena.
The convergent nature of geography is evident in Queensland, where the Senior
Geography syllabus arguably encompasses more disciplines than any other
subject offering in Queensland. Furthermore, of the 49 Common Curriculum
Elements (CCEs) derived from Queensland senior syllabuses and assessed as part
of the Core Skills Test to determine university entrance ranking, 38 are present in
Senior Geography, compared with the average of 27.8. Indeed, the number of
CCEs addressed within Queensland Studies Authority (QSA) accredited Senior
Geography is third only to Mathematics A (42) and Earth Science (41). By way
of comparison, the least frequent occurrences occur in Secretarial Studies (12),
Graphics (15), and Agriculture and Animal Production (17) (Queensland, 2002).
This multidisciplinarity affords Geography with a valuably diverse body of
knowledge. “In a positive sense … diversity gives geography part of its creative
tension and capacity for change and renewal” (Slater, 1995, p. 4). Stoltman
(1997) makes the additional claim that secondary geography education should
increasingly emphasise interconnectivity. Nellis (1995) suggests that making
such connections between phenomena studied at a local scale and the global
processes of which they are a part is a valuable means of achieving this
interconnectivity. Further, Murphy et al., (2001) state that being able to
recognise these links and relationships is a precursor to deep understanding.
Accordingly, Geography’s “wide-ranging content” enables many opportunities
for the study of issues at a range of scales (Rawling, 2000, p. 210). The breadth
of geography’s study is the third reason for its uniqueness (IGU, 1997). In
Queensland, Senior Geography involves the study of Core and Elective topics, at
a range of Scales of Study and grouped within four Themes (Table 1). Syllabus
33
page 13 outlines the requirements for core and elective units, as follows
(Queensland, 1999a, p. 13).
Core units as outlined in the syllabus
provide a framework for schools to select appropriate topics and case
studies, to match the interests of their students, the availability of resources,
and local conditions. The key questions [for the core units] … are not
statements of content. They provide guidance for the selection of case
studies at a depth sufficient to allow students to explore the unit.
At least three elective units must be studied, with at least one studied in each of
three semesters. Each elective must relate to the theme being studied in the
semester in which it is offered.
The selection of elective units may be made as a response to the interests of
students and teachers as well as on the basis of the resources to which the
school has access. The elective topics may be used to introduce a theme, to
link core topics within a theme, to provide opportunities for the examination
at greater depth of aspects of the theme or to conclude a theme. The topic
for the elective may arise from an area of interest developed in a core unit
and explored to a greater degree in an elective unit.
Core and elective units are not distinguished in level of importance, and
therefore may be studied over similar time frames within a theme…
[S]chools may tailor their courses to meet the needs and interests of their
students and the resources of their schools.

34
Table 1
Themes, Topics and Scales of Study prescribed by the 1999 Queensland
Senior Geography Syllabus (Queensland, 1999a).
However, it must also be noted that, despite the stated benefits, Geography’s
diverse and interdisciplinary nature can confuse students (Healey et al., 2000).
For this reason, it is important that the methodological basis of school geography
be developed to enable active student engagement with a range of different
discourses, within which there exists “the babble of technical terms and nuances
of technical language” (p. 4). The argument here is that if geographical education
emphasises appropriate skills, this confusion may be obviated.
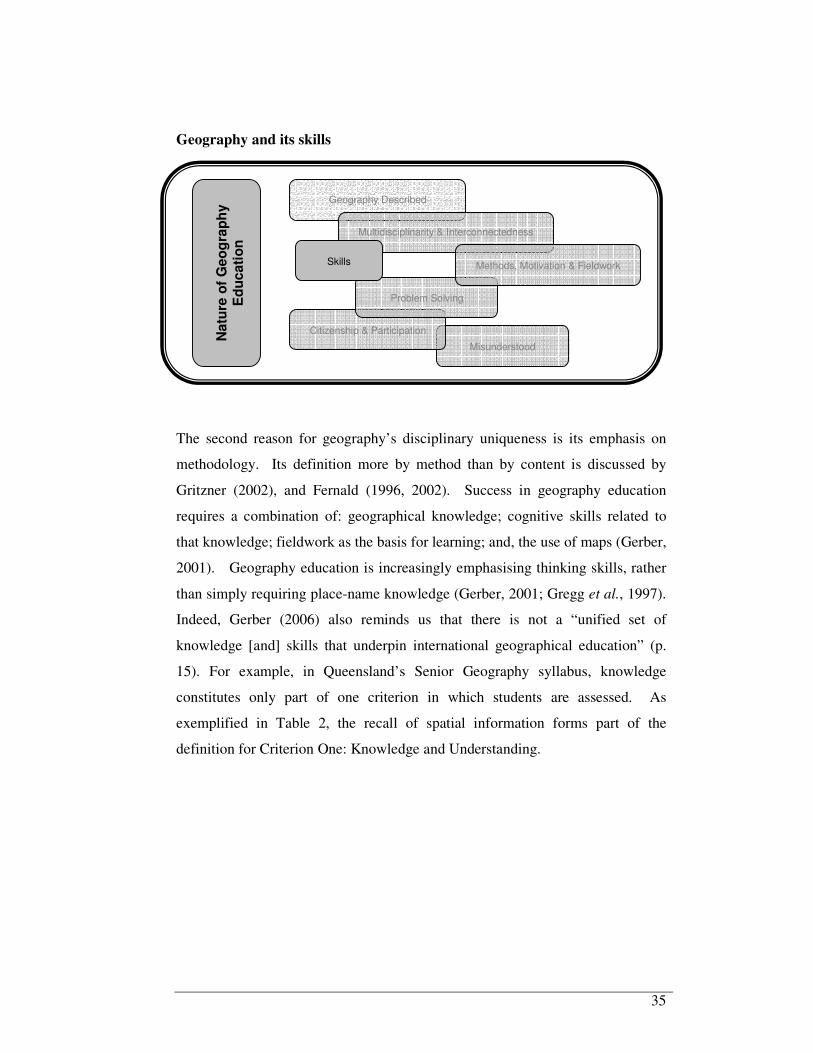
35
Geography and its skills
The second reason for geography’s disciplinary uniqueness is its emphasis on
methodology. Its definition more by method than by content is discussed by
Gritzner (2002), and Fernald (1996, 2002). Success in geography education
requires a combination of: geographical knowledge; cognitive skills related to
that knowledge; fieldwork as the basis for learning; and, the use of maps (Gerber,
2001). Geography education is increasingly emphasising thinking skills, rather
than simply requiring place-name knowledge (Gerber, 2001; Gregg et al., 1997).
Indeed, Gerber (2006) also reminds us that there is not a “unified set of
knowledge [and] skills that underpin international geographical education” (p.
15). For example, in Queensland’s Senior Geography syllabus, knowledge
constitutes only part of one criterion in which students are assessed. As
exemplified in Table 2, the recall of spatial information forms part of the
definition for Criterion One: Knowledge and Understanding.
Misunderstood
Citizenship & Participation
Geography Described
Natu
re o
f G
eo
gra
ph
y
Ed
ucati
on
Problem Solving
Multidisciplinarity & Interconnectedness
Methods, Motivation & Fieldwork
Skills

36
Table 2
Assessment criteria associated with Queensland Senior Geography syllabus
(Queensland, 1999a).
37
Teaching that develops geographical thinking allows students to draw
generalisations from data analysis (induction) and test generalisations using those
data (deduction) (Fernald, 1996). To elaborate, Fernald (1996) suggests that
thinking geographically “implies activities and thinking that examine and analyse
aspects of spatial distribution; some of these aspects are the density, pattern,
diffusion and dispersion of phenomena in place” (p. 3). Two benefits come from
emphasising the spatial organisation and distribution of phenomena
(Oldakowski, 2001). First, since people possess differing understandings of
abstract concepts, spatial awareness helps to provide a uniform perspective.
Second, understanding the spatial perspective is necessary to understand more
complex concepts and to utilise geographical technologies, such as GIS. With
respect to the latter, Gerber (1997) observed that being able to think like a
geographer means being able to use its tools. In the current discussion, however,
geography’s tools include both the technologies and the cognitive processes that
enable its efficient study.
Despite the role of its skills in underpinning effective geographical enterprise,
Gerber’s (2001) global survey of geographical educators from 32 countries
revealed that practical tasks and skills were not rated highly by respondents in
terms of their perceived value in lower secondary school. In this survey, by way
of comparison, facts and concepts were rated as highly valuable. Yet, in
practice, doing geography involves participation in a process; a methodology that
has as its basis the observation of people, places and the environment to better
understand and appreciate their interactivity (Gerber, 1997).
In support of the value of skills-based geography education, Healey et al. (2000)
believe that geography students should be given good exposure not only to a
broad liberal education, but to skills of communication, analysis, information
technology, numeracy, literacy and problem-solving. In this regard, the
Queensland Senior Geography syllabus states that, through studying Geography,
students will “become proficient in the use of a range of thinking, social,
communication, practical and study skills…as they seek an understanding of
people-environment relationships and the kinds of knowledge and patterns that
relate to them” (Queensland, 1999a, p. 5).
38
Geography’s contribution to the development of communication skills extends to
encompass a wide range of forms (de Souza and Downs, 1994). This range is
arguably wider in geography than in any other subject (Murphy et al., 2001).
One such form is communication using visual forms.
As early as, 1995, visual communication was gaining widespread acceptance as a
viable alternative to traditional emphases on written and spoken forms (Gerber,
1995a). If we can accept that the role of graphic representation is increasing in
what is often described as our technologically dependent society, then we may
conclude that its prominence in Senior Geography increases the potential role of
this subject in preparing students for participation in an increasingly visual
society (Yates, 2000). Gerber (1995a) and Catling (2003) provide further
discussion of this.
To understand the value of Geography in developing student capacity in this
regard, we should first identify the elements of graphical thinking. Graphical
thinking uses images instead of letters and numbers, even though letters and
numbers are usually a part of the images being used (Catling, 2003). Thinking
graphically is a construct of five other thinking skills: information processing
skills (e.g., reading a map); reasoning skills (e.g., drawing a sketch map to show
specific features in a relationship); inquiry skills (e.g., selecting resources to
gather information to answer specific questions); creative-thinking skills (e.g.,
creating a model to show the impact of a proposed urban development); and,
evaluation skills (e.g., generating options and then selecting a solution for a
particular issue) (Catling, 2003). On this basis, it could be argued that thinking
geographically is synonymous with thinking graphically.
The visual images commonly used in geography can be broadly grouped into
three categories (Catling, 2003). Photographs can be used to stimulate questions
for inquiry, visualise key elements of a place and represent and examine images
of a place. Sketches, diagrams and charts can be used to create diagrams that
show sequences of events, record observations from a model and display
fieldwork processes and findings. Finally, maps can be used to think about an

39
appropriate course of action (e.g., determine the most efficient route), create an
understanding of space (e.g., plan a suburban development) and investigate,
record and analyse processes arising from human-environmental interactions
(e.g., distribution of income, bushfire risk). Table 3 classifies the visual images
included within the Queensland Senior Geography syllabus according to these
three classes.
Table 3
Visual images of the Queensland Senior Geography Syllabus (Queensland,
1999a), classified according to Catling’s (2003) nomenclature.
The syllabus also includes reference to tables of data, observation schedules,
audiovisual and computer presentations (Queensland, 1999a).
However, and despite their importance, “opportunities provided by visual images
in the geography classroom are not always fully exploited by teachers to enhance
geographical knowledge, understanding and skill development” (Yates, 2000, p.
68). To ensure that images are used profitably in geography teaching, Roberts
(1998) offers four principles to guide their use. First, the image should be a part
of a larger program of inquiry, not as an extra. Second, the image should be
selected on the basis of how it can contribute to the inquiry. Third, students
should be encouraged to see images “as selections from reality”. Finally, an

40
image should provide opportunities for students to think about and ask questions
about what they see.
Of the three categories of visual images, maps are widely considered to be the
geographer’s most fundamental tool (Catling, 2003). A map represents the
features of a place “more succinctly (if not more accurately) than words could”
(p. 39). This is evidenced through the link between map use and understanding,
as investigated in a range of geographical education contexts. One such study,
by Oldakowski (2001), quantitatively investigated the influence of map
construction on the attainment of undergraduate university students with no prior
tertiary geography experience. This study concluded that students who
participated in the creation and analysis of thematic (choropleth) maps had a
statistically significant “better understanding of the spatial perspective” than
those students who were not exposed to learning experiences that “placed special
emphasis on important concepts such as spatial organisation or spatial
distribution” (p. 249).
Similarly, quantitative and qualitative investigation of 7th grade students exposed
to two different instructional strategies concluded that students who were
actively involved in constructing and working with maps provided statistically
significant improvements in accuracy when developing mental maps of the world
(Chiodo, 1997). However, study of the types of questions that 5th and 7th grade
students ask and answer about maps revealed no statistically significant benefits
from more frequent use of maps (Gregg, 1997). Despite the absence of
statistically significant benefits, subsequent qualitative study of these students
did reveal that their abilities to obtain information from maps (in the visual-
spatial mode) and then accurately ask or answer a question (in the verbal mode)
“almost certainly required them to enter deeply into the processes of reading and
interpreting maps” (p. 255).
To this end, Gregg suggests that obtaining information from a map involves three
distinct processes. First, map reading identifies explicit features on a map.
Second, map interpreting somehow integrates two or more pieces of information
from the map, identifying spatial relationships/patterns that are not “explicitly
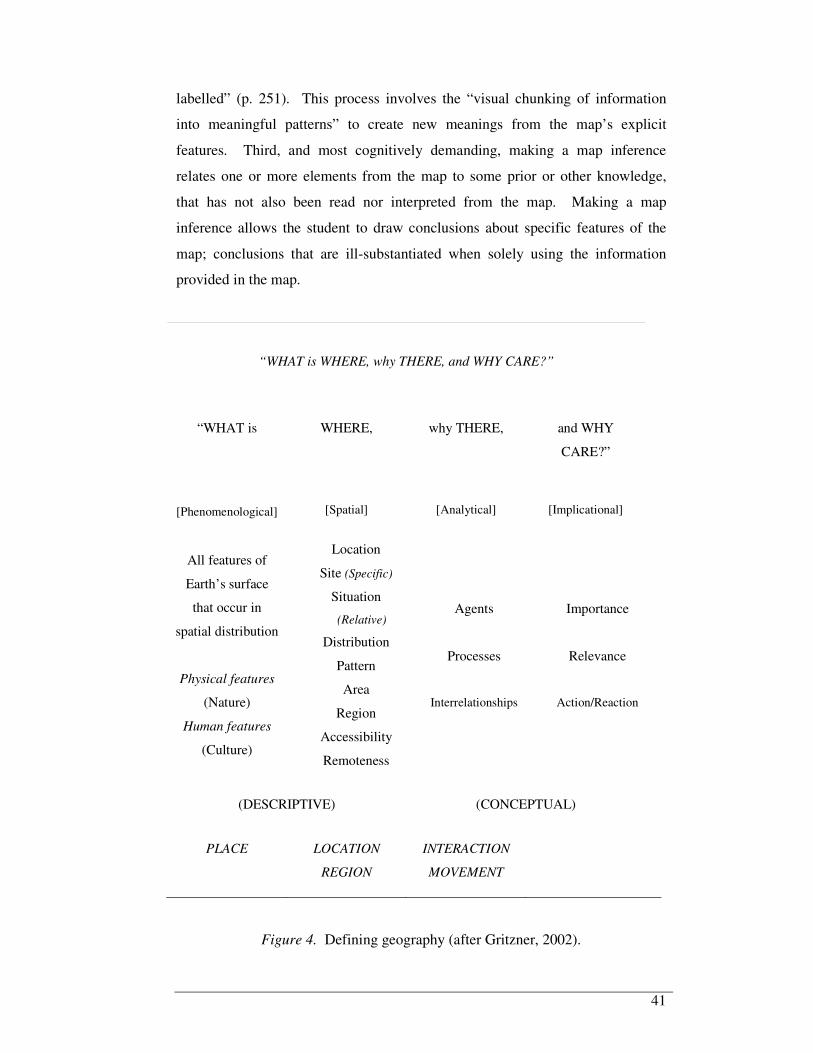
41
labelled” (p. 251). This process involves the “visual chunking of information
into meaningful patterns” to create new meanings from the map’s explicit
features. Third, and most cognitively demanding, making a map inference
relates one or more elements from the map to some prior or other knowledge,
that has not also been read nor interpreted from the map. Making a map
inference allows the student to draw conclusions about specific features of the
map; conclusions that are ill-substantiated when solely using the information
provided in the map.
“WHAT is WHERE, why THERE, and WHY CARE?”
“WHAT is
WHERE,
why THERE,
and WHY
CARE?”
[Phenomenological]
[Spatial]
[Analytical]
[Implicational]
All features of
Earth’s surface
that occur in
spatial distribution
Physical features
(Nature)
Human features
(Culture)
Location
Site (Specific)
Situation
(Relative)
Distribution
Pattern
Area
Region
Accessibility
Remoteness
Agents
Processes
Interrelationships
Importance
Relevance
Action/Reaction
(DESCRIPTIVE) (CONCEPTUAL)
PLACE LOCATION
REGION
INTERACTION
MOVEMENT
Figure 4. Defining geography (after Gritzner, 2002).

42
It is within maps that the spatial emphases of geography are most evident and it
is with the use of maps that geography students can develop spatial awareness
(Oldakowski, 2001). This is discussed further by Gerber (1992a), Mosenthal and
Kirsch (1990), Rittschoff and Kulhavy (1998), Schulze (1996), Thompson (1999)
and Trifinoff (1995). While visual images (including maps) are “a vehicle for
differentiation” and support evaluative processes (Yates, 2000, p. 69), making
map inferences first requires students to be able to analyse the world as it is
represented in maps (Casinader and Casinader, 1994).
To help students do this, and since “the spatial method of organisation and
analysis is geography’s most essential element” (Gritzner, 2002, p. 39), it is
important to ensure that they first understand the “building blocks” of spatial
awareness: the data (Oldakowski, 2001, p. 249). For Gritzner (2002, 39), this
understanding was supported by an illustration of the spatial detail associated
with the four elements of his own definition of geography: WHAT is WHERE,
why THERE, and WHY CARE? (Figure 4).
One example of the importance of emphasising these building blocks in school
geography is in the notion of Key Geographic Ideas (KGIs) adopted in the
Victorian geography curricula. An understanding of the KGIs is integral to a
student’s understanding of senior geography, and not only in Victoria (Cranby,
2002). KGIs can be loosely categorised as lower-order and higher-order,
depending upon their level of cognitive complexity (Tamagno, 2000; Figure 3).
Student understanding of them can be demonstrated in two main ways: by
identifying where a particular Idea is evident in data; and, by describing data by
identifying where/how a particular Idea is evident in those data (Cranby, 2002).
Of the KGIs, spatial association is considered one of the most difficult. By
definition, it is “the degree to which two phenomena are similarly arranged or
located in space” (Cranby, 2002, p. 25). To support the development of spatial
association, and through it geographical literacy, Oldakowski (2001) advocates
that students be taught about the different classes of data and the influence that
different methods of class construction have on thematic maps. Murphy et al.
(2001) also consider the geography teacher responsible for giving students the
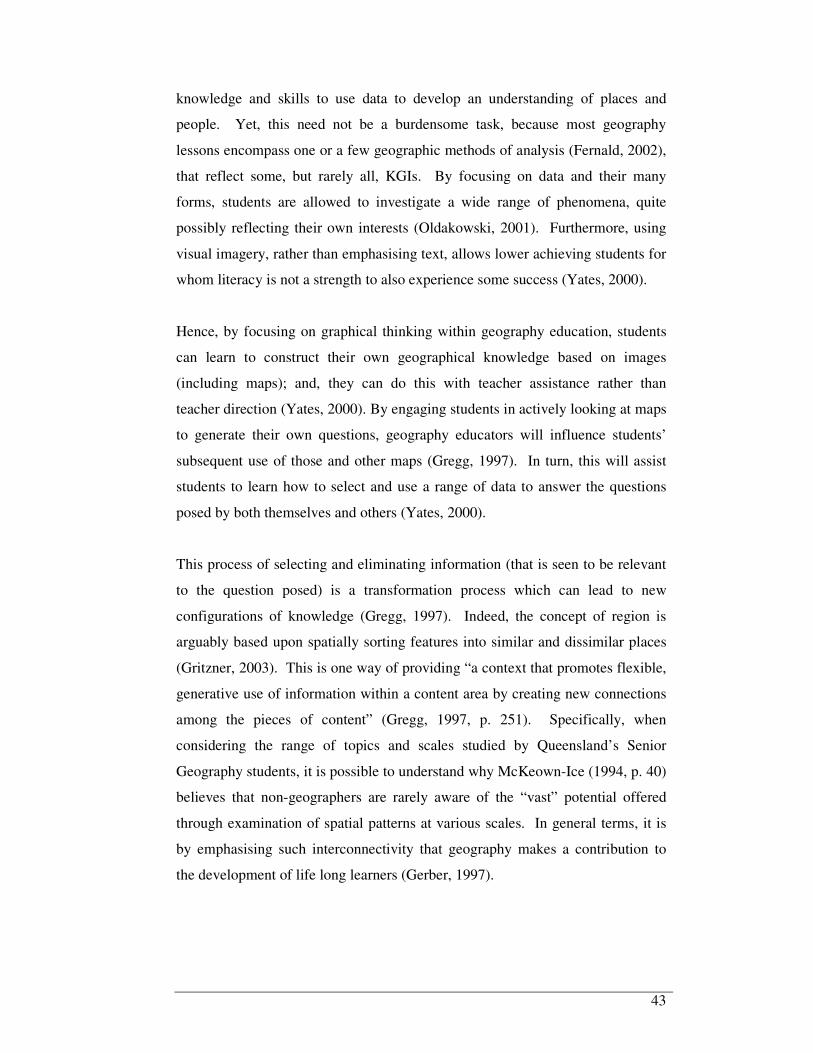
43
knowledge and skills to use data to develop an understanding of places and
people. Yet, this need not be a burdensome task, because most geography
lessons encompass one or a few geographic methods of analysis (Fernald, 2002),
that reflect some, but rarely all, KGIs. By focusing on data and their many
forms, students are allowed to investigate a wide range of phenomena, quite
possibly reflecting their own interests (Oldakowski, 2001). Furthermore, using
visual imagery, rather than emphasising text, allows lower achieving students for
whom literacy is not a strength to also experience some success (Yates, 2000).
Hence, by focusing on graphical thinking within geography education, students
can learn to construct their own geographical knowledge based on images
(including maps); and, they can do this with teacher assistance rather than
teacher direction (Yates, 2000). By engaging students in actively looking at maps
to generate their own questions, geography educators will influence students’
subsequent use of those and other maps (Gregg, 1997). In turn, this will assist
students to learn how to select and use a range of data to answer the questions
posed by both themselves and others (Yates, 2000).
This process of selecting and eliminating information (that is seen to be relevant
to the question posed) is a transformation process which can lead to new
configurations of knowledge (Gregg, 1997). Indeed, the concept of region is
arguably based upon spatially sorting features into similar and dissimilar places
(Gritzner, 2003). This is one way of providing “a context that promotes flexible,
generative use of information within a content area by creating new connections
among the pieces of content” (Gregg, 1997, p. 251). Specifically, when
considering the range of topics and scales studied by Queensland’s Senior
Geography students, it is possible to understand why McKeown-Ice (1994, p. 40)
believes that non-geographers are rarely aware of the “vast” potential offered
through examination of spatial patterns at various scales. In general terms, it is
by emphasising such interconnectivity that geography makes a contribution to
the development of life long learners (Gerber, 1997).
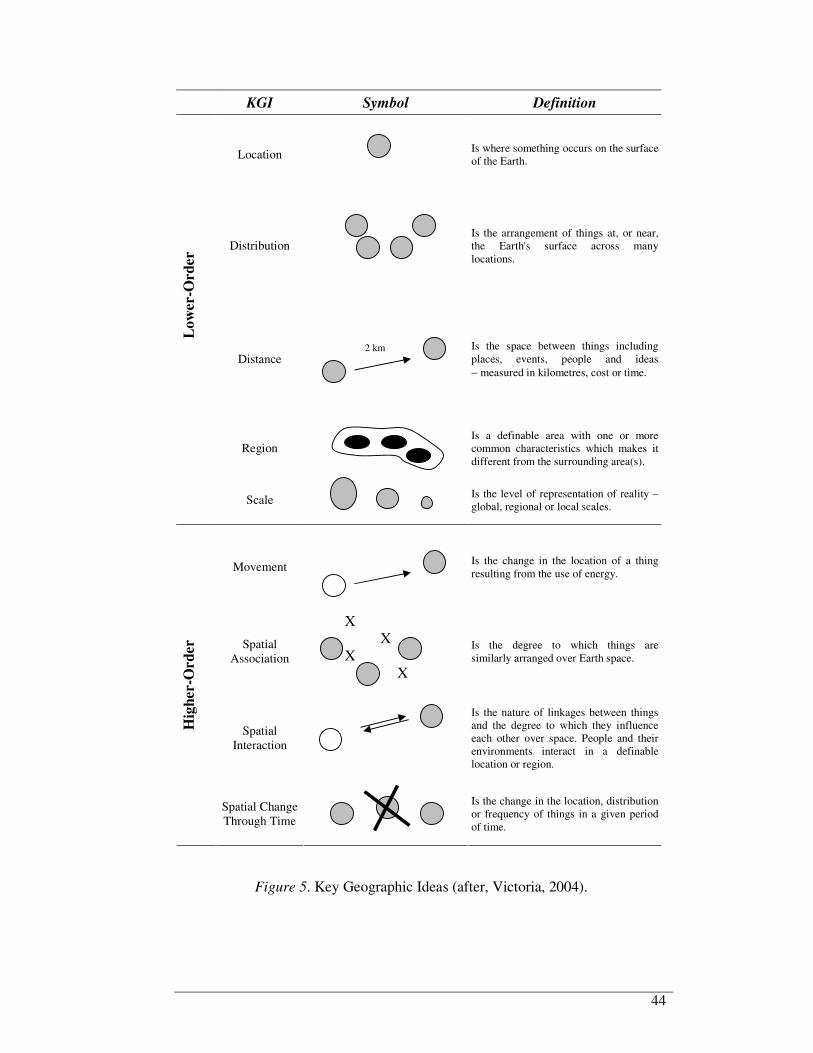
44
KGI Symbol Definition
Location
Is where something occurs on the surface of the Earth.
Distribution
Is the arrangement of things at, or near, the Earth's surface across many locations.
Distance
Is the space between things including places, events, people and ideas
− measured in kilometres, cost or time.
Lo
wer-
Ord
er
Region Is a definable area with one or more
common characteristics which makes it different from the surrounding area(s).
Scale
Is the level of representation of reality – global, regional or local scales.
Movement
Is the change in the location of a thing resulting from the use of energy.
Spatial Association
X X
X X
Is the degree to which things are similarly arranged over Earth space.
Spatial Interaction
Is the nature of linkages between things and the degree to which they influence each other over space. People and their environments interact in a definable location or region.
Hig
her-
Ord
er
Spatial Change Through Time
Is the change in the location, distribution or frequency of things in a given period of time.
Figure 5. Key Geographic Ideas (after, Victoria, 2004).
2 km
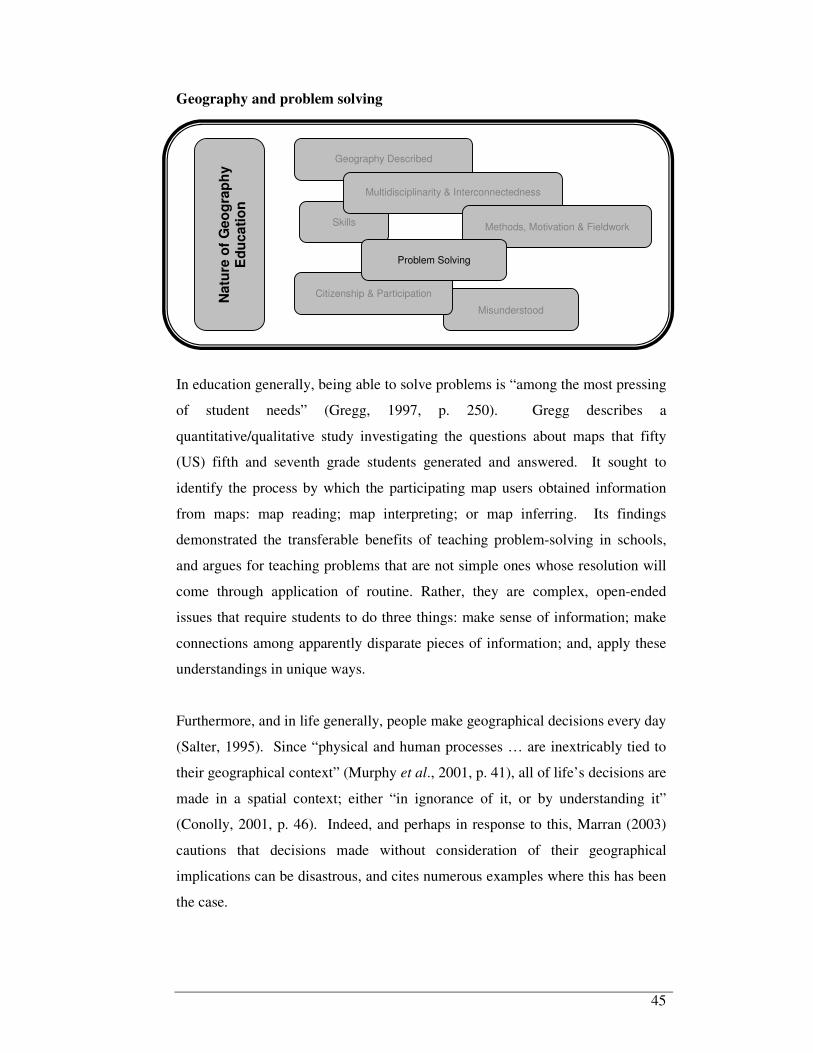
45
Geography and problem solving
In education generally, being able to solve problems is “among the most pressing
of student needs” (Gregg, 1997, p. 250). Gregg describes a
quantitative/qualitative study investigating the questions about maps that fifty
(US) fifth and seventh grade students generated and answered. It sought to
identify the process by which the participating map users obtained information
from maps: map reading; map interpreting; or map inferring. Its findings
demonstrated the transferable benefits of teaching problem-solving in schools,
and argues for teaching problems that are not simple ones whose resolution will
come through application of routine. Rather, they are complex, open-ended
issues that require students to do three things: make sense of information; make
connections among apparently disparate pieces of information; and, apply these
understandings in unique ways.
Furthermore, and in life generally, people make geographical decisions every day
(Salter, 1995). Since “physical and human processes … are inextricably tied to
their geographical context” (Murphy et al., 2001, p. 41), all of life’s decisions are
made in a spatial context; either “in ignorance of it, or by understanding it”
(Conolly, 2001, p. 46). Indeed, and perhaps in response to this, Marran (2003)
cautions that decisions made without consideration of their geographical
implications can be disastrous, and cites numerous examples where this has been
the case.
Misunderstood
Citizenship & Participation
Geography Described
Natu
re o
f G
eo
gra
ph
y
Ed
ucati
on
Skills
Multidisciplinarity & Interconnectedness
Methods, Motivation & Fieldwork
Problem Solving

46
Geography is well-placed to provide solutions because it investigates the
geographic dimensions of society’s problems (de Souza and Downs, 1994). And,
although problem-solving is widely investigated in a range of disciplines (Gregg,
1997), geography is particularly well-suited to contribute to students’ education
in and about problem-solving. According to West (2004b), this is for two
reasons. First, geography’s spatial consideration of both physical and cultural
elements affords it a holistic view of phenomena. Second, because geography is
more analytical than descriptive, it addresses rather than discusses real-world
issues. Dale (1995), among others, concurs. Casinader and Casinader (1994)
explain this more simply, asserting that problem-solving skills are the core of
geography. This is due to two interrelated factors: geography curricula are
concerned with a multidisciplinary body of knowledge of global significance, as
discussed previously; and, problem-solving involves choosing which pieces of
seemingly unrelated information are relevant, to ensure that “sensible
connections are strengthened and non-sensible ones are eliminated” (Gregg,
1997, p. 250). Thus, problem-solving in geography emphasises continued
analysis of spatial and conceptual interconnectivity.
Silver (1994) further defines problem-solving as “both the generation of new
problems and the reformation of given problems” (p. 19). In this regard, the
spatial elements that constituted a problem are transformed rather than
eliminated. Ward (2003) agrees with this point, suggesting that geography
involves both problem-solving and creating products. These products are the
practical solutions that are derived from studying an issue from a geographical
perspective (Murphy et al., 2001). [These authors also offer a critical discussion
of the products derived from investigation of the same issue from the perspective
of other disciplines, including law, politics and sociology] For this, geography
must emphasise “the relations that are developed when a person makes sensible,
intentional decisions based on knowledge, skills and values from a geographical
perspective in particular … situations” (Gerber, 1997, p. 42).
Evidently, geographical education offers the opportunity for students to gain
skills requisite to problem solving. With specific regard to conflict arising from
competing demands for natural resources, Queensland Senior Geography “seeks
47
to explain compare, contrast, evaluate and make decisions about improvements
for current and future use” (Queensland, 1999a, p. 15). One way that geography
curricula can achieve this is by using visual forms of spatial phenomena to
motivate students’ geographic inquiries (McKeown-Ice, 1994).
Investigating spatial phenomena using an inquiry approach leads to more
efficient and effective analyses, a direct consequence of which is the generation
of a “more comprehensive and rigorous conclusion” (Casinader & Casinader,
1994, p. 42). Within Queensland, this approach involves four ‘Key Questions’,
which are commensurate with the definitions of geography cited earlier (e.g.,
Fitzpatrick, 2001; Gritzner, 2002; Howitt, 2002):
1. What and where are the issues or patterns being studied?
2. How and why are they there?
3. What are the impacts or consequences?
4. What is being and could be done?
Adopting an inquiry-based approach has educational benefits. Following his
mixed methodology study of 480 (US) grade 7-12 students’ responses to inquiry
based learning, Klein (1995) concluded that inquiry-based learning experiences
were more meaningful “because they studied current, relevant issues” (p. 364).
However, since geographic inquiry is based on questions, its success demands
that pertinent questions be successfully formulated and answered. However, for
students to ask questions suited to geographic inquiry, they must first have been
taught to ask geographical questions (Yates, 2000). Teaching problem-solving in
a structured way enhances student capacity for geographic inquiry (Casinader &
Casinader, 1994). While geographic inquiry proceeds toward the formulation of
practical solutions, its value is not just in these products, but in the skills that are
honed along the way (International Charter on Geographical Education, 1992).
Reflecting the importance of this process, this Charter recommends that all
tertiary courses should comprise a geographical element since geographical
literacy is essential to quality decision-making (p. 13). Similarly, the [US]
Partnership for 21st Century Skills includes “problem identification, formulation

48
and solution” as one of nine elements constituting its ICT literacy map for
Geography (National Council for Geographical Education, 2004).
Geography’s practical approach to problem-solving enables the prediction of
possible future scenarios (International Charter on Geographical Education,
1992, 2005). This is evident in the final question of the Geographical Route of
Inquiry: What is being and what could be done? (Queensland, 1999a, p. 16,
emphasis added). However, geography also teaches students to recognise that
there is not always one right answer to a problem (Murphy et al., 2001).
Through a quantitative and qualitative study of student performance under
teacher directed and inquiry approaches to learning, Klein (1995) identified that,
in the latter, the lack of ideas for solving problems was a concern for students.
To counter this, through the entire Route of Geographical Inquiry, students are
encouraged to develop the skills of analysis and synthesis to incorporate an
understanding of the issue being investigated with their own values (Healey et
al., 2000). The Syllabus itself states that “investigating issues about which there
is no general consensus provides a very effective means by which students
become aware of the values of different people … [and] understanding of how
the values of different groups and individuals shape their world” (p. 6). Thus
when problem-solving in geography, decisions are “nearly always compromises”
(p. 3).
For these reasons, geography claims to be good at solving complex problems
associated with social and environmental matters, using a wide range of common
forms of communication, and exercising values in situations involving human-
environment interactions (Howitt, 2002; International Charter on Geographical
Education, 1992). To achieve this, Queensland’s Senior Geography emphasises
a thematic issues-based approach moreso than a systematic approach (Gerber,
2001). Hence, by teaching students to analyse current and predict future
situations within a context of investigating real-world issues, school geography
empowers students to “develop more comprehensive responses to the questions
which are posed for them in their future lives” (Casinader and Casinader, 1994,
p. 42). Or, as Howitt (2002) says, “geography … shapes how people imagine
themselves” (p. 7).

49
Geography’s role in the world; citizenship and participation
One of the seven Global Aims of the Queensland Senior Geography Syllabus is
to “develop the knowledge, abilities and ethical commitment to participate as
active citizens in the shaping of the future” (Queensland, 1999a, p. 6). The
concurrence of two factors gives credence to this need: the increased emphasis
on citizenship globally, and the increased ignorance of matters affecting the
globe and its citizens (Gritzner, 2003). Geography serves to address these by
making many valuable contributions to our understanding of the world (Young,
1995). Specifically, the US Geography Education Standards Project views
geography’s contribution as being to
discover and capture [Earth’s] horizons in order to understand how people live
and work to utilise resources. This understanding is more urgently required
than ever for all students because of new global realities – the interconnected,
integrated and interdependent character of our lives” (de Souza and Downs,
1994, p. 33).
If we accept Conolly’s (2000) assertion that educators have the responsibility to
ensure that young people “are adequately provided with the knowledge and skills
which allow them to understand themselves in their society and environment”
then it becomes essential for those educators to understand the nature of the
issues confronting societies and environments (p. 160). According to Howitt
(2002), all global issues confronting contemporary society have a geographical
basis. To support his view, Howitt discusses nine examples, ranging from
Misunderstood
Geography Described
Natu
re o
f G
eo
gra
ph
y
Ed
ucati
on
Skills
Problem Solving
Multidisciplinarity & Interconnectedness
Methods, Motivation & Fieldwork
Citizenship & Participation
50
regional inequality to issues affecting the tourism industry. Gritzner (2003)
further observes geography’s influence in four realms of our daily experience:
environmental (e.g., resources and climate); political (e.g., planning and
zonation); economic (e.g., property values, commodities); and, social (eg
demographic composition).
Investigating such a range of issues geographically equips students to better
understand and interact in their worlds. To elaborate, Walford (1987) states the
“understanding of the dimension of space and its implications for individuals,
groups, and whole nations, is essential to a proper appreciation of many of the
major issues which confront the modern world” (p. 60). Further, “much of
geography’s power lies in the insights it sheds on the nature and meaning of the
evolving spatial arrangements and landscapes that make up the world in which
we live” (Murphy et al., 2001, p. 42). Similar claims are made by, among others,
Howitt (2002).
This investigation of the spatial dimension of observed phenomena is one of the
reasons why Geography is viewed by many as the ideal place for comprehensive
global education within a school’s curriculum (e.g., Murphy et al., 2001;
Rawling, 2000). Another significant factor is that geography education attempts
to engage students critically with their world (Howitt, 2002), in response to
“concurrent globalising and localising tendencies” (Rawling, 2000, p. 210). By
recognising local differences, but within global processes, geography education
teaches students to respect diversity and multiple perspectives (Murphy et al.,
2001). Through this understanding comes added legitimacy of the solutions it
offers. In this way, geography in school serves the role of developing students
who are “responsible citizens and effective leaders in the world that they will
inhabit as adults” (Marran, 2003, p. 43).
However, changes in society have led to changes in what geography involves
(Murphy et al., 2001). The implication is that geography education cannot
remain static. Rather, attempting to make sense of the world geographically
“must be premised on some understanding of changing human and physical
patterns” (Murphy et al., 2001, p. 41). Four years earlier, Cox (1997) asserted

51
that the need for meaningful learning experiences could not be exaggerated. By
meaningful, he referred to experiences that help students to understand the world
that they live in. Or, quite simply, to understand what is where, why there and
why care (Gritzner, 2002).
By linking student learning with actual global issues, geographical education can
in this way become expressed in one’s private life (Gerber, 1997). Perhaps more
significantly, and beyond the importance of earlier arguments for a geographical
education, Spencer (2005, p. 305) observes that,
in ‘doing geography’ with the child, one is participating in a process
which is even more fundamental and therefore more important still:
namely, one is in a humble way facilitating the child’s very personal
development of self-identity which will shape much of their lives, their
values, sense of belonging and self worth.
In this manner, understanding of the KGIs arising through the Geographical
Route of Inquiry, when applied to current and topical issues, engenders the
geographical thinking that is fundamental for citizenship (Fernald, 1996). Thus,
geographical education promotes life-long learning and geographical literacy
(Chiodo, 1997; Downs, 1994; Gerber, 2001; Miller, Keller & Yore, 2005). An
adjunct to this only serves to strengthen the argument for a geographical
education, where a lack of geographical literacy “imposes a significant burden on
the nation, its communities, environments and neighbours” (Howitt, 2002, p. 7).
One particular strength of geography education is its capacity to enhance
environmental education. Gerber (2001) undertook a global survey of
geographical educators from 32 nations in 2000. He investigated, among other
things, the perceived role of geographical education in preparing students for
active citizenship and as a vehicle for sustainability. Interestingly, this study
found ‘strong support’ for the inclusion of environmental education in geography
education; the inclusion of citizenship education received only ‘moderate
support’ (Gerber, 2001).

52
Conolly (2000) agrees that geography plays a “considerable role” in furthering
sustainable management of resources (p. 163). This is because all issues dealt
with by governments can in some way be informed by geographical thinking.
Again it seems that the quality of decision making made by governments may be
influenced by the quality of thinking undertaken by geographers, an idea more
recently supported by Kidman and Palmer (2006). Within contemporary
information economies, this means that “the development as a learner is as
important as mastering knowledge” (van der Schee, Leat & Vankan, 2006,
p.124). When considering this, Conolly (2000) notes that geography education
“might enhance commercial profitability and such areas as environmental
understanding, effective decision-making in spatial contexts and cultural and
resource understanding of overseas markets” (p. 162-163). However, with
reference to the broader influence of geographical study, Slater (1995, p. 5)
concludes that
although geographical studies can contribute to student employability and
usefulness in the economic side of societies, … it has a wider potential in
the life of thinking, critical, independent citizens and human beings who
have lives to live and develop beyond the economic.
Or, more simply put, geography is “learning for living” (Gritzner, 2003, p. 91).

53
Geography: a misunderstood subject
“…no-one really knows what we do” (Year 12 Geography student, in West,
2003a, p. 29).
“Geography has lost its curriculum identity … [which] is the biggest threat to the
continuing contribution of geography in Australian schools” (Rawling, 1997, p.
6). Over a decade earlier, Chiplen (1984, as cited in Bliss, 2006) observed that
“[g]eography appears to be particularly misunderstood and to be singularly
unfortunate in not being able to shed the really obsolete, naïve images of itself”
(p. 158). Bliss reminds us that, over two decades later, “little has changed” (p.
152). Dale (1995) believes that the very name, ‘geography’, is misleading,
since it no longer truly reflects what is done by geographers. In simpler terms,
geography is misunderstood (Greiner, Wikle & Spencer, 2002).
Such misunderstanding of geography may be compounded by limited public
awareness of it (Conolly, 2001a). Moreover, misconceptions about geography
are “based probably on studies of geography in the distant past of the lives of the
people making these claims” (Gerber, 1997, p. 44). More recently, Nick
Hutchinson, Chair of the Australian Geography Teachers Association listed
fourteen reasons for the demise of geography in post-compulsory education in
Australia (Hutchinson, 2006), including the slow response of geography
educators in updating their image and to taking initiatives to move community
thinking about the subject away from the “capes and bays” mentality of past
Citizenship & Participation
Geography Described
Natu
re o
f G
eo
gra
ph
y
Ed
ucati
on
Skills
Problem Solving
Multidisciplinarity & Interconnectedness
Methods, Motivation & Fieldwork
Misunderstood

54
perceptions (p. 195). A specific example of an area where knowledge of
geography is lacking is in the business sector, where few advertised positions
require potential employees to have studied geography (Conolly, 2000).
This misunderstanding about the nature of geography inhibits its future
development (Rawling, 2000). However, this matter is further complicated by
difficulties in defining geography creating added difficulties in communicating
its value (Gritzner, 2002). In the face of these challenges, “community
awareness of geography is vital for national interest, since all contemporary
issues have a geographical aspect” (Conolly, 2000, p. 164). The implication of
misconceptions of the role of geography leads to geographical problems not
being solved by geographers; inappropriate solutions, which may serve to
exacerbate rather than ameliorate issues (Murphy et al., 2001). These authors
suggest that the poor understanding of what geography is (and isn’t) is both a
cause and effect of the subject not carrying “enough intellectual or social clout”
(p. 43).
One factor which contributes to this misunderstanding is the perception that
geography can be defined by its content (Fernald, 2002). Dale (1995) adds that
geography is commonly perceived as an “encyclopaedic discipline” (p. 14).
While Gerber (2001) found that most people see geography as ‘at least
important’, both Fernald (1996) and Hutchinson (2006) assert that the public
image of geography is misinformed. The reasoning for the perception of
geography as being ‘at least important’ could, therefore, be based on an incorrect
understanding of what the subject is. Paradoxically, while the potential
contribution of geography is substantial, this contribution is poorly understood
by people, including those who influence student subject choice specifically, and
curriculum decisions generally (Conolly, 2001a, 2001b; Crabb, 1995).
From the 1960s to 1980s, geography was “regarded as a marginal discipline”
(Murphy et al., 2001, p. 41). In more recent terms, Baldwin (2002) cites three
reasons for the decline in the uptake of Senior Geography in New Zealand across
the decade to, 2001. First, competition from other subjects. Second, concerns
about the relative difficulty in getting high marks, when compared with other
55
subjects. Third, pressure related to limited time to cover essential material. To
this, Stoltman (1997) adds that competition within school timetables compounds
this, while Hutchinson (2006) adds that the perception that other social sciences
contribute more to future employment than did geography does likewise.
Within the context specifically addressed in this thesis, synergetic focus groups
of students studying Senior Geography at one Queensland school confirmed
these suggestions (West, 2003a, 2006c). Notably, some students expressed
frustration with the common misconceptions held by others and believed that
other, perhaps more clearly defined subjects, out-competed geography because of
these. While they did not emerge as distinct categories of description within that
study, my personal experience is that students in Queensland are often concerned
about what they believe is the disproportionate amount of time required to
complete Geography related tasks, and the difficulty of getting high marks when
compared with other subjects.
Following this concern, a two-tailed Wilcoxon signed-ranks test was used to
evaluate whether Geography results were, indeed, significantly different from
other results in Queensland’s senior curriculum. This investigation revealed that,
between 1998 and 2003, significantly lower results were awarded for Geography
than in some other Subject Classes. Distribution of levels of achievement also
suggest that high results are less common in Geography than most other subjects.
It is almost a truism that the subjects offered by schools are influenced by
external factors (Alexander, 2006; Slater, 1995). Curriculum thus reflects the
things that are considered socially, economically and educationally desirable
(Casinader & Casinader, 1994). Hence, “winning a place” in the curriculum
often requires the utilitarian and/or vocational benefits to be stressed more than
the contribution of the subject to a broad education (Rawling, 1997, p. 6).
Competition within the curriculum is discussed by a number of other authors,
many of whom also identified shifts toward vocational pressures as the major
competitive disadvantage of geography (Bliss, 2006; Gerber, 1995a, 2001;
Rawling, 2000; Smerdon, 2006). Within this climate, structural and
governmental changes influence what is taught in school geography, but these
56
are not necessarily based on a true understanding of what the subject offers, by
way of contributions to vocational and general education (Berry, 1996;
Hutchinson, 2006). Indeed, it is ironic that while much of school administration
is motivated by increasing demand for vocational emphases, this threatens
subjects such as geography that offer tremendous contributions to the world of
work (Slater, 1995). This is where consideration is needed for ways of
publicising the role of geography and its contributions, especially in business
(Conolly, 2000).
However, while most authors view competition as a threat to the future of the
subject (e.g., Bliss, 2006; Hutchinson, 2006; Slater, 1995), Young (1995)
believes that threats from other disciplines and multidisciplinary offerings should
not be a concern, but rather should be an impetus to “make the best use of our
skills” (p. 8). However, the reality is that, in universities, Gerber (2001) found
“many degree programs do not see the relevance of studying geography in their
curricula” (p. 353), citing law, medicine and engineering as areas that have a
readily identifiable spatial element.
Furthermore, it is perhaps not surprising that the number of students studying
geography has declined, with the number of schools offering geography also
declining (Berry, 1996). In New South Wales, less than 20% of students studied
Geography at a post-compulsory level in 1998, while about 50% studied it in the
compulsory years of secondary school (Conolly, 2000). Student enrolment in
Senior Geography in Queensland has also declined steadily. Table 4 illustrates
this, where the proportion of Grade 12 students studying geography has declined
from 18.5% in 1993 to 10.7% in 2006. Perhaps interestingly, the proportion of
students studying Senior Geography who are OP-ineligible has increased from
20.6% to 33.7% during the same period.

57
Table 4
Queensland Year 12 student enrolment data, 1993-2003 (Source: Queensland,
1999b; 2004a; 2004b; 2004c; 2006a; 2006b; 2007a; 2007b).
OP eligible
OP ineligible
Studied Senior
Geography
Year No.
students Total % Total % Total %
1993 34436 27336 79.4 7100 20.6 6532 18.9
1994 33391 25985 77.8 7406 22.2 6255 18.7
1995 32224 25118 77.9 7106 22.1 5756 17.9
1996 32763 24893 76.0 7870 24.0 5648 17.2
1997 33822 25958 76.7 7864 23.3 5512 16.3
1998 35394 26736 75.5 8658 24.5 5741 16.2
1999 37032 27750 74.9 9282 25.1 5750 15.5
2000 38729 28293 73.1 10436 26.9 5526 14.2
2001 38441 27812 72.3 10629 27.7 5312 13.8
2002 39314 28172 71.6 11142 28.4 5157 13.1
2003 39359 28545 72.5 10814 27.5 5170 13.1
2004 38471 27235 70.7 11236 29.3 4590 11.9
2005 38953 27025 69.4 11928 30.6 4325 11.1
2006 39579 26230 66.3 13349 33.7 4241 10.7
In the face of such a steady decline, it is perhaps worth considering impediments
to the subject. While much has been written on this topic (see, for example,
Bliss, 2006; Hutchinson, 2006; Smerdon, 2006), Conolly (2000) succinctly cites

58
five constraints confronting geography education: institutional; political;
academic; business; and media. He highlights that local government has no
legislative role in education, despite this scale providing many opportunities for
geographical investigations; an opportunity that is clearly implied in the
Queensland Senior Geography syllabus, with its prescription of both field studies
and studies of phenomena at local scales. Rather, national interests are
influencing state education policy through funding, which emphasises, among
others, integrated curriculum which presents no overt emphasis on geography,
such as Civics Education and Studies of Society and Environment. Similar
concerns are addressed by, among others, Freeman (2006), Hutchinson (2006),
Kriewaldt (2006) and Smerdon (2006). The growth in student enrolment in OP-
ineligible courses of study, from Table 4, reflects recent emphases upon
vocational education and training. Both of these trends add further credence to
the suggestion that, quite simply, some students never study geography (Conolly,
2000); and to Ballantyne’s (1996, p. 180) question, “how can geography
educators influence students if they are not exposed to the subject?”
If geography is going to keep its place in the secondary curriculum, it has to be
taken seriously by society (Gerber, 2001). Of course, an adjunct to this is that
the subject needs to be in the curriculum in order to demonstrate its value.
Ballantyne (1996) investigated the reasons why Queensland Year 11 students did
or did not include Senior Geography in their subject mix. Following statistical
analyses of the questionnaire responses of 169 students who did select
Geography and 174 who did not, he concluded that two ways to affirm the
subject’s future “would be to highlight its perceived general interest value and to
promote its relevance to the world of work” (p. 179). He also recommends that
“institutional factors which influence students’ exposure to and familiarity with
the subject” be addressed (p. 179). Similarly, in response to the increasingly
competitive environment, Healey et al. (2000) assert that geography’s
transferable skills should be emphasised. More specifically, Baldwin (2002)
provides five mechanisms by which the profile of geography can be raised:
1. Interesting teaching strategies (e.g., cooperative learning, various
resources, catering for different learning needs);

59
2. Use of ICTs;
3. Celebrate and publicise;
4. Events to promote subject; and,
5. Link subject relevance to contemporary issues (e.g., investigate current
local issues).
In this respect, Slater (1995) believes that the future of geography will be
determined by student perceptions of the subject’s value in terms of knowledge
and skills ability. To address this, the discipline needs to be visibly credible
(Crabb, 1995; McInerney, 2006; Smerdon, 2006).
Discussion thus far has focused on the benefits of a geography education, rather
than the influence of selected teaching approaches in determining the extent to
which those benefits can be attained. Since the way information is taught
influences how the information becomes available (Gregg et al., 1997),
consideration of teaching methods and learning experiences will also influence
the extent to which the potential benefits of a geographical education, as
discussed, are realised within classrooms.
Teaching Geography: Methods, motivation and fieldwork
It is obvious from discussion thus far that a geographical education offers many
benefits. However, as with all subjects, “motivating and challenging pupils is a
real concern of many teachers” (van der Schee et al., 2006, p. 132). Perhaps in
Misunderstood
Citizenship & Participation
Geography Described
Natu
re o
f G
eo
gra
ph
y
Ed
ucati
on
Skills
Problem Solving
Multidisciplinarity & Interconnectedness
Methods, Motivation & Fieldwork

60
recognition of this, geography education is shifting from a teaching to a learning
focus (Gerber, 2001). This is because sound geography teaching experiences
must be offered so that students can adequately respond to “present and future
challenges” (Stoltman, 1997, p. 37). Indeed, “[geography] continues to lead in
the creation and implementation of pedagogic innovation” (QAA, 1999, as cited
in Healey et al., 2000, p. 4). [The impact of recent reforms of geography
education on teaching method and resources are outlined by Reinfried (2001) and
Hutchinson (2006), among others.] Teaching and learning experiences in
geography are as broad as its content and skills, e.g., laboratories, practical tasks
and reports associated with the physical sciences, and seminars and essays
associated with the social sciences and humanities (Healey et al., 2000). The
present discussion will focus on several aspects of the teaching-learning process:
ICT, relevance, thinking skills and fieldwork.
In simple terms, Gerber (1995a) noted a decade ago that we can expect that, if
students are exposed to richer experiences elsewhere, they will not choose the
geography classroom. He further noted that geography’s emphasis on
multimedia also provides opportunities for it to outcompete other school
subjects; it has a “comparative advantage as a field of study where visuals
provide the raw material for learning” (p. 55). Although they were made a
decade ago, Gerber’s observations remain valid, especially with respect to the
tools used in geography classrooms changing to reflect an increased emphasis on
technology (p. 52). These observations were more recently confirmed by Healey
et al. (2000), who noted that the influence of such changes toward resource based
learning and ICTs have driven many pedagogical changes in geographical
education.
Indeed, there is little doubt that increased technological capacity has increased
both what we know and the rate at which we acquire more knowledge about the
earth (Gritzner, 2003). Therefore, it appears that truth still surrounds Gerber’s
(1995a) decade old claim that “success in geography must involve a response to
technology that will enable all of us to make maximal use of technology in our
lives” (p. 50). Dale (1995) believed this use of technology would empower us to
resolve spatial issues in more sophisticated ways. From an educational point of

61
view, it was expected then (as now) that the learner would exert greater control
over the learning process as technology increases (Chalmers, 2006; Gerber,
1995a). This suggestion became apparent over 15 years ago, when Gerber
(1992a) employed a survey methodology with 193 geography educators from
fourteen nations to determine their perception of, among others, the benefits
associated with the use of technology: more teaching strategies; increased student
interest in the lesson; less preparation and delivery time; improved visualisation
by students of difficult concepts; up to date data; more and better individualised
learning; and easier data management. However, even a cursory review of
literature since then reveals that these claims remain highly contested (see, for
example, Godfrey, 2001; Montgomery, 2000; Roschelle et al., 2000; Turner and
Beeson, 2003).
The importance of ICT for geography to establish and maintaining a profile in
Queensland is discussed by Smerdon (2006). More generally, its role in
geographical education is discussed at length by Gerber (1995a). In brief, it is
founded on three interrelated factors. First, ICT are an integral element of
student lives. Second, and as discussed earlier, ICT have a strong graphical
component. Finally, learning activities require relevance for intended learners.
By corollary, it is logical then to presume that “the geography classroom, if it is
to respond to learners’ needs, will have a strong graphic and technological
element” (p. 55). However, Miller, Keller and Yore (2005) offer a word of
caution following their on-line survey of 80 predominantly North-American
‘expert’ geography educators to identify desirable elements of a curriculum that
is expanded to facilitate digital information literacy. They concluded that: given
existing concerns about the place of geography in the K-12 curricula, it
may be a luxury, therefore, to worry about strengthening digital
geographic information literacy when the curricula already struggle to
find sufficient emphasis for basic geographic literacy and for fundamental
concepts and abilities of geographic information handling (p. 256).
Further discussion is provided by Bednarz and Audet (1999), Keiper (1998),
Lloyd (2001), Lo, Affolter and Reeve (2002), and, Mara Chen (1997).
62
Meaningful learning can be encouraged through activities that involve reflective
thinking, including “consistent application of the skills associated with logical
and critical thinking”, and analysis of values in context (Cox, 1997, p. 50). The
potential for increasing student motivation comes from recognising the relevance
of geography’s content to the real-world, and not just in a vocational context
(Rawling, 1997). To this, Ballantyne (1996) recommended that the content
selected for geography lessons be “both relevant and current” and “demonstrate
the practical relevance of the subject to everyday living and problem solving;
make explicit the connections and the world of work; and enable a decrease in
the amount of writing undertaken in class” (p. 180). Real-world issues,
especially local studies, encourage student empowerment (Klein 1995).
Increasing student empowerment requires that students be involved in inquiring
into and addressing local problems (Klein 1995). This can be encouraged through
the involvement of parents, local industry, media and community organisations,
making geography a more attractive choice for students and validating the work
being done (Conolly and van Norden, 2001). Such relevencies make learning in
geography an active process.
This importance of active learning in geography education was noted in Sack and
Petersen’s (1998) investigation of an opportunistic sample of 1400 grade 4, 5 and
6 students in a US district that emphasised geography in its curriculum. Student
attitudes were surveyed, with the only statistically significant difference between
the class that rated geography highly and the one that rated geography poorly
being active teaching methods. They concluded that by actively involving
students in geography lessons, their attitudes might improve (p. 130). Rawling
(1997) agreed, citing the involvement of fieldwork, school-industry links, use of
social, economic and environmental issues as starting points for inquiry, active
learning processes and critical reflection as means of improving the quality of
geography teaching.
In a related vein West (2003a, 2006) investigated conceptions held by
Queensland Senior Geography students of the role of geography in their futures.
Emerging from analyses of the synergetic focus group discussions were five

63
categories of description. Of significance for the present discussion were four of
these categories: geography as a misunderstood subject; geography as an
enabling subject; geography as a form of general knowledge; and, geography as a
means of interacting with the world. This investigation revealed a generally
positive view held by students toward geography, arising from their perception
that studying the subject presented some immediate and future value for them
and the societies in which they participate. Although it predates the current
Senior Geography syllabus, Ballantyne’s (1996) investigation discovered a
similar result, with 75% of geography students indicating that they would
recommend the subject to a friend for reasons of either interest or practicality.
For many students, one of geography’s more interesting aspects is fieldwork
(Ballantyne, 1996; Conolly and van Norden, 2001). According to Bliss (2006),
fieldwork is “an essential part of the study of Geography. It is a geographical
tool that facilitates the understanding of geographical processes and geographical
inquiry” (p. 157). Many authors agree, e.g., Kriewaldt (2006) and Smerdon
(2006). Most geography fieldwork involves projects: collecting information by
observing, collecting and measuring (Healey et al., 2000). Therefore, when it
includes fieldwork, geography in schools readily encompasses multiple
intelligences, allowing “students to develop skills in a variety of intelligences not
always utilised in a classroom context” (Ward, 2003, p. 33). Fieldwork also
allows students to develop important skills in group work and individual
initiative (Healey et al., 2000), and to experience first hand the transferability of
what they learn in class (Ballantyne, 1996).
This latter idea was more recently explored within a British primary school
context. Halocha (2005) collected and analysed the work of 150 eleven year olds
following their participation in fieldwork. Students were asked to represent what
they had thought they learnt during the field visit. Initial results of this
investigation revealed students made clear connections between concepts
introduced in class and those experienced during field studies.
Atkin (2003) further suggests that immersion in fieldwork is an effective way to
arrest student apathy in geography because it stimulates their curiosity, such as

64
when investigating local issues. By involving them in fieldwork and practical
tasks at local levels, students’ interest in and understanding of global issues are
promoted (Klein, 1995). Specifically, he says, “local inquiries can help students
to link global issues to their own lives and build their democratic citizenship
skills” (p. 366).
In terms of skills development, Hermann (1996) provides a lengthy summary of
the benefits of fieldwork to graphicacy, and specifically to map-reading skills.
Undertaking fieldwork in the students’ local areas enables them to “understand
maps from an experiential perspective” (p.163). Student conceptualisation of
thematic maps is better when they have experienced maps of the local landscape
while functioning within that landscape. Further, fieldwork using maps allows
students to transfer their experience to other maps, such as those at larger scales;
student knowledge and understanding are deepened. The use of maps in
fieldwork is supported by numerous others (e.g., National Research Council,
2006), including Gerber (1995a), who asserted that graphic and technology
literacies should be integral to geography education, not discrete components of
it.
However, time and other limitations affect the amount and quality of fieldwork
that is undertaken (Berry, 1996; Smerdon, 2006). Engaging students in local
inquiry does also require the support of others, including school administration,
parents and community (Bliss, 2006; Halocha, 2005; Klein 1995). Also, from
my own experience, organising such experiences such that they provide benefits
in line with syllabus requirements and are enjoyable for students requires an
understanding of the inquiry process as it can be applied to the issue being
studied. This is an experience shared by several contributors to the recent Forum
about “Geography and Geographical Education in Australia”, published by
International Research in Geographical and Environmental Education (e.g.,
Kriewaldt, 2006; Smerdon, 2006).
Notwithstanding the apparently positive perception of students to studying
geography and undertaking fieldwork, Crabb (1995) argues that the “pleasure
and excitement that comes from engaging in geography has to be introduced in

65
school” (p. 9). However, in Sack and Petersen’s (1998) attitudinal study,
described above, the positive attitude of geography teachers to their subject was
not reflected in the attitudes of their students. Since the teacher’s approach to the
classroom influences the quality and quantity of meaningful learning that occurs
(Cox, 1997), this could be due, at least in part, to Murphy et al.’s (2001)
observation that few Australian secondary teachers of geography possess
sufficient training and/or enthusiasm to impart enthusiasm into their students.
This is a claim echoed by Fernald (2002) and Robertson (2004), both of whom
note that many teachers have had little or no training specific to geography
and/or geography teaching, and that they are therefore unaware of its specific
methodology. [Such a statement is not surprising given the declining number of
tertiary institutions that offer Geography methodology within their educational
faculties (Bliss, 2006).] It is important, then, that geography teacher training
must develop competence in teaching geography as well as geography skills and
enthusiasm (Ballantyne, 1996; Hutchinson, 2006; Rawling, 1997). Similarly,
Sack and Petersen (1998) and Kidman and Palmer (2006) call for existing and
potential geography teachers to receive training that better equips them to teach
actively.
However, the nature of that training must be based on an understanding of the
influence of different approaches to geographical education on students. Calls
for empirical research into this have been made for a long time. In 1996, Fernald
(p. 3) claimed that research into the methodology of geography and geography
education will assist teachers to develop more meaningful learning experiences.
This reflects the many calls made before and since (e.g., Baker and Bednarz,
2003). Similarly, in response to increasing opportunities presented through
technological advancement, calls are being made for investigation into the
potential influence of newer technologies on geographical education. And it is to
this that this discussion will now turn.

66
Geographic Information Systems
One tool that has experienced transformation arising from advancement in
computer technologies is geographical information systems (Baker and White,
2003; Wilder, Brinkerhoff & Higgins, 2003). In parallel with this has been the
growing interest of educators in the potential of GIS within schools. Indeed,
Wiegand (2001) has been so bold as to claim that GIS represent the “single
biggest contribution geographers have made to society and economy since the
Age of Discovery” (p. 68).
However, understanding its likely educational impacts first requires that GIS be
defined. This section will define GIS in terms of what it is and what it is not, and
provide an historic overview of its role in education. Its potential contribution to
student learning will then be evaluated through discussion of how its use
influences inquiry based learning, student motivation and vocational opportunity.
Five issues that affect the uptake of GIS in schools will also be reviewed:
curriculum; teacher confidence; time and data; computers; and, access. Finally,
this chapter will conclude with an outline of questions arising from the literature
and specific directions of the present study.
GIS: What it is and isn’t
Computers
Route of Geographical Inquiry
Student Motivation
Role in Education
Vocational Opportunity
Curriculum
Teacher Confidence
Access
Geo
gra
ph
ic I
nfo
rma
tio
n
Syste
ms
What it is and isn’t
Student Learning
Time & Data
Issues Affecting Use
67
GIS unite spatial data that can somehow be referenced by geographic
coordinates. They are “a collection of computer hardware, software, geographic
data, and personnel designed to efficiently capture, store, update and
electronically manipulate, analyse and display all forms of geographically
referenced information” (ESRI, 1991, pp. 1-2). More recently, Pun-Cheng and
Kwan (2001) similarly defined GIS as “a system of hardware, software and
procedures designed to support the capture, management, manipulation, analysis,
modelling and display of spatially-referenced data for solving complex planning
and management problems” (p. 88). Comparable definitions are offered by
Gerber (1995a), Schuurman (2004) and West (2003b).
In recent years, however, GIS has become more synonymous with just the
computer software able to store and use data describing places and patterns on
the earth’s surface. Hence, for the current investigation, GIS is considered to be
the software, and its associated digital data. Although possessing various
degrees of sophistication and application, all GIS perform essentially the same
function: encoding, management and manipulating spatially referenced data
(Curran, 1985; West, 1998a). Reflecting what it sees as the inadequacy of many
definitions in omitting to “capture the essence of the technology and its social
implications”, the [US] National Research Council (2006, pp. 158-9) defines GIS
as “integrated software systems for the handling of geospatial information; for its
acquisition, editing, storage, transformation, analysis, visualisation, and indeed,
virtually any task that one might want to perform with this information type”.
It is important to clarify that GIS is not multimedia computer software; it is but a
single component of a multimedia environment. However, it is similar to that of
multimedia, where “the unique capability of …linking together many disparate
pieces of information on a single screen can dramatically simplify the
information-gathering process, giving the student more time to analyse and think
about the information” (Kam, 1996, p. 206). In this regard, GIS are tools that
access data from a variety of sources and in a variety of formats, and which can
be displayed in an equally large array of formats (Gerber, 1995a; Pun-Cheng and
Kwan, 2001).

68
The way GIS store data is fundamental to an understanding of its educational
potential. GIS store sets of related data in layers that are referenced to
geographic coordinates, e.g., latitude and longitude. This synchronicity allows
different data types to be integrated, such as census, satellite, demographic and
economic information (Langley, 2001). Langley also suggests that GIS’
simultaneous mapping of multiple layers facilitates a greater understanding of the
relationships by enabling rapid complex spatial analyses of datasets to be made
(p. 93).
Beyond enabling “more accurate and meaningful analyses of geographical
phenomena” (Pun-Cheng and Kwan, 2001, p. 90), such overlay maps also enable
the results of complex analyses to be rapidly summarised and presented to
various, “non-expert audiences” (Langley, 2001, p. 95). Langley continues to
emphasise that the visual summaries of GIS “mean much more to us than tables
of numbers, for example” (p. 97). In this respect, GIS’ capacity to unite spatial
features with more descriptive information engenders its seemingly greater
utilitarian value, when compared with traditional paper maps (Pun-Cheng and
Kwan, 2001).
Table 5
Comparison of the system requirements of ArcView GIS (with common Windows
NT 4.0, or higher, platform) (ESRI, 2007).
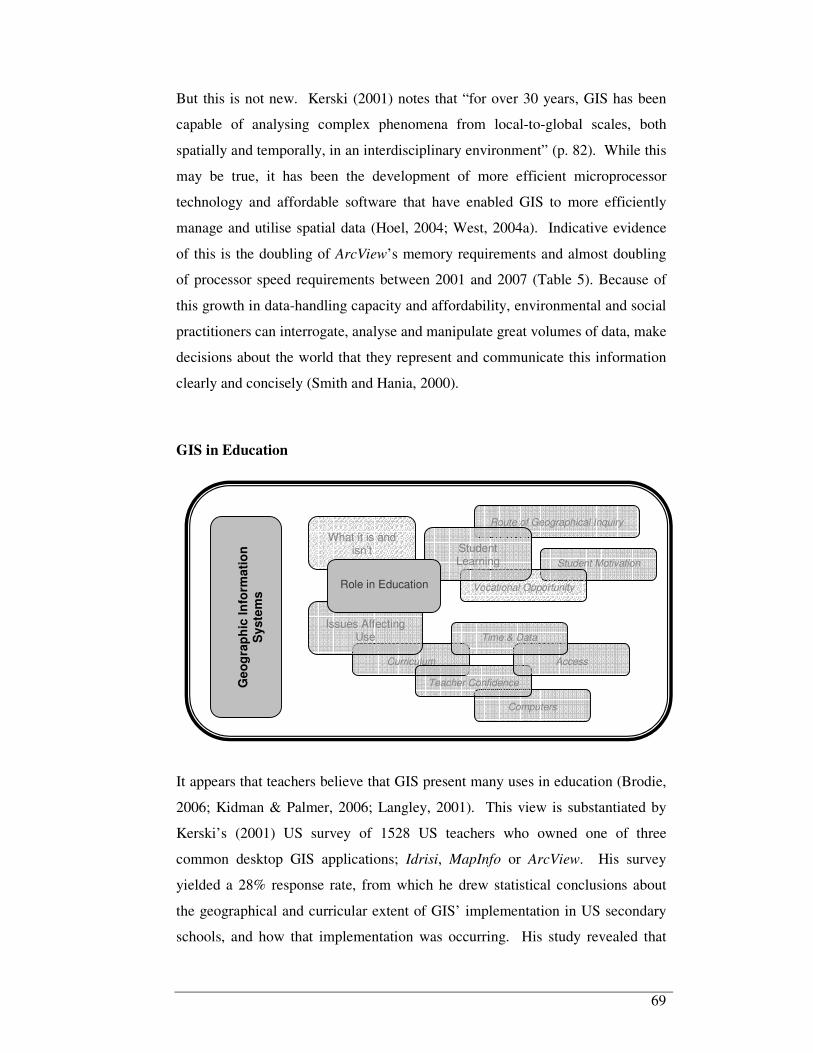
69
But this is not new. Kerski (2001) notes that “for over 30 years, GIS has been
capable of analysing complex phenomena from local-to-global scales, both
spatially and temporally, in an interdisciplinary environment” (p. 82). While this
may be true, it has been the development of more efficient microprocessor
technology and affordable software that have enabled GIS to more efficiently
manage and utilise spatial data (Hoel, 2004; West, 2004a). Indicative evidence
of this is the doubling of ArcView’s memory requirements and almost doubling
of processor speed requirements between 2001 and 2007 (Table 5). Because of
this growth in data-handling capacity and affordability, environmental and social
practitioners can interrogate, analyse and manipulate great volumes of data, make
decisions about the world that they represent and communicate this information
clearly and concisely (Smith and Hania, 2000).
GIS in Education
It appears that teachers believe that GIS present many uses in education (Brodie,
2006; Kidman & Palmer, 2006; Langley, 2001). This view is substantiated by
Kerski’s (2001) US survey of 1528 US teachers who owned one of three
common desktop GIS applications; Idrisi, MapInfo or ArcView. His survey
yielded a 28% response rate, from which he drew statistical conclusions about
the geographical and curricular extent of GIS’ implementation in US secondary
schools, and how that implementation was occurring. His study revealed that
Computers
Route of Geographical Inquiry
Student Motivation
Vocational Opportunity
Curriculum
Teacher Confidence
Access
Ge
og
rap
hic
In
form
ati
on
S
yste
ms
What it is and isn’t
Student Learning
Time & Data
Issues Affecting Use
Role in Education
70
88% believed that GIS made a “significant contribution to learning” (p. 79).
Also found from this study was that teachers’ own “descriptions of lessons in
which they use GIS illustrate the appeal, versatility and applicability of GIS in
education” (p. 78).
In 1999, more than 500 000 ArcView users existed globally. Of these, fewer than
1500 were educators (ESRI, 1999, as cited in Kerski, 2001). Of the 422 teachers
who responded to Kerski’s study, only 5 of them had used it 10 or more years
beforehand. By contrast, the number of users had increased by 155% to 138 in
the two years preceding the survey (Kerski , 2001). This increase in the number
of schools which own GIS is, in large part, due to increased technological
capacity to handle spatial data (Pun-Cheng and Kwan, 2001). Of course, as with
Kerski’s findings, possessing GIS is not a certain indicator of its use.
Within schools, Fitzpatrick (2001) offers a valuable summary of GIS’ recent
role. He notes that GIS has been used in many ways, which are largely
influenced by local, state and federal curriculum requirements, including:
� printing maps;
� collection and collation of local data;
� as an enrichment tool for some students;
� cooperative and collaborative learning in small groups; and,
� in whole class tasks using computer laboratories for real-world
tasks.
This summary reflects the descriptions of GIS use made by many other authors
(see, for example, Dascombe, 2006; Kidman & Palmer, 2006; McInerney &
Shepherd, 2006; Turner and Beeson, 2003; West, 1998a, 2006; Wiegand, 2003;
Wilder et al., 2003). It also mirrors the range of applications in Australian
schools, a sample of which is shown in Table 6. According to Langley (2001),
such a variety of GIS’ applications reflects the extent of geographical
information present within the educational environment.

71
Table 6
Sample GIS activities undertaken in Australian secondary schools.
School (State) Project Description Source
Blackheath & Thornburgh
College (Qld)
Formulation of Burdekin Rangelands Strategic Plan
West (2004a)
Caroline Chisholm High School (ACT)
Assessment of the potential impact of geohazards, such as earthquakes, at their school
Kids Map Hazards in Space for a Day (2003)
Coffs Harbour High School (NSW)
Development of a rejuvenation plan for a nearby sand dune habitat
Personal Communication
Findon High School (SA)
Development of local area disaster plan
McInerney (2003)
Latrobe High School (Tas.)
Deciding the best location for parent-teacher night interviews
Tasmania (2003)
Presbyterian Ladies College (Vic.)
Analysis of national membership and fundraising outcomes for Amnesty International and Cancer Council
Beeson (2006)
Pimlico State High School (Qld)
Investigating the impact of graffiti in the local area
Jenner (2006)
However, while this variety of data creates an equally wide array of applications,
this seemingly unlimited potential of GIS’ applications may create limitations to
its use. Pun-Cheng and Kwan (2001) argue that, in spite of its increased
accessibility, GIS’ use in schools has been met with “hesitation” (p. 90). Kerski
(2001) offers a possible explanation, arguing that “multiple pathways, methods,
and curricula exist, rather than a single entry point” (p. 81). This may explain his
further observation that GIS in education has not yet been “institutionalised,”
with few teachers programming much more than a few lessons, let alone an
entire curriculum (p. 81). Interestingly, some apprehension regarding GIS' use
within geography in Australia's Northern Territory is derived from the belief that
it “will be difficult to restrict GIS exclusively to geography due to its wide
application across the curriculum” (Battalis & Boland, 2006, p. 191).

72
In response to such apprehension, Fitzpatrick (2001, p. 87) suggests that
accelerated uptake and use of GIS in schools will follow from four things:
1. increased teacher experience using computers in general;
2. increased access to ICT hardware;
3. increased adult spatial literacy skills; and,
4. increased public support for “authentic activities”.
In 1995, Nellis asserted that the future of geography’s success was reliant upon
the development of spatial technologies. That view was supported by Salter
(1995), who added that the most useful technology in geography will enable the
development of skills in spatial observation. Spatial technologies have indeed
developed in the score years since Nellis and Salter made their assertions. So too
have a range of theories about GIS’ potential educational benefits. Yet, the
extent to which enhanced spatial technologies such as GIS do actually influence
student learning, and the manner in which they will do so, remains unclear.
Perhaps greater clarity in these regards would engender geography educators
with the confidence to employ GIS in their own learning sequences. The next
section of this literature review will address such aspects.
GIS and Student Learning
Computers
Route of Geographical Inquiry
Student Motivation
Role in Education
Vocational Opportunity
Curriculum
Teacher Confidence
Access
Geo
gra
ph
ic In
form
ati
on
S
yste
ms
What it is and isn’t
Student Learning
Time & Data
Issues Affecting Use
73
Because it enables large volumes of non-sequentially related data to be united
(Kam, 1996; West, 1998a), GIS can be used as an “integrative tool” that bridges
traditional curriculum/discipline areas (Fitzpatrick, 2001, p. 87), a point with
which both Gerber (1995a) and Baker (2005) concur. However, to enable
students to reach the level of competence to identify patterns of spatial
phenomena with GIS, they must first be assisted in mastering basic skills in the
use of the software (Baker, 2005; National Research Council, 2006); supporting
later, “more elaborate studies” (Fitzpatrick, 2001, p. 85). In this respect, Sui
(1995) noted some years ago, and Baker (2005) reminded us more recently, that
GIS education essentially involves two aspects: teaching about GIS and teaching
with GIS. The teaching about GIS involves students learning how to use it. The
teaching with GIS involves students using GIS to learn.
This raises an issue associated with GIS. Teachers using it do not control
everything that is being learned by students while using GIS (Dascombe, 2006;
Gerber, 1995a; Kidman & Palmer, 2006). There are two adjuncts to this. First,
students can be empowered to create their own learning experiences and
outcomes, with varied consequences. Second, failure to master basic software
procedures may limit their capacities to achieve even the most rudimentary of
spatial data manipulation (West, 1998a).
Perhaps more promisingly, West (1998a, 2003b) noted that, while using GIS for
extended investigation following the geographic route of inquiry, students may
proceed through tasks of differing levels of complexity and at rates
commensurate with their own levels of both spatial and software literacy. This
concurs with Gerber’s (1995a) earlier suggestion that GIS allows different
students to investigate different issues in different ways, using different sets of
data and analysing different combinations of data (e.g., graphs, maps, table, other
linked information), generating results that possess a similarly diverse range of
output.
The implications of this versatility are discussed by Fitzpatrick (2001). He
believes that when students are freed from teacher prescription of GIS tasks, they
are able to explore quite a range of relationships, not just the ones intended by

74
the teacher, and not just the ones that the teacher may have deemed most
important. Indeed, he suggests, once students move beyond simple data display,
their use of GIS allows them to “explore the patterns that appear” independently
(p. 86). On this basis, he concludes that “students given the encouragement to
explore where their minds and the data allow can wander for away from where
the teacher has planned” (p. 86). In more general educational terms, Alexander
(2006) believes that the provision of such meaningful choices within tasks
empowers, motivates and equips learners, but only when teachers are prepared to
relinquish some of the control that they have traditionally held over classrooms.
Through such an approach, “greater student engagement, interest and also greater
independence and self-direction in thinking [emerge when tasks] are truly open-
ended … and the required decision making is more likely to involve students
deeply with the content in a way that encourages thinking” (Richhardt, 2002, p.
15).
ESRI prefaced this a decade ago when they emphasised the advantage to teachers
of engaging in more risk taking and adopting more of a facilitator role when
using GIS (ESRI, 1995). Kerski’s (2001) findings were consistent with this,
where GIS’ adoption was most likely to be by those “who value an open-ended,
exploratory approach to learning” (p. 83). Also consistent with this view in
general terms were the personal accounts of contributors to the recent Forum
section in International Research in Geographical and Environmental Education
about “Issues Affecting GIS’ Implementation in Australian and New Zealand
Schools” (see, for example, Beeson, 2006; Brodie, 2006; Kidman & Palmer,
2006; Meaney, 2006; McInerney & Shepherd, 2006)
Possibly because of this, Fitzpatrick (2001, p. 87) observes,
those teachers who habitually challenge students to go out and forage for
knowledge among real-life conditions and experiences are much more
likely to engage the full power of GIS. Those teachers who seek the more
predictable path and characterise teaching as the delivery of knowledge
are less likely to use it effectively.

75
Furthermore, those teachers who fall into Fitzpatrick’s latter group are likely to
find themselves avoiding data, hardware and software issues more so than
pursuing “the important issues of inquiry process and analysis of the data”
(Baker, 2005, p. 48).
On this basis, it is perhaps not surprising that Fitzpatrick also observed that
teachers who used GIS most were not those who had the best knowledge of it.
Rather, they possessed sufficient small understanding to develop the confidence
to establish for students “a visible goal, and then stand back” (p. 87). Or, as a
teacher said a decade ago, “Nothing works the first time. Don’t get frustrated –
go with it and learn with your students. Be amazed at what the students will do
that you never in a million years would have thought of” (ESRI, 1995).
GIS and the Route of Geographical Inquiry
As discussed earlier, much of contemporary school geography deals with
decision-making (Casinader & Casinader, 1994; Fitzpatrick, 2001; Gregg, 1997;
Gritzner, 2002; Howitt, 2002; McKeown-Ice, 1994; Murphy et al., 2001). The
relationship between decision making and GIS has been discussed by West
(1998a, 1999, 2003b). Since decision-making always occurs in the context of
uncertainty (Smith, 1993), we cognitively refer to our prior experiences to find a
solution or solutions. If our prior experiences have been successful it is likely
that, circumstances being similar, we will again be successful. However, the
adjunct to this is that if our prior experiences were based upon inefficient
thinking processes, then we would likely experience difficulty in reaching
success.
This is where heuristics come into play. Heuristics are the generic cognitive
strategies that we use to interpret and respond to various situations. For example,
when we enter a room full of people, we make sense of what we see by referring
to our memory of other rooms that we have entered, and we decide how to act by
recalling which behaviours were successful in those situations. How we access
those memories determines how efficient we will be in entering the room without
embarrassment (presuming that we possess an understanding of socially

76
acceptable behaviours). In this regard, some heuristics of memory search are
more efficient than others. For lower level thinking, simple trial and error may
be sufficient. Yet, this way of thinking would be much less efficient in situations
demanding more cognitive effort, such as those attributes that rate high on
Bloom’s taxonomy (Bloom, 1956). This hierarchy of thinking skills enables us
to identify the level of complexity of various thought processes.
Such higher order thinking is necessary if geographical study is to provide a
mechanism by which students may reason both in and with geography (Gregg et
al., 1997, original emphasis). Reasoning in geography involves using the
knowledge acquired through geographical study to better comprehend
geographical concepts. Reasoning with geography involves the application of
such concepts, and the heuristics associated with them, to other, not specifically
geographical, phenomena. Unless “frequent use of higher-level thinking skills”
occurs (Macaulay, 1994, p. 23), related to reasoning with geography, students
may generate neither the additional geographical information nor the spatial
insight needed to manage uncertainty and resolve contemporary geographical
issues.
However, for higher level thinking to occur efficiently, the information being
recalled must have first been configured. Configuration involves the
prioritisation of information and its subsequent placement into recognisable
groupings (Gregg et al., 1997; West, 1999). In geography, this commonly
involves clusters or sequences being derived by attaching meaning to an object’s
relative or absolute placement (Gregg et al., 1997). For example, a map is
meaningless unless its elements have been defined, such as with a legend.
GIS configure data based upon their spatial characteristics. In ArcView, data are
encoded as Attributes, collectively forming Themes. For example, the Anglican
Church and Catholic Church are separate attributes of the theme, Churches.
These are more similar to each other than is the High School, which would
constitute an attribute of a different theme, say Schools. Alternatively, all three
may be clustered as attributes of a single Theme, Buildings. This multiplicity of

77
means of encoding data enables GIS to store large volumes of non-sequentially
related data.
Biggs and Moore (1993) recommend that each task needs to be presented in such
a way that it enables multiple levels of coding. Within geography education,
Robertson (2003) sees that this aspect of the subject “provides the tools for
individuals to process the vast quantities of information available, and to be able
to build personal geographies in place and space so that multiple realities and
complex identities can live harmoniously in the same neighbourhood” (p. 21).
Spencer (2005) concurs. Indeed, not only do GIS capabilities align well with the
route of inquiry, it is just such an inquiry-based instructional model that Baker
(2005, p. 46) calls a “natural fit”. Bednarz (2000) agrees. As a tool for the study
of geography, GIS not only allows this; its successful use demands that it occurs
(West, 2003b). Once successfully configured, data may be efficiently managed
and manipulated using GIS. From datum to complex map or chart, GIS handle
data in increasing complexity. Table 7 illustrates how this complements both the
route of geographical inquiry and Bloom’s taxonomy.

78
Table 7
The relationship between ArcView GIS, Bloom’s taxonomy and the geographical route of inquiry (after West, 1998a, 2003b).
Level of Complexity ArcView Functions Bloom’s Taxonomy Geographical Inquiry
Generating new information
Layout
Evaluation
How Ought?
Spatial analysis
Query Builder / Select By Theme
Synthesis
What Impact?
Data
manip
ula
tion
Analysis
Data analysis
Chart/View/Query Builder/Select By
Theme
Application
How/Why?
Reaso
nin
g w
ith g
eogra
phy
Data
man
agem
ent
Data Theme/View/Table of Attributes Comprehension Where?
Data
encodin
g
Datum Attribute Knowledge What?
Rea
sonin
g in
geogra
phy

79
If the assertion by Gregg et al. (1997) that the way that information is taught
influences how that information becomes available is correct, then it becomes
important to view the teaching of thinking in terms of what is required to enable
efficient higher level thinking processes to occur. If efficient heuristics are
needed to allow successful evaluation and synthesis, then educators are
responsible for teaching the skills necessary for this to occur. From the above
discussion, one of the precursors to efficient evaluation and synthesis is the
orderly configuration of data. Hence, if GIS provide this type of orderly
configuration, it is possible that their use may model this skill for students. In
this regard, by reflecting the thinking processes involved in geographical
problem solving, GIS could expose students to more efficient heuristics. If, inter
alia, the successful use of GIS requires the use of these processes, then GIS users
are more likely to develop more efficient processes for reasoning in and with
geography.
One of the three criteria that Naish et al. (1987) devised to justify the inclusion of
any subject in the school curriculum is whether it is capable of developing
students’ skills and capabilities. Through the inquiry process, geographical
investigation using GIS requires that students develop a range of skills and an
awareness of when to use them. More than a set of computer tools, GIS entail a
specific method of its own for analysing the world, and applying spatial data to
solving problems. This method, more than tools, make GIS attractive to teachers
(Kerski, 2001). We should not, however, focus on developing skills merely for
geography’s own study, but to contribute to “an education for social
competence…not in specialised knowledge” (Piper, 1994, p. 346). Using GIS in
geography might just foster skills in social competence by emphasising the
importance of encoding information based on spatial characteristics (Kam,
1996), and by manipulating this information to generate new geographical
information to devise recommendations for the resolution of issues (Laurence et
al., 1993; West, 1998a).

80
GIS and Student Motivation
The other two criteria to justify any school subject devised by Naish et al. (1987)
are: it should be concerned with a body of knowledge of genuine significance;
and, it should open up opportunities for values education.
The use of GIS enables larger volumes of data readily and routinely to be
incorporated into learning sequences. The extensive range of real-world data
available for manipulation through GIS enables students to study cultural and
physical environments at a much broader range of scales than through standard
classroom methods. Personal involvement in detailed geographical analyses of
issues of personal significance and immediate relevance can also occur. This
idea has been discussed widely (see, for example, Baker and White, 2003;
McInerney, 2002a, 2002b, 2006; West, 1998a, 2003b, 2006d). Moreover, as a
generic tool, information technologies are an integral component of students’
lives (Selwyn, 1997). As such, GIS increases the personal and societal
significance of geographical study.
In response to the third criterion, one of the core goals of school geography is to
inculcate a values-based approach to conflict resolution. Queensland’s Senior
Geography syllabus, for example, stipulates that its study “will involve a critical
understanding of value issues…for to select issues and consider solutions is to
make value judgements about what is important and appropriate” (Queensland,
1999a, p.1). In this vein, syllabuses commonly prescribe that students be
exposed to actual or hypothetical conflicts arising from human-environment
interactions. Their formulation of plausible solutions to such issues requires an
understanding of the values underlying the various decisions and actions that
contributed to the conflict. If students are better able to engage in the analysis
and manipulation of data related to actual conflicts, they may be more
comprehensively exposed to the influence of attitudes and political structures
upon the decision making processes. Hence, using GIS might afford students the
opportunity to develop skills to analyse not simply the geographical data, but
also their personal values and attitudes and how they, and those of others,
influence those data.

81
In this regard, West (1998a) hypothesised that the use of GIS in school
geography not only encourages intrinsic motivation by providing relevant
learning experiences, it better positions geography within the school curriculum
(Naish et al., 1987). This idea was investigated further by West (2003b). He
surveyed over one hundred students from four subjects in three year levels at two
Queensland schools before and after involvement in GIS-related lessons, using a
five-point Likert scale with 47 items. This study concluded that using GIS
appears to positively affect student attitudes, and for two reasons (p. 270). First,
GIS offers students the ability to engage in the development of higher level
thinking skills. Second, intrinsic motivation is enhanced by doing this in the
context of investigating issues of personal significance. This combination of
enhanced perception of relevance and the provision of an appropriate level of
cognitive demand suggests that using GIS may positively influence student
learning.
GIS and Vocational Opportunity
Technological developments within the fields of geomatics and surveying have
greatly changed the manner in which these professions operate. Similarly, the
nature of the industry itself is changing (Gewin, 2004; Trinder, 1996). Since a
large number of surveyors entered this profession in the 1960s, their exit from
the workplace in the past decade was predicted to demand an increase in people
skilled in these areas (Skelly, 1996; Gewin 2004). According to Gewin, demand
remains strong, with “job opportunities... growing and diversifying as geospatial
technologies prove their value in ever more areas” (p. 376). A number of
publications during the past decade, have indicated with urgency the need for
educators to embrace these trends and reflect this changing nature of
technological integration within the spatial sciences (e.g., Baker, 1997b;
McInerney, 2002b).
However, technical skills alone are not sufficient (Gewin 2004). Rather, Gewin
continues, potential employees require “a deep understanding of underlying
geographical concepts” (p. 377). She asserted that the worldwide geospatial
82
market would grow from US$5-billion in 2003 to US$30-billion in 2005; growth
due largely to the rapid diversification in the application of GIS technology as a
“powerful decision making tool” (p. 376). Citing examples as varied as
responding to the recent outbreak of severe acute respiratory syndrome (SARS),
fires in southern California, and homeland security, Gewin makes clear the need
for employees with both technical and theoretical bases. However, given the
requirements of the industry for increasing numbers of graduates with a broad
academic knowledge in tandem with spatial technology skills, the role of
secondary schools has been surprisingly overlooked (West, 2004a).
In this regard, Johnson (1996, p. 103) a decade ago observed that
the potential of GIS to the business community is substantial and that, at
present, business user definitions of GIS focus on … limited spatial
decision-making support. Geographers would appear to have a considerable
role to play in responding to, and moulding, this potential through creative
curriculum decision-making that reflects a consistent regard for education...,
the analytical potential embodied in GIS…, and the communication
principles that inform effective GIS design.
Students who have excelled in GIS and another area of study such as
environmental, biological or earth sciences tend to move rapidly into
employment because their interests and educational credentials are diverse
(Gewin 2004; Skelly, 1996). To this, Trinder (1996) offers five guiding
principles to prepare students for a career in the spatial sciences:
1. students must receive a broad education;
2. students must be able to analyse and solve problems, and adapt to new
technologies and procedures;
3. since demand for traditional skills will decline, students must acquire
knowledge of the principles and procedures of spatial data gathering,
handling and manipulation, rather than specific detail;

83
4. assignments and assessments should be project based to encourage
students to think innovatively; design should be less for skills
development than analysis; and,
5. project management should be presented to allow students to address both
organisational and procedural problems.
While this employment is based upon the completion of some tertiary study, high
school geography may still play an important role, and for two reasons.
First, there is a shortage of students undertaking the relevant tertiary programs.
According to Will Featherstone, former Vice-President of the Australasian
Surveying and Mapping Lecturers' Association, this was due to lack of interest
amongst the student community; it was not an attractive option for high school
leavers (Baker, 1997a, 1997b). More recently, in an email communication on 10
May, 2007, Associate Professor Bert Veenendaal, Acting Head of Department,
Department of Spatial Sciences, Curtin University of Technology indicated that
“there is still the problem of attracting students largely due to the fact that they
do not know about GIS and the opportunities”. However, according to South
Australian geography teacher, Malcolm McInerney (2002a), secondary students
“take to GIS like ducks to water” (p. 42). That students develop positive views
of GIS is further evidenced by West’s (2003b) finding that their attitudes
improved following exposure to GIS-based learning experiences. In response,
exposure to and successful use of GIS at school might raise student awareness of
the (potentially positive) role of spatial technologies, which may then increase
the number of students who consider further (tertiary) study in related fields.
Second, including GIS in high schools readily adopts each of the above five
principles. This shall be illustrated through West’s (2004a) reference to a Grade
10 project, where students devised a Strategic Plan for the Burdekin Rangelands,
the aim of which was to recommend how the region’s natural resources could
best be managed to sustain the current mix of economic activity.
GIS was introduced as an integral component of the investigation. Its competent
use became a necessary part of the project, rather than an exclusive outcome,
84
addressing the first principle. Principle Two was met in two ways. With basic
information provided, students identified and structured the stages of the project.
This required on-going personal assessment of progress and evaluation of the
strategies by which problems may be solved. Also, incorporation of various
technologies, such as spreadsheets and digital imagery, made the project more
efficient. With regards Principle Five, limitations of time and individual ability
demanded that students develop project management skills through collaborative
decision-making and delegation.
Principles Three and Four were achieved through participation in the subject,
rather than simply undertaking this project. For example, within Queensland
Senior Geography, wherein multiple methods of data capture and analysis are
utilised, students necessarily adopt awareness of the basic principles of data
handling. Further, syllabus requirements preclude GIS fluency from providing
the sole basis of assessment. Rather, it may be used as a tool by which student
performance in a range of assessment criteria is demonstrated. In Senior
Geography, these criteria would be Analytical Processes, Decision-Making
Processes ad Research and Communication Skills. West (1998a, 1998b, 1999)
and Table 6 provide further examples of GIS related learning sequences that
address these five principles.
As evidenced by the increasing proportion of (Queensland) students undertaking
OP ineligible courses of study (Table 4), there has been an increased emphasis on
vocational education and training (VET) and non-traditional pathways within the
secondary education sector. This enables high schools to offer studies which,
although once the domain of higher education and private providers, may now
directly qualify students for credit toward tertiary courses. As with the first
point, the likelihood of continuance in a GIS related award beyond school may
be greatly increased for the student who has already successfully completed
some requirements of that course of study. As an example, McInerney (2002b,
2006) has formalised his curricular application of GIS by developing a GIS-
based course which enables students to achieve the skills and methodology of
Stage 1 Geography in the South Australian Certificate of Education. While it is
yet to occur, it is likely that students who complete this course could, in theory,

85
gain credit toward industry-level GIS training courses offered elsewhere. Thus
the potential for Recognition of Prior Learning could apply as equally to GIS-
related school activities as it does for other student learning.
Due to the multidisciplinary nature of school geography, it is, arguably, very
difficult to teach purely about GIS in a school environment (West, 1998a). This
may mean that school students are more likely to also be exposed directly to the
multidisciplinary application of GIS’ skills (Baker, 2005). Hence,
commencement of tertiary study with an awareness of GIS’ value may improve
the likelihood of students including spatial technologies within a program of
broad undergraduate study (West, 2004a). Apart from the potential for enhanced
learning, teaching with GIS in schools may thus contribute to redressing the
perceived shortage of skilled practitioners within the spatial sciences. However,
the extent to which the potential for this, and that of GIS’ use in schools
generally, may be realised is limited by a number of constraints. It is these
which will be now discussed.
Issues affecting GIS use
Many authors laud the potential contribution of GIS to geography education (see,
for example, Baker, 2005; Dascombe, 2006; Olsen, 2002; Patterson, Reeve &
Page, 2003; Seong, 1996; Smerdon, 2006; Wiegand, 2001). Arguably, this
Computers
Route of Geographical Inquiry
Student Motivation
Role in Education
Vocational Opportunity
Teacher Confidence
Access
Ge
og
rap
hic
In
form
ati
on
S
yste
ms
Time & Data
What it is and isn’t
Student Learning
Curriculum
Issues Affecting Use
86
potential may be matched only by the many ways of “doing GIS” in schools
(Fitzpatrick, 2001, p. 85). Indeed, this may in itself be partly responsible for
limiting its adoption, and why its potential, howsoever lauded, is yet to have
more than what Wiegand (2001, p. 68) describes as a “negligible” impact on the
nature of geography education within schools. The reasons for this can be
loosely grouped into five, overlapping, categories: curriculum; teacher
confidence; time and data; computers; and, access. Pun-Cheng and Kwan (2001)
found similar classes emerged from their interviews with Hong Kong teachers.
Further discussion of issues affecting GIS use generally, and GIS-uptake
specifically, is provided by, among others, Audet and Paris (1997), Baker (2003),
Beeson (2006), Chalmers (2006), Jenner (2006), Kerski (2003), Lloyd (2001),
Meaney (2006), McInerney (2002a), O’Mahony (2003) and Smerdon (2006).
Curriculum Issues
“While the technology continues to change at break-neck speed, the broader
classroom environment changes more slowly” (Chalmers, 2002, p. 26). In this
regard, the use of GIS is not always compatible with external curriculum
constraints (Baker, 2005; Smerdon, 2006; West, 2006d). By way of example, in
their “informal discussion” with geography teachers in Hong Kong, Pun-Cheng
and Kwan (2001, p. 90) discovered that teachers believed GIS to provide good
potential to undertake tasks not otherwise available in the classroom. However,
the likelihood of this opportunity being exploited, in Hong Kong and elsewhere,
may remain limited until an answer is provided to the question of whether
curriculum should be somehow “expanded or modified” to reflect GIS’ potential
(p. 88).
Limitations of GIS’ application within curricula appear to be widespread. In the
United Kingdom, reference to GIS was made in statutory curriculum statements
in the early 1990s resulting in an “explosion in resource material” (Wiegand,
2001). Since then, Wiegand continues, most teachers have remained “puzzled by
what was … an unfamiliar term” and, by 2000, its reference was removed from
statutory statements, but remains in non-statutory guidelines, with “statutory or
examination board obligations to incorporate GIS into the curriculum” (p. 68).
87
Recent curriculum development experiences in both the International
Baccalaureate Organisation and the (Canadian) Ontario Ministry of Education
considered GIS to be “too difficult to impose upon schools” (Hoel, 2003, p. 372).
Hoel continues to argue that, whereas interest in including GIS in international
curricula is high, its inclusion in the syllabus would “cause an outcry,” and
especially so in contexts where even the inclusion of topographical map
interpretation was considered optional (p. 372).
While the current Queensland Senior Geography syllabus does include GIS as a
resource that can be used to aid in student attainment of its Global Aims (p. 61),
and offers its use as a suggested learning experience for some topics of study, the
extent to which it can be incorporated beyond a few lessons appears constrained
by the criteria against which student performance is assessed, as outlined in
Table 2. Despite further statements supporting the use of spatial technologies
being made in the revised (2007) syllabus, the existing concerns appear likely to
continue unabated (Queensland, 2007c). By way of contrast, the inclusion of GIS
in South Australia’s curriculum documents in 2001 catalysed the comparatively
widespread uptake of GIS in that state (McInerney & Shepherd, 2006).
At Presbyterian Ladies College in Melbourne, Victoria, early steps to implement
GIS have, despite the enthusiasm and commitment of staff, been “difficult in an
environment where teachers have to meet a multitude of external, internal and
ever-changing curriculum and administrative requirements” (Turner and Beeson,
2003, p. 42). At a national level, in New Zealand, curriculum related programs
that integrate GIS into teaching and learning are rare (Chalmers, 2006; Olsen,
2002). Although many schools there have entered competitions, such as the ESRI
and AURISA GIS in Schools competitions, few schools have implemented
programs that consistently integrate GIS into the curriculum; indeed, Olsen
found that, in 2002, only 1% of schools in NZ had a curriculum program in place
or being developed that integrated GIS technologies. In simple terms, and
representative of many authors from a variety of nations, Pun-Cheng and Kwan
(2001) assert that “we need a carefully designed curriculum” and one which
answers the question of to what extent “should the high school curriculum also

88
be expanded or modified … in response to this changing technology” (pp. 88,
91)?
Teacher Confidence Issues
The growth in technology in education has presented numerous issues for teacher
training. Chalmers (2006) goes so far as to suggest that “the social acceptance of
computing has not been matched by the creation of an educational environment
that can promote the use of GIS in the classroom” (p. 267). Smaldino and
Muffoletto (1997) noted that since the decisions a teacher makes about how to
select and integrate technology will influence learning, and since the technology
is itself changing, “there has to be a greater understanding of the role of
technology in the classroom” (p. 37). These authors further observe, in general
terms, that “most teacher education programs struggle with being able to provide
a comprehensive program of study,” precluding students from gaining “an
understanding of the applications of technology in education in the broad sense,
with an in-depth examination of how technology supports learning in specific
content areas” (p. 37). This continues despite more recent research identifying
“high levels of agreement between student teachers and their mentors about the
value of ICT as a resource in teaching and learning” (Loveless, 2003, p. 327).
While almost a decade old, the repeated call for further research in to the specific
detail surrounding GIS’ application within school geography suggests that the
concerns of Smaldino and Muffoletto’s remain valid: teacher confidence with
GIS will influence their use of GIS (Beeson, 2006; Chalmers, 2006; Jenner,
2006; Meaney, 2006; McInerney & Shepherd, 2006; West, 2006d). More
generally, Rakes, Fields and Cox’s (2006) survey of teachers across 11 (US)
school districts revealed a significant, positive relationship between three
variables: levels of class technology use and personal computer use and use of
constructivist teaching methods.
Of specific relevance to the present discussion, Kerski’s (2001) survey of 1500
US schools revealed the characteristics of GIS uptake and impediments to its use.
Specifically, Kerski identified teacher experience as significant in determining
89
the extent to which GIS would be used in high schools. The vast majority of US
teachers who regularly used GIS were considered both highly qualified and
experienced; over 76% possessed tertiary qualifications at Masters or PhD level,
and over 60% had taught for more than 15 years. Kerski concluded that GIS was
more likely to be implemented by those teachers who possessed both the
educational background and time required to devote to it. Although promising
that there remains only a “widening interest” in GIS within geography teacher
training in Australia, Robertson (2004, p. 174) raises concerns about the
likelihood of GIS’ broader acceptance within curriculum; a conclusion for which
much support can be found (e.g., Baker, 2005; Beeson, 2006; Hoel, 2004). This
would appear to add credence to Chalmers’ (2002) assertion that inquiry-based
learning in the digital classroom is an unrealistic goal for most geography
teachers.
Kerski (2001) discovered statistically significant differences between those
teachers who “embark on a long-term program of learning about and
implementing a complex system such as GIS in the curriculum, [who] must be
highly motivated, willing to take risks, and not afraid to experiment with new
strategies” and those who are not (p. 73). Interestingly. teachers using GIS tend
to be more active in their professional activities, attending more conferences
than non GIS-using teachers.
In 1995, Gerber (1995a) predicted that teacher training would become an issue
affecting GIS’ uptake. Indeed, training is seen by most teachers of geography in
New Zealand to be the key factor in determining the extent to which GIS will be
used (Chalmers, 2006; Olsen, 2002). However, even though most technology
training is targeted at in-service rather than preservice teachers (Bednarz and
Audat, 1999), there remains a perception that the training that does occur does
not equip teachers to use the technologies effectively in the planning and
administering of learning experiences (Baker, 2005; Kidman & Palmer, 2006;
Milken Exchange and the International Society for Technology in Education,
1999; West, 2006d).

90
On the basis of this apparent contradiction, it appears that teacher interest may be
the driving factor in the adoption of GIS. Anecdotally, this is something that I
observed while editing the recent IRGEE Forum about issues affecting GIS’ use
in Australia and New Zealand, leading to my concluding statement, as follows
(West, 2006d, p. 258):
That Forum contributors appear to view the benefits of using GIS to
outweigh issues surrounding its use is perhaps no surprise. Indeed, a
plausible criticism of the collective wisdom presented by this Forum is that it
reflects only the experiences of those who have been successful. However,
when I consider the experiences that are recounted in the following articles, I
find that it becomes equally plausible to suggest that this goes to the very
heart of GIS’ successful implementation: the sheer enthusiasm to implement
it combined with the tenacity to overcome the obstacles that invariably
confront any innovation in education.
For example, at Presbyterian Ladies College Melbourne, it was the combination
of one teacher’s enthusiastic leadership in the areas of curriculum and skills
development that motivated the participation of colleagues in demonstrations,
workshops and discussions about the application of GIS in the classroom (Turner
and Beeson, 2003). On-going training needs at this school are met through a
mentoring process which, while expensive, provides the novice GIS-teacher with
both software and non-specific IT support to facilitate progress toward their
curriculum goals (Beeson, 2006). As suggested in Chapter One, my own
experience in the use of GIS in three schools has not been unlike this.
Hence, it appears that a major obstacle to the coordinated adoption of GIS is the
absence of coordinated training (Kerski, 2001). Although Kerski found that 17%
of GIS-teachers trained themselves, the quality of training undertaken by others
has lacked the specificity required to articulate GIS theory into educational
practice. And, since most GIS training emphasises teaching about GIS rather
than with GIS, both Kerksi (2001) and, more recently, Chalmers (2006) argue it
is non-productive given that its application to secondary education requires a
specific teaching method that is unfamiliar to most teachers. Because of this,
91
teachers equipping themselves to transmit the “skills and technologies of GIS” to
students are likely to fall short of broad educational goals such as “instruction
that fosters critical thinking” (Baker, 2005, p. 48).
Time and Data Issues
Entwined with the issue of teacher confidence are those related to time and data.
According to Kerski’s (2001) survey of the teachers who use GIS in the US, 62%
use it for an hour or more outside the classroom per week, and 21% use it at
home. This could be because lessons using GIS take more time to prepare than
those which involve more traditional learning experiences (Olsen, 2002).
Indeed, time for lesson planning is the “chief challenge to implementing [GIS] in
the classroom” (Kerski, 2001, p. 79). This view was supported by Hong Kong
teachers interviewed by Pun-Cheng and Kwan (2001, p. 91), who agree that
removal of issues associated with time constraints would enable GIS’ “potential
educational impact [to be] immense”. Several contributors to the recent IRGEE
Forum, mentioned earlier, iterated similar views with the Australian and New
Zealand context (e.g., Beeson, 2006; Dascombe, 2006; Meaney, 2006; West,
2006d).
While a decade ago teachers, including myself, may have viewed the burgeoning
place of ICTs in education as an opportunity to reduce time spent in planning,
time remains an issue for several reasons. First, teacher skill takes time to
develop (Jenner, 2006). Second, developing lessons suited to students and
curricula takes time (Meaney, 2006; McInerney & Shepherd, 2006). Third,
acquiring and managing data takes time (Beeson, 2006). Teachers have made it
clear that they required more lesson time to discuss, analyse and interpret data
“before [the] effective learning impact [of GIS] can be felt” (Pun-Cheng and
Kwan, 2001, p. 91).
Length of time in accessing data is, in many cases prohibitive (Baker, 2005;
Olsen, 2002). Since one benefit of using GIS is the potential for greater
relevance, it is important to maintain up to date data (Langley, 2001). While
initial forays into the adoption of GIS were met with demands for more data

92
(Chalmers, 2002), this has diminished as increased technology capacity has
created what Fitzpatrick (2001, p. 86) calls “an ever-widening flood”. The
development of more large data sets has not assisted schools. Whereas large
volumes of data may have once slowed data processing (Raubal, Gaupman and
Kuhn, 1997), advances in microprocessor technology have largely obviated this
concern. Rather, schools just want smaller, well-structured and readily
accessible data sets (Baker, 2005; Jenner, 2006).
The nature of available data presents teachers wishing to use GIS with two
choices. They can use large data sets with students, focusing on small elements
of those databases. Or, they can extract the data that they want, thus generating a
new database (Beeson, 2006). Opting for the former takes more time in class, as
networks or individual terminals respond to the greater memory demand. The
latter requires teacher skill to extract data, and time to manage that data such that
it becomes available for student use. Neither is ideal; a third choice thus
becomes more appealing: since there is so much data from which to choose,
don’t choose any (West, 2006d).
The growing array of data also creates challenges for teachers who have an
equally diverse array of possible ways to use GIS (Fitzpatrick, 2001). To cater
for this, he continues, “teachers have fitted the technology to their instructional
vision, depending on their grade level, subject focus, available hardware, and
comfort in teaching with computers” (p. 85). Many GIS users have also
discovered the potential that its use makes for collaboration with others.
However, while using GIS may make this task more obvious, it in no way makes
it easier to do so (Fitzpatrick, 2001; Meaney, 2006).
Although relevant data is becoming increasingly available, its “adaptation to the
particular teaching context is an inevitable requirement” (Chalmers, 2002, p. 26).
This is because simply displaying data with GIS does not mean that the data have
been subject to any form of analysis (Fitzpatrick, 2001), nor has it been
considered for its role in developing student spatial awareness. Of interest here
is that Pun-Cheng and Kwan (2001) discovered many Hong Kong teachers

93
perceived that the product of GIS analysis was embedded within the dataset,
simply waiting to be retrieved.
To help address this, it may be necessary for teachers not just to prepare data that
can generate interesting looking maps, but to develop data sets which enable
visualisation competency to be developed, for them and their students. Gerber
(1995a) suggests that doing this arises from knowing how maps are normally
read, and knowing the standard conventions of cartography. By choosing data
which can produce maps that allow this knowledge to be developed, he states,
teachers can assist students in understanding the maps that they produce using
those data.
Since there is very little analysis within a standard GIS package, it is unable to
provide solutions to spatial issues by itself (Langley, 2001). Rather, as Langley
continues, it simply and clearly displays the data that have been manipulated by
the user. Hence, it is up to the user to make meaning out of the data displayed.
The need for software competence has already been discussed. To this, it may be
possible that difficulties associated with developing the software skills to select
and manipulate data may not be as great as the difficulties associated with
developing the skills needed to understand and make meaning of that data.
When combined with issues surrounding computers themselves, teachers can
face very real impediments to using GIS.

94
Computer Issues
A major issue influencing GIS use in schools is the level of technical support and
appropriate resources. 74.2% of schools using GIS possessed technical support,
with a chi-squared test by Kerski (2001) indicating that the amount of technical
support is significantly higher for teachers using GIS than those who do not.
Evidence that this remains the case in Australia is provided by Beeson (2006),
Jenner (2006), Meaney (2006) and McInerney and Shepherd (2006). Kerski
(2001) further noted that GIS use is more affected by insufficient support and
hardware than other software commonly used in schools. Specifically, unreliable
networks and hardware are likely to make it difficult for teachers to proceed with
confidence in the development of comprehensive programs that use GIS (Olsen,
2002).
As with many technologies, a teacher needs to have an alternative plan if the GIS
lesson does not go to plan due to hardware/networking constraints/obstacles.
However, the very purpose for using GIS is to provide a learning experience that
is difficult, if not impossibly impractical, to emulate without the use of
technology. Furthermore, within the actual GIS lesson, the data handling
potential of GIS may itself present an obstacle to learning, where the GIS and/or
data being used may present a technological demand that exceeds the level of
hardware possessed by the school. Reviewing the US situation, Bednarz (2004)
concluded that “the programs available for school use ..., essentially the same
powerful, full-capacity software used by professionals in the field, are a barrier to
implementation” (p191). There is no doubt that GIS demand large volumes of
memory and space (Baker, 2005; Kerski, 2001; Table 5). Since not all schools
possess the facilities to manage this efficiently, the potential for student
disengagement becomes pronounced; and, with it, may come a variety of
unintended outcomes (West, 1998a, 2006d).
Kerski (2001) also found that more teachers use GIS on a classroom computer
(46.3%) than in a laboratory of computers (27.1%). However, his analyses also
revealed that schools that lacked computer laboratories experienced the greatest
difficulty in integrating GIS (p. 78) and, since access is generally proportionate

95
to hardware stocks within a school, any limitation of access will increase the
relative cost of both hardware and software needed to support the use of GIS;
ultimately deeming it prohibitively expensive (Gerber, 1995a).
Most schools using GIS rely on off-the-shelf products (Baker, 2005; Dascombe,
2006; Kerski, 2001). Of the three main software packages, ArcView, MapInfo
and Idrisi, only ArcView is available on both Windows and Macintosh platforms.
This perhaps explains Kerski’s finding that a significant difference exists
between the operating systems of schools that do and do not offer GIS education.
Access Issues
Interrelated with computer issues are issues of access. Presuming that adequate
computer resources exist to support use of GIS, the lack of regular and reliable
access to the hardware that support GIS precludes progress towards its adoption
(Olsen, 2002). [As will be discussed later, such access is particularly important
since, arguably, mastery of basic functions requires repetition].
Olsen indicates further that, in New Zealand, the widest possible estimate of GIS
use is 8% of schools, of which a quarter possess the software but are not using it
or are unlikely to use it in the near future. This reflects the US situation, where
less than 5% of schools possess the technology, with less than half of those who
possess GIS likely to use it (Kerski, 2001).
In the US, the proportion of students in any one school who use GIS reflects the
proportion of teachers who use GIS; most schools have only one teacher using
GIS; in 42% of schools, 10% of students were using GIS, in comparison to the
zero number of GIS-using students in 29% of schools (Kerski, 2001). Such data
is yet to be published for Australia.
Apparent from this brief discussion is that there are significant influencing
factors in the adoption of GIS. While his US study concurs, Kerski also noted
that teachers viewed the benefits of using GIS to outweigh issues such as the five
discussed here. Indeed, this apparent optimism is mirrored across the reviewed
literature. In light of this, it is appropriate to now identify those questions whose

96
answers may better clarify the role of GIS in contributing to a geographical
education.
Questions Arising from the Literature
The preceding review of literature identifies the value of geography within the
curriculum and desired features of a geographical education. In considering the
potential role of GIS in a geography education, however, it also reveals a dearth
of data. Whether or how using GIS enables students to attain the goals of
geography remains largely unknown. While some research has suggested
positive relationships between GIS use and student attitudes, the way that GIS
might assist students to achieve many of geography’s seemingly fundamental
attributes is not sufficiently clear.
Are non-explicit
map features
identified and
explained?
Are explicit
map features
identified?
Spatial nature
Multidisciplinarity Are multiple
perspectives
identified?
Are maps
used?
Are values
considered?
Does
geographical
thinking
occur?
Emphasising skills
Participating as citizens Is the world
better
understood?
Are issues
resolved?
Questions remaining about GIS’
role in geography education
Are
generalisations
drawn?
Are
generalisations
tested?
Solving problems
Misunderstood subject
Is value seen?
Does public
perception
change?
Figure 6. The major features of geography education about which GIS’ role remains uncertain.
97
In this regard, specific questions remain to be answered. These relate to how
GIS contributes to each of the major features of geography (Figure 5). With
regard to geography’s spatial nature, it is not known whether, while using GIS,
students use maps to create an understanding of space by identifying explicit
features on a map, such as location and distribution.
In terms of its multidisciplinarity, it is not known whether, while using GIS,
students integrate information from a map to identify patterns/relationships that
are not explicitly labelled. In this way, do they develop an awareness of pattern,
trends and land-people interactions? Further, do students, while using GIS,
analyse information to determine reasons for these trends and patterns and/or
make inferences by linking mapped features to other knowledge and draw
conclusions about the map’s features? Perhaps more broadly, do students
identify the multidisciplinary perspectives of the issues that they are studying
with GIS?
In terms of its emphasis on skills, it is not known whether, while using GIS,
students use maps to investigate, record and analyse processes arising from
people-environment interactions, nor whether they think graphically, by
engaging in skills of information processing, reasoning, inquiry, creative thinking
and evaluation.
In terms of its emphasis on problem-solving, it is not known whether, while
using GIS, students resolve issues using the geographic route of inquiry, nor
whether they draw generalisations from data analysis (induction) and/or test
generalisations using these data (deduction).
In terms of its role in developing student capabilities for citizenship, it is not
known whether, while using GIS, students consider values linked to phenomena
being studied, nor if they are engaging in learning experiences which enable
them to better understand the world that they live in.
98
In terms of Geography being a misunderstood subject, it is not known whether,
while using GIS, students see value in subject Geography, nor whether public
perception of the subject changes as a result of GIS being used.
Central Phenomenon and Research Questions
Three points are evident from the preceding discussion. One, it is evident that
geography is a worthwhile inclusion within school curricula. Two, it is evident
that for geography’s goals to be realised attention needs to be paid to how it is
taught and the tools that are used to do so. Three, it is evident there is little
known about how to teach with one of these tools, GIS, within geography
education.
Whereas both academics and students have identified the benefits of a
geographical education, the same cannot yet be said about GIS. A clear directive
thus emerges: it is appropriate to identify research that may constitute a ‘starting
point’ and lead to a clearer understanding not just of GIS’ role within geography
education, but also of appropriate directions for future investigations into how to
teach using it.
On this basis, the central phenomenon that has emerged from this review of
literature is student conceptions of GIS. The specific research question being
investigated is:
What are the conceptions of geographic information systems (GIS) held by
Senior Geography students?
The answers to this question may contribute to:
1. Knowledge of the spatial understandings held by students of geography;
2. Understanding of how students gain an understanding of spatial
phenomena of varying levels of complexity;
3. Awareness of the potential educational outcomes associated with using
GIS;
99
4. Current discussions about the merit of using ICTs in education, with
specific emphasis on the use of GIS in geography education;
5. Decisions related to current and potential geography curricula; and,
6. Understanding how the subject Geography is and can better be
understood.
The methodology and research design used to investigate the research question
will be addressed in Chapter Three, Investigative Framework.
100
CHAPTER THREE
INVESTIGATIVE FRAMEWORK
Overview of the Chapter
The purpose of this chapter is twofold. First, it will present a discussion of the
issues surrounding the adoption of the approach chosen to undertake this
investigation: phenomenography. This discussion will consider: the selection of
an appropriate epistemology; the central assumptions of phenomenographic
inquiry; the determination of categories of description; the delineation of
conceptions from within these categories of description; and, the emergence of
an outcome space that depicts the relationships between and among these
conceptions.
Second, it will present and justify the specific applications of the method to be
employed in this empirical research. It will outline the specific considerations
for the collection of data to answer the research question:
What are the conceptions of geographic information systems (GIS) held by
Senior Geography students?
This will occur in two sections. First, by describing the method of collecting
data to answer the research question: synergetic focus group interviews. Second,
issues associated with the ethics and trustworthiness of the research outcomes
will be presented, and strategies for their mitigation will be outlined.
Summary of methodology
Epistemology
Research involves systematically investigating questions or problems with a
view to discovering answers or solutions. In general terms, research can be
classed as nomothetic or ideographic (Figure 7). Nomothetic approaches to

101
research reflect the scientific empirical tradition, and strive to identify general
principles. Idiographic approaches to research reflect the naturalistic
phenomenological mode, and strive to identify individual experiences of
phenomena. Further discussion of the two approaches is offered by, among
others, Burns (2000), Eisner (1993), Faux (2002), Fraenkel (1995), Grice (2004),
Ramsdem (1985), Shulman (1984) and Thomae (1999). Since the central
phenomenon of this research is student conceptions, it is appropriate to employ
an idiographic approach.
Figure 7. Two approaches to research, and their emphases.
The theoretical approach to research design is informed by epistemology. The
epistemology underlying any research can be classified as either quantitative or
qualitative. Discussion about these differences is provided by, among many
others, Bryman (1984), Creswell (2002), Faux (2002), Firestone (1987), Howe
(1992), Howe & Eisenhart (1990), Onwuegbuzie & Daniel (2003), Sale, Lohfeld
& Brazil (2002), Smith (1983, 1986), and is further explored in Figure 7 and
Table 8. Quantitative research is used to describe and explain general trends and
patterns between or among variables. Qualitative research is used to explore an
understanding of a central phenomenon. Arminio (2002) explains the difference
in terms of the view held by the researcher toward the acquisition of knowledge.
He states:
Quantitative work is based on epistemological objectivism (truth is to be
discovered and measured) whereas qualitative work is based on
Nomothetic
general principles
Idiographic
individual experiences of phenomena

102
epistemological constructivism (knowledge is created through engagement
with the world) and subjectivism (knowledge is imposed by the researcher
by critical examination of textual evidence).
Table 8.
Difference between quantitative and qualitative approaches to research (after
Creswell, 2002, pp. 50-58).
Quantitative Approach Qualitative Approach
Assumes
that
knowledge
is:
� To be discovered and measured � Created through engagement
with the world
Useful for:
� Describing trends
� Explaining relationship among
variables
� exploring and understanding a
central phenomenon
To do this,
the
researcher:
� specifies narrow questions
� locates/develops instruments to
gather data to answer the
questions
� analyses numbers from the
instruments using statistics
� asks participants broad,
general questions
� collects detailed views of
participants in the form of
words or images
� analyses information for
description and themes
Using the
results, the
researcher:
� interprets the data drawing on
prior predictions and research
studies
� interprets the meaning of
information drawing personal
reflections and past research
Report of
findings:
� is presented in a standard format
� displays researcher’s objectivity
� displays researcher’s lack of
bias
� is presented in a flexible
format
� displays researcher’s biases
� displays researcher’s thoughts
103
The extent to which knowledge created through qualitative inquiry is regarded as
constructivist or subjectivist depends on the precise approach to qualitative
research that is adopted. This distinction was explored four decades ago by
Polanyi (1967, p. 33) who described knowledge as “rooted in acts of
comprehension”, rather than being based on verifiable fact (Maddox, 1993). In
this regard, the constructivist epistemology recognises knowledge as constructed
within a context (Kennedy, 2004). Schwandt (2003, p. 305) captures the sense of
this when he observes that:
most of us would agree that knowing is not passive – a simple imprinting of
sense data on the mind – but active; that is, mind does something with these
impressions…in this sense, constructivism means that human beings do not
find or discover knowledge so much as we construct or make it.
It is, here, worth recalling that the central phenomenon of the current research is
student conceptions of GIS. In this respect, it is appropriate to select a
methodology that is grounded in the constructivist view. Kennedy (2004) offers
an overview of this relevance through reflection on her own research in the area
of knowledge management; wherein the constructionist epistemology led to
a research topic that recognised knowledge as constructed within a context;
the literature’s reflection of constructivist theory meant that the research
must aim to reflect individual’s constructions of meaning; knowledge as an
activity of interdependent people meant that the research must allow
knowledge to emerge through the interaction of individuals in their sense
making; the collective mind directed the research to the understandings and
practices of collectives; and complexity theory demanded an approach that
was undirected, iterative, drew on diversity, was social, influenced by
context and facilitated emergence of novel characteristics.
The specific research question for this study asks: what are the conceptions of
geographic information systems held by Senior Geography students? Thus, the
research will seek to explore student experiences of a given phenomenon, GIS.

104
For this reason, a qualitative ideographic, and constructivist, epistemology is
most appropriate.
Figure 8. Quantitative versus qualitative approaches to research
Phenomenography: A research specialisation
The epistemology grounds the methodology. Arminio (2002) describes the
methodology as “the approach, plan of action, process, or design lying behind the
choice and use of particular data collection methods”.
The method chosen to answer the research question has predominantly been
drawn from reference to Arminio (2002), Booth (1997), Breen (1999), Bruce
(1992), Keyes and Orr (1995), Lindblad (1983), Marton (1981a; 1981b; 1986;
1994), Pinnock (2003), Pramling (1994), Richardson (1999), Sandberg (1997),
and Willmett and Lidstone (2003).
Quantitative
Truth is to be
discovered
Qualitative
Subjectivism Constructivism
Knowledge created through
engagement with world
Knowledge declared
according to perceptions of
Choice depends on precise approach adopted by researcher

105
To identify the most appropriate methodology for this study it is useful to
delineate between first and second order perspectives, as they relate to the
investigation of phenomena (Figure 8). Investigations of a first order perspective
aim to describe aspects of the world; investigations of a second order perspective
aim to describe people's experiences of aspects of the world (Marton, 1981a).
Studying the latter, second order, perspective allows people's experiences of
phenomena to be described in qualitatively different ways (Marton, 1981b). It is
here, according to Pinnock (2003) that the value of such inquiry is found, where
an understanding of student conceptions can help the teacher to find ways of
achieving specific learning outcomes.
Figure 9. First and second order perspectives, as they relate to the investigation of phenomena.
Phenomenography is a research specialisation that developed "to study human
understanding of specific phenomena" (Marton, 1994, p. 253). Willmett and
Lidstone (2003) cite Prosser and Trigwell’s (1997) assertion that its central
assumption is “that there is a variation in people’s experiences of the same
thing”. Moreover, by emphasising the relationships between subject and object
within a specific context, phenomenography offers a distinctive relational nature
(Bruce, 1995). In this regard, phenomenography fundamentally “accepts that
people develop their knowledge of the world through personal experience…all
knowledge is subjective in nature” (Gerber, 1992b). It is qualitative research that
aims to “elicit and interpret people’s interpretations of the world around them”
(Breen, 1999, p. 2). It accomplishes this by focusing on discovering patterns or
regularities in people’s conceptions of certain phenomena (Keyes & Orr, 1995).
first order perspective
describing aspects
second order perspective
describing people’s experiences of
aspects
106
Marton (1981a) adds that the phenomenographic approach to research aims to
"describe, analyse and understand how individuals conceive different phenomena
in the world around, ie, to describe phenomena as they appear to the individuals”.
Conceptions
Phenomenographic research strives to “distinguish and describe variations in
perceiving or experiencing phenomena in or aspects of, the world around”
(Pramling, 1994, p. 227). Booth (1997) concurs, agreeing that these descriptions
are of the “qualitatively different ways in which particular sorts of people
understand a phenomenon, or experience some aspect of the world” (p. 135). For
an individual, the conception is the reality; the term ‘conception’ has a specific
meaning in phenomenography theory that is different in its use elsewhere. In
terms of phenomenography, a conception is deemed to be a way of seeing
something, a relationship between an individual and a phenomenon (Johansson et
al., 1995; Figure 10). Because of this, phenomenographic research yields results
that offer alternate descriptions of people’s conceptions of a range of phenomena
(Bruce, 1995; Lindblad, 1983). Further discussion is provided by Bruce (1992,
1997), Marton (1986), Pramling (1994), and Sandberg (1997).
Methodologically, phenomenography relies upon the discursive accounts of
participants (Richardson, 1999). This reflects the phenomenographic view that
language is a “device for representing the world” (Ekeblad, 1995). Gerber
(1995b) captures the foundation of phenomenography with his statement that
people’s experiences of phenomena “are recorded in the words of other
experiences by the participants in a specific context” (p. 1). Because of this, he
further argues that interview transcripts can be analysed by phenomenographic
researchers to detect the “qualitatively different variations in the [interviewees’]
experiences” (p. 1).
All data coded transcripts are treated as “verbal protocols of subjects engaged in
a complex reasoning task” (Bausmith and Leinhardt, 1998, p. 96). Bruhn (1989)
suggests that qualitative analysis of such data as discourse may, in many ways,
serve the functions traditionally performed by statistics in quantitative analyses.

107
Here, discourse analysis allows the variation in experiences of the participants to
be revealed, which, Gerber (1995c) claims, enables this methodology to “adopt a
supra-individual orientation in the investigation of human experience” (p. 1).
“It is as relations between the individual and his or her world that conceptions
appear” (Ahlberg, 1992). Thus, the aim of phenomenography is to describe; the
kind of objects being described are conceptions (Svensson, 1997) (Figure 9).
These conceptions can be defined as ways “of seeing something, a qualitative
relationship between an individual and some phenomenon” (Johansson, Marton
and Svensson, 1985, p. 235).
Figure 10. The aim and objects of phenomenography (after Svensson, 1997).
Categories of Description
Conceptions are distilled from within categories of description, wherein the
results of phenomenographic research are “presented as carefully described and
qualitatively distinct categories in which are captured individuals’ conceptions of
Aim
describe
Objects
conceptions
ways of seeing something … a relationship between an
individual and a phenomenon (Johansson et al., 1995)
Outcome Space
diagrammatic representation of interrelations between
conceptions (Hazel et al., 1997)

108
the phenomenon in focus” (Ahlberg, 1992). However, the phenomenographic
approach does not presume conceptions to be individual qualities. Rather, they
are considered to be categories of description, which may “facilitate the grasp of
concrete cases of human functioning” (Marton, 1981a, p. 177).
Säljö (1994) has called for clarification in the way in which categories of
description denote conceptions. To this, Bowden (1994) asserts that categories
of description should not be equated with conceptions. Rather, categories of
description are to be determined by discerning commonalities in student
conceptions of the phenomenon being discussed (Keyes & Orr, 1995). Eklund-
Myrskog (1996) clarifies the process, indicating that, when we compare “the
similarities and differences between individuals’ utterances, these are categorised
in such qualitatively different categories, which finally define a category
system”. The results of phenomenographic research can thus be considered in
terms of relationships between conceptions which are distilled from the
categories of description: “since some categories of description appear in
different situations, the set of categories is thus stable and generalisable between
the situations, even if the individuals move” (Marton, 1981a, p. 177).
Outcome Space
Lindblad (1983) further argues that, in phenomenographic research, it is
necessary to “distinguish between what is conceived of a phenomenon and how
this phenomenon is conceived”. For this reason, Hazel, Conrad and Martin
(1997, p. 213) note that a critical feature of phenomenographic investigation is
the generation of an “outcome space”. This reflects the integration of different
ways that people “understand and conceptualise the content of specific
problems” (Ahlberg, 1992). Renström, Andersson and Marton (1990) similarly
describe the outcome space as a system that illustrates the logical interrelations
between the “different conceptions, their varying internal structures, and the
alternative forms of conceptions found” (p. 555). Hence, from investigating the
“most distinctive feature that differentiates alternative ways of understanding a
phenomenon …[an outcome space can be developed that]...is a visual or

109
diagrammatic representation of the categories of description which illustrates the
relationships between them” (Bruce, 1992, p. 45).
The current research problem may be investigated within the qualitative
paradigm (Lancy, 1993). Since phenomenography is a “research specialisation
aimed at describing conceptions of the world around us” (Marton, 1994), it is an
appropriate methodology for the current study; enabling student conceptions of
GIS, and the relationships between them, to be identified and described.
Categories of description will emerge through discursive analysis; conceptions
will be distilled from within these categories of description; and, an outcome
space will be generated, thus presenting a tool that “captures and communicates
the features of [those] conceptions” (Bruce and Gerber, 1996, pp. 5-8).
Summary of Method
The techniques and procedures adopted to gather data are collectively known as
the method (Arminio, 2002). This section will outline the method used to collect
data related to the research question. It will then include consideration of ethics,
trustworthiness and design limitations associated with the method.
Understanding the Context: Conversations with Teachers
Conversations were held with staff at each school to identify the specific contexts
in which the participating students had gained their lived experiences of GIS.
These were held with staff from each participating school who were involved in
teaching Senior Geography with an element of GIS. To gain a broader
understanding of the context in which GIS was incorporated, Heads of
Department were also invited to participate (for two of the schools, the teacher of
Senior Geography was also the Head of Department).
The information gleaned from these conversations related to two aspects of each
school:

110
1. The specific characteristics of each school, including details of: its location,
demographic composition and curriculum; the place of GIS within its
curriculum; teacher expertise in the use of GIS and their attitudes and perceived
impediments to its use in the school; and, the technical and other support for the
use of GIS.
2. The specific characteristics of the participants from each school, including
details of: the number of participants from each year level; the proportion of OP-
eligible and OP-ineligible students; the proportion of male and female students;
the number of participants in each interview; conditions surrounding the
interviews; and, if needed, any teacher comments about any aspect of their
students’ participation.
These conversations were scheduled for the convenience of staff involved, and
were undertaken before, during and subsequent to attending schools to interview
students.
Data Collecting: Conducting Interviews
The interview is a critical element of phenomenographic research (Gerber, Kwan
& Bruce, 1993). To this, Willmett (2002) cites Crotty’s (1998) three
considerations for interview design: the nature of the interview; the interviewing
techniques; and, the setting for the interview. Bruce (1994b) further explores the
particularities of interviewing within phenomenographic research, delineating its
distinctive aims, focus, design, role of the interviewer and implementation.
Following the theses of Costin (2000) and Willmett (2002), discussion of the
method that was employed by the current study will follow Bruce’s structure.
The distinctive aims of the interviews
The purpose of the interview is to create a “natural extension of the [established]
social relationships” (Burns, 2000, p. 411). Specifically, the aim of the interviews
was to explore participants’ various understandings of the phenomena of GIS.

111
The interviews revealed these understandings by providing for the discursive
exploration of participant experiences of GIS, from which categories of
description could be established.
The focus of the interviews: Synergetic Focus Groups (Talking About
GIS)
Traditional focus group interviews gather data from participants who are guided
through discussion of set topics (Crotty, 1998). This allows rich qualitative data
to be elicited from respondents (Marton, 1986). The advantages of these focus
group interviews have been discussed by, among others, Anderson (1990), Crotty
(1998), Lidstone (1996), Willmett & Lidstone (2003), and Wilson (1997).
However, in synergetic focus groups, the facilitator removes himself/herself from
the discussion or from directing the discussion and encourages the open
exchange of views from the participants. Thus, by allowing participants to
engage in a discussion that is not predetermined, the use of synergetic focus
groups provides a number of additional benefits. This distinction between
traditional focus groups and phenomenographic focus groups is addressed by
Willmett and Lidstone (2003):
while a phenomenographical approach to research requires that participants
explore the outer perimeters of their understandings, the security provided by
the group data collection methods provides a non-threatening environment in
which such revelations may be made.
A major strength of synergetic focus groups is the twofold potential for
participant discussion of issues that have been unanticipated by the researcher
(Anderson, 1990) and “considerable potential to encourage conversations”
(Willmett & Lidstone, 2003). Krueger and Casey (1994, p. 34) add that they are a
“socially oriented research procedure” wherein participants can both contribute
to and be influenced by the dynamism of group interaction. Participants can
explore their own qualitatively different conceptions, thus enabling an open and
deep discussion of “the phenomena which are seen, experienced or understood”
(Bruce, 1994b, p. 50). Willmett and Lidstone (2003) succinctly capture the
112
thoughts of several authors who “promote the advantages of free ranging
discussions among members of the group where a moderator plays a minimal
role”.
Although the interview is “a crucial instrument for data collection” within the
phenomenographic research specialisation (Francis, 1993, p.68), Säljö (1993, as
cited in Breen, 1999, p. 3) observes the need to ensure “a shared communicative
context” between all people involved in an interview. To achieve this common
understanding between interviewer and interviewee/s, the interview may be
preceded by either posing problems, or “by referring to shared topics of
discourse” (Breen, 1999, p. 3).
In her study of the conceptions of History held by 17 year old students, Costin
(2000, p. 155) noted that commencing her interviews with a “what is…” question
was “threatening as a starting point in the interview”. For this reason, it is
appropriate to commence a synergetic focus group with an introductory
monologue (Le Bhers, 1998). Following the recommendation of Skrzecynski and
Russell (1994), the introductory monologue in this study: welcomed participants
and assured them of confidentiality; advised participants of the purpose of the
interview and the meaning of relevant terms; and, introduced the topic for
discussion by presenting “a wide range of ideas which are not confined to those
that the researcher sees as appropriate” (pp. 369-70). To ensure consistency
across groups, the introductory monologue was written, and was crafted to
prompt “participants to speak openly in a consenting environment” (Le Bhers,
1998, p. 44). Based on personal experience of conducting synergetic interviews
with students of this age (see, for example, West 2003a, 2006a, 2006c), and
following the method of Irvine (2005), a series of open-ended prompts was
designed to motivate students to reflect on and describe their experiences of GIS.
This step both aligned student discussion to the central phenomenon and elicited
from them the referential and structural elements of their conceptions. Both
introductory monologue and open-ended prompts are included as Appendix G
and Appendix H, respectively.

113
Following the advice of Willmett and Lidstone (2003), a number of
considerations were addressed to ensure an environment commensurate with free
discussion and reliable data collection. First, students were provided with
comfortable seating and individual tables, and systems cards and pencils for
note-taking. Second, two recording devices were used, with microphone
extension cables allowing the tape recorder to be operated without distraction to
participants. All students agreed that their conversation could be recorded.
The role of the interviewer and Implementation of the Synergetic Focus
Groups
It was important for the interviewer to plan the interview structure and approach
to ensure that it led the discussion in certain directions (Costin, 2000). However,
the level of structure was not to an extent that it undermined the benefits of
synergetic focus groups; where, as discussed above, they allow for the
emergence of issues about which the interviewer is unaware (Willmett, 2002). In
this regard, and following the recommendations of Creswell (2002), the
researcher’s role in interviewing students about their conceptions of GIS
involved consideration of nine steps. An abridged version of these is illustrated
in Table 9. These steps guided the development of the specific activities
undertaken within this investigation.
Participant Selection
It was essential that the selection of participants allowed data to be collected that
related to the central phenomenon and research question. Given the emphasis of
this research upon student conceptions of GIS within a specific context, it was
appropriate to ensure that the participants reflected natural groupings that would
either exploit or support that context. In this regard, Burns (2000) recommends
“choosing a naturally existing unit [or units] that the participants may see as
distinct, and which the observer recognises has a distinct identity of its own” (p.
462).
114
Given this requirement, a non-probability sampling method was considered the
most appropriate. Specifically, an opportunity sampling strategy was employed.
While some may argue that opportunity sampling may preclude the possibility of
generalisation to a wider population (Atkinson, Coffey & Delamont, 2003;
Walters, 2001-02), it did allow for the emergence of student conceptions of GIS.
Furthermore, it capitalised upon the existing educational-social context of the
participants.
In light of this, the research involved ten groups of students, each comprising
between four and fifteen participants; while standardised group size was
intended, this was not possible within the school contexts in which the interviews
occurred. Each group studied Senior Geography at a Queensland school at the
time of data collection and had been exposed to the use of GIS as part of their
geography education. The schools from which the sample groups were drawn
reflect a range of educational contexts: public and independent, co-educational
and single sex, and urban and regional. A detailed description of participants and
the contexts in which they both experienced GIS and were involved in this
research is provided later in this chapter.

115
Table 9.
Nine steps involved in conducting interviews (after Creswell, 2002, pp. 207-
209).
No. Step Description
1 Identify the interviewees • Determine the most appropriate sampling strategy
to achieve the research aims
2 Identify the type of interview • Determine the most appropriate interview format
to answer the research questions
3 Audio-tape the entire
interview
• Ensure that an accurate recording of the
conversation is undertaken.
• Use recording equipment suitable for both site,
type of interview and participants
4 Locate a quiet, suitable place
for conducting the interview
• Select a site that is likely to present minimal
distraction and is suited to audio-recording.
5 Obtain consent from
interviewees
• Have each interviewee complete an informed
consent form before commencement (Appendix F)
• Prior to commencement of each interview, convey
to participants the purpose of the study, the
intended duration of the interview, the intended use
of results and the availability of those results once
completed
6 Take brief notes during the
interview
• Record notes and observations using an Interview
Protocol
• Use an abbreviated form of note-taking to increase
the proportion of the conversation that is recorded
in this form
7 Have a plan, but be flexible
• Adhere to intended plan during the interview, but
allow participant conversation to proceed
unimpeded
8 Use probes to obtain
additional information
• Use probes (classifying and probing) to elicit more
information about each question, to clarify points
or ideas expressed by participants
9 End and exit the interview
• Thank the participants, assuring them of the
confidentiality of their responses, offer to provide
summary of results once completed

116
Analysis: finding and describing categories of description
The analysis proceeded through five stages, reflecting Willmett’s (2002)
condensed version of Dahlgren and Fallsberg’s (1991) process. These stages are
described individually.
Stage 1. Familiarisation
Initial analyses of interview data proceeded in two parts.
The first part involved a process of familiarisation that commenced with the
recordings being transcribed. Duplicates of both audio-tapes and transcripts
were made and stored in an independent location. Following the methods of
Costin (2000) and Willmett (2002) and the recommendation of Ashworth and
Lucas (2000), this was followed by: repeatedly listening to the recordings;
reading and re-reading the transcripts, sometimes in concert with listening to the
recordings; making notations on the transcripts related to sections of the dialogue
that appeared initially relevant and significant. To enable links to be explored
within and between transcripts, a system of identifying interviews was developed
and implemented. This is detailed in Chapter Four.
1

117
The second part of familiarisation for analysing interview data involved the
tentative identification of participant’s “understandings, beliefs and awarenesses”
(Costin 2000, p. 160). These were transcribed to individual cards, on which the
participant’s name and location within the transcript were recorded. The words
spoken by the participant were likely be recorded in one, uniform, colour.
Comments by the researcher were also added to link the participant’s words to
the “images” that appeared about participant’s understandings (p. 160); these
were recorded in a second, uniform, colour.
Stage 2. Comparing, contrasting and grouping
Following Stage 1, the individual ‘meaning units’ were sought from within the
data. These were delineated by identifying those statements that offered a
somewhat representative version of the entire dialogue; also known as
condensation (Dahlgren and Fallsberg). This process of bracketing arose through
the application of four questions:
What are the participants really saying here?
What issue is being floated here?
1 2
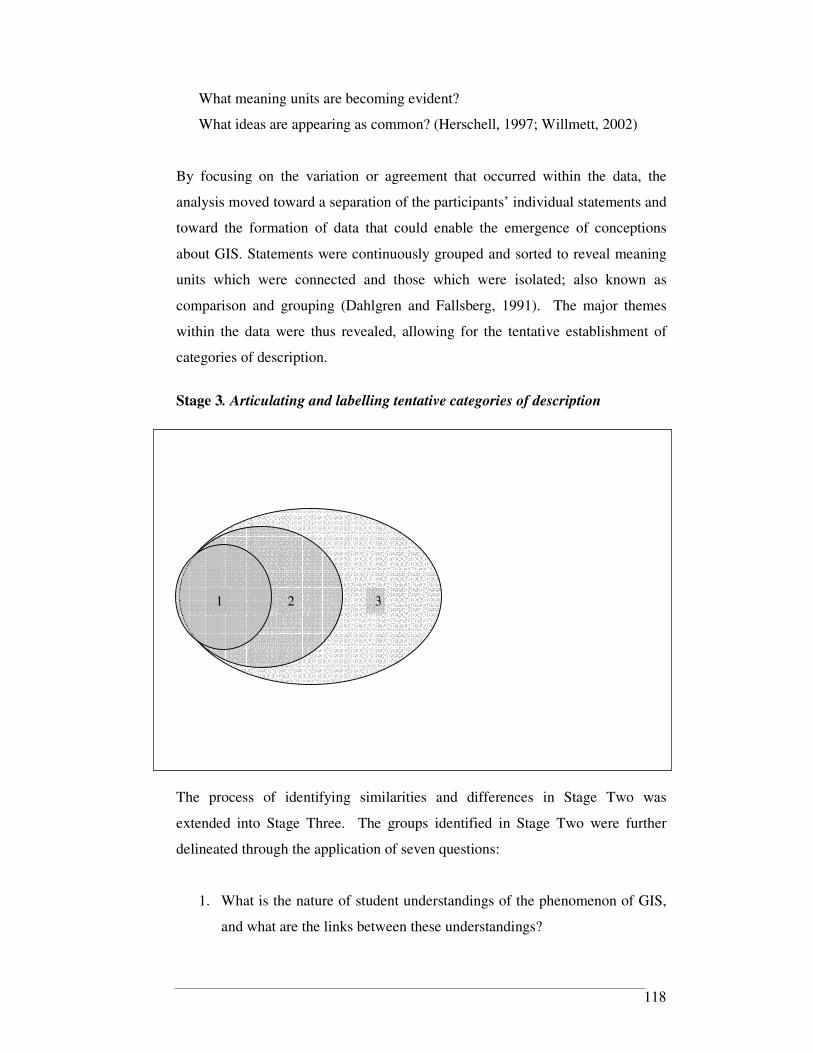
118
What meaning units are becoming evident?
What ideas are appearing as common? (Herschell, 1997; Willmett, 2002)
By focusing on the variation or agreement that occurred within the data, the
analysis moved toward a separation of the participants’ individual statements and
toward the formation of data that could enable the emergence of conceptions
about GIS. Statements were continuously grouped and sorted to reveal meaning
units which were connected and those which were isolated; also known as
comparison and grouping (Dahlgren and Fallsberg, 1991). The major themes
within the data were thus revealed, allowing for the tentative establishment of
categories of description.
Stage 3. Articulating and labelling tentative categories of description
The process of identifying similarities and differences in Stage Two was
extended into Stage Three. The groups identified in Stage Two were further
delineated through the application of seven questions:
1. What is the nature of student understandings of the phenomenon of GIS,
and what are the links between these understandings?
1 2 3
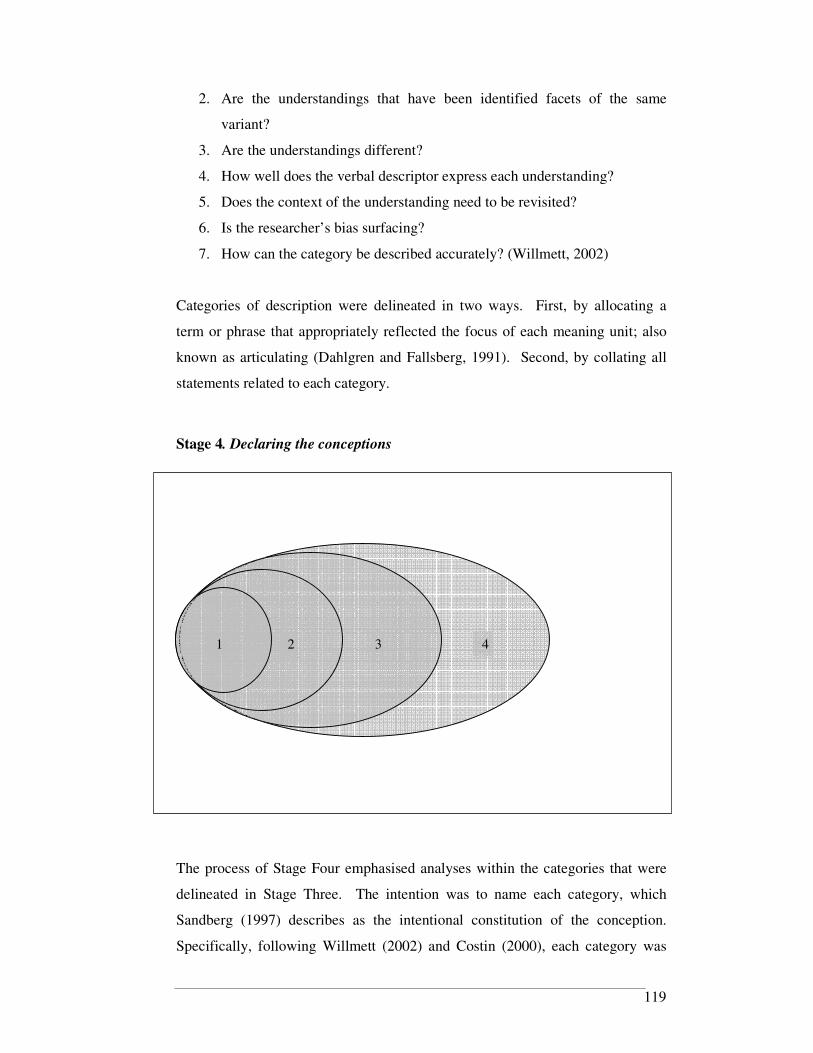
119
2. Are the understandings that have been identified facets of the same
variant?
3. Are the understandings different?
4. How well does the verbal descriptor express each understanding?
5. Does the context of the understanding need to be revisited?
6. Is the researcher’s bias surfacing?
7. How can the category be described accurately? (Willmett, 2002)
Categories of description were delineated in two ways. First, by allocating a
term or phrase that appropriately reflected the focus of each meaning unit; also
known as articulating (Dahlgren and Fallsberg, 1991). Second, by collating all
statements related to each category.
Stage 4. Declaring the conceptions
The process of Stage Four emphasised analyses within the categories that were
delineated in Stage Three. The intention was to name each category, which
Sandberg (1997) describes as the intentional constitution of the conception.
Specifically, following Willmett (2002) and Costin (2000), each category was
1 2 3 4

120
evaluated to: establish the focus of its variant; determine if it has a sense of
wholeness, integrity and logic; and, discover an appropriate image from the data
to illustrate its central focus. Declaration of the conceptions was through the
construction of a suitable linguistic expression to denote the various categories;
also known as labelling (Dahlgren and Fallsberg, 1991).
Stage 5. Constructing the outcome space
The final stage in the analyses of data was the construction of an outcome space.
This involved the arrangement of the qualitatively different conceptions in such a
way as to communicate the different ways that the participants understand and
conceptualise GIS. Generation of the outcome space occurred as a continuous
and recursive component of the data analyses; a cyclical rather than linear
progression, culminating in a diagrammatic representation of patterns that exist
within and between the conceptions.
Categories of description, conceptions and the outcome space are described,
defined and justified in Chapters Five. The implications of these findings are
considered, limitations discussed and recommendations for future actions made
in Chapters Six and Seven.
1 2 3 4 5
121
Trustworthiness of Research Outcomes
Within qualitative research, trustworthiness and reliability are drawn from the
“dependability that the results make sense and are agreed on by all concerned”
(Burns, 2000, p. 475). The trustworthiness of the research outcomes depends on
a number of issues being addressed within the planning, implementation and
analysis stages. Specifically, this section will describe how this research has
included consideration of ways to ensure trustworthiness of both data collection
and analysis.
A cursory review of published literature will reveal a broad range of design
elements within phenomenographic research. The number of participants, their
representativeness, interview design, participant age, group size, site selection,
recording method, transcription method and coding method, among other, all
appear to be quite variable (see, for example, Ahberg-Bengtsson and Ottoson,
1995; Bruce, 1994a; Dahlin and Regme, 1995; Dall Alba, 1994; Gerber, 1992b;
Gerber and Kwan, 1995). Despite the variations, and as with other
methodologies, phenomenographic research does present some limitations.
Awareness of these served to pre-empt and mitigate any undue influence on the
trustworthiness of the research outcomes.
Participants were drawn from four schools. By inviting all students enrolled in
Senior Geography at these schools, the research presented the opportunity to
collect the lived experiences of 109 students. As with other interpretive
approaches to research, its goal is not to identify universal laws, but is to
“understand particular actions and meanings in particular” (Smith, 1987, p. 176).
For this reason, Pinnock’s (2003) concern that the broad diversity within samples
utilised in phenomenographic research can adversely affect the findings of
research is moot. Notwithstanding this, by “looking at the specific .., [qualitative
inquirers seek to] … understand it in particular and to understand something of
the world in general” (Glesne, 1999, p. 153). Hence, by studying the conceptions
of GIS held by this particular group of 109 students, and within a specific context
– Senior Geography - it enables conceptual generalisations rather than statistical
122
generalisations to be made by identifying the range of conceptions that exist
amongst the participants.
Willmett (2002) and Willmett and Lidstone (2003) outline a number of
disadvantages related to the use of synergetic focus groups within
phenomenographic research. They note that a skilled interviewer is needed, and
for three reasons. First, the interviewer needs to create a comfortable physical
environment and emotional environment for participants. Second, the
interviewer needs to craft the introductory monologue skilfully to focus
participants on the discussion. Third, the interviewer needs to manage the
interview preparation process such that the need for participant incentives is
obviated and so that participants will ultimately “feel comfortable to share their
perceptions with others”. A further potential limitation relates to ensuring that
enough groups are formed to “balance the idiosyncrasies of individual sessions”
(Krueger, 1994, p. 36) although Willmett and Lidstone state that in their
experience this is rarely a problem.
Credibility of the findings can be assured in a number of ways. Hence, the
above limitations were mitigated through several design elements. With respect
to the first limitation, since the participants were school students, their physical
comfort during the research process was assured through use of those school
facilities (rooms, furniture) with which they were already familiar. Similarly, the
participants were familiar with each other and had considerable experience in
working with each other; the emotional comfort of the participants during the
research was thus expected at least to equal that of their usual school routine.
For the current research, the groups were those that pre-existed within the entire
population being sampled. This serves to preclude Leinhardt, Stainton and
Bausmith's (1998) concerns about conflict among group members and self-
withdrawal from participation. Following the advice of Willmett and Lidstone
(2003) and where practicable given the particular constraints of the sampling
environments, the size of each synergetic focus group was planned to be between
six and eight students. Groups of about this size provide more opportunities for
individuals to speak and group support may more quickly develop. Having said

123
this, in the event, groups ranged from four to fifteen students; this variation in
group size reflected the unique circumstances of each cohort of each school, such
as, but not limited to class size, timetabling and time constraints, and attendance.
Arranging groups of this size range enabled several groups to be interviewed
within each geographical context and exploited extant groups from within the
total sample population. [Characteristics of each synergetic focus group are
provided later in this chapter.]
The capacity of individual researchers fully to explore the data collected through
phenomenographic methods has been questioned (Bowden, 1994; Marton, 1983;
Säljö, 1994; Sandberg, 1995). Indeed, the trustworthiness of the interpretations
made will depend upon the awareness of the researcher of his own biases and
subjectivity. Sandberg (1995, p. 156) recommends that “interpretive awareness”
be maintained through the process of data analysis to establish reliability of
phenomenographic results. Following the recommendation of Glesne (1999),
this researcher mitigated this by continually asking questions such as: Whom do I
not see? Whom have I seen less often? Where do I not go? Where have I gone
less often? With whom do I have special relationships, and in what light would
they interpret phenomena? What data collecting means have I not used that
could provide additional insight?
Within phenomenographic research, Breen (1999) observes the possibility for
participants to talk about an area of knowledge in such a way that it seems as
though they hold a well-developed conception of the subject, whereas in reality
they may not. Similarly, Marton (1983, p. 289) argues that we should
“distinguish between categories of description and that which is being
described”. Moreover, Säljö (1994, p.71) suggests that “the role of differences in
conceptions of the world should be utilised much more restrictively”.
In response to these issues, the process of planning, data collection and data
analysis involved others. Specifically, the researcher’s interpretations were
checked against those of others with whom the threefold process of developing
coding strategies, applying coding strategies, and interpreting coded data is
shared. Likewise, the findings and interpretations of the researcher were

124
checked against those of others, and in two ways. First, intersubjective
agreement was achieved by the researcher and three others independently
agreeing on both the allocation of statements to categories, and the categories
themselves. Any disagreements were resolved by collaborative exploration of
the statements and/or categories with respect to the total body of data, and
attainment of consensus judgements. To further obviate any potential bias in the
research process, two of the other critical friends at this stage of the analysis
possessed limited knowledge or no teaching experience with either GIS or the
Senior Geography syllabus.
The purpose of phenomenographic research is not to develop generalisations. It
is, rather, to identify the conceptions held within a group of people within a
particular context. The transferability of the outcomes of such an investigation
are discernible through comparison of the context in which the research was
undertaken with other, perhaps similar, contexts. For this reason, the processes
by which data were collected and analysed have been clearly outlined. This
follows Francis’ (1993) recommendation for phenomenographic research
procedures and their justification to be reported in full. For this research, the
thesis includes rich description of several factors that influence the
trustworthiness of the reported results: any limitations to the implementation of
the intended method; any data source that was unavailable or partially
unavailable; any particularities of the study site or participants that could
influence the interpretation of data and wider application of its results (Glesne,
1999). In this respect, reliability of the conclusions is established through the
explicit documentation of all steps and procedures that have been undertaken
(Francis, 1993).
Ethical Considerations
Within research, ethical considerations relate both to the research subject matter,
and the research method and procedures. The purpose of this section of the
Chapter is to describe the ethical issues that were considered in tandem with the
development and implementation of the current research.

125
According to Glesne (1999, p. 113), ethical “considerations are inseparable from
your everyday interactions with research participants and with your data”.
Because the ethical dimension permeates all aspects of the research process, it
was essential that ethical issues be considered at every stage of that process.
This section will outline those ethical issues that are common to research before
identifying specific considerations to ensure that the current research was
undertaken ethically.
While different epistemologies may present particular ethical issues, there are a
number of ethical issues common to research (Glesne, 1999).
The disparity of power within the researcher-participant relationship adds to the
onus on researchers to protect the rights of the participants (Glesne, 1999;
Williamson & Prosser, 2002). Furthermore, since the role of the researcher is not
simply one of data gatherer, it is likely that the qualitative researcher is well
placed to determine what constitutes ethical research. In this regard, any threat
to the ethical integrity of the method was identified and mitigated during the
course of this research. These threats and associated mitigants were drawn from
reference to Burns (1997), Flick (2006), Kvale (1996), Merriam (1998), Murphy
(2000), Orb, Eisenhauer and Wynaden (2001), Smith (1995) and Williamson and
Prosser (2002). A summary of these is presented in Table 10.
Selecting the Participants for the Study
The purpose of this section is to describe the characteristics of the participating
schools and students. This information is presented to enable others to make
judgements about the extent to which the findings of the present investigation
may be transferred to other contexts by way of conceptual generalisation.
This description is presented in two stages. First, the specific characteristics of
each participating school will be introduced. These will include details of: its
location, demographic composition and curriculum; the place of GIS within its
curriculum; teacher expertise in the use of GIS and their attitudes and perceived
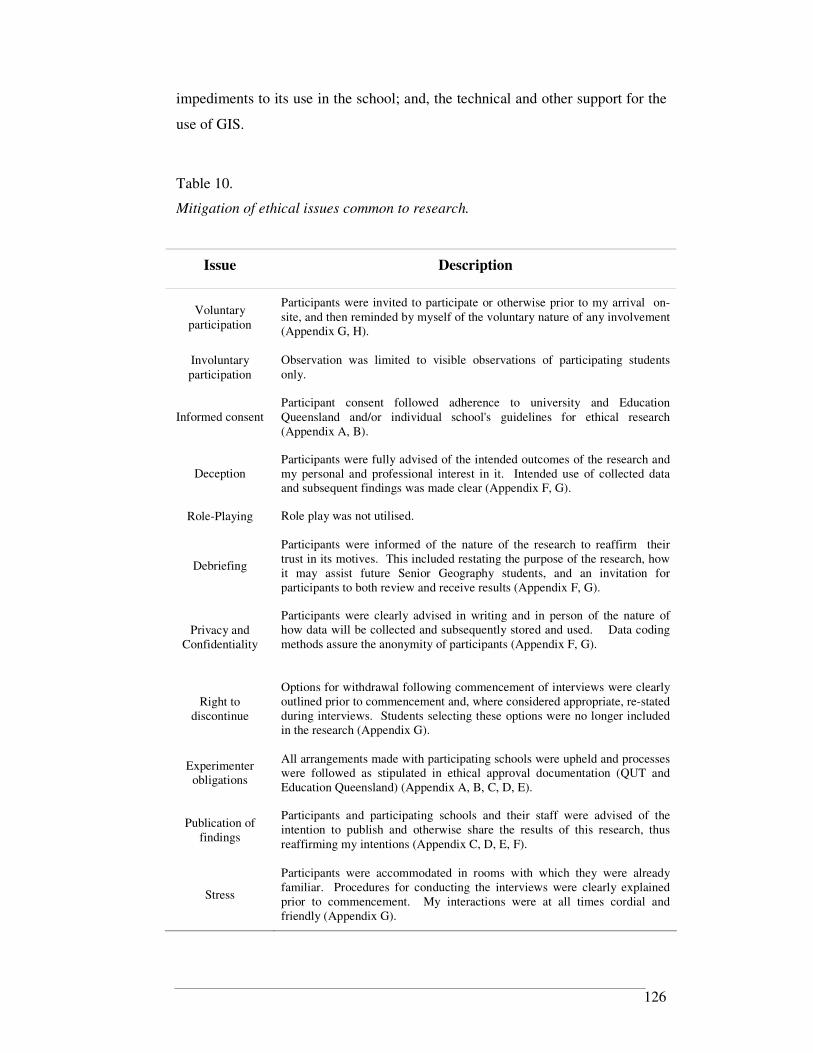
126
impediments to its use in the school; and, the technical and other support for the
use of GIS.
Table 10.
Mitigation of ethical issues common to research.
Issue Description
Voluntary participation
Participants were invited to participate or otherwise prior to my arrival on-site, and then reminded by myself of the voluntary nature of any involvement (Appendix G, H).
Involuntary participation
Observation was limited to visible observations of participating students only.
Informed consent Participant consent followed adherence to university and Education Queensland and/or individual school's guidelines for ethical research (Appendix A, B).
Deception Participants were fully advised of the intended outcomes of the research and my personal and professional interest in it. Intended use of collected data and subsequent findings was made clear (Appendix F, G).
Role-Playing Role play was not utilised.
Debriefing
Participants were informed of the nature of the research to reaffirm their trust in its motives. This included restating the purpose of the research, how it may assist future Senior Geography students, and an invitation for participants to both review and receive results (Appendix F, G).
Privacy and Confidentiality
Participants were clearly advised in writing and in person of the nature of how data will be collected and subsequently stored and used. Data coding methods assure the anonymity of participants (Appendix F, G).
Right to discontinue
Options for withdrawal following commencement of interviews were clearly outlined prior to commencement and, where considered appropriate, re-stated during interviews. Students selecting these options were no longer included in the research (Appendix G).
Experimenter obligations
All arrangements made with participating schools were upheld and processes were followed as stipulated in ethical approval documentation (QUT and Education Queensland) (Appendix A, B, C, D, E).
Publication of findings
Participants and participating schools and their staff were advised of the intention to publish and otherwise share the results of this research, thus reaffirming my intentions (Appendix C, D, E, F).
Stress
Participants were accommodated in rooms with which they were already familiar. Procedures for conducting the interviews were clearly explained prior to commencement. My interactions were at all times cordial and friendly (Appendix G).

127
Second, the specific characteristics of the participants from each school will be
introduced. These will include details of: the number of participants from each
year level; the proportion of OP-eligible and OP-ineligible students; the
proportion of male and female students; the number of participants in each
interview; conditions surrounding the interviews; and, if needed, any teacher
comments about any aspect of their students’ participation.
This information was collected to contextualise the investigation, and was
obtained through informal conversations held with staff involved in the teaching
of Senior Geography at each school.
The Schools and Their Characteristics
School A
School A is a co-educational government school that caters for 1450 students
from grades 8 – 12 in a regional Queensland city.
All students in grades 8, 9 and 10 study the key learning area of Studies of
Society & Environment, to which is allocated five 40 minute lessons each week.
Students in grades 9 and 10 also have the option of studying Geography as a
discrete subject, to which is allocated an additional four 40 minute lessons each
week. Topics are studied in line with the route of inquiry and assessment
instruments and assessment criteria reflect those from the Senior Geography
syllabus.
GIS is a compulsory part of School A’s Grade 8-10 SOSE and Grade 9-12
Geography curricula. SOSE is compulsory for all students. The way in which
GIS are utilised within Senior Geography at School A is outlined in Table 11.
Of the 509 grade 11 and 12 students, 20 (7.1%) and 14 (6.2%) study Senior
Geography, respectively. Five 40 minute lessons are allocated per week to each
senior subject, with at least two of these being combined to form an 80 minute
lesson.

128
Teachers of Senior Geography are all trained specifically to teach Geography.
Additionally, in-house training is provided for staff in the integration of GIS
within the school’s Geography and SOSE curricula. To further assist teachers,
highly prescriptive, step-by-step, instruction sheets are provided to scaffold the
mandated GIS tasks. Beyond the compulsory elements, some teachers avail
themselves of the opportunity to exceed the minimum requirements in line with
their own levels of interest and/or expertise. However, this must not involve
duplication of any aspect of the curriculum of any other subject.
The teachers involved in teaching with GIS appear to be cognisant of advantages
and disadvantages for students in doing so. The advantages include: relevance
from using an industry level software package; relevance from being able to
undertake more tasks that more fully meld student lives and the syllabus;
improved spatial/visual literacy; greater enjoyment of geography studies; real-
world tasks. Beyond the students, the publicity that GIS’ use in the curriculum
had created was seen as beneficial for the school. Perceived disadvantages
include: the time it takes to learn how to use it; the time it takes to teach how to
use it; and, the differing capabilities and interests of staff were likely to influence
how different students used GIS. Whereas some were limited to the compulsory
items, others were exposed to additional studies involving GIS. An impediment
to the broader use of GIS was seen to be the school’s stated emphasis on teacher-
centred learning, because this limits the scope for GIS’ flexible use in classroom
learning, e.g., individual and/or group-based tasks rather than whole-class tasks.
School A uses ArcView 3.2. While they also possess version 9.0, this is not used
widely due to the belief that the data sets used with 3.2 are incompatible with this
later version. The software is installed on individual computers. Data are filed
on the network, but are accessible to students as read-only files. As needed,
students save projects to their own network folders.
The computer resources needed to teach with GIS are also used for other
subjects. Access is, therefore, competitive. To improve the likelihood of being
allocated the time needed for GIS to be used, the tasks involving GIS are linked

129
directly to assessment items. At School A, priority allocation of computer
resources is directed to assessment related purposes.
Table 11.
The location of GIS within School A Senior Geography curricula.
Theme Topic Main GIS
Activity Length Assessable
Responding to Natural Hazards (Core)
Mapping flood impacts in New
Orleans; flooding &
landslides in local area
6 weeks Yes Managing the
Natural Environment
Managing the Coastal Environment (Elective)
Mapping study area based on
fieldwork
6 weeks Yes
11
People & Development
Contrasting Development (Core)
Mapping indicators of development
6 weeks Yes
Sustaining Urban and Rural Communities
(Core)
Producing choropleth maps
to support decision making
exercises
6 weeks Yes
12 Social
Environments
Investigating Current Planning Issues in Local
Area (Elective)
Evaluating land use in different
urban areas
6 weeks Yes
Technical support for the use of GIS is strong, with the primary proponent for
GIS’ curricular inclusion possessing responsibility for the school’s ICT program
and resourcing. While School A possesses no specific strategic intent to
encourage GIS use, it does provide whatever support is required to enable it.
School B
School B is a co-educational systemic school that caters for 775 students from
grades P – 12 in a regional Queensland city.
All students in grades 8, 9 and 10 study Geography for one semester of each year
(History is studied for the other semester). Two classes of each are scheduled to

130
run concurrently. Each of the Grade 8 classes is allocated four 40 minute lessons
each week. Grades 9 & 10 are allocated five 40 minute lessons each week.
Geography topics are studied in line with the route of inquiry and assessment
instruments and assessment criteria reflect those from the Senior Geography
syllabus. GIS are not mandated within the school’s work programs for either
Junior Geography or Senior Geography. However, the Head of Department
(HOD) indicated that GIS would ideally be used for between 30-50% of
allocated time in Grades 8-10. The reality is that the amount of GIS taught in
these grades depends mostly upon the choices made by the teachers allocated.
Since all Senior Geography classes were taught by a single teacher, who is
comparatively skilled in the use of GIS, this issue does not extend into Grades 11
and 12.
The place of GIS within Senior Geography at School B is outlined in Table 12.
Of the 155 senior students at School B, 38 (47.5%) are enrolled in Grade 11
Senior Geography and 11 (14.6%) are enrolled in Grade 12. There are two
Grade 11 classes, scheduled at different times, and a single Grade 12 class. Five
40 minute lessons are allocated per week to each senior subject, with at least two
of these being combined to form an 80 minute lesson.
Senior Geography is taught by the HOD, who oversees History, Geography and
SOSE curricula. All teachers of geography are trained to do so. Additionally, the
HOD provides in-house training for staff in the integration of GIS within the
school’s Geography curricula. To assist teachers further, the HOD also provides
to geography teachers highly prescriptive, self-paced work sheets for all classes,
including Senior Geography. The HOD intends that this would redueing the need
for teacher training. To further assist students, these work sheets are available to
students and staff via the school’s intranet; however, while the HOD and
geography teachers intend that students access these while at home, they are not
yet able to access the GIS software needed to undertake the activities.
131
As with School A, the teachers involved in teaching with GIS at School B appear
to be cognisant of advantages and disadvantages for students of doing so. The
advantages include: relevance from being able to undertake more “real-world”
tasks; unlimited task options; improved cartographic mapping quality; and,
opportunities to see vocational applications of geographical study. Perceived
disadvantages include: the time it takes to implement stand-alone GIS activities;
and, increasing difficulty in accessing up to data sets since a commercial market
emerged several years ago.
The quality of available professional development was seen as limiting the
quality of GIS’ inclusion within School B’s curriculum. Specifically, teachers
indicated a desire to be taught how to do the things that they see at seminars and
a frustration that so much of the available professional development was about
what you can do with GIS, rather than how to do those things. According to the
interviewed teacher, professional development to date has not been specifically
developed to support Queensland’s Senior Geography. The final difficulty
mentioned was insufficient time to articulate into classroom practice the ideas
and skills that they learned during professional development training.
While School B teachers had considered collaboration to ease the perceived
burdens of using GIS effectively, this was seen as something that was “difficult”.
A similar attitude was held regarding the potential for GIS to integrate studies
across traditionally discrete subject areas.
School B uses ArcView 9.0. The software is installed on individual computers.
Data are filed on the network, and are freely accessible to students. As needed,
students save projects to their own network folders.
The computer hardware resources needed to teach with GIS are also used for
other subjects. While access is, therefore, competitive, teachers indicated that
they “rarely” failed to gain the access that they required for GIS activities. GIS
tasks are usually undertaken by using computer facilities for 2 lessons each week
for a period of 4 weeks. Resourcing is such that the student/computer ratio is
seen by teachers as “good”. Additionally, GIS are used as a teaching aid within
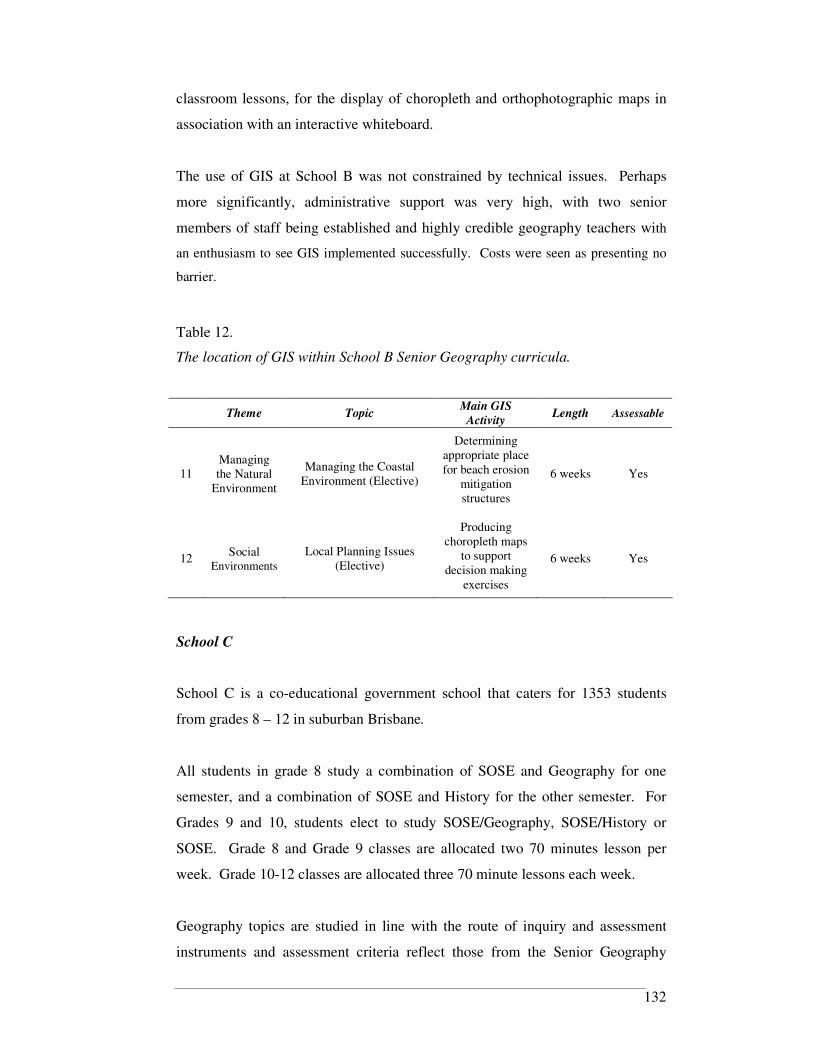
132
classroom lessons, for the display of choropleth and orthophotographic maps in
association with an interactive whiteboard.
The use of GIS at School B was not constrained by technical issues. Perhaps
more significantly, administrative support was very high, with two senior
members of staff being established and highly credible geography teachers with
an enthusiasm to see GIS implemented successfully. Costs were seen as presenting no
barrier.
Table 12.
The location of GIS within School B Senior Geography curricula.
Theme Topic
Main GIS
Activity Length Assessable
11 Managing the Natural
Environment
Managing the Coastal Environment (Elective)
Determining appropriate place for beach erosion
mitigation structures
6 weeks Yes
12 Social
Environments Local Planning Issues
(Elective)
Producing choropleth maps
to support decision making
exercises
6 weeks Yes
School C
School C is a co-educational government school that caters for 1353 students
from grades 8 – 12 in suburban Brisbane.
All students in grade 8 study a combination of SOSE and Geography for one
semester, and a combination of SOSE and History for the other semester. For
Grades 9 and 10, students elect to study SOSE/Geography, SOSE/History or
SOSE. Grade 8 and Grade 9 classes are allocated two 70 minutes lesson per
week. Grade 10-12 classes are allocated three 70 minute lessons each week.
Geography topics are studied in line with the route of inquiry and assessment
instruments and assessment criteria reflect those from the Senior Geography
133
syllabus. GIS is not mandated within the school’s work programs for Junior
Geography and Senior Geography. Interestingly, the Head of Department
reported that the nature and extent of GIS use in the school was a reflection of
the ability and willingness of individual teachers to do so, and to do so in such a
way that they in no way diluted or modified the stipulated programs of study.
Senior Geography classes were taught by two teachers, both of whom are trained
geography teachers. One of them is highly skilled in the application of GIS to
educational contexts, whereas the other possesses relatively few such skills.
At the time of collecting data, School C had used GIS as an element of a single
Theme, Social Environments. These GIS-related activities occupied about five
hours of class time, and were taught solely by the teacher with greatest skill and
experience in its application to educational contexts. The GIS activities
contributed to a single, assessable, task.
Of the 501 senior students at School C, 45 (16.8%) are enrolled in Grade 11
Senior Geography and 35 (15.0%) are enrolled in Grade 12. There are two
classes in each grade, scheduled at different time.
School C offers no training in the use of GIS, and views its use as a “trial”.
Support for its implementation is minimal. Access to necessary computer
resources is “occasionally” problematic, with the majority of GIS related
activities being constructed to support tasks within the usual classroom by using
the teacher’s personal notebook computer.
The teachers involved in teaching with GIS at School C cited the same
advantages, disadvantages and impediments as those from School A and School
B.
School C uses ArcView 9.0. The software is installed on individual computers.
Data are filed on the network and are freely accessible to students. As needed,
students save projects to their own network folders.
134
The use of GIS at School C was frequently constrained by technical issues. The
usual two or three week wait for technical support has resulted in the teacher
reducing the complexity of what the class does with GIS so that any technical
issues can be accommodated.
School D
School D is a co-educational government school that caters for 500 students from
grades 8 – 12 in a metropolitan Queensland city.
All students in grades 8 and 9 study a total of three semesters of Studies of
Society & Environment, to which are allocated three 70 minute lessons each
week. Students in grade 10 elect to study one of History, Geography or Civics
Education, to which are allocated three 70 minute lessons each week. Topics of
geographical investigation within SOSE and in grade 10 Geography are studied
in line with the route of inquiry and assessment instruments and assessment
criteria reflect those from the Senior Geography syllabus.
GIS is not required for SOSE, but it is prescribed within the school’s work
programs for Grade 10 Geography and Senior Geography, requiring one of the
three 70 minute lessons each week that are allocated to each year of the Senior
Geography course. The way in which GIS are utilised within these Senior
Geography curricula at School D is outlined in Table 13.
Of the 200 grade 11 and 12 students, 16 (16%) and 18 (18%) study Senior
Geography, respectively. Three 70 minute lessons are allocated per week to each
senior subject.
Teachers of Senior Geography are all trained to teach Geography. No formal
GIS training has been undertaken by these teachers. Instead, they are largely
self-taught, with occasional attendance at workshops hosted by teacher
associations and/or industry. In line with this, the extent of GIS use greatly
depends on the enthusiasm and commitment of individual teachers.

135
Table 13.
The location of GIS within School D Senior Geography curricula.
Theme Topic
Main GIS
Activity Length Assessable
Responding to Natural Hazards
Murray Darling River (Elective)
Mapping & analysing
relationships causing hazards
10 x 70min lessons
No Managing the Natural
Environment
Managing Catchments
Collecting primary data
related to field study
8 x 70min lessons
Yes
Human Movements (Elective)
Sustaining Urban & Rural Communities
Mapping Our World
10 x 70min lessons
No
11
Social Environments
Planning Places
Collecting & collating data related to field
study
6 x 70 min lessons
Yes
Resources & Environments
Living in Physical Systems
Mapping Our World
7 x 70 min lessons
Yes
Contrasting Development Mapping Our
World 6 x 70 min
lessons Yes
Feeding the World's People
Mapping Our World
4 x 70 min lessons
No 12
People & Development
Local Planning Issues (Elective)
Producing choropleth maps
to support decision making
exercises
6 weeks Yes
The teachers involved in teaching with GIS appear to be cognisant of advantages
and disadvantages for students of doing so. The advantages include: enhanced
relevance due to the professional nature of the software program, and increased
motivation of students; the ease with which GIS applications may be married
with the syllabus, whereby exercises can be easily created for students to use GIS
to meet syllabus needs; the self-paced nature of GIS tasks for students, with
particular benefits being afforded to students for whom English is not the first
language. Perceived disadvantages include: the difficulties of managing students
during teacher-directed portions of GIS tasks; and, the length of time required to
attain a basic level of skill. Perceived impediments include: the time required to

136
prepare GIS-based lessons; and, issues surrounding the compatibility of other
data sources with the software.
School A uses ArcView 3.2. The software is installed on individual computers.
Data are filed on the network, and are accessible through students' own accounts.
As needed, students save projects to their own network folders. A feature of
network security at School D (and a considerable source of frustration for both
student and teacher) is the freeze of a student's account if it remains idle for 5
continuous minutes; a side effect of this is the loss of all ArcView projects on
which the student whose account has been frozen was working.
School D supports, in general terms, the integration of ICT across all curriculum
areas. In terms of GIS, this support has translated into external recognition and
industry grants for the further implementation of GIS, allowing for the purchase
of more recent versions of software, and peripheral hardware such as GPS to
enable GIS to be embedded across all grades. While the computer resources
needed to teach with GIS are also used for other subjects, access is generous,
with time beyond the 70 minute lesson each week usually available if needed.
Technical support for the use of GIS is inconsistent, with initial implementation
being somewhat plagued by difficulties with installation and data management.
This required the teachers involved to educate technical staff in tandem with their
students and themselves.
The Participants and their Characteristics
School A
Three interviews were held at School A. Of the 34 participants, 14 were from
grade 12 and constituted one focus group (Interview 1). The remaining 20 grade
11 participants were interviewed in one group of 12 students (Interview 2), and
one group of 8 students (Interview 3). The characteristics of these students are
shown in Table 14.

137
The composition of the interview groups was based on a combination of
timetabling and self-selection. All year 12 students who wished to participate
were invited to do so during a scheduled geography lesson. The year 11 class
were invited to select which of two sessions at which they would participate.
Interviews were held in the students’ usual geography classroom.
Table 14.
Characteristics of School A participants.
OP-eligible OP-ineligible
Int. 1 Int. 2 Int. 3 Int. 1 Int. 2 Int. 3 n
Male 6 7 6 0 1 0 20
Female 6 0 5 2 0 1 14
n 30 4 34
Teacher observation was that the groupings reflected social preferences from
within the classes. Interview 1 comprised contributions from all but four
students. By contrast, all students in Interview 2 and Interview 3 contributed to
the discussion.
School B
Three interviews were held at School B. Of the 41 participants, 10 were from
grade 12 and constituted one focus group (Interview 1). The remaining 31 grade
11 participants were interviewed in one group of 13 students (Interview 2), one
group of 10 students (Interview 3) and one group of 8 students (Interview 4).
The characteristics of these students are shown in Table 15.
The composition of the interview groups was based on a combination of
timetabling and self-selection. All year 12 students who wished to participate
were invited to do so during a scheduled geography lesson. Grade 11 students
for Interview 2 participated during their usual geography lesson time. Interview
3 occurred during those students’ usual geography lesson time. Interview 4 was
also held during a scheduled geography lesson, although these participants were

138
drawn from both this scheduled lesson, and those students from the other
geography class who were unavailable to participate in Interview 2. Teacher
observation was that the groupings reflected social preferences from within the
classes. No other teachers were present during the interviews. Interviews were
held in the students’ usual geography classroom.
All students made some contribution to the discussions.
Table 15.
Characteristics of School B participants.
OP-eligible OP-ineligible
Int. 1 Int. 2 Int. 3 Int. 4 Int. 1 Int. 2 Int. 3 Int. 4 n
Male 1 4 4 2 1 2 0 0 14
Female 8 7 6 6 0 0 0 0 27
n 38 3 41
School C
One interview was conducted at School C. All participants were members of a
single Grade 11 geography class (Interview 1). The characteristics of these
students are shown in Table 16.
The interview occurred during a scheduled geography lesson, and in the students’
usual room. The students’ usual class teacher was present during the room, but
did not participate. Contributions were made by 12 of the 15 participants.

139
Table 16.
Characteristics of School C participants.
OP-eligible OP-ineligible n
Male 2 1 3
Female 11 1 12
n 13 2 15
School D
Three interviews were held at School D. Of the 19 participants, 7 were from
grade 12 and constituted one focus group (Interview 1). The remaining 12 grade
11 participants were interviewed in one group of 8 students (Interview 2), and
one group of 4 students (Interview 3). The characteristics of these students are
shown in Table 17.
Table 17.
Characteristics of School D participants.
OP-eligible OP-ineligible
Int. 1 Int. 2 Int. 3 Int. 1 Int. 2 Int. 3 n
Male 2 3 2 0 1 0 8
Female 5 1 2 0 3 0 11
n 15 4 19
The interviews occurred during a scheduled geography lesson, and in a room
familiar to the students; either in their usual classroom, or in the classroom
attached to the school library. The interview of grade 12 students occurred during
their final lesson of the year. Grade 11 students were interviewed immediately
prior to submission of an assignment; non-participation of six of the 18 grade 11
students was due to their preference to use class time to complete that task. The

140
students’ usual class teacher was not present during the interviews, but did enter
Interview 2 briefly. Contributions were made by all students.
Chapter Summary
This Chapter delineates the epistemological basis for adopting a
phenomenographic approach to investigate the research question of this study
and outlines the specific method that was adopted to investigate the central
phenomenon of this study: student conceptions of GIS.
The chosen methodology was selected by evaluating a descending hierarchy of
four epistemological decisions with respect to the specific research question.
First, an idiographic approach was required to investigate students’ individual
experiences of GIS, rather than the nomothetic approach which would investigate
students and/or GIS itself. Second, a qualitative approach enabled an exploration
of the way in which students engage with GIS, rather than the quantitative
attempt to somehow measure the experience. Third, a constructivist approach
recognised that students’ conceptions were based upon the knowledge of it that
they created through engagement with it, rather than the subjectivist approach
which would assume some imposition of the investigator’s own experience of
GIS. Fourth, whereas researching from a first order perspective would enable the
investigation of GIS, investigating students’ experiences of GIS required this
investigation to proceed from a second order perspective.
The chosen method was selected by evaluating the phenomenographic approach
with respect to the unique nature of the research question. First, it reviewed the
central assumptions of phenomenographic inquiry and their relevance to the
current study. Second, it outlined the use of synergetic focus groups as the basis
for the collection of discursive data and the role of the interviewer in these
interviews. Third, it described the purposive sampling method needed to ensure
data collection was commensurate with the aims of the research. Fourth, it
declared the manner by which data were analysed to find and declare student
141
conceptions and their cogent outcome space. Mitigants to threats to both the
trustworthiness and ethicality of this research were introduced.
Chapter Three concluded with a description of the salient aspects of GIS'
placement within the curricula of the sample schools and the salient
characteristics of the sample population of students. This information is
presented to enable readers to make decisions about the extent to which the
students’ conceptions of GIS emerging from this range of schools may be
transferred to other contexts. While the findings of this qualitative research are
not intended to be generalisable, it is possible to consider that similar contexts
to those studied may derive similar conceptions to those found here (Marton,
1981a).
Whereas Chapter Three has introduced the contexts in which participants have
experienced GIS and the framework adopted to investigate them, Chapter Four
will reveal the conceptions of GIS that are held by these students. The
implications of these findings will then be discussed in Chapter Five.

142
CHAPTER FOUR
CONCEPTIONS OF GIS REVEALED
Life would be so much harder in geography if you don't have GIS (t8 p6).
Introduction
This investigation into student conceptions of GIS involves a phenomenographic
study based on data collected from ten synergetic focus group interviews with
109 students studying Senior Geography at four Queensland schools. Analyses of
these discursive data revealed the qualitatively different ways in which students
experienced and understood GIS. While each student may have expressed his or
her understanding of the phenomenon in differing ways, and while each focus
group interview may have proceeded independently, commonality was evident
from within the participants’ experiences and understandings of the phenomenon,
GIS.
Emerging from these commonalities were conceptions of GIS, within which is
captured the students’ collective experience with, and understanding of, GIS in
the context of their study of Senior Geography. This chapter presents two forms
of data. First, it describes the characteristics of six individual conceptions, using
Categories of Description. Second, it describes the relationships between the
conceptions, as they contribute to an Outcome Space.
The Categories of Description
P1: It's just a program like any other computer game
P2: Just another program!!
P1: Oh well, it doubles up as a winter beanie, [for] when you are feeling
lonely [and] you need some statistics to keep you warm .. (t8 p2-3).
Chapter Three outlined the purpose of phenomenographic research in discerning
the qualitatively different ways in which people may experience phenomena.

143
The different conceptions of GIS held by students in this study are characterised
in categories of description which, following Irvine (2005), have been
constructed “to thematise the complex of possible ways to experience [GIS] and
to highlight the critical differences between the different conceptions” (p. 126).
The following section describes the salient elements of each category of
description to explicate the essential features of each conception. Each category
is described in turn, with each description encompassing three elements (Bruce,
1997; Boulton-Lewis, Marton, Lewis & Wilss, 2004): a label; discursive
description; and illustrative quotations (Figure 11).
Figure 11. The three elements included in each Category of Description.
Additionally, each category of description includes a figure to illustrate the
salient features of the conceptions that it captures. For clarity, each of these six
figures adopts a generic format, as per Figure 12.
Category of Description
1.
Label
2.
Discursive Description
3.
Illustrative Quotations
Statement to concisely
communicate conception
Outline of referential &
structural aspects, and focal elements
Student statements to illustrate Category of Description, and
allow for other reader understandings
Conception Illuminated

144
Figure 12. Salient elements of conception.
Where referenced, the transcripts have been coded to preserve the anonymity of
participants and their schools. The coding uses, in order, the Transcript Number
and Page Number. For example, t2 p3 identifies the excerpt as being from
Transcript 2 and on transcript page number 3. Unless otherwise stated, each
utterance is that of a single participant. Where the utterances of a number of
participants are included to present an holistic view of a conversation, these are
identified as ‘P1’, ‘P2’, etc. Similarly, interviewer utterances are preceded by ‘I’
and are presented in bold type. Additional information that is deemed necessary
to improve clarity of the utterances is included in square brackets.
Category One: GIS As Maps And A Source Of Maps In Geography.
The first conception is of what GIS are. It is based on students’ experiences of
GIS as maps and a source of maps in Geography. Students experience GIS
mostly as a product, wherein GIS is synonymous with the maps that students see
while using it, regardless of where these may have come from, how they have
been constructed and who may have constructed them. Perhaps unsurprisingly
then, students recognise maps as a fundamental element of GIS.
Referential Aspect
Focus of student awareness
Structural Aspects

145
Figure 13. Salient elements of Conception One
Their experience of maps is twofold (Figure 13). First, they see GIS itself as a
map, as evident in the following, representative, responses to the question, What
is GIS?
I just look at it like a map (t10 p2).
It is an image that you have to view (t5 p1).
Second, and additionally, students see GIS as being a source of maps.
I: How would you describe it to someone who didn’t know what it was?
A computer program that makes map ... it just makes map shells (t1p1).
In either situation, with students seeing GIS as both maps and as source of maps, the
maps are in geography because the information that they provide is seen as equivalent to
that otherwise obtainable from multiple sources of spatial information that students
commonly use in class, such as atlases, text books and the apparently ubiquitous
Internet.
I: What’s in it?
Maps
Using GIS means using
maps
A map or maps A source of maps

146
Well, it has the [location] with all the streets and stuff in it. That was
already there.
Like, everything’s there (t5 p2).
GIS is just a program that you have on your computer and someone has
put all this information from the Net, CIA World Fact Book, na na na na,
it's like Bam! It's all on your computer (t8 p2).
Sometimes it’s just a map where we can get, ‘cause not often can we get a
map of what we want, so we go to GIS. For [a particular location], we
can just zoom in on one specific area, and that enables us to get the
definitions (t3 p2).
As the last quotation suggests, students perceive GIS as offering not just a greater
quantity of spatial data, but also a greater quality. Specifically, the level of detail
about spatial phenomena is considered significantly greater in GIS maps than in
other sources of this information that are used in their learning.
ArcView is like a lot higher quality of maps (t6 p2).
[It is] the only program I think that offers like a bird’s eye view of the
area and offers that much detail.
You can identify location and stuff. You know the sites and stuff that you
are studying (t4 p1).
Something that is used to describe the certain location of [places] to help
recognise things (t2 p2).
This belief extended to include the presumption that the maps are somehow built
in to the software.
I: where do the maps come from that you use in GIS?
I don’t know.
They’re just on the computer and we find them (t6 p3).
147
It's there for you, but you have to ... you have to press the buttons (t5 p2).
Indeed, students display some difficulty with the conception that GIS could be
anything other than the maps themselves, revealing some inaccuracies in their
conceptual understanding of GIS. The extent of student misunderstanding of the
source of data that GIS can and do store, manage and manipulate is widely
evident. This is exemplified through the following interaction that occurred
when, during one interview, the students' teacher unexpectedly entered the room
during a protracted discussion about what GIS actually are.
P1: Where do they get the GIS information from?
[Teacher]: It's all free on the Net
P2: So they get all the info from the ‘net, and you put it in to
graphs for us?
[Teacher]: No, it gets put into a database.
P1: So, it already comes on the program (t8 p2).
Students clearly accept that data were a part of GIS, and that the maps in it were
about those data. However, the notion that these maps are created as a result of
the manipulation of data with GIS is, at best, tenuous. Indeed, the separation of
data from the actual software remains almost as tenuous, as illustrated by the
same students during a latter part of their conversation.
P3: Has the information been put there already, or does someone
have to put it in?
P1: Obviously someone has put it in there for us
P2: No, it's obviously programmed in. it's obvious that there's no-one
who's gonna put that much information in (t8 p3).
P2: ... are we talking about GIS or the data used by GIS?
P4: We already agreed that GIS was the data, that it couldn't be
separated (t8 p7).

148
These difficulties are not isolated, as illustrated in the following group's
conversation about the form in which data are saved in ArcView.
I: someone mentioned something about ticking a box on the legend.
What is that for?
It activates it
I: so, if it is not ticked then it is inactive?
Yeah
Yeah
I: so, if something is inactivated, where is it?
It doesn't show
It doesn't show
It's saved but it doesn't show
I: what is it saved as?
It comes up like a skin on top of the map.
It's saved under the map.
In the display, it more or less doesn't exist (t10 p2).
Category One – in summary
Students experience GIS as maps and a source of maps in Geography. As such,
the referential aspect of this conception is maps. Structurally, this conception is
experienced solely through GIS at once being maps, and being a source of maps.
Focal in student awareness of their experiences of GIS is that their use
necessitates the need to engage with maps.
Perhaps interestingly, all participants experienced this conception. As such, it is
reasonable to consider it to be the experience from which all other experiences
emerge or, as described by Marton et al. (1993), this conception is “prior and
super-ordinate to the other conceptions” (p. 284).

149
Category Two: GIS As Mapping in Geography: A Way To Use And Create
Maps.
The second conception is of what GIS are used for. It is based on student
experience of GIS as an activity that involves maps in Geography. Whereas
Conception One involves GIS as maps and a source of maps in Geography,
Conception Two pertains to how these are employed in Geography. The
qualitative difference then, is that Conception Two is about using maps, rather
than simply experiencing those maps as a part of GIS. This conception is based
on two aspects of student experience of GIS (Figure 14). The first is of GIS as
manipulating mapped or mappable information. The second is of GIS as making
maps.
Figure 13. Salient elements of Conception Two.
I suppose it is a mapping tool (t2 p1).
Students not only recognise that GIS have maps in them. They also recognise
GIS as being a tool; that is, something that could be used for a purpose
determined by the user, such as interrogating maps.
Using Maps
GIS is an activity
Manipulating mapped or
mappable information
Making maps

150
I think it is just used for mapping (t1 p1).
It’s primarily a geography mapping program (t3 p2).
For students, GIS are synonymous with geographical activity, such as locating
places, comparing magnitude, changing scale, classifying items and events,
identifying patterns between such items and events, and seeking to make
meaning of these activities. Such activities are widely referred to by students as
'mapping'. Since these mapping activities are undertaken within Senior
Geography, students experience GIS as a phenomenon that is about mapping in
Geography.
It’s the only thing that we have available to use which will assist us in our
efforts to locate where things are and measure and everything
I: So, what do you do with it?
We make layouts of like certain points, the main aspects of something,
like the buildings, the roads, the beach, the site we have created, and
other things like that (t3 p2).
The second aspect of students' experience of GIS as a way to use and create
maps in Geography pertains to making maps. However, it is important to note
that this experience does not extend to creating maps that display new
configurations of either existing or added data. Rather, students are of the view
that maps are made and stored as they appear, not that the maps are created
through manipulating data that are referenced to points on the earth's surface.
This view applies equally to maps based on extant data sets, as well as those that
students have some role in creating. Indeed, when they are involved in creating
maps, such as through the addition of data collected during field-studies, students
believe that they are simply modifying something that already exists in map
form, to (re)create something that would also, and subsequently, be saved in map
form. And, whereas students use the term 'layer' quite frequently, this is usually
in reference to those maps that are, as they believe, a part of the GIS program;
any data input of their own serves the purpose of augmenting existing layers,
rather than creating additional layers.
151
I: Let’s go back a step. You went to the [field study location] and you
collected the information. Where did you put that information?
We didn’t put it anywhere. We got the picture off the computer and we
added the information. We just put the lines straight on there. We didn’t
put it anywhere (t1 p4).
... we got the template of the area that we were doing, like the outline of
the suburbs and then we copy a new layer and paste it up at the top, then
we right-click it and find the information we wanted and then you click
on that and we changed the breaks so we had the ones we wanted and
then the colour we wanted, and then that went in and if we needed to we
put the names of the suburbs on and then we do the layout and do the
legend and the scale and…(t5 p4).
Because of these (mis)understandings, their conception of GIS as tools for
mapping is limited to GIS providing a means for retrieving and altering maps.
Perhaps surprisingly, and despite students seeing GIS first and foremost as a
mapping device, they patently overlook its unifying, and unique, spatial
dimension.
I: what other computer application is GIS similar too?
Movie Maker [from Microsoft]...you have things that you can apply to
your picture. If you had a movie, you could get something on there, like a
button, and it would apply it to your thing, like it does with GIS
it's kind of like the Internet crossed with a program because you can press
a button and type in something and the information is there (t8 p4).
I: what other computer application is GIS similar too?
It's exactly like the Power Point one.
Or Microsoft Word (t9 p3).
Indeed, students grapple with the notion that creating a new map involves
somehow changing pre-existing data. Instead, as illustrated in the following
152
exchange, students recognise that GIS do manipulate the information that
appears on maps, but fail to understand the data storage and handling procedures
requisite to such alterations.
P1: I just look at it like a map, like a street directory kind of thing, and
we're just colouring in its bits (t10 p2).
I: So, it's a map that hasn't been coloured in and you colour it in?
P1: Yeah, basically.
P2: You add data.
I: What does the colour mean that you add?
P2: Different things.
P1: Like residential and stuff.
I: So how do you go about adding those things?
P3: Oh, its confusing at first but then you get used to it.
P4: You can change the colours to whatever you want. But basically
to differentiate between them, its just like using a key.
I: So the key links colours to something else?
P1: Yeah.
I: Where is that something else that the colours are linking to?
P2: The legend.
I: Where's that?
P2: You put it on when you finished.
P1: It's on the left hand side at the bottom.
P2: You make it, you enter the data.
I: Where do the data come from?
P3: The computer.
I: Where are the data?
P4: ArcView (t10 p2).
Category Two – In Summary
Students experience GIS as a way to use and create maps. As such, the
referential aspect of this conception is using maps. Structurally, this conception
is revealed through students’ experiences of GIS: as manipulating mapped or

153
mappable information; and, as making maps. Focal in student awareness of their
experiences of GIS is that it is an activity. Evident from this conception is that
students experience GIS as not simply maps (Category One), but the use of those
maps.
Category Three: GIS As A Professional Mapping Tool: Exceeding The
Needs Of Senior Geography.
Conception Three captures students’ experiencing GIS as a product intended for
a specific group of users: non-school users. It is based on four manifest aspects
of student experience of GIS as being a professional tool (Figure 15). The first is
of GIS as being beyond school need and IT capabilities. The second is of GIS as
a being able to do many more things than they know it can do. The third is of
GIS as doing the geography for them. The fourth is of GIS as a poor use of time.
The technical nature of GIS leads many students to question its relevance to
school-level studies. Despite the potential for them to gain experiences that may
not otherwise be available until tertiary or professional study, students are
apprehensive about the value of software that, to them, is so clearly designed to
do much more than they ever could. And, given the difficulties that students
experience in using only a meagre few of GIS’ capabilities, they seriously
consider its intention for use in industry to reflect its inappropriateness, in its
present form, for use in secondary school.
..like there are so many options..
..a version for us that still does the same thing, like because we don’t use
absolutely everything on the other program. So, half the options
sometimes might be easer to work our way around (t3 p2).
The call by students for a ‘watered down’ version reflects their desire for a
program that could just do two things. First, it would allow students to do just
those tasks that they were required to do, especially those that were related to
assessment. Second, it would allow students to do these within the relatively
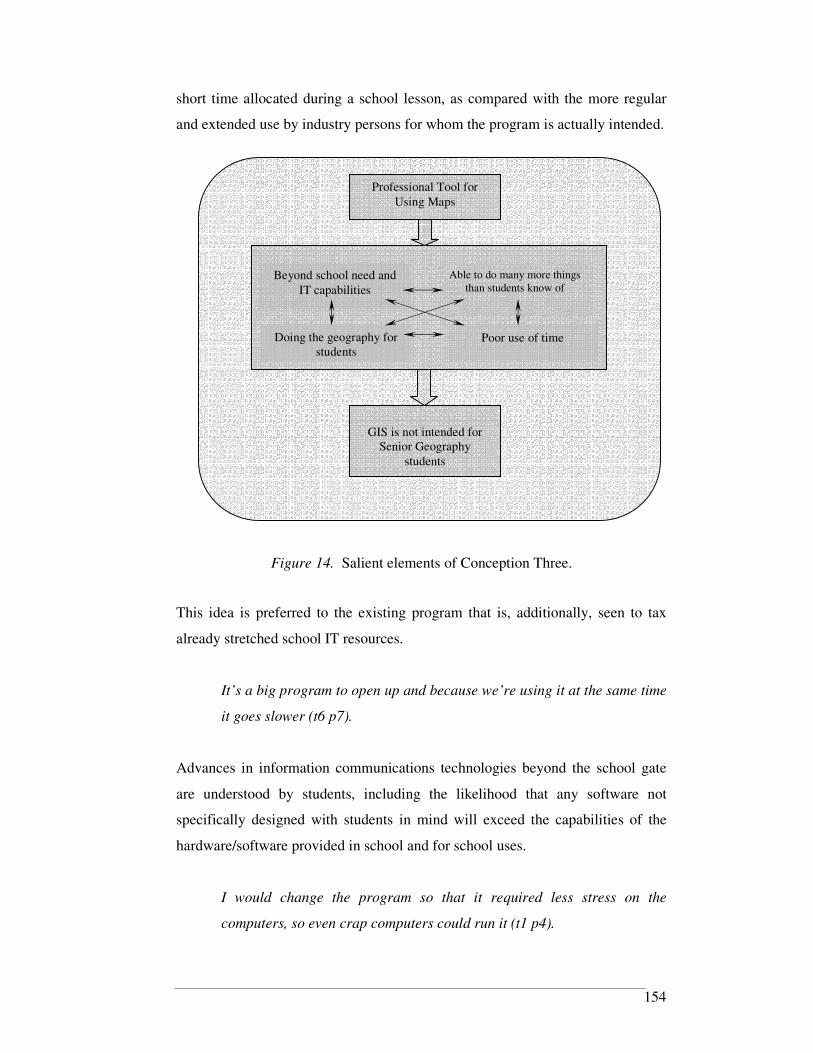
154
short time allocated during a school lesson, as compared with the more regular
and extended use by industry persons for whom the program is actually intended.
Figure 14. Salient elements of Conception Three.
This idea is preferred to the existing program that is, additionally, seen to tax
already stretched school IT resources.
It’s a big program to open up and because we’re using it at the same time
it goes slower (t6 p7).
Advances in information communications technologies beyond the school gate
are understood by students, including the likelihood that any software not
specifically designed with students in mind will exceed the capabilities of the
hardware/software provided in school and for school uses.
I would change the program so that it required less stress on the
computers, so even crap computers could run it (t1 p4).
Professional Tool for
Using Maps
GIS is not intended for
Senior Geography
students
Doing the geography for students
Poor use of time
Able to do many more things than students know of
Beyond school need and
IT capabilities

155
As alluded to in some of the above comments, it is clear to students that the GIS
software used by them is designed for applications other than in school
geography.
P1: You can use it for something else.
P2: There’s got to be something else other drawing lines on a map (t7
p5).
These potential applications are received with some excitement by students, who
also recognise that being successful with GIS takes both time and persistence.
I: earlier on in the conversation, you mentioned that there are functions
that you haven’t used.
P1: Yeah, like there are 20 functions in the toolbox, and in each one of
those there are 4 or 5 options, and we just use one.
P2:Imagine how much you could do if we used all of them.
P1: If we had more time as well to learn how to use all of them, I reckon
it would be deadly.
P3: If you just had time doing it by yourself, just mucking around by
yourself, just figuring things out, you would be awesome (t6 p5).
While this presents some value in terms of gaining experiences more clearly
related to post-school opportunities, it also presents some difficulties, without
which its use would be much easier.
It’s gotta be a hundred different options in that toolbox and we’ve only
used one and that was hard enough (t6 p1).
This is a simple syllogism experienced by students. Specifically, students
believe the GIS to be designed for industry. As such, it is capable of doing
things required for industry tasks. Industry tasks are many more, varied and
complex than those required by Senior Geography. Therefore, Senior Geography
tasks using GIS become unnecessarily difficult since they are derived from using
software that obviously has the capacity to do much more than students need to,
156
and attempt to, do with it; and which has, as a result, many more ways to ‘get it
wrong’.
P1: We probably didn’t use it to its full potential [in Year 11]
P2: It’s like in year 12, we will probably use it a lot more.
P3: There’s probably a lot more that we don’t know about it, what it’s
good for.
I: Do you have any idea of what those things might be?
P2: Not really (t7 p1).
The difficulties students experience when using GIS are generally associated
with the order of steps needed to complete a set task. Students see these
complexities as unnecessarily great, leading to their experience that using GIS
requires a great deal of thought. However, this thinking need not be so much
about the geographical aspects of the tasks that they are meant to be doing with
GIS, but about how to use GIS to complete those tasks.
But you’re not using your brain.
You're just think[ing] about using the buttons (t6 p8).
Students are acutely aware of the difference in thinking when using GIS for a
task and when undertaking the same task by hand. Specifically, they recognise
that doing tasks with GIS requires, and nurtures, a lesser degree of cartographic
skills and geographical knowledge than by completing the same task by hand.
No, but ArcView GIS puts into scale automatically and does all the
calculations, but when we do it, we would have to go through and put it
into scale and draw where the beaches are.
I think it makes us lazy.
You know, are we going to comprehend it more because we’ve drawn it,
because I know the more times I do something, the more I remember it (t6
p8).

157
I: Let’s say you did it by drawing instead of using GIS; what would you
be thinking about if you were drawing it by hand?
If you got the measurements right.
If it was looking right, like what it was supposed to be doing.
If it was accurate and to scale.
I think that I think that there is an easier way to do it (t7 p3).
But, you see, when you’re drawing you might actually be putting more
attention into the actual map and the geographical side of it rather than
...'cause I know I didn’t really think about it when I was drawing the
breakwater or highlighting the erosion sites 'cause, I don’t know, I wasn’t
really thinking about it and I would probably say that it was less when
using GIS.
I reckon what [another student] said, like probably more when you are
drawing it.
That’s what I was saying before. When you draw it, you are thinking
more about the accuracy ...
I found when I used the Arcmap I tend half the time to think am I doing
the right thing, am I pressing the right button (t2 p3).
You’re not actually thinking at the time (t1 pp2-3).
I agree that if it is tested, then as long as you remember the three steps
then you are done; you don’t have to have any real knowledge.
..it’s pretty much just to not miss anything.
yeah, you don’t have to do any work.
the only geography in it is collating data (t1 p1).
If you have the information there, like all the statistics and that, and you
are putting it on to a map yourself [by hand], then I think you are
learning more.
Yeah.
Cause otherwise [with GIS] you’re just clicking it and it is just doing it
for you.

158
And you don’t actually have to take any notice of what is going on (t1 p2-3).
I: ..when you are constructing the same map using GIS, what are you
thinking about?
When you're doing GIS, you're ...
You just think about clicking the right buttons (t8 p5).
Arising from this was students' experience of GIS as something that requires
greater attention to its processes than the geographical purpose of those
processes. An irony that emerged frequently from student discussions of their
experiences was recognition that they are using GIS to learn about Geography,
whereas GIS are designed for use by those who had already done so. Because of
this, students' believe that their focus on the steps needed to complete a task often
preclude them from actually achieving the task, let alone understanding its
geographical significance.
When you think about it, you don’t actually have to do any work. The
computer does it all for you, you don’t have to know anything (t4 p1-2).
Aligned with the earlier experiences of GIS as exceeding school need, being
unnecessarily complex and demanding less geographical thought, students
experience GIS as a problematic use of their class time. And, while they do see
some merit in using GIS to complete class and assessment tasks, this is countered
by what students see as the excessive amount of time required to complete them.
I: is using it the best way to use your class time?
No.
No, it’s not.
I: Why not?
Well, you can draw maps yourself and since [GIS] takes too long you
could spend more time on other stuff if you didn’t have it; on writing …,
like writing up reports if you didn’t have GIS (t3 p2).
It's hard to understand. It's a waste of time (t10 p1).

159
This inefficient use of time is exacerbated by the view that the tasks themselves
are not as immediately important or relevant to their studies as the tasks that they
would otherwise be undertaking; neither are they as important for their
progression toward attaining the learning objectives of Senior Geography. This
is an issue compounded both by the time it takes to learn the appropriate software
applications for given tasks, and by the time the software takes to process the
steps involved in the tasks.
It takes ages for each thing to come up, like you have a little globe at the
bottom spinning for about a minute then a picture will come up and then
you will do one thing and then it will spin for about another minute (t6
p1-2).
I don’t know what I did for the 90 minutes but I did get the map finished
but it’s a long time for just one part of your assignment (t6 pp1-2).
From the above discussion, it is clear that students experience GIS as either being
poorly designed for use with school students, or being designed with a different
audience in mind. Specifically, students believe that GIS are capable of doing
much more than they know it can. When combined with their experience of GIS
as demanding different thinking from that typically experienced in Senior
Geography, students appreciate GIS as offering a worthwhile tool for
professional use. As a professional tool, it is designed to be efficient and to be
used by people who have a comprehensive understanding of its capabilities and
their applications. As an educational tool, however, it is inefficient and used by
people who have limited understanding of its capabilities and their applications.
In this regard, GIS exceed the needs of the classroom.
It’s professional (t4 p1).
Category Three – in summary
Students experience GIS as a Professional Mapping Tool: Exceeding the Needs
of Senior Geography. As such, the referential aspect of this conception is as a
160
professional tool for using maps. Structurally, this conception is revealed
through students’ experiences of GIS as professional mapping tools through
being: beyond school need and IT capabilities; as being able to do many more
things than students know it can do; as “doing the geography” for students; and
as a poor use of time. Focal in student awareness of their experiences of GIS is
that their use is intended by an audience more geographically and computer
literate than they are. Evident from this conception is that students experience a
disconnection between what they see as the purpose of GIS and what they see as
the purpose of Senior Geography.
Category Four: GIS as Frustrating Geography: Irksome And Presenting
Many Challenges To The Student-User.
The fourth conception of GIS reveals students' emotive responses while using it.
The term, “Frustrating Geography” is intentionally both noun and verb. Students
experience GIS as a frustrating thing to do as part of their Senior Geography
studies. Consequently, this leads to their experience of GIS as frustrating their
progress toward what they see as the intended educational goals of Senior
Geography.
It is based on four, interrelated, aspects of student experience of GIS (Figure 16).
The first is of GIS as bothersome. The second is of GIS as tedious. The third is
of GIS as difficult to learn. The fourth is of GIS as creating uncertainty.
P1: It's f**ked up.
P2: I don't understand it.
P3: I hate all computers and I hate that program (t10 p1).
For students, using GIS are bothersome. This experience relates to GIS in terms
of the complexity inherent within the software itself, the complexity of
manipulating the software while being taught in its use, and the complexity of the
tasks for which GIS have been employed.

161
Figure 15. Salient elements of Conception Four.
As evident in the conceptions described above, students do not appreciate the
way in which GIS store spatial data. This limits their understanding of how to
manage the data that they are using. Specifically, they do not understand how
attributes are stored to form themes, and that these are manipulated and displayed
in layers to produce a map. Because of this, students have difficulty with using
those GIS functions that are specifically related to doing those things; indeed,
they have difficulty with using those functions that are fundamental to creating
maps. Not understanding these functions while using GIS creates frustration for
students.
I just kept losing my map; I did all this stuff on my map.
I: Where did it go?
I don’t know.
[The teacher] brought it back for me.
I just had to start again.
Yeah, that just is awful (t1 p2).
Frustration
Using GIS is
disconcerting and irksome
Difficult to learn Creating uncertainty
Tedious Bothersome

162
Students link much of their frustration while using GIS with the teaching that
complements its use. Specifically, they view teaching of how to use GIS as
compounding their difficulties in both understanding and using the software to
complete the set tasks.
I don’t even know what it is at all. I just do whatever [the teacher] says
because I don’t know what GIS is really meant to be or for, so I just do
what [the teacher] says and I don’t know why [the teacher] says it, and I
don’t worry about it because if I worry about it I just confuse myself (t6
p5).
Students are aware that the time allocated to complete tasks with GIS is more
limiting than that to complete other, non-GIS, tasks. This emerges from students
recognising that teaching about and with GIS is more teacher-centred than other
tasks; and necessarily so, such that students can gain an understanding, in the
usually limited time, of how to use the GIS in the required way so that they may
complete more successfully other, subsequent, tasks. Perhaps ironically,
however, this mode of delivering instructions in either a verbal or pre-printed
series of step-by-step instructions leads students also to view GIS as being a
predetermined set of steps that must be followed to complete a task with a
narrow focus, rather than a tool to increase both the range of tasks and the
breadth of foci that they may encompass.
I remember using ArcView GIS and [the teacher] was telling us what to
do and I got way behind and I didn’t know what to do….so I got lost
doing steps, and I got lost and by that time I was three steps behind and I
didn’t know what to do.
[The teacher] goes too fast.
And once you get too far behind, you just go, oh stuff it, I can’t be
bothered to do it (t6 p8).
I: How do you learn the correct order [of steps]?
Someone tells you.
You just keep fiddling with it until you get it right (t7 p3).

163
I: So, how do you learn how to use it?
Repetition. You just go lesson after lesson on the same thing, learning
how to do that thing until you can just do it (t5 p1).
The third element of student experience of GIS as frustrating geography relates
to the tasks that they are required to complete while using it. Students often see
the tasks allocated to be undertaken using GIS as being unattainable. The
apparent lack of confidence in using GIS functions, arising from the software
itself and the means in which its use is taught to students (see above), appears to
preclude students from recognising that GIS afford the potential to create
multiple answers to any given question. Instead, they see the multiplicity of
possible outcomes as undermining what little confidence they do possess. The
whole experiential combination of complex software, inadequate instruction and
difficult tasks appears overwhelming.
I: What are you thinking about when you are using it?
Oh God!
It’s hard!
We're just thinking about how to, it’s frustrating, and like how to operate
it, how to get it to work, and like the why the person next yours looks
different (t5 p3).
Students experience difficulties in mastering a basic set of GIS functions, and
they believe that repetition is the key to attaining mastery of them. Despite this,
however, students’ difficulties with using GIS appear to be further compounded
by their experiences of it as generally repetitive and tedious and, for some,
contrary to what geography is meant to involve.
[If] they introduced new things every week, like new things that you could
do with it [GIS] then I might be interested for a long time, but if you just
keep doing the same thing over and over then it could get a bit boring (t7
p4).

164
Because in geography, you're supposed to draw, you're supposed to be
outdoors, not stuck on a friggin' computer (t10 p4).
The unique nature of GIS as software that is used in school creates some
difficulties for students, because they see the program as needing to be learned
essentially from scratch.
I: who thinks it’s hard?
In certain ways (t7 p3).
In this regard, they see GIS as being like other programs that they use widely in
schools, but for which they have had much greater exposure; in some cases,
extending into the lower primary years.
It's kind of like when you are five and you work Microsoft word; if you
use it often enough you get to know how to work it (t7 p1).
As with learning how to use computers at an early age, students view GIS as
presenting similar difficulties as learning computer programs and applications,
but at an early age. The need to be taught everything creates a reliance on the
teacher for direction, and creates difficulties for students who experience
considerable alienation when exposed to this new program. Frustration is
exacerbated by students’ concurrent expectation that they should be using GIS to
complete to a higher standard the tasks that they would otherwise have been
doing in class without the computer and with a greater degree of autonomy.
I don’t think it’s very good because when you start using it the teacher
has to explain it to everyone and no-one actually understands it.
Yeah, it was a bit hard to understand the first time we tried to use it.
I only used it once.
So every lesson [the teacher] he has to reteach you how to use it (t7 p1).

165
Compounding this is the variation in levels of ICT competence held by different
students. Since an entire class is so often beholden to the teacher for direction,
individuals who do grasp the steps earlier than others are largely hamstrung by
the need to wait for those individuals who experience greater difficulty to receive
the assistance they needed to 'keep up'.
I think it’s hard. I guess, I think that when we were learning to do it, it
was hard to follow. Well, I guess it’s because I’m dumb on the computer,
and we were all in there together and I needed individual help.
I can back that up (t5 p1).
However, as with other computer applications, once they perceive a reasonable
level of control over the software, students are keen to explore. And yet, such
confidence is ultimately eroded by them then progressing beyond the teacher’s
script, and experiencing difficulty with staying on-task.
I feel it’s really easy to get lost with it. If you miss one step and you keep
on going you don’t know where you are (t6 p1).
Indeed, students recognise that the time spent in waiting for the teacher to
address the concerns of individual students in a whole-class lesson is commonly
divided among those students who have difficulty in keeping up, and those
students who have difficulty in restraining the urge to go further.
I: you say you don’t know what you did; how did you get it done?
I don’t know. It took me ages. If you were to put in Feature and then you
press the button but if you weren’t pressing the right one you lost it all so
you have to do it again.
And again.
And you have to do it again like a million times.
I lost mine like 5 times.
And you need someone in the machine to tell you what to do; just some
little Einstein in the corner of the screen to tell you what to do like “okay,
next step…”.

166
There should be a manual for it.
Yeah, we need instructions for it.
You know how you get those books and stuff.
Yeah, like “GIS for Dummies”.
Last year when we did FrontPage, [the teacher] made us a little manual
with each step and that was really good.
And we can use something like that.
Then you could work at your own pace.
But then you get frustrated because you don’t know what to do.
Like when you get a blue line around your Feature Class and you don’t
know what to do.
You can try everything to get rid of it, but in the end we just started again.
I think the reason why we lose so much stuff is because it stores your
classes in a different place from that actual file you save yourself.
And you can’t make two with the same name; you have to come up with
something different.
You cannot press undo because then it will take off whole layers of what
you have just put on (t6 p2).
While students recognise that GIS are difficult to learn, they acknowledge that to
do so is not beyond them. They are willing to learn how to use it, as long as
sufficient time is allowed for them to do so.
The program to use? At first it’s rather hard, but once you get the hang of
it, it gets simpler. I still have trouble with it but you can work your way
around it (t2 p1).
Herein lies an irony. Students desire more time to explore with GIS, but to do so
they require some fundamental competence in its use. While students see
exploring individually as highly valuable in gaining an understanding both of the
software and the data that are in it, they first require confidence in using its more
rudimentary functions; a few of the many buttons about which they often lament.

167
It’s confusing with all the buttons, like [we] have to get to know the
software or whatever it’s called (t7 p1).
It’s a lot more complicated.
Cause, yeah, it’s a lot more complicated … because you like have to have
experience to create map in ArcView GIS (t5 p2).
And yet, to gain this experience they need individual assistance. But this is not
forthcoming until such time as most students possess the basic skills to be able to
explore and use the software with some degree of confidence.
I guess that it not the GIS system itself but it is the learning process.
And, which affected the number of people using it.
I think like if we all had individual help then we all would have used it,
but like, no offense to the teacher – [they are] self-explanatory, very well
– but when you had a friend go over it with you it registers, sunk in (t5
p1).
I: So, how do you get to be comfortable using it?
By doing the exercises.
Follow the instructions. The teacher usually gives us the instructions;
how to start, and then start using it.
I: Can you describe a typical lesson where you are using it?
Yeah, [the teacher's] got a data projector.
It's showing up and like we have the instructions on paper.
[The teacher] goes through it with us.
[The teacher] will show us pretty much how to do everything.
[The teacher] will go step by step through everything.
[The teacher] demonstrate the exercise.
If you fall behind, it sucks.
I: Why?
Because, if [the teacher is] say three exercises in front of us, then each
of us will probably be asking the next person for help and then that
person will fall behind.

168
So it's really important for [teacher] to make sure that all students are on
the same page.
I: So how do you make sure everyone is on the same page?
[The teacher] makes sure that we are following it.
No, not really. [The teacher] finishes the task and then [the teacher]
walks around.
And tells us what to do.
Yeah, like telling us not to swear about the program.
I: How do you know whether you have completed [an exercise]
correctly or not?
You don't.
'Cause [the teacher has] got a demo for us.
It has pictures on the paper to show what is on the screen.
I: So, if it already has been done and it is on your page, and your just
following the teacher's steps, step-by-step-by-step, what is the point in
doing it?
[The teacher] does that, [the teacher] goes through it with us and all
that, but that's just the first time.
We sort of know what to do because [the teacher] sort of already taught
us from the start and the next exercise we know how to do it – as much as
we can by ourselves – and when we need help, we ask [the teacher].
[The teacher will] explain it again.
[The teacher will] do it the first time and then [the teacher will] do it a
few more times so we get the gist of it. But, then we still have it on paper,
so we know what were doing, but sometimes if you're having trouble,
then you can ask for help. But, [the teacher] won't be doing step by step
every time (t10 pp1-2).
A further paradox for students is that to learn how to use GIS effectively, they
need to experience repetition.
I: So, how do you learn how to use it?
Get help from the teacher.
169
Repetition. You just go lesson after lesson on the same thing, learning
how to do that thing until you can just do it (t5 p1).
However, the very repetition needed to master GIS appears to contribute to the
tedium that students experience when doing so.
[If] they introduced new things every week, like new things that you could
do with it then I might be interested for a long time, but if you just keep
doing the same thing over and over then it could get a bit boring (t7 p4).
Furthermore, this repetition requires a teaching approach that emphasises a
particular order of steps and which is, inevitably, directed by the teacher.
In any event, the collective tension experienced by a class attempting to focus on
forward progress amid myriad hardware, software and learning distractions in a
time-poor environment precludes an emphasis on how GIS actually process those
steps to manipulate the spatial data involved, and why such manipulation is
required. As such, students seem to be stuck in a cycle that prevents them from
understanding, from a spatial perspective, what they are doing; an understanding
that students sensed could perhaps lead to greater self-reliance with its use.
I think the problem is it is so hard to explain to someone why we are
doing this. Like, for example, if someone saw that you had a certain
image in your Word document, it took me forever to explain it, so I ended
up just saying do this, do this, do this, rather than saying you do this
because.
Yeah.
We should be given examples, and we should be given reasons for it, the
because I think we have sort of been pushed into it, pushed off the cliff …
because he hasn’t given us a manual for it, but I think that if we explore it
for ourselves then, we know it’s hard, but I think we’ll get a better
understanding of it in the end.
I don’t even know what it is at all, I just do whatever he says because I
don’t know what GIS is really meant to be or for, so I just do what he

170
says and I don’t know why he says it, and I don’t worry about it because
if I worry about it I just confuse myself.
This assessment piece, the criteria was to show a map that showed the
breakwater, he didn’t give us or say that you can make a map, or what
sort of map, so we just did what we’re told to do because that’s what he
wanted (t6 p5).
Arising from these issues is the repeated call for GIS to be more extensively and
routinely used prior to entering Senior Geography, suggesting that earlier
exposure may obviate many of the fundamental causes for the frustration
experienced by participants.
I think it would have better if we learned how to do it earlier and not just
in Grade 12 and how to do other things.
We were thrown in the deep end.
The year 9s are using it.
So if we had used it since Grade 8, we’d probably have a better idea of
how to use it more efficiently (t1 p3).
Interestingly, however, if this were to lead to improved efficiencies in the use of
GIS prior to Grade 11 then, presuming participants' attitudes toward GIS' role in
learning are true retrospectively, we could expect that many would see GIS as a
draw card for the study of Senior Geography. However, generally speaking, GIS
are not a motivator for electing to study Senior Geography.
I: What are your thoughts about the extent to which GIS influences
subject choice; do you think it does or doesn’t at all?
Nope.
No.
It doesn’t at all (t4 p2).
In this respect, students are acutely aware of the perceived expectation of their
teachers that success in these tasks comes when students’ complete the same task
that the teacher had at some earlier time, and which the teacher was either
171
personally repeating for students to replicate in the classroom, or which they had
translated into step by step instructions for students to follow and, thus, replicate.
Compounding this, students do not share the palpable enthusiasm for GIS that
their teachers routinely display.
I: Why do you think your teacher and your school has chosen to [use
GIS]?
Because [the teacher] is into that (t9 p4).
Instead, students view their completion of GIS tasks as somehow satisfying their
teachers' needs moreso than they themselves achieving satisfaction from their
learning about and with GIS. Because of the above experiences, students
harbour the notion that maybe the benefits of GIS for Senior Geography are
somehow overstated. Students are more likely to express concerns over GIS’
value in tandem with their expression of concerns about their own confidence
when using it. This uncertainty appears to be due to a combination of poor skills
in its use, ignorance of its applications beyond school and, significantly,
scepticism about its reliability and accuracy. This scepticism is evident within
the following excerpt from Transcript Six.
… it doesn’t necessarily make it more correct, and this is against it,
because we’re presuming that the … if it’s a photo, then it’s going to be
right. But, for all we know, this photo could have been taken five years
ago.
Yeah.
That’s the thing.
I know that’s negative, but you don’t know. You see, those wave fronts
could have been from five years ago and it could be completely different
now.
It’s not accurate.
That’s the thing, because technology is…

172
If we took our own pictures, like wave fronts and time taken and
everything was controlled, then we would be getting accurate
measurements in everything (t6 p5).
Control over what is happening while using GIS is seen largely as extrinsic. As
suggested earlier, students believe that they are simply following a set of
predetermined steps/functions to achieve an equally predetermined end. As a
result of this belief, students are heavily focused on completing these steps in
what they assume is a non-negotiable manner. The possibility that there may be
a raft of options in addition to the prescribed steps does not seem to influence
their approach to the GIS tasks.
…you’re not going to know if the colours have gone into the right place
You could have got something mixed up and got the colours in the wrong
spot, and how would you know?
Because, you don’t like, because when we did the test, we don’t actually
know where it shows up. You can learn the Layout and know you are
right with that, but when it comes to the actual map, you’re not going to
know if you’re right.
We just assume that we are given the right information.
We just have to assume that the computer has put things in the right spot
and that we have done that right (t1 pp2-3).
Despite the GIS tasks undertaken by these students generally following the route
of inquiry and therefore representing, to some extent, an open-ended inquiry,
they still seek confidence through comparing their own screens with those of
other students and, more significantly, those of their teacher. Indeed, this lack of
confidence leads students to reconsider whether to use GIS or to continue with
the more traditional methods employed in class, as exemplified in the following
comment by a student who consistently selected to do his/her maps by hand
rather than risk getting it wrong using ArcView:
… that’s why we chose to do the colouring in because we’re more
confident (t5 p1).

173
Because students are not overly familiar with the steps involved, they are not
fully acquainted with the role of GIS in providing for them an opportunity to
undertake a more independent investigation. Their preoccupation with which
buttons to press - the method of doing GIS - in this way interferes with their use
of GIS for the purpose intended by their teachers.
Another difficulty with GIS is that if you make a mistake, you have to
pretty much redo everything.
You can click “undo”.
Sure, but you don't know you've made a mistake until the teacher checks
it at the end (t 13 p8).
I: What do you learn, what do you think about while you are doing the
GIS stuff?
How to press the buttons.
I: How do you know if you press the right button?
You get taught it.
It’s like cause and effect; if you press the wrong one, then you can undo it
if you don’t like it and try a different button.
Experiment.
I: And then how do you know you have got the right one?
You get the result you want.
I: How do you know the result you want is correct?
Because it looks the same as the one on the board (t7 p2).
The possibility that there could be many ‘correct’ answers arising from the
application of GIS’ functions to a single set of data that is manipulated
concurrently by many students adds to the uncertainty that any one answer is
correct, rather than freeing students from the constraints imposed by the belief
that there can be only a single, correct, outcome.
I: How do you know if you have achieved the things that your teacher
wanted you to?
174
Because he tells us.
We get a tick.
Correct.
I: Would you know, without him actually saying, whether you got it
right or not?
If he taught us how to do it in the first place, yes (t1 pp2-3).
Category Four – in summary
Students experience GIS as Frustrating Geography: irksome and presenting
many challenges to the student-user. As such, the referential aspect of this
conception is frustration. Structurally, this conception is revealed through
students’ experience of GIS: as bothersome; as tedious; as difficult to learn; and
as creating uncertainty. Focal in student awareness of their experiences of GIS
is that its use is disconcerting and irksome. Evident from this conception is that
students experience GIS as both academically and personally discomfiting.
Category Five: GIS As Relevant Geography: Within And Beyond The
School Experience.
The fifth conception of GIS is about students' perception of the connectedness
between it and other aspects of their studies and lives. It is based on four aspects
of student experience of GIS as being relevant: to different learning styles; for
geography; for computer skills; and, to general life (Figure 17).
Students appreciate that GIS offered a different way to do things. Specifically,
this relates to their experience of GIS as being both a new way to do old things,
as well as being a way to do new things.
It's a different way of learning (t8 p4).
I: What are you learning while you are doing it?
Learning things. Like learning how to do something that you couldn’t
before.

175
Yeah, new things (t5 p3).
Figure 16. Salient elements of Conception Five.
For many students, it is the former that constitutes one of GIS' greatest benefits,
namely it allows students to learn in a way that is not otherwise available within
their studies of Senior Geography.
I: Do you think it is a good use of your time?
Yeah.
Yeah.
Yeah.
Yeah, it's better than writing all the time.
Yeah, like people learn things like say people might learn things by
writing things down, people might learn by hearing things, and some
people are physical learners and like for the visual learners of the class
could really excel by using the program (t2 p2).
... and it's visual, too.
Relevance
GIS is relevant to both immediate studies and
future lives
Relevant for computer
skills
Relevant to life beyond
school
Relevant to Senior
Geography
Relevant to different
learning styles
176
Some of us appeal to colours (t8 p3).
This visual nature of GIS and its emphasis upon graphic presentation of data,
regardless of the extent to which they correctly understand it, appeals to students.
This is for two reasons. First, it adds variety to their lessons. Second, they find it
more stimulating, and are more inclined to retain their motivation and
concentration than were they to do the equivalent task using resources other than
GIS.
When I'm drawing a map I'm grumbling, I'm whingeing, I'm pissed off,
because I don't like tracing paper and lead pencils just give me the shits.
I think if you've got a book that has got all the bloody details in it that you
just copy to make a map to put on a bloody clipboard, then I don't see the
point. It is a lesson waster and a time filler.
That's why it's [GIS] more stimulating, being able to have something
there immediately and go “yep, now I can look at this and see it” instead
of going “oh my god, this is really crap” and then you go “why did I just
do that?” (t8 p5).
Well, when using GIS I am thinking that this is interesting, but when I am
doing it by hand I am thinking that this is boring (t8 p5).
A further reason for GIS' relevance to learning styles is its capacity to reveal the
interconnectedness of things being studied. Indeed, it is this aspect of GIS, either
directly expressed or otherwise, which is largely responsible for students’ belief
that it is relevant for geography; both as a discipline, and as the subject, Senior
Geography. This capacity emerges through student use of several data
manipulation functions, and specifically those related to zooming in on specific
map features, and constructing the layers of maps to make more clear the
relationships between such features and other features.
... and you can open up a map and a graph and look at the statistics.
You can analyse stuff.
And you can watch the difference in things (t8 p3).

177
ArcView has helped us with our report because it has shown us different
times of the beach’s profile. The [study site] has gotten smaller so we
know that over time it has gotten smaller, it has shrunk and stuff. It has
helped us (t3 p1).
Because it caters for a wider range of student learning preferences, students
experience GIS as improving their collective understanding of the topics being
investigated. It also allows them to gain a greater understanding of those topics
than would otherwise have been possible. As indicated in Category One, this is
due to the wealth of data that GIS comprise, which allows students to determine
to a greater extent the direction of their investigations.
It makes information more accessible.
...and from that you can convert it to your own needs, through the maps,
through the tables and the graphs (t8 p1).
It has all the information you will need, it's got population density,
rainfall.
I: All the information that you will need for what?
Well, for geography. It's about geography, all about the world (t8 p1).
This is not just because of the presentation, but because having a more accurate
map when commencing the study of a new area, especially during fieldwork,
allows them to develop a better understanding of the area being studied. In turn,
this allows students to (potentially) undertake more accurate analyses and make
what they believe to be better decisions.
An adjunct to this intrinsic motivator is the extrinsic motivation of GIS tasks
being linked to assessment. In this regard, student interest in using GIS is largely
shaped by the assessment related to it and, since students experience assessment
as being relevant to Senior Geography, they also experience GIS as being
relevant to Senior Geography.
I: How often would you like to use it?
178
On a regular basis.
Well, if I had one of those assignments every week then I would want to
use it every week. I’d use it as often as I needed to do what I had to do
(t7 p5).
I think it is a valuable resource for Senior Geography, because it helps us
accomplish our assignments (t3 p1).
I: What benefit is there in having used it at school?
Um, because … you use it for assignments (t5 p2).
So you can be accurate in what you say and write about it.
So you can get a better mark (t5 p4).
Coincidentally, many assessment tasks referred to by participants involve
fieldwork. The relevance of using GIS in local area studies is particularly
evident for students, with their added understanding of their local environments
improving the level of interest in, and hence, motivation for, what they were
studying. The discovery of their own home, school or significant other landmark
involves students in further immersion in GIS (although not necessarily in the
prescribed task/s).
Using GIS I can actually see into my yard, and whatever’s on the roof of
my house I s’pose.
You can actually see the people walking to work (t3 p1).
The relevance of using GIS in field studies extends beyond the matters under
study, to include the relevance of using ICT as part of those studies. Indeed,
students see computer technologies as the way of the future, and something that
is relevant for schools to engage.
... or like trying to modernise our school and get us using computers and
stuff (t8 p4).

179
With this in mind, they see using computers at school as being both a means and
an end. As a means, students experience GIS as helping them to learn how to
use another software package, thereby giving them a broader base of computer
skills.
You learn more about computers because everyone will need to know
how to use computers after school; everyone will have to know how to
use computers out of school (t1 p1).
For instance, it is good to have computer skills (t1 p1).
It's introducing us to technology as well (t1 p2).
If we come across a program that’s kind of similar to it then we will
know, we’ll try the way we did the GIS maps and see if that way of
clicking the buttons will work (t5 p4).
As an end, they see it as more appropriate in the contemporary technological
environment to make a map with a computer than with pencils and paper.
The technology of maps today, like not everything needs to be hand
drawn and that. We can just use the computer (t5 p3).
Geographers will rely on computers in the future (t10 p5).
Perhaps more pragmatically, students are keenly aware of competition for access
to ICT resources at school. In this regard, the relevance of using GIS for
computer skills is complemented by the experience of improved physical comfort
offered in a computer room when compared with a usual classroom. The link
between success in GIS activities and subsequent, additional, time in the
'computer room' is clear to students, with several students acknowledging that
they intentionally experience GIS favourably simply because of the greater
comfort offered by the room in which they use it. Indeed, a number of

180
participants admitted to working harder in lessons involving GIS so as to
increase the likelihood of further classes being held in a computer room.
I: If you weren't using GIS, what would you be doing instead?
We'd be sitting in the classroom and if it's a hot day then we'd be
sweating, but if we do GIS then we get to go to the air-conditioning (t9
p2).
P1: Primarily it's to get us into air-conditioning.
P2: Once a week, in the air-con for 70 minutes is great.
P1: Anything that gets us in there is good (t8 p4).
Perhaps more seriously, the relevance of using GIS to post-school life is clearly
identified by many students.
I: Beyond school, why do you think your teachers use GIS as part of
your Senior Geography?
Because it is more of a life skill, like it’s something that is practical, we
can use it (t1 p2).
Experiencing it at school is seen as a 'natural' extension, given the potential
applications of it beyond school. Interestingly, it is experiencing GIS that leads
to student awareness of these applications, which in turn creates the perception of
its relevance. GIS' relevance beyond school is initially identified as being
associated with further (post-school) study that also uses GIS.
Because if you do geography at uni or whatever you’ll never actually
have to sit down and colour something in, everything is done by
computers now, so it is more useful (t1 p1).
If you want to go to uni and study geography or cartography or something
to do with geography then you will probably have to use it (t1 p4).

181
If I’d never used it at school then I would never know what it was and you
would never, I would never use it out of school, so it’s good to have it at
school (t5 p2).
And that’s such a skill by itself, like learning all the buttons what to press
will be also helpful with if you want to ... you know what I mean, like,
learning the way to do it is valuable, it's not just...you are learning how to
do it in the future (t3 p2).
For all groups, discussion about the possible place of GIS within and beyond the
senior school curriculum invariably led to the possible vocational opportunities
that may also arise from having used it.
We’re also given an insight to what tool you can use not only at school
and when we leave school what tools we can use in the workforce (t2 p2).
Students recognise the breadth of occupations that may in some way use or
benefit from using GIS. This involves both identifying actual jobs that may
require it, and identifying GIS as a skill that is transferable across many,
traditional, jobs.
I s’pose If you want to become a cartographer, you don’t draw any more
so you may need it (t1 p1).
If you’re in a construction job, or in town planning, you need to be able
to look at an area and see what you can do with it and see what services
and housing and stuff you can put there if you are in that industry (t2 p3).
It would be useful in the army.
I: How?
Navigation, logistics.
…yeah, logistics, finding the positions on a map
..tactics
..tactics, yep (t3 p2).
182
In short, students experience GIS as relevant, by virtue of it being a
microprocessor technology at a time when such technologies exert influence on
all areas of students' lives. In this respect, they see GIS as being commensurate
with a range of academic, vocational and life situations, thus engendering their
experience of GIS as being relevant.
Drawing a map is, like, olden days, but GIS is modern day technology.
I guess it's a skill really (t8 p6).
Like, if you are going into some big geography firm – I don't even think
there are such things – so if you're in some big firm, I don't even think
they are going to make you draw a map by hand.
You need to do it faster.
Exactly, that's what the real-world is; newer, faster stuff (t8 p6).
People who analyse lots of information would need it, they couldn't not
use it (t8 p7).
And it’s what they do in the real world anyway (t1 p4).
Category Five – in summary
Students experienced GIS as Relevant Geography: within and beyond the school
experience. As such, the referential aspect of this conception is relevance.
Structurally, this conception is revealed through students experiencing GIS as:
relevant to different learning styles; relevant to Senior Geography; relevant for
computer skills; and, relevant to life beyond school. Focal in student awareness
of their experiences of GIS is that its use is relevant to both their immediate
studies of Senior Geography, and to their future lives. Because GIS, as part of
the study of geography, offer relevant learning experiences and opportunities, its
use enhances the relevance of Senior Geography to students.
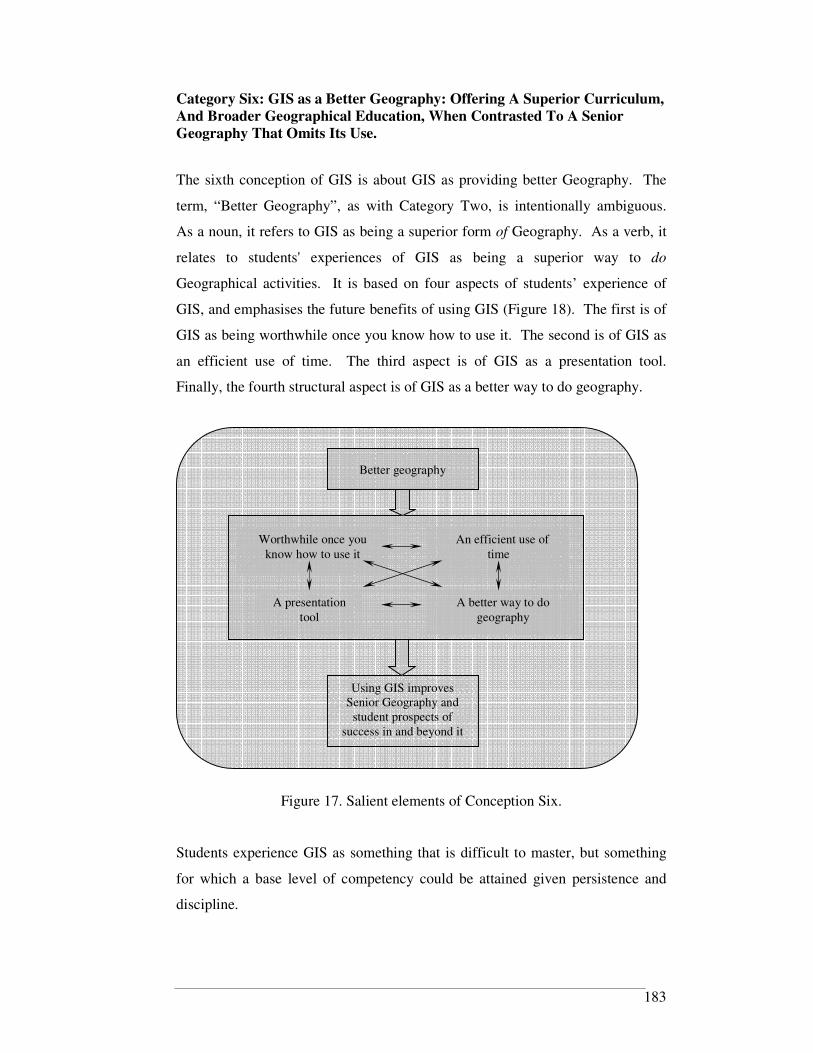
183
Category Six: GIS as a Better Geography: Offering A Superior Curriculum,
And Broader Geographical Education, When Contrasted To A Senior
Geography That Omits Its Use.
The sixth conception of GIS is about GIS as providing better Geography. The
term, “Better Geography”, as with Category Two, is intentionally ambiguous.
As a noun, it refers to GIS as being a superior form of Geography. As a verb, it
relates to students' experiences of GIS as being a superior way to do
Geographical activities. It is based on four aspects of students’ experience of
GIS, and emphasises the future benefits of using GIS (Figure 18). The first is of
GIS as being worthwhile once you know how to use it. The second is of GIS as
an efficient use of time. The third aspect is of GIS as a presentation tool.
Finally, the fourth structural aspect is of GIS as a better way to do geography.
Figure 17. Salient elements of Conception Six.
Students experience GIS as something that is difficult to master, but something
for which a base level of competency could be attained given persistence and
discipline.
Better geography
Using GIS improves Senior Geography and
student prospects of success in and beyond it
A presentation
tool
A better way to do
geography
An efficient use of
time
Worthwhile once you
know how to use it

184
P1: I don't think it’s stupid; I think it makes geography easier.
P2: Yeah I reckon.
P3: 'Cause geography is good, but it is a bit hard. ArcView helps us, it
makes it easier. That's my opinion; I don't think it's stupid and it's not
hard to understand.
P2: I reckon if you know how to use it, it’s really good. But, if you
don't, then it’s very frustrating. Like, it took me a little while to get used
to it and I hated it at first, but then once I knew how to use it, there's a
whole range and variety of statistics and things like that that you can
access. It's just that knowing how to access it (t10 p1).
Notwithstanding the issues associated with earlier conceptions, students see these
difficulties as an acceptable price to pay for the benefits that they perceive as
being provided from using GIS in Senior Geography. Even the most
rudimentary level of ability, students believe, is sufficient to enable them to
access these benefits. And, since they see repetition as the key to improving skill
in its use, students recognise also the role of persevering with a task in improving
the likelihood of not just completing that task, but in also enabling subsequent,
and potentially more difficult, tasks to be completed.
P1: But once you know what you’re doing, you’re kind of, it’s good.
P2: Once you know how to use it, it is easy to use (t1 p1).
But after I used it for a while I got used to it (t2 p2).
P1:...but if you take three hours to get used to it, then it's good forever
after that. (t10 p3).
Once you get to know it a bit better it will be okay.
It could be easier; once you know how to use it.
I: What do you think would need to happen in order for you to know
how to use it?
Use it more often.
Yeah.
185
I: Do you think it is a good program to use at school?
It would be once you understand what you are doing.
Yeah.
Yes.
Yep (t5 p2).
Once students experience learning how to use GIS as a worthwhile exercise, their
attention moves to whether it is an effective use of their class time.
I: What you do in one GIS lesson would take how long in “normal”
classes”?
Like, weeks.
Hours.
Yeah (t8 p4).
Much debate occurred within every group about whether using GIS was an
efficient use of time. Using it, some believe, gives them more time to do other
things, such as work with the maps that they create.
Well, it doesn’t actually take a lot to make a map. It only takes a few
minutes, so that’s probably a good thing.
I: Why is that a good thing?
Because it doesn’t take as long time to do it, you then just, you spend less
time on the one project and then you have more time for other stuff (t5
p1).
It makes it a whole lot easier and faster to gather information (t9 p4).
For students, it also prevents the boredom that they associate with drawing maps
by hand. This serves a twofold purpose; first, it eliminates the perception of time
passing slowly. Second, it leads students to experience Senior Geography in an
improved light.

186
Like, to start with we were given a sheet and we had to colour each
section in for like, we had a country and each thing was like a different
thing, and one colour is 45 to 50, and another colour was, and so on and
so forth, but with GIS we can just do it in 5 minutes instead of sitting
there colouring it in and drawing all the keys, so it is good in that way.
I: If you weren’t using GIS, what do you think you would be doing
instead?
Colouring in.
Doing it by hand.
Tracing a map.
Everything by hand.
It would take way ever.
And it would be really boring.
And it would be really messy (t1p1).
Further, GIS’ efficiency is seen as being derived not from doing the usual
classroom activities faster, but from being able to do more and other, better,
activities in the time that would otherwise been allocated to undertake those
usual activities.
With ArcView, we can decide whether we want a certain range of data to
be shown or not, and then we can print off a total picture, as opposed to
having a hand drawn one. It saves a lot of time (t10 p3).
I: What is the closest in-class activity to what you do with GIS?
You can't. It's just impossible. You'd have to get maps, you'd have to get
charts, you'd have to get all this different information.
Either access the Internet or get books to research.
See, like one of these [referring to a student drawn map on the board], we
could do 40 different maps.
See, that's all in GIS. You don't have to go through books and books and
books, it's all there... (t8 p 4).

187
Students believe that overcoming GIS’ difficulties will lead to improved
efficiencies. Associated with this, students possess a broader view of the role of
GIS within their education; at once serving the immediate needs of Senior
Geography, and serving the needs of a broader, geographical education. In this
sense, students experience a favourable cost/benefit ratio associated with GIS,
regardless of what their preferred learning activities may have been.
I would rather draw a map myself if I need the information, but in class,
if you're given a task and you need the information, then you need to do it
as quick as practical, and get it accurate (t8 p6).
I: Last year you didn't use GIS, this year you did. In which year
do you think you were exposed to better geography?
P1: This year. There's no question. This year, we have gone through
far more information.
P2: Yeah.
P3: It's more detailed, maybe it's because we're in Year 12, but it's
just more useful stuff that we've analysed ...
P1: We went through a lot more information and a lot more quickly
than last year.
P4: Yeah, applying climate and terrain to figure out what was going
on in a country. We were able to do it a lot quicker, in a couple of
lessons, rather than looking it up on the Internet, doing the map, figuring
it out, doing that sort of thing...so, we got it done quicker, and be able to
move on through more information (t8 p8).
For most participants, a key part of this cost/benefit scenario is the better way to
present their maps.
I think it's not just so much what we learned from it, but its about the
presentation of the data that we pick up (t10 p3).
GIS enable students to communicate more clearly than by using words alone.
This reflects their experience of the cliché that ‘a picture tells a thousand words’,
188
where the maps and layouts that they generate make it easier to communicate
their ideas and findings.
It makes us, it’s a better way to show what we want or what we are
thinking about the task at hand instead of having to either draw or
completely describe it in writing, you could show it on the picture in
through GIS (t2 p1).
P1: I like it, because it makes things very easier.
P2: You can see things clearer (t10 p4).
GIS allow students to create higher quality maps than were they to draw them by
hand. In this way, as a map-making tool, GIS provide a range of functions that
students will otherwise complete with an obviously lesser degree of accuracy, or
would not complete at all.
On the map you could have a whole wad of; you can't fit as much data on
an A4 piece of paper as you can in ArcView. In ArcView you can put a
whole heap of information up there and hide it, so it's not always in your
face. But with a map, you can only put the stuff that's going to fit on a
page. Like in ArcView, you can put in details about site locations, and
countries, cities, all kinds of stuff. Whereas a map alone is just an
illustration, ArcView is a lot more than just a picture, a map (t10 p4).
Such inaccuracies/omissions of constructing maps by hand can distort their
geographical thinking, which students see as placing downward pressure on their
results.
In a way, our maps are slower to draw. If you made a mistake by
colouring in, then you have to live with it, or you have to go and get
another one and start again, and then what you write about it will be
wrong too.

189
I think that one of the benefits of using GIS is that we [those students who
chose to do their maps by hand instead of using GIS] had more chance of
making mistakes (t5 p5).
For this reason, the value of GIS in improving presentation quality is closely
linked to its role in deriving better assessment results for users than non-users.
It's probably the most time consuming thing we do, but it's probably the
most valuable for assessment (t3 p2).
Students expressing this conception are aware that they are among the minority,
statewide, of students using GIS as part of their Senior Geography. Within
Queensland's system of school-based assessment and moderation, students
consider GIS as providing an advantage over those students who do not use GIS.
This was specifically so for presenting maps within their assessment items, some
of which would inevitably be sent to District Review Panels for moderation.
Well, say they keep all our assessment and stuff for like that we hand in
over the Senior Geography, the two years, and I think they give it to the
um, whoever does the marking for the OP, and our presentations look a
lot more professional, then we might have a slight advantage over
someone who doesn’t use it, who might do their map by hand (t2 p2).
I: Why do you think your teachers want you to use it; what do you
think your teachers want you to get out of it?
Experience. Using GIS maps. Like getting ahead of other schools and
stuff (t4 p1).
Well, say they keep all our assessment and stuff for, like, that we hand in
over the senior geography, the two years, and I think they give it to the …
[District Review Panel] … and our presentations look a lot more
professional then we might have a slight advantage over someone who
doesn’t use it, who might do their map by hand (t2 p2).

190
I: If you weren’t using GIS for the [field study that you undertook], what
would you do?
I think we would do a really dodgy job on Microsoft Word and it wouldn’t
turn out as good.
Yeah.
You could find some map somewhere, but you couldn’t do the stuff that
you can do.
It wouldn’t be as good, because it wouldn’t let you see details, like wind
directions, and waves (t6 p5).
P1: I would use it even if we had the choice because it makes the
assignment look neat, better than some pictures pasted on there from
Google or something.
P2: But are we using it because we want to use it or because we have to
use it?
P1: I reckon we are using it because it looks neat.
P3: I think it really gives an edge to the report (t6 p6).
As previously noted, students see GIS as an alternative to the more common way
of doing things in their classes. However, this is not to say that they categorically
prefer to use GIS in all situations, nor that it should replace more traditional
learning experiences. Rather, they see that using GIS as part of Senior
Geography improves the whole of Senior Geography.
As I said before, there's a lot in geography, and not all of it is relevant to
ArcView, but I think [GIS] is beneficial to some parts [of Senior
Geography] (t10 p5).
It does this not by taking the place of any particular classroom experience but,
rather, by augmenting the multiplicity of skills and experiences gained through
studying Senior Geography, as well as augmenting students' own capacities to
learn these skills. This ability of students to reconcile themselves to the role of
GIS as a part of their learning appeared within a number of interviews, such as
the following excerpt from Transcript Eight.

191
P1: Can I ask a question? Which one, okay, which one do you learn
better from, drawing it or on the computer? Because, if you draw it and
stuff it may actually go straight through your head, because you are
concentrating more, whereas if you're reading it [a map produced using
GIS], you know you might just read it and it will go out the other way. So
which one do you learn more from?
P2: Maybe we need to look at both situations, because if you are just
sitting there drawing it you can get annoyed and think “why am I
drawing this and it kind of goes through your head, and you see the end
result, and the end result is seeing the map and that is how you learn the
information, but that is the same end result that you get with GIS. You
see the map, you print it, you look at it, and you have the same
information. So, I would go “yep, I would learn the same amount by
doing that map by hand or by doing it by GIS” (t8 p6).
I: Who would like to keep using it and why?
Yeah, so I can get to know it better so I can use it more in the future (t5
p5).
Further evidence of this conception of GIS as a better Geography is that students
experience GIS as something that they are keen to pursue further. This is not
because they believe themselves to be competent in its use. In fact, it is quite the
contrary. Because students see the inclusion of GIS as constituting a superior
form of Senior Geography, they are keen to gain the competency that they
believe will better enable them to fully embrace the opportunities such a course
of study will present, much like their willingness to learn the many other new
skills that the course entails.
I: Do you think you are advantaged or disadvantaged being able to use
GIS?
Advantaged to the fact that we’re learning or have learnt to use it, but
disadvantaged to the fact that we haven’t been taught to use it more.
If we got to use it more that would be better (t5 p5).
192
Category Six – in summary
Students experience GIS as Better Geography: offering a superior curriculum,
and broader geographical education, when contrasted to a Senior Geography
that omits its use. As such, the referential aspect of this conception is better
geography. Structurally, this conception is revealed through students
experiencing GIS as being: worthwhile once you know how to use it; an efficient
use of time; a presentation tool; and, a better way to do geography. Focal in
student awareness of their experiences of GIS is that their use in Senior
Geography improves the course and, through this, improves student prospects of
success in and beyond Senior Geography.
Summary
This section has delimited the qualitatively different ways in which GIS are
experienced by participants. Explanatory labels, discursive description and
illustrative quotations have been presented to delineate each of the six Categories
of Description and, through this, the six qualitatively different conceptions that
are lived by participating students. The distinguishing features of each Category
are summarised in Table 18, as are the constituent referential and structural
elements of each conception.
Now that the ways in which students experienced GIS have been understood,
attention will be directed to identifying the way in which these conceptions are
intertwined, through construction of an Outcome Space.

193
Table 18.
Summary of Categories of Description.
Category Label
(Abbreviated)
Referential Aspect
(what GIS is
conceived as)
Structural Aspects
(how GIS is conceived)
Focal Element
Maps in Geography
GIS as maps and a
source of maps in
geography
� Greater quality & quantity of data
than other maps
� Maps are not a separate part of the
GIS program
The focus on maps is the distinguishing feature of this conception. GIS is
delimited to maps as they are presented by the GIS program. Using GIS requires
the use of maps.
Mapping in
Geography
GIS as mapping in
geography
� Manipulating mapped or mappable
information
� Making maps
The focus on how maps are used in geography is the distinguishing feature of this
conception. GIS is delimited as an activity that involves using maps in Geography.
Professional
Mapping Tool
GIS as a
professional
mapping tool
� Beyond school need and IT
capabilities
� Being able to do many more things
than we know it can do
� Doing the geography for you
� A poor use of time
The distinguishing feature of this conception is its focus on GIS being designed for
people who are more geographically and computer literate than students. GIS is
delimited as an activity that is disconnected from students they see as the purpose
of Senior Geography.

194
Category Label
(Abbreviated)
Referential Aspect
(what GIS is
conceived as)
Structural Aspects
(how GIS is conceived)
Focal Element
Frustrating
Geography
GIS as frustrating
geography
� Frustrating
� Tedious
� Difficult to learn
� Creating uncertainty
The distinguishing feature of this conception is its focus on GIS as being a
frustrating way to do tasks in Senior Geography, and a way of frustrating progress
toward attainment of those tasks. GIS is delimited as a disconcerting and irksome
experience, which students find both academically and personally discomfiting.
Relevant Geography GIS as relevant
geography
� Relevant to different learning styles
� Relevant to Senior Geography
� Relevant for computer skills
� Relevant to life beyond school
The focus on relevance to students' immediate studies and to their future lives is
the distinguishing feature of this conception. GIS is delimited as a way of doing
geography that is aligned to what students see as the purpose of Senior Geography.
Better Geography GIS as a better
Geography
� Worthwhile once you know how to
use it
� An efficient use of time
� A presentation tool
� A better way to do geography
The distinguishing feature of this conception is its focus on the superior nature of
learning experiences and learning outcomes. GIS is delimited as improving Senior
Geography and student prospects of success in and beyond Senior Geography.

195
Description of the Outcome Space: GIS as Experienced by
Students
The way in which the various conceptions of GIS that were derived from the data
analyses are logically related is graphically depicted in the outcome space
(Marton, 1986). The outcome space presents two interconnected elements:
referential and structural (Figure 19). The referential aspect describes the
varying meanings of the conceptions of GIS and the global meaning of GIS as
the phenomenon under investigation. In so doing, it describes what GIS are
conceived as (Bruce, 1997); specifically, the current study reveals these
referential aspects using statements commencing with “GIS is…”. The structural
aspect describes how GIS are conceived by illustrating how the conceptions are
related; “how the phenomenon and its component parts are delineated and related
to each other” (Marton et al., 1993, p. 278). Moreover, Marton et al. add that
this “structural aspect is dialectically intertwined with the referential (or
meaning) aspect of the conception” (p. 278). A further distinction may be made
within the structural aspects of the outcome space, whereby the relationships
between the conceptions may be hierarchical or developmental (Bruce, 1997).
The varying meanings inherent in each conception contribute to the position of
each category in the outcome space; in other words, they provide the outcome
space with its structure.
Figure 18. Elements of an Outcome Space.
Outcome Space
Structural aspects
Describes how conceptions are related
Referential aspects
Describes conceptions of GIS
196
The Chosen Metaphor
Following the research methodology and analysis of Mailler (2006), the six
categories of description have been allocated metaphoric labels. The purpose of
these is to assist the conceptions to be understood more clearly through
referencing them to “concrete examples with which the reader may be more
familiar” (p. 193). The labels emerged from students' discussion of their
experiences of GIS, with the chosen metaphor emerging from three distinct ways
in which students referred to their experiences of it. First, since discussion was
largely about their experiences of geography through GIS, it is perhaps not
surprising that students frequently described this using language also relevant to
the discussion of maps and landscapes generally, and landscapes mapped with
GIS, specifically. Second, discussion also tended to describe GIS in terms of it
being a distinct feature of the Senior Geography curriculum, much like an island
is a distinct feature of the broader landscape. Third, since students frequently
described their experiences of GIS using language also relevant to the discussion
of a journey, the chosen metaphor involves the passage of student explorers
through the mapped island landscape. Within this metaphor, each category of
description is discernible as a feature (or Theme) of a landscape mapped with
GIS, with each feature possessing two or more distinct elements (or Attributes).
The Themes and their Attributes are introduced in Table 19.
Following Nagel (2002), the outcome space will be revealed in two stages. First,
the “constituent elements that are used to establish the visual representation” will
be revealed (p. 224). Second, the overall visual schema that establishes the
interrelationships between those constituent elements will be revealed.

197
Table 19.
Relationship between categories of description and the Mapped Island Landscape metaphor.
Category of Description Metaphor (Theme) Metaphoric elements
(Attributes) Significance within the Mapped Landscape
Category 1 GIS as maps and a source of maps in geography
Water sources Reliable water sources
Unreliable water sources
Watercourses provide a source of water to the student explorer, without which their progress through the landscape will be limited and difficult.
Category 2 GIS as mapping in geography Signs Sign posts Other signs
Signs provide guidance and directions for the student explorer to follow. The ease and reliability with which these may be followed influences the ease with which the student explorer may traverse the landscape.
Category 3 GIS as a professional mapping tool
Terrain
Level ground Undulating slopes
Steep slopes Cliffs
Terrain is one variable that influences the freedom of passage for the student explorer, and determines the routes that will be taken to traverse the landscape.
Category 4 GIS as frustrating geography Vegetation
Grassland Open forest
Closed forest Jungle
Vegetation is another variable that influences the freedom of passage for the student explorer, also determining the routes that may be taken to traverse the landscape.
Category 5 GIS as relevant geography Paths Reliable paths
Unreliable paths
Paths provide a means for the student explorer to more easily traverse the landscape, enabling passage through/across otherwise less accessible terrain and/or vegetation.
Category 6 GIS as a better Geography Vantage points Views
Vantage Points provide the student explorer with information about the landscape itself, such that they may better see where they have come from and better identify easier routes through the landscape. Vantage Points also enable the student explorer to see the world beyond the landscape of their immediate experience.

198
Three elements of the outcome space.
Emerging from the six conceptions are three constituent elements from which the
outcome space is derived (Figure 20). These are:
Element One: Physical features – GIS is.
Element Two: Cultural features – GIS does.
Element Three: Experiential features – GIS feels.
Signs
GIS DOES… Mapping
Cultural Features
Water Supplies Vegetation
Terrain
GIS IS…
Maps Frustration
Professional Tool
Physical Features
Paths Vantage Points
GIS FEELS… Relevant Better Geography
Experiential Features
Figure 19. The three constituent elements of the outcome space.
It is appropriate now for the metaphor of each constituent Element to be
described in turn, with the metaphor deconstructed to reveal the parallel student
experience of GIS.
Element One
Element One refers to students' experiences of the program itself; of what GIS is
(Figure 21). It emphasises students' experiences of GIS as reflecting their view
of it as being 'easy' or 'hard', based upon their understanding of maps being its
fundamental component (Category One), their efforts to learn how to use it
(Category Four), and their belief that the program is beyond the capabilities and

199
needs of Senior Geography (Category Three). Element One provides the
physical landscape over which students must travel as they experience GIS.
Table 20 compares students’ metaphoric experiences of Element Three with their
literal experiences of GIS.
Signs
GIS DOES… Mapping
Cultural Features
Water Supplies Vegetation
Terrain
GIS IS…
Maps Frustration
Professional Tool
Physical Features
Paths Vantage Points
GIS FEELS… Relevant Better Geography
Experiential Features
Figure 20. Element One.

200
Table 20.
Metaphoric and literal student experiences of Element One.
Element One: Metaphor Element One: Student Experience
A critical feature of the island landscape for the student explorer is the supply of water. Forward progress can only be sustained through repeated consumption of water. Since the student explorer can only carry so much water at any one time, it is necessary for him/her to replenish his/her supplies at regular intervals. For this reason, it is important that the student explorer does not stray too far from the Reliable Water Sources on the island. Similarly, the amount of water needed by the student explorer will depend on other conditions that they encounter, such as terrain and density of vegetation. Reliance solely upon the Unreliable Water Sources is fraught with danger and is likely to impede the student explorer's journey through the island, as their capacity to endure adverse conditions on the island is limited.
The extent to which students experience GIS as being maps (Unreliable Water), or more so as a source of maps of greater quality and quantity of information (Reliable Water), influences their capacity to engage with GIS to achieve any educational goals intended for its use. Students who experience GIS solely as maps are greatly limited in their capacity to experience other aspects of GIS. This is because they are not aware of how to proceed with its use, nor does their understanding sustain their progress into new situations; when confronted by any difficulty when using GIS, these students are likely to find these to be insurmountable. By contrast, students who recognise that GIS present maps with data of superior quality and quantity are more able to persevere to experience some degree of progress through the intended learning experiences, since their understanding of GIS as a source of maps allows them to consider a greater range of possibilities than had they seen GIS simply as the maps themselves. Students experience GIS as a Professional Tool to a range of extents. For some students and some tasks, this is a benefit, for others it is no more than something about which they are aware. For others, it is insurmountable. Accessing the potential of GIS is influenced by the extent of this conception being experienced.
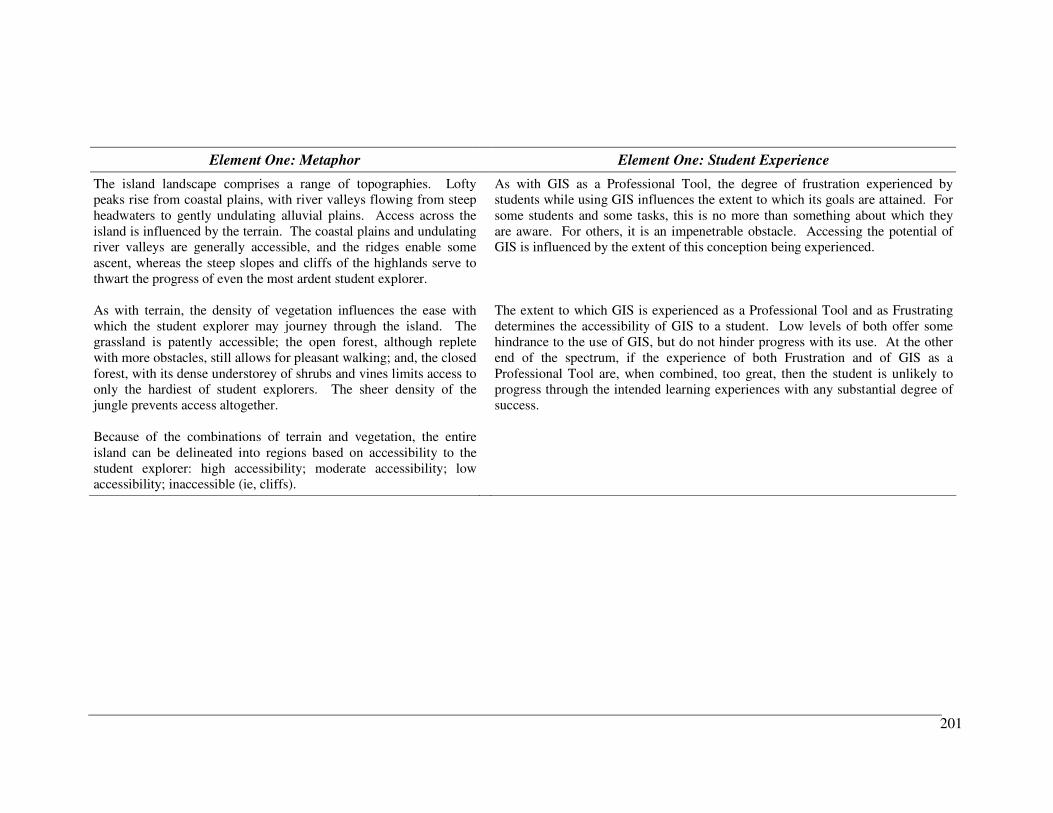
201
Element One: Metaphor Element One: Student Experience
The island landscape comprises a range of topographies. Lofty peaks rise from coastal plains, with river valleys flowing from steep headwaters to gently undulating alluvial plains. Access across the island is influenced by the terrain. The coastal plains and undulating river valleys are generally accessible, and the ridges enable some ascent, whereas the steep slopes and cliffs of the highlands serve to thwart the progress of even the most ardent student explorer. As with terrain, the density of vegetation influences the ease with which the student explorer may journey through the island. The grassland is patently accessible; the open forest, although replete with more obstacles, still allows for pleasant walking; and, the closed forest, with its dense understorey of shrubs and vines limits access to only the hardiest of student explorers. The sheer density of the jungle prevents access altogether. Because of the combinations of terrain and vegetation, the entire island can be delineated into regions based on accessibility to the student explorer: high accessibility; moderate accessibility; low accessibility; inaccessible (ie, cliffs).
As with GIS as a Professional Tool, the degree of frustration experienced by students while using GIS influences the extent to which its goals are attained. For some students and some tasks, this is no more than something about which they are aware. For others, it is an impenetrable obstacle. Accessing the potential of GIS is influenced by the extent of this conception being experienced. The extent to which GIS is experienced as a Professional Tool and as Frustrating determines the accessibility of GIS to a student. Low levels of both offer some hindrance to the use of GIS, but do not hinder progress with its use. At the other end of the spectrum, if the experience of both Frustration and of GIS as a Professional Tool are, when combined, too great, then the student is unlikely to progress through the intended learning experiences with any substantial degree of success.

202
Element Two
Element Two refers to students' experiences of using the program; of what GIS
does (Figure 22). It emphasises students' experiences of GIS as reflecting their
view of it as being a tool, based upon their use of it to manipulate and make maps
(Category Two). Element Two provides the guidance and directions in which
students may travel as they experience GIS. Table 21 compares students’
metaphoric experiences of Element Three with their literal experiences of GIS.
Signs
GIS DOES… Mapping
Cultural Features
Water Supplies Vegetation
Terrain
GIS IS…
Maps Frustration
Professional Tool
Physical Features
Paths Vantage Points
GIS FEELS… Relevant Better Geography
Experiential Features
Figure 21. Element Two
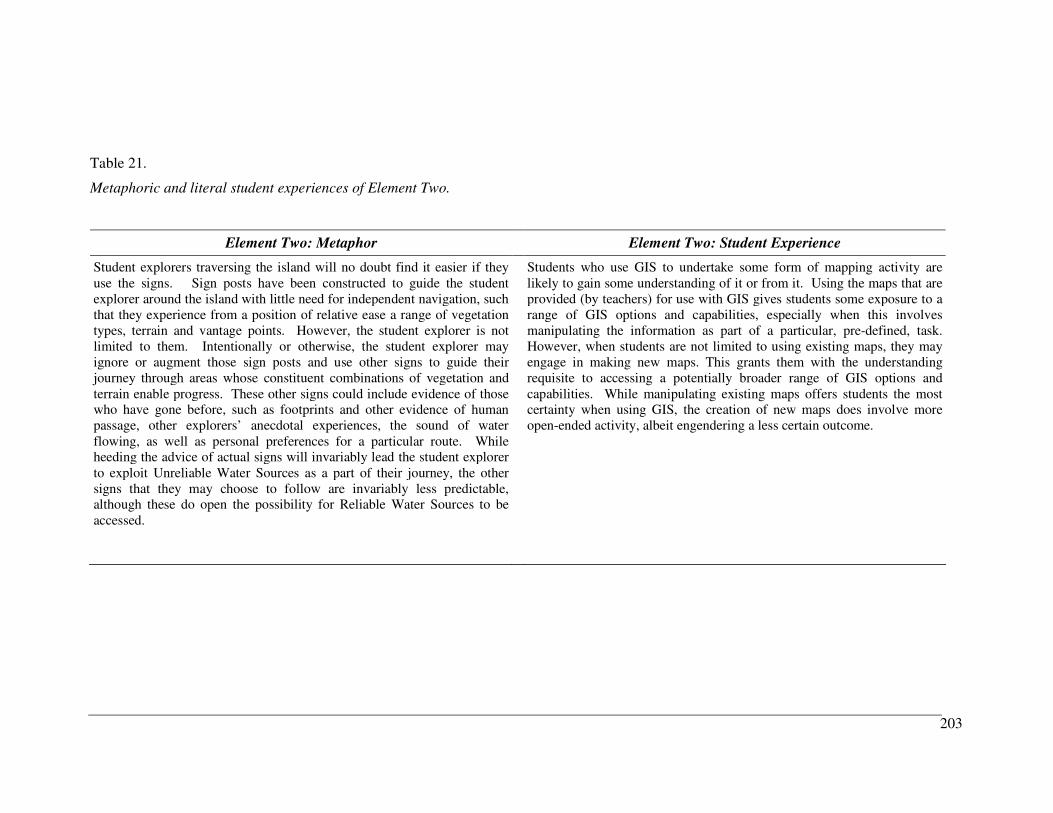
203
Table 21.
Metaphoric and literal student experiences of Element Two.
Element Two: Metaphor Element Two: Student Experience
Student explorers traversing the island will no doubt find it easier if they use the signs. Sign posts have been constructed to guide the student explorer around the island with little need for independent navigation, such that they experience from a position of relative ease a range of vegetation types, terrain and vantage points. However, the student explorer is not limited to them. Intentionally or otherwise, the student explorer may ignore or augment those sign posts and use other signs to guide their journey through areas whose constituent combinations of vegetation and terrain enable progress. These other signs could include evidence of those who have gone before, such as footprints and other evidence of human passage, other explorers’ anecdotal experiences, the sound of water flowing, as well as personal preferences for a particular route. While heeding the advice of actual signs will invariably lead the student explorer to exploit Unreliable Water Sources as a part of their journey, the other signs that they may choose to follow are invariably less predictable, although these do open the possibility for Reliable Water Sources to be accessed.
Students who use GIS to undertake some form of mapping activity are likely to gain some understanding of it or from it. Using the maps that are provided (by teachers) for use with GIS gives students some exposure to a range of GIS options and capabilities, especially when this involves manipulating the information as part of a particular, pre-defined, task. However, when students are not limited to using existing maps, they may engage in making new maps. This grants them with the understanding requisite to accessing a potentially broader range of GIS options and capabilities. While manipulating existing maps offers students the most certainty when using GIS, the creation of new maps does involve more open-ended activity, albeit engendering a less certain outcome.
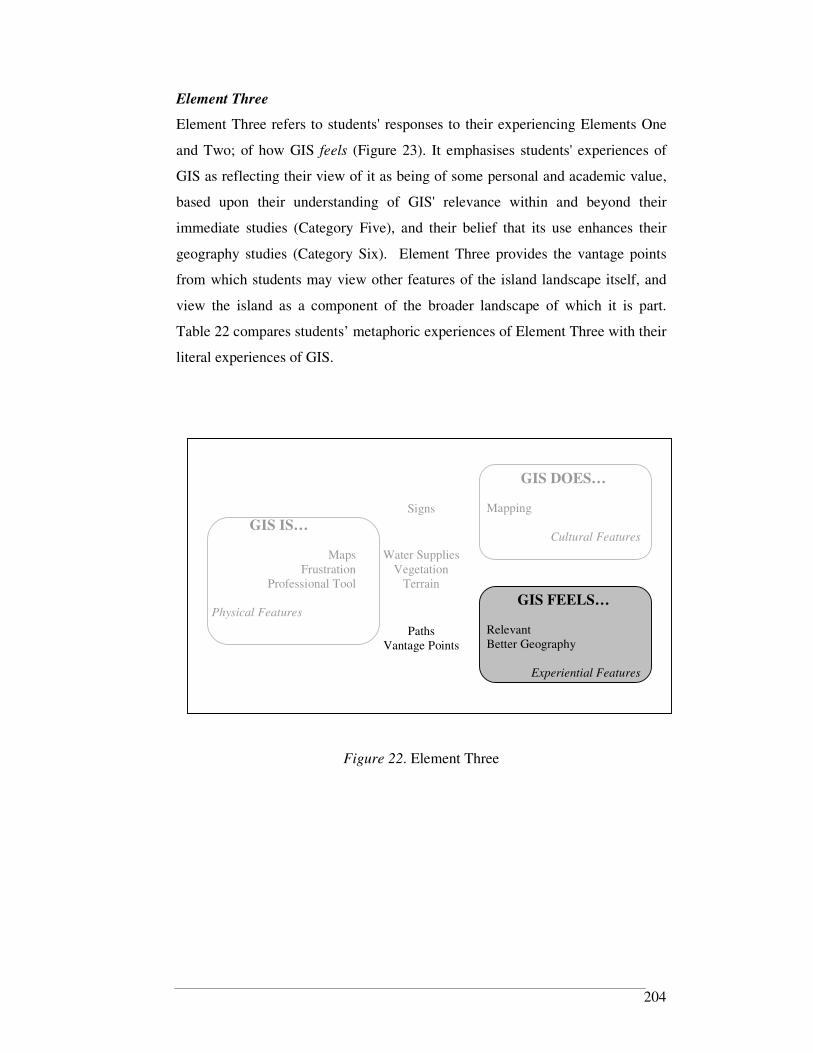
204
Element Three
Element Three refers to students' responses to their experiencing Elements One
and Two; of how GIS feels (Figure 23). It emphasises students' experiences of
GIS as reflecting their view of it as being of some personal and academic value,
based upon their understanding of GIS' relevance within and beyond their
immediate studies (Category Five), and their belief that its use enhances their
geography studies (Category Six). Element Three provides the vantage points
from which students may view other features of the island landscape itself, and
view the island as a component of the broader landscape of which it is part.
Table 22 compares students’ metaphoric experiences of Element Three with their
literal experiences of GIS.
Signs
GIS DOES… Mapping
Cultural Features
Water Supplies Vegetation
Terrain
GIS IS…
Maps Frustration
Professional Tool
Physical Features
Paths Vantage Points
GIS FEELS… Relevant Better Geography
Experiential Features
Figure 22. Element Three

205
Table 22.
Metaphoric and literal student experiences of Element Three.
Element Three: Metaphor Element Three: Student Experience
Access by the student explorer may be aided by various Paths. These serve two purposes. First, they enable the less capable or less energetic explorer to experience some of the island with comparative ease. Second they are located at sites where aspects of the island would otherwise serve to make the forward journey extraordinarily difficult, if not impossible. Reliable and Unreliable Paths provide access through areas in which travel would otherwise be somewhat difficult, and escort the student explorer across otherwise impassable areas. The quality of Unreliable Paths is, as their name suggests, not certain, nor is their destination. The island offers the student explorer many opportunities to avail themselves of fine views. These are located where combinations of vegetation and terrain allow for sight over parts of the island, or to beyond the island. Many of these are accessible via following the Signs and Reliable Paths, although they do not exploit Reliable Water Sources. Thus, the student explorer will be largely dependent upon whatever water they have brought with them to. Other peaks will remain permanently inaccessible to all but the most determined explorer who is prepared to take some risks with Unreliable Paths. However, given the nature of the terrain, it is not necessary for the student explorer to visit every vantage point in order to gain a comprehensive understanding of the island and beyond. Rather, should they choose their vantage points wisely, they will be able to gain an understanding and experience that will encompass (and exceed) that provided by some other (lower) vantage points, including an understanding of how they may better explore the island.
Students who experience GIS as being in some way relevant are likely to overcome challenges presented through their experience of GIS as being a professional tool and/or as frustrating. For some students and some tasks, the experience of relevance is limited to aspects of some GIS tasks, thus offsetting only a small degree of difficulty experienced through concurrently experiencing GIS as a professional tool and/or as frustrating. For others, the experience is of GIS as widely relevant, in which case their experiences of it as a professional tool and/or as frustrating are usually vicarious. Using GIS gives students the opportunity to experience Better Geography. At its pinnacle, this comes through students being aware of what they have been doing, what they can do, and how the experience of GIS 'fits' within the larger context of Senior Geography, and life. Lesser degrees of this are experienced when students experience some understanding of what they have been doing, what they can do and how the experience 'fits' within some aspects of the larger context of Senior Geography and, to a lesser extent, life. Students who experience the former are well positioned to become capable users of GIS, being aware that GIS' processes are required to support learning, rather than vice versa. In this way, they 'rise above' and see beyond the difficulties associated with its use.

206
The Overall Visual Schema of the Outcome Space
The role of the outcome space is to capture logically the different ways in which
the participating students experienced the relationships between these three
constituent elements outlined previously (Marton, 1994). Following this, the
outcome space presented here extends the metaphors used to describe those three
elements; hence capturing the range of qualitative variations in students’
experiences of GIS (Figure 24).
A mapped island landscape was chosen because it is commonly experienced by
people as a distinguishable feature within a broader landscape, just as GIS are
commonly experienced by students as a distinguishable feature with the broader
landscape of Senior Geography.
Deconstructing the Mapped Island Landscape
Any landscape will comprise many features. Within a physical landscape, these
will include terrain, vegetation, drainage, elevation and aspect. Within a physical
landscape, these will not exist independently. Rather, their form is the direct
consequence of their constant interactions through time. Indeed, a particular
landscape can usually be recognised by the particular combinations of these
interactions at a particular location.
The addition of cultural elements to this landscape adds further complexity, and
for two reasons. First, the addition of human constructions such as signs and
paths increases the complexity of the interactions between and among these and
the physical features, thus influencing the future shape of the landscape. Second,
the addition of human experiences of that landscape increases the complexity of
human interaction with the processes that have determined the landscape’s shape;
thereby directly influencing the nature of future processes. In this way, the
cultural elements will – intentionally or otherwise – irrevocably alter the nature
of the landscape itself. Of course, an adjunct to this is that such an alteration
will, also irrevocably, alter any subsequent human experiences of that landscape.

207
Figure 23. The Outcome Space.

208
Culturally and historically, the features and language of landscapes and human
experiences of them have come to assume other, symbolic, meanings; used to
describe other aspects of human experience such that these are communicated for
better understanding. Likewise, the features and language of landscapes and
human experiences of them will assist us in depicting the qualitatively different
ways in which students experienced GIS.
Figure 24 captures the conceptions also as a landscape; thus also comprising a
range of physical and cultural features. While the nature of their interactions
results in a potentially infinite range of spatial and temporal combinations, there
is evidence that these constitute a pattern of discernible landscape morphologies.
The chosen metaphor thus articulates the conceptions such that they possess an
internal logic from which the likely experiences associated with these
morphologies can be readily understood. Indeed, it is within this form that the
conceptions ought to be interpreted and it is to the pattern of discernible
landscape morphologies that our attention will now be directed.
The island comprises summits, reliable and unreliable paths, reliable and
unreliable water sources, formal and informal signs, and combinations of
vegetation and terrain which constitute areas of differing accessibility: high,
medium, low and inaccessible.
Initial embarkation to the island would usually be via one of two points, both
comprising a Reliable Path near an Unreliable Water Supply, with a Sign
providing initial interpretive and directive information. Apart from these two
points, entry to the island may also be through landing anywhere along the shore
in places of various accessibility, or it could be through descending to a similarly
large range of points from the air, for example by parachute. Because of the
different nature of immediate access (Paths) and information (Signs) available at
the various points of entry, the initial direction taken by an explorer is equally
varied.
The three summits are at different elevations. Hence, they command different
views over and beyond the island. From the lowest vantage point, Summit A, the

209
view includes detail that includes the accessibility of the other summits. Visible
from Summit A is a possible route to Summit B, via an Unreliable Path and a
traipse through some moderately and then highly accessible landscape, that was
otherwise not visible from lower ground. However, from Summit A, Summit C
appears inaccessible due to the presence of dense vegetation and steep terrain,
including cliffs. A Reliable Water source is visible from Summit A as is the
possible route from the main path that goes to it. Another Reliable Water source
is visible in the valley that separates Summits B and C, although it appears
inaccessible. From Summit B, however, it is possible to see the Unreliable Path
leading not just to this Reliable Water source, but to additional Paths, a Sign and
additional Vantage Point, and leading ultimately beyond the cliffs to the summit
itself. The view from Summit B is greater in scope than that from Summit A,
with Summit C offering the greatest vantage point of all; commanding views not
just of the landscape through which access to the Summit has been gained, but of
otherwise inaccessible landscapes on the island’s other side and beyond its
shores.
As with participants in many real landscapes, the role of students as participants
within this metaphoric island is that of explorers. Significantly, however, the
exploration is not an optional one.
I: How often would you like to use it?
P1: Well, if I had one of those assignments every week then I would want to
use it every week. I’d use it as often as I needed to do what I had to do
P2: But, I’m not going to go in there in my lunch time just to play with it (t7
p5)
To deconstruct this metaphor, students experience GIS as a distinguishable
component within the broader landscape of Senior Geography. The level of
interest and motivation of students differs greatly, and their commitment to the
stated and other goals of Senior Geography is equally variable. With respect to
GIS, and although it may be external to themselves, the students’ goal is to at
once become familiar with GIS itself (learning about GIS), and through this, to
210
become familiar with the concepts within and beyond Senior Geography (leaning
with GIS).
The experience of students is aided by some of their experiences of GIS, yet
hindered by some of their other experiences of GIS; in any case, combinations of
experiences may serve to promote or thwart student progress.
P1: ‘Cause, yeah, it’s a lot more complicated, like XXX said before,
because you like have to have experience to create map in ArcView GIS
and (t5 p2).
P2: I wouldn’t say that it is totally worthless and pointless. Most of
the people will say that it’s just too complicated.
P3: Yeah.
P4: So, you don’t think that, you just think that it is all complicated
and you have to have experience to know what to do (t5 p4).
Exploration of the island involves moving through it. Regardless of the route or
time taken, the supply of water is essential. The amount of water required to
sustain the exploration, however, will depend upon the route taken and the time
required to traverse that route. Adhering to Reliable Paths, travelling short
distances to only those clearly Sign-posted places, will allow an explorer
comparatively easy passage through a limited variety of highly accessible terrain
and vegetation. Without water additional to that which they consumed prior their
embarkation to the island, however, it is likely that they would fail to reach any
vantage points from where they might otherwise view parts of the island and the
landscape beyond.
P1: We should be given examples and we should be given reasons for it;
[we need to know] the ‘Because’ [of what we are meant to be doing]
P2: I think we have sort of been pushed into it, pushed off the cliff ...
because [the teacher] hasn’t given us a manual for it, but I think that if
we explore it for ourselves then, we know it’s hard, but I think we’ll get a
better understanding of it in the end
211
P3: I don’t even know what it is at all, I just do whatever he says because
I don’t know what GIS is really meant to be or for, so I just do what he
says and I don’t know why he says it, and I don’t worry about it because
if I worry about it I just confuse myself.
P4: This assessment piece, the criteria was to show a map that showed
the breakwater, [the teacher] didn’t give us or say that you can make a
map, or what sort of map, so we just did what we’re told to do because
that’s what [the teacher] wanted
P5: And I need to have someone to come in and come in to explain what
its basic parts are and what it does for us.
P6: The thing what I think of that is that a lot of the stuff that someone
says and its technology, and if you’re not very familiar with technology
yourself, and they tell you all this stuff that you should do this and you
should do that, then I think it just goes straight over your head. I mean
you might get some of it, but the other stuff just goes.
P2: I reckon you should get someone to go in there and show you
themselves, like hop on the computer and show you.
P5: But I forget, that’s why I think you need a manual to say that this is
what you do because and blah blah blah and have each step done really
detailed, so then when you look at and say I want to do this, you can then
look at it and find out how to do it (t6 p6).
Alternatively, the breadth of an explorer’s experience of the island may benefit
from moving beyond the sign-posted Paths to explore other routes. By utilising
Other Signs, such as their own prior experience and/or other explorer’s anecdotal
experiences, footprints, considering the sources of water available to them at
different locations and times, and avoiding inaccessible combinations of dense
vegetation and steep terrain, this explorer will be able to traverse a variety of
landscape morphologies, and exploit water supplies not otherwise accessible via
the Reliable Paths, and which themselves traverse those more impenetrable
landscape morphologies. Although this route-making will present more
obstacles than experienced by our first explorer, it also presents motivational
benefits that remain unknown to them. By doing so, this explorer will
experience a greater variety of the island’s geography and can reach Vantage

212
Points which not only afford greater views of the island and beyond, but afford
them with information about the island that may be used to inform its further
exploration.
Such variations in the experience of explorers results in quite different
understandings of the island and its place within the surrounding landscape, and
they represent disparate ends of the exploration experience.
P1: It's f**ked up
P2: I don’t understand it
P3: … I hate that program (t10 p1).
It gives a really good insight into the town that we live in. We learn more
about it (t2 p3).
It is exciting really. It's hard not to have it once you've got it (t8 p8).
However, they do serve to illustrate the different experiences of students
engaging with GIS. Typically, explorers will enter the island at a predetermined
place, at which point they will drink some water which they brought with them.
This water will sustain their passage until it is replenished during the exploration.
Failing to replenish the water, or only obtaining water from the most accessible -
Unreliable - supplies, will limit the extent to which the explorer may travel. In
turn, this will limit the breadth of experience that the explorer will gain of the
island.
Perhaps paradoxically, accessing Reliable water supplies requires divergence
from the Reliable Paths and the exertion of greater effort by travelling further
distances, and along Unreliable Paths through less accessible landscapes. For the
explorer committed to the goal, this additional exertion is a worthwhile expense
to enable the exploration to continue and to proceed beyond the already known
elements of the island. Doing so affords the explorer more information about the
island’s landscapes, and more confidence and skills to traverse areas that may - at
first sight - appear somewhat impenetrable, including reaching summits that,

213
based on early experiences of the island, were insurmountable. Hence, by
applying more effort, and being committed to the exploration’s goal, an explorer
may gain the understandings, experience and skills that enable the goal to be
attained better.
Extending the metaphor
The preceding discussion considers a wide range of implications for geography
education, and the use of GIS by geography students. However, the extent to
which these implications are a reality for all students is not known. This is
because the findings of this study represent an exploration into the wider
conceptions of GIS held by students, rather than specific understandings and
their development that individual students may or may not gain from engaging
with it.
Having said this, it is possible to extend the metaphor to allow some tentative
groupings to emerge from within the findings. The groupings may assist to
furthering understanding of students’ experiences of GIS in Senior Geography,
and of the pedagogical implications of GIS’ role in Senior Geography. While
there are, no doubt, many more combinations of experiences within the island
landscape, the following four groups reflect distinct combinations of conceptions
and descriptive data that relate to student experiences of GIS.
To understand the extent to which using GIS may allow students within these
groups to gain the spatial awareness suggested above as being requisite to
experiencing success with GIS, it is worth employing the outcome space to
identify possible causal effects for these four groups. For clarity, then, the
outcome space metaphor will be extended to understand the likely experience of
each group of students.
Group One presents a negative experience of GIS and makes references mostly
to lower-order KGIs. These students may have experienced a difficult
introduction to the metaphoric island landscape, including being thirsty on

214
arrival. It is quite likely that they arrived at a different time and/or at a location
on the island that was otherwise inaccessible by conventional means, with little
understanding of their purpose for being there. These students struggled to make
sense of the landscape in which they found themselves and travelled slowly
along Reliable Paths through the island rather than seeking to strategically
position themselves to be able to reach a particular destination. If they did reach
the most accessible vantage point (Summit A), they will have observed the
majority of the island as inaccessible due to a combination of terrain and
vegetation. Their focus on simple survival precluded their concentrating on
discovering Other Signs which may have provided some clues for more
successful exploration. For these students, the aim was simply to rejoin their
group and survive until such time as they were released from the island's
captivity.
Group Two presents a positive experience of GIS and makes references mostly to
lower-order KGIs. These students may have experienced a clear pathway
through the metaphoric island landscape. These students will have entered the
island via a Reliable Path and will have been led through the more professional
and frustrating aspects of GIS' use to experience a pre-determined level of
success, such as a nearby Vantage Point offering limited views. The uncertain
confidence of the group leader prevented these students from travelling
independently of the group; the group's size meant that not all students got the
opportunity to use the equipment that would have enabled more independent
route planning; and limitations of time prevented these students from more
independently experiencing the wide range of cultural and physical landscapes
available on the island. Because of this, the students had a lovely day out with
their peers, but did not fully experience the scope of GIS' applications within and
beyond their studies, thus leaving them dependent upon the prescriptive approach
to GIS tasks.
Group Three presents a positive experience of GIS and makes references to both
lower and higher-order KGIs. This group may have experienced a fuller array of
learning experiences using GIS than other groups. This commenced with an
introduction to the island and its landscape prior to arrival, and some preliminary
215
planning which involved clear directions to enable students to understand those
landscape elements which may thwart their progress. Thus, they were fully
hydrated upon arrival at a predetermined location, from where the group leader
provided opportunities for students to move with increasing autonomy on and off
the Reliable Paths to explore the island. The island’s features and suggested
ways of traversing the island were described to students by the leader using a
variety of means; for some, this was in person; for others, it was through pre-
printed materials; for others still, it was provided but not used by students. The
students of Group Three reached different points on the ‘island’, and therefore
some more clearly saw the immediate and further benefits of its use than others.
But, since they were all able to explore the island in a way that catered to their
own capabilities, all had a positive experience of the landscape.
Group Four presented a negative experience of GIS and made references to both
lower and higher-order KGIs. Students from this group may have been unaware
of the presence of an island whose summit was attainable, and whose
surrounding landscape was visible. Nor may these students have been aware of
those elements of the island which may assist them in their journey, presuming
that they were aware that their journey possessed a particular destination. In this
regard, these students will have been exposed to spatial phenomena and KGIs,
but they arrived at the island with great thirst. Accordingly, the extent to which
they engaged with the island’s morphologies was limited by the other obstacles
that they faced, such as the seemingly relentless topography and vegetation. For
these students to gain some understanding of the higher-order KGIs suggests that
these elements of the island were not impenetrable. Rather, they presented an
obstacle, but one that was not worth the effort to overcome.
Evident from this discussion is that, just like their experiences of exploring a
landscape, students’ experience of using GIS as a part of Senior Geography, is a
product of:
1. their vicarious interaction with it;
2. their direct interaction with it;
3. their knowledge and understanding of the processes that have and will
shape it; and,

216
4. the value to which they ascribe it and to which they ascribe their further
experiences of it.
Chapter Summary
This Chapter has explored the various and complex meanings of GIS held by
Senior Geography students. Six conceptions of GIS held by the 109 student
participants have been declared and their relation to each other has been
illustrated through an Outcome Space. The findings reveal that students may
experience GIS in up to six qualitatively different ways which, despite their
relationships, possess critical differences that serve to frame a student’s overall
experience of GIS.
The conceptions and outcome space have been depicted using an island
landscape metaphor so that students’ experiences of GIS can be understood in
language used by the participants themselves during their discussions of them.
This metaphor comprises a number of constituent elements which have been
arranged to provide an internal logic to reveal the many ways in which the six
conceptions can be related, and experienced by students.
The following Chapter will discuss the implications of these results with respect
to the nature and place of geography within school curricula, and of the potential
role that GIS may play within a geographical education. It will conclude with a
reflection on the method and recommended directions for future research.
217
CHAPTER FIVE
DISCUSSION
Education has a history of regularly adopting new ideas, but it has done so
without the wide-scale assessment and scientific research that is necessary to
distinguish effective from ineffective forms” (Hempenstall, 2007).
Introduction
This investigation employed a phenomenographic method to identify the
qualitatively different ways in which a group of students experienced GIS. This
involved an exploration from the second order perspective, whereby the central
phenomenon and specific research question intended to identify not the
phenomenon - GIS - itself, but the experience that students had of that
phenomenon.
The central phenomenon and research question for this study emerged from a
review of literature. The relevant literature was based upon assumptions drawn
primarily from a first order perspective about the nature and place of geography
within school curricula, and of the potential role that GIS may play within a
geographical education. It was the intention, then, of this research to clarify the
authenticity of many of these assumptions, by explicitly investigating students’
experiences.
In this regard, the following discussion seeks to clarify the potential role of GIS
in geography education by melding the research findings with the reviewed
literature. For clarity, the discussion will largely mirror the organisational
sequence – and include the associated diagrams - found in Chapter Two. First, it
will review the findings with respect to their implications for Focus I, The Nature
of Geography Education, including: geography itself; its multidisciplinarity and
interconnectedness; its emphasis on skills; its emphasis on problem solving; its
role in citizenship and participation; and, its place as a misunderstood subject.
The discussion will then consider the findings with respect to their implications
218
for Focus II, Geographical Information Systems, including: its links to student
learning; and, issues affecting its use. The Chapter will conclude with a reflection
on the method and its limitations, and directions for future research.
Research Outcomes
This research clearly contributes to addressing the questions that emerged from
the review of current literature (Chapter Two):
1. While involved in GIS-related tasks, some students do integrate
information from a map to identify patterns/relationships that are not
explicitly labelled.
2. Some students did extend their understanding of spatial phenomena to
include both an awareness of pattern, trends and land-people
interactions, and the analysis of information to determine reasons for
these trends and patterns.
3. While involved in field tasks, some students augmented the
information provided with the GIS with information that they
gathered themselves. By adding these data to the GIS, students not
only integrated mapped information, they collected and added
mappable information to it.
4. Some students were capable of arranging multiple sets of data as
discrete, yet spatially uniform, layers: the initial GIS-based data, and
their own (primary) data observations.
5. Comparing the placement of the elements of each layer, in
conjunction with the other understandings that they possessed (e.g.,
from class work), enabled some students not only to determine
possible reasons for the patterns that they had identified (deduction),
but to draw conclusions and make generalisations (induction) about
the map’s features.

219
6. The nature of the tasks described by participants, and many others in
Senior Geography, is such that the phenomena being studied while
using GIS necessarily draws its information from a range of
disciplines, e.g., town planning, geomorphology.
7. Beyond its evident role in exposing students to the development of
spatial awareness, the manner in which the participants used GIS to
ultimately resolve issues and to make decisions regarding the future
of the phenomena being investigated clearly aligned with the
geographical route of inquiry.
8. The combination of several of the above points further indicate that,
while using GIS, some students do:
a. think graphically, by engaging in skills of information processing,
reasoning, inquiry, creative thinking and evaluation.
b. better understand the world that they live in; and,
c. see value in subject Geography.
Each of these findings will be discussed further as part of this Chapter.

220
The nature of geography
Geography Described
Review of relevant literature revealed four common elements to geography’s
many definitions: location; pattern; distribution; and, land-people interaction
(Gerber, 1997). Its “distinctive feature” is its emphasis upon skills, their
development and application (Rawling, 1997, p. 11). Review of the findings
reveals that references to all four elements emerged through student discussions
of their experiences of GIS. Furthermore, and revealed by Conceptions Five and
Six, it confirms that students clearly experience GIS as augmenting the emphasis
of geography on skills. Conception Five, GIS as relevant within and beyond the
school experience, revealed that using GIS as part of Senior Geography can
provide a framework for students to make sense of the spatial data that they
encounter within their daily lives, thus aligning the GIS-inclusive curriculum
with the role of geographers. Moreover, Conception Six, GIS as a better
geography: offering a superior curriculum, and broader geographical education,
when contrasted to a Senior Geography that omits its use, revealed that the value
of these aspects of the subject enables geography’s value to extend beyond itself,
enabling geography students to describe and attempt to explain patterns evident
within human-natural environments.
Accordingly, the findings suggest that using GIS meets Marran’s (2003) five
reasons for the continued existence of geography education and, by corollary, the
continued existence of Senior Geography within the Queensland curriculum.
First, using GIS enables students to experience a spatial perspective that is not
Misunderstood
Citizenship & Participation
Natu
re o
f G
eo
gra
ph
y
Ed
ucati
on
Skills
Problem Solving
Multidisciplinarity & Interconnectedness
Methods, Motivation & Fieldwork
Geography Described

221
provided in any other discipline (Conceptions 1 and 2). Second, it describes and
seeks to explain changing patterns (Conceptions 2, 5 and 6). Third, it emphasises
problem-solving in real-world contexts (Conceptions 5 and 6). Fourth, it provides
an effective context for life-long learning (Conception 6). Finally, it provides
students with the opportunity to develop a perspective of the world from
scientific and humanistic viewpoints (Conceptions 5 and 6). Each of these will
be revisited during this Chapter.
Geography: its multidisciplinarity and interconnectedness
By enabling an interdisciplinarity and diversity, the findings suggest that using
GIS supports Rawling’s (2000) claim that geography provides a “socially critical
classroom pedagogy” (p. 210). This arises from students experiencing GIS as a
phenomenon which had applications beyond the geography classroom and which,
therefore, included some of those applications within the geography classroom
(Conceptions 3, 5 & 6)).
In this respect, by synthesising other, science and humanity, disciplines, using
GIS has enabled students of Senior Geography to experience one of the three
reasons for which the International Geographic Union (1997) claims geography
to be unique. While describing their experiences of using GIS, many students
made it patently obvious that its use enabled the use of ideas of other, discrete,
subjects (including those in which they themselves were enrolled). Specifically
within Conceptions 5 and 6, these experiences of GIS enabled students as part of
Misunderstood
Citizenship & Participation
Natu
re o
f G
eo
gra
ph
y
Ed
ucati
on
Skills
Problem Solving
Methods, Motivation & Fieldwork
Geography Described
Multidisciplinarity & Interconnectedness

222
their studies of Senior Geography to move toward the synthesis of knowledge in
a more holistic sense than they may have otherwise achieved.
This experience of GIS as a multidisciplinary phenomenon supports the view that
the Senior Geography syllabus is convergent in nature, encompassing other
disciplines. Additionally, GIS was commonly used by students who investigated
local issues to contextualise and personalise their studies of the regional and/or
global processes of which those local issues were part. By doing so, using GIS
in this way engendered an element of interconnectivity, the emphasis of which
was encouraged by IGU a decade ago (1997), and the recognition of which is a
precursor to students’ deeper understanding (Murphy, Morrisson & Conolly,
2001).
Whereas GIS have been used as a part of the four Themes, and at all scales of
study, prescribed by the Senior Geography syllabus, this did not occur in a
uniform manner across the participating schools. Rather, the unique ways in
which GIS have been used by participating schools suggest that the provision of
school choice in developing studies to “select appropriate topics and case studies,
to match the interests of their students, the availability of resources, and local
conditions” (Queensland 1999a, p. 13) has facilitated its inclusion to aid in the
attainment of syllabus objectives.
Geography and its skills
Misunderstood
Citizenship & Participation
Natu
re o
f G
eo
gra
ph
y
Ed
ucati
on
Problem Solving
Multidisciplinarity & Interconnectedness
Methods, Motivation & Fieldwork
Geography Described
Skills

223
That contemporary geography education has moved beyond an emphasis on
place-name knowledge and toward an emphasis on method was discussed in
some length in Chapter Two. Hence, attention will now turn toward an
exploration of the possible role of GIS in contributing to student development of
the thinking skills that are increasingly emphasised by geography. Specifically,
this section will evaluate the findings to discuss the role of GIS in student
development of what Gerber (2001) sees as five prerequisites to their success in
geography education.
With respect to the first prerequisite, geographical knowledge, four of the six
conceptions (1, 2, 5, 6) comprised at least some element of geographical
knowledge being experienced as part of using GIS. Specifically, the majority of
the KGIs referred to by students were the lower order ones to which this
geographical knowledge refers, such as Location, Distribution and Distance. In
this regard, using GIS was aligned with the experience of geographical
knowledge and, for most participants, its further development.
With respect to the second prerequisite, cognitive skills related to that
knowledge, two of the six conceptions (5 and 6) comprised at least some element
of the cognitive skills related to the above geographical knowledge being
experienced while using GIS. However, despite their presence, only a small
number of the higher order KGIs to which these cognitive skills refer emerged
within the findings, including Spatial Association, Spatial Change Through Time
and Spatial Interaction. In this regard, using GIS was not strongly aligned with
the experience of geographical thinking.
This aspect of students’ experiences of GIS supports Oldakowski’s (2001) view
that understanding the spatial perspective (of the phenomena under study) is
necessary to understand more complex concepts and to utilise geographical
technologies, such as GIS. The findings make it clear that students lacking an
understanding of the spatial dimension of the phenomena being studied with GIS
experienced the greatest obstacles to exploring the metaphoric island; it was
these students for whom Conception Three (Professional Tool) and Conception
Four (Frustrating) appeared to be most prominent. By contrast, students for

224
whom an understanding of that spatial dimension was evident were those more
likely to traverse more of the island and experience Conceptions Five (Relevant)
and Six (Better). This is an outcome that matches Oldakowski’s (2001) finding
of a correlation between creating and analysing maps, and understanding the
spatial perspective. Of course, the question remains of whether it was the
manner in which the students used GIS that influenced the spatial thinking that
afforded them with these experiences, or their higher level of spatial
understanding that influenced their use of GIS that afforded them with these
experiences.
With respect to the third prerequisite, fieldwork as the basis for learning, most
students experienced GIS, at least in part, as an element of field studies. Further
discussion of this role will occur later in this Chapter.
With respect to the final prerequisite, the use of maps, it is clear that students
experienced GIS as a type of map/s or as a tool for mapping. Specifically,
Conception One, GIS as maps and a source of maps in Geography, revealed that
students experience GIS as source of maps which were of higher educational
quality than those otherwise available within their studies of Senior Geography.
However, the other component of this conception, GIS as maps, is of some
concern in so far as it precludes from student experience the separation of GIS
from the maps that it generates. Such a separation indicates there exists some
evidence that the spatial dimension of the data being manipulated by the GIS is
divorced from the maps that are subsequently presented by it. Also related to
student development of this prerequisite is Conception Two, GIS as mapping in
Geography: a way to use and create maps. Students experiencing this
conception used the maps in GIS to engage in geographical thinking and the
development of geographical knowledge. However, the extent to which this
conception of the activities’ spatial dimensions was experienced was limited by
the conception of the maps as being in the GIS, rather than being a product of it
(Conception One). This was particularly limiting given that there exists also the
conception that making maps using GIS simply involves recreating something
that already exists.

225
On the basis of the above, and given that just experiencing a combination of
Gerber’s (2001) four prerequisites will lead to success in a geographical
education, then it is clear that the inclusion of GIS within Senior Geography
potentially has considerable merit. Specifically, GIS could lead Senior
Geography to develop in students the capacity to achieve what Fernald (2002)
claims to be the aim of geography: “the analysis of the areal distribution of a
phenomenon [that involves the examination of] the location and distribution of
phenomena in space, or place, by means of identifying their density, pattern,
diffusion, and dispersion” (p. 126).
However, arising from the conceptions that reveal some misunderstanding about
the manner in which GIS manage spatial data, there do exist serious limitations
to the extent to which these capacities may be developed in students. This aspect
of the findings confirms Gritzner’s (2002) claim that “the spatial method of
organisation and analysis is geography’s most essential element” (p. 39). Here,
students in the present study who failed to grasp what Oldakowski (2001, p. 249)
considers to be the “building blocks” of spatial awareness, the data, experience
difficulty in advancing beyond the simple definition of location, and into the
more demanding descriptive (e.g., distribution, area) and conceptual (e.g.,
interaction, association) aspects of spatial thinking.
Hence, GIS could well be implicated in students experiencing some success in a
geographical education. Having said this, however, whether using GIS as part of
a curriculum is more beneficial than those activities that would otherwise fill
lessons remains unanswered.

226
Geography and problem solving
Queensland’s Senior Geography requires that issues be investigated such that
their study leads to the “selection between valid alternatives and making
judgements supported by evidence” (Queensland 1999a, p. 46). To achieve this,
however, it stipulates that material ought first to be broken “into its component
parts so that students can identify trends, similarities, differences and patterns”
(p. 46). The materials to which the syllabus refers are data. And, it is those very
data that teachers of the participants in this research intended that their students
would engage with through and while using GIS.
Evident from Conceptions Five and Six is that students can and do make
decisions about the geographical issues that they have investigated while using
GIS. Also evident from the findings is that these students did so through the
manipulation of the spatial elements that they identified through their
experiences of Conceptions One and Two. This appears to be a critical
determinant in the success of students in using GIS for solving problems: where
students experience solving problems as reforming given problems (Silver, 1994,
emphasis added).
To do this requires students to transform rather than eliminate the spatial
elements that constitute a given problem. And, it is here that the creative aspect
of geography comes to bear: students are required to make new meaning of the
spatial elements by re-arranging them in space. For the students by whom GIS’
data handling and manipulation functions are clearly understood, this is
Misunderstood
Citizenship & Participation
Natu
re o
f G
eo
gra
ph
y
Ed
ucati
on
Skills
Multidisciplinarity & Interconnectedness
Methods, Motivation & Fieldwork
Geography Described
Problem Solving

227
achievable and offers further motivation to overcome any of the obstacles
presented through their experiences of Conceptions Three (Professional Tool)
and Four (Frustrating).
However, as with the use of maps an inability of students to identify these spatial
elements within the GIS-maps that they use precludes them from identifying the
potential for those elements to be transformed. Experiencing GIS as maps
(Conception 1), and experiencing GIS as the re-creation of something that
already exists (Conception 2) thus belies the most basic spatial element, the
datum, an understanding of which is necessary to develop the core of geography:
problem-solving skills.
Without this understanding, students could not successfully engage in the
geographical route of inquiry. This is particularly important for the present
investigation of students’ lived experiences of GIS within geography education.
If students fail to grasp data as the basic building block of the GIS, then they are
less likely to recognise that the data presented to them is other than static. Not
recognising that data may be transformed, and assuming that there is a correct
answer to a given investigation will present great obstacles to the students’
attempts to proceed through a geographical inquiry, whose very aim in Senior
Geography is to “investigate issues about which there is no consensus”
(Queensland, 1999a, p. 6).
Because of this experience, such students are likely to apportion some
responsibility for these difficulties to GIS itself. It is in this context where
Conception Three, GIS as a professional mapping tool: exceeding the needs of
Senior Geography, is particularly relevant to the current discussion. Of the four
structural elements of this conception, three relate to the software itself being
somehow inaccessible or incompatible with what students believe they should be
doing. The fourth structural element, GIS as a professional mapping tool
through doing the geography for students, is also relevant, but for a different
reason. For these students, this element relates to their experiencing GIS as
performing for them the tasks that they believed they would otherwise be doing
by hand. In this, some of their conceptions of GIS prevented students from

228
proceeding through a set task, because it was responsible for the maps that
formed the basis of that task. It is a simple syllogism: GIS presented students
with data; students had difficulty making sense of the data; students had
difficulty experiencing using GIS functions to manipulate the data; students had
difficulty experiencing success in the set tasks; students experienced GIS as an
obstacle to their learning. Quite simply, not grasping the basic level of GIS data
handling prevented students from understanding the fundamental cause of their
own difficulties while using GIS; while they were looking for GIS to provide the
solution, they overlooked the role of GIS in assisting them to devise a solution.
Likewise, the above scenario includes the experience of Conception Four, GIS as
frustrating Geography: irksome and presenting many challenges to the student-
user also. These experiences arose from not understanding the role of GIS in
supporting the transformation of data that was needed to engage in the spatial
thinking that may or may not lead to decision-making. Instead, the experience of
Conception Three becomes intrinsically linked with Conception Four, with the
latter being the affective response to the former. In this regard, students who are
able to recognise the data held within GIS as being transformable are less likely
to experience Conception Three in a negative way. Rather, their experience of
this conception emphasises the structural element, doing the geography for
students, but from the point of view that GIS can complete the tedious aspects of
geography, such as visually communicating the outcome of an inquiry, to a
higher standard. Similarly, there exists the conception of experiencing success
when proceeding through the route of inquiry while using GIS, and thus
experiencing direct and indirect benefits of its use (Conceptions 5 and 6).

229
Geography's role in the world: citizenship and participation
If “much of geography’s power lies in the insights it sheds on the nature and
meaning of … the landscapes that make up the world in which [students] live”
(Murphy, Morrison & Conolly, 2001, p. 42), then using GIS as a part of Senior
Geography clearly offers the potential to equip students to better understand and
interact in their worlds.
The contribution of GIS to developing in students the abilities to “participate as
active citizens in the shaping of the future” (Queensland, 1999a, p. 6) - one of the
seven aims of Senior Geography - comes from its use to investigate the spatial
dimension of observed phenomena. Given that this aspect of geography is
frequently cited as an argument for its position as the ideal place for a
comprehensive global education within a school’s curriculum (see, for example,
Murphy, Morrison & Conolly, 2001; Rawling, 2000), students whose
experiences of GIS emphasise Conceptions Five and Six over Conceptions Three
and Four may well be exercising these abilities.
Specifically, the combination of the relevance that students experience
(Conception 5) and the benefits of a geography education that students
experience (Conception 6) demonstrated the capacity of using GIS to inculcate in
students the development of citizenship and participation. The inclusion of GIS
in the study of local area issues, but as part of the regional and/or global study of
the processes influencing those issues, at once enabled students to experience
relevance of their immediate studies, and to experience relevance of their
Misunderstood
Natu
re o
f G
eo
gra
ph
y
Ed
ucati
on
Skills
Problem Solving
Multidisciplinarity & Interconnectedness
Methods, Motivation & Fieldwork
Geography Described
Citizenship & Participation

230
immediate studies to their lives beyond the classroom (Conception 5). This at
once enabled students to experience an improved geography curriculum, and to
experience an improved understanding of the world beyond the curriculum
(Conception 6).
Students who experienced those aspects of GIS have engaged in what Cox
(1997) described a decade ago as meaningful learning, the need for which he
argues cannot be exaggerated. Furthermore, by linking student investigation of
local issues with global processes, geography became expressed within their
private lives. Indeed, regardless of their success in these investigations, since all
students experienced Conception Five to some extent, they will all have “in a
humble way” developed their sense of personal identity (Spencer, 2005, p. 305).
And yet, for students to develop capabilities in the geographical thinking that is
fundamental for citizenship, they must first develop an understanding of the
KGIs that arise through the geographical route of inquiry (Fernald, 1996).
Failing to develop these understandings prior to or while using GIS is thus likely
to preclude a student from experiencing what many authors laud as the potential
of geography to promote life-long learning (Chiodo, 1997; Downs, 1994; Gerber,
2001; Miller, Keller & Yore, 2005). In this regard, students who do not
experience the spatial dimension of GIS may not develop geographical literacy
and thus, according to Howitt (2002), impose “a significant burden on the nation,
its communities, environments and neighbours” (p. 7).
Geography: a misunderstood subject
Natu
re o
f G
eo
gra
ph
y
Ed
ucati
on
Skills
Problem Solving
Multidisciplinarity & Interconnectedness
Methods, Motivation & Fieldwork
Geography Described
Citizenship & Participation
Misunderstood

231
Review of the literature revealed misunderstandings about the nature of
geography to be related largely to a presumption that the subject is about where
things are, rather than being about the processes that explain why or how those
things came to be there and the significance of those and subsequent processes
for their future. The findings indicate that students’ experiences of GIS can
either compound misunderstanding or compel understanding of what geography
is.
Students for whom spatial awareness was developed prior, with or during the use
of GIS appeared to be those most likely to negotiate the route of inquiry
successfully using it. There exists some evidence that GIS enable them to
explore local issues within a regional and/or global context, and in such a way
that they were at once developing skills in geographical thinking, generally, and
problem-solving, specifically. Because such investigations occurred within a
context of human-environment interactions, they were likely to be progressing
toward devising solutions and making decisions that reflected not only the spatial
dimension of the issue under study, but the multidisciplinary context in which
those spatial phenomena existed.
Of course, where such awareness existed neither prior to nor during the use of
GIS, attempting to negotiate the route of inquiry while using GIS was a likely
contributor to the conception of GIS as frustrating (Conception Four) and the
conception of GIS as a professional tool unsuited to a school audience
(Conception Three). This was related to the conception that the aim of set GIS-
related tasks, vis à vis the making of decisions to resolve issues, was
overshadowed by the conception that completing such tasks required them to
somehow replicate the ‘answer’ that they believed their teacher required of
them. Because of this, such students were likely to perpetuate the concern
expressed by Murphy, et al., (2001) that geographical problems were not being
solved through consideration of their spatial dimension. Instead, students were
likely to offer inappropriate solutions which, were they to be employed, may
serve to exacerbate rather than ameliorate the issue being investigated.

232
Hence, with respect to GIS’ role in addressing the misunderstanding of
geography, it is evident through the findings that students for whom the spatial
dimension of GIS was clear developed a more clear understanding of geography
and that this offered them a view of geography’s broader applications
(Conception 6), within which they could undertake subsequent geographical
activities. The corollary to this, of course, is that students for whom the spatial
dimension of GIS was not clear spent their time on the island making little
progress as they attempted to cut a swath through dense vegetation on steep
slopes.
Teaching Geography: Methods, Motivation and Fieldwork
Methods
The rise of ICT’s prevalence within society, generally, and education
specifically, has presented some challenges to geography curricula. The use of
contemporary GIS software as part of those curricula represents a response by
some teachers to this rise. However, while ICT (including GIS) have increased
both what we know and the rate at which we acquire more knowledge about the
earth (Gritzner, 2003), the findings do not clearly indicate that using GIS as part
of Senior Geography will enable students to experience these efficiencies.
It is apparent that there are many proponents for the widespread use of ICT as a
vehicle by which individual subjects may better achieve their goals. However,
Misunderstood
Natu
re o
f G
eo
gra
ph
y
Ed
ucati
on
Skills
Problem Solving
Multidisciplinarity & Interconnectedness
Methods, Motivation & Fieldwork
Geography Described
Citizenship & Participation

233
there remains uncertainty about what leads students to bridge the gap in the
spatial understanding that is represented by Conception Three (Professional
Tool) and Conception Four (Frustration). Specifically, the findings do not
indicate whether a certain degree of prior spatial awareness is required to
successfully use GIS, thus bridging that gap and experiencing the relevance of
GIS (Conception 5), or whether the requisite spatial awareness can be adequately
developed while using GIS.
Indeed, if a certain level of spatial skill is required in order to employ GIS to
accomplish class tasks successfully, then those students for whom this is lacking
are likely to experience difficulties using the software for its intended purpose,
and experience frustration associated with this. Furthermore, if this is the case,
then it adds credence to the conclusion of Miller, Keller and Yore (2005) that it is
a “luxury … to worry about strengthening digital geographic information literacy
when the curriculum already struggles to find sufficient emphasis for basic
geographical literacy and for fundamental concepts and abilities of geographic
information handling” (p. 256).
Notwithstanding the above, the findings also clearly reveal the existence of some
evidence of value in using GIS. It is apparent from the outcome space that there
further exists the experience of the benefits of GIS as exceeding the difficulties
and associated frustrations that all students, to a greater or lesser extent,
experienced. Indeed, given this apparent dichotomy between student
experiences, it is perhaps pertinent to consider the extent to which GIS constitute
an equitable element of the Senior Geography curriculum.
Motivation
For most participants, using GIS was associated with increased motivation.
Although this was due largely to effects of GIS on the curriculum with which
students were meant to be engaged, it also represented other benefits that arose
from the contexts in which it was used.

234
The link between class and life afforded by using GIS emerged repeatedly from
the findings. For most students, using GIS was somehow associated with
inquiring into and addressing local problems, which Klein (1995) sees as
essential for students to develop empowerment. By studying areas with which
students were personally associated, using GIS became a vehicle with which
students could engage their geographical skills “associated with logical and
critical thinking” in a context of immediate relevance (Cox, 1997, p. 50). That
students saw the tasks that they were required to undertake with GIS as “both
relevant and current” suggests their awareness of “the practical relevance of the
subject to everyday living and problem solving” (Ballantyne, 1996, p. 180).
With respect to the findings, another of Ballantyne’s (1996) suggestions holds
true, where students experienced using GIS as an attractive alternative to the in-
class activities otherwise required of them. This especially included the
proposition of a decrease in the amount of writing undertaken in class when
using GIS (p. 180), and the improved physical environments associated with
using GIS in an air-conditioned room or as a part of fieldwork beyond the school
gate.
Fieldwork
Additionally motivating to students is their conception of the integrating function
of GIS. This was especially evident during fieldwork, when students used GIS to
make links between phenomena previously studied in class, and phenomena
being observed in situ. It appears that the combination of group work, first hand
experience of the transferability of concepts introduced in class, and the active
nature of fieldwork appealed to students. While these three aspects of fieldwork
can exist without GIS, because participants in the present study experienced GIS
as an integral part of the fieldwork, they also experienced these three aspects as
requiring not just the observation and collection of data, but using GIS to handle
those data.
Whereas Atkin (2003) claims that fieldwork is an effective way to arrest student
apathy in geography, the lived experiences of students using GIS as a part of

235
fieldwork reveals that while its inclusion appears to have a motivating influence,
this is not universally experienced. Although there exists some evidence that
fieldwork stimulates students’ curiosity, there also exists some evidence that the
maps involved in GIS-based fieldwork pose difficulties for students. Given the
general agreement that constructing and using maps is one of the most important
features of worthwhile fieldwork, the difficulties and frustrations experienced by
students trying to use GIS to do this made more difficult the task of mapping a
local landscape while functioning in that landscape. Because of this, there exists
some evidence that using GIS as a part of fieldwork eroded at least some of the
widely asserted benefits of doing fieldwork.
GIS and Student Learning
The route of geographical inquiry and student motivation
With respect to student learning, the findings offer some contribution to what has
largely been speculation about the role of GIS. Since GIS have been
incorporated as a part of Senior Geography, it is not surprising that many of these
contributions echo those already discussed in this Chapter with respect to
geography education in general. Despite the risk of some duplication, it is
appropriate given the nature of this study’s three foci (geography education, GIS,
questions remaining) now to consider the specific implications of the findings for
the role of GIS in student learning within the geography curriculum.
Computers
Role in Education
Vocational Opportunity
Curriculum
Teacher Confidence
Access
Ge
og
rap
hic
In
form
ati
on
S
yste
ms
What it is and isn’t
Student Learning
Time & Data
Issues Affecting Use
Student Motivation
Route of Geographical Inquiry

236
Following my initial experiences of teaching with GIS as part of Senior
Geography, in 1998 I published an article entitled GIS in the secondary school:
some possible outcomes (West, 1998a). Although almost a decade old, the
validity of many of its claims still remains untested and ill-clarified. In such a
climate of uncertainty, educators – including myself - are thus making decisions
about whether and how they will use GIS in what is a virtual vacuum of data
about its potential and actual influence on student learning.
A fundamental reason for the use of GIS in Senior Geography is its capacity to
unite large volumes of non-sequentially related data (Fitzpatrick, 2001; West,
1998a). Because of this capacity, GIS readily constitutes an integrative tool that
can bridge traditionally discrete subject areas (Baker, 2005), and thus present the
opportunity to examine the spatial dimension of a range of multidisciplinary
issues. Indeed, as alluded to earlier, it is this aspect of GIS that essentially
constitutes its greatest potential to augment students’ studies of geography.
However, if we accept the assertion by Gregg et al. (1997) that the way
information is taught influences how that information becomes available for
subsequent thinking, then it is important to consider the way that GIS and its
spatial elements are taught to students. The findings suggest that despite student
experience of GIS involving a substantial emphasis on spatial elements,
especially location, for many students this did not appear to translate into an
understanding of the spatial bases of those data. Rather, the Conception One
experience that GIS was the maps that they saw, and/or was simply a source of
maps, suggests that these students had not adequately configured the data
represented in those maps in such a way that would support their subsequent
analyses, evaluation and syntheses.
By way of corollary, however, this could also lead to the proposition that if the
effective use of GIS requires students to engage in efficient data configuration
and higher level spatial thinking, then using GIS may also be implicated in the
further development of those (more efficient) processes. In this way, for students
who possess an understanding of the spatial element of mapped data, using GIS

237
may offer an opportunity to enhance their capacity to reason both in and with
geography.
Indeed, the belief that GIS was personally relevant (Conception 5) and that it
enhanced their studies in and beyond Senior Geography (Conception 6) has
implications for the present discussion. This is because the spatial insight needed
to reason with geography requires what Macaulay (1994) described over a
decade ago as “the frequent use of higher-level thinking skills” (p. 23). Since
higher level thinking requires configuration of information such that each datum
is ascribed some meaning by its user, it becomes imperative that tasks using GIS
are presented so that their constituent data can be coded in several ways, and so
that they meet recommendations for learning preferred by Biggs and Moore
(1993).
In geography, this coding commonly involves data being prioritised and placed
into recognisable groupings, such as with a legend on a map. Hence, to be able
to code data in several ways means that a student must first recognise that they
can be grouped in several ways. While the findings did not explicitly reveal the
extent to which students did do this, Conception Two (Mapping) and student
references to KGIs, such as distribution and patterns, do indicate that it was a
component of their GIS experience. Hence, arising from this emerges the
possibility that students’ experiences of the personal relevance of GIS
(Conception 5) and the improved nature of geography (Conception 6) may be
somehow associated with their using GIS as a tool with which they could
“process the vast quantities of information available, and to be able to build
personal geographies in place and space” (Robertson, 2003, p. 21).
However, two aspects of the findings imply that, for many students, this did not
occur. First, the majority of student references to spatial thinking were to lower
order KGIs. Second, many students experienced a critical misunderstanding
about GIS as a tool to process, rather than to simply present, spatially referenced
information. For these students, understanding the what? and where? of data was
sufficiently problematic. Further use of GIS thus presented both difficulty and
frustration. Quite simply, these students were unable to build personal

238
geographies because they did not sufficiently understand the building blocks with
which to build them.
Interestingly, also emerging from the findings is the idea that when it comes to
learning about these building blocks, it may perhaps be better to complete tasks
without GIS. By extension, students who experienced what may be considered
success when using GIS were those most likely to believe that they think more
about data when constructing maps and manipulating mapped data by hand, but
that they think more with those data when using GIS.
What this indicates is that not all students are capable of engaging with GIS tasks
at the same level. In this regard, the potential for task differentiation has also
been identified as a reason for using GIS in secondary education. While it is
possible that those students who experienced difficulty with GIS may also have
experienced difficulty in other aspects of their geography education, it does
indicate some merit in clarifying for students of different ability whether what
they are meant to be doing with GIS is intended for them learn about it, or learn
with it.
In this respect, the teaching that occurs with GIS is important. Very clear from
the findings is that students experience success with GIS only through some
reference to their teachers’ pre-determined notions of correct or otherwise.
Perhaps interestingly, this was the experience for all students, regardless of their
other experiences of GIS. It was just that students who possessed an
understanding of the data themselves were more able and/or more likely to
undertake the correct steps with GIS to reach this result; their use of GIS was
thus influenced by their awareness of the data and the need to progress through a
logical sequence of ordering and organising these data. For other, less
successful, students, their attempts to undertake the correct steps to reach this
result was influenced by their awareness that a particular sequence of steps
should lead to the correct result, regardless of the data involved.
This is not isolated to students. Indeed, Fitzpatrick (2001) recalled similar
experiences among teachers whom he trained in the use of GIS; those who are

239
motivated by the delivery of knowledge are, when using GIS, most likely to
emphasise the avoidance of data and IT-issues, rather than emphasising the
pursuit of inquiry and data analyses. Perhaps this goes some way to explaining a
common experience for students in this study: the desire to explore with GIS in a
more independent manner. Indeed, to do so was seen by many as a way to
increase their skills in its use, regardless of the difficulties and frustrations that
they had already experienced, including those difficulties and frustrations related
to data and IT-issues. For these participants, being free to explore its
applications in a less prescriptive context was viewed as improving their ability
to use GIS for its intended Senior Geography applications.
That students experienced such a desire indicates exposure of students to a
dichotomy of how GIS was used. Teachers were invariably prescriptive in their
use of GIS. Time was usually limited. Tasks were mostly linked to assessment.
This created a context in which students needed to rather rapidly master the basic
software procedures to allow rudimentary manipulation of spatial data while
concurrently engaging with tasks that were designed to assess their analytical
capabilities. Given this, it is perhaps unsurprising that from the findings emerges
a broad experience of GIS as frustrating and beyond school needs.
Perhaps by being permitted to explore patterns of data with GIS more freely,
students would be at liberty to make what Alexander (2006) describes as
meaningful choices within tasks. Following the ideas of ESRI (1995),
Fitzpatrick (2001) and Kerski (2001), employing the role of facilitator rather than
deliverer of knowledge may not only improve teaching about and with GIS, it
may also promote greater student motivation. To achieve this, however, requires
teachers using GIS to relinquish some of the control that they traditionally hold
over their classrooms (Richhardt, 2006).
Of course, it is also important to bear in mind that improved student
empowerment arising from the shift in locus of control from teacher to student
will, no doubt, elicit varied consequences. Just by following Fitzpatrick’s (2001,
p. 87) recommendation to establish for students “a visible goal, and then stand
back” will not necessarily lead to less difficulty and frustration while using GIS.

240
Rather, it is likely to enable - and, arguably, demand - a greater degree of
differentiation. Students who require more learning about GIS would be able to
consolidate their mastery of the basic software procedures, and students who
possess adequate spatial awareness would be able to explore this more freely
while learning with GIS. To do so might go some way to reduce the
pervasiveness of Conceptions Three and Four. In any case, what this discussion
has revealed is the need for greater balance between teaching about and teaching
with GIS.
Such an approach resonates well with the findings of West’s (2003b) attitudinal
survey of students who had used GIS, where the improved motivation following
use of GIS was deemed due to a combination of students developing higher level
thinking skills while exploring issues of personal significance, and within a
context of an appropriate level of cognitive demand (emphasis added).
Clearly then, there is a link between the development of higher-level thinking
skills and the finding that students experienced GIS as offering a better
geography (Conception 6). Also clear is the link between exploring issues of
personal significance and the Finding that students experienced GIS as offering
improved relevance within and beyond Senior Geography (Conception 5). What
also appears clear, by implication, is that there exists some evidence that the
provision of an appropriate level of cognitive demand enables the obstacles
presented in Conceptions Three and Four to be transcended to enable experiences
of Conceptions Five and Six. Ipso facto and also by implication, there exists
some evidence that GIS is experienced at such an inappropriate level of cognitive
demand that the obstacles presented in Conceptions Three and Four are
insurmountable. This reveals the existence of conceptions of GIS that are
experienced without the students first establishing a sound understanding of GIS’
basic building blocks: data. Whether this was because their pre-existing spatial
understandings were somehow lacking for the GIS tasks, or whether it was
because the tasks themselves were somehow lacking remains unknown.

241
Vocational opportunity
With respect to vocational opportunities within the spatial sciences, in an email
communication on 10 May 2007, Associate Professor Bert Veenendaal, Head of
Department of Spatial Sciences at Curtin University of Technology indicated his
view that the current strong demand for skilled people is expected to continue.
However, simply being skilled in the use of GIS is not sufficient (Gewin, 2004).
Rather, it is important that potential employees possess “a deep understanding of
underlying geographical concepts” (p. 377).
At first glance, it would appear that the inclusion of GIS in Senior Geography
would provide some small steps toward the development of both GIS skills and
conceptual understandings. After all, in Senior Geography, the use of GIS is
invariably undertaken as an integral component of a larger conceptual
exploration of spatial processes.
Indeed, the findings indicate students do experience this link between their
studies with GIS and their other studies of regional and/or global processes
(Conception 5), with many students also experiencing what they see as a deeper
understanding and insight into both local areas and global processes (Conception
6).
Computers
Route of Geographical Inquiry
Student Motivation
Role in Education
Vocational Opportunity
Curriculum
Teacher Confidence
Access
Geo
gra
ph
ic In
form
ati
on
S
yste
ms
What it is and isn’t
Student Learning
Time & Data
Issues Affecting Use

242
However, despite students being explicitly aware of a range of vocational
opportunities associated with GIS, there are some implications of the findings
that may indicate the use of GIS in Senior Geography may serve to stymie the
progression of students from school into the spatial science industry. If we can
assume that students’ post-school engagement with GIS will depend, at least in
part, on their experiences of it while at school, then it is important to consider
those experiences.
For example, for the many students who did not overwhelmingly experience GIS
as relevant and beneficial, for whom the configuration of data was rather alien,
using GIS effectively was a largely overwhelming possibility. Indeed, it was
mostly these students who experienced GIS as being a professional tool that
exceeded school need. For these students, GIS was too hard, with far too many
ways of doing far more than they needed it to do in order to replicate what the
teacher required them to. When we consider this, it is not surprising that an
associated structural element of Conception Three was that GIS was a poor use
of time. Indeed, it is likely that these experiences were the catalyst for two
student suggestions. First, if GIS were to be used at school, then a simpler
version would be preferred. Second, being introduced to it prior to entering
Senior Geography would more likely enable students to gain the mastery needed
to support learning with GIS. For students, both of these options were
considered to be essential if teachers wanted students to succeed while using
GIS.
Hence, not only does a failure to master an understanding of the basic elements
of GIS’ data handling functions limit students’ use of GIS, it may also hinder
their future engagement with it. Indeed, it is also possible that the time spent
using it in class may be used better for the development in students of greater
understandings of spatial concepts, so that subsequent exposure to GIS will be
more likely to involve students experiencing conceptions such as those revealed
in Conceptions 5 and 6.
Of course, it is not just what happens within the classroom that influences how
GIS is used and students’ experiences of it. It is to the implications of the

243
findings for understanding the issues affecting the use of GIS that our attention
now turns.
Issues Affecting the Use of GIS
Curriculum issues
The capacity for GIS to provide opportunities otherwise unavailable within the
geography classroom was clearly obvious to students, who lauded this potential.
However, the extent to which this could occur was limited by other curriculum
issues. The tension between GIS' potential applications to Senior Geography and
the syllabus requirements of Senior Geography was experienced indirectly by
students. This occurred through their realisation that what they were doing with
GIS was not being done by all students who study Senior Geography, leading
them to question its necessity, and through their realisation that what they were
doing could only be assessed to a limited extent. With regards this latter idea,
students experienced some discord between the belief that using GIS would
improve their assessment items through improved presentation, and the belief
that using GIS made it more difficult to discern the actual geography that the
students themselves had undertaken from the geography that the software had
done for them. Students were further aware that GIS are not used as much as
they could be, and explained this with reference to their belief that Senior
Geography encompassed many elements, of which GIS were only one.
Computers
Route of Geographical Inquiry
Student Motivation
Role in Education
Vocational Opportunity
Teacher Confidence
Access
Geo
gra
ph
ic In
form
ati
on
S
yste
ms
What it is and isn’t
Student Learning
Time & Data
Curriculum
Issues Affecting Use

244
Teacher Confidence issues
Teacher confidence with using GIS in an educational setting was an issue that
was clearly evident to students, who made frequent references to the manner in
which they were taught both about and with GIS. While students recognised the
apparent enthusiasm of their teachers for GIS to be used in their lessons, students
found the methods of instruction to be somewhat problematic. In this regard,
students' experiences aligned with what Chalmer (2006) described as the social
acceptance of ICTs not being matched with the education that promoted its use.
The way that GIS were used within lessons suggested to students that teachers
were, perhaps, less experienced in using GIS as an educational tool than in other
aspects of their teaching. In turn, this influenced both the teaching methods and
the student experiences of its effectiveness as a tool about which they were to
learn, and with which they were to learn. Much of their frustration with GIS
revolved around how students were being taught. Despite the finding of Rake et
al. (2006) that constructivist teaching methods were closely aligned to teacher
ICT use, participants in the present study more commonly experienced
transmission teaching methods, with instructions delivered in highly prescriptive
verbal and/or printed forms. This level of teacher-centredness within the GIS
classroom was compounded by student perception that teachers, despite their
laudable enthusiasm for the technology's use, lacked the broad experience in its
use that may enable more dynamic approaches to its use by and with students.
Computers
Route of Geographical Inquiry
Student Motivation
Role in Education
Vocational Opportunity
Curriculum
Access
Ge
og
rap
hic
In
form
ati
on
S
yste
ms
What it is and isn’t
Student Learning
Time & Data
Issues Affecting Use
Teacher Confidence

245
Related to this is that, although the multiplicity of data manipulating applications
created strong opportunities for collaboration among students, this was usually
unintended by the teacher. Indeed, and somewhat paradoxically, collaboration
was usually limited to students compensating for what they saw as inadequate
instruction; assisting one another to proceed through the teacher’s prescribed
steps.
Time, data, computer and access issues
As with teacher confidence, the constraints of time were also experienced by
students through the manner in which GIS lessons were conducted, emphasising
pre-scripted steps to achieve a common goal. Also, students experienced
concern that what they were doing with GIS and what the Senior Geography
syllabus required them to be doing may not have been aligned. This adds some
credibility to the claims of Jenner (2006), McInerney and Shepherd (2006) and
Meaney (2006) that it is not just teacher skill in using GIS that takes time to
develop, but also it is the development of lessons using GIS that suit the
curriculum that takes time.
These issues of time were also experienced by students, and in a number of
forms. First, the time they did have was usually insufficient to enable them to
confidently move through the prescribed activities. Second, the findings concur
with Pun-Cheng and Kwan’s (2001) conclusion that the lesson time needed to
Route of Geographical Inquiry
Student Motivation
Role in Education
Vocational Opportunity
Curriculum
Teacher Confidence
Access
Ge
og
rap
hic
In
form
ati
on
S
yste
ms
What it is and isn’t
Student Learning
Time & Data
Issues Affecting Use
Computers

246
discuss, analyse and interpret data so that “the effective learning impact of GIS
[could] be felt” (p. 91) was not built into the learning experiences, no doubt
further compounding misunderstandings of GIS as a data processing tool. Third,
students' experiences of GIS were influenced by the competition within schools
for access to the necessary ICT resources.
Perhaps ironically, in many schools GIS' use was linked to assessment to
increase likelihood of gaining access to the computer resources. This was
obviously problematic for students who, because of GIS' role in assessment, were
immediately aware of its importance. But, for these students, the need to
complete the prescribed tasks in limited time had a major impact on their overall
experiences of GIS, and for a single reason: it precluded them from gaining the
wider understanding and skills associated with GIS in order to fully appreciate its
potential significance within, and beyond, their geographical education.
While related to computer issues, the differential speeds of computers and
networks was experienced as creating issues that affected the quality of GIS
learning. Interestingly, this arose through both the high speed with which some
schools' systems allowed GIS to process data faster than students could manage
it, and the slow pace of some schools' systems, which created the opposite issue.
Emerging from student conceptions was that the nature of a school’s computer
arrangements influenced their experiences of GIS. This was specifically evident
through Conception Three and Conception Four. Conception Three included
references to issues related to processor speed, or lack thereof, and issues
associated with using school networks to access and manage files, thus leading to
the structural elements indicating GIS to be a poor use of time and beyond school
capabilities. An extension of this conception was, for many students,
Conception Four, Frustration.

247
Strengths of the Research
In addition to the contributions to education outlined previously, the study has
also demonstrated the appropriateness of phenomenographic research approaches
to investigate educational phenomena. Participation of students in the research
involved them in actively contributing to decisions that will ultimately affect
them and their peers. Anecdotally, numerous participants expressed some
gratitude for the opportunity to consider their own experiences and to express
their views about them, aligning this research with the widely held view that
doing so is beneficial for researcher and student alike (Levin, 1991; Nagel, 2002;
Ruddick, Day & Wallace, 1997).
The collection of very rich data through synergetic focus group interviews
ensures validity of the data collection process since the depth and breadth of the
discussion was led by students and not the researcher. Similarly, the emergence
of six distinct Categories of Description, with their constituent referential and
structural elements, and their cogent Outcome Space reflected the suitability of
the data analysis process outlined in Chapter Three.
Finally, following Cope’s (2002) recommendation, the findings have been
presented such that they allow informed scrutiny. Provision for this includes the
broad range of student references drawn from all interviews that were included
within Chapters Four and Five.
Beyond the stated objectives of this study, undertaking this research has also
afforded the researcher many benefits, including, but not limited to enhanced and
expanded understanding of: educational theory and practice; research methods
and their role within education; the place of teacher as researcher; and, perhaps
more significantly, himself.

248
Limitations of the Research
Despite Chapter Three presenting a full account of the data collection and
analysis procedures, further confidence in the study and its findings requires a
reflection on six possible limitations.
1. Representativeness of the research sample
The use of a purposive sample presents some inherent limitations to the
transferability of the findings. However, these issues were largely
mitigated through the provision of rich descriptive data about the context in
which the students had experienced GIS and the context in which the data
were collected, in Chapter Three, and the manner in which the findings
were presented (Chapter Four) and discussed (Chapter Five) to allow
informed scrutiny.
2. Representativeness of participants
Despite all students from the target classes being invited to participate, not
all did so. The reasons related to absence and, for one class, personal
choice to work on assessment related tasks instead.
Participants were drawn from four schools. While additional schools were
invited to participate, not all chose to do so, and some were unable to
participate due to scheduling issues and some were unable to participate
due to internal matters.
While it is possible that these absent and non-participating students may
have made some contributions to group discussion, the size of the sample
and the rich data that were collected from them are expected to mitigate any
effects arising from their absence.
3. Representativeness of student conceptions through time
The conceptions captured through the findings represent the collective
experiences of a particular group of students in time. It is not reasonable to
assume that these will remain static. It was beyond the scope of this study,

249
however, to entertain such an aim, which has been referred for future
research.
4. Size of the sample
The sample size does not include all Senior Geography students in
Queensland who have experienced GIS as part of their studies. However,
within the scope of the present investigation, it is deemed sufficient since
its goal was not to identify universal laws, but to understand the nature of
these individuals’ experiences. Furthermore, this study included 109
participants from 11 interviews, in comparison to the 15 to 30 participants
that Franz (1994) and Trigwell (2000) suggest as ideal.
5. Circumstances surrounding data collection
Data collection times were largely influenced by the schools themselves,
with some interviews scheduled immediately following use of GIS, and
with others scheduled on the final day of Grade 12. It is expected that these
variations and the responses from individual participants may lead to the
recount of varied experiences based on such circumstances. The manner in
which GIS were used and the experience of individuals with its use varied
across the sample size, which also influences the findings.
6. Researcher subjectivity
My interest in this research topic stems from a decade of experience using
GIS within Senior Geography classrooms. I have been a staunch advocate
for its continued use and have stated my views publicly in a range of fora.
In these circumstances, my own personal bias and subjectivity need to be
both recognised and addressed. On the basis of my own personal and
professional experience with this topic, I followed Sandberg’s (1995, p.
156) recommendation and maintained “interpretive awareness” through all
phases of data collection and analysis, as clearly outlined in Chapter Three.
Additionally, the thesis includes what Glesne (1999, p. 152) describes as
“rich description” of those factors that may somehow limit the findings,
thus enabling the study’s conclusions to be established through the explicit

250
documentation of all steps and procedures that were undertaken (Francis,
1993).
While the design was based upon an acceptance that conceptions are the
construction of experiences by individuals within specific contexts, the
discursive analysis inherent in the design employed did provide an outcome
space which possesses some degree of generalisability to similar situations
(Glesne, 1999; Marton, 1981a).
Directions for Future Research
Emerging from this study are opportunities to gather additional information to
further improve the collective understanding of GIS’ position with education.
1. The research investigated a purposive sample of Queensland Senior
Geography students. Further understanding of student experiences of
GIS would be offered by broadening this sample to include students:
i. from other schools;
ii. from other grades and statutory authorities, including
internationally;
iii. who have withdrawn from Senior Geography after using
GIS;
iv. who have elected to, or otherwise experienced, GIS in a
post-school context; and
v. who experienced GIS as part of their pre-Senior studies
but did not elect to study Senior Geography.
2. The research comprised a phenomenographic approach to capture
student conceptions of GIS. Further understanding would likely
emerge from using other qualitative and quantitative instruments to
augment the data collected herein. Examples include pre- and post-
attitudinal surveys, participant observation, and inclusion of data
related to individual student performance.

251
3. Commencement of a longitudinal study to investigate the
development of spatial thinking skills in contexts that include and
omit GIS would likely contribute to a better understanding of whether
and to what extent using GIS aids in the development of, or relies
upon, spatial thinking skills in its users.
4. Further research into the conceptions of GIS held by other groups
would enable worthwhile comparisons to be made with students’
conceptions, notably those of educators and educational
administrators, as well as the industry professionals that encourage its
use in schools.
Conclusion
Chapter One introduced the assertion of Blachford (1971) that “it is in the fullest
development of the mind that geography seems to have a place in the
curriculum” (p. 216). Chapter Two then argued that the inclusion of any subject
within a school’s curriculum should be justified through the elucidation of not
only the body of knowledge with which it is concerned, but its potential for
developing in students broader capabilities for participation in the world. From
this, it becomes incumbent upon educators to identify best the manner by which
this knowledge can be learned and these capabilities developed; to fully develop
young minds requires due consideration of the methods employed to inculcate
the myriad benefits of a geography education.
Chapter Two then introduced three foci for this investigation: Geography
Education; Geographic Information Systems; and Questions Remaining.
Emerging from the literature review was that geography and a geographical
education are valuable, and for three specific reasons: they are concerned with a
multidisciplinary body of knowledge of global significance; they emphasise a
range of technical and problem-solving skills; and, they allow for its students to
develop capabilities to actively participate in the world about which they are
learning. Given that geography is a worthwhile inclusion within school
curricula, attention needs to be paid to how it is taught and the tools that are used

252
to do so. With this justification in mind, Chapter Two moved to consider those
teaching practices that may support both teachers delivering and students
pursuing such an education. Within this, particular attention was afforded to the
potential role of GIS as a means of attaining those educational goals, about which
little is known for sure.
A clear directive thus emerged. Namely, it is appropriate to identify research
that may constitute a ‘starting point’ and lead to a clearer understanding not just
of GIS’ role within geography education, but also of appropriate directions for
future investigations surrounding its inclusion. From this, a central phenomenon
and research question for the present investigation emerged through considering
published opinion about specific interactions between GIS and geography
education:
What are the conceptions of geographic information systems (GIS) held by
Senior Geography students?
To explore this research question further, Chapter Three evaluated the
epistemological and methodological bases of research and identified the
phenomenographic approach as an appropriate research method. Participant and
school characteristics were also delineated in Chapter Three.
Six qualitatively different ways in which participating students conceive of GIS
were described in Chapter Four, as was an Outcome Space which offered a
diagrammatic representation of how these six conceptions are interrelated.
Awareness of these conceptions and their cogent outcome space gives rise to a
clearer understanding of GIS’ role within geography education.
These findings clearly contribute to the understanding of how GIS may be used
to enable geography’s goals to be realised. However, they cannot be assumed to
constitute given educational outcomes for all students. For many students, their
capacity to experience the above benefits was curtailed by only a limited
understanding of spatially referenced data as the building blocks of GIS’
functioning. Thus, the range of experiences of GIS also encompassed those

253
which may exert a deleterious effect on student progress toward the stated
educational goals. In this regard, some students’ particular combinations of
experiences of GIS precluded them from attaining some or all of the benefits
embedded within the above eight items.
When the findings are placed within the context of the literature, they make
clearer the potential role of GIS in geography education. Particularly evident is
that the experiences of students vary rather substantially in terms of both
academic and affective responses to using GIS. Whereas some students
experience GIS as both personally meaningful and as improving Senior
Geography curricula, others experience them as insurmountably difficult and
impeding their attainment of the syllabus’ goals. The key difference appears to
be the extent of individual students’ understandings of the building blocks of
spatial awareness, the data. However, it remains as yet unknown whether
successfully using GIS requires such an understanding, or whether successfully
using GIS develops such an understanding.
The Queensland Senior Geography syllabus aims to prepare students to “explore,
understand and evaluate the social and environmental dimensions of the world”
(Queensland, 1999a, p. 2). For the geographer, the concept of place offers both
meaning and the potential for understanding. Given the increasingly central role
of geographic information systems beyond the classroom for the use and
manipulation of such spatially-referenced information data, it is not surprising
then that these same technologies are widely presumed to offer an avenue for
students to attain educational goals such as the above. Evidently, this study has
made some contributions to the questions that emerged from Chapter Two and,
by revealing the qualitatively different ways in which students experience GIS, it
has achieved its goal.
However, decisions regarding the extent to which such technologies are to be
used should at all times emphasise the probable rather than merely the possible
educational outcomes for students, and be based in evidence of their capacity to
effectively promote student learning. This thesis has gone some way to
distinguish between the probable and the possible. While GIS can aid in the

254
development of spatial awareness and can support geography education, it is not
always implicated in the fullest development of the mind.
It is without a doubt that spatial thinking and spatial technologies – such as GIS –
can benefit society. It is without a doubt that geography education can harness
the capabilities of GIS to develop in students the skills of spatial thinking.
Finally, it is without a doubt that there emerges from this study one particular
imperative: educators, geographical or otherwise, must ensure that while using
GIS students grasp the basic level of organising spatially referenced information,
so that they too possess the spatial awareness requisite to harnessing the benefits
of their geographical education; for themselves, and for the societies of which
they are part.
This study confirms the value both of a geography education and of GIS. More
significantly, it reveals that the value of the one exists not in isolation from the
other; just as GIS gives meaning to place, so too does geography give meaning to
GIS. And yet despite this apparent union, GIS and geography education remain
at an historic crossroads: a place from which their futures may either converge or
from which they may diverge. Divorcing the one from the other will destine the
benefits of neither from being experienced. By contrast, reaping the benefits of
GIS will demand that the intellect of geography be harnessed and reaping the
benefits of geography will demand that the technology of GIS be harnessed.
Indeed, it will only be by converging the technological capacity of GIS with the
intellectual abilities promoted by geography that students will be able to access,
process and make sense of the spatial information that they will be managing and
manipulating using GIS. It remains imperative, therefore, that educators harness
the convergent nature of geography education and GIS, enabling not merely the
full development of the mind, but the full development of the citizenry’s capacity
to exploit and further the processes of democracy.

255
Appendix A: QUT Ethical Clearance
Date: Fri, 24 Feb 2006 12:04:35 +1000
From: "Research Ethics" <[email protected]>
Subject: Ethics Application Approval: 4256H
To: "Mr Bryan Andrew West" <[email protected]>
Cc: "Mr David Wiseman" <[email protected]>
Dear Mr Bryan West ,
Re: Concepts of geographic information systems held by senior
geography
students in Queensland
This email is to advise that your application 4256H has been
considered
and approved. Consequently, you are authorised to immediately
commence
your project, with the following proviso:
- Approvals from Education Queensland and School Principals,
should be
provided to this office as they become available.
The decision is subject to ratification at the next available
committee
meeting. You will only be contacted again in relation to this
matter if the
Committee raises any additional questions or concerns in regard
to the
clearance.
Please do not hesitate to contact me further if you have any
queries
regarding this matter.
Regards
David Wiseman
Research Ethics Officer

256
Appendix B: EQ Approval to Conduct Research

257
Appendix C: Letter to Education Queensland Principals
Bryan West
Address 1 Address 2 DATE Title Address 1 Address 2 Dear <INSERT PRINCIPAL’S NAME> I am presently conducting doctoral studies through Queensland University of Technology. The title of this research is Conceptions of Geographic Information Systems (GIS) held by Senior Geography students in Queensland. The purpose of this investigation is to identify what students think about GIS, and through this to better inform decisions about the role of GIS within schools. Your school is one of several that has been identified as providing an appropriate context in which data may be collected. I am writing, therefore, to request permission to conduct a study involving students enrolled in Senior Geography at your school. The study will involve two aspects: 1. Site visit, which would involve me familiarising myself with the educational context in
which GIS is used at your school. 2. Interviews, which will be involve groups of approximately 6-8 students. Each
interview will be audio taped and preceded by an introductory monologue to ensure common understanding between myself and interviewees. Each interview is expected to take between 30-45 minutes. The number of interviews undertaken in any one school will depend on the number of students wishing to participate.
It is anticipated that this study would be undertaken during Semester One of this year. There are no perceived benefits or disadvantages to the students being involved in this study. Participation of students in this study is voluntary. The students may also discontinue participation at any time without comment or penalty. Confidentiality of participants is assured. Student names will not be used during collection of data. No student will be identifiable from the written records of the research project, nor from any publications that may arise from the research. The collected data (audio recordings, transcripts, field notes) from the study will be available only for access by my principal supervisor and myself. These data may be accessed for the purposes of undertaking work in related areas, namely workshops, presentations and publications in educational and research journals. Following completion of the research project, the data will be used solely for presenting work in educational and research forums. Audio-tapes will be destroyed once the project is complete. Initial findings from this research are expected to be available by the end of the year, with publication of these expected from mid-2007 onwards. Results will be supplied to you. Application to Conduct Research in Education Queensland State Schools and Other Units has been lodged with the Senior Research Officer – Strategic Policy and Education Futures in Central Office, as per Education Queensland Guidelines. A copy of both the application and of the approval notice is appended. Also appended are the

258
information/consent forms that will be provided to students, and a copy of my current teacher registration certificate. Should you wish <INSERT SCHOOL NAME> to be included in this research, in the first instance I will require your written consent. Once this has been received, I will provide the form for students and their parents/guardians that outlines the proposed research and seeks their written consent. I will also provide a brief outline of the proposed research for inclusion in your communications with parents. It is anticipated that interviews would be undertaken during Terms One and Two of this year. Should you wish to discuss this proposal, or raise concerns about its conduct, I may be contacted directly on telephone , or via [email protected]. Alternatively, you may contact my supervisor, Associate Professor John Lidstone, on 0413 485 957, or via [email protected], or the University’s Research Ethics Officer on 3864 2340, or [email protected]. I would be grateful if you would consider this application favourably. Yours sincerely Bryan West Encl. Application to Conduct Research In Education Queensland Schools Notice of approval to conduct research in EQ schools Parent/student information/consent form Teacher registration certificate

259
Appendix D: Letter to independent school principals
Bryan West
Address 1 Address 2 DATE Title Address 1 Address 2
Dear <INSERT PRINCIPAL’S NAME> I am presently conducting doctoral studies through Queensland University of Technology. The title of this research is Conceptions of Geographic Information Systems (GIS) held by Senior Geography students in Queensland. The purpose of this investigation is to identify what students think about GIS, and through this to better inform decisions about the role of GIS within schools. Your school is one of several that has been identified as providing an appropriate context in which data may be collected. I am writing, therefore, to request permission to conduct a study involving students enrolled in Senior Geography at your school. The study will involve two aspects: 3. Site visit, which would involve me familiarising myself with the educational context in
which GIS is used at your school. 4. Interviews, which will be involve groups of approximately 6-8 students. Each
interview will be audio taped and preceded by an introductory monologue to ensure common understanding between myself and interviewees. Each interview is expected to take between 30-45 minutes. The number of interviews undertaken in any one school will depend on the number of students wishing to participate.
It is anticipated that this study would be undertaken during Semester One of this year. There are no perceived benefits or disadvantages to the students being involved in this study. Participation of students in this study is voluntary. The students may also discontinue participation at any time without comment or penalty. Confidentiality of participants is assured. Student names will not be used during collection of data. No student will be identifiable from the written records of the research project, nor from any publications that may arise from the research. The collected data (audio recordings, transcripts, field notes) from the study will be available only for access by my principal supervisor and myself. These data may be accessed for the purposes of undertaking work in related areas, namely workshops, presentations and publications in educational and research journals. Following completion of the research project, the data will be used solely for presenting work in educational and research forums. Audio-tapes will be destroyed once the project is complete. Initial findings from this research are expected to be available by the end of the year, with publication of these expected from mid-2007 onwards. Results will be supplied to you. Ethical approval for this research has been granted, in accordance with QUT guidelines. A copy of this advice is appended for your information, as is a copy of my current Teacher Registration Certificate. Also appended is the information/consent form that will be provided to students.

260
Should you wish <INSERT SCHOOL NAME> to be included in this research, in the first instance I will require written confirmation of your consent. Once this has been received, I will provide the form for students and their parents/guardians that outlines the proposed research and seeks their written consent. I will also provide a brief outline of the proposed research for inclusion in your communications with parents. It is anticipated that interviews would be undertaken during Terms One and Two of this year. Should you wish to discuss this proposal, or raise concerns about its conduct, I may be contacted directly on telephone , or via [email protected]. Alternatively, you may contact my supervisor, Associate Professor John Lidstone, on 0413 485 957, or via [email protected], or the University’s Research Ethics Officer on 3864 2340, or [email protected]. I would be grateful if you would consider this application favourably. Yours sincerely Bryan West Encl. Notification of Ethical Approval Teacher Registration Certificate Parent/student information/consent form

261
Appendix E: Letter to participating teachers
Bryan West
Address 1 Address 2 DATE Title Address 1 Address 2 Dear <INSERT TEACHER’S NAME> I am presently conducting doctoral studies through Queensland University of Technology. The title of this research is Conceptions of Geographic Information Systems (GIS) held by Senior Geography students in Queensland. The purpose of this investigation is to identify what students think about GIS, and through this to better inform decisions about the role of GIS within schools. Your Principal, <INSERT PRINCIPAL’S NAME> has given approval for your school to participate, and has indicated that I should liaise directly with you to coordinate the project. I am writing, therefore, to advise of the study’s requirements. The study will involve students enrolled in Senior Geography at your school. The study will involve two aspects, which will ideally occur during the one visit: 5. Site visit, which would involve me familiarising myself with the educational context in
which GIS is used at your school. 6. Interviews, which will be involve groups of approximately 6-8 students. Each
interview will be audio taped and preceded by an introductory monologue to ensure common understanding between myself and interviewees. Each interview is expected to take between 30-45 minutes. The number of interviews undertaken in any one school will depend on the number of students wishing to participate.
It is anticipated that this study would be undertaken during the first four weeks of Term Two this year. The precise time will be negotiated with yourself. There are a number of tasks that I need to complete. These are:
1. Provide information and consent forms to students who have experienced the use of GIS as part of their Senior Geography studies
2. Collect consent forms from students and advise me of the number of students 3. Organise participants into interview groups 4. Identify an appropriate venue in which the interviews may be conducted 5. Identify interview times that are suitable for your school and its participants 6. Meet with you for approximately 30 minutes to discuss the nature and extent of
GIS’ use as part of your school’s Senior Geography curriculum. I would be happy to discuss with you the most efficient way of undertaking these tasks. There are no perceived benefits or disadvantages to the students being involved in this study. Participation of students in this study is voluntary. The students may also discontinue participation at any time without comment or penalty. Confidentiality of participants and schools is assured. Student names will not be used during collection of data. No student will be identifiable from the written records of the research project, nor from any publications that may arise from the research. The collected data (audio recordings, transcripts, field notes) from the study will be available

262
only for access by my principal supervisor and myself. These data will be stored with my supervisor at QUT Kelvin Grove and may be accessed solely for the purposes of undertaking work in related areas, namely workshops, presentations and publications in educational and research journals. Following completion of the research project, the data will be used solely for presenting work in educational and research forums. Audio-tapes, transcripts and field-notes will be destroyed once the project is complete. Initial findings from this research are expected to be available by the end of the year, with publication of these expected from mid-2007 onwards. Results will be supplied to the school. I have appended for your reference a copy of the Introductory Monologue, Interview Guidelines and Parent/Student Information/Consent Form. I will contact you by telephone prior to the end of Term One to discuss this proposal, and to arrange your school’s further involvement. In the meantime, should you wish to discuss this proposal, or raise concerns about its conduct, I may be contacted directly on telephone 07 , or via [email protected]. Alternatively, you may contact my supervisor, Associate Professor John Lidstone, on 0413 485 957, or via [email protected], or the University’s Research Ethics Officer on 07 3864 2340, or [email protected]. I look forward to working with you further. Yours sincerely Bryan West Encl. Introductory Monologue Interview Guidelines Parent/student information/consent form

263
Appendix F: Interview Consent Form
Conceptions of Geographic Information Systems (GIS) held by Senior Geography students in Queensland.
Bryan West,
Description
This project is being undertaken as part of an PhD project for Bryan West. The purpose of this project is to identify what students think about GIS, and through this to better inform decisions about the role of GIS within schools. The research team requests your child’s assistance in identifying what students think about GIS.
Participation
Your child’s participation will involve a focus group that is expected to occupy approximately 30-45 minutes. This interview will occur at your child’s school, and will involve your child discussing GIS in a group of about eight Senior Geography students. Each interview will be audio recorded. The audio recordings will be transcribed and then retained until completion of the research project. During this time, they will be available only to the principal researcher and his university supervisors. Audiotapes will be destroyed once the project is complete. Since the entire focus group interview is to be transcribed, it is not possible to participate in the project without being audio-recorded.
Expected Benefits
It is expected that the results of the interview will not benefit your child, but their involvement in the project will provide information that will inform future decisions about the use of GIS in Australian schools.
Risks
There are no additional risks associated with your child’s participation in this project.
Confidentiality
All comments and responses are anonymous and will be treated confidentially. The names of individual persons will not be required in any of the responses.
Voluntary Participation
Your child’s participation in this project is voluntary. If you do agree for your child to participate, he or she can withdraw from participation at any time during the study without comment or penalty. The decision to participate will in no way impact upon your child’s current or future relationship with QUT.
Questions / further information
Please contact the research team if you require further information about the project, or to have any questions answered.
Concerns / complaints
Please contact the Research Ethics Officer on 3864 2340 or [email protected] if you have any concerns or complaints about the ethical conduct of the project.

264
Conceptions of Geographic Information Systems (GIS) held by Senior Geography students in Queensland.
Bryan West
Statement of Parent/Guardian consent
By signing below, you are indicating that you:
• have read and understood the information sheet about this project;
• have had any questions answered to your satisfaction;
• understand that if you or your child have any additional questions you can
contact the research team;
• understand that you or your child are free to withdraw at any time, without
comment or penalty;
• understand that you or your child can contact the research team if there any
questions about the project, or the Research Ethics Officer on 3864 2340 or
[email protected] if they have concerns about the ethical conduct of the
project;
• understand that the project will include audio and/or video recording; and
• agree to your child’s participation in the project.
Name
Signature
Date / /
Statement of Child consent
Your parent or guardian has given their permission for you to be involved in this research project. This form is to seek your agreement to be involved. By signing below, you are indicating that you agree to participate in the project.
Name
Signature
Date / /

265
Appendix G: Introductory Monologue
Good morning/afternoon. I’d like firstly to thank you for being involved today.
Before we get to the topic, I would like to advise that I am tape recording this
session so that I can transcribe it later. I will also take notes. I will then combine
your conversations and the notes with those from other groups who are involved
in my study. At no time will you be identified, either while I analyse the data, or
publish the results. Your confidentiality is certain. There are no right or wrong
answers. You will not be graded in the things that you say. I will not judge you
for the things that you say. Standard courtesy, however, is required. If at any
time you wish to stop participating, you may do so freely.
So, what is this about?
When I think about GIS, I see certain things. Because of my experiences, I have
certain beliefs about it. I can define it, describe how it can be used, suggest ways
that it affects what and how students learn, and argue about its role in Senior
Geography.
But, as a teacher, I understand that students might have different beliefs about
GIS. So, my aim is to find out what students who do Senior Geography think
about GIS. You are all enrolled in Senior Geography. You have all used GIS as
part of your Senior Geography studies. This means that you have had some
experience of GIS.
I would like you to talk about your experiences of GIS.

266
Appendix H: Sample interview questions
The following questions may offer a guide to possible conversation topics
1. What does GIS stand for?
2. What does GIS do? Do you think that its name is appropriate for what it
does?
3. How does GIS structure information about the world?
4. Is GIS hard or easy? What bits are hard, and what bits are easy?
5. What sorts of things do you do with GIS and how do these compare with
other things you do in your Geography classes?
6. Is GIS just another computer program that you use at school?
7. Do you enjoy using GIS? If so, what is it that you enjoy about using GIS?
If not, what is it that you find not enjoyable, and what would you prefer to
be doing instead?
8. Does using GIS make doing Geography easier or harder?
9. Is using GIS the best way to use your class time?
10. What sorts of things make using GIS worthwhile?
11. Why do you think your teacher chooses to use GIS?
12. When you use GIS, do you think that you achieve the goals that your
teacher intends?
13. Would you recommend that GIS be used by all students who study
Geography?
14. Do you think that GIS could be used in other subjects?
15. How often do you use GIS, and for what types of things?
16. Would it be possible to do the things that you do with GIS without using
computers?
17. Why is GIS used in Senior Geography?

267
REFERENCES
Ahlberg, A. (1992). The Meeting with Mathematical Problems. An Illumination
of Children's Learning. Retrieved 27/06/05, from
www.ped.gu.se/biorn/phgraph/civil/graphica/diss.su/ahlberg1.html
Alexander, J. (2006, July 22-26, 2006). Engagement and Deeper Understanding
through Choice: Empowering Students through Negotiating their own
Curriculum in the Social Sciences. Paper presented at the Teaching For
Understanding - Behind, Within & Beyond, A.B. Paterson College, Gold
Coast.
Anderson, G. (1990). Foundations of Educational Research. London: The
Falmer Press.
Arminio, J. (2002). Considerations in conducting "good" qualitative assessment.
Retrieved 29/01/05, from
www.naspa.org/netresults/PrinterFriendly.cfm?ID=662
Ashworth, P., & Lucas, U. (2000). Acheiving empathy and engagement: a
practical approach to the design, conduct and reporting of
phenomenographic research. Studies in Higher Education, 25(3), 295-
308.
Atkin, J. (2003). Geography and the thinking curriculum. Interaction, June, 9-12.
Atkinson, P., Coffey, A., & Delamont, S. (2003). Key themes in qualitative
research: Continuities and Change. Blue Ridge Summit (PA): Altamira.
Audet, R. H., & Paris, J. (1997). GIS implementation model for schools:
Assessing the critical concerns. Journal of Geography, 96(6), 293-300.
Baker, H. (1997b). Education for the spatial information industries. An industry
in crisis. GIS User, 25, 2-25.
Baker, H. (1997a). GIS education for the next millenium. GIS User, 20, 22-25,
29.
Baker, T. R. (2003). The History and Application of GIS in Education. Retrieved
24/02/03, from http://kangis.org/ed_docs/gisNed1.cfm
Baker, T. R. (2005). Internet-Based GIS mapping in Support of K-12 Education.
The Professional Geographer, 57(1), 44-50.
Baker, T. R., & Bednarz, S. W. (2003). Lessons Learned From Reviewing
Research in GIS Education. Journal of Geography, 102, 231-233.

268
Baker, T. R., & White, S. H. (2003). The Effects of GIS on Students' Attitudes,
Self-efficacy, and achievement in Middle School Science Classrooms.
Journal of Geography, 102(6), 243-254.
Baldwin, R. (2002). Geography On-Line: The Status of Geography as a School
Subject. New Zealand Journal of Geography, October, 32-33.
Ballantyne, R. (1996). Factors affecting student choice of geography as a senior
secondary school subject in Queensland. International Research in
Geographical and Environmental Education, 5(3), 172-185.
Bausmith, J. M., & Leinhardt, G. (1998). Middle-school students' map
construction: understanding complex spatial displays. Journal of
Geography, 97, 93-107.
Bednarz, R. S. (1997). A decade of progress in geographic education. Journal of
Geography, 96(6), 278-279, 324.
Bednarz, R. S., & Audet, R. H. (1999). The status of GIS technology in teacher
preparation programs. Journal of Geography, 98(2), 60-67.
Bednarz, S. W. (2000). Connecting GIS and Problem-Based Learning. In R. H.
Audet & G. Ludwig (Eds.), GIS in Schools (pp. 89-101). Redlands, Ca.:
ESRI Press.
Bednarz, S. W. (2004). Geographic information systems: A Tool to Support
Geography and Environmental Education? GeoJournal, 60(2), 191-199.
Beeson, P. (2006). Uncovering the secrets behind the successful integration of
GIS into the core curriculum. International Research in Geographical
and Environmental Education, 15(3), 274-277.
Berry, M. (1996). The fate of Geography in Queensland. Geographical
Education, 9, 25-27.
Biggs, J. B., & Moore, P. J. (1993). The Process of Learning (3rd ed.). New
York: Prentice Hall.
Blachford, K. R. (1971). Why is Geography in the curriculum? Geographical
Education, 1, 216-222.
Bliss, S. (2006). Forum: Geography and Geographical Education in New South
Wales, Australia. International Research In Geographical And
Environmental Education, 15(2), 149-158.
Bloom, B. S. (Ed.). (1956). Taxonomy of educational objectives: The
classification of educational goals: Handbook I, cognitive domain. New

269
York: Longmans.
Booth, S. (1997). On phenomenography, learning and teaching. Higher
Education Research and Development, 16(2), 135-158.
Boulton-Lewis, G., Marton, F., Lewis, D., & Wilss, L. (2004). A longitudinal
study of learning for a group of Indigenous Australian university students:
Dissonant conceptions and strategies. Higher Education, 47, 91-112.
Bowden, J. (1990). Curriculum development for conceptual change learning: a
phenomenographic pedagogy: ERADU: RMIT.
Bowden, J. (Ed.). (1994). Phenomenographic research: a personal experience.
Melbourne: EQARD, RMIT.
Breen, R. (1999, 12-15 July). Student Motivation and Conceptions of
Disciplinary Knowledge. Paper presented at the HERDSA Annual
International Conference, Melbourne.
Brodie, S. (2006). GIS in the Classroom: a New Zealand Experience.
International Research in Geographical and Environmental Education,
15(3), 271-273.
Bruce, C. (1992). In search of research students' conceptions of a literature
review. Unpublished master's thesis, Queensland University of
Technology.
Bruce, C. (1994b). Reflections on the experience of the phenomenographic
interview. Paper presented at the Phenomenography: Philosophy and
Practice Conference, Brisbane.
Bruce, C. (1994a). Research students' early experiences of the dissertation
literature review. Studies in Higher Education, 19(2), 217-229.
Bruce, C. (1995). Phenomenographic Research: An Annotated Bibliography.
Retrieved 30/03/03, from http://sky.fit.qut.edu.au/~bruce/anabib/preface
Bruce, C. (1997). The seven faces of information literacy. Adelaide: Auslib Press.
Bruce, C., & Gerber, R. (1996). Phenomenography: an annotated bibliography,
3rd edition.: CAESER Occasional Paper, QUT Brisbane.
Bruhn, J. K. (Ed.). (1989). Discourses on interviewing: validating qualitative
research findings through textual analysis. Lund: Studentlitteratur.
Bryman, A. (1984). The debate about quantitative and qualitative research: A
question of method or epistemology. The British Journal of Sociology,
35(1), 75-92.

270
Burns, R. B. (1997). Introduction to Research Methods (3rd ed.). South
Melbourne: Longman.
Burns, R. B. (2000). Introduction to Research Methods. (4th ed.). Longman:
South Melbourne.
Casinader, C., & Casinader, N. (1994). Going somewhere? "Future Problem
Solving" techniques in Geography. Geographical Education, 7(2), 42-46.
Catling, S. (2003). Primary Geographer Thinking Geographically. Interaction,
June, 37-39.
Chalmers, L. (2002). Developments in Getting GIS Technologies into
Classrooms. Geographical Education, 15, 22-27.
Chalmers, L. (2006). GIS in New Zealand schools: issues and prospects.
International Research In Geographical And Environmental Education,
15(3), 268-270.
Chiodo, J. J. (1997). Improving the cognitive development of students' mental
maps of the world. Journal of Geography, 96(3), 153-163.
Chorley, R. J., & Haggett, P. (1965). Epilogue. In R. J. Chorley & P. Haggett
(Eds.), Frontiers in Geographical Teaching (pp. 375). London: Methuen.
Conolly, G. (2000). Promotion of Geography in Australia: An Unfinished Story.
International Research in Geographical and Environmental Education,
9(2), 160-165.
Conolly, G. (2001a). Forum on the promotion of Geography in Australia.
Geographical Education, 14, 3-4.
Conolly, G. (2001b). Geography and the Australian Community. Geographical
Education, 14, 2.
Conolly, G., & van Noorden, P. (2001). Promoting Geography in Schools.
Geographical Education, 14, 22-26.
Cope, C. (2002). Using the analytical framework of a structure of awareness to
establish validity and reliability in phenomenographic research., Current
Issues in Phenomenography – Symposium Proceedings. ANU, Canberra.
Costin, V. A. (2000). Conceptions of 'History' held by a group of 17 year old
students in a Queensland school. Unpublished EdD, Queensland
University of Technology, Brisbane.
Cox, B. (1997). Teaching meaningful geography. Geographical Education, 10,
50-52.

271
Crabb, P. (1995). "Les professeurs de geographie savant ou ils vont" Or do they?
Geographical Education, 8(3), 9-11.
Cranby, S. (2002). Understanding KGIs - spatial association. Interaction,
30(March), 25-31.
Creswell, J. W. (2002). Educational Research: Planning, Conducting, and
Evaluating Quantitative and Qualitative Research. New Jersey: Merrill
Prentice Hall.
Crotty, M. (1998). The Foundations of Social Research: Meaning and
Perspective in the Research Process. London: Sage.
Curran, P. J. (1985). The Principles of Remote Sensing. London: Longman.
Dahlgren, L. O. (Ed.). (1984). Higher education - impact on students. Edinburgh:
Scottish Academic Press.
Dahlgren, L. O., & Fallsberg, M. (1991). Phenomenography as a qualitative
approach in social pharmacy research. Journal of Social and
Administrative Pharmacy, 8(4), 150-156.
Dahlin, B. (1994). An epistemology of conceptions and its educational
significance. Paper presented at the Phenomenography: Philosophy and
Practice, Brisbane.
Dahlin, B., & Regmi, M. P. (1995, August 26-31). Conceptions of Learning
among Nepali students. Paper presented at the 6th EARLI Conference,
Nijmegen, The Netherlands.
Dale, P. (1995). The future of Australian geography? Geographical Education,
8(3), 12-15.
Dall Alba, G. (Ed.). (1994). Reflections on some faces of phenomenography.
Melbourne: EQARD: RMIT.
Dascombe, B. (2006). Making GIS sustainable in schools. International
Research in Geographical and Environmental Education, 15(3), 265-267.
de Souza, A., & Downs, R. (1994). Geography for Life: Executive Summary.
Washington, DC: National Council for Geographic Education.
Downs, R. M. (1994). The need for research in Geography education: it would be
nice to have some data. Journal of Geography, 93(1), 57-60.
Eisner, E. W. (1993). The emergence of new paradigms for educational research.
Art Education, 46(6), 50-55.
Ekeblad, E. (1995, March 16-19). Talking phenomenography. Some reflections

272
occasioned by Säljö's article on "Minding action." Paper presented at the
23rd congress of the NFPF, Aarhus, Denmark.
Ekeblad, E., & Bond, C. (1995, August 26-31). A phenomenography of learning
in context. Paper presented at the 6th EARLI Conference, Nijmegen,
Netherlands.
ESRI. (1991). Understanding GIS: The ARC/Info Method. Redlands (Ca.):
Environmental Systems Research Institute.
ESRI. (1995). Explore your world: GIS in K-12 education. USA: ESRI Inc.
ESRI. (2007). System Requirements. Retrieved Mar 28, 2007, from
http://www.esri.com/software/arcgis/ArcView/about/sys-reqs.html
Faux, R. B. (2002). Introducing students to the tools of psychological research.
Forum Qualitative Sozialforschung / Forum: Qualitative Social Research
[On-line Journal], 3(4). Retrieved Mar, 13, 2006, from
http://www.qualitative-research.net/fqs-texte/4-02/4-02review-faux-
e.htm.
Fernald, E. A. (1996). The need that just won't go away. Journal of Geography,
95(1), 2-4.
Fernald, E. A. (2002). Using the definition of Geography to develop teaching
strategies. Journal of Geography, 101, 126-130.
Ferrari, J. (2007, May 23). Ideology rules the classroom. The Australian, p. 1.
Firestone, W. A. (1987). Meaning in method: The rhetoric of quantitative and
qualitative research. Educational Researcher, 16(7), 16-21.
Fitzpatrick, C. (2001). A trainer's view of GIS in schools. International Research
in Geographical and Environmental Education, 10(1), 85-87.
Flick, U. W. E. (2006). An Introduction to Qualitative Research. London: Sage
Publications.
Fraenkel, P. (1995). The nomothetic-idiographic debate in family therapy.
Family Process, 34 (1), 113-121.
Francis, H. (1993). Advancing phenomenography - questions of method. Nordisk
Pedogogik, 13(2), 68-75.
Franz, J. (1994). Managing intricacy in phenomenographic inquiry. Paper
presented at the Phenomenography: Philosophy and Practice Conference,
Brisbane.
Freeman, J. (2006). Geography in the Australian Capital Territory: A Mixed

273
Picture. International Research In Geographical And Environmental
Education, 15(2), 185-188.
Geography Education Standards Project. (1994). Geography For Life.
Washington, D.C.: National Geographic Research and Exploration.
Gerber, R. (1992a). Using maps and graphics in geography teaching. Brisbane:
IGU Commission on Geographical Education, QUT Press.
Gerber, R. (1992b, July 1). Phenomenography as a qualitative research
approach beyond the individual. Paper presented at the Third National
Social Research Conference, University of Western Sydney.
Gerber, R. (1993). A sense of quality - qualitative research approaches for
geographical education. In H. Jager (Ed.), Liber Amicorum Prof Niemz.
Frankfurt am Main: Goethe University Press.
Gerber, R. (1995a). A geographical education for life based on technological and
graphic literacy. Geographical Education, 8(3), 50-56.
Gerber, R. (1995b, August 14-18). Students' Understanding of the Concept of
Global Change in Geographical Education. Paper presented at the Global
Changes and Geography, Conference of the International Geography
Union, Moscow.
Gerber, R. (1995c). Preface. In C. Bruce (Ed.), Phenomenographic Research: An
Annotated Bibliography. (3rd ed.). Brisbane.
Gerber, R. (1997). Geography, work and lifelong learning. Geographical
Education, 10, 38-44.
Gerber, R. (2001). The state of Geography education in countries around the
world. International Research in Geographical and Environmental
Education, 10(4), 349-362.
Gerber, R. (2006, June 26-29, 2006). An Internationalised, Globalised
Perspective on Geographical Education. Paper presented at the Changes
in Geographical Education: Past, Present and Future, Brisbane.
Gerber, R., & Kwan, T. (1995). A phenomenographical approach to the study of
pre-adolescents use of maps in a wayfinding exercise in a suburban
environment. Journal of Environmental Psychology, 14, 265-280.
Gerber, R., Kwan, T., & Bruce, C. (1993). Gathering phenomenographic data:
An example from wayfinding. On Qualitative Research -
Phenomenography: Theory and Applications, 2 [videorecording].

274
Brisbane: QUT.
Gewin, V. (2004). Mapping opportunities. Nature, 427(January), 376-377.
Glesne, C. (1999). Becoming Qualitative Researchers. New York: Longman.
Godfrey, C. (2001). Computer Technologies: Scaffolding tools for teaching and
learning. Australian Educational Computing, 16(2), 27-29.
Gregg, M. (1997). Problem posing from maps: utilising understanding. Journal
of Geography, 96(5), 250-256.
Gregg, M., Stainton, C., & Leinhardt, G. (1997). Strategies for geographic
memory: Oh, what a state we're in! International Research in
Geographical and Environmental Education, 6(1), 41-59.
Grice, J. W. (2004). Bridging the idiographic-nomothetic divide in ratings of self
and others on the big five. Journal of Personality, 72 (2), 203-241.
Griffiths, M. D. (1997). Friendship and social development in children and
adolescents: the impact of electronic technology. Educational and Child
Psychology, 14, 25-37.
Gritzner, C. F. (2002). What is where, why there, and why care? Journal of
Geography, 101, 38-40.
Gritzner, C. F. (2003). Why Geography? Journal of Geography, 102, 90-91.
Halocha, J. (2005). Developing a Research Tool to Enable Children to Voice
their Experiences and Learning through Fieldwork. International
Research In Geographical And Environmental Education, 14(4), 348-
355.
Harman, J. R. (2003). Whither Geography? The Professional Geographer, 55(4),
415-421.
Hazel, E., Conrad, L., & Martin, E. (1997). Exploring gender and
phenomenography. Higher Education Research and Development, 16(2),
213-226.
Healey, M., Jenkins, A., & Kneale, P. (2000). Small worlds on an interconnected
planet: Teaching and learning Geography in higher education. Retrieved
28/03/03, from www.chelt.ac.uk/gdn/confpubl/isl.htm
Hempenstall, K. (2007). The teaching of literacy: Reflecting a profession without
a strong foundation. In Senate Employment, Workplace Relations and
Education Committee (Ed.): Parliament of Australia.
Hermann, D. (1996). Developing a spatial perspective: Using the local landscape

275
to teach students to think geographically. Journal of Geography, 95(4),
162-167.
Herschell, R. M. (1997). Conceptions of thinking legally: An intepretive
approach. Unpublished PhD thesis, University of New England,
Armidale, N.S.W.
Hoel, M. (2004). Limits to Globalisation: Technology in Secondary School
Geography, the International Baccalaureate Curriculum and Ontario
Public Education Experiences. International Research In Geographical
And Environmental Education, 13(4), 370-373.
Howe, K. R. (1992). Getting over the quantitative-qualitative debate. American
Journal of Education, 100(2), 236-256.
Howe, K. and Eisenhart, M. (1990). Standards for qualitative (and quantitative)
research: A prolegomenon. Educational Researcher, 19 (4), 2-9.
Howitt, R. (2002). A Geographer's way of seeing - Geographical imaginaries and
political realities. Interaction, December, 7-12.
Hutchinson, N. (2006). Geography in Australian Schools: A View from the
AGTA Chair. International Research In Geographical And
Environmental Education, 15(2), 193-196.
Hutchinson, N., & Pritchard, B. (2006). True Blue Geography. Geographical
Education, 19, 8-10.
International Charter on Geographical Education. (1992). Commission on
Geographical Education of the International Geographical Union.
Retrieved Jan 12, 2005, from http://igu-cge.tamu.edu/
Irvine, S. (2005). Parent Conceptions of their Role in Early Childhood Education
and Care: A Phenomenographic Study from Queensland, Australia,
Queensland University of Technology, Brisbane, Qld, Australia.
Jenner, P. (2006). Engaging students through the use of GIS at Pimlico State
High School. International Research In Geographical And Environmental
Education, 15(3), 278-282.
Johansson, B., Marton, F., & Svensson, L. (1985). An approach to describing
learning as a change between qualitatively different conceptions. In L.
West & L. Pines (Eds.), Cognitive Structure and Conceptual Change. (pp.
233-257). Orlando: Academic Press.
Johansson, B., Marton, F., & Svensson, L. (1985). An approach to describing

276
learning as change between qualitatively different conceptions. In L. H.
T. West & L. Pines (Eds.), Cognitive structure and conceptual change
(pp. 233-257). New York: Academic Press.
Johnson, M. (1996). GIS in business: Issues to consider in curriculum decision-
making. Journal of Geography, 95(3), 98-105.
Kam, T. S. (1996). Interactive multimedia and GIS applications for teaching
school geography. International Research in Geographical and
Environmental Education, 5(3), 205-212.
Keiper, T. A. (1998). GIS for elementary students: an inquiry into a new
approach to learning geography. Journal of Geography, 98, 47-59.
Kempson, S. (2000). Gone are the days of the hand-drawn map! Geographical
Education, 13, 18-24.
Kennedy, M. (2004, Oct 13-14). Are we there yet? Developing methodology in a
knowledge management research project. Paper presented at the Fifth
Annual ActKM Conference, Canberra.
Kerski, J. J. (2001). A national assessment of GIS in American high schools.
International Research in Geographical and Environmental Education,
10(1), 72-84.
Kerski, J. J. (2003). The implementation and effectiveness of geographic
information systems technology methods in secondary education. Journal
of Geography, 102, 128-137.
Keyes, M., & Orr, G. (1995). Student Conceptions of Legal Theory: the first year
experience. Paper presented at the Australasian Law Teachers
Association 50th Anniversary Conference. Cross Currents:
Internationalism, National Identity and Law.
Kidman, & Palmer, G. (2006). GIS: the technology is there but the teaching is yet
to catch up. International Research in Geographical and Environmental
Education, 15(3), 289-296.
Kids map hazards in space for GIS day. (2003). Retrieved 27/06/05, from
www.ga.gov.au/media/releases/200306112003-gis_day.jsp
Klein, P. (1995). Using inquiry to enhance the learning and appreciation of
Geography. Journal of Geography, 94(2), 358-367.
Kriewaldt, J. (2006). Geography and Geographical Education in Victoria.
International Research In Geographical And Environmental Education,

277
15(2), 159-165.
Krueger, R. A., & Casey, M. A. (1994). Focus Groups: A Practical Guide for
Applied Research (3rd ed.). Thousand Oaks, CA: Sage Publications.
Kvale, S. (1996). Interviews: An Introduction to Qualitative Research
Interviewing. London: Sage Publications.
Lancy, D. F. (1993). Qualitative Research in Education: An Introduction to the
Major Traditions. New York: Longman.
Langley, R. (2001). The application of GIS to education administration.
International Research in Geographical and Environmental Education,
10(1), 92-99.
Laurence, W. C., Shaffer, C. A., Morrill, R. W., & Fox, E. A. (1993). GeoSim: A
GIS-based simulation laboratory for introductory geography. Journal of
Geography, 92(5), 217-222.
Le Bhers, D. (1998). Influences on student learning in master of education
(TESOL): Five conceptions. Unpublished master's thesis, Queensland
University of Technology, Brisbane.
Leinhardt, G., Stainton, C., & Bausmith, J. M. (1998). Constructing maps
collaboratively. Journal of Geography, 97, 19-30.
Lidstone, J. (1996). Synergetic focus group discussion: rapid access to rich data.
In R. Gerber & M. Williams (Eds.), Qualitative Research in
Geographical Education (pp. 159-168). Armidale: University of New
England Press.
Lindblad, S. (1983). How to study teachers' conceptions of the world around us.
Or: A discussion of phenomenography as normal science. Tidskrift for
Nordisk Forening for Pedagogisk Forskning, 2.
Lloyd, W. J. (2001). Integrating GIS into the undergraduate learning
environment. Journal of Geography, 100, 158-163.
Lo, C. P., Affolter, J. M., & Reeve, T. (2002). Building environmental literacy
through participation in GIS and multimedia assisted field research.
Journal of Geography, 101, 10-19.
Loveless, A. (2003). Information and Communications Technology as a Catalyst
for Professional Growth. Technology, Pedagogy & Education, 12(3), 325-
328.
Macaulay, J. (1994). Lessons from our recent English experience for our Social

278
Sciences curriculum development. New Zealand Journal of Geography,
97, 22-24.
Maddox, H. (1993). Theory of Knowledge and its Dissemination. Castlemaine
[Vic.]: Freshet Press.
Mailler, E. (2006). For Love or Money: Peceptions and Conceptions of the Work
Ethic Held by a group of Preservice Teachers in Queensland.
Unpublished PhD, Queensland University of Technology, Brisbane.
Main, K., Bryer, F., & Grimbeek, P. (2004). Forging Relationships: An Integral
Feature of Middle Schooling Practice. Australian Journal of Middle
Schooling, 4(2), 8-17.
Mara Chen, X. (1997). Integrating GIS education with training: a project-
oriented approach. Journal of Geography, 97, 261-268.
Marran, J. F. (2003). Geography: An essential school subject - Five reasons why.
Journal of Geography, 102(1), 42-43.
Marton, F. (1981a). Phenomenography - Describing conceptions of the world
around us. Instructional Science, 10, 177-200.
Marton, F. (1981b). Studying conceptions of reality - A metatheoretical note.
Scandinavian Journal of Educational Research, 25, 159-169.
Marton, F. (1983). Beyond individual differences. Educational Psychology, 3(3-
4), 289-303.
Marton, F. (1986). Phenomenography - A research approach to investigating
different understandings of reality. Journal of Thought, 3, 28-49.
Marton, F. (1994). Phenomenography and "the art of teaching all things to all
men." International Journal of Qualitative Studies in Education, 5(3),
253-267.
.McInerney, M. (2002a). An achievable approach to GIS: Making GIS happen
with minimal purchased data and maximum student input. Interaction,
30(1), 42-46.
McInerney, M. (2002b). GIS is achievable: the "nuts and bolts" of introducing
GIS in the geography classroom. Geographical Education, 15, 12-21.
McInerney, M. (2003). An extreme event; developing a disaster plan using GIS.
Interaction, 13(March), 9-16.
McInerney, M. (2006). The implementation of spatial technologies in Australian
schools: 1996-2005. International Research In Geographical And

279
Environmental Education, 15(3), 259-264.
McInerney, M., & Shepherd, R. (2006). Geography: The South Australian
Experience. International Research In Geographical And Environmental
Education, 15(2), 176-181.
McKeown-Ice, R. (1994). Environmental education: A geographical perspective.
Journal of Geography, 93(1), 40-42.
Meaney, M. (2006). Towards GIS implementation: A Case Study. International
Research In Geographical And Environmental Education, 15(3), 283-
288.
Merriam, S. B. (1998). Qualitative Research and Case Study Applications in
Education. San Francisco: Jossey Bass Publishers.
Migliorino, N. J., & Maiden, J. (2004). Educator Attitudes Toward Electronic
Grading Software. Journal of Research on Technology in Education,
36(3), 193.
Miles, S. J. (1999). Postgraduate Nursing Students: Conceptions of Clinical
Experience in Acute Paediatric Health Care Settings. Unpublished
Master of Nursing, Queensland University of Technology, Brisbane.
Miller, J., Keller, P., & Yore, D. (2005). Suggested Geographic Information
Literacy for K-12. International Research In Geographical And
Environmental Education, 14(4), 243-259.
Montgomery, K. L. (2000). Children's media culture in the new millenium:
Mapping the digital landscape. The Future of Children, 10(2), 145-167.
Mosenthal, P. B., & Kirsch, I. S. (1990). Understanding thematic maps
(understanding documents). Journal of Reading, 34, 136-140.
Murphy, A., Morrisson, Z., & Conolly, G. (2001). Viewpoints on the place of
Geography. Geographical Education, 14, 41-48.
Murphy, E. (1997). Computer-Based Learning Environments. Retreived
25/04/2003 from www.stemmnet.nf.ca?~elmurphy/emurphy/computers
Murphy E (2000). Qualitative research methods in health technology assessment:
a review of the literature. The Research Findings Register. Summary no
87. 02/072007, from www.ReFeR.nhs.uk/ViewRecord.asp?ID=87.
Nagel, M. (2002). Queensland and Saskatchewan Middle Years Students'
Experiences of Environmental Education: An Analysis of Conceptions.
Unpublished PhD, Queensland University of Technology, Brisbane.

280
Nagel, M. (2004). What Could They Be Thinking?: The Neuro-Pathology of
Adolescence. Australian Journal of Middle Schooling, 4(2), 1-7.
Naish, M., Rawling, E., & Hart, C. (1987). Geography 16-19. The Contribution
of a Curriculum Project to 16-19 Education. London: Longman.
National Council for Geography Education. (2004). ICT Literacy Map:
Geography. Retrieved Feb 04, 2007, from
http://21stcenturyskills.org/images/stories/matrices/ictcover_geo.pdf
National Research Council. (2006). Learning to Think Spatially: GIS as a
Support System in the K-12 Curriculum. Washington, D.C.: The National
Academies Press.
Nellis, M. D. (1995). Geography for life: Today's innovations are tomorrow's
traditions. Journal of Geography, 94(1), 302-304.
Oldakowksi, R. K. (2001). Activities to develop a spatial perspective among
students in introductory geography courses. Journal of Geography, 100,
243-250.
Olsen, A. (2002). Using GIS software in school teaching programmes: an initial
survey. New Zealand Journal of Geography, April, 17-19.
O'Mahony, C. (2003). Getting the Information and Communications Technology
Formula Right: Access + Ability = Confident Use. Technology,
Pedagogy & Education, 12(2), 295-311.
Onwuegbuzie, A. J., & Daniel L. G. (2003, February 19). Typology of analytical
and interpretational errors in quantitative and qualitative educational
research. Current Issues in Education [On-line], 6(2). Retrieved June 25,
2004 from http://cie.ed.asu.edu/volume6/number2/
Orb, A., Eisenhauer, L., & Wynaden, D. (2001). Ethics in qualitative research.
Journal of Nursing Scholarship, 33 (1), 93-96.
Patterson, M., W., Reeve, K., & Page, D. (2003). Integrating Geographic
Information Systems into the Secondary Curricula. Journal of
Geography, 102(6), 275-281.
Pinnock, W. (2003). Review article on conceptions of creative writing.
Investigations in University Teaching and Learning, 1(1), 92-94.
Piper, K. (1994). Review of the Queensland School Curriculum: Social
Education. In Shaping the Future: Review of the Queensland School
Curriculum (Vol. 2). Brisbane: Queensland Government.

281
Polyani, M. (1967). The Tacit Dimension. London: Routledge & K. Paul.
Pramling, I. (1994). Phenomenography and educational practice. Nordisk
Pedogogik, 14(4), 227-239.
Pramling, I. (1995). Phenomenography and practice. New Zealand Journal of
Educational Studies, 30(2), 135-148.
Pun-Cheng, L. S. C., & Kwan, T. Y. L. (2001). The development of geomatics
education in Hong Kong. International Research in Geographical and
Environmental Education, 10(1), 88-91.
Queensland, B. o. S. S. S. S. (1999a). Geography: Senior Syllabus. Brisbane:
QBSSSS.
Queensland, B. o. S. S. S. S. (1999b, 20/05/99). Annual Summary 1993-1998.
Retrieved 13/12/04, from https://www.qsa.qld.edu.au/yrs11_12/statistics/
1998/qs1123g_1998.pdf
Queensland, Q. S. A. (2004a, 18/08/04). Senior subjects and assessment
outcomes 1998-1992. Retrieved 13/12/04, from
https://www.qsa.qld.edu.au/yrs11_12/statistics/subjects/98-92.html
Queensland, Q. S. A. (2004b, 26/10/04). Senior subjects and assessment
outcomes 1999-2003. Retrieved 13/12/04, from
https://www.qsa.qld.edu.au/yrs11_12/statistics/subjects/index.html
Queensland, Q. S. A. (2004c, 18/08/04). Annual Summary 1998-2003. Retrieved
13/12/04, from https://www.qsa.qld.edu.au/yrs11_12/statistics/
general/index.html.
Queensland, Q. S. A. (2006a). Senior Subjects and Assessment Outcomes 1999-
2005. Retrieved Feb 03, 2007, from https://www.qsa.qld.edu.au/
yrs11_12/statistics/subjects/index.html
Queensland, Q. S. A. (2006b). Annual Summary 2000-2005. Retrieved Feb 03
2007, from https://www.qsa.qld.edu.au/yrs11_12/statistics/
general/index.html
Queensland, Q. S. A. (2007a). Annual Summary, 2006. Retrieved Mar 28, 2007,
from http://www.qsa.qld.edu.au/yrs11_12/statistics/2006/QS1123G_2006
Queensland, Q. S. A. (2007b). Subject Enrolments and Levels of Achievement in
Authority Subjects by Subject Class and Sex. Retrieved Mar 28, 2007,
from www.qsa.qld.edu.au/yrs11_12/statistics/2006/QS1123C_2006
Queensland, Q. S. A. (2007c). Geography: Senior Syllabus. Brisbane: QSA.

282
Queensland, T. E. P. A. (2002). From Year 11 to Tertiary Entrance.
Understanding Senior Schooling and Tertiary Entrance. Brisbane: TEPA.
Rafaeli, S. (1998). Interactivity: From New Media to Communication. In R. P.
Hawkins, J. M. Wiemann & S. Pingree (Eds.), Advancing Communication
Science: Merging Mass and Interpersonal Processes. Newbury Park:
Sage Publications.
Rakes, G. C., Fields, V. S., & Cox, K. E. (2006). The Influence of Teachers'
Technology Use on Instructional Practices, Journal of Research on
Technology in Education (Vol. 38).
Ramsdem, P. (1985). Student learning research: Retrospect and Prospect. Higher
Education Research and Development, 4 (1), 51-69.
Raubaul, M., Gaupman, B., & Kuhn, W. (1997). Teaching raster GIS operations
with spreadsheets. Journal of Geography, 96(5), 258-263.
Rawling, E. (1997). Challenges for Geography in the 14-19 curriculum.
Geographical Education, 10, 6-14.
Rawling, E. (2000). Ideology, Politics and Curriculum Change: Reflections on
School Geography 2000. Geography, 85(3), 209-220.
Reinfried, S. (2001). Curricular changes in the teaching of Geography in Swiss
upper secondary schools: An attempt to develop skills for lifelong
learning. Journal of Geography, 100, 251-260.
Renström, L., Andersson, B., & Marton, F. (1990). Students' conceptions of
matter. Journal of Educational Psychology, 82(3), 555-569.
Resnick, M. (2001). Closing the Fluency Gap. Communications of the
Association for Computing Machinery, 44(3), 144-145.
Richardson, J. T. E. (1999). The Concepts and Methods of Phenomenographic
Research. Review of Educational Research, 69(1), 53-82.
Richhardt, R. (2002). Intellectual Character. San Francisco: Jossey-Bass.
Ritchie, D., & Baylor, A. (1997). Teaching with technology. Finding a workable
strategy. TechTrends, September, 27-30.
Rittschof, K. A., & Kulhavy, R. W. (1998). Learning and remembering from
thematic maps of familiar regions. Educational Technology Research and
Development, 46, 19-38.
Roberts, M. (1998). Using slide images to promote active learning. Teaching
Geography, 23(1), 16-19.

283
Robertson, M. (2003). School geography in Tasmania: its place and potential. EQ
Australia, Autumn, 20-21.
Robertson, M. (2004). Teacher Education Training for Geography Teachers in
Australia. International Research In Geographical And Environmental
Education, 13(2), 171-175.
Roschelle, J. M., Pea, R. D., Hoadley, C. M., Gordin, D. N., & Means, B. M.
(2000). Changing how and what children learn in school with computer-
based technologies. The Future of Children, 10(2), 76-101.
Ruddick, J., Day, J., & Wallace, G. (1997). Students' perspectives on school
improvement. In A. Hargreaves (Ed.), Rethinking educational change
with heart and mind. (pp. 73-91). Alexandria, VA: Association for
Supervision and Curriculum Development.
Sabelli, N. (2001). The goals behond the rhetoric: why we don't always talk
about technology when we talk about technology in education.
Information Impacts Magazine, June, 1-6.
Sack, D., & Petersen, J. F. (1998). Children's attitudes toward Geography: A
Texas case study. Journal of Geography, 97, 123-131.
Sale, J. E. M., Lohfield, L. H., & Brazil, K. (2002). Revisiting the quantitative-
qualitative debate: Implications for mixed-methods research. Quality and
Quantity, 36(1), 43-53.
Säljö, R. (1994). Minding action: Conceiving of the world versus participating in
cultural practices. Nordisk Pedogogik, 14(2), 71-80.
Salter, C. L. (1995). The geographic imperative. Journal of Geography, 94(4),
471-477.
Sandberg, J. (1995). Are phenomenographic results reliable? Nordisk Pedogogik,
15(3), 156-164.
Sandberg, J. (1997). Are phenomenographic results reliable? Higher Education
Research and Development, 16(2), 203-212.
Schulze, M. (1996). Students as map makers: Creating choropleth maps. Journal
of Geography, 95, 168-170.
Schuurman, N. (2004). GIS: A Short Introduction. Maiden, MA: Blackwell
Publishing.
Schwandt, T. A. (2003). Three epistemological stances for qualitative inquiry -
Interpretivism, hermeneutics and social constructionism. In N. K. Denzin

284
& Y. S. Lincoln (Eds.), The Landscape of Qualitative Research -
Theories and Issues (pp. 292-331). London: Sage.
Seong, K. T. (1996). Interactive multimedia and GIS applications for teaching
school geography. International Research in Geographical and
Environmental Education, 5(3), 205-212.
Shields, M. K., & Behrman, R. E. (2000). Children and Computer Technology:
Analysis and Recommendations. The Future of Children, 10(2), 4-30.
Shulman, L. S. (1984). The practical and the eclectic: A deliberation on teaching
and educational research. Curriculum Inquiry, 14 (2), 183-200.
Skelly, C. (1996). GIS employment in Australia. GIS User, 17, 16-18.
Skrzecynski, C., & Russell, A. L. (1994). Focus on data: The role of the
introductory monologue in data collection. Phenomenography:
Philosophy and Practice Conference (pp. 367-379). Brisbane:
Queensland University of Technology.
Slater, F. (1995). Geography into the future. Geographical Education, 8(3), 4-6,
63.
Smaldino, S., E., & Muffoletto, R. (1997). The educational media experience in
teacher education. TechTrends, September, 37-40.
Smerdon, R. (2006). Geography: The Queensland Experience. International
Research In Geographical And Environmental Education, 15(2), 166-
170.
Smith, A., & Hania, J. (2000). What is GIS? New Zealand Journal of Geography,
October, 5-10.
Smith, J. K. (1983). Quantitative versus qualitative research: An attempt to
clarify the issue. Educational Researcher, 12(3), 6-13.
Smith, J. K. (1986). Closing down the conversation: The end of the quantitative-
qualitative debate among educational inquirers. Educational Researcher,
15(1), 4-12.
Smith, M. L. (1987). Publishing qualitative research. American Educational
Research Journal, 24(2), 173-183.
Smith, M. W. (1985). Ethics in focus groups: A few concerns. Qualitative Health
Research, 5(4), 478-486.
Smith, R. E. (1993). Psychology. New York: West Publishing.
Solvberg, A. M. (2003). Computer-related control beliefs and motivation: A

285
panel study. Journal of Research on Technology in Education, 35(4), 473.
Spencer, C. (2005). Place Attachment, Place Identity and the Development of the
Child’s Self-Identity: Searching the Literature to Develop an Hypothesis.
International Research In Geographical And Environmental Education,
14(4), 305-309.
Stoltman, J. P. (1997). The International Charter on Geographical Education:
Setting the Curriculum Standard. Journal of Geography, 96(1), 32-39.
Subrahmanyan, K., Krant, R. E., Greenfield, P. M., & Gross, E. F. (2000). The
impact of home computer use on children's activities and development.
The Future of Children, 10(2), 123-144.
Sui, D. Z. (1995). A pedagogic framework to link GIS to the intellectual core of
geography. Journal of Geography, 94(6), 578-591.
Svensson, L. (1997). Theoretical foundations of phenomenography. Higher
Education Research and Development, 16(2), 159-171.
Tamagno, B. (2000). Working with the KGIs. Interaction, June, 25.
Tasmania, D. o. E. (2003). Latrobe High School recognised in the AURISA 2003
GIS in Schools National Competition. Retrieved 27/06/05, from www.e-
magine.education.tas.gov.au/Newsletter2003/html/24November.htm
Thomae, H. (1999). The nomothetic-idiographic issue: Some roots and recent
trends. International Journal of Group Tensions, 28 (1-2), 187-215(29).
Thompson, G. (1999). "I thought the world was flat like the map showed it!"
Social Education, 63, 269-271.
Trifonoff, K. (1995). Going beyond location: Thematic maps in the early
elementary grades. Journal of Geography, 94, 368-374.
Trigwell, K. (2000). A phenomenographic interview on phenomenography. In J.
Bowden & E. Walsh (Eds.), Phenomenography (pp. 62-82). Melbourne:
RMIT.
Trinder, J. (1996). Trends in education in Surveying and Geomatics. The
Australasian Geographic Information Systems Applications Journal, 16,
42-44.
Turner, J. & Beeson, P. (2003). Technology moves up a notch in post-primary
Geography. EQ Australia, 1, 40-42.
Underwood, J. (2004). Research into Information and Communications
Technologies: where now? Technology, Pedagogy and Education, 13(2),

286
135-145.
van der Schee, J., Leat, D. & Vankan, L. (2006). Effects of the Use of Thinking
Thinking Through Geography Strategies. International Research In
Geographical And Environmental Education, 15(2), 124-133.
Victoria, D. o. E. (2004). VCE Unit 1 Geography - Place and change. Retrieved
28/02/2007 from http://www.distance.vic.edu.au/
/vcesubjectinfo/pdf/ge011intro.pdf
Walford, R. (1987). The indispensible place of geography in a balanced general
education. In P. Bailey & T. Binns (Eds.), A Case for Geography. (pp. 59-
63). Letchworth, Herts.: The Geographical Association.
Walters, E. (2001-2002). The use of qualitative research methods in student
affairs: A practical guide. Journal of College Student Retention:
Research, Theory and Practice, 3(2), 183-194.
Ward, M. (2003). Local area fieldwork. Interaction, 31(June), 33-35.
Wartella, E. A. & Jennings, N. (2000). Children and computers: New
Technology - Old Concerns. The Future of Children, 10(2), 31-43.
West, B. A. (1998a). GIS in the secondary school: Some possible outcomes.
Geographical Education, 11, 12-17.
West, B. A. (1998b). Acid sulfate soils and community involvement in the
Pimpama River catchment. Natural Resource Management, 1(2), 5-8.
West, B. A. (1999). Geographical literacy and the role of GIS. New Zealand
Journal of Geography, (April), 24-25.
West, B. A. (2003a). Conceptions of the 'Role of Geography in the Future' held
by Year 12 Geography students. Geographical Education, 16, 26-32.
West, B. A. (2003b). Student attitudes and the impact of GIS on thinking skills
and motivation. Journal of Geography, 102(6), 267-274.
West, B. A. (2004a). GIS goes to high school. Position Magazine, 13(October),
24-27.
West, B. A. (2004b). The contribution of a geographical education to regional
sustainability. Geographical Education, 17, 15-23
West, B. A. (2006a). Conceptions of "productive classroom environment" held
by middle school students at one independent Queensland school.
Australian Journal of Middle Schooling, 6(3), 8-14.
West, B. A. (2006b). Towards and understanding of the conceptions of GIS held

287
by Senior Geography students in Queensland. Paper presented at the
Changes in Geographical Education: Past, Present & Future, Brisbane.
West, B. A. (2006c). Conceptions of the "Role of Geography in their Futures"
held by Senior Geography students in one independent Queensland
school. International Research in Geographical and Environmental
Education, 15(2), 104-124.
West, B. A. (2006d). Forum: Issues affecting the adoption of GIS within
Australian and New Zealand schools. International Research in
Geographical and Environmental Education, 15(3), 255-258.
Wiegand, P. (2001). Geographic Information Systems (GIS) in education.
International Research in Geographical and Environmental Education,
10(1), 68-71.
Wiegand, P. (2003). School Students' Understanding of Choropleth Maps:
Evidence from Collaborative Mapmaking Using GIS. Journal of
Geography, 102(6), 234-242.
Wilder, A., Brinkerhoff, J. D., & Higgins, T. M. (2003). Geographic Information
Technologies + Project Based Science: A Contextualised Professional
Development Approach. Journal of Geography, 102(6), 255-266.
Will new teachers be prepared to teach in a digital age? A national survey on
information technology in teacher education. (1999). Retrieved 11/10/03,
2003, from www.milkenexchange.org
Williamson, G. R. & Prosser, S. (2002). Action research: Politics, ethics and
participation. Journal of Advanced Nursing, 40 (5), 587-593.
Willmett, A. T. (2002). Conceptions of 'Sexuality Education' held by a group of
primary school teachers in the Catholic Arch-Diocese of Brisbane.
Unpublished PhD, Queensland University of Technology, Brisbane.
Willmett, A. T., & Lidstone, J. (2003). Synergetic focus groups: Attending to
risks and dilemmas associated with researching sensitive, personal or
controversial issues in education. Paper presented at the AARE
Conference, Auckland.
Wilson, V. (1997). Focus groups: a useful qualitative method for educational
research. British Educational Research Journal, 23(2), 209-224.
Yates, G. (2000). Active learning strategies using images in Geography.
Geographical Education, 13, 68-76.

288
Young, E. (1995). Once a geographer, always a geographer: Perspectives on the
future of our discipline. Geographical Education, 8(3), 7-8, 63.
Zandvliet, D. B. & Fraser, B. J. (2004). Learning environments in information
and communications technology classrooms. Technology, Pedagogy &
Education, 13(1), 97-123.