conceptual groundwater flow model of the mekelle paleozoic ...the environmental isotopes 18o and 2h...
TRANSCRIPT
Conceptual groundwater flow model of the MekellePaleozoic–Mesozoic sedimentary outlier and surroundings(northern Ethiopia) using environmental isotopesand dissolved ions
Ermias Girmay & Tenalem Ayenew & Seifu Kebede &
Mulugeta Alene & Stefan Wohnlich & Frank Wisotzky
Abstract A wide range of lithologic units and tectonicdisturbances by cross-cutting faults and folds has resultedin the quite complex hydrogeological setting of thesedimentary outlier and its surroundings at Mekelle,northern Ethiopia. The environmental isotopes of oxygenand hydrogen and patterns of dissolved ion concentrationsin the groundwater, coupled with understanding of thethree-dimensional geological framework, are used toconceptualize the groundwater flow model and recharge–discharge mechanisms in the area. In agreement with thepiezometric-surface map, recharge areas are determined tobe the highlands (northwest, north, east and south of thestudy area), characterized by relatively more depleted
isotopic compositions, higher d-excess, and lower con-centrations of dissolved ions in the groundwater samples;the narrow major river valleys of Giba, Illala, Chelekotand Faucea Mariam are discharge areas. The groundwaterdivide between the Tekeze and the Denakil basinscoincides with the surface-water divide line of these twobasins. In most cases, groundwater feeds the semi-perennial streams and rivers in the area. However, isotopicsignatures in some wells indicate that there are localitieswhere river flow and seepage from micro-dams locallyfeed the adjacent aquifers. The lithostratigraphic, geomor-phologic, isotopic and hydrochemical settings observed inthis study indicate that three groundwater flow systems(shallow/local, intermediate and deep/semi-regional) canexist here. Tritium data indicate that the groundwater inthe study area has generally short residence time and isdependent on modern precipitation.
Keywords Ethiopia . Fractured rocks . Groundwaterflow . Environmental isotopes . Hydrochemistry
Introduction
Groundwater occurs in geological formations and theearth is basically heterogeneous. Hence, knowledgeabout how these earth materials are formed and thechanges they have undergone is vital in order tounderstand the distribution of geological materials ofvarying hydraulic conductivity and porosity (Fetter1994; Ayenew and Alemayehu 2001; Alemayehu 2006;Newman et al. 2010; Singhal and Gupta 2010; Kebede2013). Such geological information in a multifacetedhard-rock and tectonic setting should, therefore, come asa priori while trying to conceptualize the groundwaterflow system and hydrogeochemical characteristics of anarea. Expertise should include the ability to understandinformation about metamorphic and sedimentary faciesand architecture, the tectonic setting and the genesis ofaquifers. This helps to interpret results from isotopic,hydrochemical and other hydrogeological data, to fill data
Received: 14 April 2014 /Accepted: 16 February 2015Published online: 19 March 2015
* Springer-Verlag Berlin Heidelberg 2015
Electronic supplementary material The online version of this article(doi:10.1007/s10040-015-1243-4) contains supplementary material,which is available to authorized users.
E. Girmay ()) : T. Ayenew : S. Kebede :M. AleneSchool of Earth Sciences, Addis Ababa University,P.O. Box 1176, Addis Ababa, Ethiopiae-mail: [email protected]
T. Ayenewe-mail: [email protected]
S. Kebedee-mail: [email protected]
M. Alenee-mail: [email protected]
E. Girmay : S. Wohnlich : F. WisotzkyLehrstuhl Angewandte Geologie, Ruhr-Universität Bochum,GebäudeNA 3/125, Universitätsstraβe 150, 44801, Bochum,Germany
S. Wohnliche-mail: [email protected]
F. Wisotzkye-mail: [email protected]
Hydrogeology Journal (2015) 23: 649–672DOI 10.1007/s10040-015-1243-4

gaps, and ultimately to establish more precise conceptualhydrogeological models.
With the development of mass spectrometers in themiddle of the twentieth century and their improvements inaccuracy and efficiency during the rest of the century,measurements of isotopes and chemical tracers in ground-water became commonplace and the focus has now turnedmore toward movement of groundwater (Sanford et al.2011). The atmospheric nuclear testing in the late 1950sand early 1960s also created a convenient input signal totrace movement of tritium through the shallow hydro-sphere during the rest of the century (Begemann andLibby 1957). At about that time (1961), the InternationalAtomic Energy Agency (IAEA) began measurements for aGlobal Network of Isotopes in Precipitation (Aggarwalet al. 2005).
Although multiple measurements of various tracers areusually desired, this is ultimately limited by availableresources. It is also not always obvious a priori whichof the measurements will aid in interpreting flow andreaction processes that occur in an aquifer, and whichwill be redundant. Therefore, Bexperience^ and anunderstanding of the geologic, mineralogic, and hydro-logic framework are keys for making appropriatedecisions (Hunkeler et al. 1999; Schmidt et al. 2004;Newman et al. 2010); for it is only through thecomplete interrogation of the hydrogeological informa-tion contained in the isotope data that one can obtaininsights into the processes of groundwater systemswhich otherwise would be difficult or even impossibleto obtain (Verhagen 1991; Newman et al. 2010).
The environmental isotopes 18O and 2H are widelyused as tracers to investigate various hydrogeologicalprocesses (such as origin, movement, mixing, evaporation,groundwater recharge and basin hydrology) to improveour understanding of the modern hydrological cycle atlocal, regional and global scales (Clark and Fritz 1997;Rietti-Shati et al. 2000; Kendall and Coplen 2001; Gibsonet al. 2005). These studies provide base-level information, asthe 18O and 2H isotopes systematically vary after evapora-tion from seawater, condensation during atmospheric trans-portation of water vapor, and evaporation from the surfacewater and groundwater after precipitation.
In addition, many problems related to groundwatersupply and quality, as well as groundwater-dependentecosystems require some understanding of the timescalesof flow and transport. For example, increased concernabout the vulnerabilities of ‘young’ groundwaters (lessthan ~1,000 years) to overexploitation, contamination, andland use/climate change effects are driving the need tounderstand flow and transport processes that occur overdecadal, annual, or shorter time scales. Some usefultracers for such purpose include tritium, noble gasses(including tritium/3He dating and 39Ar), chlorofluorocar-bons (CFCs), and sulphur hexafluoride (SF6). It isimportant to note that no one tracer can be used to dateall types of groundwater because the range of ages is sobroad and use of a suite of tracers is typically recom-mended (Newman et al. 2010).
A number of research projects in the Ethiopian RiftValley and the Blue Nile Basins have shown that thepatterns of δ18O, δ2H and 3H isotopic compositions inwater can provide a useful tool for hydrological investi-gations (Darling et al. 1996; Ayenew 1998, 2003; Kebede2004; Kebede et al. 2005, 2008; Kebede and Travi 2012;Demilie et al. 2006, 2007; Yitbarek et al. 2012; Furi et al.2011; Weldesenbet 2012), while there have been nosimilar studies undertaken in the Tekeze and Denakilbasins, where the study area resides.
Accordingly, these environmental isotopes (18O, 2Hand 3H) and hydrochemical data coupled with geologicalexpertise of the study area have been employed toconstruct conceptual groundwater flow models. Withinthese models, the current study has tried to solve manycontroversial ideas forwarded in the previous studies(Beyth and Shachnai 1970; Chernet and Eshete 1982;Hussein 2000; Yihdego 2003; Zereay 2007; FWWDSE/Federal Water Works Design and Supervision Enterprise2007; Gebreyohannes 2009; DH-consult 2010) regardingthe groundwater flow dynamics within these sedimentaryoutlier of Mekelle and its close surroundings.
Study area
Ethiopia can be divided into four major physiographicregions widely known as the Western Plateau, theSoutheastern Plateau, the Main Ethiopian Rift and theAfar Depression. The Ethiopian Plateau is underlain atdepth by Precambrian rocks which are considered to be acontinuation of two folded belts, the Mozambique belt andthe Arabian-Nubian Shield. The Precambrian basement iscovered for the most part by glacial and marine sedimentsof Permian to Paleocene period and Tertiary volcanicrocks with related sediments (EIGS/Ethiopian Institute ofGeological Survey 1996).
The study area is found in the northern part of theWestern Ethiopian Plateau. It is geographically locatedbetween 38°48′–40°23′ east longitudes and 12°55′–14°17′north latitudes. It builds the western shoulder of the RedSea-Afar Rift at the northern verge of the East African RiftSystem, and portrays the surface-water divide of theTekeze River Basin (tributary of the Nile Basin) and theDenakil Basin (Fig. 1). It comprises successions of diverselithologic formations and tectonic structures of differentorientation. There are deep river gorges intruding into thehighland plateau that are oriented either in the E–W orNNE–SSW directions. Elevation within the study arearanges between 1,250 masl (meters above sea level) and3,200 masl.
The area is characterized by a semi-arid climate anduni-modal type of rainfall (rainy months: June, July andAugust). The air temperature varies from an average dailyminimum of 6 °C in the Amba Alaje, Hagere Selam andAtsbi highlands to an average daily maximum of 33 °C inthe western and eastern lowland areas. Similarly, theannual average precipitation varies between 450 mm inthe lowland areas and 970 mm in the highland areas.
650
Hydrogeology Journal (2015) 23: 649–672 DOI 10.1007/s10040-015-1243-4

Ethiopia
ca
b
Fig. 1 Location map of a major geological features of Ethiopia, and b the watershed boundary and c major rivers of the study area
651
Hydrogeology Journal (2015) 23: 649–672 DOI 10.1007/s10040-015-1243-4

Using the WetSpass model, Gebreyohannes (2009) hasestimated a mean annual potential evapotranspiration anda mean annual groundwater recharge of 462 and 37 mmrespectively for the Giba river basin (Fig. 1).
Similar to other arid and semiarid regions, most riversand springs in the study area significantly decrease theirdischarge to unreliable levels (for domestic and small-scale irrigation water supply) starting from the early ormid months of the dry season and usually they becomedry in the late months of the dry season. Therefore, handdug and machine drilled wells are the main source ofwater supply for domestic, irrigation and industrial uses inalmost all parts of the area. Lowering of groundwaterlevels, significant decrease of wells discharge and highsalinity and hardness of the groundwater are the commonchallenges in the area.
Most previous studies in the area made use ofconventional hydrogeological techniques with an overallgoal of solving the immediate water demand problems ofMekelle town. They focused on delineating and quantify-ing potential groundwater localities to propose new wellfields, while less attention was given to scientific aspectsrelated to the groundwater flow dynamics and recharge–discharge mechanisms of the area. However, there werestill some attempts in the previous studies that forwardedcontradicting ideas based on scarce data.
Generally, there are two diverging views regarding thegroundwater flow system in the area. Some studies havereached the conclusion that only local flow systems existwhere precipitation is the main source of recharge anddischarge takes place through springs and rivers (Beythand Shachnai 1970; Gebreyohannes 2009; DH-consult2010). Other studies argue for the presence of inter-catchment/inter-basin groundwater transfers, with thepossibility of intermediate to regional flow-system devel-opment (Chernet and Eshete 1982; FWWDSE/FederalWater Works Design and Supervision Enterprise 2007).On the other hand, some local investigations around theAynalem well-field (close to Mekelle town) concluded thatthere can only be localized inter-catchment groundwatertransfers through the N–S trending regional faults thatcross the locality (Hussein 2000; Yihdego 2003; Zereay2007). In almost all of these previous investigations, thenecessity of doing more detailed analysis of thelithostratigraphic and structural settings and applicationof isotope hydrological and hydrochemical techniques arehighlighted.
Materials and methods
Preparation of a geological map and cross sectionsThis study was started by making an exhaustive survey ofprevious geological knowledge in the study area(Gebreyohannes et al. 2009; DH-consult 2010).Afterwards, new field observations, lithologic logs, geo-physical data, digital satellite image interpretations andvisual observations from Google Earth Map wereemployed to produce a modified geological map (scale
1:50000) and geological cross-sections (vertical exagger-ation of 5.0).
For the interpretation of satellite images, four LandsatETM digital images (path numbers 168 and 169; rawnumbers 50 and 51) of the years 1999 and 2000 have beenmosaiced and processed in the ENVI software version 4.2.The color composite image of bands 7-4-2 was selected todelineate the lithologic contacts. Directional filters at 45and 135° with a sun angle of 45° were used to enhance themajor lineament directions and to plot the major geolog-ical structures. The US Geological Survey (USGS) SRTMdata of 90-m resolution is used to produce a shaded digitalelevation model of the area and to extract profile sectionsalong selected lines for producing the geological crosssections. The data of lithologic contacts, structures and thegeological cross-sections extracted in the ENVI softwarehave been exported in shape files to the ArcGIS v10software and shaded with standard shades and symbols.Finally, geological map layouts for print are prepared inthe ArcGIS environment.
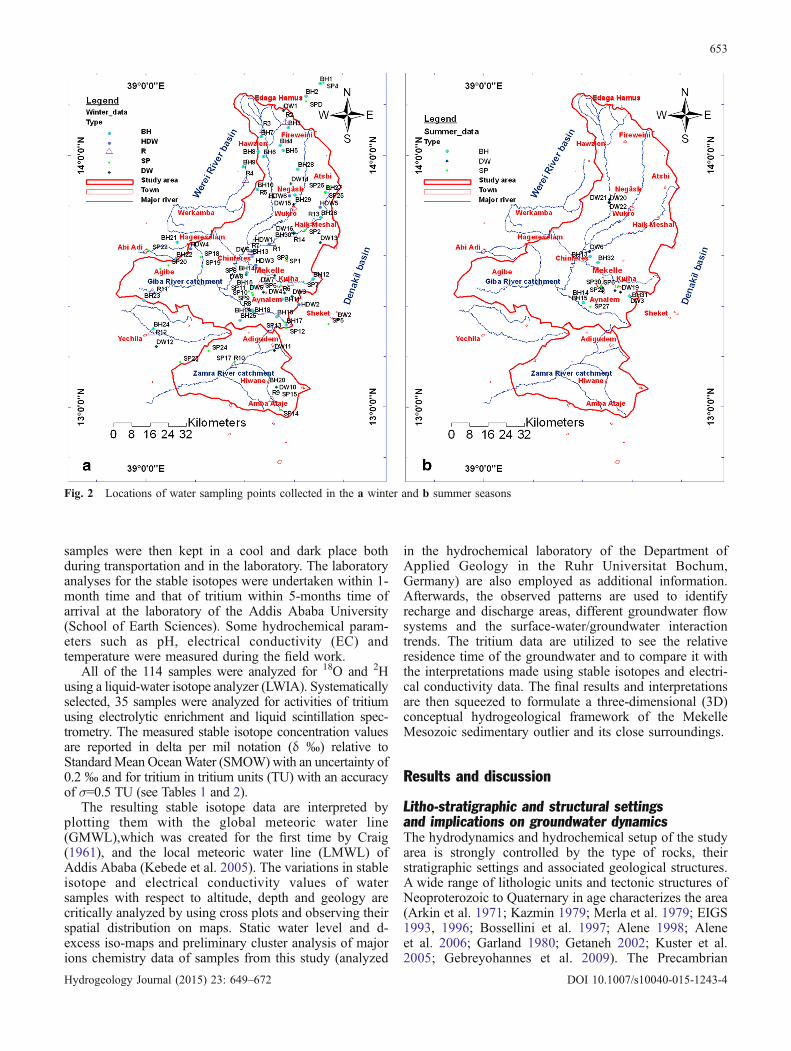
Sampling and analytical proceduresIn this research, a total of 114 water samples werecollected (25 samples from deep wells, with depth 90–350 mbgl (meters below ground level); 36 samples fromshallow wells, with depth 45–80 mbgl; 6 samples fromhand dug wells, with depth 12–18 mbgl; 33 samples fromsprings, and 14 samples from river water). Twenty of thesamples were collected at the end of the rainy season (endof August to early October, 2012; summer samples) andthe other 94 samples were collected in April, 2013 (closeto the end of the dry season; winter samples). Thelocations of water sampling points (Fig. 2) were system-atically selected based on the following criteria:
& In a way to have representation from different rockformations in the stratigraphic column
& From recharge and discharge areas, and along expectedgroundwater circulation paths
& From their location with respect to different geologicstructures (such as faults and dolerite sills and dykes)
The water samples from wells were collected eitherfrom the pumped water (continuously functioning handpumps and submersible pumps) or from the artesian flowon some wells. Spring and river water samples werecollected from points of strong flow and no interferencefrom humans or animals, facing opposite to the flowdirections.
From each sampling point, two separate samples(300 ml and 2 L clean, inert plastic bottles with rubberstoppers) were collected for the laboratory analysis ofstable isotopes and tritium respectively. The samplingbottles were repeatedly rinsed with the water to besampled and then completely filled leaving no space forair. The rubber stoppers were tightly closed and plasteredin order to avoid isotopic exchange with the air. The water
652
Hydrogeology Journal (2015) 23: 649–672 DOI 10.1007/s10040-015-1243-4
samples were then kept in a cool and dark place bothduring transportation and in the laboratory. The laboratoryanalyses for the stable isotopes were undertaken within 1-month time and that of tritium within 5-months time ofarrival at the laboratory of the Addis Ababa University(School of Earth Sciences). Some hydrochemical param-eters such as pH, electrical conductivity (EC) andtemperature were measured during the field work.
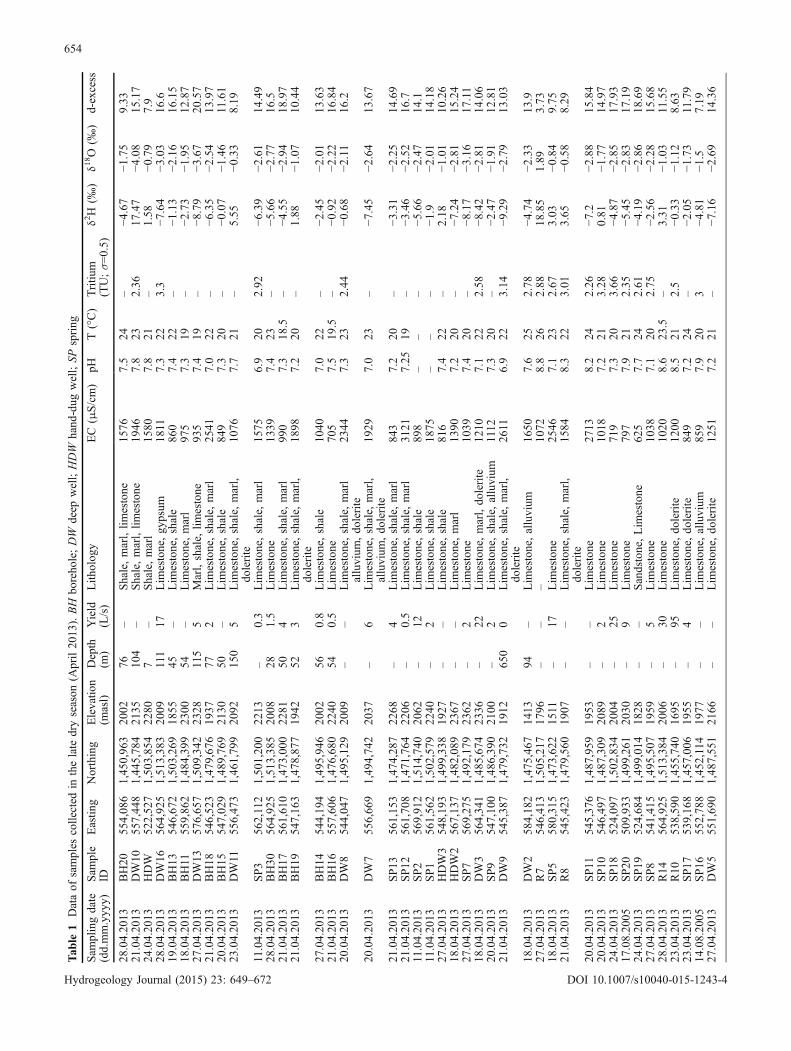
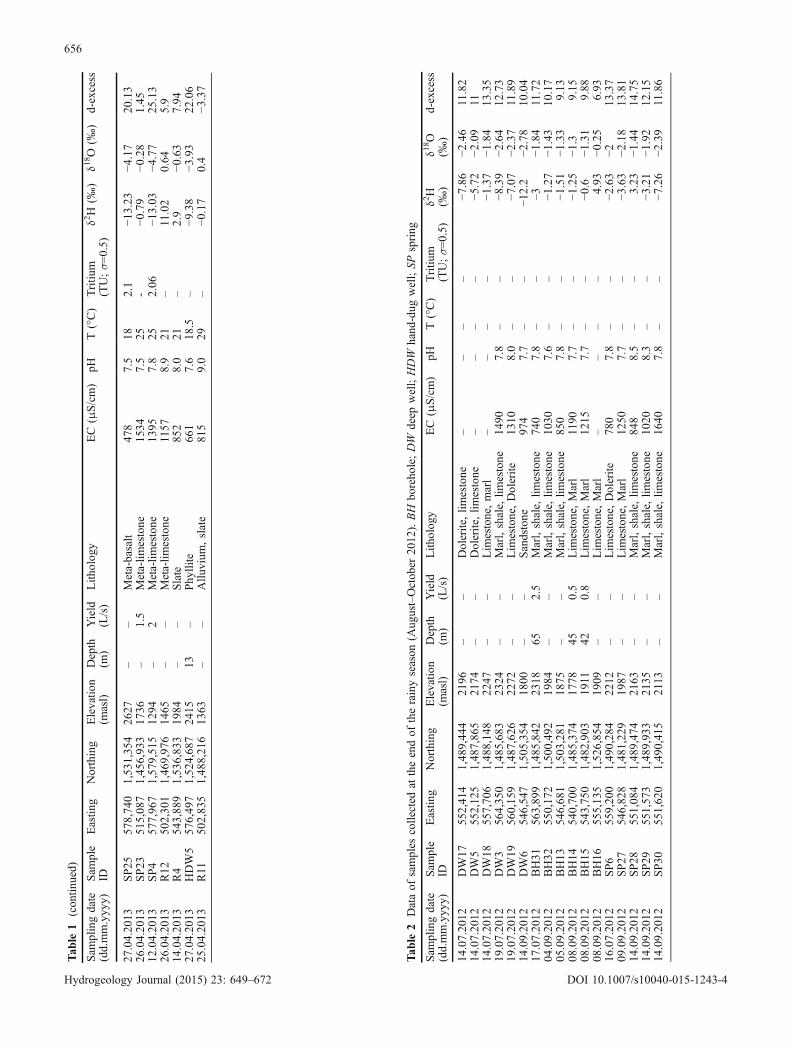
All of the 114 samples were analyzed for 18O and 2Husing a liquid-water isotope analyzer (LWIA). Systematicallyselected, 35 samples were analyzed for activities of tritiumusing electrolytic enrichment and liquid scintillation spec-trometry. The measured stable isotope concentration valuesare reported in delta per mil notation (δ ‰) relative toStandardMean OceanWater (SMOW)with an uncertainty of0.2 ‰ and for tritium in tritium units (TU) with an accuracyof σ=0.5 TU (see Tables 1 and 2).
The resulting stable isotope data are interpreted byplotting them with the global meteoric water line(GMWL),which was created for the first time by Craig(1961), and the local meteoric water line (LMWL) ofAddis Ababa (Kebede et al. 2005). The variations in stableisotope and electrical conductivity values of watersamples with respect to altitude, depth and geology arecritically analyzed by using cross plots and observing theirspatial distribution on maps. Static water level and d-excess iso-maps and preliminary cluster analysis of majorions chemistry data of samples from this study (analyzed
in the hydrochemical laboratory of the Department ofApplied Geology in the Ruhr Universitat Bochum,Germany) are also employed as additional information.Afterwards, the observed patterns are used to identifyrecharge and discharge areas, different groundwater flowsystems and the surface-water/groundwater interactiontrends. The tritium data are utilized to see the relativeresidence time of the groundwater and to compare it withthe interpretations made using stable isotopes and electri-cal conductivity data. The final results and interpretationsare then squeezed to formulate a three-dimensional (3D)conceptual hydrogeological framework of the MekelleMesozoic sedimentary outlier and its close surroundings.
Results and discussion
Litho-stratigraphic and structural settingsand implications on groundwater dynamicsThe hydrodynamics and hydrochemical setup of the studyarea is strongly controlled by the type of rocks, theirstratigraphic settings and associated geological structures.A wide range of lithologic units and tectonic structures ofNeoproterozoic to Quaternary in age characterizes the area(Arkin et al. 1971; Kazmin 1979; Merla et al. 1979; EIGS1993, 1996; Bossellini et al. 1997; Alene 1998; Aleneet al. 2006; Garland 1980; Getaneh 2002; Kuster et al.2005; Gebreyohannes et al. 2009). The Precambrian
Fig. 2 Locations of water sampling points collected in the a winter and b summer seasons
653
Hydrogeology Journal (2015) 23: 649–672 DOI 10.1007/s10040-015-1243-4
Tab
le1
Dataof
samples
collected
inthelate
dryseason
(April20
13).BH
boreho
le;DW
deep
well;HDW
hand
-dug
well;SP
spring
Sam
plingdate
(dd.mm.yyy
y)Sam
ple
IDEastin
gNorthing
Elevatio
n(m
asl)
Depth
(m)
Yield
(L/s)
Lith
olog
yEC(μS/cm)
pHT(°C)
Tritiu
m(TU;σ=0.5)
δ2H
(‰)
δ18O
(‰)
d-excess
28.04.20
13BH20
554,08
61,45
0,96
320
0276
–Shale,marl,lim
estone
1576
7.5
24–
−4.67
−1.75
9.33
21.04.20
13DW10
557,44
81,44
5,78
421
3510
4–
Shale,marl,lim
estone
1946
7.8
232.36
17.47
−4.08
15.17
24.04.20
13HDW
522,52
71,50
3,85
422
807
–Shale,marl
1580
7.8
21–
1.58
−0.79
7.9
28.04.20
13DW16
564,92
51,51
3,38
320
09111
17Lim
estone,gy
psum
1811
7.3
223.3
−7.64
−3.03
16.6
19.04.20
13BH13
546,67
21,50
3,26
918
5545
–Lim
estone,shale
860
7.4
22–
−1.13
−2.16
16.15
18.04.20
13BH11
559,86
21,48
4,39
923
0054
–Lim
estone,marl
975
7.3
19–
−2.73
−1.95
12.87
27.04.20
13DW13
576,65
71,50
9,34
223
28115
5Marl,shale,
limestone
935
7.4
19–
−8.79
−3.67
20.57
21.04.20
13BH18
546,52
31,47
9,67
619
3777
2Lim
estone,shale,
marl
2541
7.0
22–
−6.35
−2.54
13.97
20.04.20
13BH15
547,02
91,48
9,76
921
3050
–Lim
estone,shale
849
7.3
20–
−0.07
−1.46
11.61
23.04.20
13DW11
556,47
31,46
1,79
920
9215
05
Lim
estone,shale,
marl,
dolerite
1076
7.7
21–
5.55
−0.33
8.19
11.04.20
13SP3
562,112
1,50
1,20
022
13–
0.3
Lim
estone,shale,
marl
1575
6.9
202.92
−6.39
−2.61
14.49
28.04.20
13BH30
564,92
51,51
3,38
520
0828
1.5
Lim
estone
1339
7.4
23–
−5.66
−2.77
16.5
21.04.20
13BH17
561,61
01,47
3,00
022
8150
4Lim
estone,shale,
marl
990
7.3
18.5
–−4
.55
−2.94
18.97
21.04.20
13BH19
547,16
31,47
8,87
719
4252
3Lim
estone,shale,
marl,
dolerite
1898
7.2
20–
1.88
−1.07
10.44
27.04.20
13BH14
544,19
41,49
5,94
620
0256
0.8
Lim
estone,shale
1040
7.0
22–
−2.45
−2.01
13.63
21.04.20
13BH16
557,60
61,47
6,68
022
4054
0.5
Lim
estone
705
7.5
19.5
–−0
.92
−2.22
16.84
20.04.20
13DW8
544,04
71,49
5,12
920
09–
–Lim
estone,shale,
marl
alluvium
,dolerite
2344
7.3
232.44
−0.68
−2.11
16.2
20.04.20
13DW7
556,66
91,49
4,74
220
37–
6Lim
estone,shale,
marl,
alluvium
,dolerite
1929
7.0
23–
−7.45
−2.64
13.67
21.04.20
13SP13
561,15
31,47
4,28
722
68–
4Lim
estone,shale,
marl
843
7.2
20–
−3.31
−2.25
14.69
21.04.20
13SP12
561,70
81,47
1,76
422
06–
0.5
Lim
estone,shale,
marl
3121
7.25
19–
−3.46
−2.52
16.7
11.04.20
13SP2
569,91
21,51
4,74
020
62–
12Lim
estone,shale
898
––
–−5
.66
−2.47
14.1
11.04.20
13SP1
561,56
21,50
2,57
922
40–
2Lim
estone,shale
1875
––
–−1
.9−2
.01
14.18
27.04.20
13HDW3
548,19
31,49
9,33
819
27–
–Lim
estone,shale
816
7.4
22–
2.18
−1.01
10.26
18.04.20
13HDW2
567,13
71,48
2,08
923
67–
–Lim
estone,marl
1390
7.2
20–
−7.24
−2.81
15.24
27.04.20
13SP7
569,27
51,49
2,17
923
62–
2Lim
estone
1039
7.4
20–
−8.17
−3.16
17.11
18.04.20
13DW3
564,34
11,48
5,67
423
36–
22Lim
estone,marl,do
lerite
1210
7.1
222.58
−8.42
−2.81
14.06
20.04.20
13SP9
547,10
01,48
6,39
021
00–
2Lim
estone,shale,
alluvium
1112
7.3
20–
−2.47
−1.91
12.81
21.04.20
13DW9
545,38
71,47
9,73
219
1265
00
Lim
estone,shale,
marl,
dolerite
2611
6.9
223.14
− 9.29
−2.79
13.03
18.04.20
13DW2
584,18
21,47
5,46
714
1394
–Lim
estone,alluvium
1650
7.6
252.78
−4.74
−2.33
13.9
27.04.20
13R7
546,41
31,50
5,21
717
96–
––
1072
8.8
262.88
18.85
1.89
3.73
18.04.20
13SP5
580,31
51,47
3,62
215
11–
17Lim
estone
2546
7.1
232.67
3.03
−0.84
9.75
21.04.20
13R8
545,42
31,47
9,56
019
07–
–Lim
estone,shale,
marl,
dolerite
1584
8.3
223.01
3.65
−0.58
8.29
20.04.20
13SP11
545,37
61,48
7,95
919
53–
–Lim
estone
2713
8.2
242.26
−7.2
−2.88
15.84
20.04.20
13SP10
546,49
71,48
7,30
920
89–
2Lim
estone
1018
7.2
213.28
0.81
−1.77
14.97
24.04.20
13SP18
524,09
71,50
2,83
420
04–
25Lim
estone
719
7.3
203.66
−4.87
−2.85
17.93
17.08.20
05SP20
509,93
31,49
9,26
120
30–
9Lim
estone
797
7.9
212.35
−5.45
−2.83
17.19
24.04.20
13SP19
524,68
41,49
9,01
418
28–
–Sandstone,Lim
estone
625
7.7
242.61
−4.19
−2.86
18.69
27.04.20
13SP8
541,41
51,49
5,50
719
59–
5Lim
estone
1038
7.1
202.75
−2.56
−2.28
15.68
28.04.20
13R14
564,92
51,51
3,38
420
06–
30Lim
estone
1020
8.6
23.5
–3.31
−1.03
11.55
23.04.20
13R10
538,59
01,45
5,74
016
95–
95Lim
estone,do
lerite
1200
8.5
212.5
−0.33
−1.12
8.63
23.04.20
13SP17
539,16
81,45
7,00
619
55–
4Lim
estone,do
lerite
849
7.2
24–
−2.05
−1.73
11.79
14.08.20
05SP16
552,78
81,45
2,114
1977
––
Lim
estone,alluvium
859
7.9
203
−4.81
−1.5
7.19
27.04.20
13DW5
551,69
01,48
7,55
121
66–
–Lim
estone,do
lerite
1251
7.2
21–
−7.16
− 2.69
14.36
654
Hydrogeology Journal (2015) 23: 649–672 DOI 10.1007/s10040-015-1243-4

18.04.20
13DW4
560,97
01,48
7,14
522
81–
25Lim
estone,do
lerite
1263
7.3
203.45
−5.36
−2.38
13.68
27.04.20
13BH12
573,45
41,49
3,19
523
9358
5Dolerite
1160
7.3
19–
−7.82
−2.91
15.46
18.08.20
05SP24
527,61
31,46
1,67
221
56–
–Lim
estone,do
lerite
1577
7.3
23–
−7.12
−2.16
10.16
27.04.20
13R6
563,56
61,49
1,85
122
35–
–-
1375
7.7
19–
−0.92
−1.85
13.88
18.04.20
13SP6
559,19
51,49
0,43
122
17–
–Lim
estone,do
lerite
830
7.2
20–
−4.41
−2.12
12.55
26.04.20
13BH25
541,39
71,47
5,17
521
5050
2Dolerite
585
7.6
19–
−7.96
−2.69
13.56
13.04.20
13BH8
549,20
51,54
9,16
122
27–
–Sandstone
595
7.1
20–
−7.63
−2.71
14.05
13.04.20
13BH5
560,34
51,54
9,68
323
49–
–Sandson
e43
37.3
19–
−4.59
−3.03
19.65
13.04.20
13BH4
558,90
01,55
1,92
523
53–
–Sandstone
365
6.9
20–
−3.06
−2.79
19.26
27.04.20
13DW6
546,69
21,50
5,52
317
92–
–Sandstone
947
7.0
242.75
−20.39
−4.05
12.01
04.08.20
05DW1
560,52
81,56
7,19
328
3292
–Sandstone
767.8
193.21
−6.26
−3.39
20.86
28.04.20
13DW15
564,92
11,52
5,88
920
1816
86
Sandstone
336
7.3
21–
−0.27
−1.77
13.89
25.04.20
13SP22
501,35
51,50
5,84
716
76–
–Sandstone
998.1
21–
4.97
−0.59
9.69
25.04.20
13SP21
506,40
11,49
7,69
316
73–
45Sandstone
287
7.9
241.73
−17.3
−4.06
15.18
14.04.20
13R5
555,37
71,53
0,52
919
48–
–Sandstone
550
8.3
28–
9.63
0.45
6.03
12.04.20
13R2
561,29
71,56
2,50
325
36–
–Sandstone
225
7.2
20–
−3.9
−1.98
11.94
12.04.20
13SPD
570,43
21,57
1,34
728
32–
1Sandstone
185
7.4
18–
−7.9
−2.74
14.02
26.04.20
13DW12
504,611
1,46
3,56
016
10–
–Sandstone,alluvial
Allu
vual
sand
550
7.6
25–
−5.25
−210
.75
27.04.20
13BH26
576,82
81,52
0,25
721
5870
–Allu
vial
sand
,sand
ston
e,meta-vo
lcanics
569
7.6
21–
−9.41
−3.74
20.51
27.04.20
13R13
573,86
41,51
8,87
12116
––
Allu
vial
sand
,Sandstone
481
9.2
24.5
–−1
.45
−2.38
17.59
11.04.20
13HDW1
554,03
11,50
8,59
918
9912
–Marl,lim
estone
1070
6.9
212.94
2.28
−1.36
13.16
14.04.20
13BH10
549,00
41,53
2,48
621
2142
–Sandstone/tillite
290
7.6
21–
−1.9
−2.03
14.34
13.04.20
13BH7
550,69
31,55
5,711
2320
93–
Tillite
760
7.9
202.43
−18.62
−4.15
14.58
13.04.20
13BH6
551,60
61,54
7,08
522
47–
–Sandstone/tillite
395
7.2
19–
−6.62
−2.9
16.58
12.04.20
13BH3
562,45
31,55
9,82
225
7850
–Sandstone/tillite
169
7.2
19–
−4.79
−2.39
14.33
13.04.20
13R3
551,44
61,55
8,81
423
34–
2Sandstone,tillite,
Allu
vial
sand
920
8.5
26–
−3.03
−1.74
10.89
11.04.20
13R1
555,83
81,50
9,27
319
06–
–Marl,lim
estone
1008
8.0
25–
7.37
− 0.44
10.89
28.04.20
13HDW6
563,00
91,52
9,71
620
63–
–Sandstone,tillite
754
7.5
22–
−2.61
−2.34
16.11
24.04.20
13HDW4
519,59
51,50
6,50
225
305
–Basalt
564
7.2
17–
−2.25
−2.24
15.67
21.04.20
13SP15
558,28
31,44
4,110
2116
––
Sandstone,basalt
530
7.7
30–
−11.74
−3.23
14.1
21.04.20
13SP14
558,91
21,43
5,75
027
03–
–Basalt
297
8.2
152.73
−11.39
−3.65
17.81
21.04.20
13R9
555,45
01,44
0,59
925
16–
13Basalt,Sandstone
567
8.8
252.43
−4.65
−2.59
16.07
25.04.20
13BH22
513,20
41,50
2,111
2637
401.5
Basalt/m
udston
e43
67.9
17–
−9.2
−2.96
14.48
25.04.20
13BH21
513,77
91,50
9,48
225
6260
–Basalt/m
udston
e43
77.4
17–
−3.53
−2.28
14.71
28.04.20
13BH29
565,42
41,53
0,15
92118
501
Meta-do
lomite
927
7.6
22–
−5.73
−2.53
14.51
28.04.20
13BH28
566,63
01,54
1,53
824
8745
2Meta-sediment,meta-
volcanics
825
7.8
20–
−9.84
−2.96
13.84
27.04.20
13BH27
578,85
61,53
1,35
426
3840
1.2
Meta-basalt
467
7.5
171.92
−13.69
−3.4
13.51
26.04.20
13BH24
503,28
11,47
1,41
615
1845
1.5
Phy
llite
967
7.3
27–
0.53
−1.56
13.01
25.04.20
13BH23
499,16
11,48
4,00
414
5448
2Phy
llite
1827
7.2
27–
−4.33
−2.01
11.75
14.04.20
13BH9
542,66
21,54
2,59
520
8485
–Slate
795
7.5
21–
−7.67
−3.12
17.29
12.04.20
13BH2
570,33
71,57
3,55
627
7165
–Phy
llite
610
7.5
162.06
−8.34
−4.61
28.54
12.04.20
13BH1
576,54
41,57
9,09
813
0067
–Slate
1560
7.0
202.12
−18.46
−4.88
20.58
28.04.20
13DW14
563,80
61,53
5,118
2333
––
Metabasic
605
7.4
193.18
−6.83
−2.8
15.57
27.04.20
13SP26
580,10
91,53
3,67
326
74–
–Phy
llite
435
7.9
181.97
−14.08
−3.82
16.48
Tab
le1
(con
tinued)
Sam
plingdate
(dd.mm.yyy
y)Sam
ple
IDEastin
gNorthing
Elevatio
n(m
asl)
Depth
(m)
Yield
(L/s)
Lith
olog
yEC(μS/cm)
pHT(°C)
Tritiu
m(TU;σ=0.5)
δ2H
(‰)
δ18O
(‰)
d-excess
655
Hydrogeology Journal (2015) 23: 649–672 DOI 10.1007/s10040-015-1243-4
Tab
le1
(con
tinued)
Sam
plingdate
(dd.mm.yyy
y)Sam
ple
IDEastin
gNorthing
Elevatio
n(m
asl)
Depth
(m)
Yield
(L/s)
Lith
olog
yEC(μS/cm)
pHT(°C)
Tritiu
m(TU;σ=0.5)
δ2H
(‰)
δ18O
(‰)
d-excess
27.04.20
13SP25
578,74
01,53
1,35
426
27–
–Meta-basalt
478
7.5
182.1
−13.23
−4.17
20.13
26.04.20
13SP23
515,08
71,45
6,93
317
36–
1.5
Meta-lim
estone
1534
7.5
25-
−0.79
−0.28
1.45
12.04.20
13SP4
577,96
71,57
9,51
512
94–
2Meta-lim
estone
1395
7.8
252.06
−13.03
−4.77
25.13
26.04.20
13R12
502,30
11,46
9,97
614
65–
–Meta-lim
estone
1157
8.9
21–
11.02
0.64
5.9
14.04.20
13R4
543,88
91,53
6,83
319
84–
–Slate
852
8.0
21–
2.9
−0.63
7.94
27.04.20
13HDW5
576,49
71,52
4,68
724
1513
–Phy
llite
661
7.6
18.5
–−9
.38
−3.93
22.06
25.04.20
13R11
502,83
51,48
8,21
613
63–
–Allu
vium
,slate
815
9.0
29–
−0.17
0.4
−3.37
Tab
le2
Dataof
samples
collected
attheendof
therainyseason
(Aug
ust–Octob
er20
12).BH
boreho
le;DW
deep
well;HDW
hand
-dug
well;SP
spring
Sam
plingdate
(dd.mm.yyy
y)Sam
ple
IDEastin
gNorthing
Elevatio
n(m
asl)
Depth
(m)
Yield
(L/s)
Lith
olog
yEC(μS/cm)
pHT(°C)
Tritiu
m(TU;σ=0.5)
δ2H
(‰)
δ18O
(‰)
d-excess
14.07.20
12DW17
552,41
41,48
9,44
421
96–
–Dolerite,lim
estone
––
––
−7.86
−2.46
11.82
14.07.20
12DW5
552,12
51,48
7,86
521
74–
–Dolerite,lim
estone
––
––
−5.72
−2.09
1114
.07.20
12DW18
557,70
61,48
8,14
822
47–
–Lim
estone,marl
––
––
−1.37
−1.84
13.35
19.07.20
12DW3
564,35
01,48
5,68
323
24–
–Marl,shale,
limestone
1490
7.8
––
−8.39
−2.64
12.73
19.07.20
12DW19
560,15
91,48
7,62
622
72–
–Lim
estone,Dolerite
1310
8.0
––
−7.07
−2.37
11.89
14.09.20
12DW6
546,54
71,50
5,35
418
00–
–Sandstone
974
7.7
––
−12.2
−2.78
10.04
17.07.20
12BH31
563,89
91,48
5,84
223
1865
2.5
Marl,shale,
limestone
740
7.8
––
–3−1
.84
11.72
04.09.20
12BH32
550,17
21,50
0,49
219
84–
–Marl,shale,
limestone
1030
7.6
––
−1.27
−1.43
10.17
05.09.20
12BH13
546,68
11,50
3,28
118
75–
–Marl,shale,
limestone
850
7.8
––
−1.51
−1.33
9.13
08.09.20
12BH14
540,70
01,48
5,37
417
7845
0.5
Lim
estone,Marl
1190
7.7
––
−1.25
−1.3
9.15
08.09.20
12BH15
543,75
01,48
2,90
319
1142
0.8
Lim
estone,Marl
1215
7.7
––
−0.6
−1.31
9.88
08.09.20
12BH16
555,13
51,52
6,85
419
09–
–Lim
estone,Marl
––
––
4.93
−0.25
6.93
16.07.20
12SP6
559,20
01,49
0,28
422
12–
–Lim
estone,Dolerite
780
7.8
––
−2.63
−213
.37
09.09.20
12SP27
546,82
81,48
1,22
919
87–
–Lim
estone,Marl
1250
7.7
––
−3.63
−2.18
13.81
14.09.20
12SP28
551,08
41,48
9,47
421
63–
–Marl,shale,
limestone
848
8.5
––
3.23
−1.44
14.75
14.09.20
12SP29
551,57
31,48
9,93
321
35–
–Marl,shale,
limestone
1020
8.3
––
−3.21
−1.92
12.15
14.09.20
12SP30
551,62
01,49
0,41
52113
––
Marl,shale,
limestone
1640
7.8
––
−7.26
−2.39
11.86
656
Hydrogeology Journal (2015) 23: 649–672 DOI 10.1007/s10040-015-1243-4

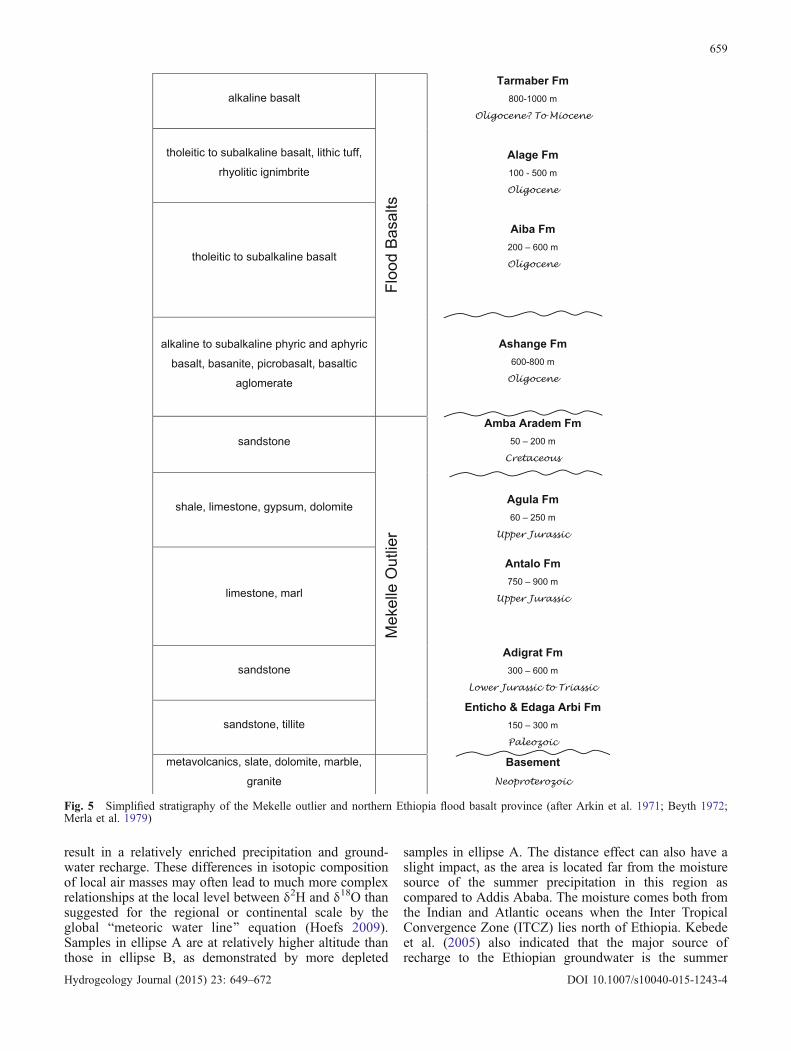
basement (metavolcanic and metasedimentary rocks) isexposed to the surface in the northern highland plateausaround Atsbi and Negash, and in the southwest aroundAgibe and Yechila (Fig. 3). In the northern part, they arefound at the same elevation with that of the adjacentPaleozoic-Mesozoic sedimentary rock formations becauseof the normal faults of the Wukro fault belt. The Negashsynclinorium and associated plutonic intrusion, theWukro, Mekelle, Chelekot and Fucea Mariam fault belts,and the dolerite sills and dykes around Mekelle town aresome among the megascopic geological structures in thearea (Fig. 3).
Mesozoic sedimentary rocks, belonging to marine andcontinental facies (from top to bottom: Amba ArademSandstone, Agula Shale, Antalo Limestone and Adigrat
Sandstone) and the underlying inter-fingered Paleozoicglacial sediments (Edaga Arbi Tillites and EntichoSandstone) form the Mekelle sedimentary outlier, whichis surrounded to the north, northeast and west by thebasement rocks, and to the south by the Tertiary floodbasalts (Figs. 3, 4 and 5). In the east, it is truncated by thenormal faults of the Afar rift margin, resulting inintermountain graben and horst structures until thecrystalline rocks appear again close to the center of therift. A significant portion of the study area is covered withthe sedimentary rocks.
Continuous joint sets of diverse orientations are alsocommon in all rock formations of the study area. Themajor fracture orientations are NNE–SSW and WNW–ESE with sub-vertical dips (Fig. 6). Isolated thin covers
Fig. 3 Geological map of the study area
657
Hydrogeology Journal (2015) 23: 649–672 DOI 10.1007/s10040-015-1243-4
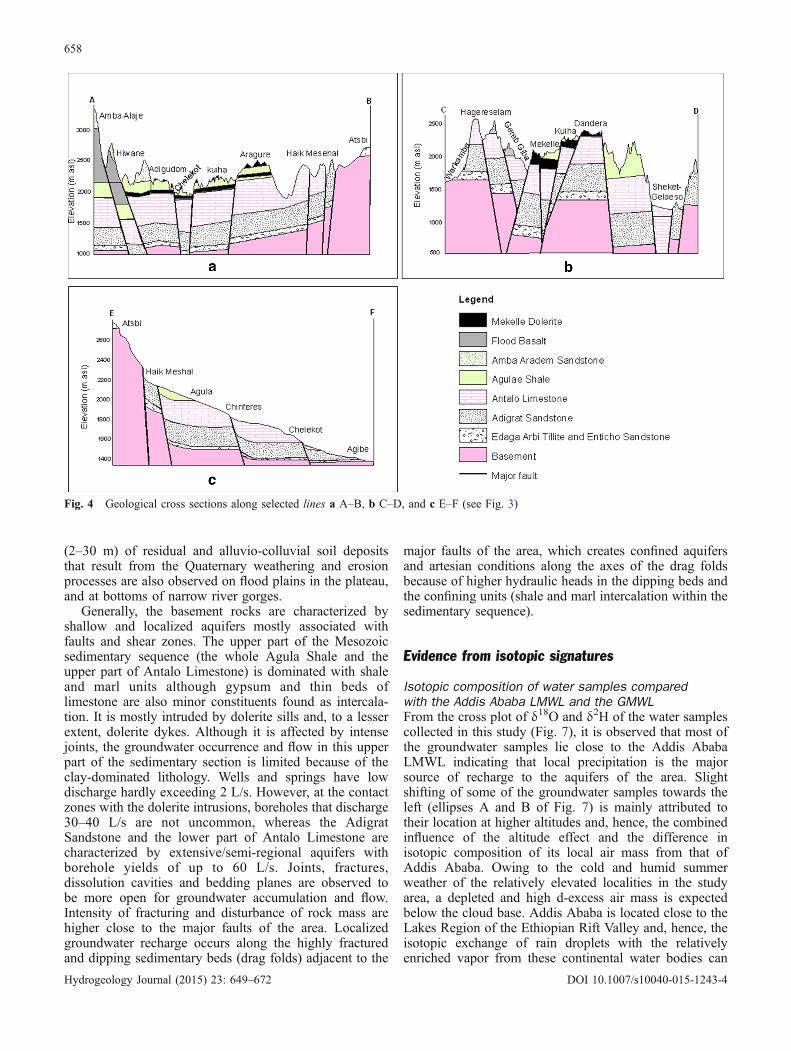
(2–30 m) of residual and alluvio-colluvial soil depositsthat result from the Quaternary weathering and erosionprocesses are also observed on flood plains in the plateau,and at bottoms of narrow river gorges.
Generally, the basement rocks are characterized byshallow and localized aquifers mostly associated withfaults and shear zones. The upper part of the Mesozoicsedimentary sequence (the whole Agula Shale and theupper part of Antalo Limestone) is dominated with shaleand marl units although gypsum and thin beds oflimestone are also minor constituents found as intercala-tion. It is mostly intruded by dolerite sills and, to a lesserextent, dolerite dykes. Although it is affected by intensejoints, the groundwater occurrence and flow in this upperpart of the sedimentary section is limited because of theclay-dominated lithology. Wells and springs have lowdischarge hardly exceeding 2 L/s. However, at the contactzones with the dolerite intrusions, boreholes that discharge30–40 L/s are not uncommon, whereas the AdigratSandstone and the lower part of Antalo Limestone arecharacterized by extensive/semi-regional aquifers withborehole yields of up to 60 L/s. Joints, fractures,dissolution cavities and bedding planes are observed tobe more open for groundwater accumulation and flow.Intensity of fracturing and disturbance of rock mass arehigher close to the major faults of the area. Localizedgroundwater recharge occurs along the highly fracturedand dipping sedimentary beds (drag folds) adjacent to the
major faults of the area, which creates confined aquifersand artesian conditions along the axes of the drag foldsbecause of higher hydraulic heads in the dipping beds andthe confining units (shale and marl intercalation within thesedimentary sequence).
Evidence from isotopic signatures
Isotopic composition of water samples comparedwith the Addis Ababa LMWL and the GMWLFrom the cross plot of δ18O and δ2H of the water samplescollected in this study (Fig. 7), it is observed that most ofthe groundwater samples lie close to the Addis AbabaLMWL indicating that local precipitation is the majorsource of recharge to the aquifers of the area. Slightshifting of some of the groundwater samples towards theleft (ellipses A and B of Fig. 7) is mainly attributed totheir location at higher altitudes and, hence, the combinedinfluence of the altitude effect and the difference inisotopic composition of its local air mass from that ofAddis Ababa. Owing to the cold and humid summerweather of the relatively elevated localities in the studyarea, a depleted and high d-excess air mass is expectedbelow the cloud base. Addis Ababa is located close to theLakes Region of the Ethiopian Rift Valley and, hence, theisotopic exchange of rain droplets with the relativelyenriched vapor from these continental water bodies can
Fig. 4 Geological cross sections along selected lines a A–B, b C–D, and c E–F (see Fig. 3)
658
Hydrogeology Journal (2015) 23: 649–672 DOI 10.1007/s10040-015-1243-4
result in a relatively enriched precipitation and ground-water recharge. These differences in isotopic compositionof local air masses may often lead to much more complexrelationships at the local level between δ2H and δ18O thansuggested for the regional or continental scale by theglobal Bmeteoric water line^ equation (Hoefs 2009).Samples in ellipse A are at relatively higher altitude thanthose in ellipse B, as demonstrated by more depleted
samples in ellipse A. The distance effect can also have aslight impact, as the area is located far from the moisturesource of the summer precipitation in this region ascompared to Addis Ababa. The moisture comes both fromthe Indian and Atlantic oceans when the Inter TropicalConvergence Zone (ITCZ) lies north of Ethiopia. Kebedeet al. (2005) also indicated that the major source ofrecharge to the Ethiopian groundwater is the summer
Fig. 5 Simplified stratigraphy of the Mekelle outlier and northern Ethiopia flood basalt province (after Arkin et al. 1971; Beyth 1972;Merla et al. 1979)
659
Hydrogeology Journal (2015) 23: 649–672 DOI 10.1007/s10040-015-1243-4

rainfall, and the distance and altitude effects are prominentfactors in depleting the precipitation in the northernhighlands of Ethiopia.
A similar leftward shift of samples SP18, SP19 and SP20compared with the others in ellipse B, while they are fromrelatively lower altitudes, indicates the presence of fastgroundwater flow along open fractures and dissolutioncavities in limestones from the Hagere Selam highlandstowards the sampling points. The mouths of these springsalso display accumulations of travertine deposits and thesprings emerge from highly fractured limestone terrains withobservable dissolution cavities. Shifting of the samples inellipses C and D of Fig. 7 parallel to the x-axis is related totheir location at low elevations and, hence, shows the
importance of local precipitation that has undergone isotopicexchange with the hot and dry air mass under the cloud basewhich should be heavily enriched.
The regression line for the river-water samples hasproduced a shallower slope than both the LMWL and theGMWL. This line is considered as a surface evaporationline (δ2H=4.47δ18O+6.42; R2=0.8) (Fig. 7). Four riversamples (R3, R6, R9 and R13) that are relatively moredepleted than the other river samples (Figs. 2a and 7)indicate that they have effluent sections around therespective sampling points. The shift of some groundwatersamples towards the enriched river samples values(polygon E in Fig. 7) signifies the influence of local rechargefrom nearby surface waters (microdams and rivers). Some
Fig. 6 Major faults and lineaments traced from satellite images
660
Hydrogeology Journal (2015) 23: 649–672 DOI 10.1007/s10040-015-1243-4
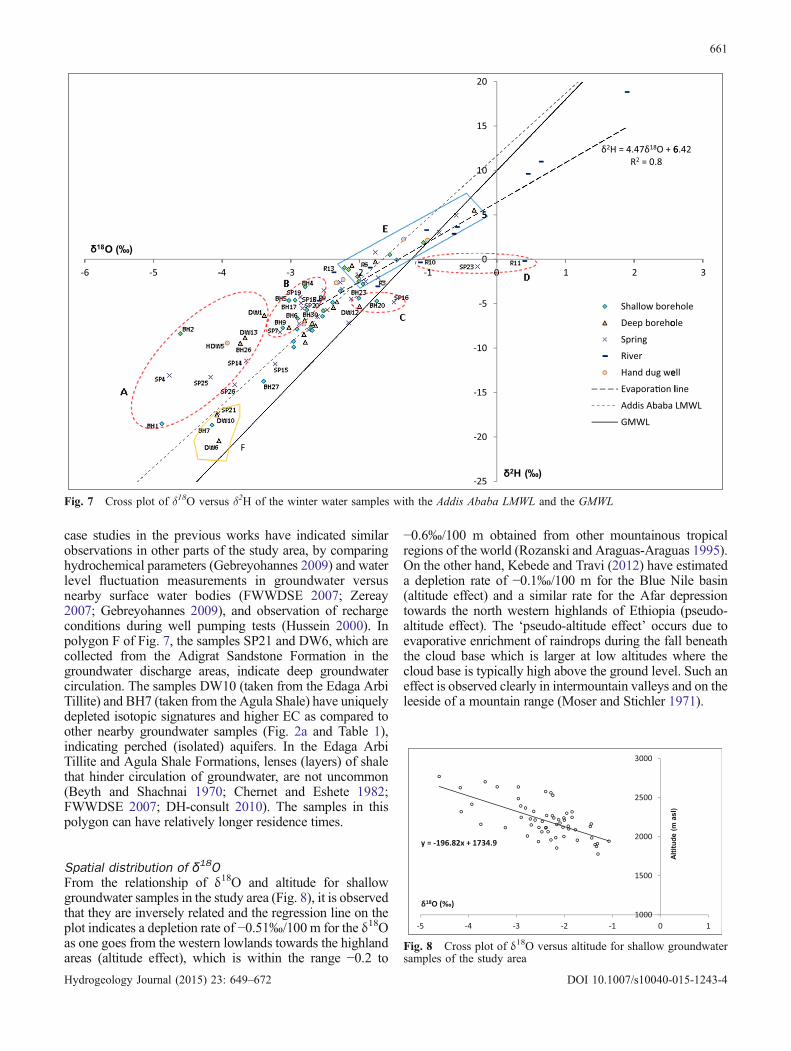
case studies in the previous works have indicated similarobservations in other parts of the study area, by comparinghydrochemical parameters (Gebreyohannes 2009) and waterlevel fluctuation measurements in groundwater versusnearby surface water bodies (FWWDSE 2007; Zereay2007; Gebreyohannes 2009), and observation of rechargeconditions during well pumping tests (Hussein 2000). Inpolygon F of Fig. 7, the samples SP21 and DW6, which arecollected from the Adigrat Sandstone Formation in thegroundwater discharge areas, indicate deep groundwatercirculation. The samples DW10 (taken from the Edaga ArbiTillite) and BH7 (taken from the Agula Shale) have uniquelydepleted isotopic signatures and higher EC as compared toother nearby groundwater samples (Fig. 2a and Table 1),indicating perched (isolated) aquifers. In the Edaga ArbiTillite and Agula Shale Formations, lenses (layers) of shalethat hinder circulation of groundwater, are not uncommon(Beyth and Shachnai 1970; Chernet and Eshete 1982;FWWDSE 2007; DH-consult 2010). The samples in thispolygon can have relatively longer residence times.
Spatial distribution of δ18OFrom the relationship of δ18O and altitude for shallowgroundwater samples in the study area (Fig. 8), it is observedthat they are inversely related and the regression line on theplot indicates a depletion rate of −0.51‰/100 m for the δ18Oas one goes from the western lowlands towards the highlandareas (altitude effect), which is within the range −0.2 to
−0.6‰/100 m obtained from other mountainous tropicalregions of the world (Rozanski and Araguas-Araguas 1995).On the other hand, Kebede and Travi (2012) have estimateda depletion rate of −0.1‰/100 m for the Blue Nile basin(altitude effect) and a similar rate for the Afar depressiontowards the north western highlands of Ethiopia (pseudo-altitude effect). The ‘pseudo-altitude effect’ occurs due toevaporative enrichment of raindrops during the fall beneaththe cloud base which is larger at low altitudes where thecloud base is typically high above the ground level. Such aneffect is observed clearly in intermountain valleys and on theleeside of a mountain range (Moser and Stichler 1971).
-6 -5
F
--4 -3 -2 -1
-25
-20
-15
-10
-5
0
5
10
15
20
0 1
δ2H = 4.47δ18O + 6R2 = 0.8
2
Shallow bore
Deep boreho
Spring
River
Hand dug we
Evapora�on l
Addis Ababa
GMWL
6.42
3
hole
ole
ell
line
LMWL
Fig. 7 Cross plot of δ18O versus δ2H of the winter water samples with the Addis Ababa LMWL and the GMWL
1000
1500
2000
2500
3000
-5 -4 -3 -2 -1 0 1
Fig. 8 Cross plot of δ18O versus altitude for shallow groundwatersamples of the study area
661
Hydrogeology Journal (2015) 23: 649–672 DOI 10.1007/s10040-015-1243-4

Therefore, the depletion in δ18O of the shallowgroundwater in the highland plateau of the study area(polygon A in Fig. 9) is due to recharge from already-depleted precipitation reaching these elevated groundareas due to the altitude effect. However, the enrichmentof shallow groundwater in the intermediate and lowerelevations (polygon B in Fig. 9) of the study area can beattributed to four reasons: recharge from already enrichedlocal rainfall, evaporation prior to recharge of the surfacerunoff, percolation of evaporated shallow groundwater todeeper aquifers which discharge in the western lowlandarea, and evaporation from the shallow groundwater inthese discharge areas. Further study on isotopic composi-tion of rainwater in different elevations of the study areacan help to verify which of these reasons can be the majorfactor.
For river water, as it moves towards the westernlowlands (Fig. 10), progressive enrichment is likely dueto continuous evaporation as the surface water flowsdownstream and further evaporation of the shallowgroundwater that feeds the base flow in the dischargeareas in the lower parts of the Giba and Zamra rivers andtheir tributaries (Fig. 3 and evaporation line in Fig. 7).
Shallow groundwater samples (BH1 and SP4) collectedat the foot of the Afar Rift escarpment have similarlydepleted δ18O values (−4.88 and −4.77‰) as those of thehighland groundwater (Figs. 2a and 11), while their ECvalues are higher (1,560 and 1,395 μS/cm) than measuredin the highland groundwater (<700 μS/cm) aroundEdaga Hamus and Atsbi (Fig. 2a). This result showsthat there is deep groundwater circulation with longerresidence time towards the Afar Depression through thedeep-seated faults of the rift escarpment. Further studyand additional data are needed to fully understand howthis deep groundwater flow system operates and itsresidence time.
On the western side of the highland plateau (in thelower Giba river catchment),two groundwater samples(SP21 and DW6) collected from the Adigrat Sandstonealso have depleted δ18O (−4.06 and −4.05‰) and similar
lower EC (287 and 947 μS/cm) as those of thegroundwater samples collected from the basement rocksand sandstones around Edaga Hamus and Atsbi highlands(Figs. 2a and 11). The area in between these localities iscovered with a thick (>1,000 m) shale-marl-limestonerock sequence of the Agula and Antalo formations (Figs. 3and 4) in which the average groundwater EC is 1,306μS/cm.This indicates that there is a deep groundwater flow mainlythrough the fractured sandstone formation with minimalleakage from the overlying more soluble rocks probablybecause of the aquitards (mudstones andmarls) at the base ofthe Antalo Limestone. This deep groundwater flows in thesouthwest direction parallel to the surface water flow of theGiba River. Clues of multi-layer aquifer systems withcontrasting groundwater quality were also found in someof the pervious works based on categorization of lithologicformations into hydrostratigraphic units (Chernet and Eshete1982; Gebreyohannes 2009), borehole geophysical logging(FWWDSE 2007; DH-consult 2010) and monitoring ofgroundwater level and yield of wells with different depths inthe Aynalem well-field (FWWDSE 2007).
Variability of δ18O and δ2H with depthWater samples taken from close proximity rivers, shallowwells (35–70 m depth) and deep wells (350–650 m depth)in four localities were also analyzed for stable isotopes(δ18O and δ2H) to identify similarity or difference of thegroundwater flow paths at different depths. The deep wellsfrom which samples BA^, BB^ and BC^ were collected areartesian wells. The result of Fig. 12 indicates that there is aclear segregation of stable isotope compositions withdepth in all the areas.
The groundwater samples from the deeper sources(A BDW6^, B BDW16^, C BDW9^) show relativelydepleted isotopic compositions as compared to their respec-tive shallow groundwater samples (a BBH13^, b BBH30^, cBBH18^, d BBH31^). The surface water samples (a′ BR7^, b′BR14^, c′ BR8^) show high enrichment of both δ18O andδ2H. These differing isotopic signatures reveal that there is
Fig. 9 Cross plot of δ18O versus electrical conductivity (EC) for shallow groundwater samples of the study area
662
Hydrogeology Journal (2015) 23: 649–672 DOI 10.1007/s10040-015-1243-4
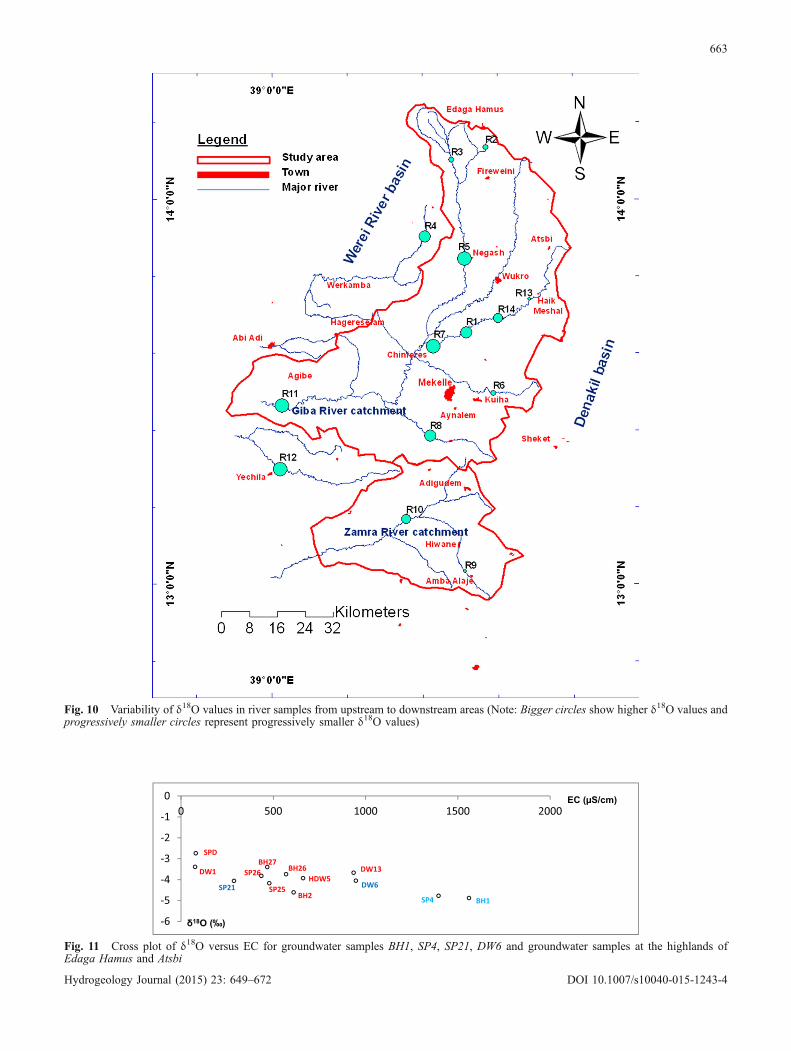
Fig. 10 Variability of δ18O values in river samples from upstream to downstream areas (Note: Bigger circles show higher δ18O values andprogressively smaller circles represent progressively smaller δ18O values)
-6
-5
-4
-3
-2
-1
00 500 1000 1500 2000
BH1SP4
HDW5
BH2
BH26
SP25
SP26BH27
SPD
DW1 DW13
DW6SP21
18O (‰)
EC (µS/cm)
Fig. 11 Cross plot of δ18O versus EC for groundwater samples BH1, SP4, SP21, DW6 and groundwater samples at the highlands ofEdaga Hamus and Atsbi
663
Hydrogeology Journal (2015) 23: 649–672 DOI 10.1007/s10040-015-1243-4
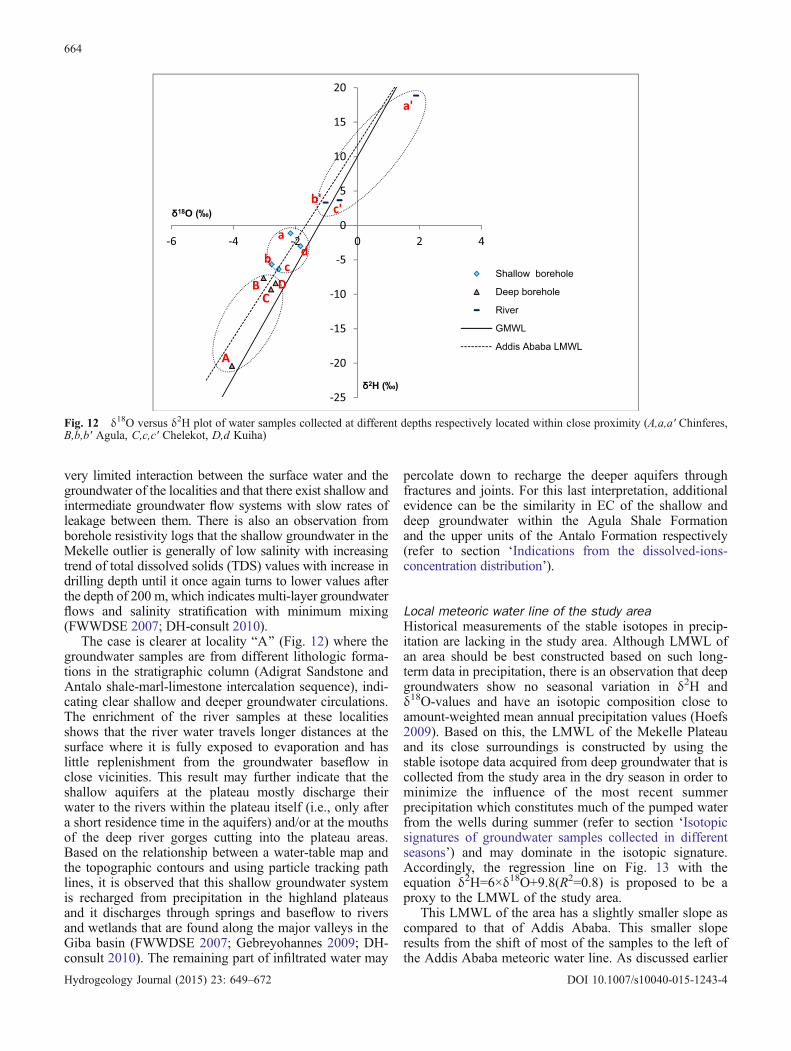
very limited interaction between the surface water and thegroundwater of the localities and that there exist shallow andintermediate groundwater flow systems with slow rates ofleakage between them. There is also an observation fromborehole resistivity logs that the shallow groundwater in theMekelle outlier is generally of low salinity with increasingtrend of total dissolved solids (TDS) values with increase indrilling depth until it once again turns to lower values afterthe depth of 200 m, which indicates multi-layer groundwaterflows and salinity stratification with minimum mixing(FWWDSE 2007; DH-consult 2010).
The case is clearer at locality BA^ (Fig. 12) where thegroundwater samples are from different lithologic forma-tions in the stratigraphic column (Adigrat Sandstone andAntalo shale-marl-limestone intercalation sequence), indi-cating clear shallow and deeper groundwater circulations.The enrichment of the river samples at these localitiesshows that the river water travels longer distances at thesurface where it is fully exposed to evaporation and haslittle replenishment from the groundwater baseflow inclose vicinities. This result may further indicate that theshallow aquifers at the plateau mostly discharge theirwater to the rivers within the plateau itself (i.e., only aftera short residence time in the aquifers) and/or at the mouthsof the deep river gorges cutting into the plateau areas.Based on the relationship between a water-table map andthe topographic contours and using particle tracking pathlines, it is observed that this shallow groundwater systemis recharged from precipitation in the highland plateausand it discharges through springs and baseflow to riversand wetlands that are found along the major valleys in theGiba basin (FWWDSE 2007; Gebreyohannes 2009; DH-consult 2010). The remaining part of infiltrated water may
percolate down to recharge the deeper aquifers throughfractures and joints. For this last interpretation, additionalevidence can be the similarity in EC of the shallow anddeep groundwater within the Agula Shale Formationand the upper units of the Antalo Formation respectively(refer to section ‘Indications from the dissolved-ions-concentration distribution’).
Local meteoric water line of the study areaHistorical measurements of the stable isotopes in precip-itation are lacking in the study area. Although LMWL ofan area should be best constructed based on such long-term data in precipitation, there is an observation that deepgroundwaters show no seasonal variation in δ2H andδ18O-values and have an isotopic composition close toamount-weighted mean annual precipitation values (Hoefs2009). Based on this, the LMWL of the Mekelle Plateauand its close surroundings is constructed by using thestable isotope data acquired from deep groundwater that iscollected from the study area in the dry season in order tominimize the influence of the most recent summerprecipitation which constitutes much of the pumped waterfrom the wells during summer (refer to section ‘Isotopicsignatures of groundwater samples collected in differentseasons’) and may dominate in the isotopic signature.Accordingly, the regression line on Fig. 13 with theequation δ2H=6×δ18O+9.8(R2=0.8) is proposed to be aproxy to the LMWL of the study area.
This LMWL of the area has a slightly smaller slope ascompared to that of Addis Ababa. This smaller sloperesults from the shift of most of the samples to the left ofthe Addis Ababa meteoric water line. As discussed earlier
-25
-20
-15
-10
-5
0
5
10
15
20
-6 -4 -2 0 2 4
Shallow borehole
Deep borehole
River
GMWL
Addis Ababa LMWL
δ18O (‰)
δ2H (‰)
a'
b'c'
da
b cB D
C
A
Fig. 12 δ18O versus δ2H plot of water samples collected at different depths respectively located within close proximity (A,a,a′ Chinferes,B,b,b′ Agula, C,c,c′ Chelekot, D,d Kuiha)
664
Hydrogeology Journal (2015) 23: 649–672 DOI 10.1007/s10040-015-1243-4
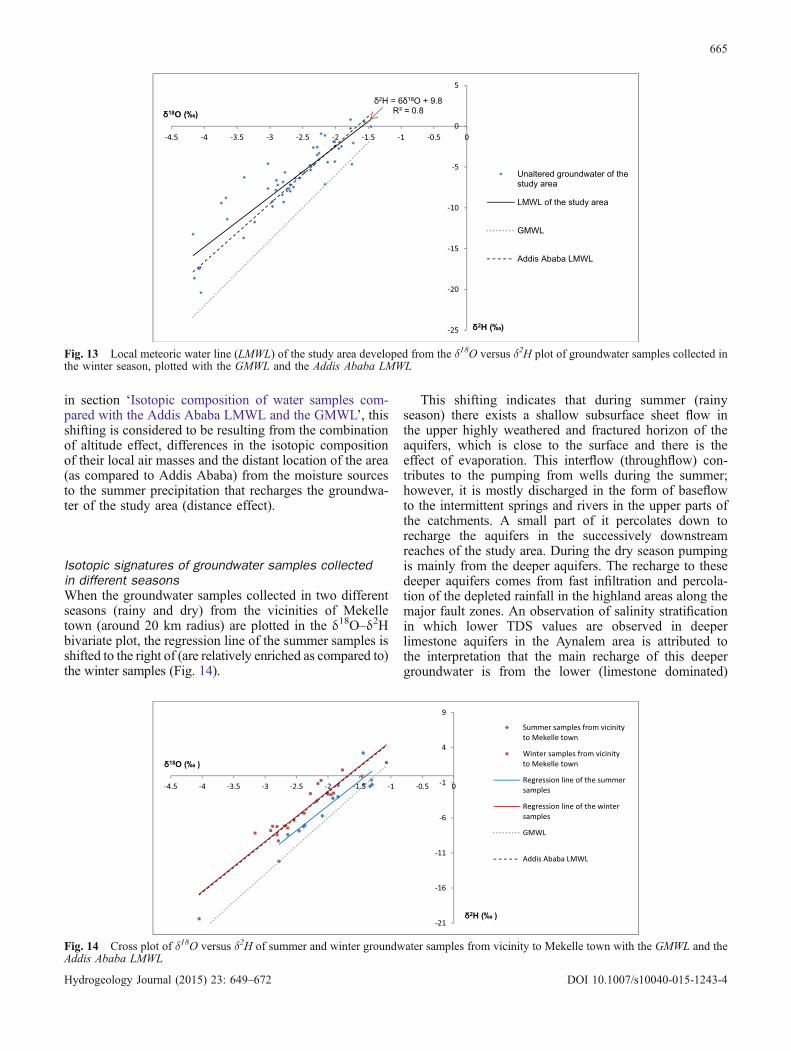
in section ‘Isotopic composition of water samples com-pared with the Addis Ababa LMWL and the GMWL’, thisshifting is considered to be resulting from the combinationof altitude effect, differences in the isotopic compositionof their local air masses and the distant location of the area(as compared to Addis Ababa) from the moisture sourcesto the summer precipitation that recharges the groundwa-ter of the study area (distance effect).
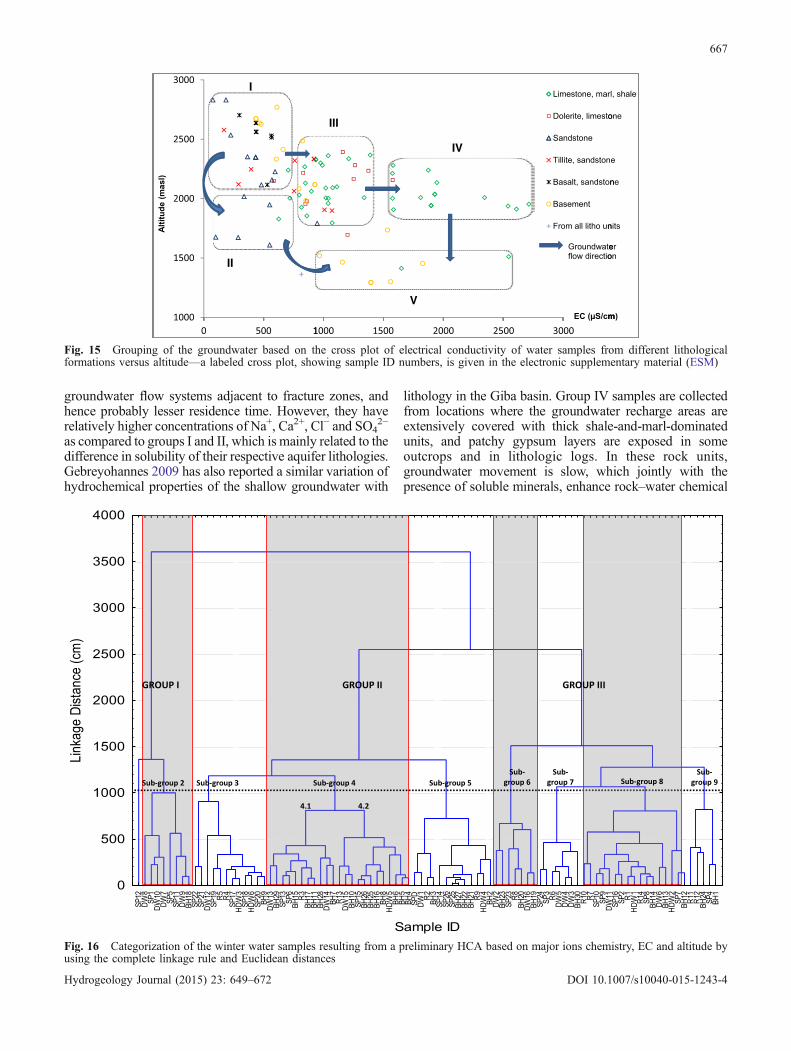
Isotopic signatures of groundwater samples collectedin different seasonsWhen the groundwater samples collected in two differentseasons (rainy and dry) from the vicinities of Mekelletown (around 20 km radius) are plotted in the δ18O–δ2Hbivariate plot, the regression line of the summer samples isshifted to the right of (are relatively enriched as compared to)the winter samples (Fig. 14).
This shifting indicates that during summer (rainyseason) there exists a shallow subsurface sheet flow inthe upper highly weathered and fractured horizon of theaquifers, which is close to the surface and there is theeffect of evaporation. This interflow (throughflow) con-tributes to the pumping from wells during the summer;however, it is mostly discharged in the form of baseflowto the intermittent springs and rivers in the upper parts ofthe catchments. A small part of it percolates down torecharge the aquifers in the successively downstreamreaches of the study area. During the dry season pumpingis mainly from the deeper aquifers. The recharge to thesedeeper aquifers comes from fast infiltration and percola-tion of the depleted rainfall in the highland areas along themajor fault zones. An observation of salinity stratificationin which lower TDS values are observed in deeperlimestone aquifers in the Aynalem area is attributed tothe interpretation that the main recharge of this deepergroundwater is from the lower (limestone dominated)
Fig. 13 Local meteoric water line (LMWL) of the study area developed from the δ18O versus δ2H plot of groundwater samples collected inthe winter season, plotted with the GMWL and the Addis Ababa LMWL
-21
-16
-11
-6
-1
4
9
-4.5 -4 -3.5 -3 -2.5 -2 -1.5 -1 -0.5 0
Summer samples from vicinityto Mekelle town
Winter samples from vicinityto Mekelle town
Regression line of the summersamples
Regression line of the wintersamples
GMWL
Addis Ababa LMWL
δ2H (‰ )
δ18O (‰ )
Fig. 14 Cross plot of δ18O versus δ2H of summer and winter groundwater samples from vicinity to Mekelle town with the GMWL and theAddis Ababa LMWL
665
Hydrogeology Journal (2015) 23: 649–672 DOI 10.1007/s10040-015-1243-4

units of the Antalo Formation that outcrop in the upstreamreaches of the adjacent Illala and Chelekot catchments,through the deep-seated fractures of the Mekelle andChelekot Fault Belts (FWWDSE 2007). It should also benoted that the regression line of the dry season ground-water samples collected from around Mekelle town fitswith the LMWL of Addis Ababa, showing the meteoricorigin of the deep groundwater in this area. As the area ischaracterized by semi-arid climate, groundwater-levelfluctuations can be significantly great during extendedperiods of drought and when there is over pumping fromwells. Therefore, efficient water-resources managementpractices such as frequent monitoring of groundwaterlevels, massive implementation of groundwater rechargingstructures and conjunctive use of surface water andgroundwater, are highly recommended for the area.
Indications from tritium dataActivity of tritium has been measured in 35 systematicallyselected water samples (Table 1) that are collected fromdeep wells, shallow wells, springs and rivers at differentlocations within the study area. The tritium activity valuesnarrowly range between 1.73 and 3.66 TU (σ=0.5 TU).The lowest and highest tritium activities were measured inSP21 (high-discharge spring emerging from the AdigratSandstone in the western lowland) and SP18 (high-discharge spring emerging from karstified limestone atthe lower part of the Antalo Limestone) respectively(Fig. 2). According to Clark and Fritz 1997, waters withtritium concentration from about 0.8 to 4 TU mayrepresent a mixture of water that contains components ofrecharge from before and after 1952 (<0.8 TU representrecharge prior to 1952; 5–15 TU indicate recharge after1987; 16–30 TU is indicative of recharge since 1953;>30 TU show probably of recharge in the 1960s or 1970s;>50 TU show predominantly recharge in the 1960s).Hence, the range observed in the study area (1.73–3.66 TU) indicates components of pre- and post-1952recharge. Having this and the background geological andgeomorphologic knowledge of the study area, one can atleast say that the lowest tritium activity in SP21 shows adeep circulation of relatively older groundwater (pre-1952) within the Adigrat Sandstone. And the highesttritium concentration in SP18 indicates more proportion ofpost-1952 recharged groundwater that flows from theHagere Selam Highlands towards the discharge areaaround the sampling point, along interconnected dissolu-tion cavities within the limestones of the area. In thesekarstic limestones, fastflow of groundwater can be evidentfrom recharge to discharge areas.
Most of the deep well samples (DW1, DW4, DW9,DW14 and DW16) display higher tritium activities(>3 TU) which shows that they are pumped from aquiferswith a greater proportion of young groundwater. Thesedeep wells are mostly located close to major fracturezones and, hence, acquire their groundwater recharge fromrecent precipitation which percolates fast along intercon-nected fractures. Generally, the probability of encountering
very old (tritium depleted) groundwater in the study area isunlikely. Relatively older groundwater can be expected onlytowards the Afar depression (east of the study area),wherethe Mesozoic sedimentary rocks are relatively thick andextensive and the deep-seated faults of the Afar rift can leadthe groundwater into very deep positions, where flow ratecan be slower.
As it is recommended by Newman et al. 2010, the ages ofsuch young groundwaters in the study area can be moreprecisely determined by using a suite of tracers such astritium, noble gasses (including tritium/3He dating and 39Ar),chlorofluorocarbons (CFCs), and sulphur hexafluoride(SF6). Measurement of 14C can also be required forgroundwater from the central part of the DenakilDepression. Future sample collection strategy for this datingpurpose should consider sampling from wells screened onlyin target aquifers, from systematically selected springs, fromriver points based on expected groundwater flow directions,and from rainfall events at different altitudes along selectedtransects.
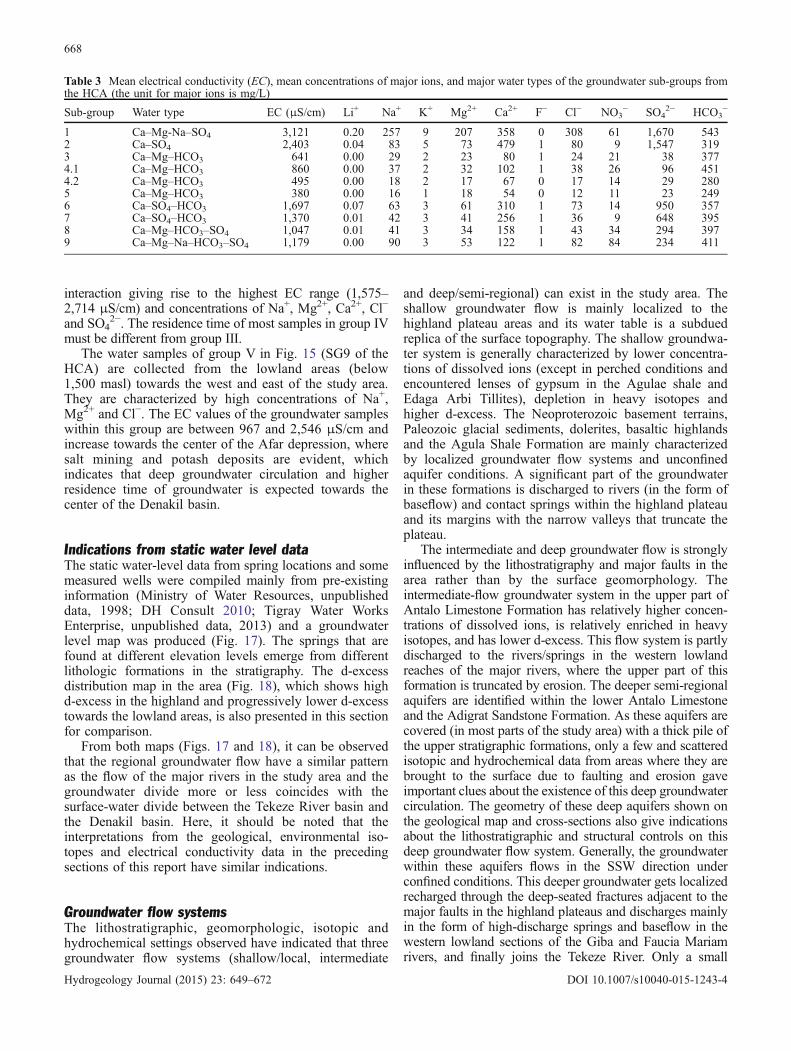
Indications from the dissolved-ions-concentrationdistributionFive groundwater groups have been identified from theEC–altitude–lithology cross plot (Fig. 15). A similarpattern of categories is also identified from a preliminaryhierarchical cluster analysis (HCA) based on major-ionchemistry (Li+, Na+, K+, Mg2+, Ca2+, HCO3
−, SO42−, F−,
Cl−, NO3−), EC and altitude of the water samples collected
in this study (Fig. 16). The groundwater samples from thehighland areas of Atsbi, Hawzien, Amba Alaje andHagere Selam lay within the low-EC/high-altitude range(group I in Fig. 15). Most samples in sub-group 4 (SG4)and SG5 of the HCA lay in this group and they arecharacterized by low concentrations of all the major ions.They were collected mainly from basalt, sandstone, tillite(sand dominated), dolerite and metavolcanic rock aquifers.This low EC (76–705 μS/cm) nature arises from theirlocation within the recharge area (low residence time) andthe lower aquifer solubility as compared to the carbonateand evaporate rocks in other recharge areas (refer lines797–817). The samples in group II of Fig. 15 (SG3 of theHCA) have an EC-values range of 99–719 μS/cm and lowconcentrations of all the major ions similar to group I, butthey are found at lower altitudes. They were collectedfrom highly fractured sandstone and limestone aquifers atlower altitudes around Wukro and Abi Adi, indicating fastgroundwater flow (see Table 3).
Groundwater samples of groups III and IV (Fig. 15) arelocated at similar altitude ranges (1,695–2,487 masl).Most samples in SG7 and SG8 of the HCA lay in groupIII, and that of SG2 and SG6 lay in group IV. They aredominantly from the Agula and upper Antalo formationsand from dolerite. Some of the samples were collectedfrom metasediments and clay dominated tillite aquifers.The difference in EC arises from the fact that the aquifersfrom which group III (795–1,390 μS/cm) samples werecollected are characterized by localized and shallow
666
Hydrogeology Journal (2015) 23: 649–672 DOI 10.1007/s10040-015-1243-4
groundwater flow systems adjacent to fracture zones, andhence probably lesser residence time. However, they haverelatively higher concentrations of Na+, Ca2+, Cl− and SO4
2−
as compared to groups I and II, which is mainly related to thedifference in solubility of their respective aquifer lithologies.Gebreyohannes 2009 has also reported a similar variation ofhydrochemical properties of the shallow groundwater with
lithology in the Giba basin. Group IV samples are collectedfrom locations where the groundwater recharge areas areextensively covered with thick shale-and-marl-dominatedunits, and patchy gypsum layers are exposed in someoutcrops and in lithologic logs. In these rock units,groundwater movement is slow, which jointly with thepresence of soluble minerals, enhance rock–water chemical
1000
1500
2000
2500
3000
0
I
II
500 11000
III
1500
V
2000
IV
2500 3000
Limestone, mar
Dolerite, limesto
Sandstone
Tillite, sandston
Basalt, sandston
Basement
From all litho un
Groundwate
flow directio
l, shale
one
e
ne
nits
er
on
Fig. 15 Grouping of the groundwater based on the cross plot of electrical conductivity of water samples from different lithologicalformations versus altitude—a labeled cross plot, showing sample ID numbers, is given in the electronic supplementary material (ESM)
SP12
DW8
SP1
DW10
DW7
SP5
SP11
DW9
BH18
SP22
SP21
DW12
SP19 R5 R4
SP17
HDW
3SP
18HD
W6
SP20
BH9
DW13
BH29
SP13 SP6
BH15 R3
BH17
BH11
BH28
DW14
BH7
R13
DW15
BH10
SP15
BH26
BH25
BH16
BH8
HDW
5BH
6BH
5BH
4SP
DDW
1 R2 BH3
SP14
SP26
SP25
BH27
BH22
BH21 R9
HDW
4BH
2DW
2BH
23SP
23 R8BH
20DW
16BH
19SP
24 SP3 R6
DW5
DW4
DW3
BH30 R10 R7
SP10 SP9
DW11
SP16 SP2 R1
HDW
1R1
4SP
8BH
14DW
6BH
13HD
W2
SP7
BH12 R11
R12
BH24 SP4
BH1
Sample ID
0
500
1000
1500
2000
2500
3000
3500
4000
Link
age
Dist
ance
(cm
)
Sub-group 2
GROUP I
Sub-group 3 Sub-group 4
4.1 4.2
Sub-group 5Sub-
group 6
GROUP II
Sub-group 7
GROUP III
Sub-group 8Sub-
group 9
Fig. 16 Categorization of the winter water samples resulting from a preliminary HCA based on major ions chemistry, EC and altitude byusing the complete linkage rule and Euclidean distances
667
Hydrogeology Journal (2015) 23: 649–672 DOI 10.1007/s10040-015-1243-4
interaction giving rise to the highest EC range (1,575–2,714 μS/cm) and concentrations of Na+, Mg2+, Ca2+, Cl−
and SO42−. The residence time of most samples in group IV
must be different from group III.The water samples of group V in Fig. 15 (SG9 of the
HCA) are collected from the lowland areas (below1,500 masl) towards the west and east of the study area.They are characterized by high concentrations of Na+,Mg2+ and Cl−. The EC values of the groundwater sampleswithin this group are between 967 and 2,546 μS/cm andincrease towards the center of the Afar depression, wheresalt mining and potash deposits are evident, whichindicates that deep groundwater circulation and higherresidence time of groundwater is expected towards thecenter of the Denakil basin.
Indications from static water level dataThe static water-level data from spring locations and somemeasured wells were compiled mainly from pre-existinginformation (Ministry of Water Resources, unpublisheddata, 1998; DH Consult 2010; Tigray Water WorksEnterprise, unpublished data, 2013) and a groundwaterlevel map was produced (Fig. 17). The springs that arefound at different elevation levels emerge from differentlithologic formations in the stratigraphy. The d-excessdistribution map in the area (Fig. 18), which shows highd-excess in the highland and progressively lower d-excesstowards the lowland areas, is also presented in this sectionfor comparison.
From both maps (Figs. 17 and 18), it can be observedthat the regional groundwater flow have a similar patternas the flow of the major rivers in the study area and thegroundwater divide more or less coincides with thesurface-water divide between the Tekeze River basin andthe Denakil basin. Here, it should be noted that theinterpretations from the geological, environmental iso-topes and electrical conductivity data in the precedingsections of this report have similar indications.
Groundwater flow systemsThe lithostratigraphic, geomorphologic, isotopic andhydrochemical settings observed have indicated that threegroundwater flow systems (shallow/local, intermediate
and deep/semi-regional) can exist in the study area. Theshallow groundwater flow is mainly localized to thehighland plateau areas and its water table is a subduedreplica of the surface topography. The shallow groundwa-ter system is generally characterized by lower concentra-tions of dissolved ions (except in perched conditions andencountered lenses of gypsum in the Agulae shale andEdaga Arbi Tillites), depletion in heavy isotopes andhigher d-excess. The Neoproterozoic basement terrains,Paleozoic glacial sediments, dolerites, basaltic highlandsand the Agula Shale Formation are mainly characterizedby localized groundwater flow systems and unconfinedaquifer conditions. A significant part of the groundwaterin these formations is discharged to rivers (in the form ofbaseflow) and contact springs within the highland plateauand its margins with the narrow valleys that truncate theplateau.
The intermediate and deep groundwater flow is stronglyinfluenced by the lithostratigraphy and major faults in thearea rather than by the surface geomorphology. Theintermediate-flow groundwater system in the upper part ofAntalo Limestone Formation has relatively higher concen-trations of dissolved ions, is relatively enriched in heavyisotopes, and has lower d-excess. This flow system is partlydischarged to the rivers/springs in the western lowlandreaches of the major rivers, where the upper part of thisformation is truncated by erosion. The deeper semi-regionalaquifers are identified within the lower Antalo Limestoneand the Adigrat Sandstone Formation. As these aquifers arecovered (in most parts of the study area) with a thick pile ofthe upper stratigraphic formations, only a few and scatteredisotopic and hydrochemical data from areas where they arebrought to the surface due to faulting and erosion gaveimportant clues about the existence of this deep groundwatercirculation. The geometry of these deep aquifers shown onthe geological map and cross-sections also give indicationsabout the lithostratigraphic and structural controls on thisdeep groundwater flow system. Generally, the groundwaterwithin these aquifers flows in the SSW direction underconfined conditions. This deeper groundwater gets localizedrecharged through the deep-seated fractures adjacent to themajor faults in the highland plateaus and discharges mainlyin the form of high-discharge springs and baseflow in thewestern lowland sections of the Giba and Faucia Mariamrivers, and finally joins the Tekeze River. Only a small
Table 3 Mean electrical conductivity (EC), mean concentrations of major ions, and major water types of the groundwater sub-groups fromthe HCA (the unit for major ions is mg/L)
Sub-group Water type EC (μS/cm) Li+ Na+ K+ Mg2+ Ca2+ F− Cl− NO3− SO4
2− HCO3−
1 Ca–Mg-Na–SO4 3,121 0.20 257 9 207 358 0 308 61 1,670 5432 Ca–SO4 2,403 0.04 83 5 73 479 1 80 9 1,547 3193 Ca–Mg–HCO3 641 0.00 29 2 23 80 1 24 21 38 3774.1 Ca–Mg–HCO3 860 0.00 37 2 32 102 1 38 26 96 4514.2 Ca–Mg–HCO3 495 0.00 18 2 17 67 0 17 14 29 2805 Ca–Mg–HCO3 380 0.00 16 1 18 54 0 12 11 23 2496 Ca–SO4–HCO3 1,697 0.07 63 3 61 310 1 73 14 950 3577 Ca–SO4–HCO3 1,370 0.01 42 3 41 256 1 36 9 648 3958 Ca–Mg–HCO3–SO4 1,047 0.01 41 3 34 158 1 43 34 294 3979 Ca–Mg–Na–HCO3–SO4 1,179 0.00 90 3 53 122 1 82 84 234 411
668
Hydrogeology Journal (2015) 23: 649–672 DOI 10.1007/s10040-015-1243-4

proportion of it percolates down to the fractured Paleozoicglacial sediments and the fractured upper part of thebasement rocks. These lower-most rock formations havemuch lower permeability. However, it is recommended herethat further study and additional data on these deep aquifersis still necessary in order to cross check the interpretationsforwarded by this study and/or to get more supportiveinformation.
Conclusion
The study area is characterized by heterogeneous lithologicunits and geological structures. In this research work, the
previous geological knowledge of the area has beenreviewed and new information from the field, satelliteimages, well lithologic logs and geophysical data areemployed to modify previous geological maps and constructnew geological cross-sections. These geological data areinteractively used with the isotopic signatures (δ18O, δ2Hand tritium), patterns of dissolved-ion concentrations andgroundwater-level data to (1) identify recharge and dischargeareas and the groundwater divide between the Tekeze andDenakil basins, (2) see the groundwater/surface-waterinteractions and (3) conceptualize the overall groundwaterflow system in the study area.
Based on the piezometric map, along with the relativelymore depleted isotopic compositions, higher d-excess, and
Fig. 17 Groundwater level map and groundwater flow directions based on spring positions and static water levels (SWL) in wells (Note:SWL values are in masl and they decrease from light gray regions towards the dark gray regions)
669
Hydrogeology Journal (2015) 23: 649–672 DOI 10.1007/s10040-015-1243-4
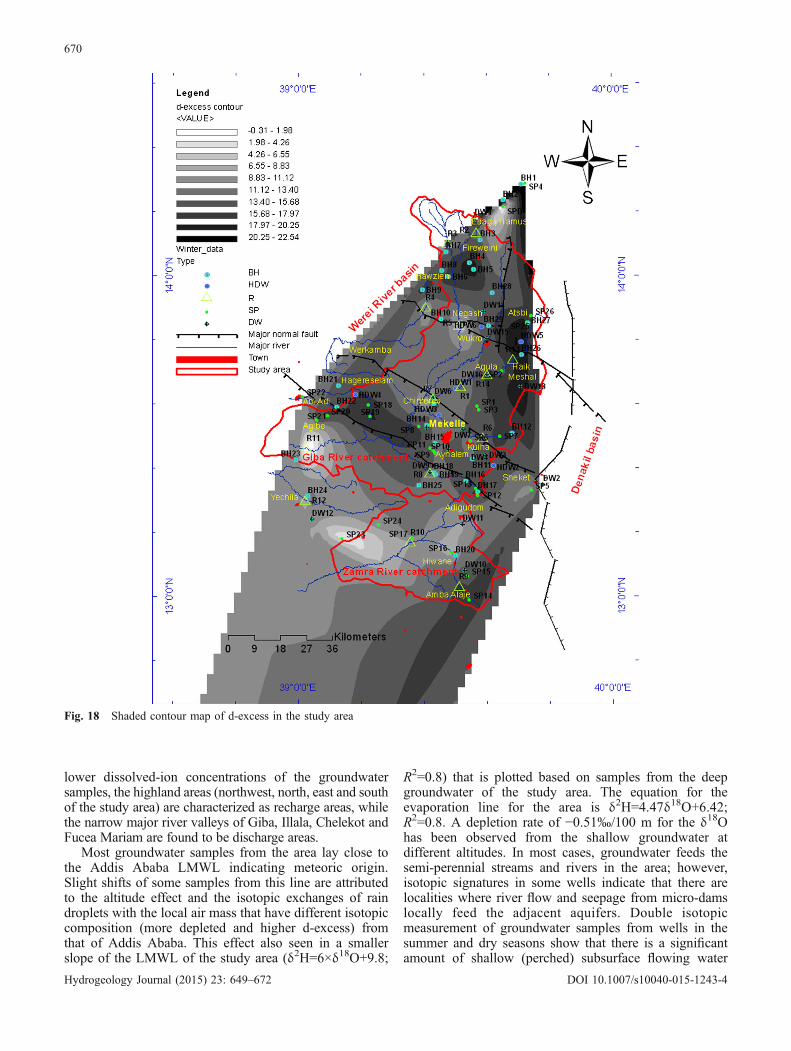
lower dissolved-ion concentrations of the groundwatersamples, the highland areas (northwest, north, east and southof the study area) are characterized as recharge areas, whilethe narrow major river valleys of Giba, Illala, Chelekot andFucea Mariam are found to be discharge areas.
Most groundwater samples from the area lay close tothe Addis Ababa LMWL indicating meteoric origin.Slight shifts of some samples from this line are attributedto the altitude effect and the isotopic exchanges of raindroplets with the local air mass that have different isotopiccomposition (more depleted and higher d-excess) fromthat of Addis Ababa. This effect also seen in a smallerslope of the LMWL of the study area (δ2H=6×δ18O+9.8;
R2=0.8) that is plotted based on samples from the deepgroundwater of the study area. The equation for theevaporation line for the area is δ2H=4.47δ18O+6.42;R2=0.8. A depletion rate of −0.51‰/100 m for the δ18Ohas been observed from the shallow groundwater atdifferent altitudes. In most cases, groundwater feeds thesemi-perennial streams and rivers in the area; however,isotopic signatures in some wells indicate that there arelocalities where river flow and seepage from micro-damslocally feed the adjacent aquifers. Double isotopicmeasurement of groundwater samples from wells in thesummer and dry seasons show that there is a significantamount of shallow (perched) subsurface flowing water
Fig. 18 Shaded contour map of d-excess in the study area
670
Hydrogeology Journal (2015) 23: 649–672 DOI 10.1007/s10040-015-1243-4
that is pumped in wells during the summer season. Thisinterflow (throughflow) disappears shortly after the rainyseason passed because it is mostly discharged to springsand rivers in the form of baseflow and partly percolatesdown to the deeper aquifers in downstream areas. Fivegroundwater groups have been identified from the EC–altitude–lithology cross plot. A similar pattern of categoriesis also identified from a preliminary hierarchical clusteranalysis (HCA) based on major-ion chemistry (Li+, Na+, K+,Mg2+, Ca2+, HCO3
−, SO42−, F−, Cl−, NO3
−), EC and altitudeof the water samples collected in this study.
The lithostratigraphic, geomorphologic, isotopic andhydrochemical settings observed in this study have indicatedthat three groundwater flow systems (shallow/local, inter-mediate and deep/semi-regional) can exist in the study area.The groundwater divide between the Tekeze and the Denakilbasins for all the three flow systems coincides with thesurface-water divide line of these two basins (i.e., the easternboundary of the study area represents the groundwater divideline between the basins). Within the Denakil basin theregional groundwater flow in the lower-most Mesozoicsediments is in the ESE direction.
Tritium data indicate that the groundwater in the studyarea has generally short residence time and is highlydependent on modern precipitation. The range observed inthe study area (1.73–3.66 TU) indicates components ofpre- and post-1952 recharge. Further study is recommendedusing a suite of tracers such as tritium, noble gasses(including tritium/3He dating and 39Ar), chlorofluorocarbons(CFCs), and sulphur hexafluoride (SF6) and
14C. This willhelp to determine more precisely the ages of the groundwa-ters in the area.
Acknowledgements The results presented here are part of ongoingPhD research work at Adiss Ababa University (Ethiopia) and RuhrUniversitat Bochum (Germany) and are supported by the GermanAcademic Exchange service (DAAD). Therefore, the authors wouldlike to acknowledge the financial, logistical and laboratory supportof these institutions. We also thank the three anonymous reviewersand the editors of the Hydrogeology Journal for their constructivecomments and suggestions.
References
Aggarwal PK, Froelich K, Gonfiantini R, Gat JR (2005) Isotopehydrology: a historical perspective from the IAEA. In:Aggarwal PK, Gar JR, Froelich KFO (eds) Isotopes in thewater cycle: past, present and future of a developing science.Springer, Berlin, 381 pp
Alemayehu T (2006) Groundwater occurrence in Ethiopia. AddisAbaba University Press, Addis Ababa, Ethiopia, 106 pp
Alene M (1998) Tectonomagmantic evolution of the Neoproterozoicrocks of the Mai Kenetal-Negasharea, northern Ethiopia. PhDThesis, University of Turin, Turin, Italy, 260 pp
Alene M, Jenkin GRT, Leng MJ, Darbyshire DPF (2006) TheTambien Group, Ethiopia: an early Cryogenian (ca. 800–735 Ma) Neoproterozoic sequence in the Arabian-Nubianshield. Precambrian Res 147:79–99
Arkin V, Beyth M, Dow DB, Levitte D, Haile T (1971) Geologicalmap of Mekele sheet (ND 37–11). Ethiopian Institute ofGeological Survey (EIGS), Addis Ababa, Ethiopia
Ayenew T (1998) The hydrogeological system of the Lake Districtbasin. Central Main Ethiopian Rift. PhD Thesis, Free Universityof Amsterdam, The Netherlands, 259 pp
Ayenew T (2003) Environmental isotope-based integratedhydrogeological study of some Ethiopian rift lakes. J RadioanalNucl Chem 257(1):11–16
Ayenew T, Alemayehu T (2001) Principles of hydrogeology. AddisAbaba University Press, Addis Ababa, Ethiopia,125 pp
Begemann F, Libby WF (1957) Continental water balance,ground water inventory and storage times, surface oceanmixing rates and world-wide circulation patterns fromcosmic-ray and bomb tritium. Geochim Cosmochim Acta12:277–296
Beyth M (1972) The geology of central and western Tigre. PhDThesis, University of Bonn, Germany, 155 pp
Beyth M, Shachnai E (1970) Hydrogeology of Mekelle area.Ethiopian Institute of Geological Survey (EIGS), Addis Ababa,Ethiopia, 10 pp
Bossellini A, Russo A, Fantozzy PL, Assefa G, Tadesse S (1997)The Mesozoic succession of Mekelle Outlier (Tigre Province,Ethiopia). Mem Sci Geol 49:95–116
Chernet T, Eshete G (1982) Hydrogeology of Mekelle area (ND37-11). Memoir No. 2, Ministry of Mines and Energy andEthiopian Institute of Geological Survey, Addis Ababa, Ethio-pia, 49 pp
Clark ID, Fritz P (1997) Environmental isotopes in hydrogeology.Lewis, Boca Raton, FL, 328 pp
Consult DH (2010) Groundwater resources potential assessment ofthe Mekelle outlier: phase II report. Ministry of WaterResources, Addis Ababa, Ethiopia, 153 pp
Craig H (1961) Isotopic variations in meteoric waters. Science133:1702–1703. doi:10.1126/science.133.3465.1702
Darling GW, Gizaw B, Arusel MK (1996) Lake-groundwaterrelationships and fluid-rock interaction in the East African RiftValley: isotope evidence. J Afr Earth Sci 22:423–431
Demilie M, Wohnlich S, Gizaw B, Stichler W (2006) Groundwaterrecharge in the Akaki catchment, central Ethiopia: evidencefrom environmental isotopes (δ18O, δ2H and 3H) and chloridemass balance. Hydrol Process 21:807–818
Demilie M, Wohnlich S, Wisotzky F, Gizaw B (2007) Groundwaterrecharge, flow and hydrochemical evolution in complexvolcanic aquifer system, central Ethiopia. Hydrogeol J15:1169–1181
EIGS/Ethiopian Institute of Geological Survey (1993) Hydrogeologicalmap of Ethiopia, 1:2,000,000 scale. Ministry of Mines and Energyand Ethiopian Institute of Geological Survey (EIGS), Addis Ababa,Ethiopia
EIGS/Ethiopian Institute of Geological Survey (1996) Explanationof the geological map of Ethiopia (scale 1:2,000,000), 2nd edn.Ethiopian Institute of Geological Survey, Addis Ababa,Ethiopia, 79 pp
Fetter CW (1994) Applied hydrogeology. Prentice Hall, EnglewoodCliffs, NJ, 604 pp
Furi W, Razack M, Ayenew T, Kebede S, Legese D (2011)Hydrochemical characterization of complex volcanic aquifersin a continental rift zone: the Middle Awash Basin Ethiopia.Hydrogeol J 20:325–400
FWWDSE/Federal Water Works Design and Supervision Enterprise(2007) Evaluation of Aynalem well fields around Mekelle townfor water supply source: final report, vol II. Addis Ababa,Ethiopia, 147 pp
Garland CR (1980) Geology of the Adigrat area. Memoir, no. 1.Ministry of Mines, Addis Ababa, Ethiopia, 51 pp
Gebreyohannes T (2009) Regional groundwater flow model of GibaBasin, northern Ethiopia. PhD Thesis, Vrije UniversiteitBrussel, Belgium, 256 pp
Gebreyohannes T, Smedt FD, Hagos M, Amare K, Kabeto K,Hussein A, Nyssen J, Bauer H, Moeyersons J, Deckers J, TahaN (2009) Large-scale geological mapping of the Geba basin,northern Ethiopia. VLIR-Mekelle University IUC program,Tigray Livelihood Papers 9, Mekelle University, Mekelle,Ethiopia, 46 pp
671
Hydrogeology Journal (2015) 23: 649–672 DOI 10.1007/s10040-015-1243-4

Getaneh W (2002) Geochemistry province and depositional tectonicsetting of the Adigrat Sandstone northern Ethiopia. J Afr EarthSci 35:185–198
Gibson JJ, Edwards TWD, Birks SJ, St Amour NA, Buhay WM,McEachern P, Wolfe BB, Peters DL (2005) Progress in isotopetracer hydrology in Canada. Hydrol Process 19:303–327
Hoefs J (2009) Stable isotope geochemistry, 6th edn. Springer,Berlin, 285 pp
Hunkeler D, Aravena R, Butler B (1999) Monitoring microbialdechlorination of tetrachloroethene (PCE) in groundwater usingcompound-specific stable carbon isotope ratios: microcosm andfield studies. Environ Sci Technol 33:2733–2738
Hussein A (2000) Hydrogeology of the Aynalem well field. MScThesis, Addis Ababa University, Ethiopia, 103 pp
Kazmin V (1979) Stratigraphy and correlation of volcanic rocks ofEthiopia. EIGS Note no. 106, Ethiopian Institute of GeologicalSurveys, Addis Ababa, Ethiopia, pp 1–26
Kebede S (2004) Approches isotopique et geochimique pourl’etudedes eauxsouterraines et des lacs: exemples du haut bassindu Nil Bleu et du rift Ethiopien [Environmental isotopes andgeochemistry in groundwater and lake hydrology: cases fromthe Blue Nile basin, main Ethiopian rift and Afar, Ethiopia].PhD Thesis, University of Avignon, France, 162 pp
Kebede S (2013) Groundwater in Ethiopia features, numbers andopportunities. Springer, Berlin, 121 pp
Kebede S, Travi Y (2012) Origin of the δ18O and δ2H compositionof meteoric waters in Ethiopia. Quat Int 257:4–12
Kebede S, Travi Y, Alemayehu T, Ayenew T (2005) Groundwaterrecharge, circulation and geochemical evolution in the sourceregion of the Blue Nile River, Ethiopia. Appl Geochem20:1658–1676
Kebede S, Travi Y, Asrat A, Alemayehu T, Ayenew T, Tessema Z(2008) Groundwater origin and flow along selected transects inEthiopian rift volcanic aquifers. Hydrogeol J 16:55–73
Kendall C, Coplen TB (2001) Distribution of oxygen-18 anddeuterium in river waters across the United States. HydrolProcess 15:1363–1393
Kuster D, Dwivedi SB, Kabeto K, Mehari K, Matheis G (2005)Petrograhic reconnaissance investigation of mafic sills associatedwith flood basalts, Mekelle basin, northern Ethiopia: implicationsfor Ni–Cu Exploration. J Geochem Explor 85:63–79
Merla G, Abate E, Azzaroli A, Bruni P, Fazzuoli M, Sagri M (1979)Comments to the geological map of Ethiopia and Somalia.Consiglio Nazionale delle Ricerche, Rome, 95 pp
Moser H, Stichler W (1971) Die Verwendung des Deuterium undSauerstoff-18 Gehalts bei Hydrologischen Untersuchungen.Geol. Bavarica 64:7–35
Newman BD, Osenbrück K, Aeschbach-Hertig W, Solomon DK,Cook P, Różański K, Kipfer R (2010) Dating of ‘young’groundwaters using environmental tracers: advantages, applica-tions, and research needs. Isot Environ Health Stud 46(3):259–278. doi:10.1080/10256016.2010.514339
Rietti-Shati M, Yam R, Karlen W, Shemesh A (2000) Stable isotopecomposition of tropical high-altitude fresh-waters on Mt.Kenya, Equatorial East Africa. Chem Geol 166:341–350
Rozanski K, Araguas-Araguas L (1995) The spatial and temporalvariability of stable isotope composition of precipitation overthe South American continent. In: Kebede S, Travi Y (2012)Origin of the δ18O and δ2H composition of meteoric waters inEthiopia. Quat Int 257:4–12
Sanford WA, Aeschbach-Hertig W, Andrew L, Herczeg AL (2011)Insights from environmental tracers in groundwater systems.Hydrogeol J 19:1–3
Schmidt TC, Zwank L, Elsner M, Berg M, Meckenstock RU,Haderlein SB (2004) Compound-specific stable isotope analysisof organic contaminants in natural environments: a criticalreview of the state of the art, prospects and future challenges.Anal Bioanal Chem 378:283–300
Singhal B, Gupta R (2010) Applied hydrogeology of fracturedrocks, 2nd edn. Springer, Heidelberg, Germany, 408 pp
Verhagen BT (1991) Detailed geohydrology with environmentalisotopes: a case study at Seroew, Botswana. In: Isotope techniquesin water resources development. IAEA, Vienna, pp 345–362
Weldesenbet S (2012) Hydrogeology, hydrochemistry and isotopehydrology of Central Main Ethiopian Rift. PhD Thesis, RuhrUniversitat Bochum, Germany, 175 pp
Yihdego S (2003) Hydrogeological assessment of the Ellala-Aynalem catchments with particular reference to the chemicalvariation and aquifer characterization, northern Ethiopia. MSc,Thesis, Addis Ababa University, Ethiopia, 183 pp
Yitbarek A, Razack M, Ayenew T, Zemedagegnehu E, Azagegn T(2012) Hydrogeological and hydrogeochemical framework ofUpper Awash River basin, Ethiopia: with special emphasis oninter-basins groundwater transfer between Blue Nile and AwashRiver. J Afr Earth Sci 65:46–60
Zereay T (2007) Evaluating the potential of the Aynalem wellfieldfor the conjunctive use of surface and groundwater. MSc Thesis,Mekelle University, Ethiopia, 113 pp
672
Hydrogeology Journal (2015) 23: 649–672 DOI 10.1007/s10040-015-1243-4