concord, ma. 2 page i.overview of the survey and the participants 3 ii.base salary projections 11...
TRANSCRIPT

Summary Report: Compensation Trends for 2014
Sponsored by BOSE Corporation and Wilson GroupDecember, 2013
Concord, MA

www.wilsongroup.com 2
Agenda and Table of Contents
Page
I. Overview of the Survey and the Participants 3
II. Base Salary Projections 11
III. Variable Pay Projections 15
IV. Changes Planned for Compensation Programs 19
V. Breakout of Survey Highlights by Industry 24
VI. Primary Conclusions and Ideas to Consider 27
Overview of the Wilson Group 29
www.wilsongroup.com 3
SECTION I
Overview of the Survey
and the Participants
www.wilsongroup.com 4
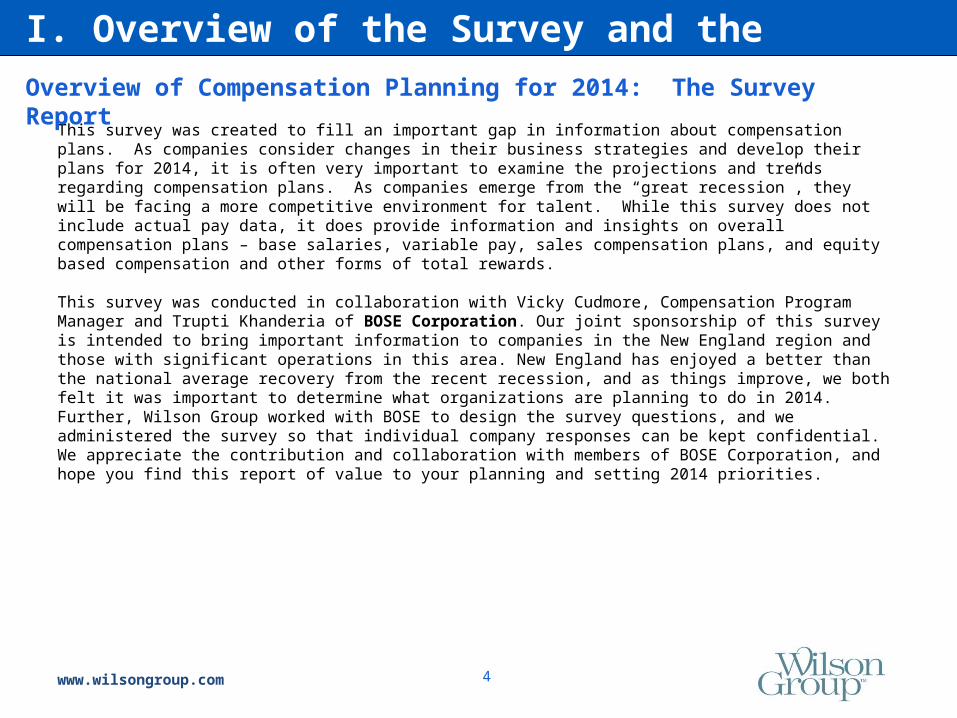
This survey was created to fill an important gap in information about compensation plans. As companies consider changes in their business strategies and develop their plans for 2014, it is often very important to examine the projections and trends regarding compensation plans. As companies emerge from the “great recession”, they will be facing a more competitive environment for talent. While this survey does not include actual pay data, it does provide information and insights on overall compensation plans – base salaries, variable pay, sales compensation plans, and equity based compensation and other forms of total rewards.
This survey was conducted in collaboration with Vicky Cudmore, Compensation Program Manager and Trupti Khanderia of BOSE Corporation. Our joint sponsorship of this survey is intended to bring important information to companies in the New England region and those with significant operations in this area. New England has enjoyed a better than the national average recovery from the recent recession, and as things improve, we both felt it was important to determine what organizations are planning to do in 2014. Further, Wilson Group worked with BOSE to design the survey questions, and we administered the survey so that individual company responses can be kept confidential. We appreciate the contribution and collaboration with members of BOSE Corporation, and hope you find this report of value to your planning and setting 2014 priorities.
I. Overview of the Survey and the Participants
Overview of Compensation Planning for 2014: The Survey Report

www.wilsongroup.com 5
Based on the results of this survey, several of the most important findings include:
1. The companies surveyed reported a minor revenue growth in 2013 over 2012. The median growth projection was 5.0% for 2012 and 5.6% in 2013. It appears that most companies are not projecting strong increases in revenue growth for 2013.
2. Base salary increases are likely to be what they were in 2013. The median merit increase budget for 2012 was 3.0% and 3.0% is planned for 2013. The range of increases is very tight, between 2.5% and 3.0% for 2013.
3. There is a modest increase in the percent of employees that will NOT likely receive pay increases. In 2013 this median percent was 3.0% (8.1% average) and is planned for 2013 at 5.0% (11.4% average). This means that despite a slowly improving economy, companies are taking a harder line on giving merit increases. Instead of paying high performers more money, companies appear to be giving 0% increases to more people.
4. Similar to last year, 90% of the survey companies are making bonus payouts in 2013 for 2012 performance. These payouts are projected to be 90% of the target payouts which is a little lower than last year. The payouts as a percent of the target ranged from 50% (at the 10th percentile) to 110% (at the 90th percentile).
5. Most companies are doing normal updates to their base salary, variable pay, and equity based pay plans (6 – 8% are planning changes). Twice this level (17%) are planning on changes to their sales compensation plans.
I. Overview of the Survey and the Participants
Overview of Compensation Planning for 2014: Primary Findings

www.wilsongroup.com 6
The survey includes information from 37 companies. They are all based or have significant operations in the New England region. The companies represent a broad range of industries. Twenty-two (42%) are in the Technology and Life Sciences industry, 17% are in the Professional Services industries, 17% are in Financial and Insurance Services, 14% are in Consumer Products, Retail Services, and 11% are in Healthcare and other Non-Profit industries.
I. Overview of the Survey and the ParticipantsDemographics: Industry Composition of the Survey

www.wilsongroup.com 7
The survey reflects responses from a broad range of companies in terms of their revenue size and employee population. The median revenue of the participating companies is $771M and they have approximately 1,672 employees. There are a number of very large companies, and many mid-market size companies in the survey. This means that the survey provides important information from a large breadth of companies. As you will see in the report, despite this wide range of companies, the actual variation in the responses is not that large. So, even though there is a significant range, there appears to be very similar pay practices for 2013 and 2014.
The demographics of this group includes the following:
Demographics:25th Percentile Median 75th Percentile Average
Annual Revenues: $140.0 M $771 M $1.4 B $1.3 B
Total No. of EEs: 395 1,672 3,977 4,520
Revenues per EE: $108.6 M $215.0 M $304.4 M $647.1 M
I. Overview of the Survey and the ParticipantsDemographics: Profile of the Participating Companies

www.wilsongroup.com 8
This group of companies is projecting a modest growth for 2013 with slightly more growth planned for 2014. Approximately one-third have revenue growth projections of greater than 4% for both 2013 and 2014. Forty-four percent (44%) of companies are expecting growth in 2014 of greater than 4% compared to 36% in 2013. Only three organizations reported a decline in revenues for 2013 and only one in 2014. Over 47% of the companies indicated they were increasing the staffing levels in 2014 with 29% projecting no change; 18% anticipated reducing staffing levels. Therefore, it appears that 2014 will likely be more prosperous than 2013 for these leading employers.
Revenue growth projections for 2013 Revenue growth projections for 2014
I. Overview of the Survey and the ParticipantsDemographics: Revenue Growth Projections for 2013 and 2014

www.wilsongroup.com 9
Voluntary turnover rates are approximately twice that of involuntary turnover rates. As the economy continues to increase its rate of growth, this turnover pattern is likely to increase for many companies. The challenges facing many companies is attracting and retaining desired talent. In many firms this is specialized into a number of critical jobs.
This group of companies is facing hiring challenges with the professional workforce. Attracting and retaining talent includes four key functional areas: Information technology, Engineering, Sales and Marketing and Human Resources. Little concern exists for management or operational/hourly employees.
I. Overview of the Survey and the Participants
Executive Management Professional Service OperationalInformation Technology
0% 3% 21% 21% 0%
Engineering 3% 12% 44% 15% 3%
Sales & Marketing 3% 12% 24% 12% 6%
Customer Service 0% 3% 0% 6% 6%
Operations & Manufacturing
0% 3% 3% 6% 9%
Finance 6% 3% 6% 12% 0%
Human Resources 0% 3% 15% 9% 3%
Voluntary Involuntary
Average 8.9% 5.8%
10th Percentile 2.3% 1.2%
25th Percentile 3.9% 2.3%
50th Percentile 7.0% 3.5%
75th Percentile 10.3% 5.0%
90th Percentile 14.7% 7.7%
Turnover
Demographics: Turnover and Hiring Challenges

www.wilsongroup.com 10
I. Overview of the Survey and the ParticipantsList of the Survey Participants
AIPSO Idenix PharmaceuticalsAirvana LLC InvensysAlent Iron MountainAll Screens Entertainment, Inc Kronos Inc.Anonymous Mapfre InsuranceAmerican Tower MathWorksAnalog Devices MITREBeth Israel Deaconess Medical Center MorphoTrust USA, Inc.Bose Ocean Spray Cranberries, Inc.Boston Mutual Life Rockland TrustCommonwealth Equity Services Stratus TechnologiesCommunispace Corporation The TJX Companies, IncConstant Contact TripAdvisorCOVERYS UMass Memorial Health CareDana-Farber Cancer Institute VistaprintDeluxe Waters CorporationDraper Laboratory Watts Water TechnologiesEMD Millipore World Energy SolutionsHebrew SeniorLife

www.wilsongroup.com 11
SECTION II
Base Salary Projections

www.wilsongroup.com 12
The merit pay increase projections for 2013 and 2014 show a very tight cluster around 3.0%. There is also little change planned for 2014 from increases made in 2013. The “highs and lows” were also tightly clustered. This pattern has existed from the last several years.
The only note of significance is the average number of people who will NOT be receiving pay increases. This is projected to decrease from 9.4% (average) to 7.5% (average) within companies. The difference between the Median and the Average indicates there are several companies being more disciplined about pay increases in 2013 and 2014.
II. Base Salary Projections
Merit Increase Budget for
2013
% of EE’s NOT receiving pay increases in
2013
Merit Increase Budget for
2014
% of EE’s NOT receiving pay increases in
2014
AVERAGE 2.8% 9.4% 2.9% 7.5%
10th Percentile 2.0% 1.0% 2.0% 0.0%
25th Percentile 2.5% 1.0% 2.5% 1.0%
MEDIAN (50th Percentile)
3.0% 4.0% 3.0% 2.8%
75th Percentile 3.0% 10.5% 3.0% 10.0%
90th Percentile 3.5% 18.8% 3.5% 11.8%
Merit Increase Projections

www.wilsongroup.com 13
Approximately half of the participating companies provide a budget for promotions and special market adjustments. This has only changed slightly from 2013 to 2014. The table below shows the percent of companies that have a separate budget and the amount for 2013 and planned for 2014.
II. Base Salary Projections
2013 2014
Yes 53% 50%
No 47% 50%
Average 1.0% 3.9%
10th Percentile 0.3% 0.3%
25th Percentile 0.5% 0.5%
50th Percentile 0.9% 1.0%
75th Percentile 1.1% 1.0%
90th Percentile 1.8% 3.0%
Promotional IncreasesSeparate budget for promotions and special market adjustments:
Promotional and Special Market Adjustment Budgets
www.wilsongroup.com 14
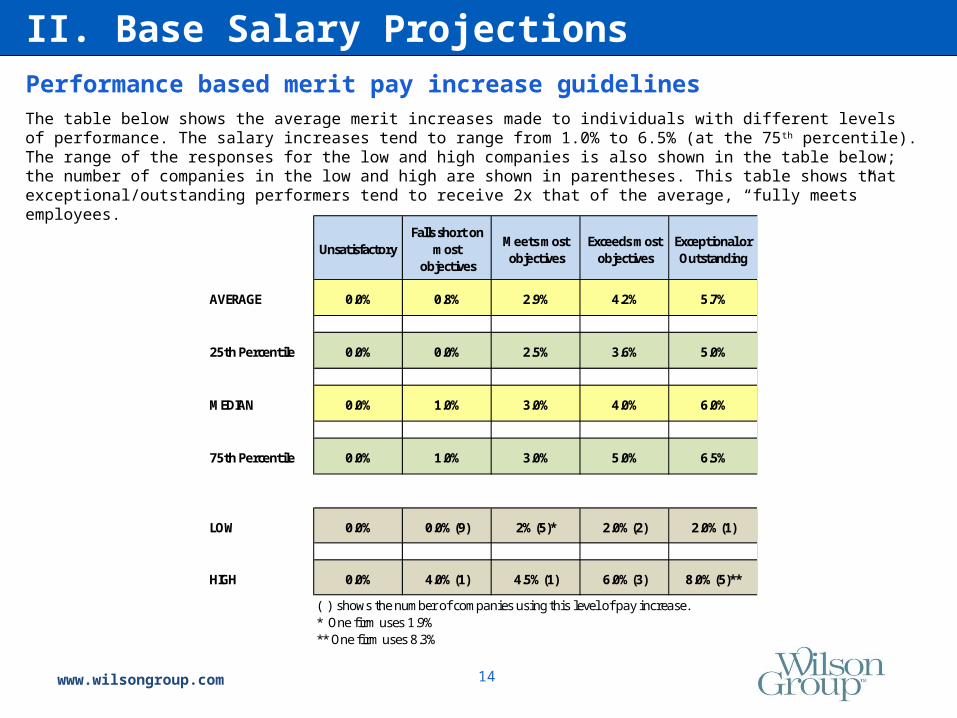
The table below shows the average merit increases made to individuals with different levels of performance. The salary increases tend to range from 1.0% to 6.5% (at the 75th percentile). The range of the responses for the low and high companies is also shown in the table below; the number of companies in the low and high are shown in parentheses. This table shows that exceptional/outstanding performers tend to receive 2x that of the average, “fully meets” employees.
II. Base Salary Projections
UnsatisfactoryFalls short on
most objectives
Meets most objectives
Exceeds most objectives
Exceptional or Outstanding
AVERAGE 0.0% 0.8% 2.9% 4.2% 5.7%
25th Percentile 0.0% 0.0% 2.5% 3.6% 5.0%
MEDIAN 0.0% 1.0% 3.0% 4.0% 6.0%
75th Percentile 0.0% 1.0% 3.0% 5.0% 6.5%
LOW 0.0% 0.0% (9) 2% (5)* 2.0% (2) 2.0% (1)
HIGH 0.0% 4.0% (1) 4.5% (1) 6.0% (3) 8.0% (5)**
( ) shows the number of companies using this level of pay increase.* One firm uses 1.9%** One firm uses 8.3%
Performance based merit pay increase guidelines

www.wilsongroup.com 15
SECTION III
Variable Pay Projections

www.wilsongroup.com 16
The table below shows the projected payouts for bonus plans based on 2013 performance. Virtually all companies in the survey indicated they would be making a bonus award payout. Companies will be making payouts that are right at their target payouts (100%). There were 6 companies that exceeded 110% payouts with the highest being 200%, and there were 5 companies that were 75% or less of target payout, with the lowest being 22% of target.
Does your company intend to make bonus payouts for 2013 performance?
Yes: 94% No: 6%
Payouts as percent of target payouts:
Average 92.4%
10th Percentile 31.6%25th Percentile 76.5%
Median 100.0%
75th Percentile 113.0%90th Percentile 131.4%
III. Variable Pay ProjectionsOverview of Variable Pay/Bonus Programs
www.wilsongroup.com 17
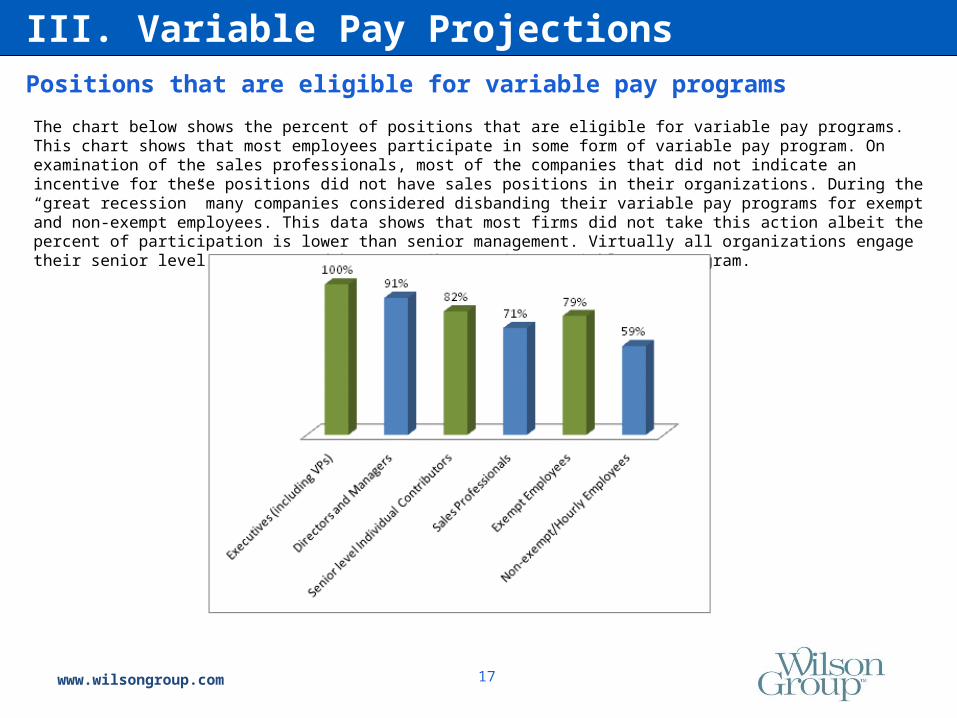
The chart below shows the percent of positions that are eligible for variable pay programs. This chart shows that most employees participate in some form of variable pay program. On examination of the sales professionals, most of the companies that did not indicate an incentive for these positions did not have sales positions in their organizations. During the “great recession” many companies considered disbanding their variable pay programs for exempt and non-exempt employees. This data shows that most firms did not take this action albeit the percent of participation is lower than senior management. Virtually all organizations engage their senior level managers and key contributors in a variable pay program.
III. Variable Pay ProjectionsPositions that are eligible for variable pay programs

www.wilsongroup.com 18
The chart below shows the prevalence in 2013 of special cash, recognition and award programs. New hire bonuses, spot awards and special recognition cash awards are clearly the preferred vehicles for rewarding performance. Gift cards and movie passes are also very important non-cash mechanisms for rewarding desired performance. Based on an examination of the responses for 2014, most of the programs that will be initiated new are hiring bonuses, project based bonus plans, lump sum merit pay and gift card/movie passes recognition awards.
III. Variable Pay ProjectionsThe Use of Special Bonus and Recognition Programs
Currently usePlanning for
2014
Retention bonuses 23% 11%
New hire bonuses 74% 37%
Spot awards 66% 31%
Project based bonuses 46% 23%
Lump sum for merit pay 40% 14%
Special recognition cash awards 63% 34%
Gift cards, movie passes, etc. 57% 37%
Other special bonuses 9% 6%
www.wilsongroup.com 19
SECTION IV
Changes Planned for Compensation
Programs

www.wilsongroup.com 20
Changes Planned in Base Salary Programs for 2014
While most companies are not planning to make changes to their base pay programs in 2014, there are several areas that companies are focusing on for improvements. The most significant changes appear to be with strengthening the link between base pay systems and merit increases with the performance management and talent development priorities of the business. These initiatives strengthen the impact of base pay, and move it from being just a “hygiene factor” to one that reinforces performance and competency development. No company reported instituting a forced distribution process and only a few companies are looking to create broadbanding systems for pay. It appears that base pay plans are still an essential element of the total compensation and people management programs of the company.
IV. Changes Planned for Compensation Programs

www.wilsongroup.com 21
The chart below shows the percent of companies that are planning changes in variable pay programs. It appears that 2014 will see some improvements in the plans, with 55% of the firms indicating that they were making some important changes to them. The most critical areas for change appears in the performance measures and funding process that supports variable pay plans. A few companies are changing the payout targets and/or modifying the weighting associated with the measures. And a number of companies are uncertain what they will be doing differently in 2014.
IV. Changes Planned for Compensation ProgramsChanges Planned in Variable Pay Plans for 2014

www.wilsongroup.com 22
The chart below shows the percent of companies that are planning changes to sales compensation programs. The most important actions will be to align sales plans more with the strategy of the company. This means there will be greater emphasis on acquiring new customers. Next, the emphasis will be on improving the efficiency of the plan through better administrative systems and documentation. Changes are being considered in the acceleration points of the commission rates in addition to other elements of the sales plan. Wilson Group has recently completed a landmark study (second annual) of sales compensation plan practices, with an emphasis on five (5) critical sales roles. If you are interested in receiving a copy of this report or discussing it with us, please contact us. Our contact information in included at the end of this report.
IV. Changes Planned for Compensation ProgramsChanges Planned in Sales Compensation Plans for 2014
0% 5% 10% 15% 20% 25%
Not making any material changes to the sales compensation plansChanging the "on target" earnings
Simplifying the plan - reduce the number of measures and ratesPlacing more emphasis on retaining and developing current customers
Placing more emphasis on new/current productsChanging the commission rates
Changing the commission acceleration pointsIncreasing the documentation and controls of the plan
Improving the administrative systems of the planPlacing more emphasis on acquiring new accounts/customers
Improving the alignment with our overall business strategy

www.wilsongroup.com 23
IV. Changes Planned for Compensation ProgramsChanges Planned for Equity/Ownership Based Plans for 2014
There were only three companies that indicated they were making changes to their equity/ownership based compensation programs. Consequently, we cannot report any findings or trends in this area. The observation of these companies and from our practices with designing executive compensation plans indicate that companies are addressing these plan design changes for 2014:
1. Companies are shifting the use of equity vehicles from stock options to restricted stock units. Most firms are using a combination of vehicles, but the trend is clearly toward more full valued equity vehicles.
2. When companies adopt restricted stock units (RSU’s) or restricted stock, they place a performance condition to receive the award. The most common technique is to link the vesting of RSU awards to the achievement of long-term performance relative to an external benchmark group – a peer group, industry or market index. If the company achieves performance in the top quartile of this group, after 3 to 5 years, the RSU’s will vest. This vesting measure is spread out across grant cycles so that if performance is achieved, then equity units will be vested annually.
3. Companies are changing the guidelines to limit the number that are awarded below the executive or director level positions within the organization. Equity plans are viewed as rewarding the growth in the long-term value of the corporation, and therefore should be awarded to those positions that have a direct impact on the factors that create long-term value. These plans are still used with high levels of participation in private, emerging growth companies as a tool for attracting and retaining talent to offset limited cash compensation.
4. Private companies are increasingly using equity based vehicles for their executive management and senior leadership. There are a great number of vehicles and approaches used for these programs, and they are tailored to the specific philosophy and requirements of each organization.

www.wilsongroup.com 24
SECTION V
Breakout of Survey Highlights by
Industry

www.wilsongroup.com 25
The following table shows the survey results for the major industries of companies in this survey.
V. Breakout of Survey Highlights by IndustryPrimary Survey Results by Major Industry Categories
Technology & Life Sciences
Retail & Consumer Products
Professional Services
Financial Services
BackgroundRevenue Growth Projections
2013 4% - 8% 0 - 3.9% 4% - 8% 4% - 8%2014 4% - 8% 4% - 8% 4% - 8% 8% - 12%
Staffing ChangesIncreasing Staff 57% 40% 40% 67%
No Change in Staff 36% 40% 20% 17%Decreasing Staff 7% 20% 40% 17%
TurnoverVoluntary % 7.3% 5.0% 11.0% 5.6%
Involuntary % 5.7% 4.5% 5.0% 2.6%Total Cash Compensation
Merit Pay Increases2013 3.0% 2.5% 2.5% 2.9%2014 3.0% 2.5% 2.5% 3.0%
% EE's with NO Increase2013 5.0% 4.5% 8.5% 1.0%2014 6.2% 5.8% 7.6% 1.3%
Bonus Plan Payouts% making payouts 95% 83% 89% 89%
Payouts as % of Target 97.5% 120.0% 100% 105%

www.wilsongroup.com 26
V. Breakout of Survey Highlights by IndustryPrimary Survey Results by Major Industry Categories (continued)
Technology & Life Sciences
Retail & Consumer Products
Professional Services
Financial Services
Reward and Recognition Programs Used in 2013
Retention Bonuses 29% 17% 20% 17%
New Hire Bonuses 86% 50% 60% 100%
Spot Awards 86% 33% 80% 67%
Project based Bonuses 57% 17% 40% 33%
Lump Sum Merit Pay 71% 0% 40% 33%
Special Recognition Cash Awards 86% 17% 80% 83%
Gift Cards, Movie Passes Awards 64% 50% 80% 50%
Other Special Awards 0% 33% 17% 0%

www.wilsongroup.com 27
SECTION VI
Primary Conclusions
and Ideas to Consider

www.wilsongroup.com 28
We hope that you have enjoyed reviewing this special survey of compensation plans for 2014 and that it has provided important information for your organization. Based on the information presented in this report, we believe there are several questions important for every organization to consider in making their total compensation plans more effective for the organization and their people.
1. If the average merit increase is 3.0%, then what should your top performers make in pay increases? The survey data showed the exceptional performers were earning approximately 6.1% or about 2x the normal pay increase.
2. What percent of your employees should receive both the top awards and zero pay increases? There was a significant mix of opinions with many companies not awarding merit pay increases to up to 20% of their workforce; the median was 4.8% of the employees.
3. Less than 20% of the companies actively use special award, recognition and spot bonus programs. What value do or can these programs provide to your organization? Can these programs be managed in a way that reinforces both the performance requirements and the desired culture of the organization? These programs may provide untapped potential to the resourceful organization to encourage and reinforce desired performance.
4. Most companies are making bonus payouts for 2013 performance. The amounts are close to the target payouts. (90%) A few companies are examining the effectiveness of these programs and examining both the eligibility and metrics associated with them. Depending on the nature of the strategies and plans for 2013, what elements of your variable pay plans are working for the organization and what elements are limiting its impact?
5. Sales compensation plans appear to be the focus for important changes by a moderate number of survey companies. Feedback comments and our experience in development of these plans with clients indicate the primary interest is to strengthen the ability of the company to increase revenues from new clients and from existing clients.
If you would like to talk about your compensation plans and programs, and explore ways to improve their effectiveness and make a positive impact on the company, please contact us. We would enjoy working with you to improve the performance in your company.
VI. Primary Conclusions and Ideas to Consider

www.wilsongroup.com 29
Our Mission:“To help our clients assess, develop and implement performance systems and
total compensation plans that translate strategy and values into action.”
Our Primary Services:• Executive total compensation• Board of directors governance structure and compensation
• Sales effectiveness and total rewards
• Employee total compensation and rewards• Special studies in market trends and practices
Key Differentiators:• Our expertise -- Work with highly seasoned, experienced professionals
• Our collaborative approach -- We engage our clients in a collaborative, open communication fashion
• More cost effective -- Highly customized, value added to address just what the client needs • Innovative insights -- Simplifies complex data into easy to understand information and actions
plans
Founded: 1994, Concord, MA
Clients and Markets: We have worked with over 150 clients. They include:• Information Technology – Stratus Technologies, iRobot, Constant Contact, Care.com• Bio-technology – Cytyc, AgaMatrix, CRF Healthcare• Light manufacturing – Nypro, A.W. Chesterton, Lightcontrol, Circor• Professional services – Copyright Clearance Center, Morgan Samuel, Ariel Group• Financial services – Safety Insurance, Boston Mutual, DentaQuest, Commonwealth Financial Network
Overview of the Wilson Group
www.wilsongroup.com 30
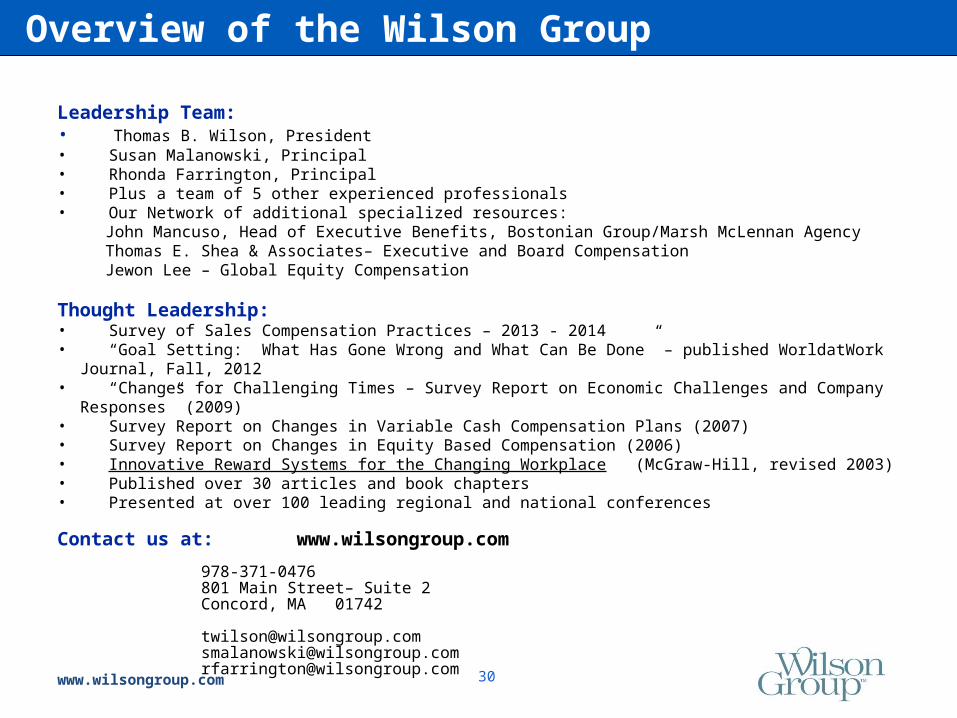
Leadership Team:• Thomas B. Wilson, President• Susan Malanowski, Principal • Rhonda Farrington, Principal• Plus a team of 5 other experienced professionals• Our Network of additional specialized resources:
John Mancuso, Head of Executive Benefits, Bostonian Group/Marsh McLennan AgencyThomas E. Shea & Associates– Executive and Board CompensationJewon Lee – Global Equity Compensation
Thought Leadership:• Survey of Sales Compensation Practices – 2013 - 2014• “Goal Setting: What Has Gone Wrong and What Can Be Done” – published WorldatWork Journal, Fall, 2012• “Changes for Challenging Times – Survey Report on Economic Challenges and Company Responses” (2009)• Survey Report on Changes in Variable Cash Compensation Plans (2007)• Survey Report on Changes in Equity Based Compensation (2006)• Innovative Reward Systems for the Changing Workplace (McGraw-Hill, revised 2003)• Published over 30 articles and book chapters• Presented at over 100 leading regional and national conferences
Contact us at: www.wilsongroup.com
978-371-0476801 Main Street– Suite 2
Concord, MA 01742
[email protected]@[email protected]
Overview of the Wilson Group