condensed consolidated financial results
TRANSCRIPT
28 FEBRUARY 2021
CONDENSED CONSOLIDATED FINANCIALRESULTS
www.hulisani.co.za t: +27 (0) 87 806 2425 e: [email protected] a: 4th Floor, North Tower, 90 Rivonia Road, Sandton, South Africa, 2196
HULISANI LIMITED Registration number 2015/363903/06
(Incorporated in the Republic of South Africa) ("the Group" or "the Company")
Share code: HUL ISIN: ZAE000212072
Summarised consolidated financial results for the year ended 28 February 2021
Hulisani Group (Registration number 2015/363903/06) Trading as Hulisani Limited Financial Results for the year ended 28 February 2021 Results Overview
www.hulisani.co.za t: +27 (0) 87 806 2425 e: [email protected] a: 4th Floor, North Tower, 90 Rivonia Road, Sandton, South Africa, 2196
1. Group overview Hulisani management is pleased to present the results for the year ended 28 February 2021. The financial year under review was characterised by a focus on simplifying the business, steadily building up scale, and working towards long-term growth for Hulisani while containing costs and increasing value for our stakeholders. Our assets continue to demonstrate strong performance and are cash generative. In difficult trading circumstances, we are pleased to continue to report positive cashflow from our investments in line with our business strategy. 2. Nature of the business
Hulisani Limited. (“Hulisani” or the "Company" or the” Group”) was incorporated on 13 October 2015 as an investment holding company focused on power generation projects ranging from gas, diesel, solar PV, concentrated solar, wind and hydro, in South Africa and in Sub-Saharan Africa, and is the ultimate holding company of the group. The current investments made by the group which are operational are highlighted below: • RustMo1 Solar Farm (Pty) Ltd (“RustMo1”) is a material subsidiary and was the first Independent Power
Producer (“IPP”) to be connected to the grid and one of the 18 solar PV power plants constructed in the first round of the Renewable Energy Independent Power producer (“REIPPP”). The 7MW plant has a 20-year Power Purchase Agreement to supply electricity to Eskom that commenced in 2013. Hulisani has a 66% shareholding in RustMo1.
• Kouga Wind Farm (Pty) Ltd (“Kouga”) is an investment Hulisani has significant influence over. Kouga is one of the first wind farms to be connected under the REIPPP and has a 20-year Power Purchase Agreement to supply electricity to Eskom.
• GRI Wind Steel South Africa (Pty) Ltd (“GRI”) manufactures wind turbine towers used in energy production. The investment consists of two instruments and is accounted for by the group as a financial asset at fair value through profit or loss. Refer to note 4.
• Legend Power Solutions (Pty) Ltd (“LPS”) has invested in Avon and Dedisa Open Cycle Gas Turbine (OCGT) peaking power plants and Hulisani participates in 9% of the distributable profits of LPS. The group accounts for the LPS investment as a convertible loan at fair value through profit or loss.
3. Financial performance
The operating results and financial position of the group are set out in the condensed consolidated statements of comprehensive income, statements of financial position, statements of changes in equity, statements of cash flows and accompanying notes. The group has reported an inaugural net profit for the period under review of R13.4m compared to a loss of R26.9m in the prior year. The improved performance is largely attributable to a significant increase in fair value gains of R18.9m (2020: R7.8m), and an impairment loss reversal of R14.3m relating to the associate recognised in the statement of profit or loss. Fair value gains are driven by increased energy production activities in the LPS investment as well as the favourable movement in the GRI financial asset as the value increase as the investment approaches maturity (refer to note 4 for detail), while the reversal of impairment is attributable to the significant decrease in interest rates resulting in the improvement of project cashflows in Kouga. In addition, the group operating expenses for the period decreased in line with the strategy to contain costs. There were no impairments or downward fair value adjustments of the investments. Key factors that have driven performance for the year under review include the following:
• Revenue • Operating costs • Share of profits from the associate • Impairment loss reversal • Investment valuations
Revenue Revenue of R62.4m (2020: R69.4m) for the period under review is reported, a decrease of 10% from the comparative prior period. Revenue at group level consists of sales of electricity at RustMo1 Solar Farm (Pty) Ltd, the subsidiary, and the profit share earned from the convertible loan from Legend Power Solutions (Pty) Ltd
Hulisani Group (Registration number 2015/363903/06) Trading as Hulisani Limited Financial Results for the year ended 28 February 2021 Results Overview
www.hulisani.co.za t: +27 (0) 87 806 2425 e: [email protected] a: 4th Floor, North Tower, 90 Rivonia Road, Sandton, South Africa, 2196
(“LPS”). The decrease in revenue related mainly to an interruption in production, related to the soiling and cleaning of solar panels. Operating expenses Operating expenses for the period are R71.5m (2020: R73.6m) a decrease of 3% which is in line with the strategy to contain costs. The 28 February 2021 group operating expenses include non-cash items such as depreciation and amortisation of R17.7m (2020: R17.4m).
Impairment reversal
The investments in the associate was adjusted for an impairment reversal.
Group 2021 2020 R'000 R'000
Impairment reversal on associate 14,314 - 14,314 -
Kouga Wind Farm (Pty) Ltd The group recognised a full reversal of accumulated impairment to the value of R14.3m. The decline in profitability is due to the current year wind resource being lower than the expected generation profile, however the generation profile since inception of the project is cumulatively in line with the basis as applied in the financial forecast upon which the impairment assessment was performed. The reduction in interest rates improved projected cash flows in Kouga enabling an increase in the carrying value of the investment. Details on the associate and related impairment reversal are in notes 3. Investment valuations The valuations process involves an element of judgement and involves estimates. Inputs which were factored in the process include the discount rates and the projected cashflows from the underlying investments. Valuations for LPS and GRI were conducted to determine the fair value of the investment to enable a fair value gain or loss to be recognised in the statement of profit or loss and other comprehensive income. The discount rates that were applied were reflective of prevailing market conditions. The following adjustments were noted in the current year. Group 2021 2020 R'000 R'000
Convertible loan 13,684 4,823 GRI financial asset 5,140 3,020 Fair value gain on assets at fair value through profit or loss 18,884 7,843
Fair value gains In the current year under review a fair value gain of R18.9m was recognised in the statement of profit or loss and other comprehensive income. This was attributable to an increased energy production of the plants LPS has invested in (R13.7m), as well as favourable movement in the GRI financial asset (R5.1m).
Hulisani Group (Registration number 2015/363903/06) Trading as Hulisani Limited Financial Results for the year ended 28 February 2021 Results Overview
www.hulisani.co.za t: +27 (0) 87 806 2425 e: [email protected] a: 4th Floor, North Tower, 90 Rivonia Road, Sandton, South Africa, 2196
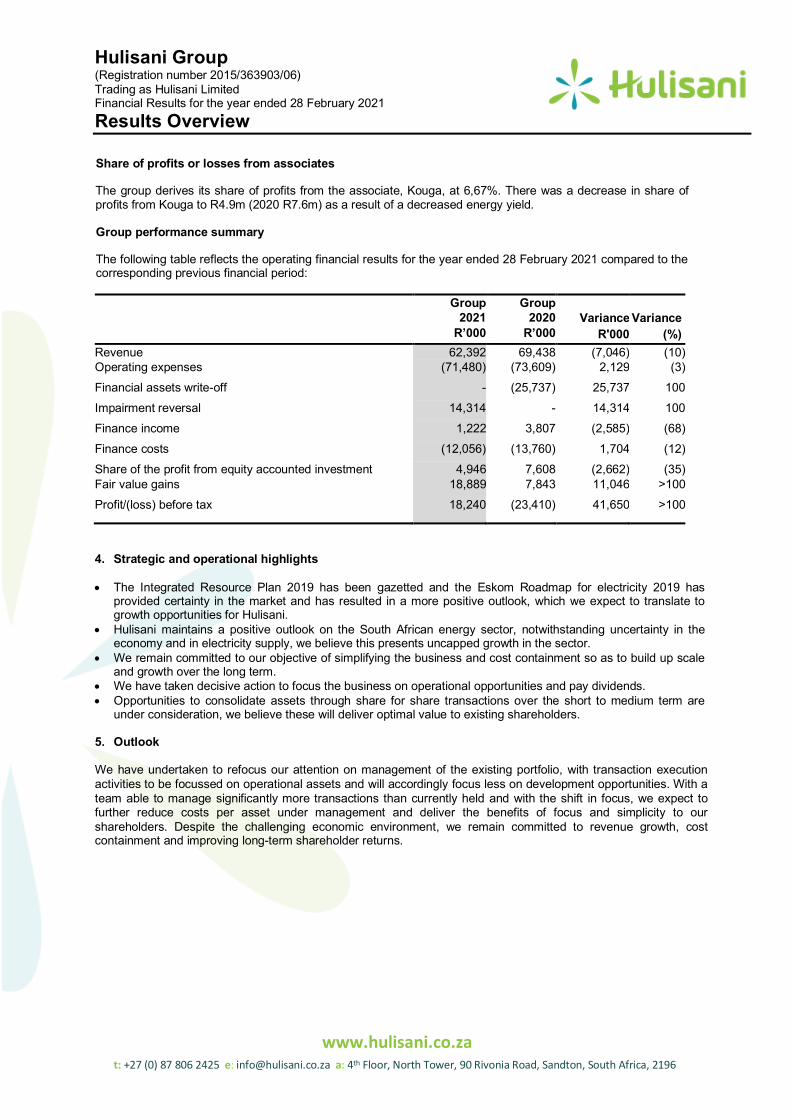
Share of profits or losses from associates
The group derives its share of profits from the associate, Kouga, at 6,67%. There was a decrease in share of profits from Kouga to R4.9m (2020 R7.6m) as a result of a decreased energy yield. Group performance summary
The following table reflects the operating financial results for the year ended 28 February 2021 compared to the corresponding previous financial period: Group Group 2021 2020 Variance Variance R’000 R’000 R'000 (%) Revenue 62,392 69,438 (7,046) (10) Operating expenses (71,480) (73,609) 2,129 (3) Financial assets write-off - (25,737) 25,737 100 Impairment reversal 14,314 - 14,314 100 Finance income 1,222 3,807 (2,585) (68) Finance costs (12,056) (13,760) 1,704 (12) Share of the profit from equity accounted investment 4,946 7,608 (2,662) (35) Fair value gains 18,889 7,843 11,046 >100 Profit/(loss) before tax 18,240 (23,410) 41,650 >100
4. Strategic and operational highlights
• The Integrated Resource Plan 2019 has been gazetted and the Eskom Roadmap for electricity 2019 has provided certainty in the market and has resulted in a more positive outlook, which we expect to translate to growth opportunities for Hulisani.
• Hulisani maintains a positive outlook on the South African energy sector, notwithstanding uncertainty in the economy and in electricity supply, we believe this presents uncapped growth in the sector.
• We remain committed to our objective of simplifying the business and cost containment so as to build up scale and growth over the long term.
• We have taken decisive action to focus the business on operational opportunities and pay dividends. • Opportunities to consolidate assets through share for share transactions over the short to medium term are
under consideration, we believe these will deliver optimal value to existing shareholders.
5. Outlook We have undertaken to refocus our attention on management of the existing portfolio, with transaction execution activities to be focussed on operational assets and will accordingly focus less on development opportunities. With a team able to manage significantly more transactions than currently held and with the shift in focus, we expect to further reduce costs per asset under management and deliver the benefits of focus and simplicity to our shareholders. Despite the challenging economic environment, we remain committed to revenue growth, cost containment and improving long-term shareholder returns.
Hulisani Group (Registration number 2015/363903/06) Trading as Hulisani Limited Financial Results for the year ended 28 February 2021 Results Overview
www.hulisani.co.za t: +27 (0) 87 806 2425 e: [email protected] a: 4th Floor, North Tower, 90 Rivonia Road, Sandton, South Africa, 2196
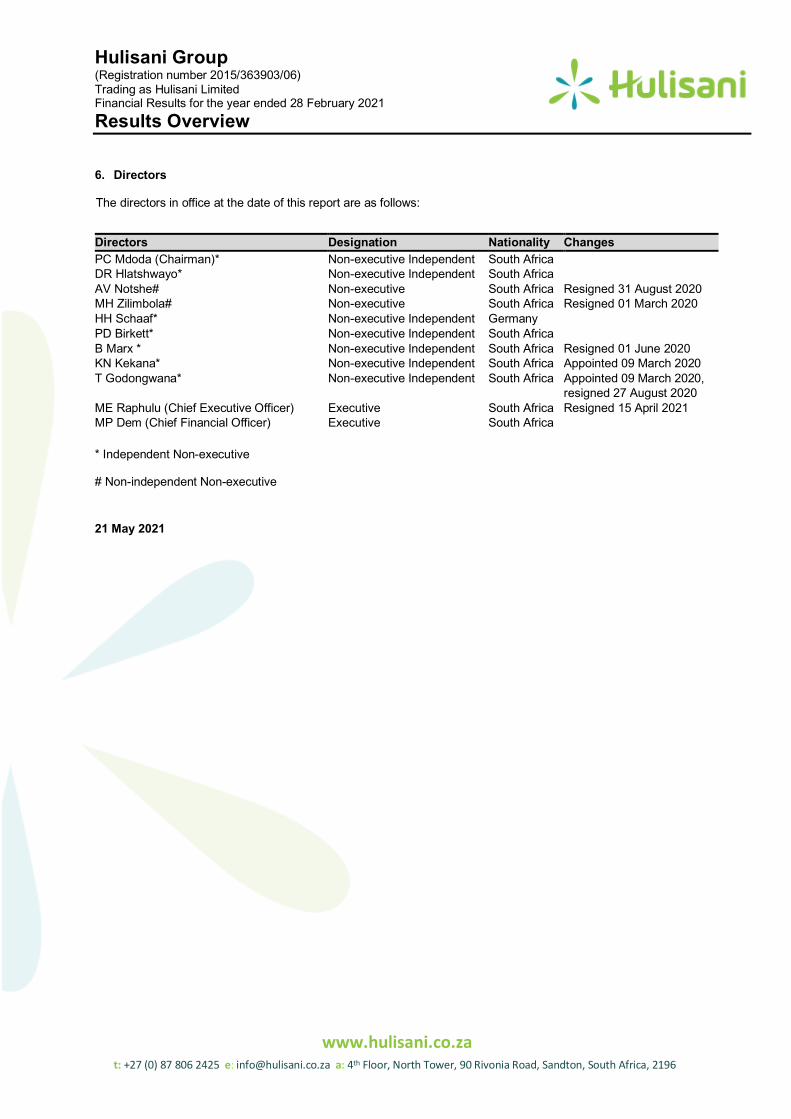
6. Directors The directors in office at the date of this report are as follows:
Directors Designation Nationality Changes PC Mdoda (Chairman)* Non-executive Independent South Africa DR Hlatshwayo* Non-executive Independent South Africa AV Notshe# Non-executive South Africa Resigned 31 August 2020 MH Zilimbola# Non-executive South Africa Resigned 01 March 2020 HH Schaaf* Non-executive Independent Germany PD Birkett* Non-executive Independent South Africa B Marx * Non-executive Independent South Africa Resigned 01 June 2020 KN Kekana* Non-executive Independent South Africa Appointed 09 March 2020 T Godongwana* Non-executive Independent South Africa Appointed 09 March 2020,
resigned 27 August 2020 ME Raphulu (Chief Executive Officer) Executive South Africa Resigned 15 April 2021 MP Dem (Chief Financial Officer) Executive South Africa
* Independent Non-executive # Non-independent Non-executive
21 May 2021
Hulisani Group (Registration number 2015/363903/06) Trading as Hulisani Limited Financial Results for the year ended 28 February 2021
www.hulisani.co.za t: +27 (0) 87 806 2425 e: [email protected] a: 4th Floor, North Tower, 90 Rivonia Road, Sandton, South Africa, 2196
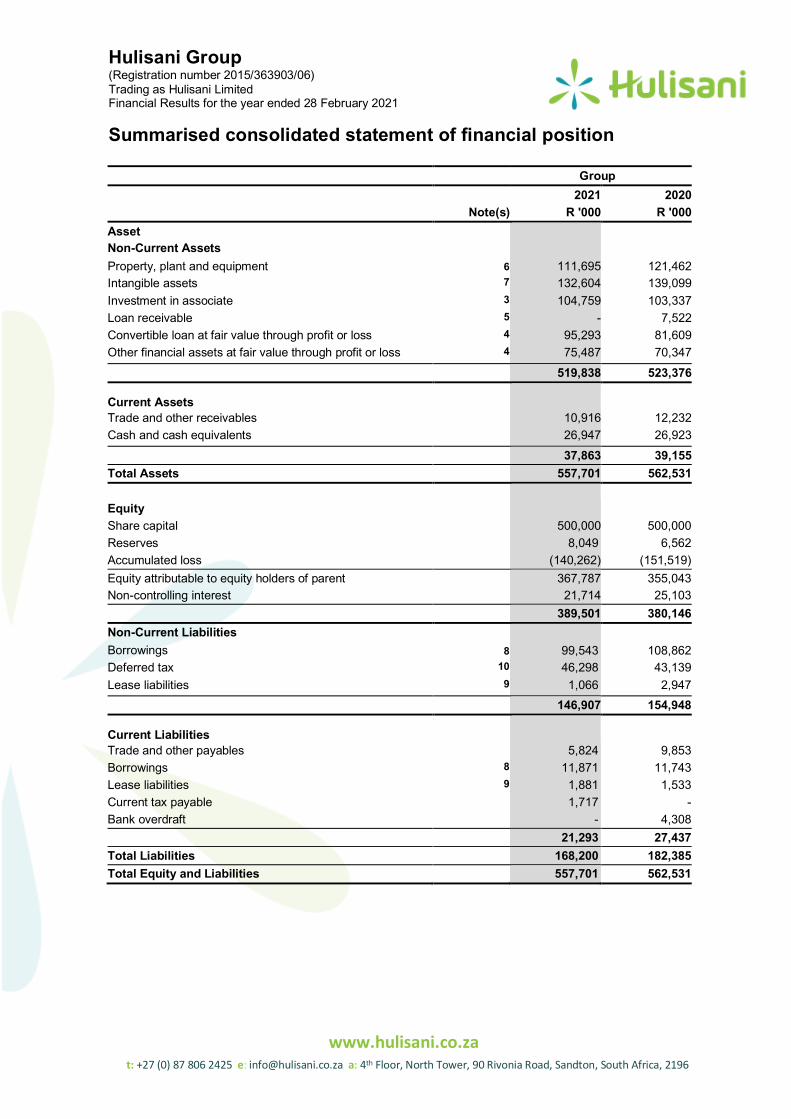
Summarised consolidated statement of financial position
Group 2021 2020 Note(s) R '000 R '000 Asset Non-Current Assets Property, plant and equipment 6 111,695 121,462 Intangible assets 7 132,604 139,099 Investment in associate 3 104,759 103,337 Loan receivable 5 - 7,522 Convertible loan at fair value through profit or loss 4 95,293 81,609 Other financial assets at fair value through profit or loss 4 75,487 70,347 519,838 523,376
Current Assets Trade and other receivables 10,916 12,232 Cash and cash equivalents 26,947 26,923 37,863 39,155 Total Assets 557,701 562,531
Equity Share capital 500,000 500,000 Reserves 8,049 6,562 Accumulated loss (140,262) (151,519) Equity attributable to equity holders of parent 367,787 355,043 Non-controlling interest 21,714 25,103 389,501 380,146 Non-Current Liabilities Borrowings 8 99,543 108,862 Deferred tax 10 46,298 43,139 Lease liabilities 9 1,066 2,947 146,907 154,948
Current Liabilities Trade and other payables 5,824 9,853 Borrowings 8 11,871 11,743 Lease liabilities 9 1,881 1,533 Current tax payable 1,717 - Bank overdraft - 4,308 21,293 27,437 Total Liabilities 168,200 182,385 Total Equity and Liabilities 557,701 562,531
Hulisani Group (Registration number 2015/363903/06) Trading as Hulisani Limited Financial Results for the year ended 28 February 2021
www.hulisani.co.za t: +27 (0) 87 806 2425 e: [email protected] a: 4th Floor, North Tower, 90 Rivonia Road, Sandton, South Africa, 2196
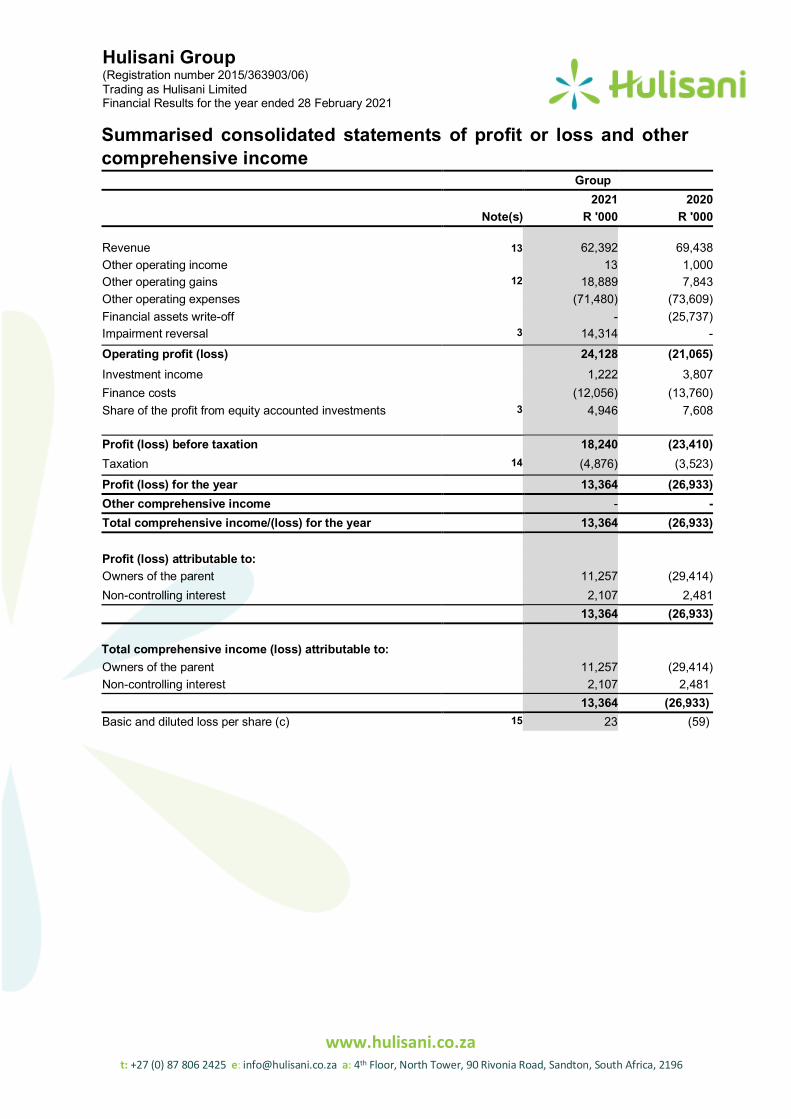
Summarised consolidated statements of profit or loss and other comprehensive income
Group 2021 2020 Note(s) R '000 R '000
Revenue 13 62,392 69,438 Other operating income 13 1,000 Other operating gains 12 18,889 7,843 Other operating expenses (71,480) (73,609) Financial assets write-off - (25,737) Impairment reversal 3 14,314 - Operating profit (loss) 24,128 (21,065) Investment income 1,222 3,807 Finance costs (12,056) (13,760) Share of the profit from equity accounted investments 3 4,946 7,608
Profit (loss) before taxation 18,240 (23,410) Taxation 14 (4,876) (3,523)
Profit (loss) for the year 13,364 (26,933) Other comprehensive income - - Total comprehensive income/(loss) for the year 13,364 (26,933) Profit (loss) attributable to: Owners of the parent 11,257 (29,414) Non-controlling interest 2,107 2,481 13,364 (26,933) Total comprehensive income (loss) attributable to: Owners of the parent 11,257 (29,414) Non-controlling interest 2,107 2,481 13,364 (26,933) Basic and diluted loss per share (c) 15 23 (59)
Hulisani Group (Registration number 2015/363903/06) Trading as Hulisani Limited Financial Results for the year ended 28 February 2021
www.hulisani.co.za t: +27 (0) 87 806 2425 e: [email protected] a: 4th Floor, North Tower, 90 Rivonia Road, Sandton, South Africa, 2196
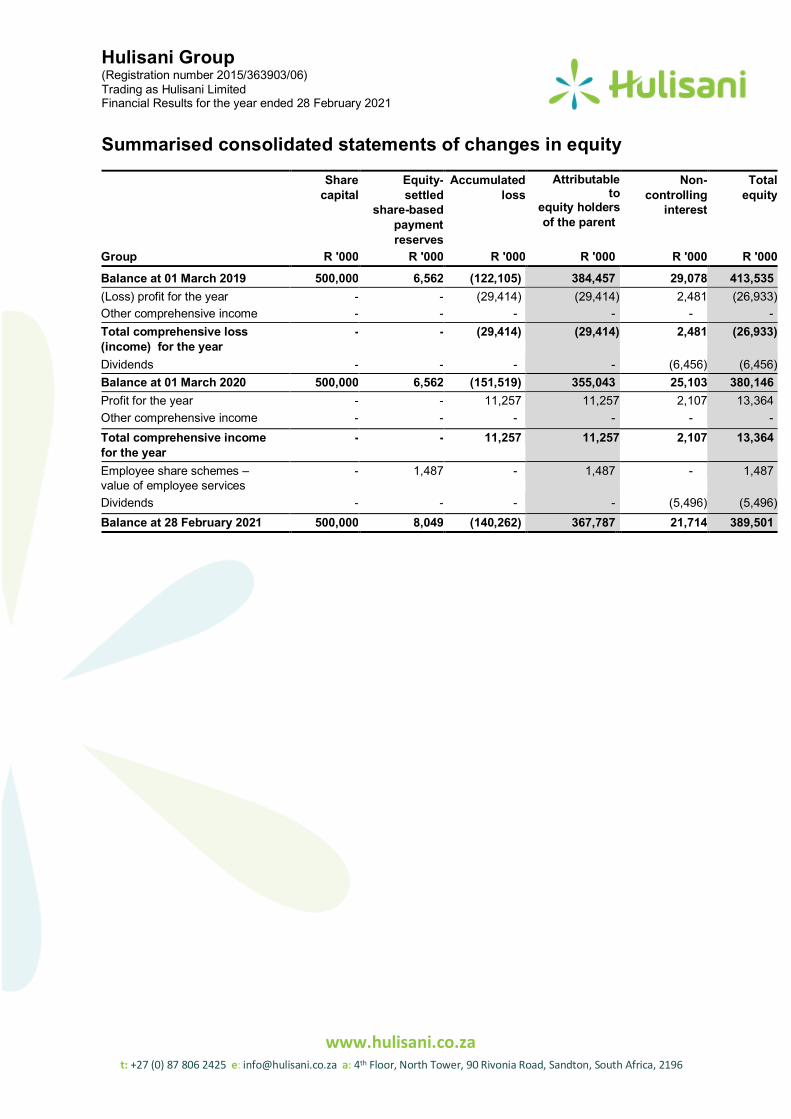
Summarised consolidated statements of changes in equity
Share capital
Equity-settled
share-based payment reserves
Accumulated loss
Attributable to
equity holders of the parent
Non-controlling
interest
Total equity
Group R '000 R '000 R '000 R '000 R '000 R '000 Balance at 01 March 2019 500,000 6,562 (122,105) 384,457 29,078 413,535 (Loss) profit for the year - - (29,414) (29,414) 2,481 (26,933) Other comprehensive income - - - - - - Total comprehensive loss (income) for the year
- - (29,414) (29,414) 2,481 (26,933)
Dividends - - - - (6,456) (6,456) Balance at 01 March 2020 500,000 6,562 (151,519) 355,043 25,103 380,146 Profit for the year - - 11,257 11,257 2,107 13,364 Other comprehensive income - - - - - - Total comprehensive income for the year
- - 11,257 11,257 2,107 13,364
Employee share schemes – value of employee services
- 1,487 - 1,487 - 1,487
Dividends - - - - (5,496) (5,496) Balance at 28 February 2021 500,000 8,049 (140,262) 367,787 21,714 389,501
Hulisani Group (Registration number 2015/363903/06) Trading as Hulisani Limited Financial Results for the year ended 28 February 2021
www.hulisani.co.za t: +27 (0) 87 806 2425 e: [email protected] a: 4th Floor, North Tower, 90 Rivonia Road, Sandton, South Africa, 2196
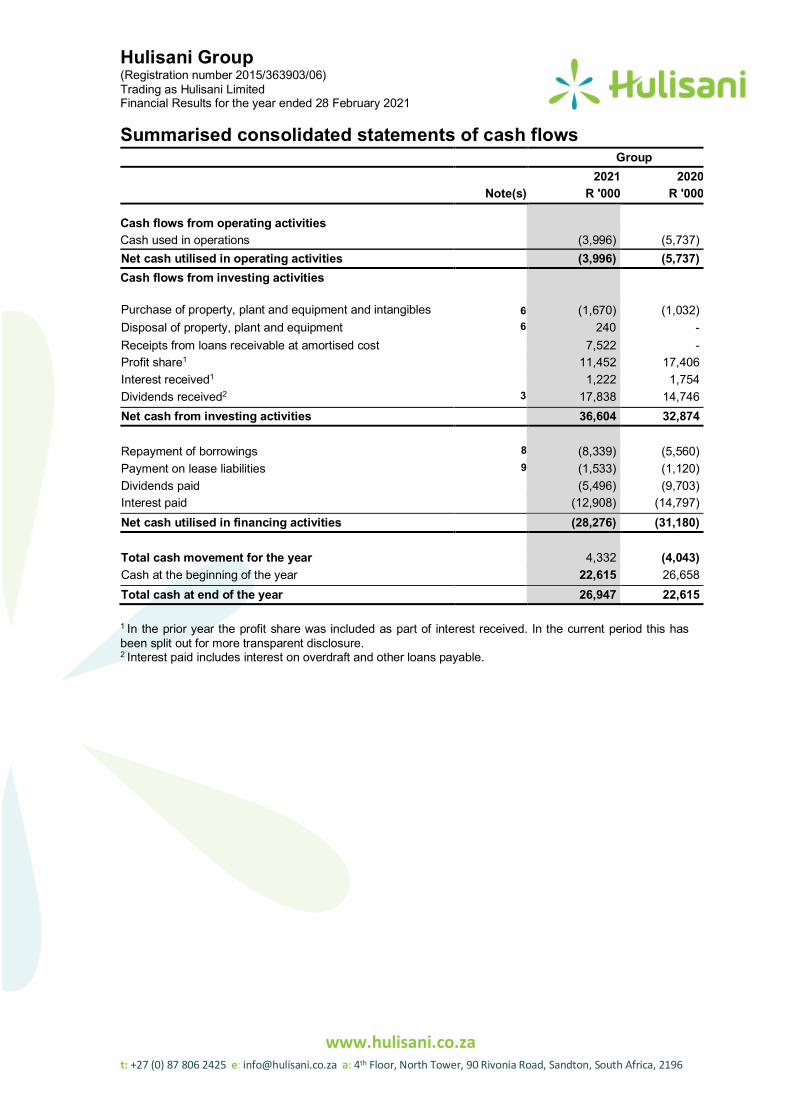
Summarised consolidated statements of cash flows Group 2021 2020 Note(s) R '000 R '000
Cash flows from operating activities Cash used in operations (3,996) (5,737) Net cash utilised in operating activities (3,996) (5,737) Cash flows from investing activities Purchase of property, plant and equipment and intangibles 6 (1,670) (1,032) Disposal of property, plant and equipment 6 240 - Receipts from loans receivable at amortised cost 7,522 - Profit share1 11,452 17,406 Interest received1 1,222 1,754 Dividends received2 3 17,838 14,746 Net cash from investing activities 36,604 32,874 Repayment of borrowings 8 (8,339) (5,560) Payment on lease liabilities 9 (1,533) (1,120) Dividends paid (5,496) (9,703) Interest paid (12,908) (14,797) Net cash utilised in financing activities (28,276) (31,180) Total cash movement for the year 4,332 (4,043) Cash at the beginning of the year 22,615 26,658 Total cash at end of the year 26,947 22,615 1 In the prior year the profit share was included as part of interest received. In the current period this has been split out for more transparent disclosure. 2 Interest paid includes interest on overdraft and other loans payable.
Hulisani Group (Registration number 2015/363903/06) Trading as Hulisani Limited Financial Results for the year ended 28 February 2021 Notes to the summarised consolidated annual financial statements
www.hulisani.co.za t: +27 (0) 87 806 2425 e: [email protected] a: 4th Floor, North Tower, 90 Rivonia Road, Sandton, South Africa, 2196
1. Basis for presentation The summarised consolidated financial statements for the year ended 28 February 2021 have been prepared in accordance with the JSE Limited Listings Requirements (“Listings Requirements”) for preliminary reports and the requirements of the Companies Act, Act 71 of 2008. The Listings Requirements require financial statements to be prepared in accordance with the framework concepts and the measurement and recognition requirements of International Financial Reporting Standards (IFRS), the SAICA Financial Reporting Guides as issued by the Accounting Practices Committee and Financial Reporting Pronouncements as issued by the Financial Reporting Standards Council, and contain the information required by IAS 34 Interim Financial Reporting. The summarised consolidated financial information should be read in conjunction with the consolidated financial statements for the year ended 28 February 2021, which have been prepared in accordance with IFRS. The summarised consolidated financial statements were prepared under the supervision of the chief financial officer, MP Dem, CA (SA).
Audit opinion This summarised report is extracted from audited information but is not itself audited. The annual financial statements were audited by BDO South Africa Inc., who expressed an unmodified opinion thereon. The audited annual financial statements and the auditor’s report thereon are available for inspection at the Company’s registered office and on the Company’s website www.hulisani.co.za. The directors take full responsibility for the preparation of the summarised consolidated financial statements and confirm that the financial information has been correctly extracted from the underlying annual financial statements.
Accounting policies
The accounting policies applied in preparing the summarised consolidated financial statements comply with IFRS and consistent with those applied in the previous annual financial statements.
2. Significant judgements and sources of estimation uncertainty
The preparation of financial statements in conformity with IFRS requires management, from time to time, to make judgements, estimates and assumptions that affect the application of policies and reported amounts of assets, liabilities, income and expenses. These estimates and associated assumptions are based on experience and various other factors that are believed to be reasonable under the circumstances. Actual results may differ from these estimates. The estimates and underlying assumptions are reviewed on an ongoing basis. Revisions to accounting estimates are recognised in the period in which the estimates are revised and in any future periods affected.
The areas involving significant judgements are:
(i) Investment in an associate decision.
Hulisani holds 100% of issued shares in Red Cap Investments (Pty) ("Red Cap”) Ltd and Eurocape Renewables (Pty) Ltd ("Eurocape"). Red Cap and Eurocape hold 5.46% and 1.21% interest in Kouga Wind Farm (RF) (Pty) Ltd respectively, combined to 6.67%. Refer to note 3 for detail.
Hulisani management made a judgement regarding the classification of this acquisition as to an investment in associates as Hulisani has a 25% directorship representation on the board of the investee. The board representation indicates a level of significant influence by Hulisani.
(ii) Classification of the GRI financial asset
Hulisani holds 100% of issued shares in Pele SPV13. Pele SPV13 holds a 25% interest in GRI Wind Steel South Africa (Pty) Ltd (“GRI)”). GRI Renewable Industry, S.L granted Pele SPV13 (Pty) Ltd ("Pele SPV13”) a put option to sell the shares back to GRI Renewable Industry, S.L for the purchase price less any dividends received from GRI up to date of exercise of the put option. Hulisani accounted for the acquisition of shares and the granting of the put option as a single unit of account as the counterparty in both cases is the same and each constituted an integral part of a single transaction. The conclusion on the transaction is that the risks and
Hulisani Group (Registration number 2015/363903/06) Trading as Hulisani Limited Financial Results for the year ended 28 February 2021 Notes to the summarised consolidated annual financial statements
www.hulisani.co.za t: +27 (0) 87 806 2425 e: [email protected] a: 4th Floor, North Tower, 90 Rivonia Road, Sandton, South Africa, 2196
2. Significant judgements and sources of estimation uncertainty (continued)
rewards associated with the current ownership interest in GRI have not transferred to Hulisani. The substance of the
transaction is that Hulisani has a call option to acquire 25% of GRI with the strike price paid in advance. As such Hulisani has accounted for the transaction on the basis that it holds two instruments, namely the right to receive cash as well as an option to acquire 25% ownership interest in GRI in the future for a fixed price. Therefore, both instruments are classified as a financial asset at fair value through profit or loss within the scope of IFRS 9, with the option determined to have an immaterial fair value. Refer to note 4 for detail.
The areas involving estimation uncertainty are:
(iii) IFRS 9 Expected Credit Losses
Hulisani management made a judgement regarding the assessment of receivables for impairments using reasonable and supportable information that was available without undue cost or effort in accordance with the requirements of IFRS 9 to determine the credit loss allowance of the respective items at the date they were initially recognised and at the reporting date. The loss allowances for financial assets are based on assumptions about risk of default and expected loss rates. The group uses estimate in making these assumptions and selecting the inputs to the impairment calculation, based on the group’s history, existing market conditions as well as forward looking estimates at the end of each reporting period.
(iv) Estimated fair value of the GRI financial asset The substance of the transaction is that Hulisani has a call option to acquire 25% of GRI with the strike price paid in advance. As such Hulisani has accounted for the transaction on the basis that it holds two instruments; namely a right to receive cash carried at fair value which is the present value arrived at by discounting R82.5m for the time value of money plus the credit risk of GRI Renewable Industry, S.L, as well as an option to acquire GRI shares in the future with the fair value of the option determined through an option pricing model. For a call option to be in-the-money, the spot price is required to exceed exercise price. Since the Pele SPV 13 investment in GRI is worth a lot less than the purchase price less any dividends paid to Pele SPV 13, the call option is out of the money and was determined to have an immaterial fair value. Refer to note 4 for detail on the GRI financial asset.
(v) Leases
Management has had to make an estimation on whether the group will exercise an option to extend the leases when determining the lease term, by considering all facts and circumstance that create an economic value on the decision. It was decided that the extension option should not be included in the lease liability, because the group could replace the assets without significant cost or business disruption (refer to note 9). (vi) Estimated fair value of financial assets at fair value through profit or loss Hulisani holds a convertible loan to Legend Power Solutions (Pty) "(LPS"). The group carries the financial asset as an investment at fair value through profit or loss. The fair value is determined by discounting dividend income using the dividend discount method. The expected cash flows are discounted using an appropriate discount rate. In determining the fair value, the group made key assumptions on base revenue from underlying plant operations, discount rate and period of operation. The loan participates in 9% of distributable profits available to LPS’ shareholders. On maturity the loan will convert to 9% of equity in LPS (refer to note 4).
Hulisani Group (Registration number 2015/363903/06) Trading as Hulisani Limited Financial Results for the year ended 28 February 2021 Notes to the summarised consolidated annual financial statements
www.hulisani.co.za t: +27 (0) 87 806 2425 e: [email protected] a: 4th Floor, North Tower, 90 Rivonia Road, Sandton, South Africa, 2196
2. Significant judgements and sources of estimation uncertainty(continued)
(v) Pele SPV 198 option
Hulisani subscribed for preference shares of R41.25m Pele SPV198 and the preference share subscription agreement includes a requirement that Pele SPV198 pledges its shares held in Pele SPV13 to Hulisani until the preference share funding is repaid. Therefore, until such time as the preference shares have been repaid risks and rewards associated with the Pele SPV198 investment in Pele SPV13 have transferred to Hulisani and Pele SPV198 effectively has an option to acquire the 50% interest in Pele SPV13 once the preference share funding has been repaid. The option is carried as an equity-settled instrument by the group, while the company accounts for it as a cash-settled instrument.
(vii) Reversal of impairment of an investment in associate
In prior years the group recognised an impairment on its investment in associate, Kouga Wind Farm (Pty) Ltd (“Kouga”). The recoverable amount of the investment in Kouga was determined by calculating value in use. The recoverable amount is determined by using the dividend discount model. The expected dividends are discounted using an appropriate discount rate. In determining the expected dividends, the group made key assumptions on forecasted revenue and the discount rate (refer to note 3).
(viii) Goodwill impairment
The carrying value of goodwill in the group is R45m and arose on acquisition of a majority stake in RustMo1 Solar Farm (Pty) Ltd (“RustMo1”). RustMo1 is considered to be a separately identifiable cash generating unit and goodwill has been allocated to this cash generating unit. The recoverable amount of goodwill was based on value in use, using the dividend discount method. In determining the recoverable amount, the group made key assumptions on forecasted revenue and the discount rate (refer to note 7).
(ix) The impact of COVID-19 Management assessed the impact of COVID-19 to be immaterial on operations, other than the macro economic impact. Management does not expect COVID-19 to have a material adverse impact on the operations of Hulisani nor on the going concern assumption. Management believes that the group has enough liquidity to withstand the impact of COVID-19 and will remain a going concern until at least the next financial year end. (x) Deferred tax assets Deferred tax assets are raised to the extent that it is probable that future taxable profit will be available against which the unused tax losses and unused tax credits can be utilised. Assessment of future taxable profit is performed at every reporting date. Details of deferred taxation can be found in note 10.
Hulisani Group (Registration number 2015/363903/06) Trading as Hulisani Limited Financial Results for the year ended 28 February 2021 Notes to the summarised consolidated annual financial statements
www.hulisani.co.za t: +27 (0) 87 806 2425 e: [email protected] a: 4th Floor, North Tower, 90 Rivonia Road, Sandton, South Africa, 2196
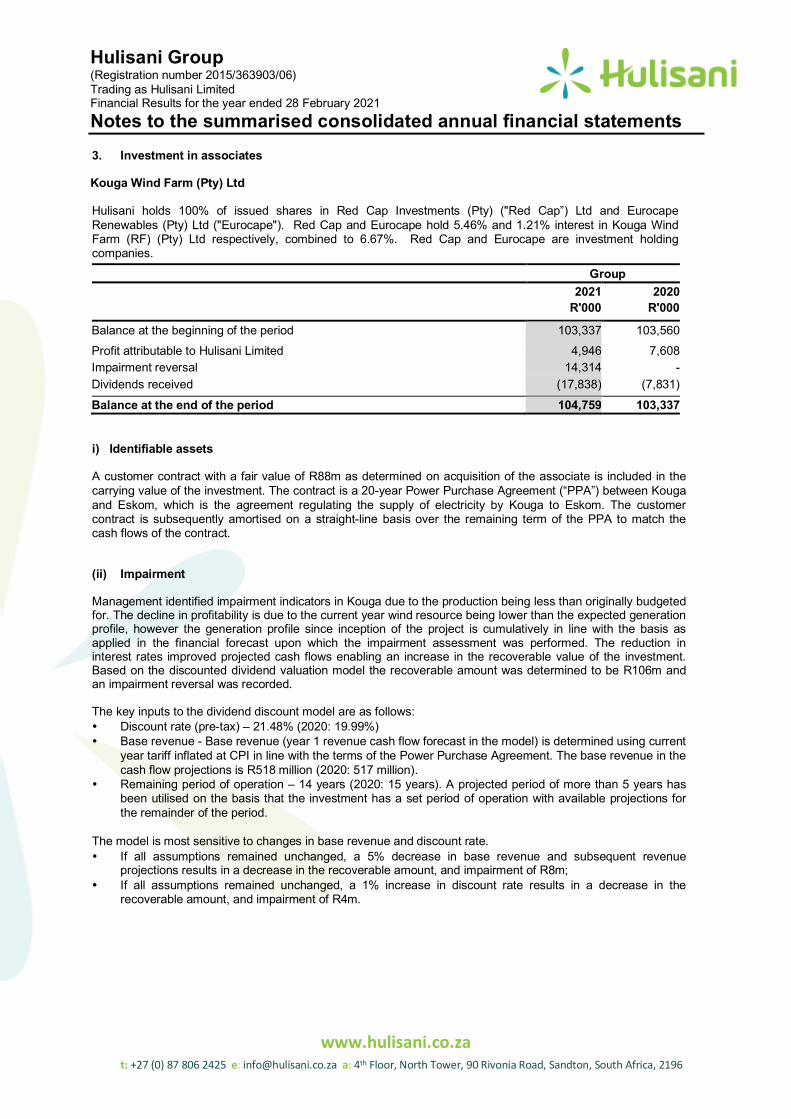
3. Investment in associates
Kouga Wind Farm (Pty) Ltd
Hulisani holds 100% of issued shares in Red Cap Investments (Pty) ("Red Cap”) Ltd and Eurocape Renewables (Pty) Ltd ("Eurocape"). Red Cap and Eurocape hold 5.46% and 1.21% interest in Kouga Wind Farm (RF) (Pty) Ltd respectively, combined to 6.67%. Red Cap and Eurocape are investment holding companies.
Group 2021 2020 R'000 R'000
Balance at the beginning of the period 103,337 103,560 Profit attributable to Hulisani Limited 4,946 7,608 Impairment reversal 14,314 - Dividends received (17,838) (7,831)
Balance at the end of the period 104,759 103,337
i) Identifiable assets
A customer contract with a fair value of R88m as determined on acquisition of the associate is included in the carrying value of the investment. The contract is a 20-year Power Purchase Agreement (“PPA”) between Kouga and Eskom, which is the agreement regulating the supply of electricity by Kouga to Eskom. The customer contract is subsequently amortised on a straight-line basis over the remaining term of the PPA to match the cash flows of the contract.
(ii) Impairment
Management identified impairment indicators in Kouga due to the production being less than originally budgeted for. The decline in profitability is due to the current year wind resource being lower than the expected generation profile, however the generation profile since inception of the project is cumulatively in line with the basis as applied in the financial forecast upon which the impairment assessment was performed. The reduction in interest rates improved projected cash flows enabling an increase in the recoverable value of the investment. Based on the discounted dividend valuation model the recoverable amount was determined to be R106m and an impairment reversal was recorded.
The key inputs to the dividend discount model are as follows: � Discount rate (pre-tax) – 21.48% (2020: 19.99%) � Base revenue - Base revenue (year 1 revenue cash flow forecast in the model) is determined using current
year tariff inflated at CPI in line with the terms of the Power Purchase Agreement. The base revenue in the cash flow projections is R518 million (2020: 517 million).
� Remaining period of operation – 14 years (2020: 15 years). A projected period of more than 5 years has been utilised on the basis that the investment has a set period of operation with available projections for the remainder of the period.
The model is most sensitive to changes in base revenue and discount rate. � If all assumptions remained unchanged, a 5% decrease in base revenue and subsequent revenue
projections results in a decrease in the recoverable amount, and impairment of R8m; � If all assumptions remained unchanged, a 1% increase in discount rate results in a decrease in the
recoverable amount, and impairment of R4m.
Hulisani Group (Registration number 2015/363903/06) Trading as Hulisani Limited Financial Results for the year ended 28 February 2021 Notes to the summarised consolidated annual financial statements
www.hulisani.co.za t: +27 (0) 87 806 2425 e: [email protected] a: 4th Floor, North Tower, 90 Rivonia Road, Sandton, South Africa, 2196
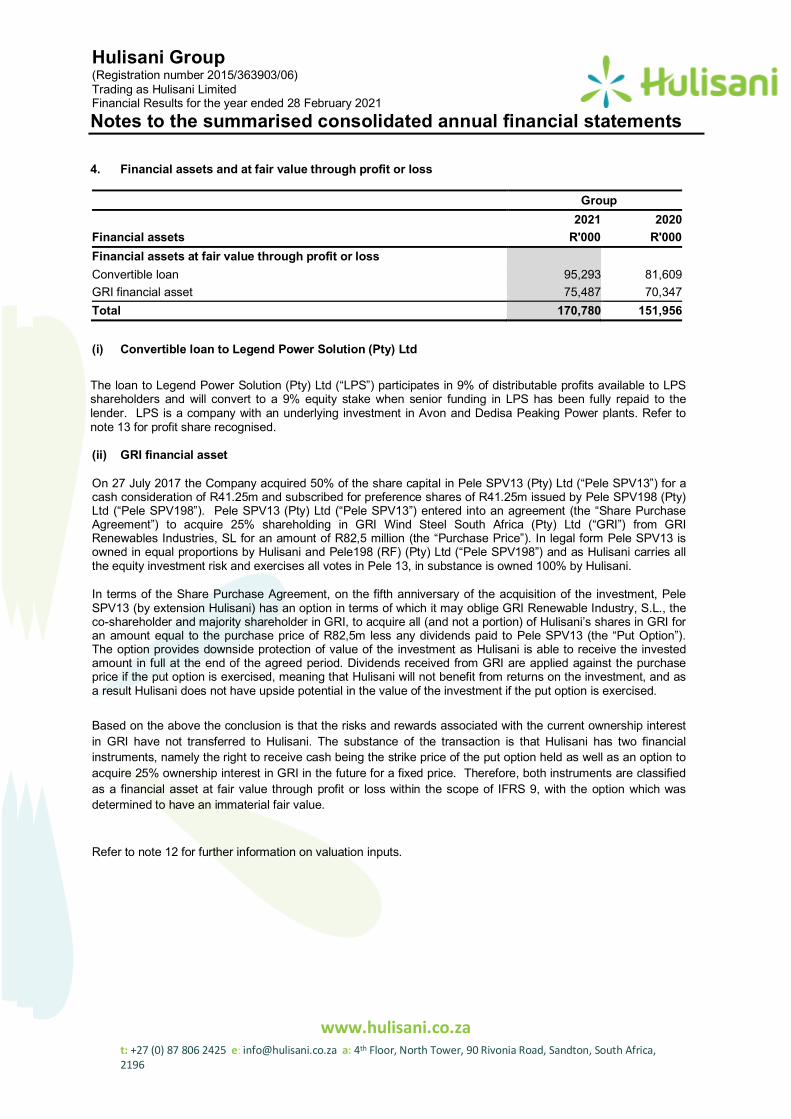
4. Financial assets and at fair value through profit or loss
Group 2021 2020
Financial assets R'000 R'000 Financial assets at fair value through profit or loss Convertible loan 95,293 81,609 GRI financial asset 75,487 70,347 Total 170,780 151,956
(i) Convertible loan to Legend Power Solution (Pty) Ltd
The loan to Legend Power Solution (Pty) Ltd (“LPS”) participates in 9% of distributable profits available to LPS shareholders and will convert to a 9% equity stake when senior funding in LPS has been fully repaid to the lender. LPS is a company with an underlying investment in Avon and Dedisa Peaking Power plants. Refer to note 13 for profit share recognised.
(ii) GRI financial asset
On 27 July 2017 the Company acquired 50% of the share capital in Pele SPV13 (Pty) Ltd (“Pele SPV13”) for a cash consideration of R41.25m and subscribed for preference shares of R41.25m issued by Pele SPV198 (Pty) Ltd (“Pele SPV198”). Pele SPV13 (Pty) Ltd (“Pele SPV13”) entered into an agreement (the “Share Purchase Agreement”) to acquire 25% shareholding in GRI Wind Steel South Africa (Pty) Ltd (“GRI”) from GRI Renewables Industries, SL for an amount of R82,5 million (the “Purchase Price”). In legal form Pele SPV13 is owned in equal proportions by Hulisani and Pele198 (RF) (Pty) Ltd (“Pele SPV198”) and as Hulisani carries all the equity investment risk and exercises all votes in Pele 13, in substance is owned 100% by Hulisani. In terms of the Share Purchase Agreement, on the fifth anniversary of the acquisition of the investment, Pele SPV13 (by extension Hulisani) has an option in terms of which it may oblige GRI Renewable Industry, S.L., the co-shareholder and majority shareholder in GRI, to acquire all (and not a portion) of Hulisani’s shares in GRI for an amount equal to the purchase price of R82,5m less any dividends paid to Pele SPV13 (the “Put Option”). The option provides downside protection of value of the investment as Hulisani is able to receive the invested amount in full at the end of the agreed period. Dividends received from GRI are applied against the purchase price if the put option is exercised, meaning that Hulisani will not benefit from returns on the investment, and as a result Hulisani does not have upside potential in the value of the investment if the put option is exercised.
Based on the above the conclusion is that the risks and rewards associated with the current ownership interest in GRI have not transferred to Hulisani. The substance of the transaction is that Hulisani has two financial instruments, namely the right to receive cash being the strike price of the put option held as well as an option to acquire 25% ownership interest in GRI in the future for a fixed price. Therefore, both instruments are classified as a financial asset at fair value through profit or loss within the scope of IFRS 9, with the option which was determined to have an immaterial fair value. Refer to note 12 for further information on valuation inputs.
Hulisani Group (Registration number 2015/363903/06) Trading as Hulisani Limited Financial Results for the year ended 28 February 2021 Notes to the summarised consolidated annual financial statements
www.hulisani.co.za t: +27 (0) 87 806 2425 e: [email protected] a: 4th Floor, North Tower, 90 Rivonia Road, Sandton, South Africa, 2196
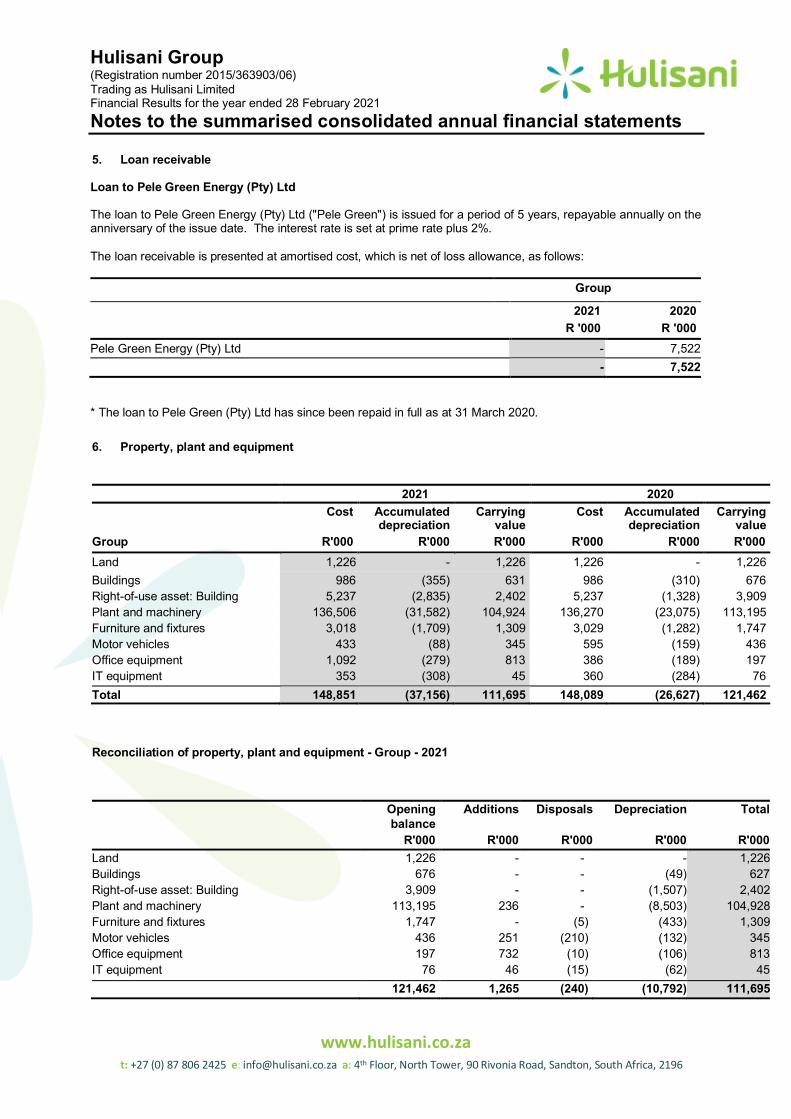
5. Loan receivable
Loan to Pele Green Energy (Pty) Ltd
The loan to Pele Green Energy (Pty) Ltd ("Pele Green") is issued for a period of 5 years, repayable annually on the anniversary of the issue date. The interest rate is set at prime rate plus 2%. The loan receivable is presented at amortised cost, which is net of loss allowance, as follows: Group
2021 2020 R '000 R '000 Pele Green Energy (Pty) Ltd - 7,522 - 7,522
* The loan to Pele Green (Pty) Ltd has since been repaid in full as at 31 March 2020.
6. Property, plant and equipment
2021 2020 Cost
Accumulated depreciation
Carrying value
Cost
Accumulated depreciation
Carrying value
Group R'000 R'000 R'000 R'000 R'000 R'000 Land 1,226 - 1,226 1,226 - 1,226 Buildings 986 (355) 631 986 (310) 676 Right-of-use asset: Building 5,237 (2,835) 2,402 5,237 (1,328) 3,909 Plant and machinery 136,506 (31,582) 104,924 136,270 (23,075) 113,195 Furniture and fixtures 3,018 (1,709) 1,309 3,029 (1,282) 1,747 Motor vehicles 433 (88) 345 595 (159) 436 Office equipment 1,092 (279) 813 386 (189) 197 IT equipment 353 (308) 45 360 (284) 76 Total 148,851 (37,156) 111,695 148,089 (26,627) 121,462
Reconciliation of property, plant and equipment - Group - 2021
Opening balance
Additions Disposals Depreciation Total
R'000 R'000 R'000 R'000 R'000 Land 1,226 - - - 1,226 Buildings 676 - - (49) 627 Right-of-use asset: Building 3,909 - - (1,507) 2,402 Plant and machinery 113,195 236 - (8,503) 104,928 Furniture and fixtures 1,747 - (5) (433) 1,309 Motor vehicles 436 251 (210) (132) 345 Office equipment 197 732 (10) (106) 813 IT equipment 76 46 (15) (62) 45 121,462 1,265 (240) (10,792) 111,695
Hulisani Group (Registration number 2015/363903/06) Trading as Hulisani Limited Financial Results for the year ended 28 February 2021 Notes to the summarised consolidated annual financial statements
www.hulisani.co.za t: +27 (0) 87 806 2425 e: [email protected] a: 4th Floor, North Tower, 90 Rivonia Road, Sandton, South Africa, 2196
6. Property, plant and equipment (continued)
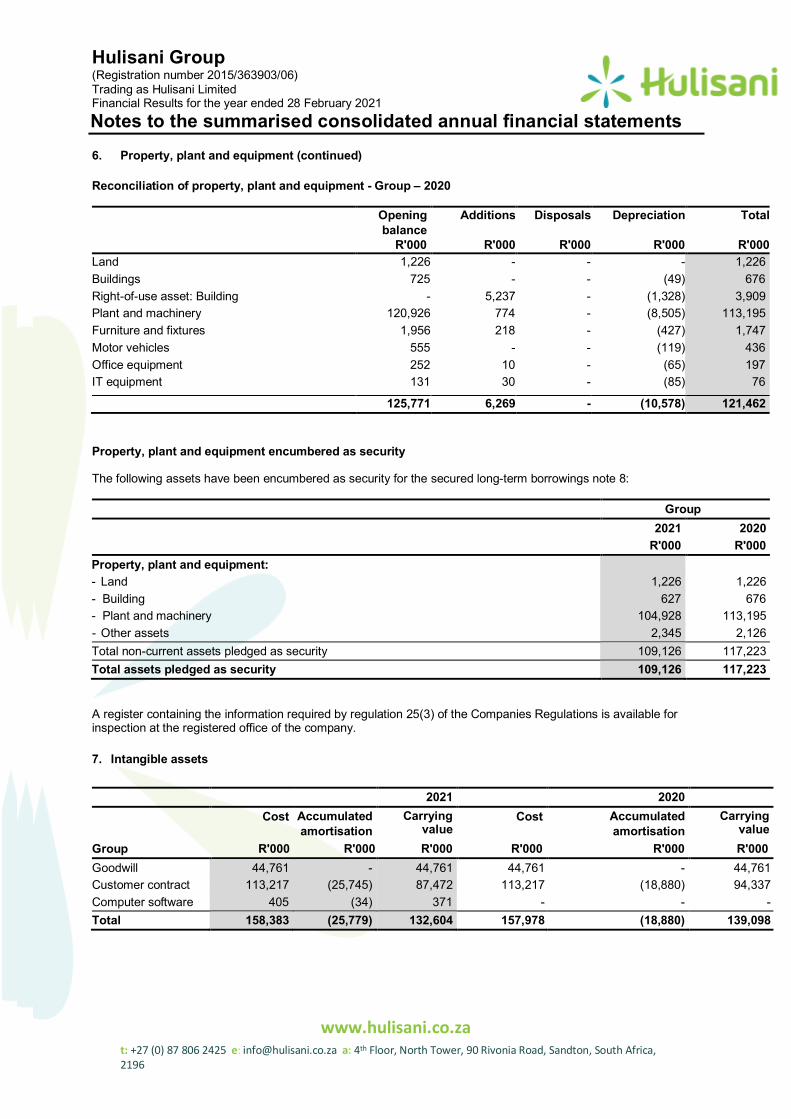
Reconciliation of property, plant and equipment - Group – 2020
Opening balance
Additions Disposals Depreciation Total
R'000 R'000 R'000 R'000 R'000 Land 1,226 - - - 1,226 Buildings 725 - - (49) 676 Right-of-use asset: Building - 5,237 - (1,328) 3,909 Plant and machinery 120,926 774 - (8,505) 113,195 Furniture and fixtures 1,956 218 - (427) 1,747 Motor vehicles 555 - - (119) 436 Office equipment 252 10 - (65) 197 IT equipment 131 30 - (85) 76
125,771 6,269 - (10,578) 121,462
Property, plant and equipment encumbered as security
The following assets have been encumbered as security for the secured long-term borrowings note 8:
Group 2021 2020 R'000 R'000 Property, plant and equipment: - Land 1,226 1,226 - Building 627 676 - Plant and machinery 104,928 113,195 - Other assets 2,345 2,126 Total non-current assets pledged as security 109,126 117,223 Total assets pledged as security 109,126 117,223
A register containing the information required by regulation 25(3) of the Companies Regulations is available for inspection at the registered office of the company.
7. Intangible assets
2021 2020 Cost Accumulated
amortisation Carrying
value Cost Accumulated
amortisation Carrying
value Group R'000 R'000 R'000 R'000 R'000 R'000 Goodwill 44,761 - 44,761 44,761 - 44,761 Customer contract 113,217 (25,745) 87,472 113,217 (18,880) 94,337 Computer software 405 (34) 371 - - - Total 158,383 (25,779) 132,604 157,978 (18,880) 139,098
Hulisani Group (Registration number 2015/363903/06) Trading as Hulisani Limited Financial Results for the year ended 28 February 2021 Notes to the summarised consolidated annual financial statements
www.hulisani.co.za t: +27 (0) 87 806 2425 e: [email protected] a: 4th Floor, North Tower, 90 Rivonia Road, Sandton, South Africa, 2196
7. Intangible assets (continued)
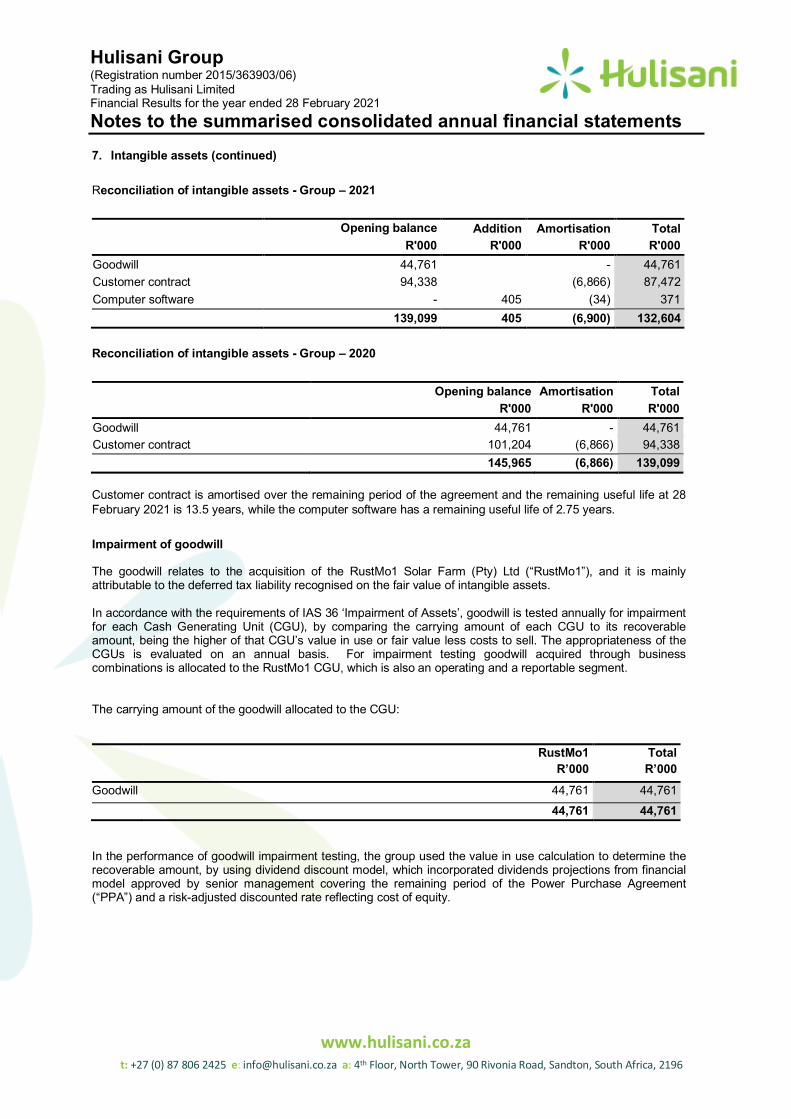
Reconciliation of intangible assets - Group – 2021
Opening balance Addition Amortisation Total R'000 R'000 R'000 R'000 Goodwill 44,761 - 44,761 Customer contract 94,338 (6,866) 87,472 Computer software - 405 (34) 371 139,099 405 (6,900) 132,604
Reconciliation of intangible assets - Group – 2020
Opening balance Amortisation Total R'000 R'000 R'000 Goodwill 44,761 - 44,761 Customer contract 101,204 (6,866) 94,338 145,965 (6,866) 139,099
Customer contract is amortised over the remaining period of the agreement and the remaining useful life at 28 February 2021 is 13.5 years, while the computer software has a remaining useful life of 2.75 years. Impairment of goodwill
The goodwill relates to the acquisition of the RustMo1 Solar Farm (Pty) Ltd (“RustMo1”), and it is mainly attributable to the deferred tax liability recognised on the fair value of intangible assets. In accordance with the requirements of IAS 36 ‘Impairment of Assets’, goodwill is tested annually for impairment for each Cash Generating Unit (CGU), by comparing the carrying amount of each CGU to its recoverable amount, being the higher of that CGU’s value in use or fair value less costs to sell. The appropriateness of the CGUs is evaluated on an annual basis. For impairment testing goodwill acquired through business combinations is allocated to the RustMo1 CGU, which is also an operating and a reportable segment. The carrying amount of the goodwill allocated to the CGU:
RustMo1 Total R’000 R’000 Goodwill 44,761 44,761
44,761 44,761
In the performance of goodwill impairment testing, the group used the value in use calculation to determine the recoverable amount, by using dividend discount model, which incorporated dividends projections from financial model approved by senior management covering the remaining period of the Power Purchase Agreement (“PPA”) and a risk-adjusted discounted rate reflecting cost of equity.
Hulisani Group (Registration number 2015/363903/06) Trading as Hulisani Limited Financial Results for the year ended 28 February 2021 Notes to the summarised consolidated annual financial statements
www.hulisani.co.za t: +27 (0) 87 806 2425 e: [email protected] a: 4th Floor, North Tower, 90 Rivonia Road, Sandton, South Africa, 2196
7. Intangible assets (continued)
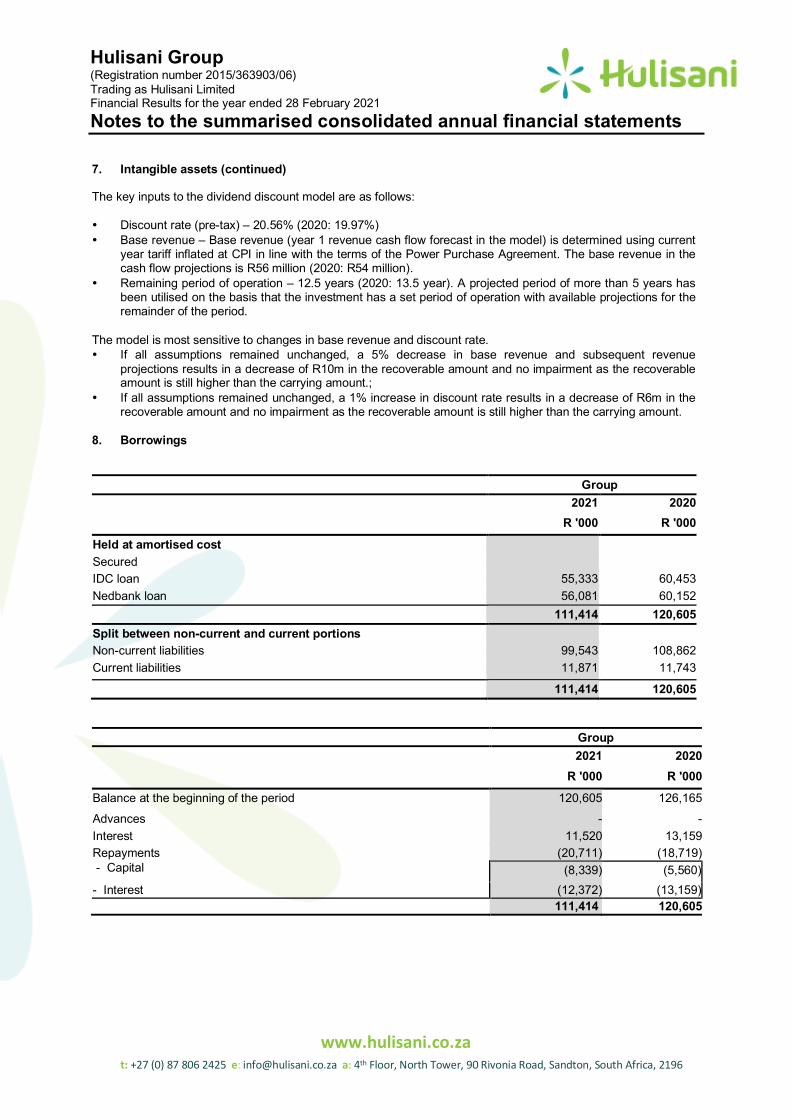
The key inputs to the dividend discount model are as follows: � Discount rate (pre-tax) – 20.56% (2020: 19.97%) � Base revenue – Base revenue (year 1 revenue cash flow forecast in the model) is determined using current
year tariff inflated at CPI in line with the terms of the Power Purchase Agreement. The base revenue in the cash flow projections is R56 million (2020: R54 million).
� Remaining period of operation – 12.5 years (2020: 13.5 year). A projected period of more than 5 years has been utilised on the basis that the investment has a set period of operation with available projections for the remainder of the period.
The model is most sensitive to changes in base revenue and discount rate. � If all assumptions remained unchanged, a 5% decrease in base revenue and subsequent revenue
projections results in a decrease of R10m in the recoverable amount and no impairment as the recoverable amount is still higher than the carrying amount.;
� If all assumptions remained unchanged, a 1% increase in discount rate results in a decrease of R6m in the recoverable amount and no impairment as the recoverable amount is still higher than the carrying amount.
8. Borrowings
Group 2021 2020 R '000 R '000 Held at amortised cost Secured IDC loan 55,333 60,453 Nedbank loan 56,081 60,152 111,414 120,605 Split between non-current and current portions Non-current liabilities 99,543 108,862 Current liabilities 11,871 11,743
111,414 120,605
Group 2021 2020 R '000 R '000 Balance at the beginning of the period 120,605 126,165
Advances - - Interest 11,520 13,159 Repayments - Capital
(20,711) (18,719) (8,339) (5,560)
- Interest (12,372) (13,159) 111,414 120,605
Hulisani Group (Registration number 2015/363903/06) Trading as Hulisani Limited Financial Results for the year ended 28 February 2021 Notes to the summarised consolidated annual financial statements
www.hulisani.co.za t: +27 (0) 87 806 2425 e: [email protected] a: 4th Floor, North Tower, 90 Rivonia Road, Sandton, South Africa, 2196
8. Borrowings (continued)
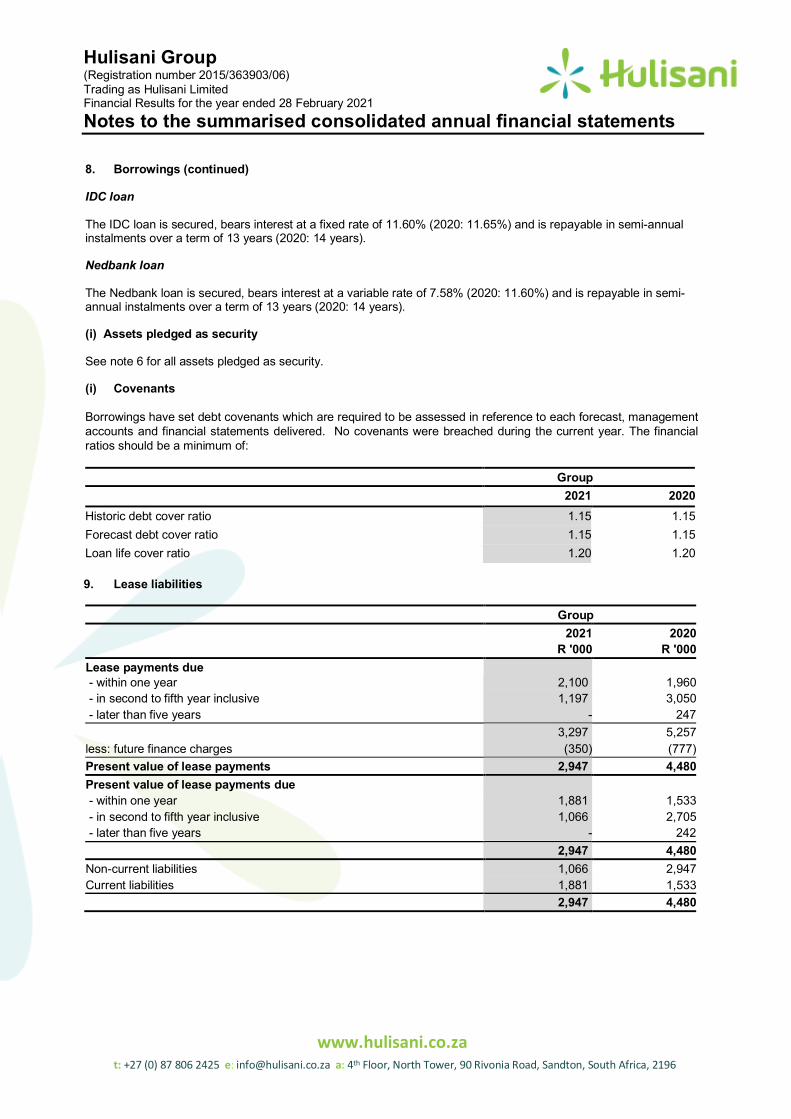
IDC loan
The IDC loan is secured, bears interest at a fixed rate of 11.60% (2020: 11.65%) and is repayable in semi-annual instalments over a term of 13 years (2020: 14 years).
Nedbank loan
The Nedbank loan is secured, bears interest at a variable rate of 7.58% (2020: 11.60%) and is repayable in semi-annual instalments over a term of 13 years (2020: 14 years).
(i) Assets pledged as security
See note 6 for all assets pledged as security.
(i) Covenants Borrowings have set debt covenants which are required to be assessed in reference to each forecast, management accounts and financial statements delivered. No covenants were breached during the current year. The financial ratios should be a minimum of: Group 2021 2020 Historic debt cover ratio 1.15 1.15 Forecast debt cover ratio 1.15 1.15 Loan life cover ratio 1.20 1.20
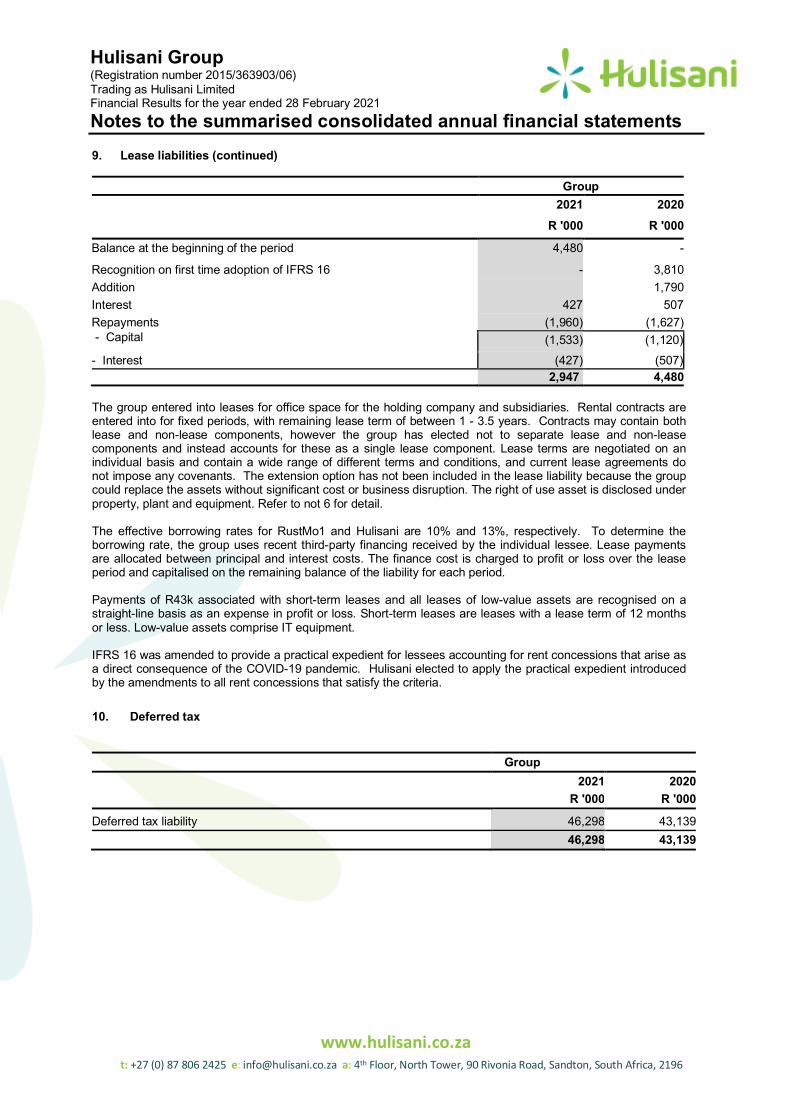
9. Lease liabilities
Group 2021 2020 R '000 R '000 Lease payments due - within one year 2,100 1,960 - in second to fifth year inclusive 1,197 3,050 - later than five years - 247 3,297 5,257 less: future finance charges (350) (777) Present value of lease payments 2,947 4,480 Present value of lease payments due - within one year 1,881 1,533 - in second to fifth year inclusive 1,066 2,705 - later than five years - 242 2,947 4,480 Non-current liabilities 1,066 2,947 Current liabilities 1,881 1,533 2,947 4,480
Hulisani Group (Registration number 2015/363903/06) Trading as Hulisani Limited Financial Results for the year ended 28 February 2021 Notes to the summarised consolidated annual financial statements
www.hulisani.co.za t: +27 (0) 87 806 2425 e: [email protected] a: 4th Floor, North Tower, 90 Rivonia Road, Sandton, South Africa, 2196
9. Lease liabilities (continued)
Group 2021 2020 R '000 R '000
Balance at the beginning of the period 4,480 -
Recognition on first time adoption of IFRS 16 - 3,810 Addition 1,790 Interest 427 507 Repayments - Capital
(1,960) (1,627) (1,533) (1,120)
- Interest (427) (507) 2,947 4,480
The group entered into leases for office space for the holding company and subsidiaries. Rental contracts are entered into for fixed periods, with remaining lease term of between 1 - 3.5 years. Contracts may contain both lease and non-lease components, however the group has elected not to separate lease and non-lease components and instead accounts for these as a single lease component. Lease terms are negotiated on an individual basis and contain a wide range of different terms and conditions, and current lease agreements do not impose any covenants. The extension option has not been included in the lease liability because the group could replace the assets without significant cost or business disruption. The right of use asset is disclosed under property, plant and equipment. Refer to not 6 for detail. The effective borrowing rates for RustMo1 and Hulisani are 10% and 13%, respectively. To determine the borrowing rate, the group uses recent third-party financing received by the individual lessee. Lease payments are allocated between principal and interest costs. The finance cost is charged to profit or loss over the lease period and capitalised on the remaining balance of the liability for each period. Payments of R43k associated with short-term leases and all leases of low-value assets are recognised on a straight-line basis as an expense in profit or loss. Short-term leases are leases with a lease term of 12 months or less. Low-value assets comprise IT equipment. IFRS 16 was amended to provide a practical expedient for lessees accounting for rent concessions that arise as a direct consequence of the COVID-19 pandemic. Hulisani elected to apply the practical expedient introduced by the amendments to all rent concessions that satisfy the criteria.
10. Deferred tax
Group 2021 2020 R '000 R '000
Deferred tax liability 46,298 43,139 46,298 43,139
Hulisani Group (Registration number 2015/363903/06) Trading as Hulisani Limited Financial Results for the year ended 28 February 2021 Notes to the summarised consolidated annual financial statements
www.hulisani.co.za t: +27 (0) 87 806 2425 e: [email protected] a: 4th Floor, North Tower, 90 Rivonia Road, Sandton, South Africa, 2196
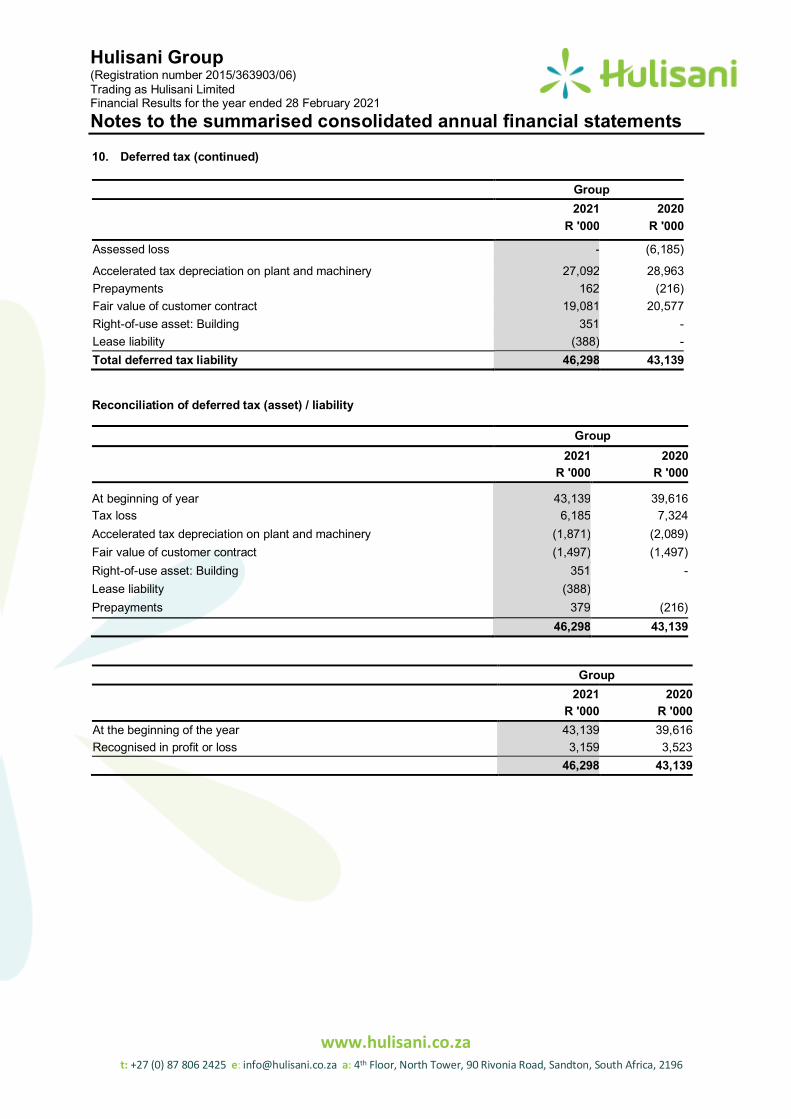
10. Deferred tax (continued)
Group 2021 2020
R '000 R '000
Assessed loss - (6,185)
Accelerated tax depreciation on plant and machinery 27,092 28,963 Prepayments 162 (216) Fair value of customer contract 19,081 20,577 Right-of-use asset: Building 351 - Lease liability (388) - Total deferred tax liability 46,298 43,139
Reconciliation of deferred tax (asset) / liability
Group 2021 2020 R '000 R '000
At beginning of year 43,139 39,616 Tax loss 6,185 7,324 Accelerated tax depreciation on plant and machinery (1,871) (2,089) Fair value of customer contract (1,497) (1,497) Right-of-use asset: Building 351 - Lease liability (388) Prepayments 379 (216)
46,298 43,139
Group 2021 2020 R '000 R '000
At the beginning of the year 43,139 39,616 Recognised in profit or loss 3,159 3,523 46,298 43,139
Hulisani Group (Registration number 2015/363903/06) Trading as Hulisani Limited Financial Results for the year ended 28 February 2021 Notes to the summarised consolidated annual financial statements
www.hulisani.co.za t: +27 (0) 87 806 2425 e: [email protected] a: 4th Floor, North Tower, 90 Rivonia Road, Sandton, South Africa, 2196
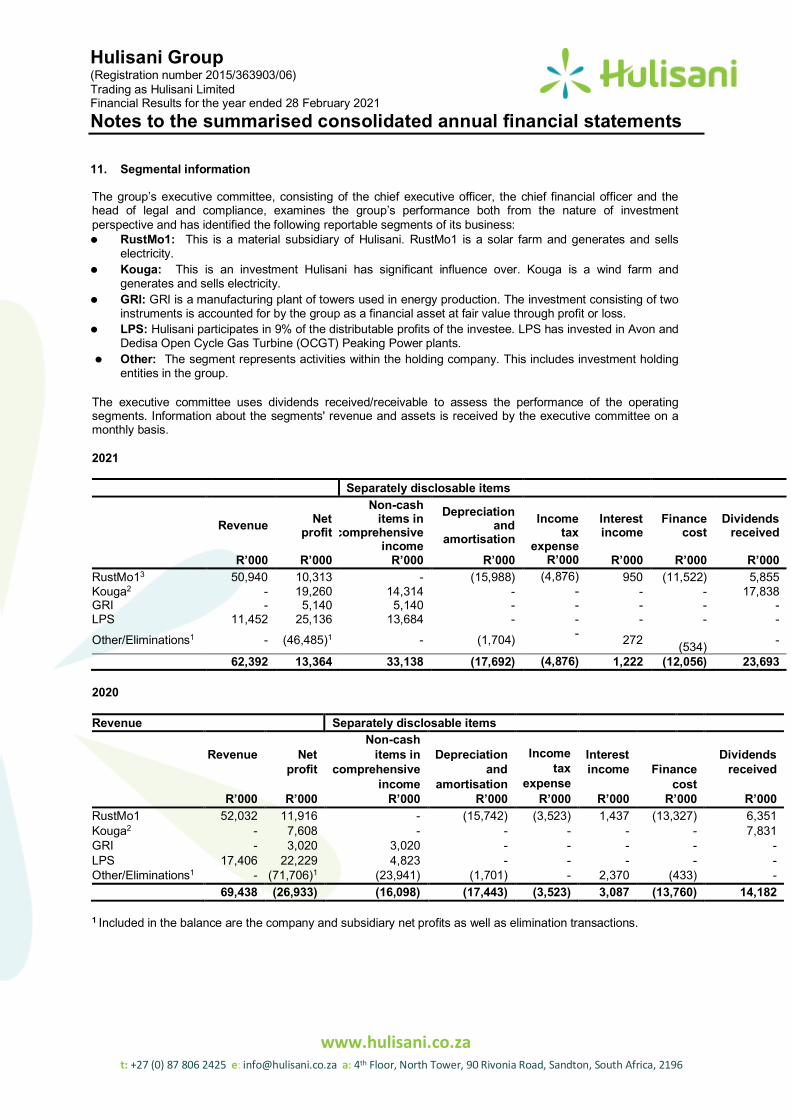
11. Segmental information The group’s executive committee, consisting of the chief executive officer, the chief financial officer and the head of legal and compliance, examines the group’s performance both from the nature of investment perspective and has identified the following reportable segments of its business: • RustMo1: This is a material subsidiary of Hulisani. RustMo1 is a solar farm and generates and sells
electricity. • Kouga: This is an investment Hulisani has significant influence over. Kouga is a wind farm and
generates and sells electricity. • GRI: GRI is a manufacturing plant of towers used in energy production. The investment consisting of two
instruments is accounted for by the group as a financial asset at fair value through profit or loss. • LPS: Hulisani participates in 9% of the distributable profits of the investee. LPS has invested in Avon and
Dedisa Open Cycle Gas Turbine (OCGT) Peaking Power plants. • Other: The segment represents activities within the holding company. This includes investment holding
entities in the group.
The executive committee uses dividends received/receivable to assess the performance of the operating segments. Information about the segments' revenue and assets is received by the executive committee on a monthly basis.
2021
Separately disclosable items
Revenue Net profit
Non-cash items in
comprehensive income
Depreciation and
amortisation
Income
tax expense
Interest income
Finance cost
Dividends received
R’000 R’000 R’000 R’000 R’000 R’000 R’000 R’000 RustMo13 50,940 10,313 - (15,988) (4,876) 950 (11,522) 5,855 Kouga2 - 19,260 14,314 - - - - 17,838 GRI - 5,140 5,140 - - - - - LPS 11,452 25,136 13,684 - - - - -
Other/Eliminations1 - (46,485)1 - (1,704) - 272 (534) -
62,392 13,364 33,138 (17,692) (4,876) 1,222 (12,056) 23,693
2020
Revenue Separately disclosable items
Revenue
Net profit
Non-cash items in
comprehensive income
Depreciation
and amortisation
Income
tax expense
Interest income
Finance cost
Dividends
received
R’000 R’000 R’000 R’000 R’000 R’000 R’000 R’000 RustMo1 52,032 11,916 - (15,742) (3,523) 1,437 (13,327) 6,351 Kouga2 - 7,608 - - - - - 7,831 GRI - 3,020 3,020 - - - - - LPS 17,406 22,229 4,823 - - - - - Other/Eliminations1 - (71,706)1 (23,941) (1,701) - 2,370 (433) - 69,438 (26,933) (16,098) (17,443) (3,523) 3,087 (13,760) 14,182
1 Included in the balance are the company and subsidiary net profits as well as elimination transactions.
Hulisani Group (Registration number 2015/363903/06) Trading as Hulisani Limited Financial Results for the year ended 28 February 2021 Notes to the summarised consolidated annual financial statements
www.hulisani.co.za t: +27 (0) 87 806 2425 e: [email protected] a: 4th Floor, North Tower, 90 Rivonia Road, Sandton, South Africa, 2196
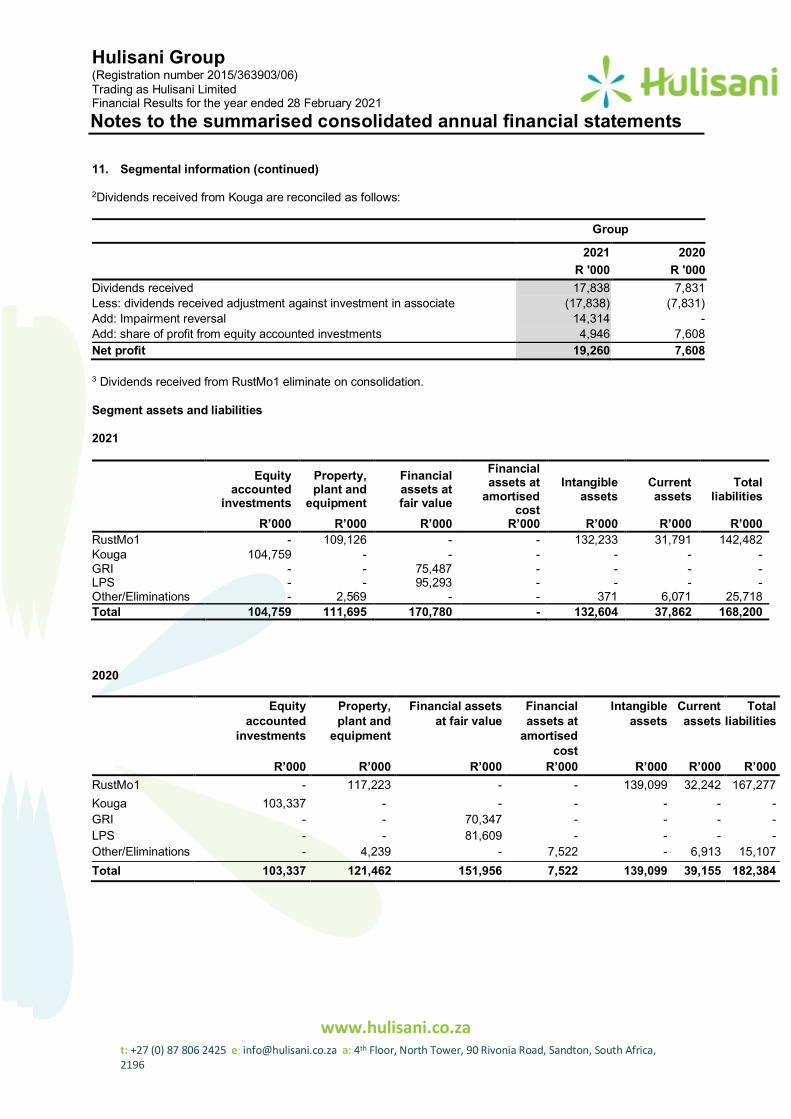
11. Segmental information (continued)
2Dividends received from Kouga are reconciled as follows:
Group
2021 2020 R '000 R '000 Dividends received 17,838 7,831 Less: dividends received adjustment against investment in associate (17,838) (7,831) Add: Impairment reversal 14,314 - Add: share of profit from equity accounted investments 4,946 7,608 Net profit 19,260 7,608
3 Dividends received from RustMo1 eliminate on consolidation.
Segment assets and liabilities
2021
Equity
accounted investments
Property, plant and
equipment
Financial assets at fair value
Financial assets at
amortised cost
Intangible assets
Current assets
Total liabilities
R’000 R’000 R’000 R’000 R’000 R’000 R’000 RustMo1 - 109,126 - - 132,233 31,791 142,482 Kouga 104,759 - - - - - - GRI - - 75,487 - - - - LPS - - 95,293 - - - - Other/Eliminations - 2,569 - - 371 6,071 25,718 Total 104,759 111,695 170,780 - 132,604 37,862 168,200
2020
Equity accounted
investments
Property, plant and
equipment
Financial assets at fair value
Financial assets at
amortised cost
Intangible assets
Current assets
Total liabilities
R’000 R’000 R’000 R’000 R’000 R’000 R’000 RustMo1 - 117,223 - - 139,099 32,242 167,277 Kouga 103,337 - - - - - - GRI - - 70,347 - - - - LPS - - 81,609 - - - - Other/Eliminations - 4,239 - 7,522 - 6,913 15,107 Total 103,337 121,462 151,956 7,522 139,099 39,155 182,384
Hulisani Group (Registration number 2015/363903/06) Trading as Hulisani Limited Financial Results for the year ended 28 February 2021 Notes to the summarised consolidated annual financial statements
www.hulisani.co.za t: +27 (0) 87 806 2425 e: [email protected] a: 4th Floor, North Tower, 90 Rivonia Road, Sandton, South Africa, 2196
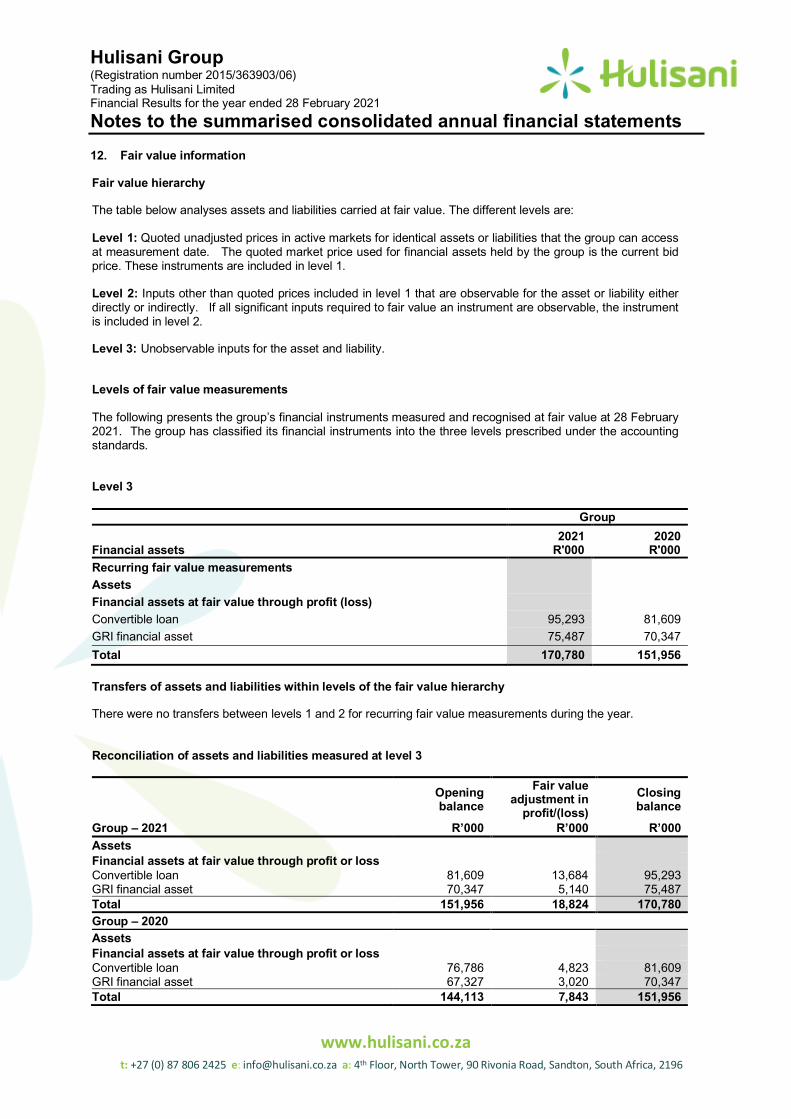
12. Fair value information
Fair value hierarchy
The table below analyses assets and liabilities carried at fair value. The different levels are:
Level 1: Quoted unadjusted prices in active markets for identical assets or liabilities that the group can access at measurement date. The quoted market price used for financial assets held by the group is the current bid price. These instruments are included in level 1.
Level 2: Inputs other than quoted prices included in level 1 that are observable for the asset or liability either directly or indirectly. If all significant inputs required to fair value an instrument are observable, the instrument is included in level 2.
Level 3: Unobservable inputs for the asset and liability.
Levels of fair value measurements
The following presents the group’s financial instruments measured and recognised at fair value at 28 February 2021. The group has classified its financial instruments into the three levels prescribed under the accounting standards.
Level 3
Group
2021 2020 Financial assets R'000 R'000 Recurring fair value measurements Assets Financial assets at fair value through profit (loss) Convertible loan 95,293 81,609 GRI financial asset 75,487 70,347 Total 170,780 151,956 Transfers of assets and liabilities within levels of the fair value hierarchy
There were no transfers between levels 1 and 2 for recurring fair value measurements during the year.
Reconciliation of assets and liabilities measured at level 3
Opening balance
Fair value adjustment in
profit/(loss) Closing balance
Group – 2021 R’000 R’000 R’000 Assets Financial assets at fair value through profit or loss Convertible loan 81,609 13,684 95,293 GRI financial asset 70,347 5,140 75,487 Total 151,956 18,824 170,780 Group – 2020 Assets Financial assets at fair value through profit or loss Convertible loan 76,786 4,823 81,609 GRI financial asset 67,327 3,020 70,347 Total 144,113 7,843 151,956
Hulisani Group (Registration number 2015/363903/06) Trading as Hulisani Limited Financial Results for the year ended 28 February 2021 Notes to the summarised consolidated annual financial statements
www.hulisani.co.za t: +27 (0) 87 806 2425 e: [email protected] a: 4th Floor, North Tower, 90 Rivonia Road, Sandton, South Africa, 2196
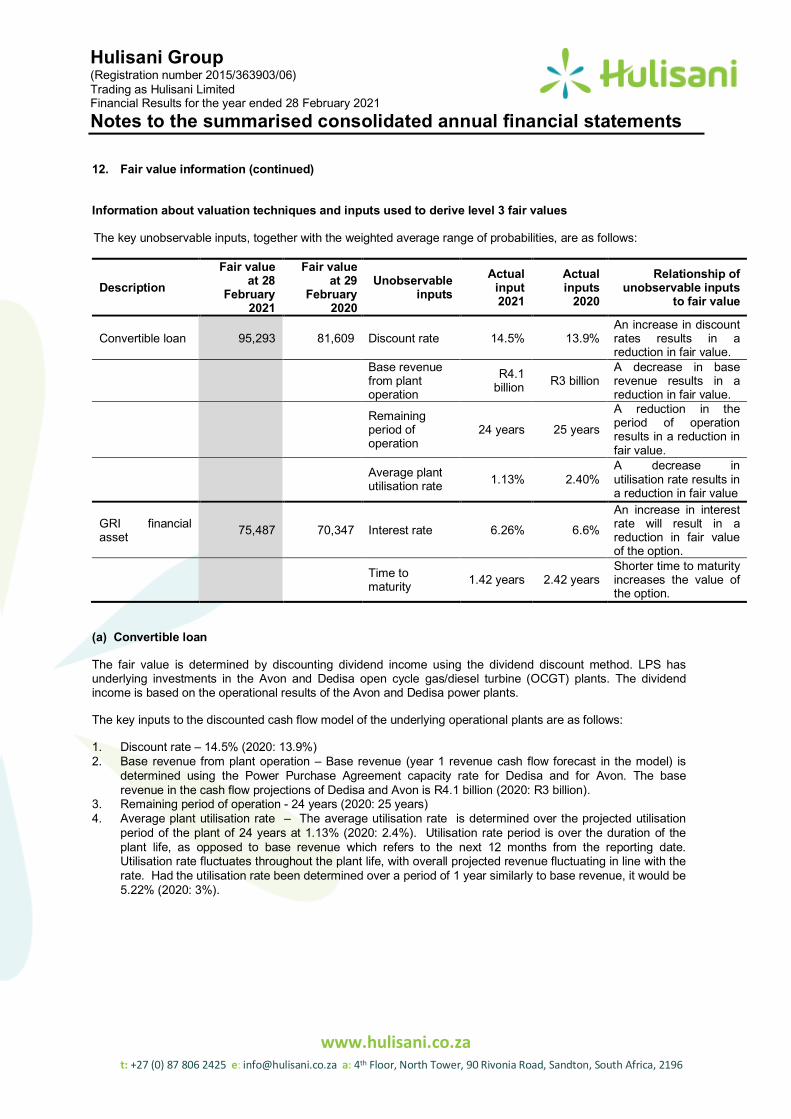
12. Fair value information (continued) Information about valuation techniques and inputs used to derive level 3 fair values
The key unobservable inputs, together with the weighted average range of probabilities, are as follows:
Description Fair value
at 28 February
2021
Fair value at 29
February 2020
Unobservable inputs
Actual input 2021
Actual inputs
2020
Relationship of unobservable inputs
to fair value
Convertible loan 95,293 81,609 Discount rate 14.5% 13.9% An increase in discount rates results in a reduction in fair value.
Base revenue from plant operation
R4.1 billion R3 billion
A decrease in base revenue results in a reduction in fair value.
Remaining period of operation
24 years 25 years
A reduction in the period of operation results in a reduction in fair value.
Average plant utilisation rate 1.13% 2.40%
A decrease in utilisation rate results in a reduction in fair value
GRI financial asset 75,487 70,347 Interest rate 6.26% 6.6%
An increase in interest rate will result in a reduction in fair value of the option.
Time to maturity 1.42 years 2.42 years
Shorter time to maturity increases the value of the option.
(a) Convertible loan
The fair value is determined by discounting dividend income using the dividend discount method. LPS has underlying investments in the Avon and Dedisa open cycle gas/diesel turbine (OCGT) plants. The dividend income is based on the operational results of the Avon and Dedisa power plants.
The key inputs to the discounted cash flow model of the underlying operational plants are as follows:
1. Discount rate – 14.5% (2020: 13.9%) 2. Base revenue from plant operation – Base revenue (year 1 revenue cash flow forecast in the model) is
determined using the Power Purchase Agreement capacity rate for Dedisa and for Avon. The base revenue in the cash flow projections of Dedisa and Avon is R4.1 billion (2020: R3 billion).
3. Remaining period of operation - 24 years (2020: 25 years) 4. Average plant utilisation rate – The average utilisation rate is determined over the projected utilisation
period of the plant of 24 years at 1.13% (2020: 2.4%). Utilisation rate period is over the duration of the plant life, as opposed to base revenue which refers to the next 12 months from the reporting date. Utilisation rate fluctuates throughout the plant life, with overall projected revenue fluctuating in line with the rate. Had the utilisation rate been determined over a period of 1 year similarly to base revenue, it would be 5.22% (2020: 3%).
Hulisani Group (Registration number 2015/363903/06) Trading as Hulisani Limited Financial Results for the year ended 28 February 2021 Notes to the summarised consolidated annual financial statements
www.hulisani.co.za t: +27 (0) 87 806 2425 e: [email protected] a: 4th Floor, North Tower, 90 Rivonia Road, Sandton, South Africa, 2196
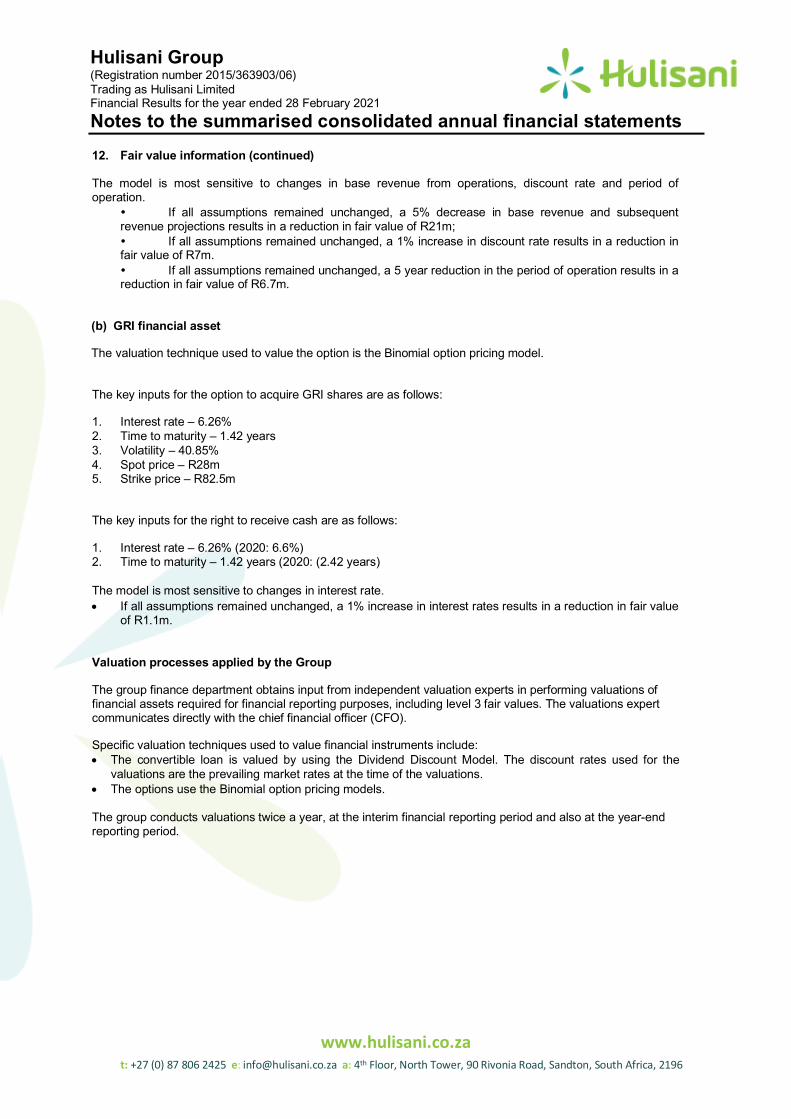
12. Fair value information (continued)
The model is most sensitive to changes in base revenue from operations, discount rate and period of operation.
� If all assumptions remained unchanged, a 5% decrease in base revenue and subsequent revenue projections results in a reduction in fair value of R21m; � If all assumptions remained unchanged, a 1% increase in discount rate results in a reduction in fair value of R7m. � If all assumptions remained unchanged, a 5 year reduction in the period of operation results in a reduction in fair value of R6.7m.
(b) GRI financial asset
The valuation technique used to value the option is the Binomial option pricing model.
The key inputs for the option to acquire GRI shares are as follows:
1. Interest rate – 6.26% 2. Time to maturity – 1.42 years 3. Volatility – 40.85% 4. Spot price – R28m 5. Strike price – R82.5m
The key inputs for the right to receive cash are as follows:
1. Interest rate – 6.26% (2020: 6.6%) 2. Time to maturity – 1.42 years (2020: (2.42 years)
The model is most sensitive to changes in interest rate. • If all assumptions remained unchanged, a 1% increase in interest rates results in a reduction in fair value
of R1.1m.
Valuation processes applied by the Group
The group finance department obtains input from independent valuation experts in performing valuations of financial assets required for financial reporting purposes, including level 3 fair values. The valuations expert communicates directly with the chief financial officer (CFO).
Specific valuation techniques used to value financial instruments include: • The convertible loan is valued by using the Dividend Discount Model. The discount rates used for the
valuations are the prevailing market rates at the time of the valuations. • The options use the Binomial option pricing models.
The group conducts valuations twice a year, at the interim financial reporting period and also at the year-end reporting period.
Hulisani Group (Registration number 2015/363903/06) Trading as Hulisani Limited Financial Results for the year ended 28 February 2021 Notes to the summarised consolidated annual financial statements
www.hulisani.co.za t: +27 (0) 87 806 2425 e: [email protected] a: 4th Floor, North Tower, 90 Rivonia Road, Sandton, South Africa, 2196
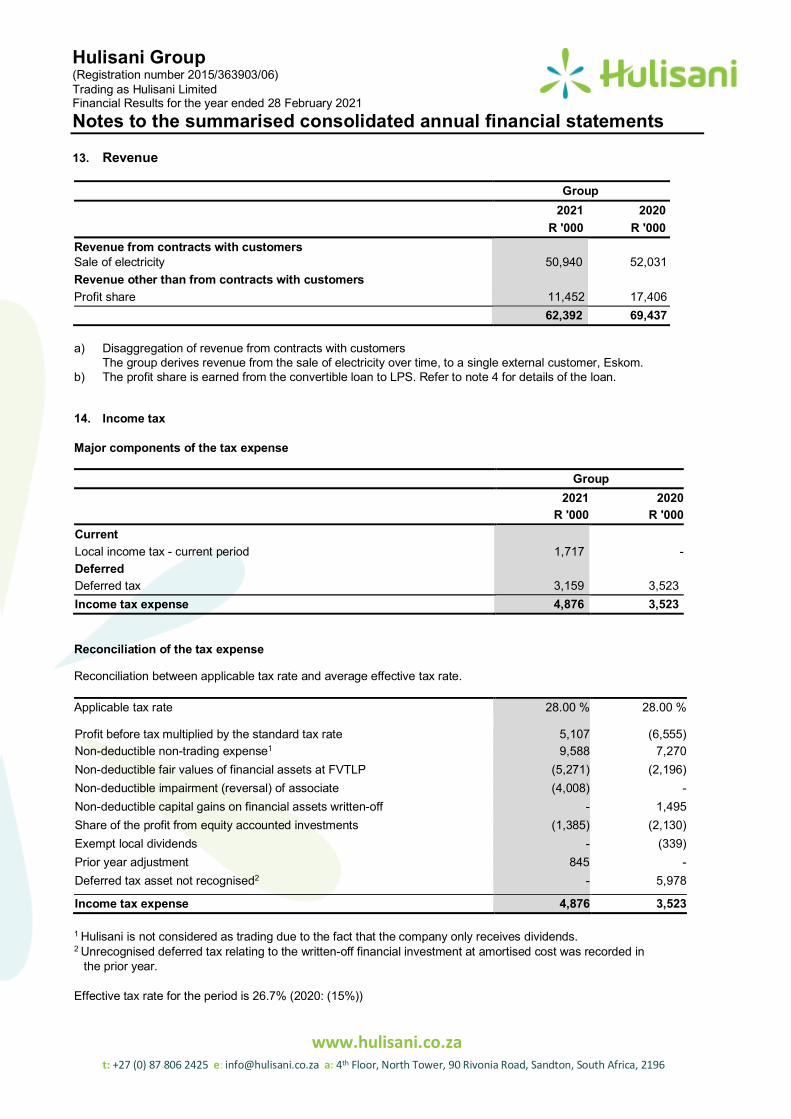
13. Revenue
Group 2021 2020 R '000 R '000 Revenue from contracts with customers Sale of electricity 50,940 52,031 Revenue other than from contracts with customers Profit share 11,452 17,406 62,392 69,437
a) Disaggregation of revenue from contracts with customers
The group derives revenue from the sale of electricity over time, to a single external customer, Eskom. b) The profit share is earned from the convertible loan to LPS. Refer to note 4 for details of the loan.
14. Income tax Major components of the tax expense
Group 2021 2020 R '000 R '000 Current Local income tax - current period 1,717 - Deferred Deferred tax 3,159 3,523 Income tax expense 4,876 3,523
Reconciliation of the tax expense
Reconciliation between applicable tax rate and average effective tax rate.
Applicable tax rate 28.00 % 28.00 %
Profit before tax multiplied by the standard tax rate 5,107 (6,555) Non-deductible non-trading expense1 9,588 7,270 Non-deductible fair values of financial assets at FVTLP (5,271) (2,196) Non-deductible impairment (reversal) of associate (4,008) - Non-deductible capital gains on financial assets written-off - 1,495 Share of the profit from equity accounted investments (1,385) (2,130) Exempt local dividends - (339) Prior year adjustment 845 - Deferred tax asset not recognised2 - 5,978
Income tax expense 4,876 3,523
1 Hulisani is not considered as trading due to the fact that the company only receives dividends. 2 Unrecognised deferred tax relating to the written-off financial investment at amortised cost was recorded in
the prior year.
Effective tax rate for the period is 26.7% (2020: (15%))
Hulisani Group (Registration number 2015/363903/06) Trading as Hulisani Limited Financial Results for the year ended 28 February 2021 Notes to the summarised consolidated annual financial statements
www.hulisani.co.za t: +27 (0) 87 806 2425 e: [email protected] a: 4th Floor, North Tower, 90 Rivonia Road, Sandton, South Africa, 2196
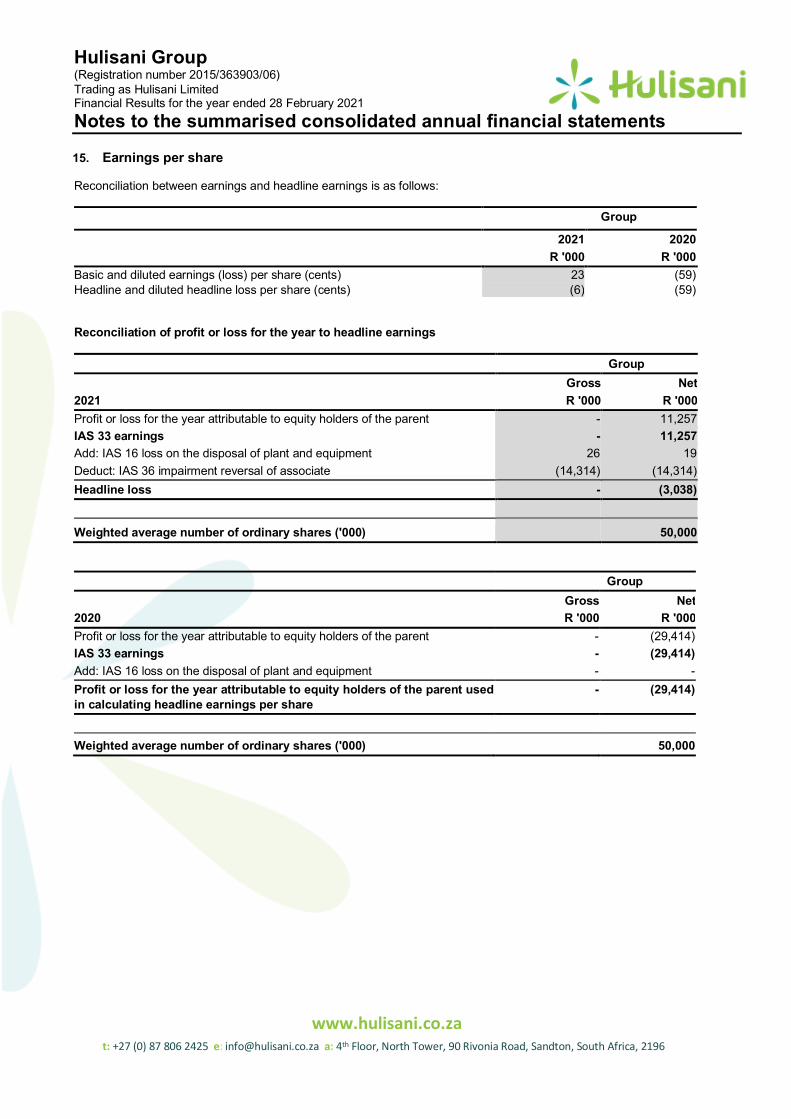
15. Earnings per share
Reconciliation between earnings and headline earnings is as follows:
Group
2021 2020 R '000 R '000
Basic and diluted earnings (loss) per share (cents) 23 (59) Headline and diluted headline loss per share (cents) (6) (59)
Reconciliation of profit or loss for the year to headline earnings
Group Gross Net
2021 R '000 R '000 Profit or loss for the year attributable to equity holders of the parent - 11,257 IAS 33 earnings - 11,257 Add: IAS 16 loss on the disposal of plant and equipment 26 19 Deduct: IAS 36 impairment reversal of associate (14,314) (14,314) Headline loss - (3,038)
Weighted average number of ordinary shares ('000) 50,000
Group Gross Net
2020 R '000 R '000 Profit or loss for the year attributable to equity holders of the parent - (29,414) IAS 33 earnings - (29,414) Add: IAS 16 loss on the disposal of plant and equipment - - Profit or loss for the year attributable to equity holders of the parent used in calculating headline earnings per share
- (29,414)
Weighted average number of ordinary shares ('000) 50,000
Hulisani Group (Registration number 2015/363903/06) Trading as Hulisani Limited Financial Results for the year ended 28 February 2021 Notes to the summarised consolidated annual financial statements
www.hulisani.co.za t: +27 (0) 87 806 2425 e: [email protected] a: 4th Floor, North Tower, 90 Rivonia Road, Sandton, South Africa, 2196
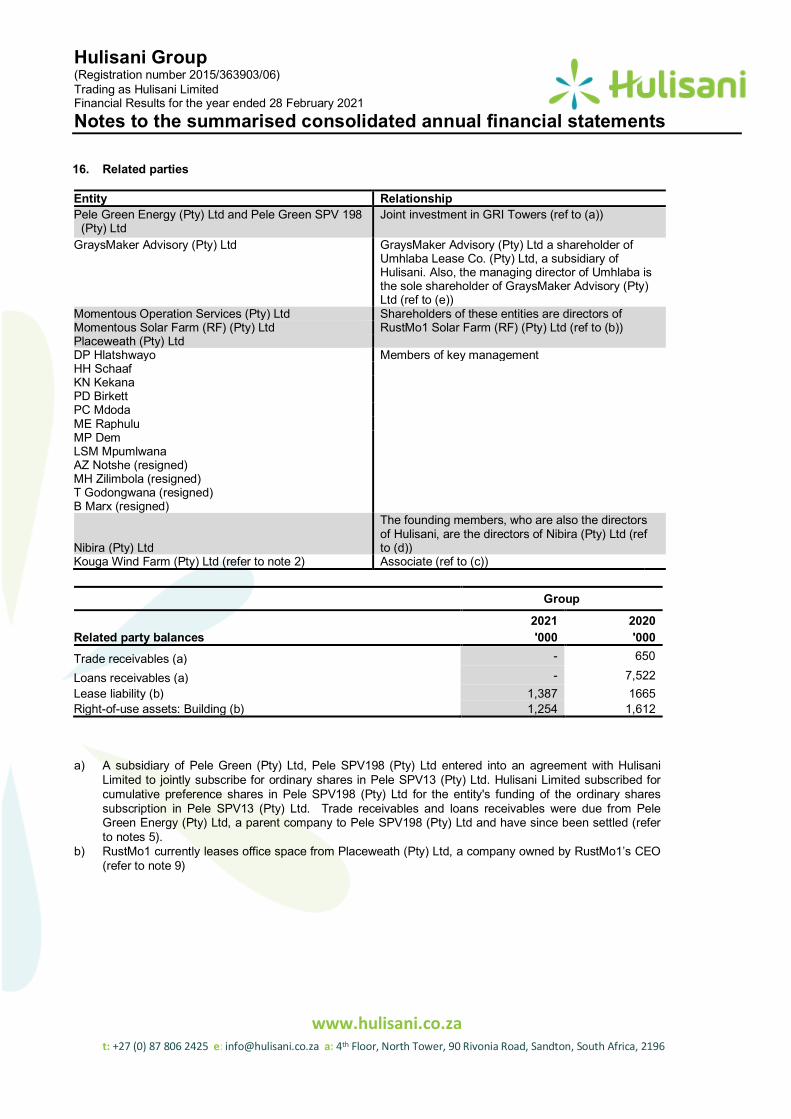
16. Related parties
Entity Relationship Pele Green Energy (Pty) Ltd and Pele Green SPV 198
(Pty) Ltd Joint investment in GRI Towers (ref to (a))
GraysMaker Advisory (Pty) Ltd GraysMaker Advisory (Pty) Ltd a shareholder of Umhlaba Lease Co. (Pty) Ltd, a subsidiary of Hulisani. Also, the managing director of Umhlaba is the sole shareholder of GraysMaker Advisory (Pty) Ltd (ref to (e))
Momentous Operation Services (Pty) Ltd Shareholders of these entities are directors of RustMo1 Solar Farm (RF) (Pty) Ltd (ref to (b)) Momentous Solar Farm (RF) (Pty) Ltd
Placeweath (Pty) Ltd DP Hlatshwayo Members of key management HH Schaaf KN Kekana PD Birkett PC Mdoda ME Raphulu MP Dem LSM Mpumlwana AZ Notshe (resigned) MH Zilimbola (resigned) T Godongwana (resigned) B Marx (resigned)
Nibira (Pty) Ltd
The founding members, who are also the directors of Hulisani, are the directors of Nibira (Pty) Ltd (ref to (d))
Kouga Wind Farm (Pty) Ltd (refer to note 2) Associate (ref to (c))
Group 2021 2020
Related party balances '000 '000 Trade receivables (a) - 650
Loans receivables (a) - 7,522 Lease liability (b) 1,387 1665 Right-of-use assets: Building (b) 1,254 1,612
a) A subsidiary of Pele Green (Pty) Ltd, Pele SPV198 (Pty) Ltd entered into an agreement with Hulisani Limited to jointly subscribe for ordinary shares in Pele SPV13 (Pty) Ltd. Hulisani Limited subscribed for cumulative preference shares in Pele SPV198 (Pty) Ltd for the entity's funding of the ordinary shares subscription in Pele SPV13 (Pty) Ltd. Trade receivables and loans receivables were due from Pele Green Energy (Pty) Ltd, a parent company to Pele SPV198 (Pty) Ltd and have since been settled (refer to notes 5).
b) RustMo1 currently leases office space from Placeweath (Pty) Ltd, a company owned by RustMo1’s CEO (refer to note 9)
Hulisani Group (Registration number 2015/363903/06) Trading as Hulisani Limited Financial Results for the year ended 28 February 2021 Notes to the summarised consolidated annual financial statements
www.hulisani.co.za t: +27 (0) 87 806 2425 e: [email protected] a: 4th Floor, North Tower, 90 Rivonia Road, Sandton, South Africa, 2196
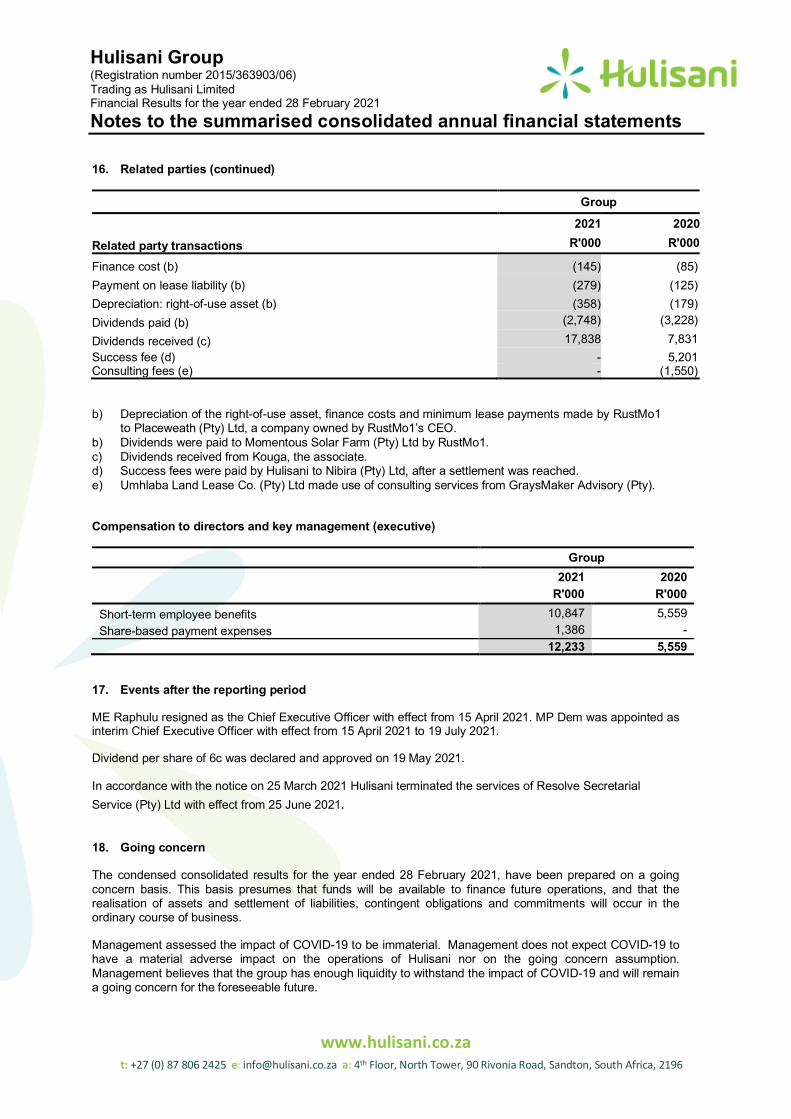
16. Related parties (continued)
Group 2021 2020
Related party transactions R'000 R'000
Finance cost (b) (145) (85) Payment on lease liability (b) (279) (125) Depreciation: right-of-use asset (b) (358) (179) Dividends paid (b) (2,748) (3,228)
Dividends received (c) 17,838 7,831 Success fee (d) - 5,201 Consulting fees (e) - (1,550)
b) Depreciation of the right-of-use asset, finance costs and minimum lease payments made by RustMo1 to Placeweath (Pty) Ltd, a company owned by RustMo1’s CEO.
b) Dividends were paid to Momentous Solar Farm (Pty) Ltd by RustMo1. c) Dividends received from Kouga, the associate. d) Success fees were paid by Hulisani to Nibira (Pty) Ltd, after a settlement was reached. e) Umhlaba Land Lease Co. (Pty) Ltd made use of consulting services from GraysMaker Advisory (Pty).
Compensation to directors and key management (executive)
Group 2021 2020
R'000 R'000 Short-term employee benefits 10,847 5,559 Share-based payment expenses 1,386 - 12,233 5,559
17. Events after the reporting period
ME Raphulu resigned as the Chief Executive Officer with effect from 15 April 2021. MP Dem was appointed as interim Chief Executive Officer with effect from 15 April 2021 to 19 July 2021.
Dividend per share of 6c was declared and approved on 19 May 2021.
In accordance with the notice on 25 March 2021 Hulisani terminated the services of Resolve Secretarial Service (Pty) Ltd with effect from 25 June 2021.
18. Going concern
The condensed consolidated results for the year ended 28 February 2021, have been prepared on a going concern basis. This basis presumes that funds will be available to finance future operations, and that the realisation of assets and settlement of liabilities, contingent obligations and commitments will occur in the ordinary course of business.
Management assessed the impact of COVID-19 to be immaterial. Management does not expect COVID-19 to have a material adverse impact on the operations of Hulisani nor on the going concern assumption. Management believes that the group has enough liquidity to withstand the impact of COVID-19 and will remain a going concern for the foreseeable future.
www.hulisani.co.za t: +27 (0) 87 806 2425 e: [email protected] a: 4th Floor, North Tower, 90 Rivonia Road, Sandton, South Africa, 2196
Registered Office: 4th Floor, North Tower,90 Rivonia Road, Sandton, Gauteng. Auditors BDO South Africa Inc. Sponsor PSG Capital Transfer secretaries: Computershare Investor Services Proprietary Limited, 70 Marshall Street Johannesburg, 2001 Company secretary Resolve secretarial services (Pty) Ltd, 77 Vasco Boulevard, Goodwood, 7460 Directors: MP Dem (Chief Financial Officer and Chief Executive Officer), PC Mdoda* (Chairman), DR Hlatshwayo*, HH Schaaf*#, KN Kekana*, PD Birkett*. * Independent Non-executive # German.

Registered Office: 4th Floor, North Wing, 90 Rivonia Road, Sandton, 2196 Postal Address: PO Box 784583, Sandton, 2146 Telephone: 087 806 2425
www.hulisani.co.za