condition assessment guide for bridge coatings assessment guide for bridge coatings ... paint...
TRANSCRIPT
Condition Assessment Guide for
Bridge Coatings
Glenn A.Washer, Ph.D.Department of Civil and Environmental Engineering
University of Missouri
Midwest Bridge Preservation Partnership 2010
Goals
• Improve the data available for managing
coatings across inventory of ~4000 steel
bridges
• Provide guidelines that improve the reliability • Provide guidelines that improve the reliability
of inspection data
– Reliability: ability to perform its intended function
• Consistency
• Data useful for decision making
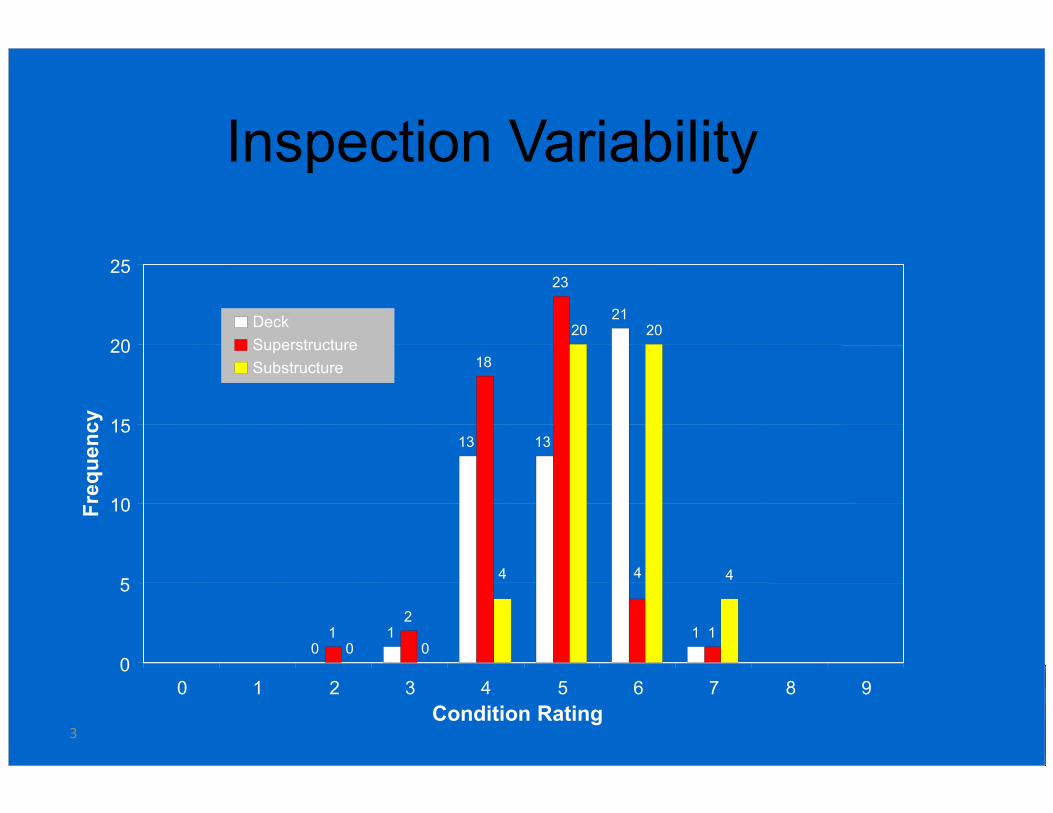
Inspection Variability
21
18
23
20 20
20
25
Deck
Superstructure
Substructure
3
01
13 13
112
10 0
44 4
0
5
10
15
0 1 2 3 4 5 6 7 8 9
Condition Rating
Frequency
Motivation
• Subjective rating scales are practical for
recording coatings conditions
• Industry standards focus on up-close
evaluations of coatingsevaluations of coatings
– Doesn’t match needs for bridges, where all
conditions may exist to some extent
– Need to assess coatings within the context of a
routine inspection
Project Overview
• Survey bridge coatings conditions in the field
– Evaluate over-coating performance, CSA
– Coating performance in general
– Factors effecting coating performance– Factors effecting coating performance
• Visual assessment tool to improve reliability of condition rating
– Provide improved data for decision making• Programmatic needs, etc.
Field Survey
• 96 bridges across 10 MoDOT districts
• Obtain standard set of photographs
• Rate bridges for end – span and mid-span • Rate bridges for end – span and mid-span conditions
• Cross section of coating systems that are in the inventory
– Focus on system S over-coatings, some young system G (current technologies)
– Other systems in the inventory
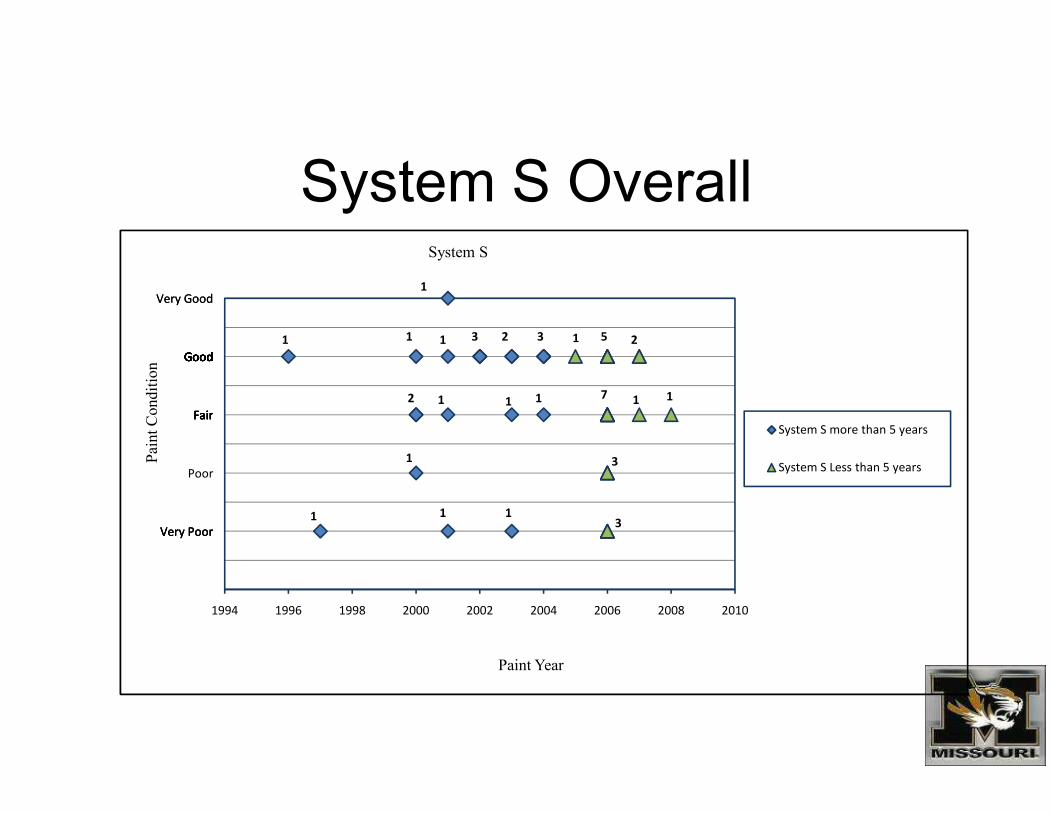
System S Overall
3
11
3
2
1 2
1
1
11
Good
Fair
Good
Fair
Good
Fair
GoodGoodGood
Very Good
Fair
GoodGoodGoodGood
Fair
Good
Very Good
7
5 21
1 1
Paint Condition
System S
1
1
1 1 1
FairFair
Poor
Very PoorVery Poor
Fair
Very Poor
FairFair
3
3
1994 1996 1998 2000 2002 2004 2006 2008 2010
Paint Condition
Paint Year
System S more than 5 years
System S Less than 5 years
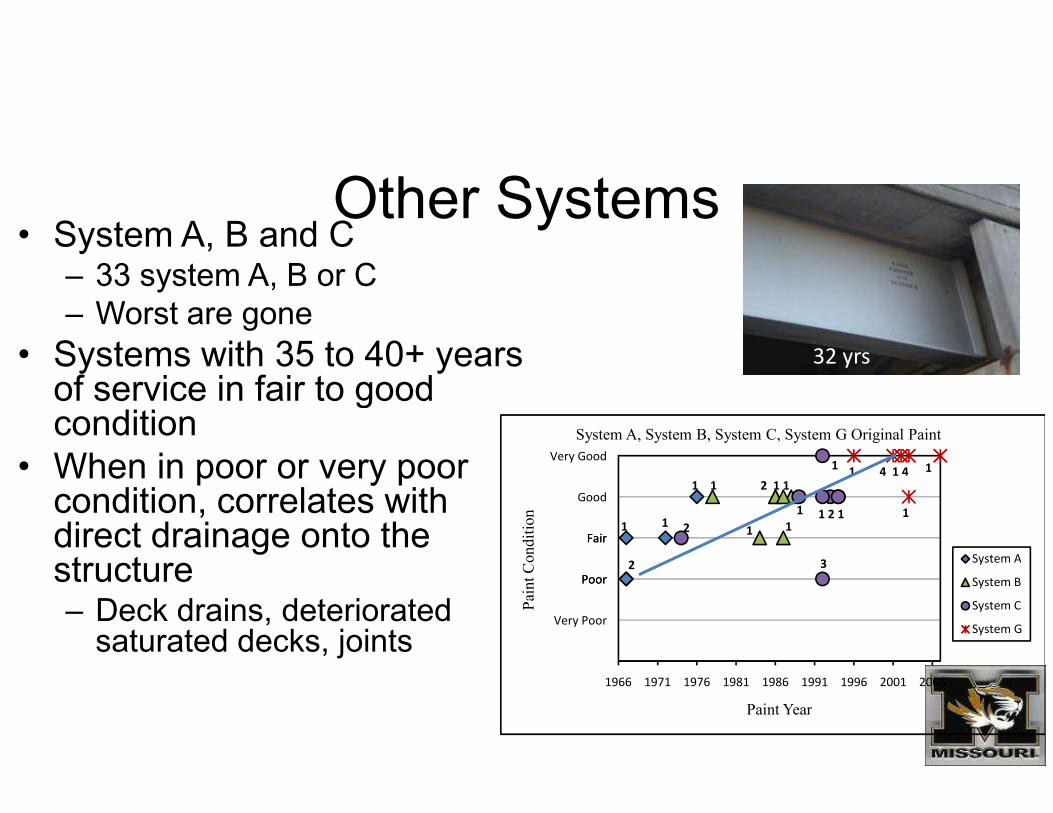
Other Systems • System A, B and C
– 33 system A, B or C
– Worst are gone
• Systems with 35 to 40+ years of service in fair to good condition
32 yrs
of service in fair to good condition
• When in poor or very poor condition, correlates with direct drainage onto the structure– Deck drains, deteriorated saturated decks, joints
2
11
1
Poor
Fair
Poor
Fair
Good
Very Good
Very Poor
2 1 11
11
3
1
1 2 11
2
14 1 41
1
1966 1971 1976 1981 1986 1991 1996 2001 2006
Paint Condition
Paint Year
System A, System B, System C, System G Original Paint
System A
System B
System C
System G
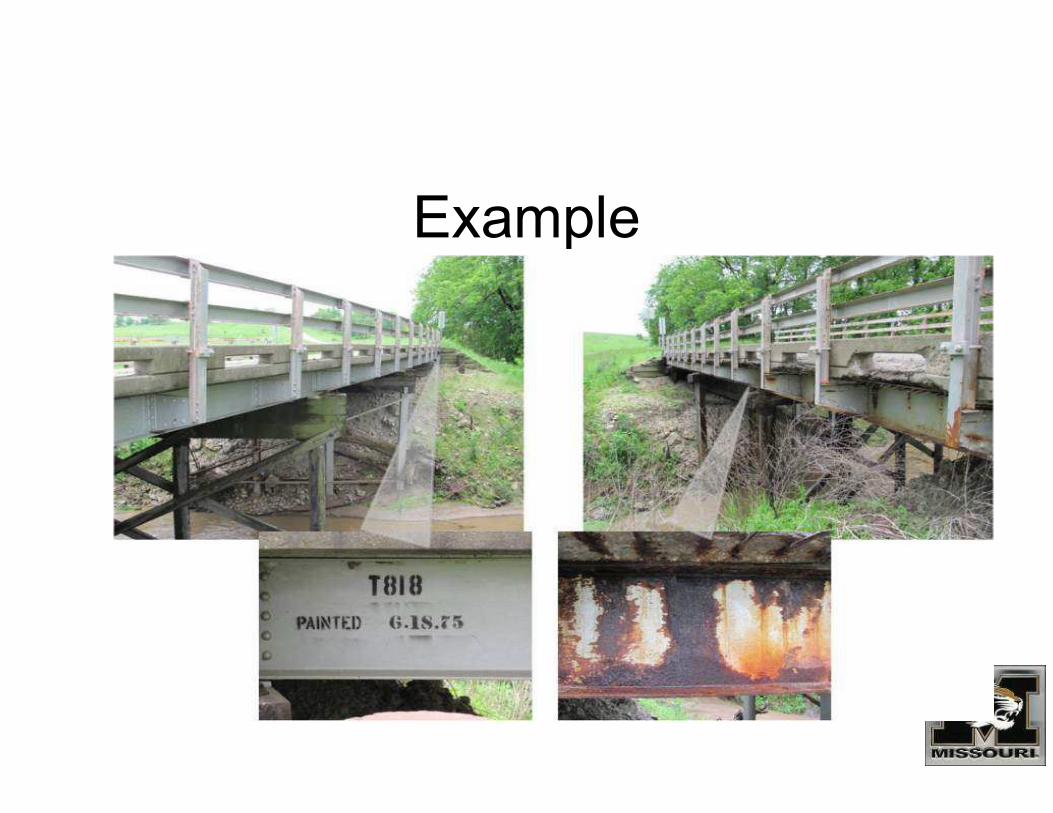
Example
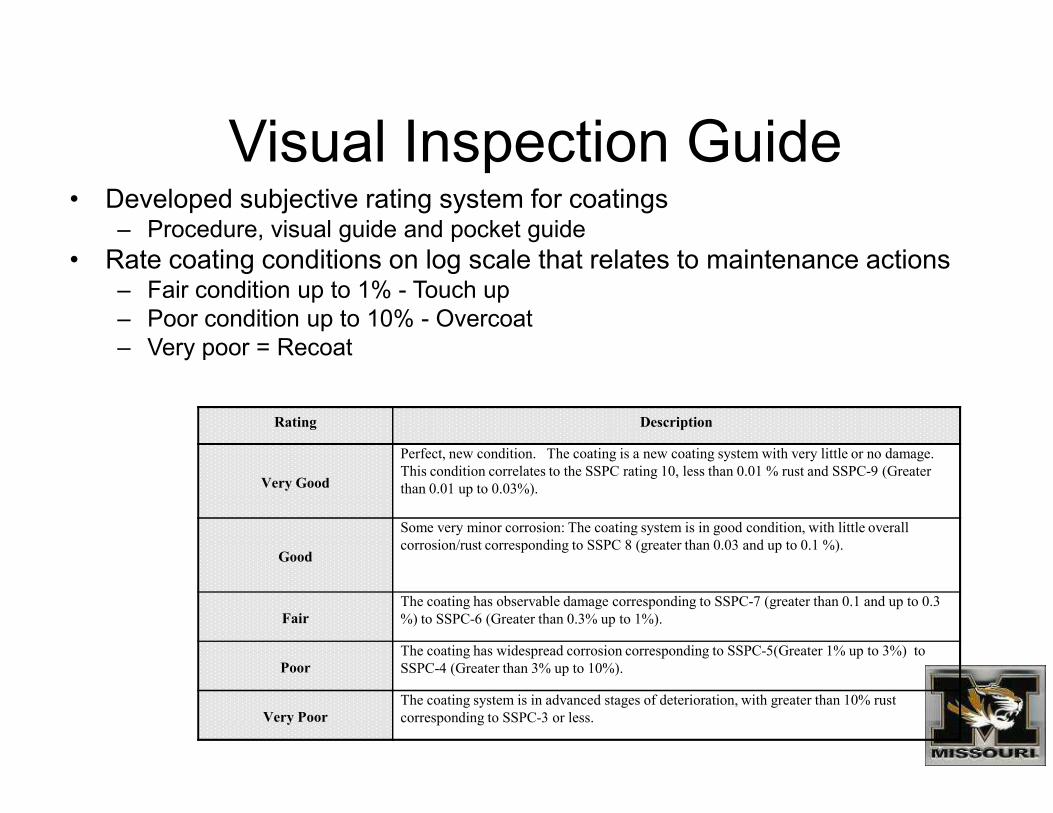
Visual Inspection Guide• Developed subjective rating system for coatings
– Procedure, visual guide and pocket guide
• Rate coating conditions on log scale that relates to maintenance actions– Fair condition up to 1% - Touch up
– Poor condition up to 10% - Overcoat
– Very poor = Recoat
Rating Description
Very Good
Perfect, new condition. The coating is a new coating system with very little or no damage.
This condition correlates to the SSPC rating 10, less than 0.01 % rust and SSPC-9 (Greater
than 0.01 up to 0.03%).
Good
Some very minor corrosion: The coating system is in good condition, with little overall
corrosion/rust corresponding to SSPC 8 (greater than 0.03 and up to 0.1 %).
Fair
The coating has observable damage corresponding to SSPC-7 (greater than 0.1 and up to 0.3
%) to SSPC-6 (Greater than 0.3% up to 1%).
Poor
The coating has widespread corrosion corresponding to SSPC-5(Greater 1% up to 3%) to
SSPC-4 (Greater than 3% up to 10%).
Very Poor
The coating system is in advanced stages of deterioration, with greater than 10% rust
corresponding to SSPC-3 or less.
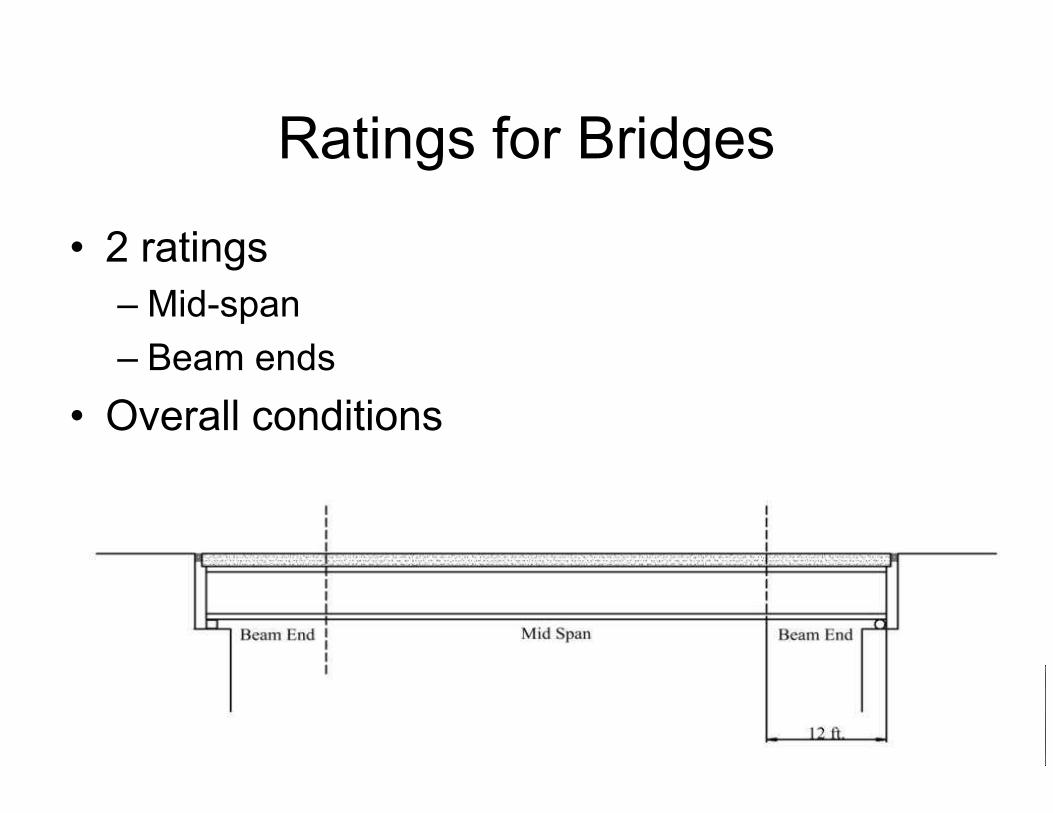
Ratings for Bridges
• 2 ratings
– Mid-span
– Beam ends
• Overall conditions• Overall conditions
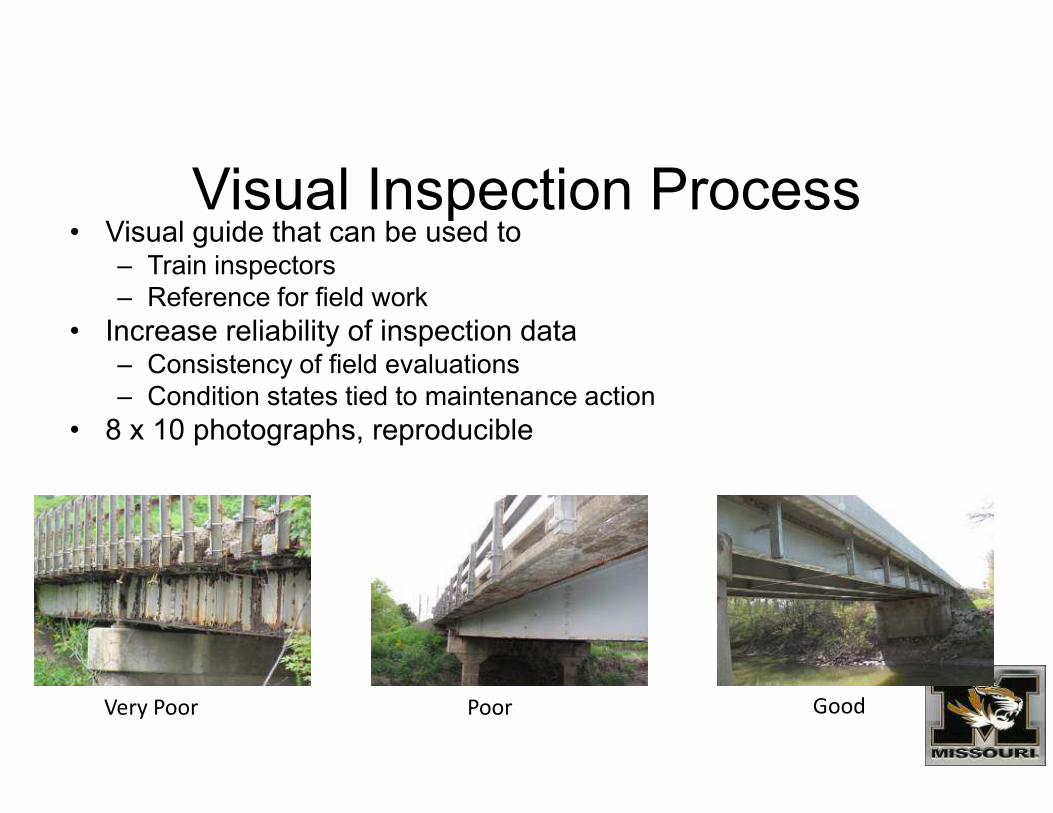
Visual Inspection Process• Visual guide that can be used to
– Train inspectors
– Reference for field work
• Increase reliability of inspection data– Consistency of field evaluations
– Condition states tied to maintenance action– Condition states tied to maintenance action
• 8 x 10 photographs, reproducible
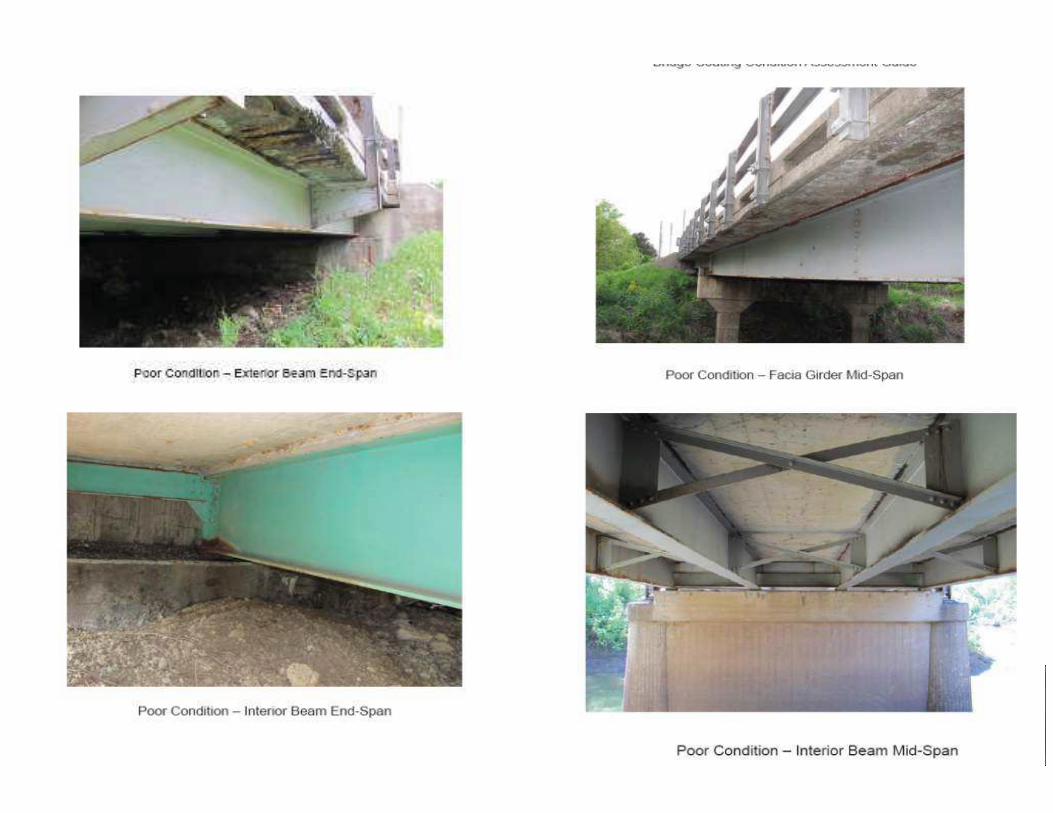
Very Poor Poor Good
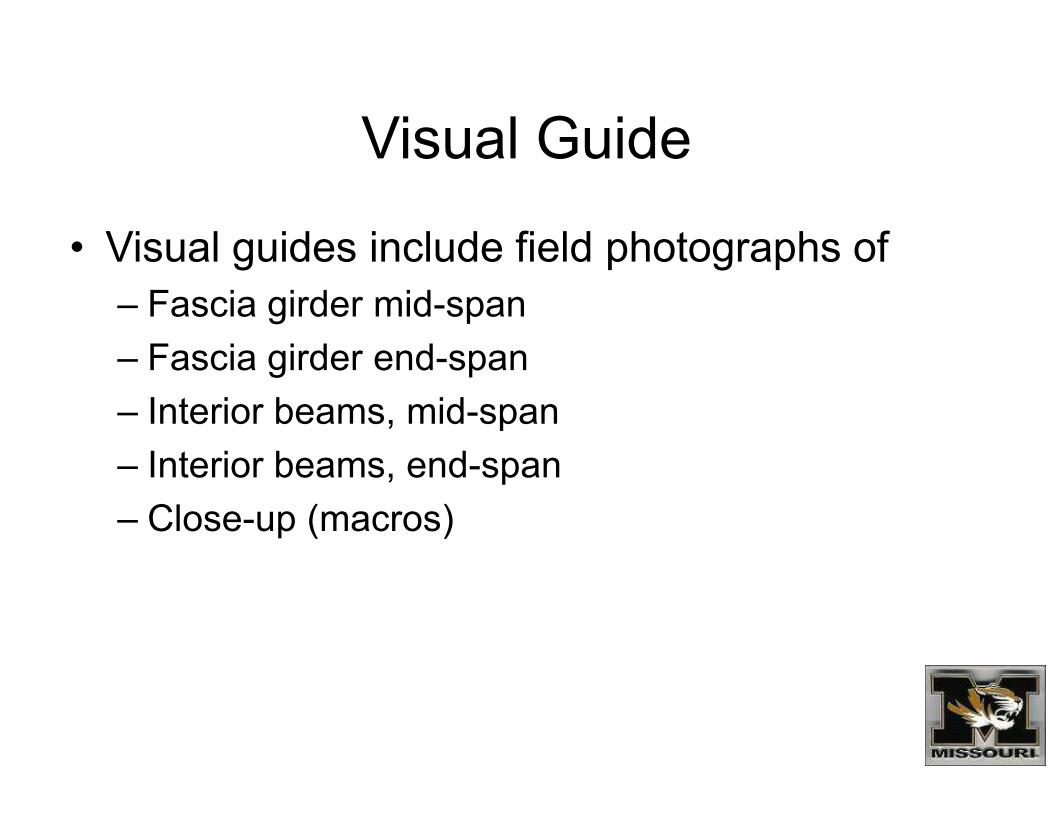
Visual Guide
• Visual guides include field photographs of
– Fascia girder mid-span
– Fascia girder end-span
– Interior beams, mid-span– Interior beams, mid-span
– Interior beams, end-span
– Close-up (macros)
Visual Inspection Guide• Visual guide includes photographs from the perspective of the inspector– Industrial guides typically show close – ups that require significant interpretation to apply to a bridge• Low reliability
• Subjective rating scale– Always some room for discussion……
– Average conditions at beam ends and mid-span
– Primary member rating
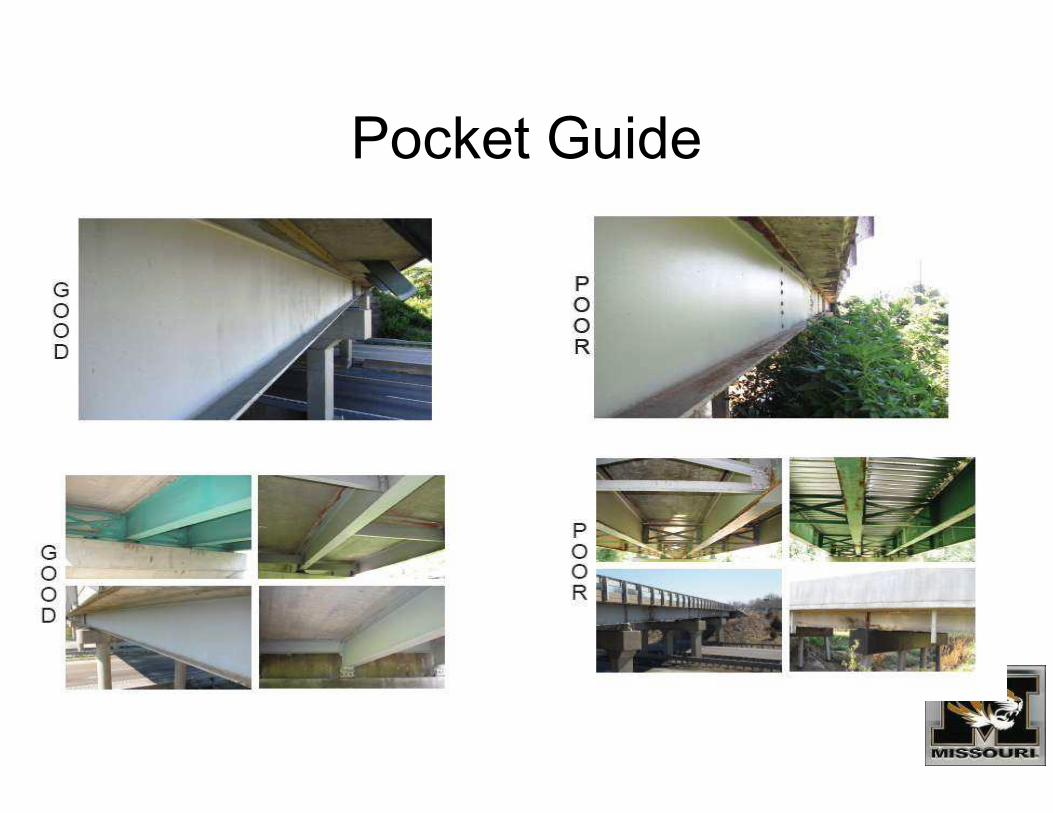
Pocket Guide
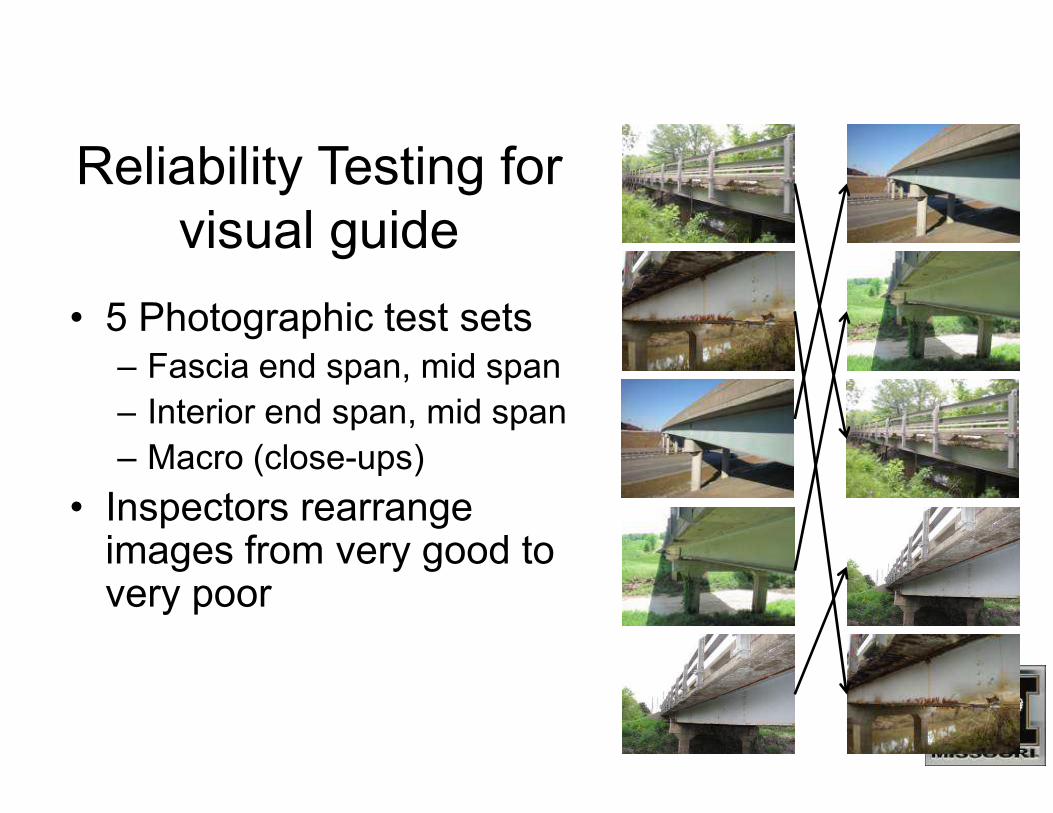
Reliability Testing for
visual guide
• 5 Photographic test sets
– Fascia end span, mid span
– Interior end span, mid span– Interior end span, mid span
– Macro (close-ups)
• Inspectors rearrange images from very good to very poor
Results of Reliability Testing• 5 inspectors took the test from MoDOT, one
coatings consultant
• 3 inspectors from MoDOT scored 100% on all
5 tests5 tests
• 6 inspectors scored 100% on the close-up
photos
– Easiest to do…..
Results of Reliability Testing
• Overall Test analysis
– For 6 inspectors, 19 errors, 13%
• Errors most commonly occurred for • Errors most commonly occurred for
– End spans of fascia girders
– In the good-fair-poor range
• i.e. for fascia girder end spans, Very good/ very poor
(20%) for good-fair-poor (33%)
• Without initial training of full instruction
Conclusions• Comprehensive guide for condition evaluation was developed
– Visual standards for practical use
– Condition states related to maintenance actions
– Visual guide and pocket guide
– Testing of consistency
• Focus over-coating on fair to poor, very poor only recoat• Focus over-coating on fair to poor, very poor only recoat
• Performance of existing coatings– System S appears to be provide coatings life extension consistent with 10 year expectation• Early failures associated with very poor conditions at recoating, and direct drainage (<5 yrs)
• Long-life associated with good drainage– >10 yrs
– Same was true for historical systems A, B, C
• Primary factors: 1: Drainage, 2: Surface prep, 3: Drainage
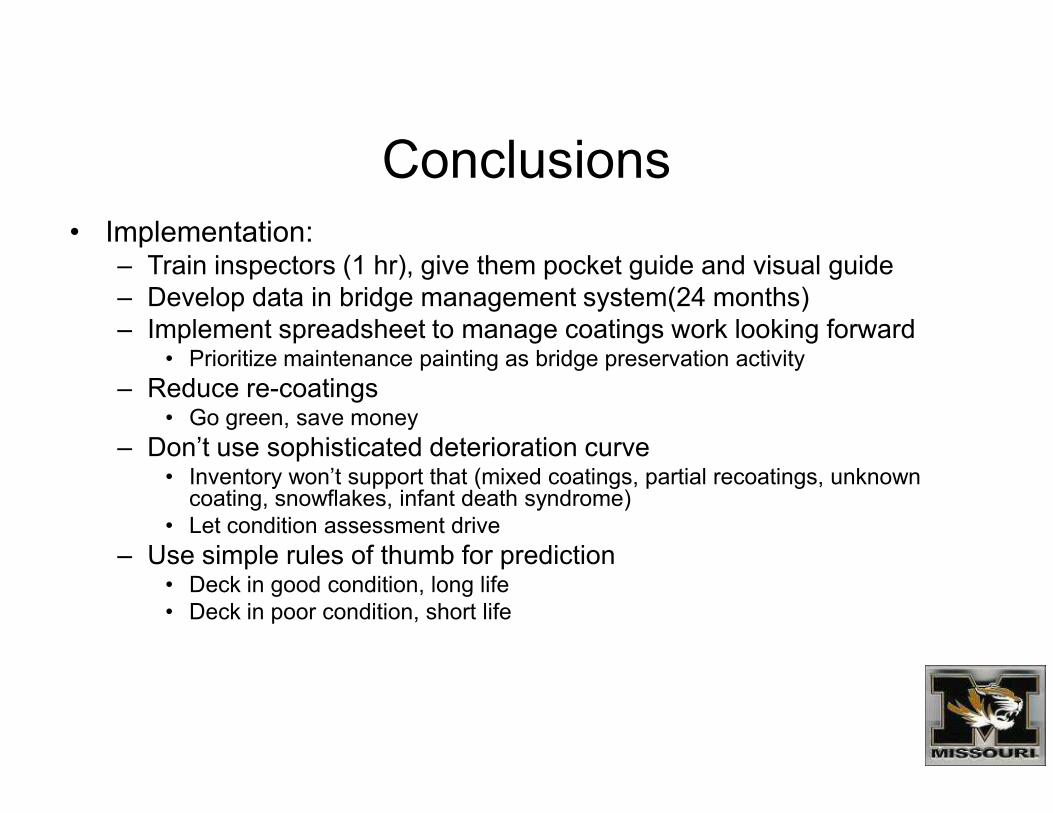
Conclusions
• Implementation: – Train inspectors (1 hr), give them pocket guide and visual guide
– Develop data in bridge management system(24 months)
– Implement spreadsheet to manage coatings work looking forward• Prioritize maintenance painting as bridge preservation activity
– Reduce re-coatings• Go green, save money• Go green, save money
– Don’t use sophisticated deterioration curve• Inventory won’t support that (mixed coatings, partial recoatings, unknown coating, snowflakes, infant death syndrome)
• Let condition assessment drive
– Use simple rules of thumb for prediction• Deck in good condition, long life
• Deck in poor condition, short life

Questions?

Backup slides
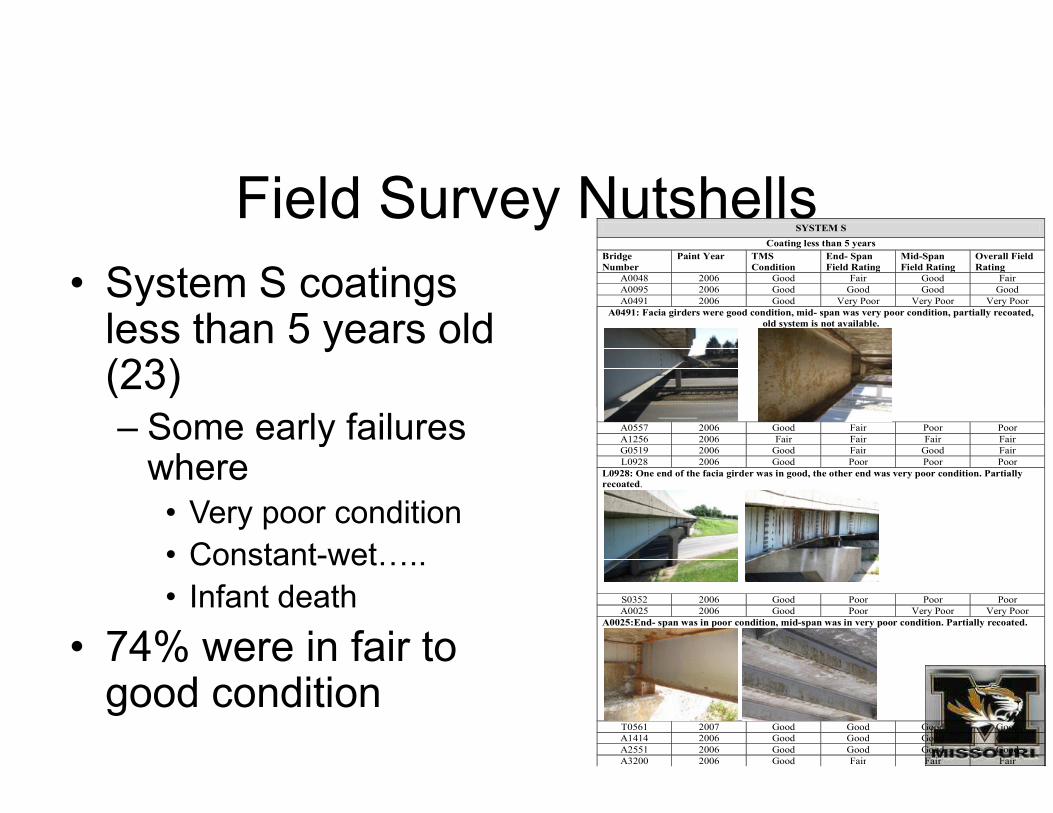
Field Survey Nutshells
• System S coatings less than 5 years old (23)
– Some early failures
SYSTEM S
Coating less than 5 years
Bridge
Number
Paint Year TMS
Condition
End- Span
Field Rating
Mid-Span
Field Rating
Overall Field
Rating
A0048 2006 Good Fair Good Fair
A0095 2006 Good Good Good Good
A0491 2006 Good Very Poor Very Poor Very Poor
A0491: Facia girders were good condition, mid- span was very poor condition, partially recoated,
old system is not available.
– Some early failures where • Very poor condition
• Constant-wet…..
• Infant death
• 74% were in fair to good condition
A0557 2006 Good Fair Poor Poor
A1256 2006 Fair Fair Fair Fair
G0519 2006 Good Fair Good Fair
L0928 2006 Good Poor Poor Poor
L0928: One end of the facia girder was in good, the other end was very poor condition. Partially
recoated.
S0352 2006 Good Poor Poor Poor
A0025 2006 Good Poor Very Poor Very Poor
A0025:End- span was in poor condition, mid-span was in very poor condition. Partially recoated.
T0561 2007 Good Good Good Good
A1414 2006 Good Good Good Good
A2551 2006 Good Good Good Good
A3200 2006 Good Fair Fair Fair
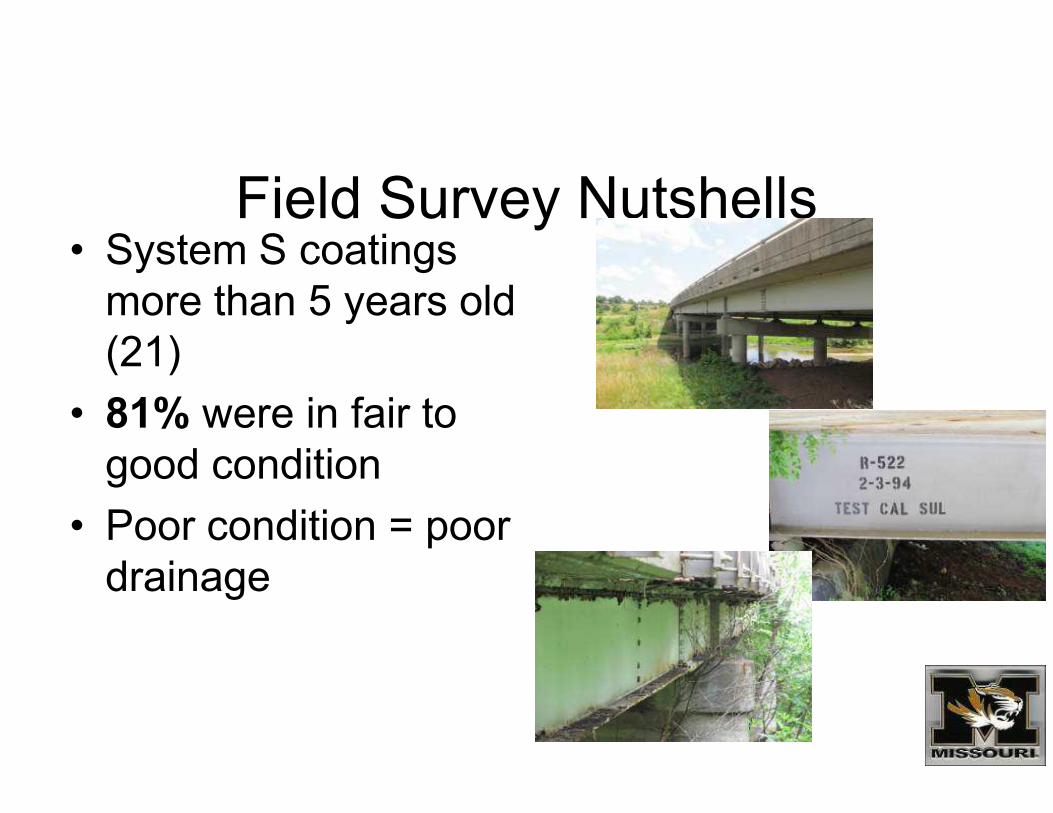
Field Survey Nutshells• System S coatings
more than 5 years old
(21)
• 81% were in fair to • 81% were in fair to
good condition
• Poor condition = poor
drainage