conflict and its impact on educational accumulation and ...ftp.iza.org/dp5939.pdf · conflict and...
TRANSCRIPT

DI
SC
US
SI
ON
P
AP
ER
S
ER
IE
S
Forschungsinstitut zur Zukunft der ArbeitInstitute for the Study of Labor
Conflict and its Impact on Educational Accumulation and Enrollment in Colombia:What We Can Learn from Recent IDPs
IZA DP No. 5939
August 2011
Kate WhartonRuth Uwaifo Oyelere

Conflict and its Impact on Educational
Accumulation and Enrollment in Colombia: What We Can Learn from Recent IDPs
Kate Wharton Georgia Institute of Technology
Ruth Uwaifo Oyelere Georgia Institute of Technology
and IZA
Discussion Paper No. 5939 August 2011
IZA
P.O. Box 7240 53072 Bonn
Germany
Phone: +49-228-3894-0 Fax: +49-228-3894-180
E-mail: [email protected]
Any opinions expressed here are those of the author(s) and not those of IZA. Research published in this series may include views on policy, but the institute itself takes no institutional policy positions. The Institute for the Study of Labor (IZA) in Bonn is a local and virtual international research center and a place of communication between science, politics and business. IZA is an independent nonprofit organization supported by Deutsche Post Foundation. The center is associated with the University of Bonn and offers a stimulating research environment through its international network, workshops and conferences, data service, project support, research visits and doctoral program. IZA engages in (i) original and internationally competitive research in all fields of labor economics, (ii) development of policy concepts, and (iii) dissemination of research results and concepts to the interested public. IZA Discussion Papers often represent preliminary work and are circulated to encourage discussion. Citation of such a paper should account for its provisional character. A revised version may be available directly from the author.

IZA Discussion Paper No. 5939 August 2011
ABSTRACT
Conflict and its Impact on Educational Accumulation and Enrollment in Colombia: What We Can Learn from Recent IDPs* Forty years of low-intensity internal armed conflict has made Colombia home to the world’s second largest population of Internally Displaced Persons (IDPs). The effect of being directly impacted by conflict on a child’s educational accumulation and enrollment is of particular concern because of the critical role that education plays in increasing human capital and productivity. This paper explores the educational accumulation and enrollment gap created by being directly affected by conflict. First, we show that children living in municipality with high conflict have a gap in education enrollment and accumulation. However, this gap is much smaller than the attainment and enrollment gap for those directly affected by the conflict (IDPs). We estimate the education accumulation and enrollment gaps for IDPs in comparison to non-migrants and other migrants respectively. Our results suggest significant education accumulation and enrollment gaps for children of IDPs that widens to over half a year in secondary school. The disparity in effects when we focus on direct exposure to conflict versus living in a municipality with conflict suggests a need to be careful when using the latter to estimate the impact of conflict. JEL Classification: I24, O12, O15, J10 Keywords: educational attainment, school enrollment, Colombia, internal displacement,
conflict Corresponding author: Ruth Uwaifo Oyelere School of Economics Georgia Institute of Technology 221 Bobby Dodd Way Atlanta, GA 30332 USA E-mail: [email protected]
* Data for this paper was derived from IPUMS International. Comments are appreciated.

1 Introduction
For over forty years, Colombia has been troubled by armed conflict. The primary aggressor, the
Revolutionary Armed Forces of Colombia (FARC) emerged as a revolutionary anti-imperialist Marx-
ist organization in the 1960s in response to political exclusion of the rural poor. Later, right-wing
paramilitaries formed as self-defense committees against the leftist FARC. Both irregular armed
groups - guerrillas and paramilitaries - have since morphed into something dangerous, becoming
closely tied to the narcotrafficking industry and other illegal activities for income. Although peace
talks have occurred under nearly every president, attempts at negotiation and disarmament have
failed to bring lasting peace.
One result of this disruptive, long-term conflict is the mass displacement of Colombians. Cur-
rently, Colombia ranks second in the world behind Sudan in the number of internally displaced
persons (IDPs), with 3.3 million registered since 1997 according to the UNHCR 2009 Global Trends
report. There is evidence that individuals who identify themselves as IDPS were forced to move
as a direct result of fighting, land confiscation, massacre, fear of forced recruitment into the armed
groups, and death threats. In addition, IDPs face significant obstacles to social and economic inte-
gration in receptor locations due to reduced social capital, family fragmentation, loss of assets, and
difficulty acquiring a job. Kirchhoff and Ibanez (2002) study changes of welfare for the displaced
population and find that landowners suffered the greatest property losses, with 83 percent forced to
abandon their land without compensation.
Although efforts have been made to protect IDPs and to assist them in resettlement, there is
anecdotal evidence that IDPs are still vulnerable many years after migration.1 One possible expla-
nation for this is that government aid to IDPs is restricted to the first three months of displacement.
Meanwhile, longer-term income generation programs have had only limited success in helping IDP
families return to their previous economic status. Ibanez and Moya (2009) provide evidence of the
problem with the USAID income-generation programs. Furthermore, many government programs
have focused on the option of return rather than on integration of IDPs into the urban environment.
Education significantly increases the chances of improving welfare and escaping poverty, and it
contributes significantly to the long-term integration of the vulnerable population into the larger
society. Given the role of education in socioeconomic development, our goal in this paper is to
investigate the impact of having parents directly affected by conflict on the education outcomes of
1The 1997 Law 387 dictates government policy concerning assistance to IDPs and establishes the Network of SocialSolidarity (RSS) as the coordinating entity for the Strategic Plan for the Management of Internal Forced Displacement.However, government programs reach only a small portion of the registered IDP population, and UN agencies andother humanitarian organizations play an important role in assisting the displaced.
2

school aged children. To meet this goal we answer four related questions.
First, is there an education accumulation and enrollment gap for children of those who live in
municipalities with high conflict in comparison to others? Second, is there an education accumulation
and enrollment gap for children of those directly affected by conflict (recent IDPs)? Third does living
in a municipality with high conflict create similar education accumulation and enrollment gaps as
being directly affected by conflict (recent IDPs)? Finally, how do recent IDPs compare to other
other migrants in education accumulation and enrollment?
We make use of the Colombia 2005 Census data and data from the Humanitarian Situation
Risk Index (HSRI) in this paper. To answer questions pertaining to educational accumulation we
make use of linear regression models and fixed effect models and for questions related to enrollment
we estimate probit models and compute marginal effects. Specifically to answer the first question,
we create a dummy variable setting as one those who live in high conflict region. We identify
individuals who fall into this category as those living in municipalities with conflict greater than the
mean. Controlling for factors that predict enrollment and accumulation respectively and separating
children 6-11 years old from those 12-17 year old, we estimate the gap between individuals in
municipalities with high conflict and others. We find a slight gap in accumulation of about 0.036 of
a year and a gap in probability of enrollment of about 1%. However if we cluster at the municipal
level, most of these estimated impacts are insignificant.
To answer the second question we first divide the sample of children into subgroups. The
subgroups consists of several types of migrants linked with the reason for migration and also a
group for non-migrants. We focus on recent IDPs because there is no way of identifying in our data
IDPs who migrated more than five years ago.2 Using both our education accumulation model and
our education enrollment empirical models, and controlling for important factors that predict school
related outcomes, we estimate the gap in accumulation and enrollment for IDPs in comparison to
non-migrants. We find that children of IDPs who are between 6-11 years have about one-fifth of a
year less of schooling in comparison to non-migrants and the children 11-17 years old have a gap of
about half-a year. With respect to enrollment, we find that children of IDPs ages 6-11 and 12-17
are 1.6% and 6.3% respectively less likely to be enrolled in school than non-migrants.
To answer the third question, we restrict our sample to only those in high conflict municipalities.
Assuming IDPs found in these regions are not a select group and living in a conflict region creates
similar effects as being directly affected by conflict, then there should be no accumulation or enroll-
ment gap between children of IDPs and all other children living in a municipality of high conflict. We
2From now on we will refer to recent IDPs simply as IDPs. We also refer to those who are directly affected byconflict as IDPs.
3

estimate our education accumulation and enrollment models on this sub-sample and find that a gap
still exists and even grows. Specifically we find that for children of IDPs 6-11 and 12-17 years, the
education accumulation gaps range from 0.21-0.23 and 0.45-0.61 less years of schooling depending
on the level of conflict the sample is restricted to. With respect to enrollment, the evidence is mixed.
For the 6-11 years cohort, there appears not to be an enrollment gap. In contrast, at the secondary
level, children of IDPs in high conflict regions are significantly less likely than non-migrants to be
enrolled in school (0.6-0.11). These estimated gaps in the high conflict municipalities though slightly
larger are similar to the noted gaps when we considered all municipalities, especially the education
accumulation gap.
The possible argument that non-migrants are not a good comparison group for IDPs leads to
our last question. To address this question, we estimate both our accumulation and enrollment
models limiting the sample to only migrants.3 We restrict our sample first to recent migrants given
we can only detect recent IDPs in our data. However, as a robustness check, we also expand the
sample to anyone who has migrated from their place of birth. We find that the accumulation and
enrollment gap between children of IDPs and other migrants persists and is only slightly smaller
than when IDPs are compared to non-migrants. For instance the accumulation gap for children ages
12-17 is half a year when IDPs are being compared to non-migrants but is about 0.4 of a year when
compared to migrants. For children ages 6-11, there is less evidence of a gap when we restrict the
sample to recent migrants. If we compare IDPs with all past migrants, the gap at this age level is
significant but small. The slight drop in the gap also provides support for the potential selectivity
of migrants.
We conduct some robustness checks on our main results using a fixed effect model and our
inferences are still the same. The finding from our analysis suggest that all other things being equal,
though living in a conflict region could affect a child’s education accumulation and enrollment, the
education impact is far less than being directly affected by conflict. In addition, we find that the
education accumulation and enrollment impacts of having parents directly affected by conflict are
more prominent at the secondary level.
This paper contributes to the literature by highlighting the direct impact of conflict on education
accumulation and enrollment in Colombia. Although the past literature has looked at the impact
of conflict on school related outcomes, it has focused on the impact of living in a municipality with
high conflict versus being directly impacted by this conflict. Though the former is useful, looking
3It is important to mention that although we can argue that most other migrant groups are voluntary migrantsand based on the past literature, such migrants are a select group who on average tend to fall behind in educationaccumulation and enrollment, it is hard argue that IDPs are voluntary migrants given their migration is linked withthe occurrence of exogenous events.
4

at individuals who have been directly impacted by conflict provides more insight on the impact
of conflict on education outcomes. Also, to the best of our knowledge, we are the first to focus
on estimating the educational accumulation and enrollment gaps for children whose parents were
directly affected by conflict in Colombia.
The rest of our paper proceeds as follows. In section two we review the past literature on conflict
and its education impacts and also highlight past literature on IDPs in Colombia. Section three is
a summary of the data sets we used in this paper. In section four, we provide descriptive analysis
of the data. Our empirical model is in section five, and section six provides a detailed summary of
our finding and robustness checks. We conclude in section seven.
2 Literature Review
Education outcomes and the factors that affect these outcomes have been considered extensively
in the literature. Specifically for Colombia, one factor that has been considered carefully is the
opportunity to attend private school through a voucher program. Angrist et al (2002) examine the
short term effects of the use of vouchers on students who had applied for the vouchers in Bogota in
1995. The longer term effects of this program were also considered by Angrist et al (2006). They
found that the voucher program increased secondary school completion rates by 15-20%. Returns
to education in Colombia have also been estimated by several authors4
Non-traditional factors that affect school attainment and enrollment have been analyzed both
within and outside Colombia. Migration, income shocks, loss of life, and institutional quality are
examples of such factors that have been examined in the past literature.5
Another non-traditional factor that affects attainment and enrollment highlighted in the more
recent literature is conflict. However, the challenges of collecting accurate household level data
during armed conflict has limited the growth of studies on this topic. In one of the few studies to
assess the impact of conflict on education attainment using microeconomic data, Shemyakina (2011)
studies the impact of the 1992-1998 civil conflict in Tajikistan on school enrollment and attainment.
Shemyakina finds that exposure to the Tajik civil conflict had little or no effect on boys’ enrollment.
However, it had a large negative effect on girls’ school enrollment. Similarly, Akresh and de Walque
4See Poveda and Sossa (2006), Gaston and Tenjo (1992), Psacharopoulos and Velez (1992, 1993) and Psacharopoulos(1994).
5See McKenzie and Rapoport (2010) for the impact of economic migration on education attainment in rural Mexico,Evans and Miguel (2007) for the effect of losing a parent and the importance of institutions, and Glewwe and Jacoby(1994) for the impact of availability and quality of school facilities on education attainment in Ghana. Also see Jacobyand Skoufias (1997), Duryea et al (2001), and Thomas et al (2004) for the impact of income shocks on schoolingdecisions in peaceful environments.
5

(2008) study the effects of the 1994 Rwandan genocide on schooling. The authors find that children
exposed to the Rwandan conflict lost nearly a half year of schooling compared to their peers who were
not exposed. They were also 15% less likely to complete grades three and four. For Guatemala,
Chamarbagwala and Moran (2011) examine the impact of exposure to the 36-year civil war on
education outcomes for the rural Mayan population. In this disadvantaged group, the authors find
a strong negative impact of conflict on education accumulation. For the three periods of the civil war
identified, rural Mayan males showed a 0.27, 0.71, and 1.09 year decline in education attainment,
while females showed a 0.12, 0.47, and 1.17 year decline. With very low education attainment
overall, this amounts to a 23% and 30% decline in years of schooling during the third period of the
war for males and females, respectively.
Compared to the conflicts in Tajikistan, Rwanda, and Guatemala, the conflict in Colombia is
much more protracted and involves a greater number of irregular actors. These actors employ
strategies that directly target civilians for expulsion, recruitment, and assassination. The relation-
ship between violence and education in Colombia has been investigated. Barrera and Ibanez (2004)
develop a theoretical framework to explore the three ways in which violence can affect education.
First, violence directly reduces the utility of individuals. Second, it destroys physical capital, cre-
ating uncertainty, deterring investment, and reducing productivity. Third, it reduces returns to
education because education is not viewed as a value-enhancing commodity.6 The authors also
show a statistically significant gap in enrollment rates between municipalities above and below the
median national homicide rate. They find that violence has a negative impact on school enrollment
at all ages, and that this effect is particularly large for young adults. The paper shows the negative
effects of living in a violent municipality on school enrollment. However, it does not provide evidence
on the impact of armed conflict on education outcomes of those directly affected by violence–the
IDPs. It also does not discriminate between generalized violence and violence occurring as a direct
result of the armed conflict. Duenas and Sanchez (2007) go a step further by looking at the impact
of armed conflict directly. These authors look at the impact of violence on another school related
outcome, drop-out rates. Focusing on households in the eastern part of Colombia, they show using
a duration model that the presence of illegal armed groups increases dropout rates, with increased
effects for the poorest households. Though this paper considers the impact of the presence of armed
conflict in an area on an education outcome, it does not look directly at IDPs, who we know are
directly affected by the armed conflict. The Rodriguez and Sanchez (2009) paper builds on Duenas
and Sanchez (2007) by considering the joint decision to drop out of school and enter the labor mar-
ket. The authors suggest that violence does not seem to affect education investments or child labor
6These channels through which armed conflict affects schooling are confirmed by Shemyakina (2011).
6
decisions for younger children, but it does impact children over age 12. Interestingly, the authors
find that the effect of violence varies primarily with age rather than with gender or household wealth.
Although looking at the impact of local violence on education outcomes is useful, it cannot reveal
the full impact of conflict on those directly affected.
Though the past research has not focused on the school enrollment and accumulation gap in
Colombia, the plight of the displaced in general has been considered. First, Kirchoff and Ibanez
(2002) study the probability of individual or household migration in Colombia and find that house-
holds that have been directly affected by violence–either assassination or death threats–have a high
probability of migrating. Of the IDPs interviewed, 58.2 percent reported that a household member
received a death threat, compared to only 9.1 percent of non-displaced from the high-conflict regions.
The authors provide extensive descriptive data on the IDP population gained from interviews in
three urban centers. Results indicate that ”security considerations are not the only determinants of
the displacement decision.” Rather, displacement may be motivated by individual characteristics,
such as risk aversion and direct targeting by guerrilla and paramilitary groups. Ibanez and Moya
(2006, 2009) look at the vulnerability of IDPs over time and find that because IDPs are unable to
successfully integrate into the urban economy, wellbeing in fact decreases and households are forced
to take drastic measures in order to smooth consumption. Lozano-Gracia et al (2010) find that while
the majority of IDPs migrate to geographically proximate locations, individuals from municipalities
in the top 10 percent of violence levels will move far from their municipality of origin in hopes of
distancing themselves from the conflict.
We will focus this paper on looking at the human capital investment gap between IDPs and
other migrants, as well as non-migrants.
3 Data
The data we use to answer our questions of interest come from two sources: the Colombia 2005
Census and the the Office for the Coordination of Humanitarian Assistance. We accessed the 2005
Census, via IPUMS-International,7 and the majority of the data for this study comes from this
source. This data includes over two million observations, a 5 percent sample of the 2005 Colombian
Census, which is notable for its accuracy and coverage.
We are able to identify IDPs from this data using those who identify themselves as migrants
and state conflict as the reason for migration. This technique of identifying IDPs has two potential
limitations. First, we are unable to identify IDPs who moved more than five years ago. This
7Minnesota Population Center. Integrated Public Use Microdata Series, International: Version 6.0 [Machine-readable database]. Minneapolis: University of Minnesota, 2010.
7

is because though we can identify indirectly all who have migrated by comparing birth place to
current place of residence, the question that allows us to identify IDPs is restricted to those who
have migrated in the last five years. This limitation implies that we are unable to look at the
long term effects of conflict on school attainment for the children of the displaced. Second, the
responses to the question of why you migrated are mutually exclusive, so each person selects only one
motivation for migration. This could potentially be an issue if an individual migrated for more than
one reason. However, we are of the opinion that this restriction is good for our own identification
because it forces people to pick the most important reason for migrating. This allows us isolate
IDPs (our group of interest) who are more likely to select the directly affected by conflict option.
However, about 0.32% of the sample of recent migrants do not report any reason for migration so
there is a potential that this group could also include IDPs. We create a separate category for these
observations but given the sample size of this group is small, we are not too worried about these
observations potential impacts.8 The census data is appropriate for this analysis not only because it
has a large sample and allows us identify IDPs, but also because it has a wide range of variables that
we can make use of as controls in our enrollment and accumulation models. The major limitation of
the data is the lack of information on income. However, the Colombian census has many indicators
for poverty and wealth which we can use as proxies for income.
The source of data concerning humanitarian risk, conflict, capacity, social, and economic levels
per municipality is the Humanitarian Situation Risk Index (HSRI), calculated by the Office for the
Coordination of Humanitarian Assistance in collaboration with the Universidad Santo Tomas in
2008. The HSRI was developed with the purpose of calculating the probability that a humanitarian
situation will occur at the municipality level in Colombia. Four sub-indices of risk are calculated and
used to determine the overall humanitarian risk: conflict, response capacity, social, and economic.
Information used to calculate the HSRI and sub-indices comes from the National Administrative
Statistics Department (DANE), the Ministry of Social Protection, the National Planning Depart-
ment, the Social Action and Unified Registry System, the National Education Ministry, the Central
Judicial Police Directorate, the Center for Criminological Investigations, the Vice-presidency’s Mines
Observatory, Free Country (an NGO), the Center for Conflict Analysis Resources (a think-tank),
and the World Bank. A HSRI value and a value for each of the risk indicators is provided for each
of 1,100 Colombian municipalities. However, only 532 municipalities or groups of municipalities
are defined in the 2005 Census because in many cases small municipalities are grouped together as
8We do not suggest that our method identifies the sample of those who register as IDPs during our data period.However, we are confident that we capture most of those whose move was driven by being directly affected by conflictfrom 2000-2005.
8

one location in the census. In order to incorporate the HSRI and its sub-indices data into the 2005
Census data (which we will be using for our analyses), we input for each individual, the value of each
index and also the composite index for their municipality. In some instances as mentioned above,
the municipality defined in the census is an agglomeration of multiple small municipalities. Given
the risk indices were defined for all municipalities in the risk data, we find the average HSRI and
other sub-index values for municipalities grouped together in the census and assign these average
values to all individuals who are defined in the census as belonging to that municipality grouping.
Specifics of the variables included in each sub index can be found in Appendix 1.
4 Descriptives
In this section we present some descriptive statistics to further motivate our discussion on the
educational attainment and enrollment of IDPs.9
Table 1 presents summary statistics of basic indicators for IDPs in comparison to other migrants.
Notice that in comparison to other migrants, IDPs are older, more likely to be male, more likely to
have more children in the family, less likely to be married, less likely to be in an urban area, less
likely to own their dwelling, less likely to be literate, less likely to be employed, and more likely to be
disabled. However, if we compare IDPs with non-migrants, we see less of a difference with respect
to being married, gender, living in an urban area, employment, and race. Notice, however, that
IDPs differ significantly in some variables which may be indicators of experiences characteristic of
those who have been directly affected by conflict. For instance, IDPs are more likely than any other
group to be disabled and they also have the lowest likelihood of owning a dwelling. With respect to
education accumulation, we note from Table 1 that IDPs have lower mean educational attainment
than other migrants and non-migrants. One glaring difference between this group and everyone else
is that they have significantly more children than non-migrants or other migrants despite having
similar probability of being married and similar mean age. This difference may suggest that families
with children are more likely to be directly affected by conflict than those without or that families
with children are more likely to migrate if directly affected by conflict. The summary in Table 1
confirms the existing literature that IDPs are vulnerable. Although the literature suggests that
migrants are a select set with exceptional drive, the findings below suggests that IDPs do not fit the
mould of other migrants.
To further motivate our discussion, we present some enrollment statistics. Table 2 shows pro-
portion enrolled in school by age cohort and migration status. In Table 2, the displaced population
9It should be noted that through out this study, “IDPs” refers to Colombians who have migrated because of conflict,according to the 2005 Census. Natural disaster migrants are treated as a separate category.
9

Table 1: 2005 Census: Descriptive Statistics
Category IDPs Other Migrants Non-Migrants All
Age 27.059 26.691 29.06 28.58559Sex (male) 0.509 0.492 0.503 0.501No. children 0.984 0.787 0.809 0.807Married 0.37 0.401 0.354 0.3631Urban 0.523 0.702 0.553 0.581Race: White 0.705 0.836 0.796 0.803Race: Black 0.17 0.11 0.103 0.105Race: indigenous 0.072 0.03 0.071 0.063Yrs school 4.354 6.321 5.125 5.349Literacy 0.738 0.823 0.739 0.755Employed 0.307 0.366 0.273 0.291Disabled 0.082 0.058 0.729 0.07
is compared to other migrants and non-migrants. The results suggest that the displaced are less
likely to be enrolled in school than any other group in all school age categories. The enrollment
gap is particularly substantial for the 12-14 and 15-19 age cohorts, which correspond to secondary
education.
Table 2: 2005 Census: Proportion Enrolled in School
Age Cohort IDPs Other Migrants Non-Migrants All
6-11 0.83 0.901 0.891 0.89212-14 0.744 0.836 0.831 0.83115-16 0.584 0.664 0.689 0.68317-21 0.253 0.322 0.331 0.32822-25 0.097 0.149 0.135 0.138
In Table 3, we compare IDPs with other vulnerable groups to highlight the fact that though our
discussion is focused on IDPs, IDPs are not the only educationally vulnerable population. The other
vulnerable groups we isolate are those who migrated because of natural disaster, the disabled, and
the poor.10 At the level of primary education, ages 6-11, the displaced are more likely to be enrolled
than any of these other groups of vulnerable migrants, with 81.1% enrollment. The displaced, the
natural disaster migrants, and the disabled have very similar enrollment rates from ages 12-21. In
10We identify the poor in this Table through the wall materials of their housing.
10

the 22-25 age cohort, which corresponds with graduate level university education, the displaced lag
behind these other groups. Not surprising, at all ages, the very poor lag significantly behind in
terms of educational enrollment which suggests the need to control for income and disability in our
regression analysis.
Table 3: 2005 Census: Enrollment Statistics for Vulnerable Groups
Age Cohort Migrated:Displaced
Migrated:NaturalDisaster
Disabled Poorlivingconditions
6-11 0.83 0.814 0.702 0.77912-14 0.744 0.74 0.723 0.70615-16 0.584 0.559 0.58 0.51117-21 0.253 0.27 0.277 0.20322-25 0.097 0.114 0.114 0.065
Table 4 highlights the educational attainment of the displaced, other migrants, and non-migrants.
Table 4 indicates that the displaced have significantly lower educational attainment than any of the
other groups, and that the educational attainment gap grows over time. These results can also be
seen graphically in Figure 1. The gap grows significantly in the 22-25 age cohort, with the displaced
achieving approximately 2.3 fewer years of schooling than non-displaced migrants and 1.3 fewer years
than non-migrants. This difference is likely attributable to the large proportion of other migrants
who have moved for study and are therefore expected to reach very high educational attainment.
It is also notable from Table 4 that educational attainment is on average lower in the 26-30 cohort
than in both the 17-21 and 22-25 age cohort, suggesting an improvement over time in human capital
accumulation in Colombia.
Table 4: 2005 Census: Educational Attainment
Age Cohort Displaced Other Migrants Non-Migrants
6-11 1.948 2.188 2.317 2.28712-14 4.728 5.633 5.58 5.57815-16 6.257 7.243 7.109 7.12217-21 6.812 8.554 7.926 8.04522-25 6.732 9.064 7.992 8.25326-30 6.176 8.877 7.396 7.777
11

02
46
810
Med
ian
splin
e: Y
ears
of S
choo
ling
5 10 15 20 25Age
Violence and Insecurity Natural DisasterHealth
Vulnerable MigrantsEducational Attainment by Reason for Migrating
Figure 1:
Even if we focus solely on potentially vulnerable migrants (migrants who have moved because
of natural disaster, health, or displacement) as in Figure 2, we still see IDPs end up with lower
levels of attainment. Notice that IDPs migrants appear to achieve similar educational attainments
as other vulnerable migrants until secondary school, when health migrants begin to move ahead and
the displaced begin to fall behind. By age 18, the gap has widened significantly, with the displaced
achieving approximately 3 years less schooling than those who migrated for health reasons, and
natural disaster victims falling somewhere in between.
One of the points we make in this paper is that IDPs are not like other most other migrants,
especially those who migrated for endogenous versus exogenous factors. Figure 3 highlights the
school attainment trend for three group of regular migrants: those who migrated for work, family,
and study. The results are logically consistent, with study migrants achieving highest years of
schooling, and work migrants achieving the fewest. It should be noted that again, the gap does not
emerge until secondary education. All of these non-vulnerable groups achieve higher educational
attainment than the displaced population.
These preliminary descriptive statistics suggest IDPs have experienced something that makes
them different. In this paper, we focus on the education accumulation and enrollment impact of
direct exposure to conflict on children. Even though the above results suggest lower mean education
accumulation and enrollment for IDPs or their children, this result does not imply that conflict is
12

05
1015
Med
ian
splin
e: Y
ears
of S
choo
ling
5 10 15 20 25Age
Work StudyFamily
Non−Vulnerable MigrantsEducational Attainment by Reason for Migrating
Figure 2:
05
1015
Med
ian
splin
e: Y
ears
of S
choo
ling
5 10 15 20 25Age
Work StudyFamily
Non−Vulnerable MigrantsEducational Attainment by Reason for Migrating
Figure 3:
13

responsible for this gap. It is possible that children of IDPs have parents with lower education or
parents who are poorer. In this scenario, a gap in educational attainment or enrollment ins expected.
To evaluate the possible effect of direct exposure to conflict, we turn to econometric analysis.
5 Empirical Strategy
As mentioned above, we focus on four main questions in this paper. First, is there an education
enrollment and accumulation gap for children of those who live in municipalities with high conflict in
comparison to others? Second, is there an education accumulation and enrollment gap for children
of those directly affected by conflict? Third, does living in a municipality with high conflict create
similar education accumulation and enrollment gaps as being directly affected by conflict? Finally,
how do IDPs compare to other migrants in education accumulation and enrollment?
To answer our first question, we estimate a school accumulation empirical model (equation (1))
and a school enrollment empirical model (equation (2)).
Yc = αc + γcXc + δcFc + βcRc + θcWc + εc (1)
Here Y is a vector of years of schooling for a particular age cohort c. We focus on two age
cohorts in our analysis: ages 6-11 and ages 12-17. We choose to focus on these cohorts because we
have information on important controls that affect our outcomes of interest for these two cohorts.
Moreover, these age groups corresponds with Colombia’s school system - primary and secondary
age ranges. X is a matrix of variables that affects a child’s schooling in cohort c. This matrix
includes variables like gender, economic status correlates, family size, mother’s years of schooling,
father’s years of schooling, number of children of mother, class of work of father, class of work of
mother, and employment status of father. F is a matrix of dummy variables that are important to
control for, such as state of residence and race. R is a dummy variable that takes a value of 1 if
a child is in a municipality with high conflict and 0 if otherwise. The matrix W consists of region
controls such as if an area is urban or rural or the social capacity of a municipality. epsilon is the
error term. The inclusion of parent related variable reduces the potential of omitted variable bias
given the importance of parents’ education as a predictor of child’s education. However, inclusion of
this variable comes at a cost given not all children in the sample report information about parents.
We drop all children who do not have information on both parents’ education from the sample we
estimate. However, we address later on in the paper the question of whether the use of the restricted
sample for which information on parents is available creates a biased estimate of the coefficients we
are interested in.
14

To answer the second part of question 1, we assume that a child being enrolled in school is a
function of a set of variables Z. In this case, our independent variable is a binary variable that takes
a 1 when a child in a particular age cohort is enrolled in schooling and 0 otherwise. We rewrite
equation (2) assuming a probit modeling strategy. The Φ in equation (3) our empirical school
enrollment model, indicates the standard normal distribution. The description of the variables is
the same as in equation (1) above. Using a probit model, we estimate equation (3) and find the
marginal effects. The marginal effects represent the impact of a unit change in each independent
continuous variable on the probability of being enrolled in school. This provides a straight forward
interpretation of estimated results from the probit models. For dummy variables like R, which is the
focus of the first question, the interpretation of marginal effects is slightly different. The marginal
estimate captures the difference in the probability of being enrolled in school for a particular group
dummy relative to the baseline group. In the case of R, the estimated marginal effect captures the
probability of being enrolled in school for a certain age cohort for those living in a high conflict
municipality relative to those who do not.
Prob(S = 1) = F (β′Z) (2)
Prob(S = 1) = Φ(α+ ζX + ξF + λR+ χW + µ) (3)
For the second question, our empirical strategy is to first estimate equation (4) using OLS. Notice
equation (4) is very similar to equation (1). The difference lies in the matrix M being include in
equation (4) instead of dummy variable R. To answer the second part of question two, we also alter
our enrollment empirical model, equation (3), dropping R and including M as in equation (5). Once
again we compute and report marginal effects for the enrollment model.
Yc = αc + γcXc + δcFc + βcMc + θcWc + εc (4)
M is a dummy variable matrix that divides the population based on cause for migration in the
last five years. For these dummy variables the base group are people who have not moved in the
last five years. We call this group non-migrants. Among the migrant cause dummies, we have a
dummy for those who migrated because of violence or conflict. This is our identifier of IDPs, and
the dummy we will focus on in answering the question of if there is an education and accumulation
gap for IDPs.
Prob(S = 1) = Φ(α+ ζX + ξF + λM + χW + υ) (5)
15

To address the third question, we re-estimate equations (4) and (5) on the sample of those
affected solely by conflict. To test the sensitivity of our result, we try different ways of defining the
population affected by conflict. First, we consider states with a conflict index above the mean. Next
we consider municipalities with conflict index above the mean. Lastly, we consider municipalities
with very high conflict (in the top quartile of the conflict index).
We address our last question by once again slightly altering equations (1) and (3). In contrast to
the first two questions for which we focus on both migrants and non-migrants, here we restrict our
sample to only migrants. In addition, we alter the dummy variable R. Recall for the first question,
R=1 if a person lives in a municipality with high conflict. However for this question, R takes the
value of 1 if a person is an IDP (migrant directly affected by conflict) and 0 if the person is a migrant
for any other reason.
5.1 Potential Econometric Issues with estimating the impact of conflict
Given our focus on estimating the school accumulation and school enrollment gap linked with con-
flict, it is important to highlight some basic issues that could make deriving consistent estimates of
these gaps difficult. First, IDPs are migrants, and in general analysis focused on migrants could be
plagued with issues of selectivity. Migrants are a select group of people, and in general, looking at
migrants’ outcomes or the impact of migrations on certain outcomes without controlling for selec-
tion could lead to biased estimates. However, IDPs are a unique group of migrants in that their
migration is motivated by being directly affected by conflict. We can think of IDPs as involuntary
migrants linked to exogenous forces. In contrast, migrants who moved for study, family reasons
or work can be viewed as voluntary migrants linked to endogenous factors. Kirchhoff and Ibanez
(2002) note that not everyone in regions of high conflict migrate. Those who do leave have usually
been directly affected in a significant way by the conflict, having lost family or property or received
threats of such. Table 1 of Kirchhoff and Ibanez (2002), highlights that 58.2% of IDPs surveyed
received a death threat before migrating. In contrast, only 9.1% of those who did not migrate living
in the same high conflict region as were the IDPs migrated from, received similar threat. Given the
uniqueness of the IDPs’ experience and the exogenous nature of being directly affected by conflict, it
may be possible to look at IDPs as a different kind of migrants that may not suffer from the selection
bias plaguing other migrants. Assuming this is true, then in a regression in which we control for
the factors that typically predict school attainment, the estimate of the gap in school attainment or
enrollment between the IDP’s and non-migrants can give us an approximate estimate of the impact
of being directly affected by conflict. If however, non-migrants on average look very different from
16

IDPs, then the estimated education accumulation or enrollment gap could be upward biased.11
Another variable that several authors have noted to be endogenous in the accumulation and
enrollment models is conflict. Conflict could be correlated with individuals being poor or living in
an area with low levels of social capacity. Because both of these factors are important for human
capital investment and school enrollment, an analysis focused on conflict could over estimate the
impact of conflict if we do not control for capacity or address the potential endogeneity in the conflict
variable. Although the level of conflict in a region is merely a control rather than our major variable
of interest for our second and third question, conflict in a region is used to define the exposure to
conflict dummy for our first question and is also relevant for our last question. We try to avoid
the potential bias in estimating the impact of exposure to conflict by controlling for the capacity
in a municipality and also by including several poverty correlates and wealth indicators.12 It is
also important to mention that Rodriguez and Sanchez (2009) highlight another potential channel
of omitted variable bias in estimating the impact of conflict on dropout rate.13 They suggest that
although exposure to conflict affects school enrollment, pressure to drop out of school also affects
dropout rates and is correlated with conflict. Therefore, it is possible to attribute to conflict the
impact of this pressure on drop out rates or enrollment. Although we think this kind of bias will
be marginal, one way to deal with this potential bias is to use instrumental variables. We do not
explore this route because we are unable find a suitable instrument that satisfies exclusion restriction
and including a weak instrument could create more bias in our estimated coefficients than if an OLS
estimate was derived.14 Although Rodriguez and Sanchez (2009) use lagged homicide capture rates
as an instrument, we are not of the opinion that this variable satisfies exclusion restrictions. One
possible way to deal with this omitted variable which we explore in our paper is to restrict the
sample to high conflict communities. In these communities, it is safe to assume that the pressure to
drop out should on average be the same. Hence, the estimated enrollment and attainment gaps for
IDPs in comparison to non-migrants living in these high conflict region will not be upward biased
because the missing variable has the same distribution across both groups.
We also explore a fixed effect technique to overcome this problem. Pressure to migrate and
11We are of the opinion that we can make this assumption because we compared summary statistics for variableslike age, family size, marital status and gender for IDPs, migrants and non-migrants. We noted only slight differencesbetween IDPs and non-migrants but bigger differences between non-migrants and migrants. We do not comparesummary statistics for variables related to education, employment or location (urban vs rural) as we expect that thesevariables will be affected by being exposed to conflict and so should differ across IDPs and non-migrants.
12More on the capacity index and what is used in its computation is in the appendix. See Table 17 in the appendix.In the data section of the paper we describe how we impute the data on conflict and capacity into our census data for2005. The conflict and capacity data are measured over different periods.
13Enrollment, our focus in this paper, is inversely related to dropout rate.14See Staiger and Stock 1997 for more on weak instruments.
17
02
46
Den
sity
0 .2 .4 .6 .8 1Conflict Index
kernel = epanechnikov, bandwidth = 0.0099
Kernel density estimate
Figure 4: Kernel Density for Conflict Index
level of conflict are similar within a municipality. In fact, conflict measures are all calculated at
the municipality level. Moreover, social and economic infrastructure and other related variables
that potentially could affect enrollment and accumulation do not vary at the municipality level. We
can therefore include fixed effects for the 532 municipalities in our data. Of course this problem
will not deal with any omitted variable that may vary within the municipality if it is correlated
with education accumulation or enrollment and varies across IDPS and other groups. Although we
cannot readily think of a variable that fits this category that we have not controlled for directly or
indirectly (income), we cannot rule out this possibility.
6 Results
6.1 Does living in a high conflict area affect educational outcomes?
The first question we try to answer as a motivation for our main set of questions is if living in a
conflict region leads to a gap in education exposure. The purpose of this analysis is to compare our
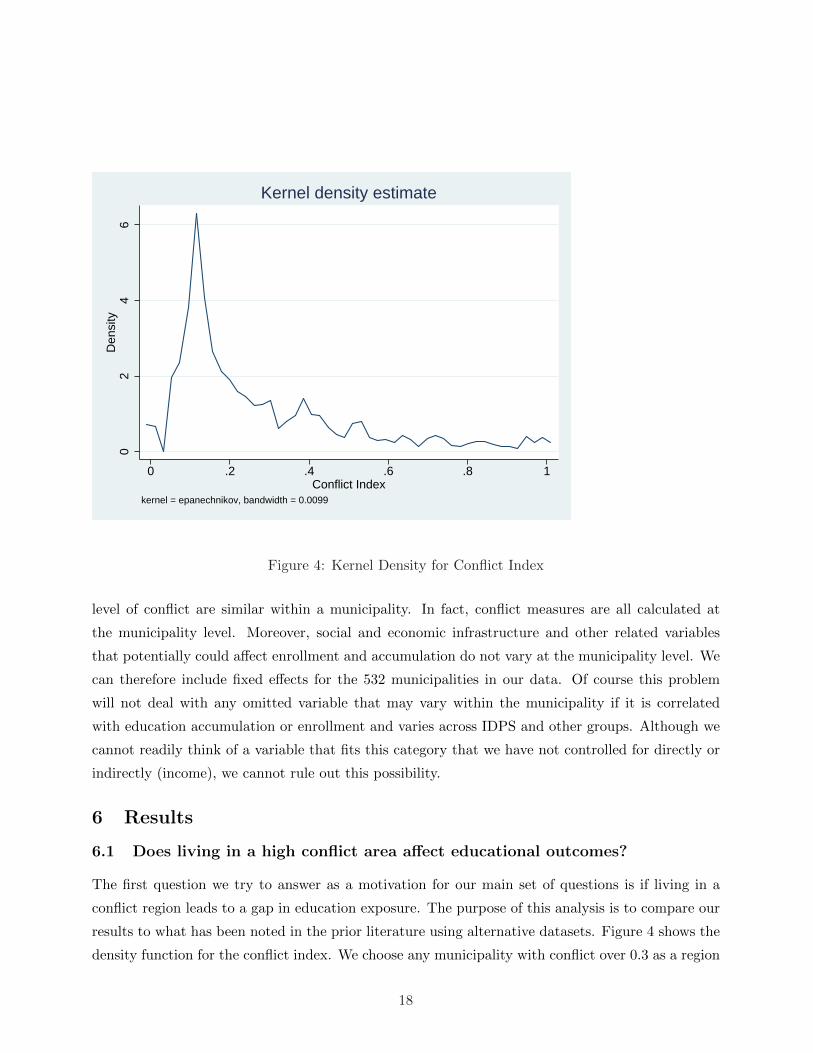
results to what has been noted in the prior literature using alternative datasets. Figure 4 shows the
density function for the conflict index. We choose any municipality with conflict over 0.3 as a region
18
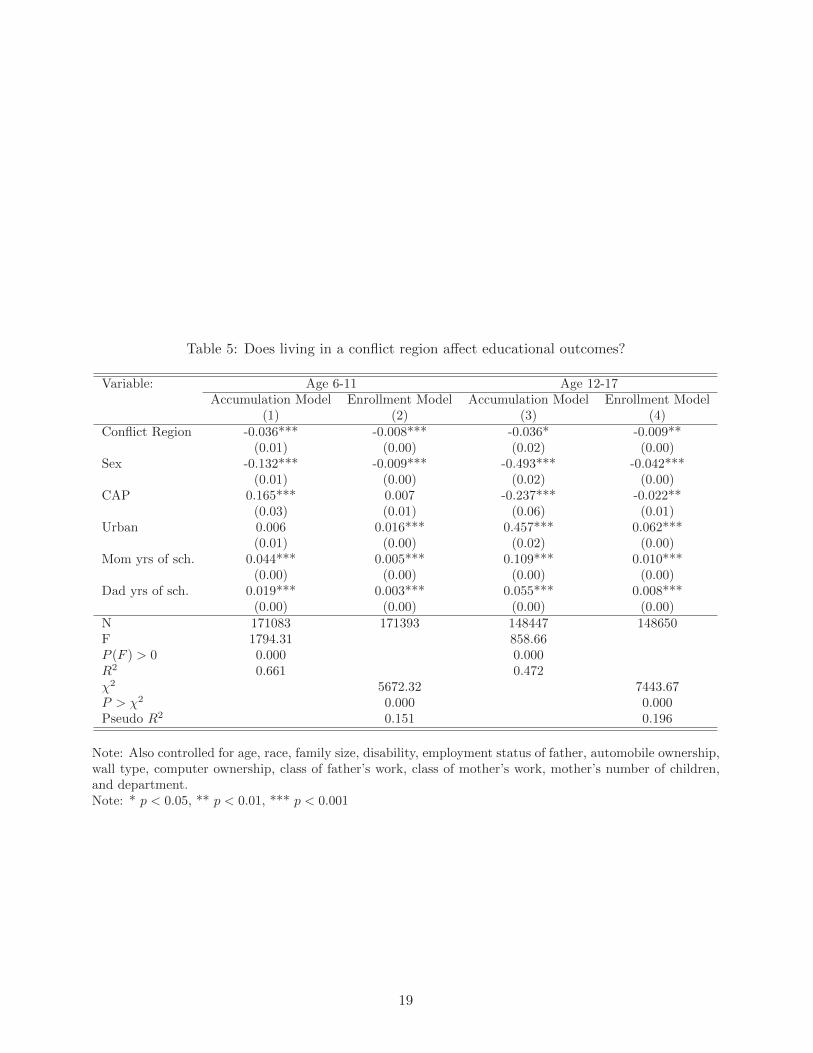
Table 5: Does living in a conflict region affect educational outcomes?
Variable: Age 6-11 Age 12-17Accumulation Model Enrollment Model Accumulation Model Enrollment Model
(1) (2) (3) (4)Conflict Region -0.036*** -0.008*** -0.036* -0.009**
(0.01) (0.00) (0.02) (0.00)Sex -0.132*** -0.009*** -0.493*** -0.042***
(0.01) (0.00) (0.02) (0.00)CAP 0.165*** 0.007 -0.237*** -0.022**
(0.03) (0.01) (0.06) (0.01)Urban 0.006 0.016*** 0.457*** 0.062***
(0.01) (0.00) (0.02) (0.00)Mom yrs of sch. 0.044*** 0.005*** 0.109*** 0.010***
(0.00) (0.00) (0.00) (0.00)Dad yrs of sch. 0.019*** 0.003*** 0.055*** 0.008***
(0.00) (0.00) (0.00) (0.00)N 171083 171393 148447 148650F 1794.31 858.66P (F ) > 0 0.000 0.000R2 0.661 0.472χ2 5672.32 7443.67P > χ2 0.000 0.000Pseudo R2 0.151 0.196
Note: Also controlled for age, race, family size, disability, employment status of father, automobile ownership,wall type, computer ownership, class of father’s work, class of mother’s work, mother’s number of children,and department.Note: * p < 0.05, ** p < 0.01, *** p < 0.001
19

with high conflict. The mean conflict index is 0.276. Using this benchmark, 34.6% of the sample
is exposed to high levels of conflict. We use this information to create a dummy variable which we
include in our school accumulation and school enrollment models. Individuals with a conflict index
more than 0.3 are assigned a 1 and everyone else is assigned a 0. Controlling for the factors that can
affect education accumulation or enrollment both on the individual and regional scale, the results in
Table 5 indicate that children age 6-11 who live in a high conflict region have about 0.04 fewer years
of schooling than those who do not. For the 12-17 year old children, the gap is larger (0.077) which
is expected given the existence of a gap from elementary school. With respect to the probability
of being enrolled, we note that children living in high conflict regions have a lower probability of
being enrolled in school (0.008% and 0.009% lower at the elementary and secondary school levels
respectively). Our results are quite different from Rodriguez and Sanchez (2009) and much smaller.
They find that without conflict, the average educational attainment of children between 6-11 years
of age residing in conflict areas would have been 0.4 years larger, and for children between 12-17,
1.4 year larger. However differences in result is possible for several reasons. First, our result is
comparing children in regions with high conflict to children in regions with lower conflict which is
different from comparing high conflict with no conflict at all. Second, they make use of a duration
model and look at the effect of past conflict on probability of dropping out and also joining the labor
force using past exposure to conflict. In contrast, we are looking at the differences between children
presently living in conflict region and those who are not. Also, they make use of the 2003 Colombia
household survey covering 24,090 households between March and May 2003 in 128 municipalities.
We make use of the 2005 census with a sample size of 2,003,186 and 533 municipalities. Our results
seem to suggest that there is not much difference between children who live in regions with high
conflict and those who do not. In fact, when we cluster our standard error given our conflict variable
is at the municipality level, we get no significant effects in all cases apart from the probability of
enrollment for children age 6-11years.
It is also important to mention that our estimate could be biased because of the possible en-
dogenous nature of the living in a conflict area dummy. If living in a conflict area is correlated
with an omitted variable that can affect education accumulation or enrollment, then the estimated
coefficient could be biased. Although we control for many variables that could fit this profile with
our capacity index,15 as noted by Rodriguez and Sanchez (2009), pressure to join militant groups
is high in regions with high conflict and this could lead to lower school attainment or enrollment.
15The capacity index is a measure of a municipalities’ infrastructure. We also tried alternative models with morepoverty correlates like home ownership, floor type, number of rooms and the result does not change significantly.Given this result for the rest of the paper we restrict our selves to just a few poverty correlates.
20

Hence, if we do not control for this omitted variable, we could attribute to living in a conflict region
the impact of the pressure to join militant groups. Assuming this is true and given the negative
correlation between pressure to join a militant group and attainment and enrollment, our estimated
impact of living in a conflict region could be upward biased, implying an even smaller gap between
children living in conflict region and children who do not. Another way to interpret these results is
to think of the estimated impact as an upper limit on the difference as long as there is no omitted
variable positively correlated with the Y variable and exposure to conflict.16 The above results
suggest very little impact of living in a high conflict region in comparison to living in a municipality
with less than average conflict. We investigate next whether directly being impacted by conflict
leads to a similar outcome.
The above look at just the impact of living in a conflict region leads us to the main questions
of our paper. What is the enrollment and education gap for the displaced? As highlighted in
our model specification, we estimate an OLS regression controlling for potential heteroskedasticity
and controlling for the general predictors of school accumulation. For our enrollment model, we
estimate a probit model deriving the marginal effects. In both cases we divide the population into
subgroups: non-recent migrants, and recent migrants, who we divide based on their primary reason
for migrating. This creates eight dummy variables of migrant groups: migrants for work, family
reasons, study natural disaster, health, other reasons, non-specificated and our group of interest
IDPs (migrants because of violence). The base group we are comparing these groups with are those
who did not migrate in the last five years.
6.2 Results : School Accumulation Models
The results summarized in Tables 6- 10 help us answer the question of whether there an education
accumulation and enrollment gap for the children of those directly affected by conflict in comparison
to other migrant sub-groups? Specifically, Table 6 summarizes the results from our estimation of the
school accumulation models based on equation (1), for ages 6-11, using ordinary least squares (OLS)
and correcting for potential heteroscedasticity. We highlight the other control variables included in
our estimation under the table.
In column one we control for age, sex, race, family size, sector (urban or rural), disability,
employment status of father, class of work of father, class of work of mother, years of school of
mother, year of school of father, number of children of mother, and state of residence. We also
include some proxies for wealth given the census data does not have information on income. There
were several potential variable that we could use as proxies. Our choice reflected variables that we
16We could not think of any such variable that we did not control for but it is still a possibility.
21
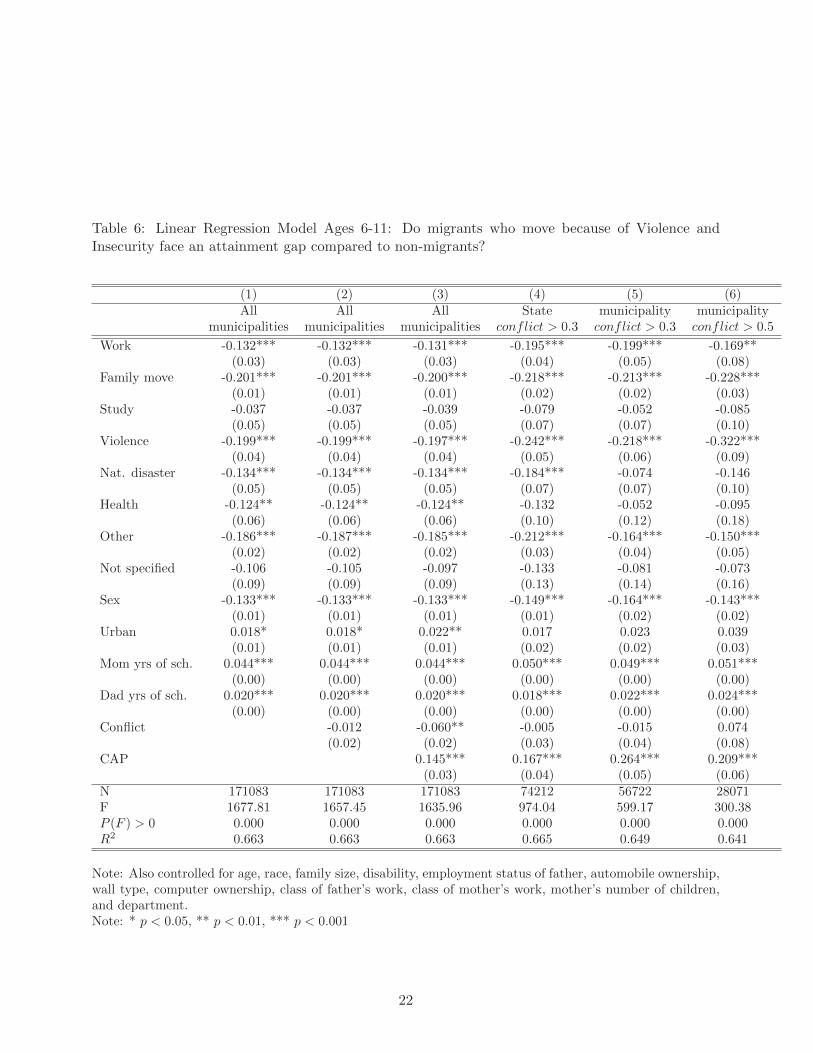
Table 6: Linear Regression Model Ages 6-11: Do migrants who move because of Violence andInsecurity face an attainment gap compared to non-migrants?
(1) (2) (3) (4) (5) (6)All All All State municipality municipality
municipalities municipalities municipalities conflict > 0.3 conflict > 0.3 conflict > 0.5
Work -0.132*** -0.132*** -0.131*** -0.195*** -0.199*** -0.169**(0.03) (0.03) (0.03) (0.04) (0.05) (0.08)
Family move -0.201*** -0.201*** -0.200*** -0.218*** -0.213*** -0.228***(0.01) (0.01) (0.01) (0.02) (0.02) (0.03)
Study -0.037 -0.037 -0.039 -0.079 -0.052 -0.085(0.05) (0.05) (0.05) (0.07) (0.07) (0.10)
Violence -0.199*** -0.199*** -0.197*** -0.242*** -0.218*** -0.322***(0.04) (0.04) (0.04) (0.05) (0.06) (0.09)
Nat. disaster -0.134*** -0.134*** -0.134*** -0.184*** -0.074 -0.146(0.05) (0.05) (0.05) (0.07) (0.07) (0.10)
Health -0.124** -0.124** -0.124** -0.132 -0.052 -0.095(0.06) (0.06) (0.06) (0.10) (0.12) (0.18)
Other -0.186*** -0.187*** -0.185*** -0.212*** -0.164*** -0.150***(0.02) (0.02) (0.02) (0.03) (0.04) (0.05)
Not specified -0.106 -0.105 -0.097 -0.133 -0.081 -0.073(0.09) (0.09) (0.09) (0.13) (0.14) (0.16)
Sex -0.133*** -0.133*** -0.133*** -0.149*** -0.164*** -0.143***(0.01) (0.01) (0.01) (0.01) (0.02) (0.02)
Urban 0.018* 0.018* 0.022** 0.017 0.023 0.039(0.01) (0.01) (0.01) (0.02) (0.02) (0.03)
Mom yrs of sch. 0.044*** 0.044*** 0.044*** 0.050*** 0.049*** 0.051***(0.00) (0.00) (0.00) (0.00) (0.00) (0.00)
Dad yrs of sch. 0.020*** 0.020*** 0.020*** 0.018*** 0.022*** 0.024***(0.00) (0.00) (0.00) (0.00) (0.00) (0.00)
Conflict -0.012 -0.060** -0.005 -0.015 0.074(0.02) (0.02) (0.03) (0.04) (0.08)
CAP 0.145*** 0.167*** 0.264*** 0.209***(0.03) (0.04) (0.05) (0.06)
N 171083 171083 171083 74212 56722 28071F 1677.81 1657.45 1635.96 974.04 599.17 300.38P (F ) > 0 0.000 0.000 0.000 0.000 0.000 0.000R2 0.663 0.663 0.663 0.665 0.649 0.641
Note: Also controlled for age, race, family size, disability, employment status of father, automobile ownership,wall type, computer ownership, class of father’s work, class of mother’s work, mother’s number of children,and department.Note: * p < 0.05, ** p < 0.01, *** p < 0.001
22
believe could do a better job of capturing variation in wealth. These variables are number of cars, if
an individual has a computer, and the type of walls of residence of an individual.17 Although we are
interested in the accumulation gap for IDPs in comparison to non-recent migrants, we also present
the marginal effects for other recent migrant groups.18 The results in column (1) do not control for
conflict in the municipality or the social capacity in the municipality. Hence, estimates may exhibit
upward bias. These result suggests that children of IDPs between the age of 6-11 (elementary school)
have approximately 0.2 less years of schooling than non-migrants (approx 1/5 of a year). When we
control for conflict in the municipality, we do not notice any change in the schooling investment
gap between children of IDPs and non-migrants (Table (6) column (2)). In the model captured in
column (3), we control for capacity, which is a necessary control for school accumulation to reduce
omitted variable bias in the estimate of the impact of conflict. Our dummy of interest does not
differ considerably in column (3) from the 2 previous models. However, notice that the conflict
variable is negative and significant, and the capacity variable is positive. Our measurement of the
direct impact of conflict as captured by the gap between IDPs and non-migrants suggests a smaller
effect than that found in Rodriguez and Sanchez (2007) focusing on exposure to conflict. They
find about 0.4 years lower for children exposed to conflict (via in a conflict area) in contrast we
find 0.2 less years of schooling for IDPs in comparison to non-migrants. As mentioned above, this
differences is not totally unexpected. Our lower estimate may be due to differences in technique
or approach and possibly due to the fact that some non-migrants could also have been exposed to
conflict and so a gap between IDP and non-migrants would be smaller than a gap between IDP and
those not exposed to conflict assuming exposure is important. Notice that this gap is much bigger
than the estimated gap in the model summarized in Table 5. This difference suggests that living in
a high conflict region may lead to a slightly lower school attainment, but it is not as important for
education accumulation of children 6-11 years old as is being directly affected by conflict. Notice our
R2 are relatively high, meaning our model is explaining between 60-65% of the variation in school
accumulation for children 6-11 years. Also recall that this estimated gap may form an upper limit
to the potential accumulation gap if pressure to drop out of school is significant.
In Table 7, we summarize the results of similar models as in Table 6 but we restrict the sample
to older children aged 12-17. The trend in the estimates is the same. Although our R2 drops, it is
still relatively high. Focusing on column (3), our results suggests that children of IDPs ages 12-17
have about half a year gap in education accumulation in comparison to non-migrants. Notice that
17We chose these three proxy for wealth but our results for IDPs do not change significantly with alternative choicecombination of potential wealth proxies like type of floor, having a toilet, ownership of dwelling and so on.
18For the rest of the paper, we will refer to non-recent migrants as non-migrants.
23

Table 7: Linear Ages 12-17: Do migrants who move because of Violence and Insecurity face attain-ment gaps compared to non-migrants?
(1) (2) (3) (4) (5) (6)All All All State municipality municipality
municipalities municipalities municipalities conflict > 0.3 conflict > 0.3 conflict > 0.5
Work -0.453*** -0.453*** -0.454*** -0.459*** -0.468*** -0.200(0.06) (0.06) (0.06) (0.09) (0.12) (0.13)
Family -0.229*** -0.230*** -0.232*** -0.263*** -0.252*** -0.206***(0.03) (0.03) (0.03) (0.04) (0.05) (0.07)
Study 0.063 0.064 0.065 -0.183* -0.042 0.013(0.08) (0.08) (0.08) (0.11) (0.14) (0.17)
Violence -0.513*** -0.513*** -0.515*** -0.445*** -0.560*** -0.610***(0.09) (0.09) (0.09) (0.12) (0.13) (0.19)
Nat. disaster -0.279* -0.279* -0.281* -0.069 -0.002 -0.024(0.15) (0.15) (0.15) (0.15) (0.18) (0.15)
Health -0.458*** -0.458*** -0.457*** -0.095 -0.350* -0.378(0.12) (0.12) (0.12) (0.18) (0.19) (0.30)
Other -0.218*** -0.220*** -0.222*** -0.213*** -0.186** -0.160(0.04) (0.04) (0.04) (0.06) (0.07) (0.11)
Not spec -0.713*** -0.712*** -0.722*** -0.760** -0.130 -0.407(0.22) (0.22) (0.22) (0.31) (0.28) (0.45)
Sex -0.495*** -0.495*** -0.494*** -0.512*** -0.503*** -0.534***(0.02) (0.02) (0.02) (0.02) (0.03) (0.04)
Urban 0.477*** 0.478*** 0.472*** 0.565*** 0.521*** 0.526***(0.02) (0.02) (0.02) (0.03) (0.04) (0.05)
Mom yrs of sch. 0.108*** 0.108*** 0.108*** 0.107*** 0.113*** 0.108***(0.00) (0.00) (0.00) (0.00) (0.00) (0.01)
Dad yrs of sch. 0.056*** 0.056*** 0.056*** 0.058*** 0.063*** 0.077***(0.00) (0.00) (0.00) (0.00) (0.00) (0.01)
Conflict -0.148*** -0.067 -0.036 -0.127* 0.131(0.04) (0.04) (0.05) (0.07) (0.15)
CAP -0.250*** -0.234*** -0.083 0.030(0.06) (0.08) (0.09) (0.12)
N 148447 148447 148447 64052 48081 23326F 795.21 785.77 777.69 305.98 172.02P (F ) > 0 0.000 0.000 0.000 0.000 0.000R2 0.474 0.474 0.474 0.476 0.476 0.487
24

this gap is bigger than the gap for the children of all the other migrant groups apart from those who
migrated for non specified reasons. Also note that this gap is not directly comparable to the results
of Rodriguez and Sanchez (2007), who find exposure to conflict leads to one year less of schooling.
This is because we are estimating the impact of being directly affected by conflict in comparison to
non-migrants who are not. In contrast they look at the impact of exposure to conflict.19
6.3 Results: School Enrollment Models
We move away from our education accumulation model and check to see if our enrollment model
leads to similar conclusions as above. First, we estimate the probability of being enrolled in school
for children 6-11 years (Table 8) and afterwards, we re-estimate our accumulation model for children
ages 12-17 (Table 9). In contrast to the accumulation model for which we present estimates, for
our enrollment model, in Tables 8 and 9 we present the marginal effects from the probit model
estimation. The results in column (3), our preferred model, suggest that children of IDPs are 1.6%
less likely to be enrolled in school in comparison to non-migrants. In Table 8, the marginal effects
for the children ages 12-17 using the different alternations to the enrollment model are summarized.
The results for older children indicate an increase in the enrollment gap compared to younger
children. Specifically looking at the whole population, children of IDPs ages 12-17 are 6.3% less
likely to be enrolled in school than are the children of non-migrants. This gap is significant, and
one way to put it in perspective is to look at the gap for other migrant groups. Given that we do
not control for selectivity of these migrant groups, it is possible that the estimates will be upward
biased. Hence we can think of these estimates as an upper limit on the education enrollment gaps
for these migrant groups. Notice however that the gap even for secondary school aged children of
those who migrate for work, natural disaster, or health, is smaller than the gap for children whose
parents were directly affected by conflict. For the children 6-11 years, there is not much difference
in enrollment for most migrant groups compared to non-migrants. Notice from Table 8 that the
enrollment gap is even slightly larger for children of migrants for health reasons and work. This
finding is in line with Rodriguez and Sanchez (2007), who find much larger effects of exposure to
conflict at the secondary level versus the primary level.
The results above raise question on what are the possible channels through which direct contact
with conflict can lead to lower education accumulation. Those who are directly impacted by conflict
sometimes lose their assets or sources of income, which may create a constraint on future income
streams and expenditures, including expenditure on children’s education. However this cannot be
the only channel because those who migrate because of natural diaster are also likely to have lost
19Our base group non-migrant have not been directly affected by conflict, but could have been exposed to conflict.
25
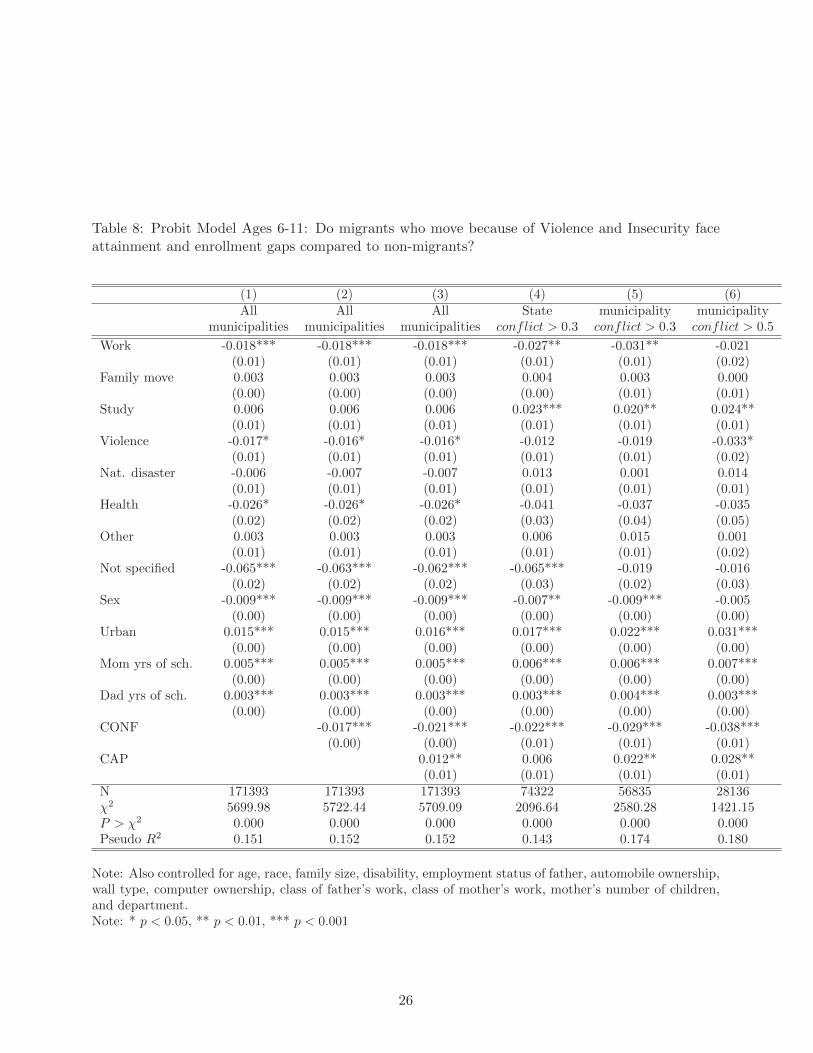
Table 8: Probit Model Ages 6-11: Do migrants who move because of Violence and Insecurity faceattainment and enrollment gaps compared to non-migrants?
(1) (2) (3) (4) (5) (6)All All All State municipality municipality
municipalities municipalities municipalities conflict > 0.3 conflict > 0.3 conflict > 0.5
Work -0.018*** -0.018*** -0.018*** -0.027** -0.031** -0.021(0.01) (0.01) (0.01) (0.01) (0.01) (0.02)
Family move 0.003 0.003 0.003 0.004 0.003 0.000(0.00) (0.00) (0.00) (0.00) (0.01) (0.01)
Study 0.006 0.006 0.006 0.023*** 0.020** 0.024**(0.01) (0.01) (0.01) (0.01) (0.01) (0.01)
Violence -0.017* -0.016* -0.016* -0.012 -0.019 -0.033*(0.01) (0.01) (0.01) (0.01) (0.01) (0.02)
Nat. disaster -0.006 -0.007 -0.007 0.013 0.001 0.014(0.01) (0.01) (0.01) (0.01) (0.01) (0.01)
Health -0.026* -0.026* -0.026* -0.041 -0.037 -0.035(0.02) (0.02) (0.02) (0.03) (0.04) (0.05)
Other 0.003 0.003 0.003 0.006 0.015 0.001(0.01) (0.01) (0.01) (0.01) (0.01) (0.02)
Not specified -0.065*** -0.063*** -0.062*** -0.065*** -0.019 -0.016(0.02) (0.02) (0.02) (0.03) (0.02) (0.03)
Sex -0.009*** -0.009*** -0.009*** -0.007** -0.009*** -0.005(0.00) (0.00) (0.00) (0.00) (0.00) (0.00)
Urban 0.015*** 0.015*** 0.016*** 0.017*** 0.022*** 0.031***(0.00) (0.00) (0.00) (0.00) (0.00) (0.00)
Mom yrs of sch. 0.005*** 0.005*** 0.005*** 0.006*** 0.006*** 0.007***(0.00) (0.00) (0.00) (0.00) (0.00) (0.00)
Dad yrs of sch. 0.003*** 0.003*** 0.003*** 0.003*** 0.004*** 0.003***(0.00) (0.00) (0.00) (0.00) (0.00) (0.00)
CONF -0.017*** -0.021*** -0.022*** -0.029*** -0.038***(0.00) (0.00) (0.01) (0.01) (0.01)
CAP 0.012** 0.006 0.022** 0.028**(0.01) (0.01) (0.01) (0.01)
N 171393 171393 171393 74322 56835 28136χ2 5699.98 5722.44 5709.09 2096.64 2580.28 1421.15P > χ2 0.000 0.000 0.000 0.000 0.000 0.000Pseudo R2 0.151 0.152 0.152 0.143 0.174 0.180
Note: Also controlled for age, race, family size, disability, employment status of father, automobile ownership,wall type, computer ownership, class of father’s work, class of mother’s work, mother’s number of children,and department.Note: * p < 0.05, ** p < 0.01, *** p < 0.001
26
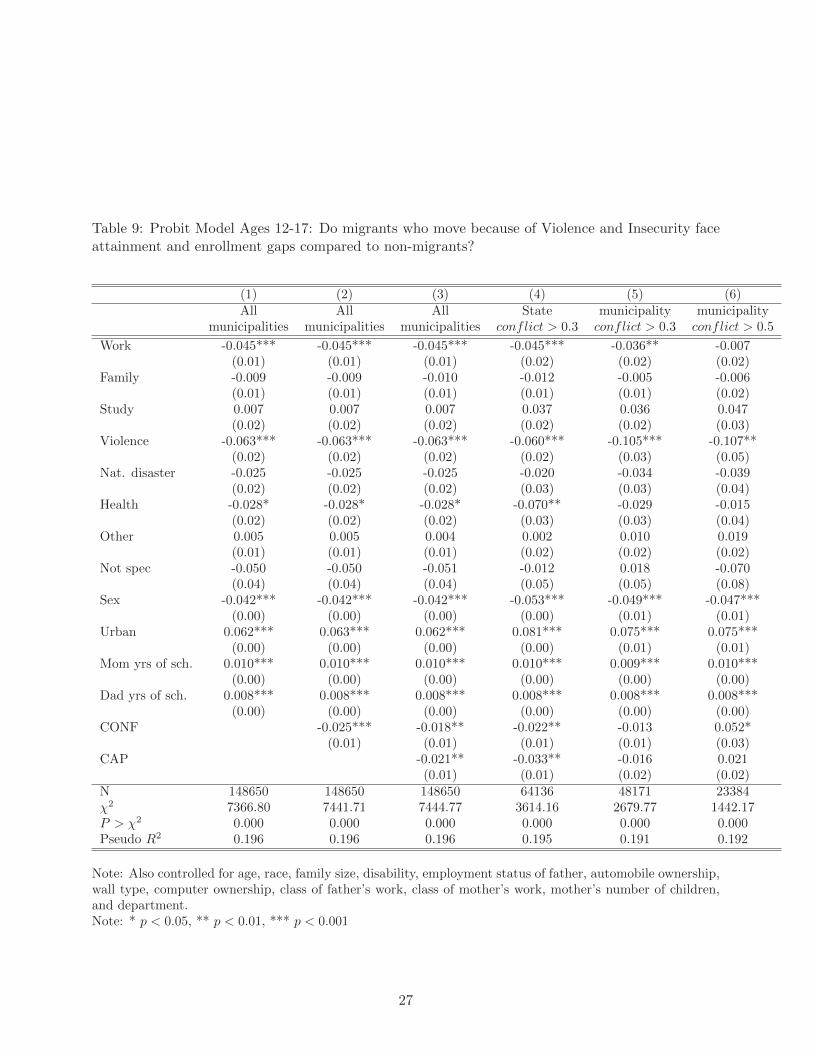
Table 9: Probit Model Ages 12-17: Do migrants who move because of Violence and Insecurity faceattainment and enrollment gaps compared to non-migrants?
(1) (2) (3) (4) (5) (6)All All All State municipality municipality
municipalities municipalities municipalities conflict > 0.3 conflict > 0.3 conflict > 0.5
Work -0.045*** -0.045*** -0.045*** -0.045*** -0.036** -0.007(0.01) (0.01) (0.01) (0.02) (0.02) (0.02)
Family -0.009 -0.009 -0.010 -0.012 -0.005 -0.006(0.01) (0.01) (0.01) (0.01) (0.01) (0.02)
Study 0.007 0.007 0.007 0.037 0.036 0.047(0.02) (0.02) (0.02) (0.02) (0.02) (0.03)
Violence -0.063*** -0.063*** -0.063*** -0.060*** -0.105*** -0.107**(0.02) (0.02) (0.02) (0.02) (0.03) (0.05)
Nat. disaster -0.025 -0.025 -0.025 -0.020 -0.034 -0.039(0.02) (0.02) (0.02) (0.03) (0.03) (0.04)
Health -0.028* -0.028* -0.028* -0.070** -0.029 -0.015(0.02) (0.02) (0.02) (0.03) (0.03) (0.04)
Other 0.005 0.005 0.004 0.002 0.010 0.019(0.01) (0.01) (0.01) (0.02) (0.02) (0.02)
Not spec -0.050 -0.050 -0.051 -0.012 0.018 -0.070(0.04) (0.04) (0.04) (0.05) (0.05) (0.08)
Sex -0.042*** -0.042*** -0.042*** -0.053*** -0.049*** -0.047***(0.00) (0.00) (0.00) (0.00) (0.01) (0.01)
Urban 0.062*** 0.063*** 0.062*** 0.081*** 0.075*** 0.075***(0.00) (0.00) (0.00) (0.00) (0.01) (0.01)
Mom yrs of sch. 0.010*** 0.010*** 0.010*** 0.010*** 0.009*** 0.010***(0.00) (0.00) (0.00) (0.00) (0.00) (0.00)
Dad yrs of sch. 0.008*** 0.008*** 0.008*** 0.008*** 0.008*** 0.008***(0.00) (0.00) (0.00) (0.00) (0.00) (0.00)
CONF -0.025*** -0.018** -0.022** -0.013 0.052*(0.01) (0.01) (0.01) (0.01) (0.03)
CAP -0.021** -0.033** -0.016 0.021(0.01) (0.01) (0.02) (0.02)
N 148650 148650 148650 64136 48171 23384χ2 7366.80 7441.71 7444.77 3614.16 2679.77 1442.17P > χ2 0.000 0.000 0.000 0.000 0.000 0.000Pseudo R2 0.196 0.196 0.196 0.195 0.191 0.192
Note: Also controlled for age, race, family size, disability, employment status of father, automobile ownership,wall type, computer ownership, class of father’s work, class of mother’s work, mother’s number of children,and department.Note: * p < 0.05, ** p < 0.01, *** p < 0.001
27

assets and also be constrained on their expenditure. Yet, they do not have an education enrollment
gap half as large as IDPs. Another possible channel is that being directly affected by conflict may
lead to more members of the family getting maimed or even killed. Family members being disabled
and killed could lead to reallocation of duties within a household and could lead to children being
forced to drop out of school to care for the disabled member or going to work. This would be
especially true if the family member was the household head or care giver. Table 1 shows that IDPs
are more likely to be disabled, which is suggestive evidence in support of the second highlighted
reason for the gap. Another reason beyond the scope of economics could be the psychological impact
on children of being directly affected by conflict. There is research that shows that children who
pass through traumatic experiences have lower education outcomes in general. If one combines this
potential psychological effect with the two earlier highlighted channels and the education disruption
that comes with having to move to another location for exogenous reasons, then the larger gap in
education accumulation and enrollment for children of IDPs compared to non-migrants and everyone
else would be expected.
6.4 Results: Question 3
To answer our third question, we further investigate if lower school attainment for IDPs is linked
with being directly impacted by conflict, living in a high conflict area in the past, or a combination
of both factors. We try to answer this question in several ways. Our hypothesis is that if the issue
is more about simply living in a high conflict regions, then even those who do not migrate but
live in a high conflict area should have similar levels of schooling as the IDPs who left the high-
conflict regions. Hence, if we restrict our sample to only those living in regions with high conflict,
the estimate on the IDP dummy should be 0 or close to 0. We explore three alternative ways of
restricting the sample. Our conflict index runs from 0-1 with a mean of 0.28. In column (4) of
Tables 6-9 we restrict ourself to states with a mean conflict of over 0.3. This analysis leads to a
reduction in the sample of states in the analysis from 33 to 14. We then re-estimate our original
model on this sub-sample. The result of this estimation is summarized in column (4) in Tables 6-9.
Focusing on Table 6 column (4), contrary to what may be expected, we find that children of IDPs
living in high conflict states have a 0.24 years less school attainment than children of non-migrants
who live in high conflict states. However, averaging over the state may be misleading. Restricting
the sample based on high conflict municipalities versus high conflict states may be more informative.
In columns (5) and (6) of Tables 6-9, we restrict the sample to only those living in municipalities
with a conflict index greater than 0.3 and 0.5 respectively. We still find that children of IDPs living
in high conflict areas have a lower school attainment (Tables 6 and 7) and lower school enrollment
28

(Table s8 and 9 ). Specifically, we find that children of IDPs who are 6-11 years living in high conflict
regions have a 0.22 years lower level of school attainment and have a 1.9% lower probability of being
enrolled in school in compared to non-migrants living in high conflict regions. For children of IDPs
12-17, the gap is significantly greater: 0.56 less years of schooling and a 10.3% lower probability of
being enrolled in school.
It is worth noting from Tables 6 and 7 that the gap in education accumulation increases when
we focus on municipality with really intense conflict (index > 0.5). For ages 6-11, the gap increases
to 0.32 years while for ages 12-17, the gap increases to 0.61 years. We note a similar increase in the
probability of not being in school in the intense conflict municipalities (see Tables 8 and 9). We also
note that the conflict variable in the education accumulation model is insignificant when we focus
solely on high conflict areas. This finding suggests that beyond a threshold of conflict, when we
control for capacity and other predictors of schooling, their is no effect of more conflict exposure on
accumulation of schooling. Also, given the change in the education gap is minimal when we focus
on high conflict municipalities who share similar pressure to leave school, then we can infer that
the effect of the potential omitted variable bias linked with pressure to leave school if it exist, is
minimal. We see similar trends in the results from our enrollment model.
These results combined with the results in Table 5 provide evidence that though exposure to
conflict might affect education accumulation and enrollment for children, being directly affected by
conflict impacts these outcomes more significantly. Therefore, living in a region with high conflict
does not lead to the same education impact as being directly affected by conflict. However, it is
possible to argue that the persistence of a gap between IDPs and other non-migrants living in the
same high conflict region region suggests that IDPs living in high conflict regions are different from
other IDPs and although exposure to conflict leads to lower school attainment, being an IDP who
migrates to a high conflict municipality creates an extra impact. In this scenario, there would still
be a gap between IDPs and others living in a high conflict region. In the next section we will address
the question of whether IDPs living in high conflict regions are unique, explaining the education gap
between children of this group and children of non-migrants living in high conflict communities.
6.5 Results Question 4: Could IDPs be different from others living in a conflictregions
The results we use to answer the question on how do IDPs compare to other other migrants in
education accumulation and enrollment are summarized in Tables 10 and 11. Focusing on migrants
could be useful for several reasons. First, it is possible to argue that IDPs are migrants and compar-
ing them with migrants is more appropriate. Notice that in all the earlier tables, children of most
29

migrant groups have lower accumulation and enrollment probabilities than non-migrants. Hence one
could argue that the gap between IDPs children in high conflict regions and non-migrant children
could be linked in part to the selection linked with migration. Though this argument has some
credibility for most migrant groups, IDPs and natural disaster migrants are different because they
move as a result of exogenous factors. For other migrant groups, we can argue that selectivity may
be responsible for the gap between their education accumulation or probability of enrollment in
comparison to non-migrants (see column (3) Table 6-9) because of the endogenous nature of their
choice to migrate. For example, notice that children of migrants who migrated for study do not
exhibit the gap other migrants groups exhibit. Again this is a reflection of the selectivity of these
kind of migrants. On the other hand, migration of IDPs is linked with an exogenous shock just
like those who migrate because of natural diasters. Although it may be safe to assume selectivity is
not an issue for IDPs and migrants linked to disaster, as long as not all who are affected by these
exogenous shocks migrate, we cannot fully rule out issues of selectivity.
Another related argument centered on migrants is that even if IDPs are not a select group like
other kinds of migrants, the problem of migrants is really not about them being a select group
with lower preference for education accumulation, but rather, it is the disruption that comes with
migration. If migration leads to disruption in schooling that has a long lasting effect, then all
migrants including IDPs will exhibit lower levels of educational attainment than non-migrants even
if the municipality being considered is one of high conflict. The problem with this argument is that it
does not hold for all groups of migrants. First, if there was no issue as it relates to selectivity in type
for migrants and the effect of migration was limited to the disruption in schooling argument, then
all migrants subgroups, ceteris paribus, should have similar gaps in enrollment and accumulation
when compared to non-migrants. This is not what we find in Tables 6-9. The gap in accumulation
and enrollment differs significantly across groups. Also, as mentioned above, our results suggest
that in comparison to children of non-migrants, there is no education gap for children whose parents
migrated for schooling reasons. The lack of a gap for this group suggests that the issue with migrants
is not one caused largely by school disruption, but as mentioned earlier, is more of a selectivity issue
with respect to types. If children of migrant groups are disadvantaged with respect to education
accumulation and enrollment apart from those who migrated for school related reasons, then it
would be interesting to find out if a gap would exist if we compare them as a group with children
of IDPs who we have earlier highlighted also as being disadvantaged with respect to education
accumulation and enrollment. This is the motivation for our final question. As highlighted in our
empirical strategy, we focus this analysis first on recent migrants to make it comparable to recent
30

Table 10: Are IDPs different? Ages 6-11
Variable: Education Accumulation Model School Enrollment ModelAll Migrants All obs All Migrants All
Migrants Conf (> 0.3) with Conf (> 0.3 ) Migrants Conf (> 0.3) with Conf (> 0.3 )(1) (2) (3) (4) (5) (6)
IDP -0.042 -0.067 -0.105** -0.010 -0.022** -0.008(0.04) (0.06) (0.04) (0.01) (0.01) (0.01)
Sex -0.101*** -0.131*** -0.166*** -0.010*** -0.012** -0.010***(0.02) (0.03) (0.02) (0.00) (0.01) (0.00)
Conflict 0.011 0.007 -0.023 -0.009 -0.019 -0.032***(0.05) (0.08) (0.04) (0.01) (0.01) (0.01)
Capacity 0.044 0.138 0.286*** 0.002 0.000 0.022**(0.07) (0.10) (0.05) (0.01) (0.02) (0.01)
Urban 0.044** 0.075** 0.009 0.014*** 0.025*** 0.023***(0.02) (0.04) (0.02) (0.00) (0.01) (0.00)
Mom Yrs of sch. 0.037*** 0.036*** 0.049*** 0.004*** 0.004*** 0.007***(0.00) (0.01) (0.00) (0.00) (0.00) (0.00)
Dad Yrs of sch. 0.020*** 0.027*** 0.021*** 0.003*** 0.003*** 0.003***(0.00) (0.00) (0.00) (0.00) (0.00) 0
N 34457 11410 57815 34459 11428 57893F 453.48 170.13 -P > (F ) 0.000 0.000 -R2 0.700 0.684 0.647χ2 1299.79 553.27 2541.03P > (χ2) 0.000 0.000 0.000PseudoR2 0.157 0.144 0.173
Note: Also controlled for age, race, family size, disability, employment status of father, automobile ownership,wall type, computer ownership, class of father’s work, class of mother’s work, mother’s number of children,and department.* p < 0.05, ** p < 0.01, *** p < 0.001Selection implies that we restricting the sample to all IDPs and both migrants and non-migrants leaving inregion with high conflict.
IDPs. However we also compare the recent IDPs to anyone who has migrated over their lifetime.20
Table 10 summarizes the results for children 6-11 years and Table 11 summarizes the results for
children 12-17 years.
In Tables 10 and 11, the results in columns (1) to (3) summarize the results using the education
accumulation model, while the last three columns summarize the results using the probability model.
In columns (1) and (4), we summarize the results using the sample of all migrants while in columns
20We are able to find other migrants apart from the recent migrants over the last five years highlighted in the censusby comparing where in individual lives now to were they were born. If these two municipalities are different, we includethis person in the sample. We then compare IDPs to the groups of all other migrants.
31

(2) and (5) we restrict ourselves to the sub-sample of migrants living in municipalities with conflict
index greater than 0.3. The results provides support for our earlier conclusion about the direct
impact of conflict. We find that even when we compare IDPs to other migrants, who are a select
group with lower education accumulation and enrollment than non-migrants, we still notice a gap for
IDPs both in enrollment and accumulation for older children.21 However, we find that for children
6-11 years, the gap is negative but not significant in all cases but in column (5). However, if we
extend the sample to all migrants-recent or not recent (see Table 17 in the appendix), we notice
a small but statistically significant difference in accumulation and enrollment. In contrast, when
we look at the older kids as in Table 11, the education gap is larger and statistically significant.
The education accumulation gap for IDPs when compared to other migrants is about 0.35 years
which is about 0.15 years less than the gap with non-migrants. With respect to enrollment, the
gap is also less than if IDPs are compared with non-migrants but not by much. Children of IDPs
are approximately 4.1% less likely to be enrolled in school when compared to other migrants, while
6.3% less likely if compared to non-migrants.The results from the analysis focused solely on migrants
suggests that the education gap of children of IDPs is not a gap linked with being a migrant given
the persistence of a gap when migrants are the sole focus of the analysis. Second, given that the gap
between IDPs and migrants in most cases is smaller than the gap when IDPs are compared with non-
migrants, suggest that there might be some selection bias with respect to education accumulation
and enrollment when we focus on migrants.
To address any potential selectivity bias that may arise in Table 6-9 column (4)-(6) when we
compare IDPs to non-migrants living in high conflict areas, we restrict our migrants to those living
in conflict areas and compare them to those directly affected by conflict. Given that both groups
migrated to high conflict region, the original argument with respect to selectivity cannot be made.
The results in Tables 10 and 11 columns (2) and (5) suggest that for children 6-11 years, there is
no difference in educational accumulation between those whose who are directly affected by conflict
and those who are exposed to conflict. However those who are directly affected by conflict have
a 2.2% less probability of being enrolled in school. When we consider children 12-17, the results
are more consistent across both our accumulation and enrollment models. We find that children of
IDPs have about 0.4 less years of schooling and are 8.8% less likely to be enrolled in school. This
significant gap could suggest one of two things. First, living in a conflict region is only marginally
important for education accumulation and enrollment, as noted in Table 5 and confirmed here.
21This gap is not created by children of migrants who move for study and are likely to have higher educationoutcomes than other migrants. To verify this we drop these children from our analysis but our estimated gap is notstatistically different with or without them.
32
What is important is being directly affected by conflict especially at the secondary level. Second,
given that children of migrants living in high conflict areas still have better education outcomes
than IDPs, the channel that leads to lower school accumulation and enrollment in IDPs cannot be
explained largely by migration or disruption in schools because of living in a conflict area. Rather,
loss of income of parents, lower probability of employment of parents or care givers who become
disabled because of conflict, and psychological factors linked with being directly affected by conflict
are more likely explanations for this gap.
In columns (3) and (6) of Tables 10 and 11, we compare all IDPs with those who live in high
conflict regions. This is another robustness check to avoid the possible argument that when we
compared IDPS in conflict regions with others in those regions, we might be dealing with a select
type of IDP. This is because we will be focusing on IDPs who are supposed to have migrated for the
sole reason to avoid conflict but still end up in a place with high conflict. This may suggest that
such IDPs are highly vulnerable, have no other options and are different from other IDPs who do
not migrate to a high conflict region. By comparing all IDPS whether or not they live in conflict
regions with migrants and non-migrants who live in conflict region, we avoid this potential issue.
The results in columns (3) and (6) suggest that children of IDPs ages 6-11 have about 0.1 year
less schooling than other children living in a high conflict region but similar probability of being
enrolled in school. For children of IDPs ages 12-17, they have 0.44 fewer years of schooling than
children of everyone else living in a high conflict region. They also have a 5.7% lower probability of
being enrolled. Given that the education gap shrunk when we compare all children of IDPs to other
children living in high conflict regions, this suggests that IDPs living in a high conflict region are to
some extent different from the average IDP.
6.6 Robustness checks: Are the results driven by sampling bias
All the analysis above suggests that being directly affected by conflict affects children’s probability
of being enrolled in school at both the elementary level and secondary level. It also affects their edu-
cational accumulation. However, the effect on younger children is smaller and not always significant.
On the other hand, the gaps for older children are consistently significant and of higher magnitude.
Although we find that some migrants on average have lower levels of educational accumulation and
those who live in a high conflict region in general have slightly lower education accumulation and
enrollment than those who do not live in such municipalities, the gap does not compare to that faced
by IDPs. Despite the analysis above, it is possible to raise the question of whether this persisting
gap in education attainment and enrollment for IDPs is driven by some omitted variable that is
correlated with being directly affected by conflict. We are of the opinion that it is not for several
33
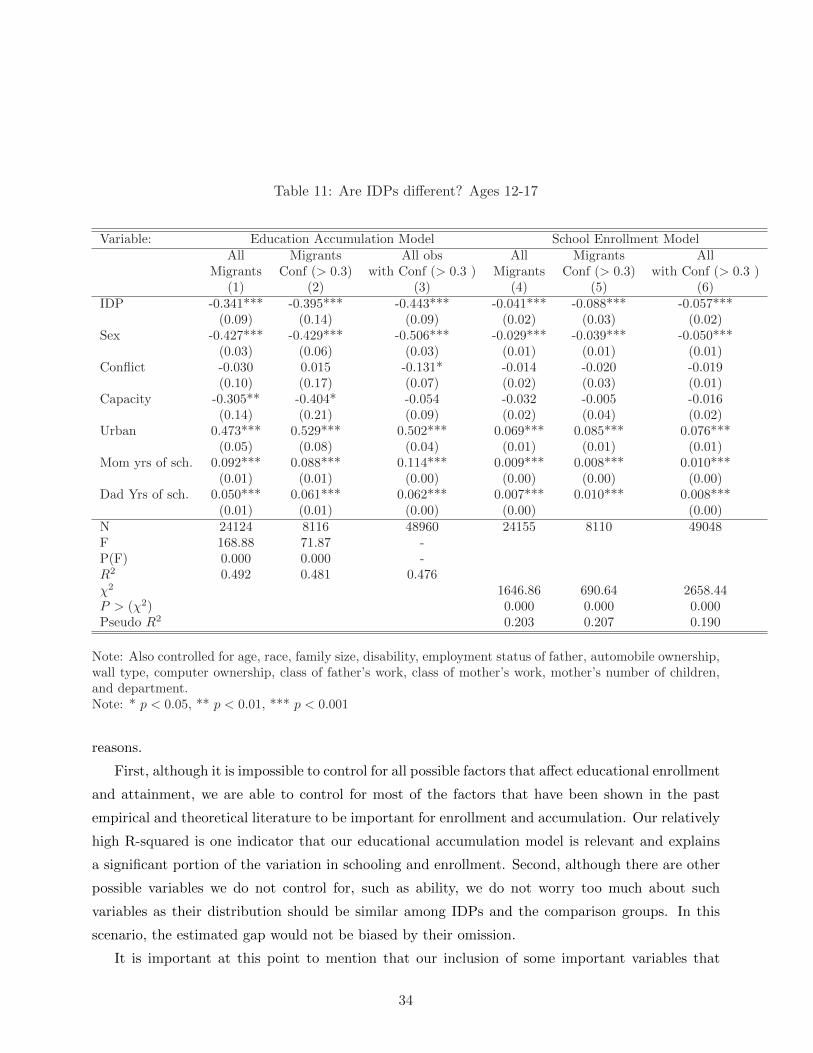
Table 11: Are IDPs different? Ages 12-17
Variable: Education Accumulation Model School Enrollment ModelAll Migrants All obs All Migrants All
Migrants Conf (> 0.3) with Conf (> 0.3 ) Migrants Conf (> 0.3) with Conf (> 0.3 )(1) (2) (3) (4) (5) (6)
IDP -0.341*** -0.395*** -0.443*** -0.041*** -0.088*** -0.057***(0.09) (0.14) (0.09) (0.02) (0.03) (0.02)
Sex -0.427*** -0.429*** -0.506*** -0.029*** -0.039*** -0.050***(0.03) (0.06) (0.03) (0.01) (0.01) (0.01)
Conflict -0.030 0.015 -0.131* -0.014 -0.020 -0.019(0.10) (0.17) (0.07) (0.02) (0.03) (0.01)
Capacity -0.305** -0.404* -0.054 -0.032 -0.005 -0.016(0.14) (0.21) (0.09) (0.02) (0.04) (0.02)
Urban 0.473*** 0.529*** 0.502*** 0.069*** 0.085*** 0.076***(0.05) (0.08) (0.04) (0.01) (0.01) (0.01)
Mom yrs of sch. 0.092*** 0.088*** 0.114*** 0.009*** 0.008*** 0.010***(0.01) (0.01) (0.00) (0.00) (0.00) (0.00)
Dad Yrs of sch. 0.050*** 0.061*** 0.062*** 0.007*** 0.010*** 0.008***(0.01) (0.01) (0.00) (0.00) (0.00)
N 24124 8116 48960 24155 8110 49048F 168.88 71.87 -P(F) 0.000 0.000 -R2 0.492 0.481 0.476χ2 1646.86 690.64 2658.44P > (χ2) 0.000 0.000 0.000Pseudo R2 0.203 0.207 0.190
Note: Also controlled for age, race, family size, disability, employment status of father, automobile ownership,wall type, computer ownership, class of father’s work, class of mother’s work, mother’s number of children,and department.Note: * p < 0.05, ** p < 0.01, *** p < 0.001
reasons.
First, although it is impossible to control for all possible factors that affect educational enrollment
and attainment, we are able to control for most of the factors that have been shown in the past
empirical and theoretical literature to be important for enrollment and accumulation. Our relatively
high R-squared is one indicator that our educational accumulation model is relevant and explains
a significant portion of the variation in schooling and enrollment. Second, although there are other
possible variables we do not control for, such as ability, we do not worry too much about such
variables as their distribution should be similar among IDPs and the comparison groups. In this
scenario, the estimated gap would not be biased by their omission.
It is important at this point to mention that our inclusion of some important variables that
34

Table 12: Who are we capturing?
Age Total With Both Parents Percentage6-11 261,469 180,912 69.19%12-17 250,349 158,347 63.25%
predict enrollment and accumulation creates secondary effects. We control for parents education,
and not every child in our sample has this information. Our inclusion of parent education variables
in all the above analysis implies that our above analysis was not conducted on our whole sample
of children ages 6-17. Table 12 provides a breakdown and highlights what percentage in each age
range falls into the sample that we used in our above analysis. Among children 6-11 years, we use
only about 70% of the sample. For children 12-17 years, we use only about 63% of the sample. This
raises the question of whether an analysis on the whole sample would lead to a different outcome.
To investigate this possibility, we first estimate the bias created in our estimate of the gap if we do
not include all the parent related variables. To find this bias we re-estimate both our accumulation
and enrollment models with and without the parental related variables ,including both migrants and
non-migrants and restricting our sample to those who have parent information. The results from
this analysis are summarized in Tables 13 and 14. Notice that the results in columns (1) and (4) are
a repetition of earlier analysis and the results in column (2) and (5) are the estimated coefficients
if parental controls are not included for the same sample. The upward bias in the estimates is
significant if we do not include parental controls. Specifically for children 6-11, without parental
controls we overestimate the impact of direct contact with violence on school accumulation by 0.071
and overestimate the probability of enrollment gap for those affected by violence by 0.013.
For children 12-17, if we do not include parental controls, we overestimate the direct impact of
contact with violence on school accumulation by 0.177 years and overestimate the probability of
enrollment gap for those affected by violence by 0.022. Given our knowledge on the potential bias
caused by not including parental controls, we re-estimate equation (2) without parental controls on
the whole sample. This means that the observations that were not included previously because of
missing information about parental controls are now included in the analysis. These estimates on the
whole sample using both the education accumulation enrollment models are summarized in Table
15 columns (1), (3), (5) and (7). Notice that for the children 6-11 years old, these estimates are very
similar to the estimates we got for the sample that have parental control when such controls were
dropped and the gap estimated. For the secondary aged children the difference is slightly larger.
In columns (2), (4), (6) and (8), we present the corrected estimate of the education accumulation
35
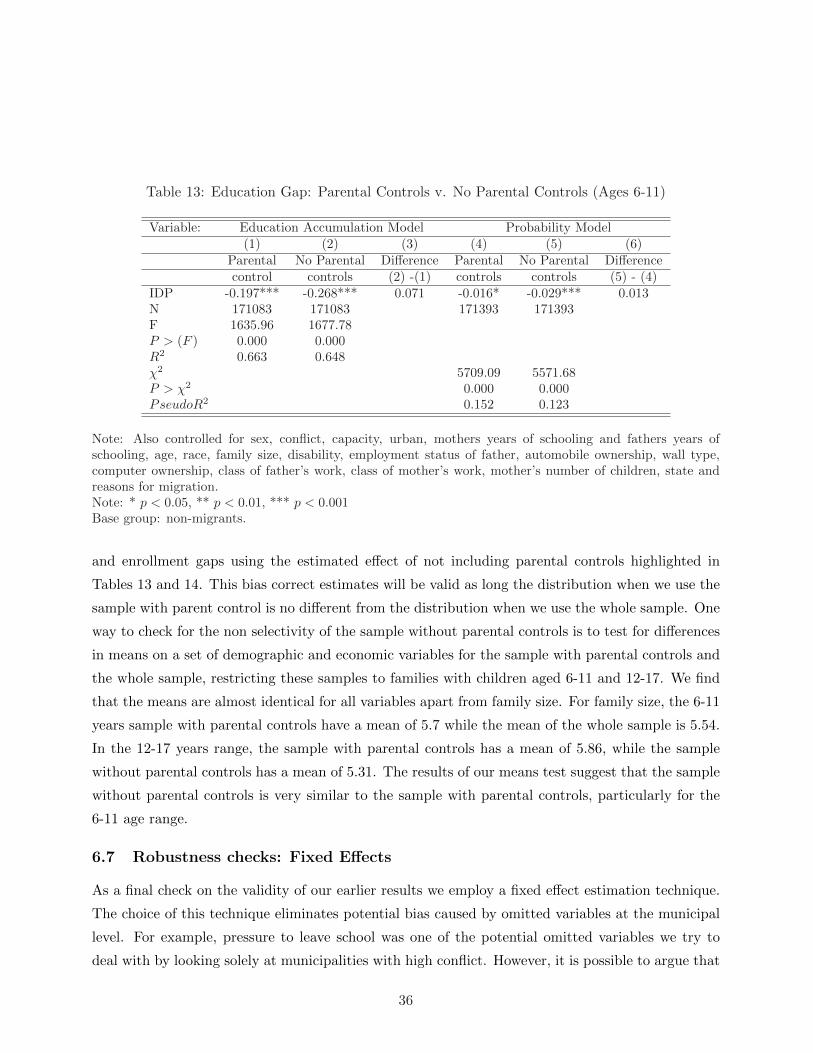
Table 13: Education Gap: Parental Controls v. No Parental Controls (Ages 6-11)
Variable: Education Accumulation Model Probability Model(1) (2) (3) (4) (5) (6)
Parental No Parental Difference Parental No Parental Differencecontrol controls (2) -(1) controls controls (5) - (4)
IDP -0.197*** -0.268*** 0.071 -0.016* -0.029*** 0.013N 171083 171083 171393 171393F 1635.96 1677.78P > (F ) 0.000 0.000R2 0.663 0.648χ2 5709.09 5571.68P > χ2 0.000 0.000PseudoR2 0.152 0.123
Note: Also controlled for sex, conflict, capacity, urban, mothers years of schooling and fathers years ofschooling, age, race, family size, disability, employment status of father, automobile ownership, wall type,computer ownership, class of father’s work, class of mother’s work, mother’s number of children, state andreasons for migration.Note: * p < 0.05, ** p < 0.01, *** p < 0.001Base group: non-migrants.
and enrollment gaps using the estimated effect of not including parental controls highlighted in
Tables 13 and 14. This bias correct estimates will be valid as long the distribution when we use the
sample with parent control is no different from the distribution when we use the whole sample. One
way to check for the non selectivity of the sample without parental controls is to test for differences
in means on a set of demographic and economic variables for the sample with parental controls and
the whole sample, restricting these samples to families with children aged 6-11 and 12-17. We find
that the means are almost identical for all variables apart from family size. For family size, the 6-11
years sample with parental controls have a mean of 5.7 while the mean of the whole sample is 5.54.
In the 12-17 years range, the sample with parental controls has a mean of 5.86, while the sample
without parental controls has a mean of 5.31. The results of our means test suggest that the sample
without parental controls is very similar to the sample with parental controls, particularly for the
6-11 age range.
6.7 Robustness checks: Fixed Effects
As a final check on the validity of our earlier results we employ a fixed effect estimation technique.
The choice of this technique eliminates potential bias caused by omitted variables at the municipal
level. For example, pressure to leave school was one of the potential omitted variables we try to
deal with by looking solely at municipalities with high conflict. However, it is possible to argue that
36
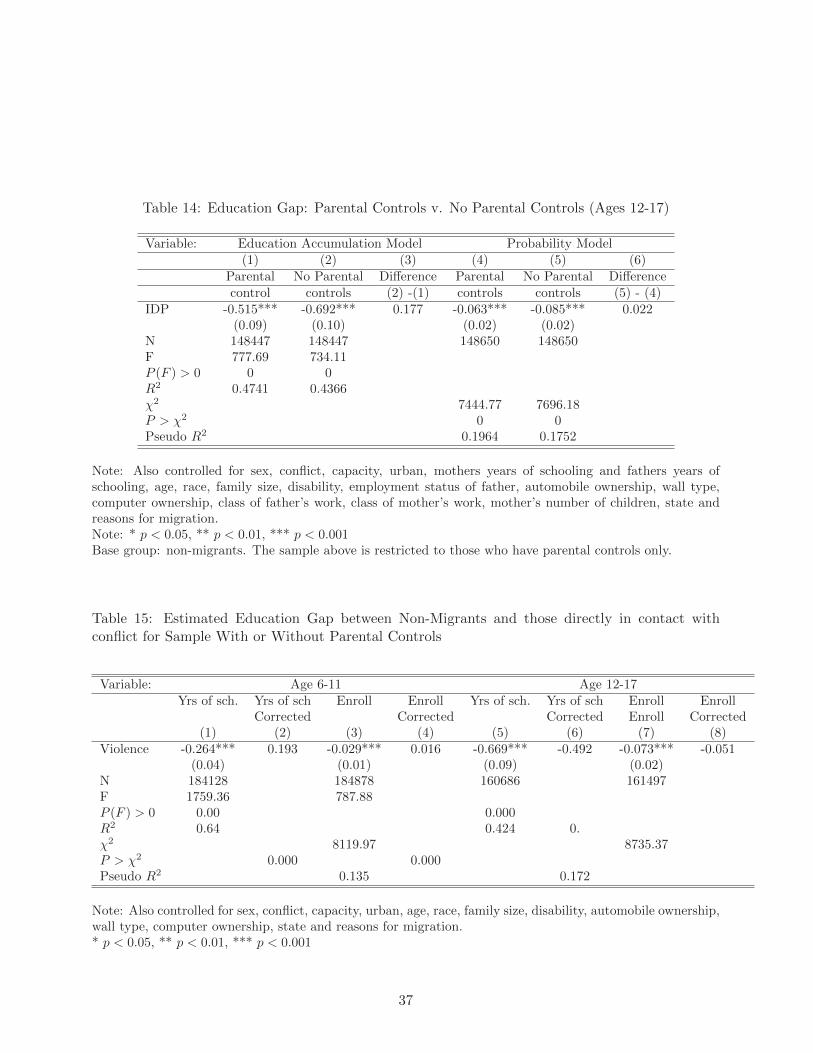
Table 14: Education Gap: Parental Controls v. No Parental Controls (Ages 12-17)
Variable: Education Accumulation Model Probability Model(1) (2) (3) (4) (5) (6)
Parental No Parental Difference Parental No Parental Differencecontrol controls (2) -(1) controls controls (5) - (4)
IDP -0.515*** -0.692*** 0.177 -0.063*** -0.085*** 0.022(0.09) (0.10) (0.02) (0.02)
N 148447 148447 148650 148650F 777.69 734.11P (F ) > 0 0 0R2 0.4741 0.4366χ2 7444.77 7696.18P > χ2 0 0Pseudo R2 0.1964 0.1752
Note: Also controlled for sex, conflict, capacity, urban, mothers years of schooling and fathers years ofschooling, age, race, family size, disability, employment status of father, automobile ownership, wall type,computer ownership, class of father’s work, class of mother’s work, mother’s number of children, state andreasons for migration.Note: * p < 0.05, ** p < 0.01, *** p < 0.001Base group: non-migrants. The sample above is restricted to those who have parental controls only.
Table 15: Estimated Education Gap between Non-Migrants and those directly in contact withconflict for Sample With or Without Parental Controls
Variable: Age 6-11 Age 12-17Yrs of sch. Yrs of sch Enroll Enroll Yrs of sch. Yrs of sch Enroll Enroll
Corrected Corrected Corrected Enroll Corrected(1) (2) (3) (4) (5) (6) (7) (8)
Violence -0.264*** 0.193 -0.029*** 0.016 -0.669*** -0.492 -0.073*** -0.051(0.04) (0.01) (0.09) (0.02)
N 184128 184878 160686 161497F 1759.36 787.88P (F ) > 0 0.00 0.000R2 0.64 0.424 0.χ2 8119.97 8735.37P > χ2 0.000 0.000Pseudo R2 0.135 0.172
Note: Also controlled for sex, conflict, capacity, urban, age, race, family size, disability, automobile ownership,wall type, computer ownership, state and reasons for migration.* p < 0.05, ** p < 0.01, *** p < 0.001
37
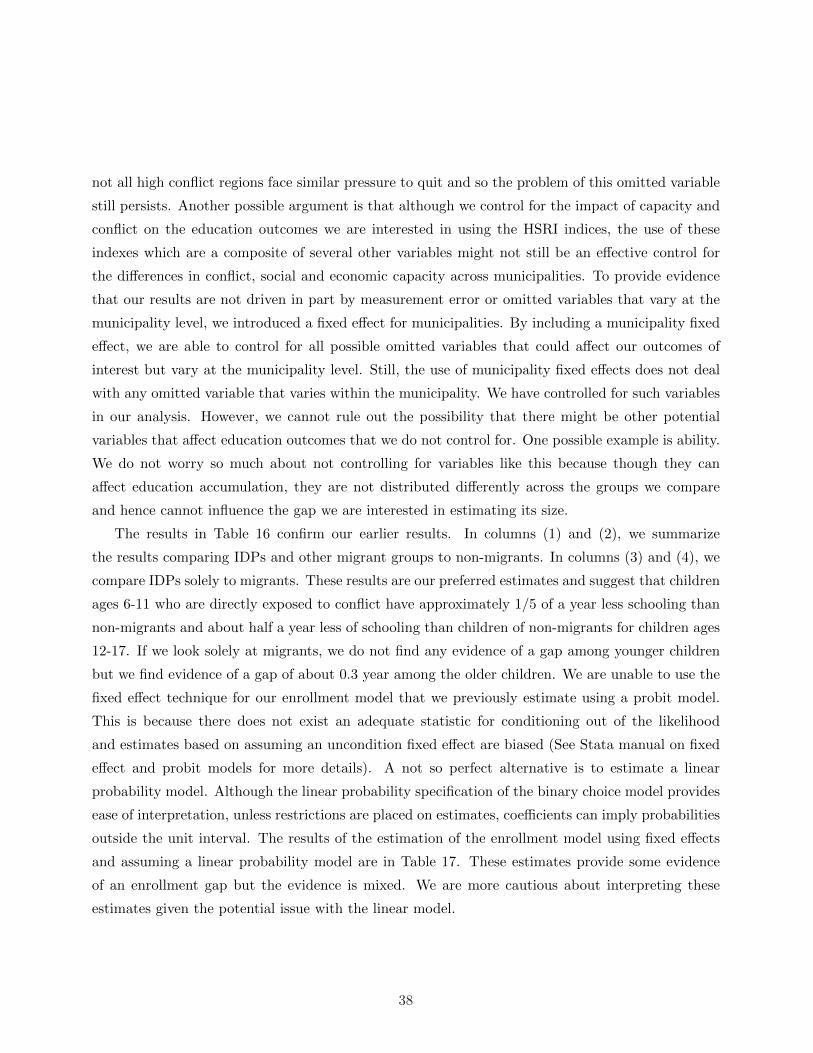
not all high conflict regions face similar pressure to quit and so the problem of this omitted variable
still persists. Another possible argument is that although we control for the impact of capacity and
conflict on the education outcomes we are interested in using the HSRI indices, the use of these
indexes which are a composite of several other variables might not still be an effective control for
the differences in conflict, social and economic capacity across municipalities. To provide evidence
that our results are not driven in part by measurement error or omitted variables that vary at the
municipality level, we introduced a fixed effect for municipalities. By including a municipality fixed
effect, we are able to control for all possible omitted variables that could affect our outcomes of
interest but vary at the municipality level. Still, the use of municipality fixed effects does not deal
with any omitted variable that varies within the municipality. We have controlled for such variables
in our analysis. However, we cannot rule out the possibility that there might be other potential
variables that affect education outcomes that we do not control for. One possible example is ability.
We do not worry so much about not controlling for variables like this because though they can
affect education accumulation, they are not distributed differently across the groups we compare
and hence cannot influence the gap we are interested in estimating its size.
The results in Table 16 confirm our earlier results. In columns (1) and (2), we summarize
the results comparing IDPs and other migrant groups to non-migrants. In columns (3) and (4), we
compare IDPs solely to migrants. These results are our preferred estimates and suggest that children
ages 6-11 who are directly exposed to conflict have approximately 1/5 of a year less schooling than
non-migrants and about half a year less of schooling than children of non-migrants for children ages
12-17. If we look solely at migrants, we do not find any evidence of a gap among younger children
but we find evidence of a gap of about 0.3 year among the older children. We are unable to use the
fixed effect technique for our enrollment model that we previously estimate using a probit model.
This is because there does not exist an adequate statistic for conditioning out of the likelihood
and estimates based on assuming an uncondition fixed effect are biased (See Stata manual on fixed
effect and probit models for more details). A not so perfect alternative is to estimate a linear
probability model. Although the linear probability specification of the binary choice model provides
ease of interpretation, unless restrictions are placed on estimates, coefficients can imply probabilities
outside the unit interval. The results of the estimation of the enrollment model using fixed effects
and assuming a linear probability model are in Table 17. These estimates provide some evidence
of an enrollment gap but the evidence is mixed. We are more cautious about interpreting these
estimates given the potential issue with the linear model.
38

Table 16: Does being directly affected by conflict create an education gap (Fixed Effects )?
Variable: IDP versus (migrants and non-migrants) IDP versus other migrants
6-11 year old 12- 17 year old 6-11 year old 12- 17 year old(1) (2) (3) (4)
Violence -0.199*** -0.487*** -0.035 -0.277***(0.02) (0.05) (0.02) (0.05)
Sex -0.163*** -0.588*** -0.133*** -0.509***(0.01) (0.01) (0.01) (0.02)
urban 0.048*** 0.442*** 0.036** 0.385***(0.01) (0.01) (0.01) (0.03)
Mother Yrs sch. 0.054*** 0.134*** 0.048*** 0.121***(0.00) (0.00) (0.00) (0.00)
Father Yrs sch. 0.026*** 0.073*** 0.020*** 0.064***(0.00) (0.00) (0.00) (0.00)
N 171083 148447 34457 24124F 777.69 752.89P (F ) > 0 0.000 0.000 0.000 0.000R2 0.620 0.430 0.650 0.450χ2
P > χ2
Pseudo R2
Note: Also controlled for age, race, family size, disability, employment status of father, automobileownership, wall type, computer ownership, class of father’s work, class of mother’s work, mother’snumber of children. In column (1) and (2) we control for migration status so dummies for othertypes of migrants are estimated but not presented. The base group is non-migrants. In column (3)and (4) we have a binary indicator IDP = 1 and Other migrants = 0Note: * p < 0.05, ** p < 0.01, *** p < 0.001
7 Summary and Conclusion
In this paper we try to answer four questions related to the impact of conflict. We are motivated
by the fact that most past research has looked at exposure to conflict and its potential effects on
education accumulation and enrollment. However, we are of the opinion that looking directly at
those who are affected by conflict should provide us with a better sense of the impact of conflict.
Our first question is focused on whether there is an education enrollment and accumulation gap for
children of those who live in municipalities with high conflict in comparison to others. Next, we
address the question of whether there is an education accumulation and enrollment gap for children
of those directly affected by conflict? Third, we investigate if living in a municipality with high
39

Table 17: Does being directly affected by conflict create an enrollment gap-Estimates using a Linearprobability model with Fixed Effects?
Variable: Migrants and Non Migrants Migrants
6-11 year old 12- 17 year old 6-11 year old 12- 17 year old(1) (2) (3) (4)
Violence -0.009 -0.026*** -0.010* -0.014(0.01) (0.01) (0.01) (0.01)
sex -0.013*** -0.058*** -0.012*** -0.050***(0.00) (0.00) (0.00) (0.00)
urban 0.037*** 0.087*** 0.040*** 0.104***(0.00) (0.00) (0.00) (0.01)
Mother Yrs sch. 0.007*** 0.011*** 0.007*** 0.011***(0.00) (0.00) (0.00) (0.00)
Father Yrs sch. 0.003*** 0.007*** 0.003*** 0.007***(0.00) (0.00) (0.00) (0.00)
N 171393 148650 34510 24158F 284.82 530.42 63.28 97.43P (F ) > 0 0.000 0.000 0.000 0.000R2 0.099 0.172 0.916 0.169Pseudo R2
Note: Also controlled for age, race, family size, disability, employment status of father, automobileownership, wall type, computer ownership, class of father’s work, class of mother’s work, mother’snumber of children.In column (1) and (2) we control for migration status so dummies for other types of migrants areestimated but not presented. The base group is non-migrants. In column (3) and (4) we have abinary indicator IDP = 1 and Other migrants = 0Note: * p < 0.05, ** p < 0.01, *** p < 0.001
conflict creates similar education accumulation and enrollment gaps as being directly affected by
conflict. Finally, we consider how IDPs compare to other migrants in education accumulation and
enrollment.
Using OLS and probit analysis to estimate our accumulation and enrollment models respectively,
first we find that though there appears to be a gap in enrollment and accumulation for children of
those who live in municipalities with high conflict in comparison to others, this gap does not appear
to be robust. Next, we find evidence of an education accumulation and enrollment gaps for children
of those who have been directly affected by conflict in comparison to non-migrants. We also find
that living in a high conflict area does not create an identical effect as being directly affected by
conflict. Education enrollment and accumulation gaps exist between IDPs and others who live in
40
such regions. Moreover, in comparison to the education gap between IDPs and non-migrants in
general, the gap between IDPS and non-migrants living in a high conflict areas is larger. Similarly,
the gap between IDPs and other migrants living in a high conflict area is larger than the gap between
IDPs and all migrants. Finally, our results suggest that in general, the children of IDPs fare worse
than other migrants with respect to education accumulation and enrollment. This result is robust
to dropping education migrants from the dataset. However if we restrict our sample to migrants in
high conflict regions, we find mixed evidence for an accumulation and enrollment gap for elementary
school students but strong evidence of a gap at the secondary school level. We provide evidence that
this gap is not linked to some form of selectivity of IDPs who end up in high conflict area. Children
of IDPs in general exhibit this gap, especially at the secondary level. We test the robustness of
our results using fixed effects and although the estimates differ slightly, the basic inference of a
significant impact of being directly affected by conflict persists, particularly at the secondary level.
Several suggestions can be drawn from these results. First, having a parent who was directly
affected by conflict negatively affects a child’s education accumulation and enrollment. This gap
grows as the child grows older. In contrast, mere exposure to conflict as captured by living in an
area with high conflict does not seem to have as much impact on a child’s education accumulation
and enrollment. Given the large literature that estimates the impact of conflict using exposure,
our results suggest the need to isolate those directly affected by conflict and collect more data on
their specific experiences. This kind of data would be useful in helping to create a framework for
better understanding the channels through which being directly affected by conflict affects education
and other labor market outcomes. Finally, although the above suggestions are relevant for studies
looking at conflict of the type similar to that of Colombia, it is possible that if we looked at a
different kind of conflict like a high-intensity civil war, exposure on its own might be as important
as being directly affected.
41
References
[1] 2009 Global Trends: Refugees, Asylum-seekers, Returnees, Internally Displaced and Stateless
Persons. (2010). United Nations High Commissioner for Refugees. Retrieved August 18th 2011
http://www.unhcr.org/4c11f0be9.pdf
[2] Akresh, Richard and Damien de Walque (2008). Armed Conflict and Schooling: Evidence from
the 1994 Rwandan Genocide. The World Bank, Policy Research Working Paper Series: 4606.
[3] Angrist, Joshua, Eric Bettinger, and Michael Kremer (2006). Long-Term Consequences of Sec-
ondary School Vouchers: Evidence from Administrative Records in Colombia. The American
Economic Review, 96(3), 847-862.
[4] Angrist, Joshua, Eric Bettinger, Erik Bloom, Elizabeth King, and Michael Kremer (2002).
Vouchers for Private Schooling in Colombia: Evidence from a Randomized Natural Experiment.
The American Economic Review, 92(5): 1535-1558.
[5] Barrera-Osorio, Felipe, and Ana Maria Ibanez (2004). Does Violence Reduce Investment in
Education?: A Theortetical and Empirical Approach. Documentos CEDE 002382, Universidad
de los Andes-CEDE.
[6] Chamarbagwala, Rubiana, and Hilc’as E. Moran (2011). The human capital consequences of
civil war: Evidence from Guatemala. Journal of Development Economics, 94(1): 41-61.
[7] Duenas, Lusia Fernanda and Fabio Sanchez (2007). Does Armed Conflict Affect the Poorest?:
The Case of School Dropout in Eastern Colombia. Working Paper, Universidad de los Andes.
[8] Duryea, Suzanne, David Lam, and Deborah Levison (2001). Effects of Economic Shocks on
Children’s Employment and Schooling in Brazil. Journal of Development Economics, 84(1):pp
188-214.
[9] Evans, David K., and Edward Miguel (2007). Orphans and Schooling in Africa: A Longitudinal
Analysis. Demography, 44(1): 35-57.
[10] Glewwe, Paul, and Hanan Jacoby (1994). Student Achievement and Schooling Choice in Low-
Income Countries: Evidence from Ghana. The Journal of Human Resources, 29(3): 843-864.
[11] Gaston, Noel, and Jaime Tenjo (1992). Education Attainment and Earnings Determination in
Colombia. Economic Development and Cultural Change, 41:pp 125-139.
42
[12] Ibanez, Ana Maria, and Andres Moya (2006). Como el Desplazamiento Forzado Deteriora el Bi-
enestar de los Hogares Desplazados?: Analisis y Determinantes del Bienestar en los Municipios
de Recepcion. Documento CEDE No. 2006-26. Universidad de los Andes.
[13] Ibanez, Ana Maria, and Andres Moya (2009). Vulnerability of Victims of Civil Conflicts: Em-
pirical Evidence for the Displaced Population in Colombia.World Development, 38(4): 647-663.
[14] Jacoby, Hanan G., and Emmanuel Skoufias (1997). Risk, Financial Markets, and Human Capital
in a Developing Country. Review of Economic Studies, 64(3): 311-335.
[15] Kirchhoff, Stefanie, and Ana Maria Ibanez (2002). Displacement due to Violence in Colombia:
Determinates and Consequences at the Household Level. Discussion Papers 18754, University
of Bonn, Center for Development Research (ZEF).
[16] Lozano-Gracia, Nancy, and Gianfranco Piras, Ana Maria Ibanez, and Geoffrey J.D. Hewings
(2010). The Journey to Safety: Conflict-Driven Migration Flows in Colombia. International
Regional Science Review, 33(2): 157-180.
[17] McKenzie, David, and Hillel Rapoport (2010). Can Migration Reduce Educational Attainment?
Evidence from Mexico. Journal of Population Economics, 24(4): 1331-1358.
[18] Poveda, Alexander Cotte, and Jin Anthony Cotrino Sossa (2006). Crecimiento Econ—mico
y Distribuci—n del Ingreso en Colombia: Evidencia Sobre el Capital Humano y el Nivel de
Educaci—n. Serie de Documentos en Economia y Violencia 002221, Centro de Investigaciones
en Violencia, Instituciones y Desarrollo Economico (VIDE).
[19] Psacharopoulos, George & Velez, Eduardo, (1992). Schooling, Ability, and Earnings in Colom-
bia, 1988, Economic Development and Cultural Change, University of Chicago Press, vol. 40(3),
pages 629-43, April.
[20] Psacharopoulos, George & Eduardo Velez (1993). Educational Quality and Labor Market Out-
comes: Evidence from Bogota, Colombia. Sociology of Education, 66(2): 130-145.
[21] Psacharopoulos, George. (1994). Returns to Investment in Education: A Global Update. World
Development 22(9): 1325-43.
[22] Rodriguez, Catherine and Fabio Sanchez (2009). Armed Conflict Exposure, Human Capital
Investments and Child Labor: Evidence from Colombia. HiCN Working Papers, 68.
43

[23] Staiger, D. and Stock, J., (1997). Instrumental Variable Regression with Weak Instruments.
Econometrica 65:557-586.
[24] Shemyakina, Olga (2011). The Effect of Armed Conflict on Accumulation of Schooling: Results
from Tajikistan. Journal of Development Economics, 95(2): 186-200.
[25] Thomas, Duncan, Kathleen Beegle, Elizabeth Frankenberg, Bondan Sikoki, John Strauss and
Graciela Teruel (2004). Education in a Crisis. Journal of Development Economics, 74 (1):53-85.
2004.
44

Appendix
Table 18: Are IDPs different? Ages 6-11
Variable: Education Accumulation Model School Enrollment ModelAll Migrants All obs All Migrants All
Migrants Conf (> 0.3) with Conf (> 0.3 ) Migrants Conf (> 0.3) with Conf (> 0.3 )(1) (2) (3) (4) (5) (6)
IDP -0.095** -0.084 -0.105** -0.014* -0.024** -0.008(0.04) (0.06) (0.04) (0.01) (0.01) (0.01)
Sex -0.105*** -0.145*** -0.166*** -0.009*** -0.008* -0.010***(0.01) (0.03) (0.02) (0.00) (0.00) (0.00)
Conflict -0.048 0.084 -0.023 -0.006 -0.001 -0.032***(0.04) (0.06) (0.04) (0.01) (0.01) (0.01)
Capacity 0.144*** 0.252*** 0.286*** 0.002 0.002 0.022**(0.05) (0.08) (0.05) (0.01) (0.01) (0.01)
Urban -0.020 -0.016 0.009 0.009*** 0.014*** 0.023***(0.02) (0.03) (0.02) (0.00) (0.00) (0.00)
Mom yrs of sch. 0.041*** 0.039*** 0.049*** 0.004*** 0.005*** 0.007***(0.00) (0.00) (0.00) (0.00) (0.00) (0.00)
Dad yrs of sch. 0.018*** 0.027*** 0.021*** 0.003*** 0.003*** 0.003***(0.00) (0.00) (0.00) (0.00) (0.00) (0.00)
N 59811 18975 57815 59809 19000 57893F 712.62 252.27P (F ) > 0 0.000 0.000R2 0.692 0.6743 0.6469χ2 1628.8 737.16 2541.03P > χ2 0.000 0.000 0.000Pseudo R2 0.143 0.136 0.173
Note: Also controlled for age, race, family size, disability, employment status of father, automobile ownership,wall type, computer ownership, class of father’s work, class of mother’s work, mother’s number of children,and department.Note: * p < 0.05, ** p < 0.01, *** p < 0.001Note: Selection implies restricting the sample to subgroup which contains all IDPs and migrants leaving inregion with high conflict.
45
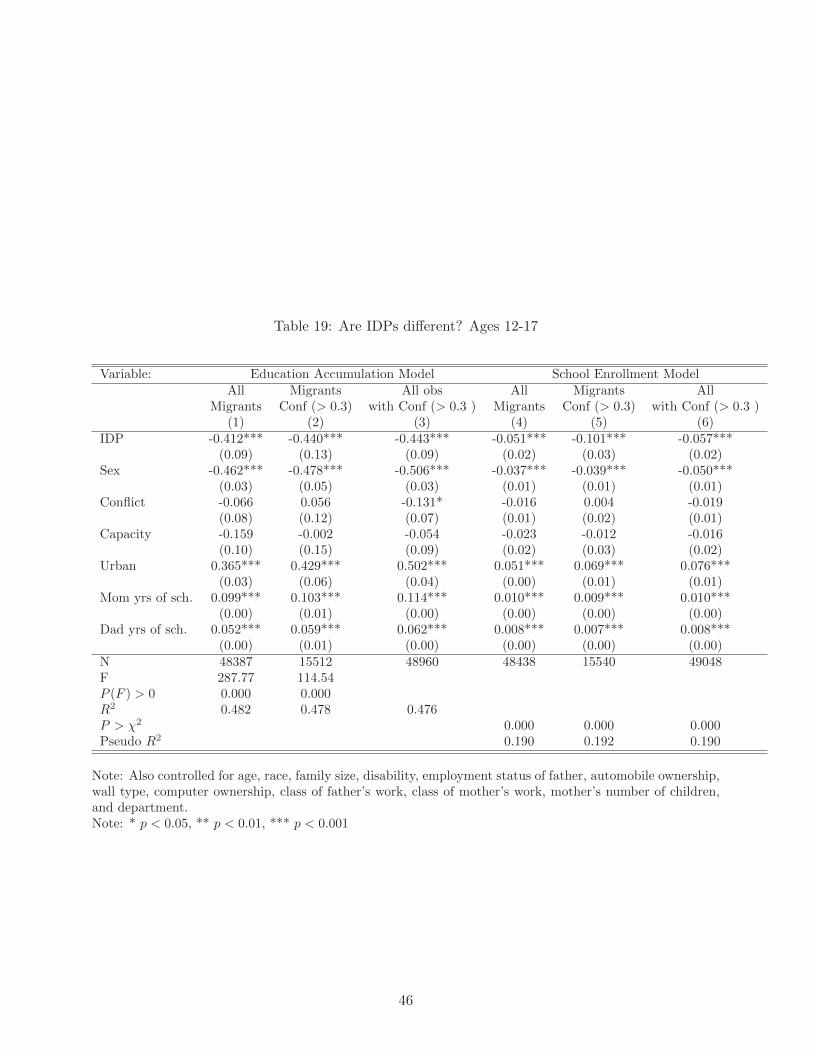
Table 19: Are IDPs different? Ages 12-17
Variable: Education Accumulation Model School Enrollment ModelAll Migrants All obs All Migrants All
Migrants Conf (> 0.3) with Conf (> 0.3 ) Migrants Conf (> 0.3) with Conf (> 0.3 )(1) (2) (3) (4) (5) (6)
IDP -0.412*** -0.440*** -0.443*** -0.051*** -0.101*** -0.057***(0.09) (0.13) (0.09) (0.02) (0.03) (0.02)
Sex -0.462*** -0.478*** -0.506*** -0.037*** -0.039*** -0.050***(0.03) (0.05) (0.03) (0.01) (0.01) (0.01)
Conflict -0.066 0.056 -0.131* -0.016 0.004 -0.019(0.08) (0.12) (0.07) (0.01) (0.02) (0.01)
Capacity -0.159 -0.002 -0.054 -0.023 -0.012 -0.016(0.10) (0.15) (0.09) (0.02) (0.03) (0.02)
Urban 0.365*** 0.429*** 0.502*** 0.051*** 0.069*** 0.076***(0.03) (0.06) (0.04) (0.00) (0.01) (0.01)
Mom yrs of sch. 0.099*** 0.103*** 0.114*** 0.010*** 0.009*** 0.010***(0.00) (0.01) (0.00) (0.00) (0.00) (0.00)
Dad yrs of sch. 0.052*** 0.059*** 0.062*** 0.008*** 0.007*** 0.008***(0.00) (0.01) (0.00) (0.00) (0.00) (0.00)
N 48387 15512 48960 48438 15540 49048F 287.77 114.54P (F ) > 0 0.000 0.000R2 0.482 0.478 0.476P > χ2 0.000 0.000 0.000Pseudo R2 0.190 0.192 0.190
Note: Also controlled for age, race, family size, disability, employment status of father, automobile ownership,wall type, computer ownership, class of father’s work, class of mother’s work, mother’s number of children,and department.Note: * p < 0.05, ** p < 0.01, *** p < 0.001
46

Table 20: Humanitarian Situation Risk Index: Conflict Index
Variable Name Description
Subversive Actions Rate Hostile acts by subversive groups per 10,000 inhabitants, againstpolice or civilian infrastructure. Includes attacks on police installa-tion, attacks on planes, urban attacks, armed contact, ambushes andsieges.
Unilateral Attacks Total number of incursion with no combat
Total Confrontations Total confrontations between Public Forces and subversive groups
Total Deaths Total deaths in combat
Mine incident rate Number of mine incidents per 10,000 inhabitants
Homicide rate Homicides per 10,000 inhabitants. Common homicides include alldeaths by weapon with the exception of traffic-related homicides
Council member homicide rate Homicide rate among council members, per 10,000 inhabitants
Union member homicide rate Homicide rate among union members, per 10,000 inhabitants
Teacher homicide rate Homicide rate among teachers, per 10,000 inhabitants
Indigenous homicide rate Homicide rate among indigenous people, per 10,000 inhabitants
Massacre victim rate Number of deaths in massacre per 10,000 inhabitants. A collectivehomicide or massacre is committed when the total killed are four ormore persons. It must be committed at the same place, same time, bythe same authors, and against persons unable to defend themselves
Kidnap victim rate Kidnap victims per 10,000 inhabitants, including both simple andextorsive kidnap victims. A kidnapping is the retention or hiding ofa person in order to exchange their freedom for some resource, avoidsome act, or for a publicity of political end.
FARC Groups Number of FARC groups present
ELN Groups Number of ELN groups present
Expulsion displacement rate Rate of forced displacement per 10,000, where the person is forciblyexpelled from the municipality
Reception displacement rate Rate of forced displacement per 10,000, where the person is forciblyexpelled to the municipality
47
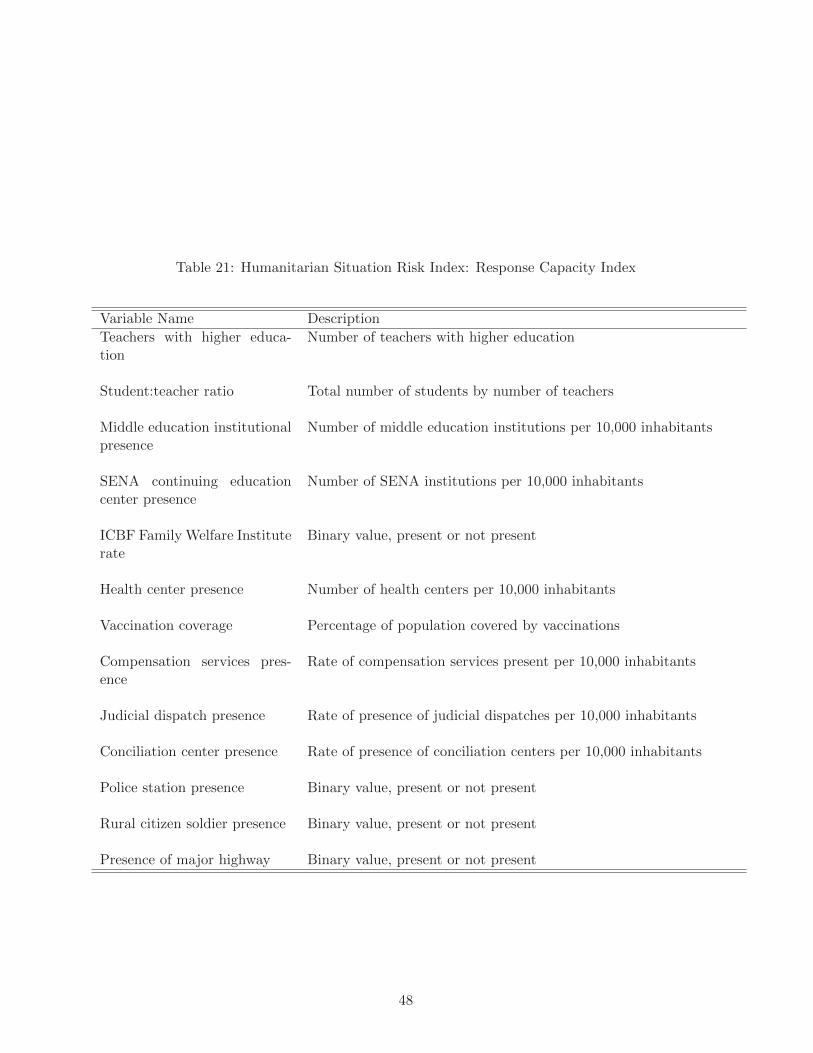
Table 21: Humanitarian Situation Risk Index: Response Capacity Index
Variable Name Description
Teachers with higher educa-tion
Number of teachers with higher education
Student:teacher ratio Total number of students by number of teachers
Middle education institutionalpresence
Number of middle education institutions per 10,000 inhabitants
SENA continuing educationcenter presence
Number of SENA institutions per 10,000 inhabitants
ICBF Family Welfare Instituterate
Binary value, present or not present
Health center presence Number of health centers per 10,000 inhabitants
Vaccination coverage Percentage of population covered by vaccinations
Compensation services pres-ence
Rate of compensation services present per 10,000 inhabitants
Judicial dispatch presence Rate of presence of judicial dispatches per 10,000 inhabitants
Conciliation center presence Rate of presence of conciliation centers per 10,000 inhabitants
Police station presence Binary value, present or not present
Rural citizen soldier presence Binary value, present or not present
Presence of major highway Binary value, present or not present
48