confronting the challenges of - overseas development … · confronting the challenges of ... –...
TRANSCRIPT
1
2
Confronting the Challenges of Gender Equality and Fragile States
Main messages
April 23, 2007
3
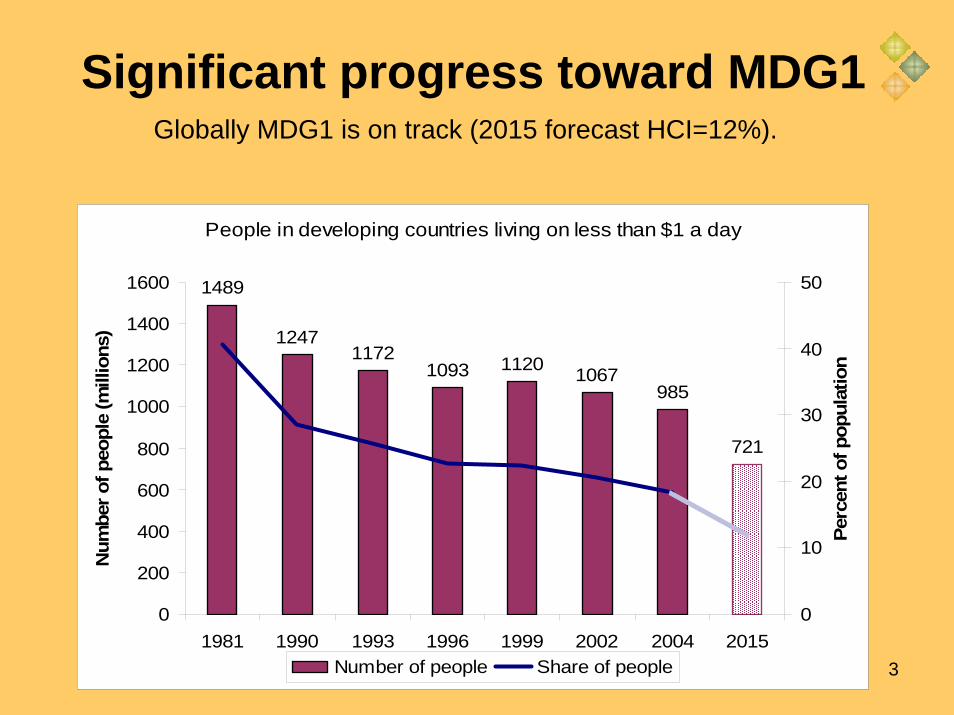
Significant progress toward MDG1
People in developing countries living on less than $1 a day
1489
12471172
1093 1120 1067985
721
0
200
400
600
800
1000
1200
1400
1600
1981 1990 1993 1996 1999 2002 2004 2015
Num
ber o
f peo
ple
(mill
ions
)
0
10
20
30
40
50
Perc
ent o
f pop
ulat
ion
Number of people Share of people
Globally MDG1 is on track (2015 forecast HCI=12%).
4
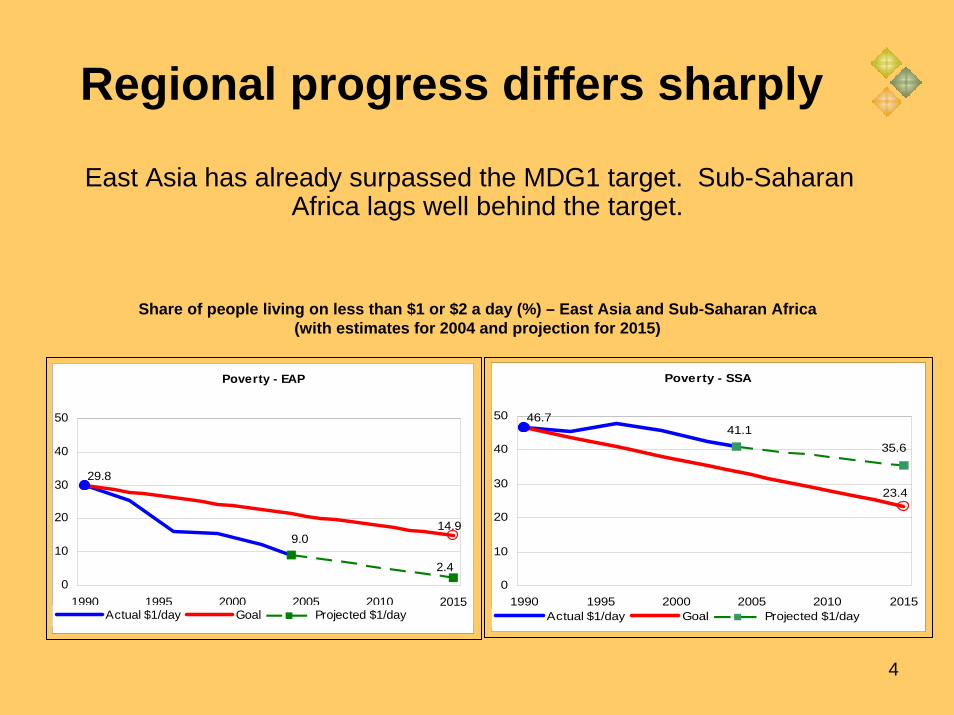
Regional progress differs sharply
East Asia has already surpassed the MDG1 target. Sub-Saharan Africa lags well behind the target.
Share of people living on less than $1 or $2 a day (%) – East Asia and Sub-Saharan Africa(with estimates for 2004 and projection for 2015)
Poverty - EAP
29.8
14.9
2.4
9.0
0
10
20
30
40
50
1990 1995 2000 2005 2010 2015Actual $1/day Goal Projected $1/day
Poverty - SSA
23.4
46.7
35.641.1
0
10
20
30
40
50
1990 1995 2000 2005 2010 2015Actual $1/day Goal Projected $1/day

5
Growth and Poverty Reduction Over Recent Period*
-4
-2
0
2
4
6
8
10
12
14
China Burkina Faso Brazil Mozambique India Nigeria Laos Peru
Annual Growth in GDP per capita Annual % Reduction in the Poverty Rate
The pace of poverty reduction depends on more than growth
* China: 1999-2004 Burkina Faso:1998-2003 Brazil: 1999-2002 Mozambique: 1996-2002
India: 1994-2005 Nigeria: 1996-2003 Laos: 1997-2002 Peru: 1996-2003
Source: World Bank – Development Economics

6
But also cautionary notes…Risks to positive outlook – unwinding of global imbalances (US trade deficit),
pandemic, oil price volatility.• Environmental sustainability: growth for many is through depleting their natural
assets. • Fragile states are being left out: weak growth, little progress with poverty reduction,
persistent fragility
Unadjusted and Adjusted Net Savings Rates by RegionFigure presents the calculation of adjusted net saving in Bolivia in 2003
7
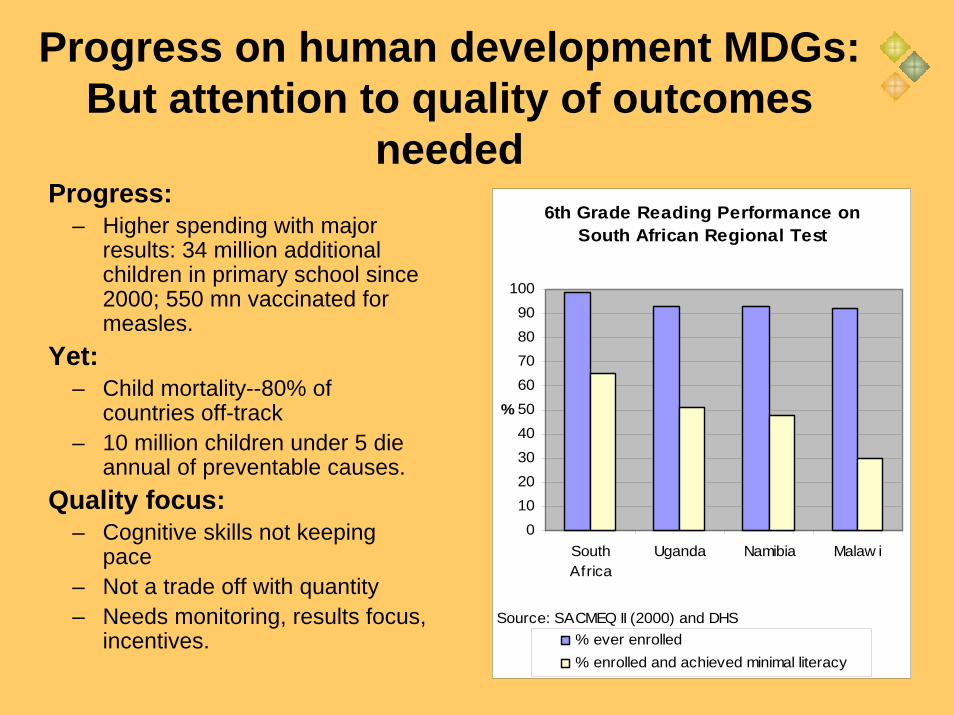
Progress on human development MDGs: But attention to quality of outcomes
neededProgress:
– Higher spending with major results: 34 million additional children in primary school since 2000; 550 mn vaccinated for measles.
Yet:– Child mortality--80% of
countries off-track – 10 million children under 5 die
annual of preventable causes.Quality focus:
– Cognitive skills not keeping pace
– Not a trade off with quantity– Needs monitoring, results focus,
incentives.
6th Grade Reading Performance on South African Regional Test
0102030405060708090
100
SouthAfrica
Uganda Namibia Malaw i
%
% ever enrolled% enrolled and achieved minimal literacy
Source: SACMEQ II (2000) and DHS

8
Better monitoring is needed to show progress in human development MDGs
Source: Demographic and Health Surveys
Annual % Reductions in Under 5 Child Mortality Rates
-1.3-1.0
-0.2-0.1
0.10.4
0.61.1
1.72.2
2.83.03.1
3.73.7
4.85.0
5.56.06.0
7.9
Kenya 1997-2003* Nigeria 1990-2003Cameroon 1998-04
* Chad 1996/7 -2004* Ghana 1998-2003
* Senegal 1997-2005* Guinea 1999-2005
Bolivia 1998-03* Colombia 2000-05
* Rw anda 2000-2005Mozambique 1997-2003
Bangladesh 2000-04Burkina Faso 1998-03* Tanzania 1999-2004
Morocco 1992-2003/04Indonesia 1997-2002/03
Philippines 1998-2003* Malaw i 2000-2004
Madagascar 1997-2003/04* Egypt 2000-2005
* Ethiopia 2000-2005
Annual % reduction required 1990-2015 to reach MDG 4
* New observations
9
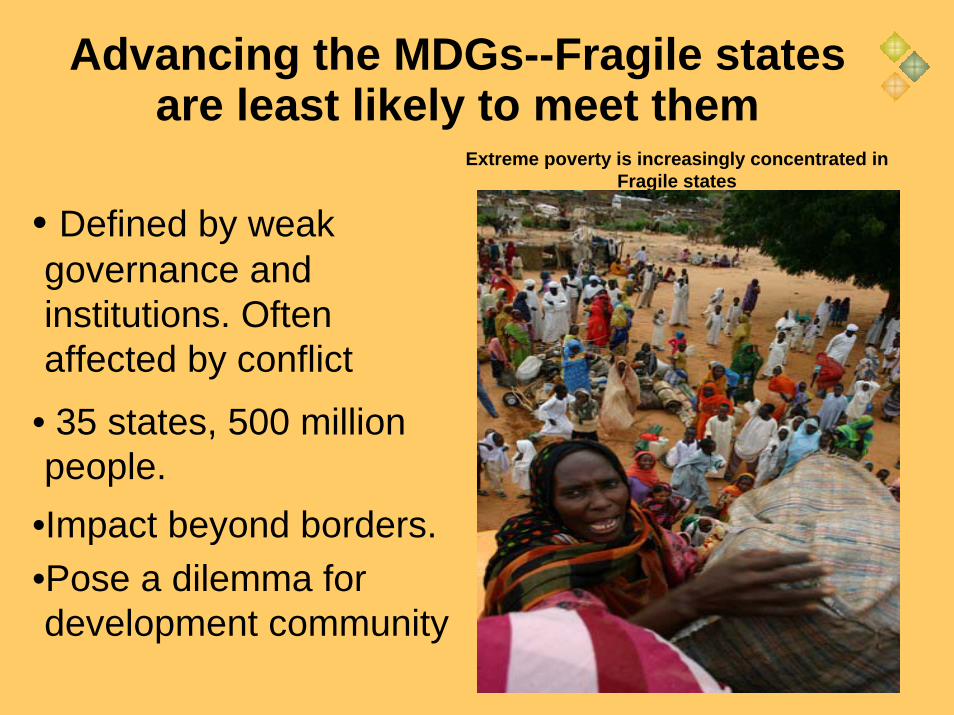
Advancing the MDGs--Fragile states are least likely to meet them
Extreme poverty is increasingly concentrated in Fragile states
• Defined by weak governance and institutions. Often affected by conflict
• 35 states, 500 million people.
•Impact beyond borders. •Pose a dilemma for development community
10
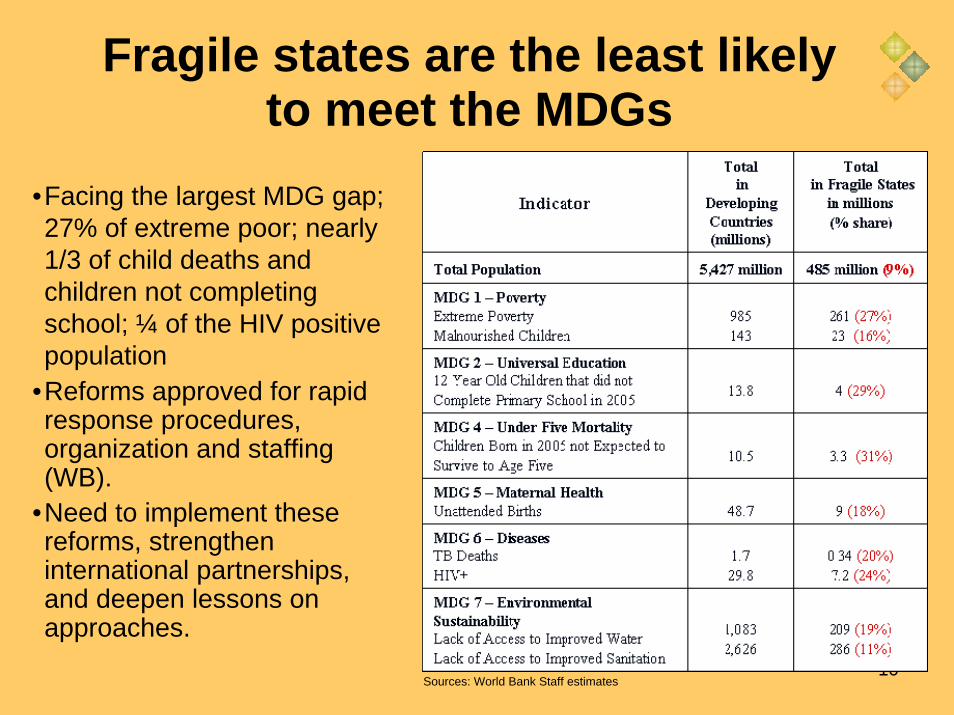
Fragile states are the least likely to meet the MDGs
•Facing the largest MDG gap; 27% of extreme poor; nearly 1/3 of child deaths and children not completing school; ¼ of the HIV positive population
•Reforms approved for rapid response procedures, organization and staffing (WB).
•Need to implement these reforms, strengthen international partnerships, and deepen lessons on approaches.
Sources: World Bank Staff estimates

11
Gender equality is about fairness, opportunity, and smart economics
Tracking gender equality over time: 1990-2005Importance: Intrinsic value; economic value; broader linkages to development
Performance: Major gains in enrollment parity: 83 of 106 countries by 2005. Elsewhere performance lags: labor force participation, political representation.
Monitoring: Need for better indicators and greater monitoring effort.
Mainstreaming: requires realistic goals; leadership, technical expertise and financing.
SSA EAP ECA LCR MNA SAR
0.5
1
Share of w
omen
0.5
1Fe
mal
e to
Mal
e R
atio
Female to Male ratio in (S) SecondaryPar: Proportion Seats held by women in Parliament
2005 1990
Source: World Bank Indicators. The regional averages are calculated using the earliest value sandwiched between 1990 and 1995 and the latest value between 2000 and 2005. The averages are weighted by the country population size in 2005.
12
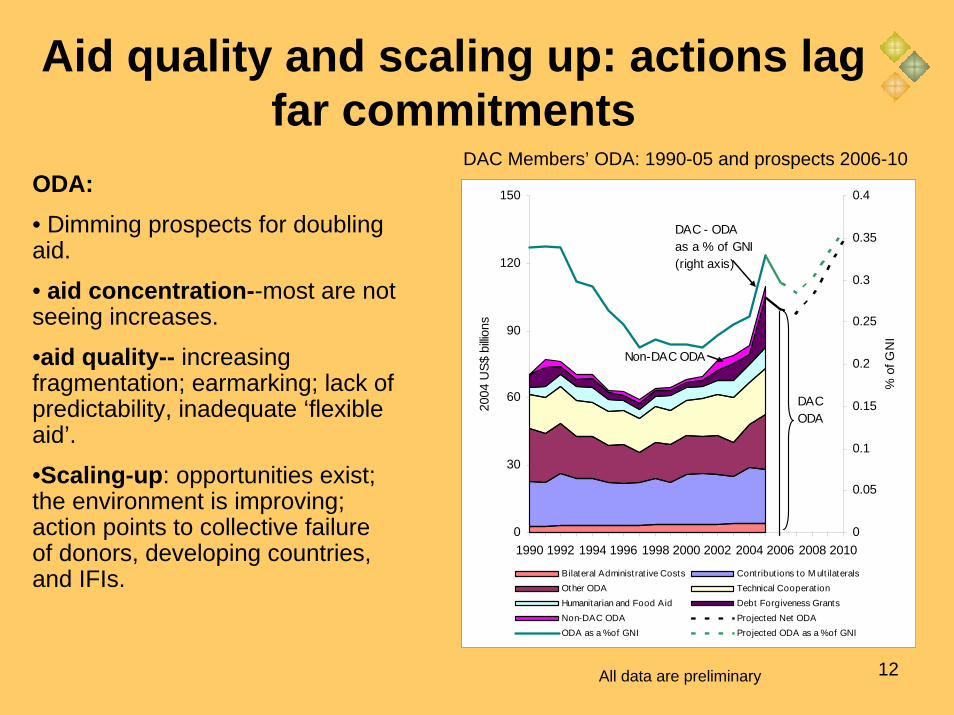
Aid quality and scaling up: actions lag far commitments
DAC Members’ ODA: 1990-05 and prospects 2006-10ODA: • Dimming prospects for doubling aid.
• aid concentration--most are not seeing increases.
•aid quality-- increasing fragmentation; earmarking; lack of predictability, inadequate ‘flexible aid’.
•Scaling-up: opportunities exist; the environment is improving; action points to collective failure of donors, developing countries, and IFIs.
0
30
60
90
120
150
1990 1992 1994 1996 1998 2000 2002 2004 2006 2008 2010
2004
US$
billi
ons
0
0.05
0.1
0.15
0.2
0.25
0.3
0.35
0.4
% o
f GN
I
Bilateral Administrat ive Costs Contribut ions to M ult ilateralsOther ODA Technical Cooperat ionHumanitarian and Food Aid Debt Forgiveness GrantsNon-DAC ODA Projected Net ODAODA as a % of GNI Projected ODA as a % of GNI
DAC - ODA as a % of GNI (right axis)
Non-DAC ODA
DAC ODA
All data are preliminary
13
SomeDecrease(1%-5%)
New ZealandRomaniaGabonComoros
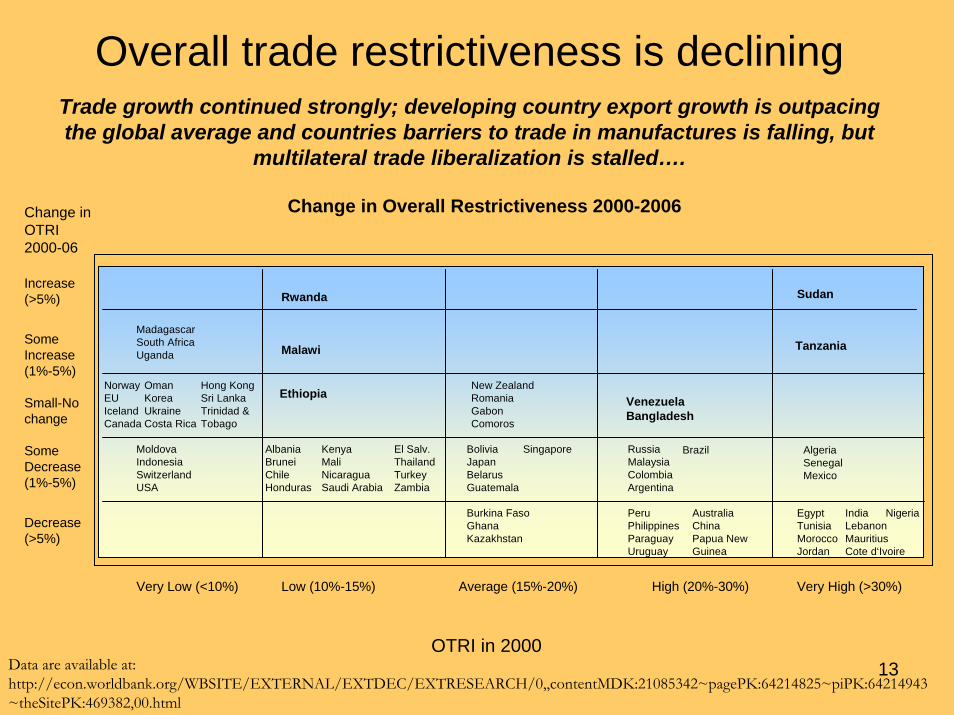
Overall trade restrictiveness is decliningTrade growth continued strongly; developing country export growth is outpacing the global average and countries barriers to trade in manufactures is falling, but
multilateral trade liberalization is stalled….
Small-No change
SomeIncrease(1%-5%)
Increase(>5%)
Decrease(>5%)
OTRI in 2000
Very Low (<10%) Low (10%-15%) Average (15%-20%) High (20%-30%) Very High (>30%)
MadagascarSouth AfricaUganda
NorwayEUIcelandCanada
OmanKoreaUkraineCosta Rica
Hong KongSri LankaTrinidad &Tobago
MoldovaIndonesiaSwitzerlandUSA
AlbaniaBruneiChileHonduras
KenyaMaliNicaraguaSaudi Arabia
El Salv. ThailandTurkeyZambia
Ethiopia
Malawi
Rwanda
BoliviaJapanBelarusGuatemala
Singapore
Burkina FasoGhanaKazakhstan
VenezuelaBangladesh
RussiaMalaysiaColombiaArgentina
PeruPhilippinesParaguayUruguay
AustraliaChinaPapua New Guinea
Brazil AlgeriaSenegalMexico
EgyptTunisiaMoroccoJordan
IndiaLebanonMauritiusCote d‘Ivoire
Nigeria
Tanzania
Sudan
Change in OTRI 2000-06
Change in Overall Restrictiveness 2000-2006
Data are available at: http://econ.worldbank.org/WBSITE/EXTERNAL/EXTDEC/EXTRESEARCH/0,,contentMDK:21085342~pagePK:64214825~piPK:64214943~theSitePK:469382,00.html
14
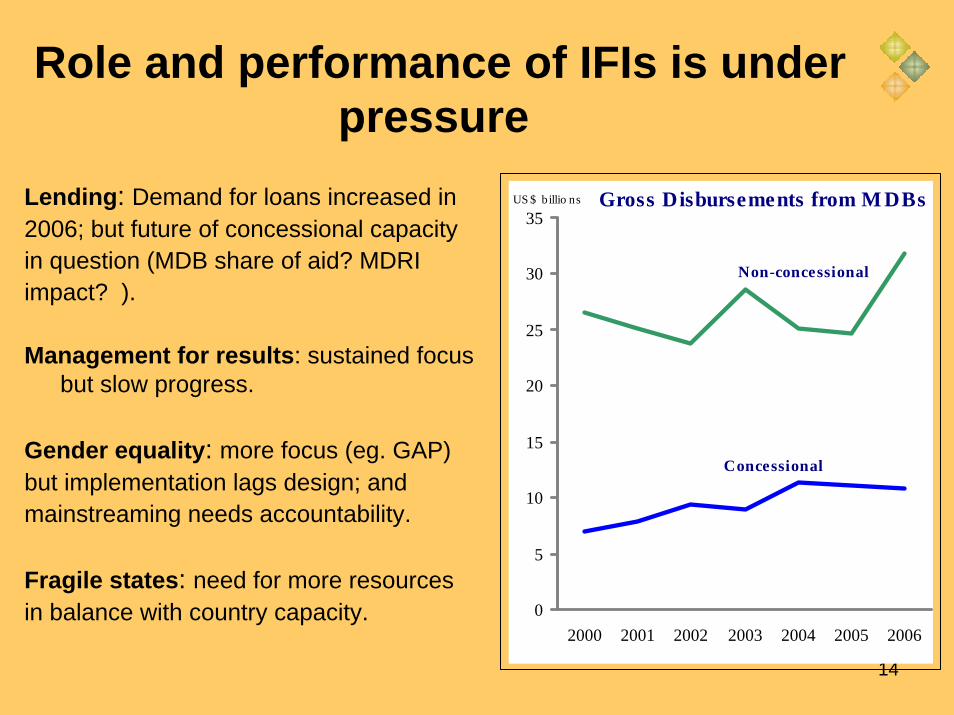
Role and performance of IFIs is under pressure
Lending: Demand for loans increased in2006; but future of concessional capacity in question (MDB share of aid? MDRI impact? ).
Management for results: sustained focus but slow progress.
Gender equality: more focus (eg. GAP)but implementation lags design; andmainstreaming needs accountability.
Fragile states: need for more resourcesin balance with country capacity.
Gross Disbursements from M DBs
0
5
10
15
20
25
30
35
2000 2001 2002 2003 2004 2005 2006
US $ billio ns
Non-concessional
Concessional
15
Promoting Gender Equality Promoting Gender Equality and Empowerment of and Empowerment of
WomenWomen
Chapter 3 Main messages

16
Gender equality is measured in 3 domains:
Aggregate economic performance (poverty reduction, growth)
Gender equality in rights, resources and voice
HouseholdHousehold resource and task allocations
Fertility decisions
Economy & marketsAccess to land
Financial services
Labor markets
Technology
SocietyCivic and political participation
Leveling the field of opportunities
Domain of choices,
Domain of policy
17
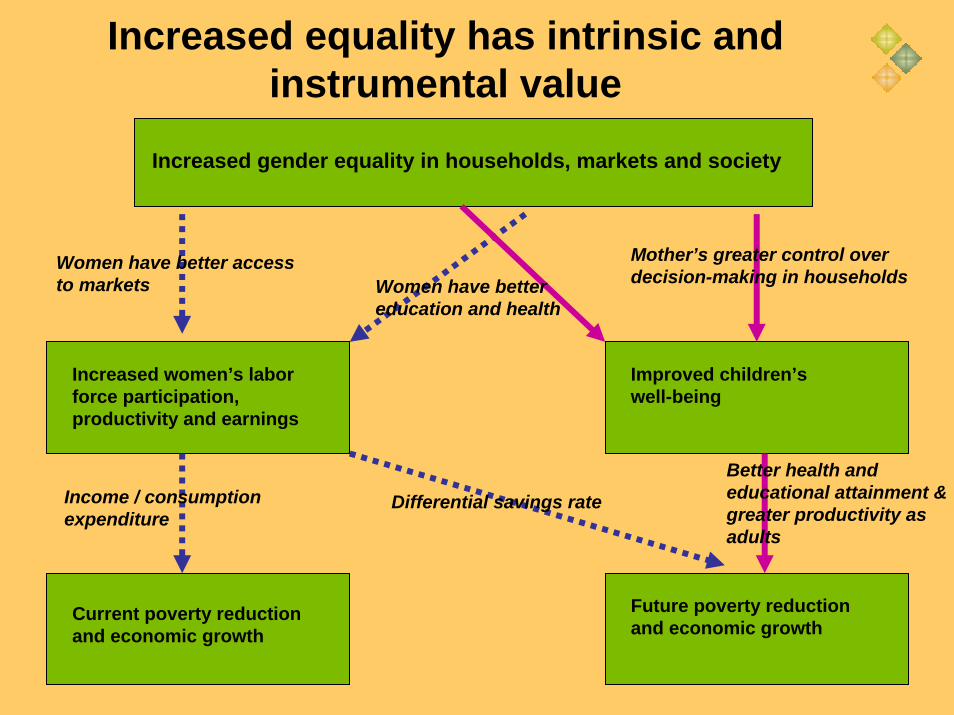
Increased equality has intrinsic and instrumental value
Increased gender equality in households, markets and society
Increased women’s labor force participation, productivity and earnings
Improved children’s well-being
Future poverty reduction and economic growth
Current poverty reduction and economic growth
Differential savings rate
Women have better education and health
Mother’s greater control over decision-making in households
Better health and educational attainment & greater productivity as adults
Income / consumption expenditure
Women have better access to markets

18
A success story: Notable improvements in girls’ enrollments in last 15 years.
50
0
100
150
P S T P S T P S T P S T P S T P S T
Primary Secondary Tertiary
AFR EAP ECA LCR MNA SAR
19902005

19
However, some low income countries & fragile states will not meet MDG3 target.
Regional performance in attaining the primary and secondary enrollment target by 2005
Achieved target by 2005
On track to achieve target
by 2015
Off track or unlikely to
achieve target by 2015 No data Total
Sub-Saharan Africa 10 1 16 2 48
East Asia and the Pacific 13 0 0 4 24
Europe and Central Asia 22 0 1 2 27
Latin America and the Caribbean 27 0 0 2 31
Middle East and North Africa 8 0 3 1 14
South Asia 3 0 2 1 8
Total 83 1 22 12 152
of which: Fragile states 5 0 9 21 35
Source: World Bank estimates using data on enrollments between early 1990s and 2004/2005.
20
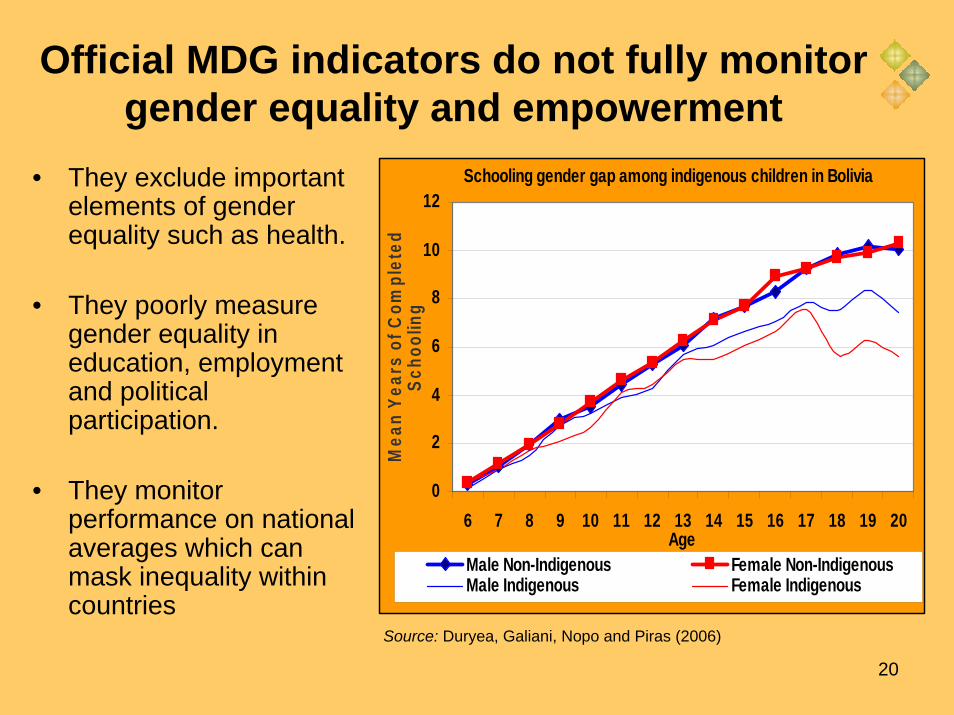
Official MDG indicators do not fully monitor gender equality and empowerment
Schooling gender gap among indigenous children in Bolivia
0
2
4
6
8
10
12
6 7 8 9 10 11 12 13 14 15 16 17 18 19 20Age
Mea
n Ye
ars
of C
ompl
eted
Scho
olin
g
Male Non-Indigenous Female Non-IndigenousMale Indigenous Female Indigenous
• They exclude important elements of gender equality such as health.
• They poorly measure gender equality in education, employment and political participation.
• They monitor performance on national averages which can mask inequality within countries
Source: Duryea, Galiani, Nopo and Piras (2006)
21
Additional indicators - three filters:
•• Data availabilityData availability
•• Policy relevancePolicy relevance
•• ParsimonyParsimony

22
Recommended additional indicators for MDG3
Household Economy and markets
Modifications of official MDG indicators Additional indicators Additional indicators
Primary completion rate of girls and boys (MDG 2)
Percentage of 15-19 year-old girls who are mothers or pregnant with their first child
Labor force participation rates among women and men aged 20-24 and 25–49
Under five mortality rate for girls and boys (MDG 4)
Percentage of reproductive-age women, and their sexual partners, using moderncontraceptives (MDG 6)

23
Monitoring child mortality reveals additional problem regions
Female under-5 mortality rate and female to male ratio, 2004
Source: World Population Prospects 2004.
0
20
40
60
80
100
120
140
160
South Asia East Asia andPacific
Sub SaharanAfrica
Middle East &North Africa
Europe &Central Asia
Latin America& Caribbean
Unde
r-5 m
orta
lity ra
te
0.00
0.20
0.40
0.60
0.80
1.00
1.20
Fem
ale to
male
ratio
Female under-5 mortality rate Female to male under-5 mortality ratio

24
Countries rank differently in official and additional indicators
25
The unfinished agenda
Closing gaps in wellClosing gaps in well--being and opportunities for being and opportunities for girls and women in disadvantaged subgirls and women in disadvantaged sub--groups within groups within nations.nations.
Giving priority to SubGiving priority to Sub--Saharan Africa. Saharan Africa.
Paying special attention to MDG3 issues in fragile Paying special attention to MDG3 issues in fragile states. states.
Scaling up collection of sex disaggregated data to Scaling up collection of sex disaggregated data to measure progress (especially, in the domains of measure progress (especially, in the domains of society and the market and economy).society and the market and economy).
26
Implementation of gender policies in donor agencies & IFIs has been disappointing.
27
Way forward for donor agencies:
Selectivity in gender mainstreaming.Selectivity in gender mainstreaming.
Results orientation with strengthened M&E.Results orientation with strengthened M&E.
Stronger organizational arrangements for Stronger organizational arrangements for gendergender--specific actions and mainstreaming.specific actions and mainstreaming.
Synergies with aid effectiveness agenda.Synergies with aid effectiveness agenda.

28
IFIs can scale-up MDG3 agenda
Invest dedicated resources to include gender Invest dedicated resources to include gender in results orientation.in results orientation.
Play leadership role to monitor MDG3 at Play leadership role to monitor MDG3 at international level.international level.
Assist client countries in scaling up MDG3 Assist client countries in scaling up MDG3 interventions.interventions.

29
Thank you
The GMR and related materials are available at: http://www.worldbank.org/gmr2007