confronting the odds: students at risk and the pipeline to - castl
TRANSCRIPT

NATIONAL CENTER FOR EDUCATION STATISTICS
Statistical Analysis Report October 1997
Confronting the Odds:Students At Risk and the Pipelineto Higher Education
Laura J. HornMPR Associates, Inc.
C. Dennis CarrollProject OfficerNational Center for Education Statistics
Data Series: NELS:88/94
U.S. Department of EducationOffice of Educational Research and Improvement NCES 98-094

iii
HIGHLIGHTS
The purpose of this report is twofold. First, it aims to understand the critical junctures in the
pipeline to college enrollment where at-risk high school graduates leave at substantially higher
rates than their counterparts not at risk. Second, it identifies factors that contribute to at-risk stu-
dents’ successful navigation of the pipeline to college enrollment.
Students at risk were defined as 1992 high school graduates who had risk characteristics
that increased their chances of dropping out of high school. These included being from a single
parent household, having an older sibling who dropped out of high school, changing schools two
or more times other than the normal progression (e.g., from elementary to middle school), having
C’s or lower grades between sixth and eighth grades, being from a low socioeconomic status
(SES) family, or repeating an earlier grade.
• About 58 percent of 1992 high school graduates had one or more risk factors; 32 per-cent had one risk factor, 16 percent had two, and 9 percent had three or more (table 1).
The pipeline analysis compares students at risk with their counterparts not at risk according
to their progression through five steps to college enrollment. The five steps that make up the col-
lege pipeline include: aspirations for a bachelor’s degree (step 1), academic preparation for col-
lege (step 2), taking entrance exams (step 3), applying to college (step 4), and enrolling (step 5).
The proportion of students at each step are those who completed all the preceding steps.
PIPELINE TO COLLEGE
• Among 1992 high school graduates with no risk factors, 58 percent successfully navi-gated the pipeline to enrollment in a four-year college, compared with 30 percent ofstudents at risk (figure 1).
• At-risk students most differed from their counterparts not at risk in relation to theireducational aspirations (step 1) and academic preparation (step 2). Just over half (56percent) of at-risk students aspired to a bachelor’s degree in the tenth grade, comparedwith four out of five students (81 percent) not at risk. About 44 percent of at-risk stu-dents progressed to step 2 (were at least minimally prepared academically to attend afour-year college), compared with 75 percent of students not at risk.

HIGHLIGHTS
iv
• Even among students who completed step 2 (were academically prepared), at-risk stu-dents were much more likely not to complete step 3 (take an entrance exam) than stu-dents not at risk (9 percent versus 3 percent) (figure 2).
• Among students who got as far as taking entrance exams, 13 percent of at-risk studentsdid not apply to college (step 4), compared with 9 percent of those not at risk.
• Among students who completed the pipeline through step 4 (applied to one or morefour-year colleges), about 16 percent of at-risk students did not enroll (step 5), com-pared with 12 percent of students not at risk.
COMPARISONS AMONG AT-RISK STUDENTS
At-risk students who progressed through the college pipeline and enrolled in a four-year
college were compared with their at-risk peers who either enrolled in a subbaccalaureate degree
institution or did not pursue further education. Comparisons were made in three areas: completion
of math “gatekeeping” courses, obtaining school assistance in applying to college, and activities
and behaviors associated with student, parent, and peer engagement in school activities. The
analysis was limited to at-risk students who completed the first two steps of the pipeline (aspired
to a bachelor’s degree and were at least minimally prepared for admission to a four-year college).
Math Course Taking
• Among at-risk students who aspired to a college degree and were academically pre-pared, about two-thirds (64 percent) of those who enrolled in a four-year college com-pleted at least one advanced math course (such as calculus), compared with about one-third who enrolled in other postsecondary education (36 percent) or who did not enrollat all (31 percent) (table 9). There was no measurable difference in the proportion ofstudents who took advanced math courses between those enrolled in other postsecon-dary education and those who did not enroll.
School Assistance in Application Process
• At-risk students who enrolled in a four-year college were more likely to report receiv-ing help from school personnel in filling out their application (56 percent) than eitherthose who enrolled in other postsecondary education (44 percent) or those who hadnever enrolled (43 percent) (table 10).
• At-risk students did not differ, however, with respect to taking a special course offeredby the school to help them prepare for the college entrance exams relative to their post-secondary enrollment outcomes.

HIGHLIGHTS
v
Student, Parent, and Peer Engagement
• The rate at which students participated in two or more extracurricular activities distin-guished students who enrolled in a four-year college (48 percent) from those who hadnever enrolled in postsecondary education (34 percent) (table 11).
• The frequency with which parents reported discussing school-related matters with theirchild distinguished students who enrolled in a four-year college from those who eitherenrolled in other postsecondary education or did not enroll (table 12). For example,four-year college enrollees’ parents were less likely to report having few or no discus-sions (13 percent) than were students who enrolled in other postsecondary education(20 percent) or those who had never enrolled (24 percent).
• The number of students’ friends with plans to attend a four-year college was stronglyassociated with enrollment outcomes (table 13): students who enrolled in a four-yearcollege were much more likely to report that all or most of their friends planned to at-tend (80 percent), compared with those who enrolled in other postsecondary education(60 percent) or who never enrolled (49 percent).

vi
FOREWORD
This report is part of the Postsecondary Education Descriptive Analysis Reports (PEDAR)
series. The PEDAR series consists of reports that focus on postsecondary education policy issues,
taking advantage of a variety of education data sources, especially recently completed data col-
lections. Other reports in the series include: Undergraduates Who Work While Enrolled in Post-secondary Education: 1989–90 (NCES 94-311); Characteristics of Students Who Borrow toFinance Their Postsecondary Education (NCES 95-310); Minority Undergraduate Participationin Postsecondary Education (NCES 95-166); Profile of Older Undergraduates: 1989–90 (NCES
95-167); Profile of Part-Time Undergraduates in Postsecondary Education: 1989–90 (NCES
95-173); Packaging of Undergraduate Student Financial Aid: 1989–90 (NCES 95-313); HowLow Income Undergraduates Financed Postsecondary Education: 1992–93 (NCES 96-161); and
Nontraditional Undergraduates: Trends in Enrollment from 1986 to 1992 and Persistence andAttainment Among 1989–90 Beginning Postsecondary Students (NCES 97-578).
This report compares 1992 high school graduates who were “at risk” of dropping out of
high school with their counterparts not at risk to determine how well each group progressed
through five important steps leading to college enrollment. These steps were defined in terms of a
“pipeline” to college enrollment and include: aspirations for a bachelor’s degree (step 1), aca-
demic preparation for college (step 2), taking entrance exams (step 3), applying to college (step
4), and enrolling in college (step 5). Students were considered at risk if they had one or more of
the following characteristics: were from a single parent household, had an older sibling who
dropped out of high school, changed schools two or more times other than the normal progres-
sion (e.g., from elementary to middle school), had C’s or lower grades between sixth and eighth
grade, were from a low SES family, or repeated an earlier grade.
The data used for this analysis were drawn from the National Education Longitudinal Study
of 1988 (NELS:88/94), a survey that began with eighth graders in 1988 and followed them every
two years through 1994. The analysis was limited to 1992 high school graduates.
The percentages and means presented in this report were produced using the public access
NELS:88/94 Data Analysis System (DAS). The DAS is a microcomputer application that allows
users to specify and generate their own tables from the NELS data. The DAS produces design-
adjusted standard errors necessary for testing the statistical significance of differences shown in

FOREWORD
vii
the tables. Additional information about the DAS, and how it may be obtained, is included in ap-
pendix B of this report.
We hope that the information provided in this report will be useful to a wide range of inter-
ested readers, and that the results reported here will encourage others to use the NELS data.

viii
ACKNOWLEDGMENTS
The authors wish to thank all those who contributed to the production of this report. At
MPR Associates, Susan Choy reviewed the report and provided helpful criticism. Thanks also to
Andrea Livingston, who edited the report, to Mary Sukkestad and Helen Jang, who formatted the
tables and graphics, and to Don Eike, Karyn Madden, and Barbara Kridl, who assembled and
proofread the final report.
We are grateful to all the reviewers of this report whose insights and helpful criticism
strengthened the final product. Ellen Bradburn from Education Statistics Services Institute pro-
vided a comprehensive substantive and methodological review. Robert Burton and Mike Ross
from NCES, and David Bergeron from the Office of Postsecondary Education (OPE), reviewed
the final report.

ix
TABLE OF CONTENTS
Page
Highlights ............................................................................................................................. iii
Foreword .............................................................................................................................. vi
Acknowledgments ................................................................................................................ viii
List of Tables ........................................................................................................................ xi
List of Figures ...................................................................................................................... xiv
Introduction ......................................................................................................................... 1Background ...................................................................................................................... 1
Data and Definitions ............................................................................................................ 5Study Sample ................................................................................................................... 5Who Is At Risk? ............................................................................................................... 5Pipeline to College ............................................................................................................ 6Comparisons Within the At-Risk Population ..................................................................... 8
Overview of Students at Risk .............................................................................................. 11Distribution of Risk Factors .............................................................................................. 11Demographic Composition ............................................................................................... 12Postsecondary Enrollment ................................................................................................ 16
Pipeline to a Four-Year College ........................................................................................... 19Outcomes of Students Not Advancing Through the Pipeline ............................................. 23Postsecondary Persistence Indicators ................................................................................ 23
Comparisons Among At-Risk Students ............................................................................... 27Number of Risk Factors .................................................................................................... 27Math Course Taking ......................................................................................................... 30Received Help From the School With the Postsecondary Application Process ................... 30Student, Parent, and Peer Engagement ............................................................................. 31Controlling for Related Variables....................................................................................... 35
Summary and Conclusions .................................................................................................. 45

TABLE OF CONTENTS
x
Page
Appendix A—Glossary ........................................................................................................ 47
Appendix B—Technical Notes and Methodology ............................................................... 59
Appendix C—Supplementary Tables .................................................................................. 69

xi
LIST OF TABLES
Table Page
1 Risk status of 1992 high school graduates: total percentage with any risk factors, witheach risk factor, the percentage distribution by number of risk factors, and theaverage number of risk factors among all high school graduates .................................. 11
2 Percentage of 1992 high school graduates with each risk factor, by number of riskfactors and all other risk factors .................................................................................. 13
3 Percentage distribution of 1992 high school graduates according to race–ethnicity,by number of risk factors and individual risk factors .................................................... 14
4 Percentage distribution of 1992 high school graduates according to parents’ highesteducational attainment, by number of risk factors and individual risk factors ................ 15
5 Percentage distribution of 1992 high school graduates according to the first postsecondaryinstitution attended, by number of risk factors and individualrisk factors .................................................................................................................. 17
6 Percentage of 1992 high school graduates who progressed through each step in thepipeline to enrollment in a 4-year institution by 1994, by risk status ............................. 20
7 Percentage distribution of 1992 high school graduates who did not enroll in a 4-yearcollege by 1994 according to their postsecondary education enrollment, by pipeline status,risk status, and academic preparation .......................................................................... 24
8 Among 1992 high school graduates who enrolled in postsecondary education by 1994, thepercentage who had strong persistence indicators, by risk status and type of firstinstitution ................................................................................................................... 25
9 Among 1992 high school graduates with one or more risk factors who had a bachelor’sdegree goal in the 10th grade and were at least minimally prepared academicallyto enroll in a 4-year college, the percentage distribution according to the highestlevel of math courses completed in high school, by type of first postsecondaryinstitution ................................................................................................................... 31

LIST OF TABLES
xii
Table Page
10 Among 1992 high school graduates with one or more risk factors who had a bachelor’sdegree goal in the 10th grade and were at least minimally prepared academically toenroll in a 4-year college, the percentage who reported receiving help from theirschool in preparing postsecondary education applications, by type of firstpostsecondary institution ............................................................................................ 32
11 Among 1992 high school graduates with one or more risk factors who had a bachelor’sdegree goal in the 10th grade and were at least minimally prepared academically toenroll in a 4-year college, the percentage distribution according to level of class attendancein high school and the percentage reporting two or moreextracurricular activities, by type of first postsecondary institution .............................. 33
12 Among 1992 high school graduates with one or more risk factors who had a bachelor’sdegree goal in the 10th grade and were at least minimally prepared academically toenroll in a 4-year college, the percentage distribution according to parents’educational expectations and the frequency of school-related discussions,by type of first postsecondary institution ..................................................................... 34
13 Among 1992 high school graduates with one or more risk factors who had a bachelor’sdegree goal in the 10th grade and were at least minimally prepared academically toenroll in a 4-year college, the percentage distributions according to level ofimportance peers attribute to learning activities, and the number of friendswith college plans, by type of first postsecondary institution ........................................ 36
14 Percentage of 1992 high school graduates with one or more risk factors who enrolledin a 4-year institution by 1994, and the adjusted percentage after taking into accountthe covariation of the variables listed in the table ......................................................... 38
15 Percentage of 1992 high school graduates with one or more risk factors who enrolledin any postsecondary education by 1994, and the adjusted percentage after takinginto account the covariation of the variables listed in the table ..................................... 42
B1 Standard errors for table 2: Percentage of 1992 high school graduates with each riskfactor, by number of risk factors and all other risk factors ........................................... 62
C1 Percentage of 1992 high school graduates who enrolled in a 4-year institution by 1994,and the adjusted percentage after taking into account the covariation of the variables listedin the table .................................................................................................................. 70
C2 Percentage of 1992 high school graduates who enrolled in any postsecondary education by1994, and the adjusted percentage after taking into account the covariation of thevariables listed in the table .......................................................................................... 71
Table Page

LIST OF TABLES
xiii
C3 Among 1992 high school graduates who did not enroll in a 4-year college, thepercentage who took various combinations of pipeline steps ....................................... 72

xiv
LIST OF FIGURES
Figure Page
1 Percentage of 1992 high school graduates who followed the steps of the pipeline to4-year college enrollment, by risk status ...................................................................... 21
2 Among 1992 high school graduates who progressed through the college pipeline, thepercent lost at each step among those remaining from the previous step,by risk status................................................................................................................ 22
3 Percentage of 1992 high school graduates who followed the steps of the pipelineto 4-year college enrollment, by risk status .................................................................. 28
4 Among 1992 high school graduates with any risk factors who had a bachelor’s degreegoal in the 10th grade and were at least minimally prepared academically to attenda 4-year college, percentage distribution according to postsecondary enrollmentby 1994 ...................................................................................................................... 29

1
INTRODUCTION
Getting a college education has become increasingly important in order to participate fully in
today’s labor market. The size of the blue-collar job sector has declined markedly over the last
two decades.1 At the same time, there has been a parallel decline in entry-level wages, and the
wage drop for high school graduates entering the labor force has been more than three times that
of college graduates (in constant dollars).2
In the past, students who either dropped out of high school or entered the labor market im-
mediately after high school graduation may have relied on getting relatively well paying entry-
level manufacturing jobs. However, now that the economy demands a more technologically so-
phisticated labor force, these youth may have limited opportunities for economic advancement
unless they continue their education beyond high school.
These changes may have especially adverse consequences on students who are characterized
as “at risk.” These are students whose family background or early educational experiences place
them at greater risk of dropping out of high school. For those who manage to graduate from high
school, at-risk students are much less likely to pursue further education. For example, among
1988 eighth graders in the lowest socioeconomic status (SES) quartile, about one-third enrolled in
some form of postsecondary education by 1994, compared to most (88 percent) of the students in
the highest SES quartile.3
BACKGROUND
Until recently, much of the research on “at-risk” populations has concentrated on identifying
exactly who is at risk.4 That is, outside of ability, what are the factors that distinguish students
who drop out or fail in school from those who do not? However, the focus has subsequently
1L. Mishel and J. Bernstein, The State of Working America (New York, NY: Economic Policy Institute, M.E. Sharp, 1994).2Ibid. For example, according to Mishel and Bernstein, the entry-level hourly wage for high school graduates in 1993 dollarsdeclined from $8.82 in 1973 to $6.61 in 1993. College graduates’ entry-level hourly wage declined from $12.55 to $11.67 forthe same time period.3M. McMillen and P. Kaufman, Dropout Rates in the United States: 1994 (NCES 96-863) (Washington, D.C.: U.S. Depart-ment of Education, National Center for Education Statistics, 1996).4P. Kaufman and D. Bradby, Characteristics of At-Risk Students in NELS:88 (NCES 92-042) (Washington, D.C.: U.S. De-partment of Education, National Center for Education Statistics, 1992).

INTRODUCTION
2
shifted to understanding why certain at-risk students exhibit resiliency and do well in school de-
spite significant disadvantages. For example, a study conducted by Finn (1993) revealed that
higher achieving at-risk students were more engaged in their school life from the very start of
their education.5 These students were more likely to have attended kindergarten than their lower
achieving peers, and later in their school life, exhibited stronger participatory behaviors both in-
side and outside the classroom. As eighth graders, these students attended class more often, came
to school more prepared, did more homework, and participated in extracurricular activities at
higher rates.
More recently, Chen and Kaufman (1997) analyzed the influence of “protective” behaviors
exhibited by successful at-risk students in high school.6 In their study “success” was defined as
graduating from high school, and the protective behaviors were ones that lowered the odds of
dropping out. These behaviors were defined within three domains: family, individual, and peer
associations. A number of these variables significantly reduced the odds of dropping out of high
school independent of SES and race–ethnicity.
The study reported on here builds on Chen and Kaufman’s research by beginning with a “re-
silient” population of at-risk students—those who graduated from high school—and tracking their
progress through the “pipeline” to college enrollment. The purpose is twofold: first, to determine
junctures in the pipeline to college enrollment where at-risk students leave at substantially higher
rates than their counterparts not at risk; and second, to compare at-risk students with different
postsecondary enrollment outcomes in order to identify factors that may contribute to their suc-
cessful navigation of the pipeline to college enrollment.
To set the context, the analysis first compares students who are at risk with those who are
not. It is loosely modeled on the “pipeline” study developed by the National Science Foundation
(NSF), which identifies various junctures in the pipeline to attaining a college degree in mathe-
matics, science, or engineering.7 In the current study, the pipeline represents the path from high
school to enrollment in a four-year college.8 The pipeline has five major junctures: having aspira-
tions for a bachelor’s degree, academic preparation for college, taking entrance exams, applying
to college, and enrolling.
5J. Finn, School Engagement and Students At Risk (Washington, D.C.: U.S. Department of Education, National Center for Edu-cation Statistics, 1993).6X. Chen and P. Kaufman, “Risk and Resilience: The Effects on Dropping Out of High School,” a paper presented at theAmerican Education Research Association (AERA) meeting, Chicago, 1997.7National Science Foundation, National Science Board, Science and Engineering Indicators—1995 (Washington, D.C.: U.S.Government Printing Office, 1995).8In this report, the term “four-year college” refers to any four-year postsecondary institution that offers a bachelor’s degreeprogram. The first postsecondary enrollment, if any, is used to determine enrollment in such a program.

INTRODUCTION
3
The second part of the analysis compares at-risk students who progressed through the col-
lege pipeline and enrolled in a four-year college with their at-risk peers who either enrolled in a
subbaccalaureate degree institution, such as a community college, or who did not pursue further
education (at least within two years) after high school. Comparisons are made in three areas: math
course taking, school assistance in the applying to college, and activities and behaviors associated
with school engagement.


5
DATA AND DEFINITIONS
STUDY SAMPLE
The data used for this analysis are drawn from the National Education Longitudinal Study of
1988 (NELS:88/94), a survey that began with eighth graders in 1988 and followed them every
two years through 1994. The sample was limited to 1992 high school graduates.
The first part of the analysis is based on all 1992 high school graduates, comparing students
who are at risk with their counterparts who are not at risk according to how well they navigated
through the pipeline to college enrollment. The second part of the study is based entirely on stu-
dents at risk and comparisons are made among at-risk students with different postsecondary en-
rollment outcomes.
WHO IS AT RISK?
Previous studies conducted on the base-year and first follow-up NELS surveys (eighth and
tenth graders) identified many factors that are associated with the probability of school failure and
dropping out.9 As one might expect, these factors are often highly correlated with students’ SES.
However, Chen and Kaufman identified five factors that increased the odds of dropping out of
high school even after controlling for SES and race–ethnicity.10 These risk factors included being
from a single parent household, having an older sibling who dropped out of high school, changing
schools two or more times other than the normal progression (e.g., from elementary to middle
school), having poorer than average grades, and repeating an earlier grade. While it is true that
college enrollment rates vary according to racial–ethnic groups,11 there are a number of other
factors including socioeconomic status that are associated with these trends. For example, Hauser
(1992) reported that black students were more likely to attend college than whites once SES was
taken into consideration.12
9P. Kaufman and D. Bradby, Characteristics of At-Risk Students in NELS:88.10X. Chen and P. Kaufman, “Risk and Resilience.”11D. Koretz, “Trends in Postsecondary Enrollment of Minorities,” RAND, Eric Document # ED328112 (1990).12R. Hauser, “Trends in College Entry Among Whites, Blacks, and Hispanics, 1972–1988,” Eric Document # ED343987(1992).

DATA AND DEFINITIONS
6
This analysis, therefore, used the same definition of risk that was developed by Chen and
Kaufman which controlled for racial–ethnic group differences. All of the risk factors were identi-
fied in 1988 (when students were in the eighth grade) with the exception of having older siblings
who dropped out of high school, which was asked in 1990. In summary, students were considered
at risk if they had one or more of the following characteristics:
• Lowest SES quartile;
• Single parent family;
• Older sibling dropped out of school;
• Changed schools two or more times;
• Average grades of C’s or lower from sixth to eighth grade; and
• Repeated a grade.
The analysis also distinguished students’ level of risk by identifying those at low risk (one
risk factor), moderate risk (two risk factors), and high risk (three or more risk factors).
PIPELINE TO COLLEGE
The pipeline is a concept used to define the major junctures in the pathway to college en-
rollment. It begins with a student’s desire to continue her or his schooling beyond high school and
ends with matriculation in a four-year college. While the steps primarily concern the track to a
four-year college, the postsecondary status of students who did not follow this path is also pre-
sented.
Step 1: Aspirations
Students’ educational aspirations are highly correlated with their eventual attainment.13
Moreover, the differences in aspirations between students from low-SES backgrounds and their
more advantaged peers are also well known.14 Among 1988 eighth graders, for example, less than
half (42 percent) of low-SES students aspired to a bachelor’s degree, compared with 64 percent
13S.L. Hanson, “Lost Talent: Unrealized Educational Aspirations and Expectations Among U.S. Youths,” Sociology of Educa-tion 67 (1994): 159–183.14See U.S. Department of Education, National Center for Education Statistics, National Education Longitudinal Study 1988–1994 Descriptive Summary Report (Washington, D.C.: 1996).

DATA AND DEFINITIONS
7
and 89 percent of middle- and high-SES students.15 Thus, socioeconomic group differences in
student aspirations emerge well before students begin high school.
For this analysis, students’ tenth-grade aspirations signal the starting point of the pipeline to
college. Tenth-grade aspirations were chosen over those reported either in the eighth grade or the
twelfth grade because in tenth grade students probably have a better idea of what it takes to pre-
pare for college than they do in eighth grade, and unlike twelfth graders, they still have time to
take the classes required to enroll.
Step 2: Academic Preparation
Obviously, if students are not prepared academically for further education, it is highly un-
likely that they will advance to higher education immediately after high school. To identify stu-
dents who are academically prepared to enroll in college, this study draws upon recent research
conducted by Berkner and Chavez (1997). Their study addressed the issue of college access and
choice especially for low-income and racial–ethnic minority students.16 In doing so, they devel-
oped an index that identifies whether or not students are “qualified” for admission to a four-year
college. The index is a composite measure of academic qualification based on several criteria in-
cluding rank in class, ACT/SAT scores, high school grades, and the 1992 NELS math and reading
test composites. Minimal qualification was based on meeting at least one of the following criteria:
ranked at the 54th percentile or higher in graduating class; a grade point average of at least 2.7 in
academic courses; a combined SAT score of 820 or higher (or ACT score of 19 or higher); and a
score at the 56th percentile or higher on the 1992 NELS math and reading composite test. Stu-
dents who met or surpassed any one of these criteria were identified as being at least minimally
prepared academically for college enrollment. If a student did not meet the minimal academic cri-
teria, but had enrolled in a four-year college, the student was also classified as academically pre-
pared (about 10 percent of enrollees).17
Steps 3 and 4: Entrance Exams and College Application
One of the most crucial junctures in the transition from high school to college, especially for
students who are at least minimally prepared academically, is making the necessary preparations.
15Ibid.16L. Berkner and L. Chavez, Access to Postsecondary Education for the 1992 High School Graduates (NCES 98-105) (Wash-ington, D.C.: U.S. Department of Education, National Center for Education Statistics, 1998).17This coding differs from the Berkner and Chavez report, which characterized these students as marginally or not qualified.

DATA AND DEFINITIONS
8
Most of these students would be accepted to at least one four-year college if they took entrance
exams and applied.18
Step 5: Enrollment
Taking the necessary steps to apply to a postsecondary institution does not necessarily guar-
antee admittance and matriculation, however. A student must meet the qualifications of the spe-
cific institution(s) to which he or she applied and have the resources to attend. Presumably most
of those who were not accepted did not meet the requirements for admission. This analysis is lim-
ited to the first postsecondary enrollment, if any, in determining enrollment in a four-year college.
COMPARISONS WITHIN THE AT-RISK POPULATION
The second part of the analysis is concerned with distinguishing at-risk students who navi-
gated the pipeline to a four-year college from their peers who did not. The following describes the
three areas in which they are compared.
Math Course Taking
The sequence of math courses students take in high school may greatly influence their future
opportunities to enroll in higher education.19 Certain math classes are considered “gatekeeping”
courses both for enrollment in four-year colleges and for entering quantitative fields of study.20
Most universities require applicants to take three years of high school math including algebra I
and II and geometry. In addition, calculus is greatly encouraged and is also a prerequisite for math
and science majors.21 To examine the math course taking of at-risk youth who enrolled in college
with their counterparts who did not, this study used a course level index based on the NELS high
school transcript data. University of Michigan researchers originally constructed the index to de-
termine the highest sequence of math courses that students completed in high school.22 The index
is aggregated to four levels of course taking: low level (including no math, nonacademic or low-
academic courses); middle level (at least two years including algebra I and geometry); high level
18L. Berkner and L. Chavez, 1998.19D.L. Stevenson, K.S. Schiller, and B. Schneider, “Sequences of Opportunities for Learning,” Sociology of Education 67(1994): 184–189.20J. Oakes, Multiplying Inequalities (R-3928-NSF) (Santa Monica, CA: RAND, 1990).21Ibid.22D.T. Burkham, V.E. Lee, and B.A. Smerdon, Mathematics Coursetaking and the NELS:88 Transcript Data, unpublishedreport for NCES, 1996.

DATA AND DEFINITIONS
9
(completed algebra II); and advanced course taking (completed algebra III, calculus, trigonome-
try, analytic geometry, or other advanced courses).23
School Assistance With the College Application Process
At-risk students are often the first generation in their family to attend college. For example,
about one-third of students at risk had parents who completed no more than a high school educa-
tion, compared with one in twelve of students not at risk.24 Thus, for a substantial proportion of
at-risk students, there may be no one in their family who has had firsthand experience in applying
to college. These students are more dependent on schools and teachers for obtaining information
and getting help with the application process. To determine if there were differences in the way
at-risk students with different postsecondary enrollment outcomes prepared for applying to col-
lege, comparisons were made in the rates at which students in different outcome groups reported
taking a special course offered by the school to prepare for entrance exams, and receiving help
from their school or teachers in filling out college applications. Both preparation steps were re-
ported by the students in 1992, when most were in the twelfth grade.
Engagement Activities
How engaged students are in their high school life and how involved their parents are in
promoting learning activities are strong indicators of students’ likelihood of graduating from high
school.25 In Chen and Kaufman’s study, several indicators measuring student engagement, parent
involvement, and peer association were found to increase students’ odds of graduating from high
school.26 In this study, these indicators (described below) were used to compare the levels of en-
gagement reported by at-risk youth with different postsecondary enrollment outcomes.
Student Engagement
Student engagement was analyzed in two ways: first, by determining the level of high school
attendance reported by students, and second, by identifying the number of extracurricular activi-
ties in which students had participated. The level of attendance is a composite variable based on
several items asking students to report on how many times they had been late for school, skipped
23In determining the extent of math course taking, the sample was limited to students who had all four years of their transcriptsavailable (about 65 percent) (NELS:88/94 Data Analysis System).24See table 4.25X. Chen and P. Kaufman, “Risk and Resilience”; and L. J. Horn and J. West, A Profile of Parents of Eighth Graders (NCES92-488) (Washington D.C.: U.S. Department of Education, National Center for Education Statistics, 1992).26Ibid.

DATA AND DEFINITIONS
10
school, or been absent. The extent of their participation in extracurricular activities was an item
that directly asked students about their activities in various areas such as student government,
band, service clubs, and so on. Both sets of questions were asked in 1990.
Parent Engagement
Parent engagement is based on parents’ responses to questions asking how involved they
were in their teens’ schooling (asked in 1992) and what their expectations were for their teens’
future education (asked in 1990). The involvement indicator is a composite based on several items
asking parents to report on the frequency with which they discussed the following with their child:
the selection of high school courses, school activities of particular interest to their child, things
their child has studied in class, plans for taking entrance exams, and applying to college after high
school.
Peer Engagement
Two measures of peer engagement were used to determine the extent to which students’
friends were involved in school. First, students reported on the importance that their friends at-
tributed to various learning activities (asked in 1990), and second, they reported on the number of
their friends who planned to attend a four-year college (asked in 1992). The learning activities
indicator was based on several items that asked students how important their friends thought the
following activities were: attending classes, studying, getting good grades, finishing high school,
and continuing their education after high school graduation.

11
OVERVIEW OF STUDENTS AT RISK
DISTRIBUTION OF RISK FACTORS
Among all 1992 high school graduates, more than half (58 percent) had at least one risk
factor that increased their chances of dropping out of high school (table 1). Approximately one-
third (32 percent) had one risk factor, 16 percent had two, and 9 percent had three or more.
Table 1—Risk status of 1992 high school graduates: total percentage with any risk factors, with each risk Table 1—factor, the percentage distribution by number of risk factors, and the average number of risk Table 1—factors among all high school graduates
Percentage distribution Average Percentage One Two Three number of at risk risk or risk risk factor factors more factors
Total 57.8 32.2 16.3 9.3 1.7
Percent witheach risk
Individual Risk Factors factor Changed schools two or more times from 1st to 8th grade (other than natural progression) 26.8 46.8 29.9 23.3 1.9 Lowest SES quartile* 18.2 31.1 34.1 34.7 2.2
Average grades C’s or lower from 6th to 8th grade 16.7 31.2 36.3 32.5 2.2
Single parent family 15.3 32.7 34.1 33.3 2.2
Older sibling(s) dropped out of high school 11.2 22.6 35.5 41.9 2.4
Held back one or more grades from 1st to 8th grade 11.2 19.9 38.7 41.4 2.4
*SES quartiles were determined for all 1988 eighth graders. The group represented in this table are 1992 high school grad-uates, who are less likely to be in the lowest SES quartile, which is why the proportion is 18 percent instead of 25 percent.
SOURCE: U.S. Department of Education, National Center for Education Statistics, National Education LongitudinalStudy (NELS:88/94), Data Analysis System.

OVERVIEW OF STUDENTS AT RISK
12
Changing schools two or more times was the most common risk factor: 27 percent of 1992
high school graduates had done so by the eighth grade. For the remaining risk factors, 18 percent
of high school graduates were from families in the lowest SES quartile;27 17 percent had grades of
C’s or lower from sixth to eighth grade; 15 percent were from single parent families; 11 percent
had older siblings who had dropped out of high school; and 11 percent were held back a grade.
Among all 1992 high school graduates, the average number of risk factors was about 1.7.
Students who were held back or who had siblings who dropped out of high school tended to have
more risk factors on average (2.4) than those with other risk factors (1.9 to 2.2).
When high school graduates had only one risk factor, it was most likely changing schools
two or more times: 39 percent of those with one risk factor had done so (table 2). Relatively
fewer (15 to 17 percent) were from low-SES families, had grades of C’s or lower, or lived in sin-
gle parent families. About 7 and 8 percent, respectively, of students with one risk factor were held
back a grade or had an older sibling who had dropped out of school.
DEMOGRAPHIC COMPOSITION
Students at risk were more likely to be Hispanic or black, non-Hispanic (12 percent and 14
percent, respectively) than students not at risk (5 percent each were either Hispanic or black) (ta-
ble 3). Moreover, the proportion of black students among those at high risk (three or more risk
factors) was much higher than the proportion among lower risk students (one risk factor) (22 ver-
sus 10 percent). The same was not true of Hispanic students, however; their representation did
not change appreciably among the three risk groups (11 to 14 percent). The proportion of
Asian/Pacific Islander students and American Indian/Alaskan Native students was also similar at
all three levels of risk.
One reason for the relatively high proportion of black students among high-risk students
relative to their Hispanic peers was their likelihood of being from a single parent family. One-
quarter of students from single parent homes were black, compared with 9 percent of their coun-
terparts who were Hispanic.
Having parents who completed no more than a high school education was far more common
among students at risk (35 percent) than it was for those not at risk (12 percent) (table 4). Fur-
27The SES quartiles were calculated for the entire eighth-grade cohort. High school graduates were less likely to fall into thelowest quartile, which is why the proportion is less than 25 percent.

OVERVIEW OF STUDENTS AT RISK
13
thermore, as the number of risk factors increased, so did the proportion of students whose parents
had no more than a high school education.
Table 2—Percentage of 1992 high school graduates with each risk factor, by number of risk factors and all Table 2—other risk factors
Changed schools Average Older Held back two or more grades C’s sibling(s) one or more times from Lowest or lower from Single dropped grades from
1st to 8th SES 6th to 8th parent out of 1st to 8thgrade quartile grade family high school grade
Total 26.8 18.2 16.7 15.3 11.2 11.2 Number of risk factors Any risk factors 46.2 30.6 28.7 26.1 19.2 19.5 One risk factor 38.7 17.1 16.1 15.3 7.8 6.9 Two risk factors 49.6 37.1 37.0 31.7 24.4 26.9 Three or more 66.4 66.0 57.9 54.0 48.7 51.2 Number of school changes from 1st to 8th grade Two or more times 100.0 18.8 20.3 19.2 14.6 16.6 Less than two 0.0 16.9 15.0 13.6 9.4 8.7 SES in 1988 Lowest quartile 29.0 100.0 26.1 25.0 24.4 20.3 Middle to high quartiles 26.3 0.0 14.7 13.1 8.1 9.3 Average grades from 6th to 8th grade C’s or lower 33.0 28.1 100.0 21.1 16.6 23.2 A’s or B’s 25.5 16.0 0.0 14.1 9.8 8.8 Family composition in 1988 Single parent family 34.0 29.7 23.2 100.0 17.4 17.4 Other than single parent 25.5 16.1 15.6 0.0 9.8 10.1 Older siblings who left high school One or more 35.0 38.8 24.7 23.8 100.0 20.8 None left or no siblings 24.6 14.8 15.2 13.9 0.0 9.6 Ever held back 1st to 8th grade Held back at least once 40.8 31.3 33.1 23.1 20.4 100.0 Not held back 24.9 15.5 13.7 13.8 9.5 0.0
SOURCE: U.S. Department of Education, National Center for Education Statistics, National Education LongitudinalStudy (NELS:88/94), Data Analysis System.

OVERVIEW OF STUDENTS AT RISK
14
Table 3—Percentage distribution of 1992 high school graduates according to race–ethnicity, by number Table 3—of risk factors and individual risk factors
Race–ethnicity American Asian/ Indian/ Pacific Black, White, Alaskan Islander* Hispanic* non-Hispanic non-Hispanic Native*
Total 4.6 9.5 10.9 74.1 1.0 Risk status No risk factors 3.7 4.8 5.4 85.4 0.7 Any risk factors 3.9 11.6 13.5 70.1 1.0 One risk factor 4.4 10.8 9.8 74.3 0.7 Two risk factors 3.3 11.9 16.0 67.6 1.3 Three or more 3.1 13.7 21.9 60.2 1.2 Individual Risk Factors
SES in 1988 Lowest quartile 3.2 21.7 20.1 53.7 1.3 Middle to high quartiles 4.1 6.2 8.1 80.8 0.8 Family composition in 1988 single parent family 1.7 8.6 24.1 64.5 1.1 Other than single parent 4.3 9.0 7.9 78.1 0.9 Number of older siblings who left high school One or more 4.0 13.0 14.3 67.5 1.3 None left or no siblings 4.0 7.8 9.3 78.1 0.8 Number of school changes from 1st to 8th grade Two or more times 5.6 10.2 12.2 71.1 0.9 Less than two 3.2 7.6 9.2 79.3 0.7 Average grades from 6th to 8th grade C’s or lower 3.1 10.8 11.9 72.9 1.3 A’s or B’s 4.0 8.5 10.0 76.7 0.8 Ever held back 1st to 8th grade Held back at least once 3.2 11.0 15.7 68.7 1.4 Not held back 4.0 8.5 8.6 78.2 0.8
*Some of the row percentages do not include the total percentage within their range (e.g., 3.7 and 3.9 percent of Asian/Pacific Islanders with no risk factors and any factors respectively, does not include the total of 4.6 percent) because there is a greater proportion missing for the row variables than for the total.
NOTE: Details may not sum to 100 percent because of rounding.
SOURCE: U.S. Department of Education, National Center for Education Statistics, National Education LongitudinalStudy (NELS:88/94), Data Analysis System.

OVERVIEW OF STUDENTS AT RISK
15
Table 4—Percentage distribution of 1992 high school graduates according to parents’ highest educationalTable 4—attainment, by number of risk factors and individual risk factors
Parents’ highest education*Bachelor's
High Some degree school postsecondary or or less education higher
Total 26.5 41.0 32.5 Risk factors No risk factors 11.8 41.9 46.4 Any risk factors 34.9 41.4 23.6 One risk factor 24.9 43.0 32.1 Two risk factors 42.6 41.0 16.4 Three or more 57.5 36.3 6.2 Individual Risk Factors
SES in 1988 Lowest quartile 76.1 23.6 0.3 Middle to high quartiles 13.7 45.7 40.7 Family composition in 1988 Single parent family 37.3 43.3 19.4 Other than single parent 23.1 41.2 35.7 Number of older siblings who left high school One or more 42.9 43.6 13.5 None left or no siblings 23.7 40.3 36.0 Number of school changes from 1st to 8th grade Two or more times 23.1 42.8 34.1 Less than two 24.9 41.5 33.6 Average grades from 6th to 8th grade C’s or lower 37.8 46.0 16.2 A’s or B’s 22.7 40.7 36.6 Ever held back 1st to 8th grade Held back at least once 36.8 44.5 18.8 Not held back 23.0 41.4 35.6
*Some of the row percentages do not include the total percentage within their range because there is a greater proportion ofmissing cases for the row variables than for the total.
NOTE: Details for percentage distribution may not sum to 100 percent because of rounding.
SOURCE: U.S. Department of Education, National Center for Education Statistics, National Education LongitudinalStudy (NELS:88/94), Data Analysis System.

OVERVIEW OF STUDENTS AT RISK
16
POSTSECONDARY ENROLLMENT
By 1994, nearly two-thirds (64 percent) of students with no risk factors had enrolled in a
four-year college, compared with about one-third (35 percent) of at-risk students (table 5). Stu-
dents at risk enrolled in public two-year institutions at slightly higher rates than did their counter-
parts not at risk (27 percent versus 22 percent); however, they were much more likely not to
enroll in any postsecondary education by 1994 (32 percent versus 12 percent) than students not at
risk.
The postsecondary enrollment outcomes of students with each individual risk factor com-
pared with those without the risk factor is also shown in table 5. For all six risk indicators, stu-
dents with the risk factor were less likely to enroll in a four-year college and more likely not toenroll in postsecondary education.28
While these outcomes are consistent with earlier studies, the specific question for this analy-
sis concerns students who had both college aspirations and were at least minimally prepared aca-
demically to attend. Specifically, if students at risk entered the four-year college pipeline and
made the necessary preparations to go to college, were they still less likely than those not at risk
to enroll in a four-year college?
28It is also true that students with each risk factor generally have more than one risk factor (see table 1). However, a linearregression model also found a significant negative effect on enrolling in a four-year college for each risk factor independent ofall others (see appendix table C1). On the other hand, when the outcome was expanded to include enrollment in any post-secondary education (4-year, 2-year, or less-than-2-year institutions), the effect of living in a single parent home on the likeli-hood of enrolling was actually positive (appendix table C2). Changing schools two or more times had no effect and all othershad a significantly negative effect on enrollment in any postsecondary education.

OVERVIEW OF STUDENTS AT RISK
17
Table 5—Percentage distribution of 1992 high school graduates according to the first postsecondary institu-Table 5—tion attended, by number of risk factors and individual risk factors
Type of institution first enrolled Other Public less-than-
4-year 2-year 4-year Neverinstitution institution* institution enrolled
Total 45.1 25.7 4.4 24.8 Risk factors No risk factors 63.5 21.9 2.4 12.2 Any risk factors 35.0 27.3 5.7 32.0 One risk factor 45.1 26.0 5.2 23.8 Two risk factors 27.0 28.4 5.9 38.7 Three or more 14.0 29.7 7.1 49.2 Individual Risk Factors
SES in 1988 Lowest quartile 21.7 25.2 6.3 46.8 Middle to high quartiles 52.1 25.2 3.9 18.8 Family composition in 1988 Single parent family 38.6 28.1 4.7 28.7 Other than single parent 48.3 24.5 4.3 22.9 Number of older siblings who left high school One or more 25.7 28.7 5.5 40.1 None left or no siblings 49.8 24.8 4.2 21.2 Number of school changes from 1st to 8th grade Two or more times 39.8 28.0 6.1 26.1 Less than two 50.0 24.1 3.6 22.3 Average grades from 6th to 8th grade C’s or lower 16.3 29.8 7.7 46.2 A’s or B’s 52.8 24.2 3.7 19.3 Ever held back 1st to 8th grade Held back at least once 20.6 30.0 5.3 44.2 Not held back 51.2 24.4 4.1 20.3
*Some of the row percentages do not include the total percentage within their range because there is a greater proportion ofmissing cases for the row variables than for the total.
NOTE: Details for percentage distribution may not sum to 100 percent because of rounding.
SOURCE: U.S. Department of Education, National Center for Education Statistics, National Education LongitudinalStudy (NELS:88/94), Data Analysis System.


19
PIPELINE TO A FOUR-YEAR COLLEGE
The pipeline to college consists of five sequential steps leading to college enrollment. There
is an implicit assumption that each step in the pipeline is essential for college enrollment. How-
ever, the analysis showed that there was an exception to this assumption. Five percent of high
school graduates who enrolled in a four-year college did not have a bachelor’s degree goal in the
tenth grade, but completed the remaining four pipeline steps to enrollment.29 Presumably, these
students changed their minds about pursuing a college education after they had reported their
tenth-grade aspirations. However, there was no difference in risk status among students who fol-
lowed this pattern: at-risk students were just as likely as those not at risk to do so. Virtually all
other students who enrolled in a four-year college completed all five steps of the pipeline.30 Figure
1 and table 6 illustrate these students’ sequential progress through the pipeline to college.
The proportion of students at each step is based on those who successfully completed all the
preceding steps. For example, the proportion in step 2 are students who had both a bachelor’s de-
gree goal in the tenth grade (step 1) and were at least minimally prepared academically to attend a
four-year college (step 2); those in step 3 are students who had a bachelor’s degree goal (step 1),
were minimally prepared (step 2), and took college entrance exams (step 3); and so on.
The first two steps of the pipeline are clearly the junctures where most at-risk students leave
the pipeline relative to students not at risk. About 56 percent of at-risk students entered the pipe-
line by aspiring to a bachelor’s degree in the tenth grade, compared with 81 percent of those not
at risk. Similarly, the proportion of at-risk students who progressed from having a bachelor’s de-
gree goal to being at least minimally prepared academically to attend a four-year college (44 per-
cent) was much lower than the proportion of students not at risk (75 percent).
One might expect at-risk students who had a bachelor’s degree goal and who had performed
well enough in school to at least minimally prepare themselves academically to enroll in a four-
year college, to progress through the rest of the pipeline at similar rates as students not at risk.
However, this was not the case (figure 2). While the proportions who were lost in steps 3 to 5
were relatively small compared with those lost in step 1, at-risk students were much less likely
29NELS:88/94 Data Analysis System.30There were a few instances where students who enrolled in a four-year college did not report taking entrance exams (0.5percent); they were recoded as having done so (NELS:88/94 Data Analysis System).

PIPELINE TO A FOUR-YEAR COLLEGE
20
than those who were not at risk to take step 3 (entrance exams) (9 percent did not take exams
versus 3 percent); and if they took entrance exams, they were less likely to apply to college than
those not at risk (13 percent did not apply versus 9 percent).
Table 6—Percentage of 1992 high school graduates who progressed through each step in the pipeline Table 6—to enrollment in a 4-year institution by 1994,
1 by risk status
2
Step 1 Step 2 Step 3 Step 4 Step 510th-grade At least Enrolled
bachelor’s minimally Applied in 4-year degree prepared Took SAT to 4-year institution
aspirations academically3 and/or ACT institution by 19944
Total 65.8 55.5 52.4 46.7 40.3 Risk Status2
No risk factors 80.8 74.7 72.6 65.9 58.1 Any risk factors 55.7 44.2 40.3 35.0 29.5 One risk factor 63.9 54.5 51.1 44.8 39.3 Two risk factors 48.9 35.7 30.9 26.0 21.2 Three or more 38.8 23.0 18.8 16.2 9.7 1To be included in the second through fifth columns, students must have been included in all previous columns.2Risk factors include low SES quartile, average grades of C’s or lower from sixth to eighth grade, changed schools twoor more times (other than natural progression), lived in a single parent family in eighth grade, had one or more oldersiblings who dropped out of high school, or held back a grade by 1988.3Based on an index that measures the probability of being academically qualified for a 4-year college. A student is considered minimally prepared if he or she met at least one of the following five criteria: ranked at or above the 54th percentile in one’s class, had a GPA of 2.7 or higher in academic courses, had a combined SAT score of 820 or above (or ACT composite of 19 or higher), or scored at the 56th percentile or above on the 1992 NELS math and reading composite aptitude test.4Percentages differ from table 5 because the students who did not have a bachelor’s degree goal in the 10th grade (i.e., did not complete step 1) are not included (5 percent).
SOURCE: U.S. Department of Education, National Center for Education Statistics, National Education LongitudinalStudy (NELS:88/94), Data Analysis System.
With respect to completing the pipeline, the proportion of at-risk students and those not at
risk who completed all previous steps but did not enroll in a four-year college also differed (16
percent versus 12 percent). However, this may be attributed to the difference in college accep-
tance rates: 92 percent of at-risk students who completed the four steps of the pipeline leading up

PIPELINE TO A FOUR-YEAR COLLEGE
21

PIPELINE TO A FOUR-YEAR COLLEGE
22

PIPELINE TO A FOUR-YEAR COLLEGE
23
to enrollment were accepted by at least one institution, compared with 97 percent of those not at
risk.31
OUTCOMES OF STUDENTS NOT ADVANCING THROUGH THE PIPELINE
Among 1992 high school graduates who took no pipeline steps (i.e., they never aspired to a
bachelor’s degree and took no other pipeline steps), students at risk had outcomes similar to those
not at risk (table 7). As of 1994, 21 and 23 percent, respectively, enrolled in a public two-year
college; 8 percent and 9 percent, respectively, enrolled in other less-than-four-year institutions,
and 71 percent and 68 percent, respectively, had not enrolled in postsecondary education.
On the other hand, among students who took any steps in the pipeline,32 those at risk were
less likely than those not at risk to enroll in public two-year colleges (50 percent versus 65 per-
cent) and were no more likely to enroll in other postsecondary education (table 7). Even when
controlling for academic preparation, a difference was found between at-risk students and those
not at risk in the proportion enrolled in public two-year colleges: 46 percent compared with 57
percent enrolled among academically prepared students and 52 percent compared with 68 percent
enrolled among those not academically prepared.
POSTSECONDARY PERSISTENCE INDICATORS
The analysis thus far has examined the postsecondary enrollment patterns of 1992 high
school graduates. However, enrollment does not necessarily guarantee that students will persist to
degree attainment. Therefore, it is useful to examine indicators of postsecondary persistence to
determine if students at risk differ from their counterparts not at risk in this respect. To this end,
students were identified according to postsecondary enrollment patterns that have been shown to
reduce students’ chances of completing a degree. These indicators include delaying postsecondary
education by a year or more after high school graduation, beginning postsecondary education on a
part-time basis, or not attending continuously from the time of enrollment (i.e.,
31Note that once students were accepted, those at risk were as likely to enroll as those not at risk (about 91 percent). Estimatestaken from the NELS:88/94 Data Analysis System.32This includes students who took any of the four steps in the pipeline regardless of the sequence. Appendix table C3 showsthe percentage of students for all the different combinations of steps taken among those who did not enroll in a four-year col-lege.

PIPELINE TO A FOUR-YEAR COLLEGE
24
stopping for four or more months).33 Students who exhibited none of these enrollment behaviors
(i.e., they enrolled full time within a year of high school graduation and attended continuously)
were identified as having strong persistence indicators.
Table 7—Percentage distribution of 1992 high school graduates who did not enroll in a 4-year college byTable 7—1994 according to their postsecondary education enrollment, by pipeline status, risk status,Table 7—and academic preparation
1
Enrolled Enrolled in in other public less-than- 2-year 4-year Never institution institution enrolled
Total 46.9 8.0 45.2
College pipeline status No risk factors2
Took no pipeline steps 22.9 9.4 67.7 Took any steps 65.4 6.6 28.1 Not academically prepared 67.9 6.2 25.8 Academically prepared 56.6 7.6 35.8
One or more risk factors2
Took no pipeline steps 21.3 8.0 70.7 Took any steps 50.3 8.9 40.8 Not academically prepared 51.8 8.2 39.9 Academically prepared 45.8 10.8 43.4 1Based on an index that measures the probability of being academically qualified for a 4-year college. A student is considered minimally prepared if he or she met at least one of the following five criteria: ranked at or above the 54th percentile in one’s class, had a GPA of 2.7 or higher in academic courses, had a combined SAT score of 820 or above (or ACT composite of 19 or higher), or scored at the 56th percentile or above on the 1992 NELS math and reading composite aptitude test.2Risk factors include low SES quartile, average grades of C’s or lower from sixth to eighth grade, changed schools twoor more times (other than natural progression), lived in a single parent family in eighth grade, had one or more oldersiblings who dropped out of high school, or held back a grade by 1988.
NOTE: Details may not sum to 100 percent because of rounding.
SOURCE: U.S. Department of Education, National Center for Education Statistics, National Education LongitudinalStudy (NELS:88/94), Data Analysis System.
33See, for example, L. Berkner, S. Cuccaro-Alamin, and A. McCormick, Descriptive Summary of 1989–90 Beginning Post-secondary Students: 5 Years Later (NCES 96-155) (Washington D.C.: U.S. Department of Education, National Center for Edu-cation Statistics, 1996); or L. Horn, Nontraditional Undergraduates: Trends in Enrollment from 1986 to 1992 and Persistenceand Attainment Among 1989–90 Beginning Postsecondary Students (NCES 96-578) (Washington D.C.: U.S. Department ofEducation, National Center for Education Statistics, 1996).

PIPELINE TO A FOUR-YEAR COLLEGE
25
The results indicate that at-risk students were less likely to exhibit strong persistence indi-
cators than students not at risk. This was true for students enrolled in either a four-year college or
a public two-year institution (table 8): 72 percent of at-risk students who enrolled in a four-year
college by 1994 exhibited strong persistence indicators, compared with 81 percent of students not
at risk; 34 percent of at-risk students who enrolled in a public two-year college exhibited strong
persistence indicators, compared with 48 percent of students not at risk. Similar differences were
not found, however, for students who enrolled in other forms of postsecondary education (39
percent and 43 percent, respectively).
Table 8—Among 1992 high school graduates who enrolled in postsecondary education by 1994, theTable 8—percentage who had strong persistence indicators,
1 by risk status
2 and type of first institutionTable 8—
Percent with strong persistence indicatorsNo risk One or morefactors risk factors
Total 71.0 53.0
Type of first postsecondary institution 4-year 81.2 72.0 Public 2-year 47.5 34.0 Other less-than-4-year 42.5 38.8 1Enrolled full time within one year of high school graduation and attended continuously from time of enrollment.2Risk factors include low SES quartile, average grades of C’s or lower from sixth to eighth grade, changed schools twoor more times (other than natural progression), lived in a single parent family in eighth grade, had one or more oldersiblings who dropped out of high school, or held back a grade by 1988.
SOURCE: U.S. Department of Education, National Center for Education Statistics, National Education Longitudinal Study (NELS:88/94), Data Analysis System.


27
COMPARISONS AMONG AT-RISK STUDENTS
The results of the pipeline analysis indicate that at-risk students who graduate from high
school, despite having characteristics associated with dropping out, remain at risk with respect to
gaining access to higher education relative to their counterparts not at risk. Furthermore, once
enrolled, students at risk are less likely to exhibit strong persistence indicators. Nevertheless,
about one-third of 1992 high school graduates at risk succeeded in preparing for and enrolling in a
four-year college. How do these at-risk students differ from their peers who did not enroll in any
postsecondary education or who enrolled in less-than-four-year institutions? The remainder of this
report will address this question.
NUMBER OF RISK FACTORS
The level of risk experienced by high school graduates was strongly linked to their chances
of progressing through the pipeline to college. As shown in figure 3, students with only one risk
factor were much more likely to progress through the college pipeline than those with two risk
factors (39 versus 21 percent). Likewise, those with two risk factors (21 percent) were more
likely than students with three or more risk factors (10 percent) to do the same.
Large differences between students at lower risk and those at high risk appeared at steps 1
and 2 of the pipeline: educational aspirations and academic preparation. For example, about two-
thirds (64 percent) of students at relatively low risk (one risk factor) had a bachelor’s degree goal
in tenth grade, compared with just over a third (39 percent) of students at high risk (three or more
risk factors).
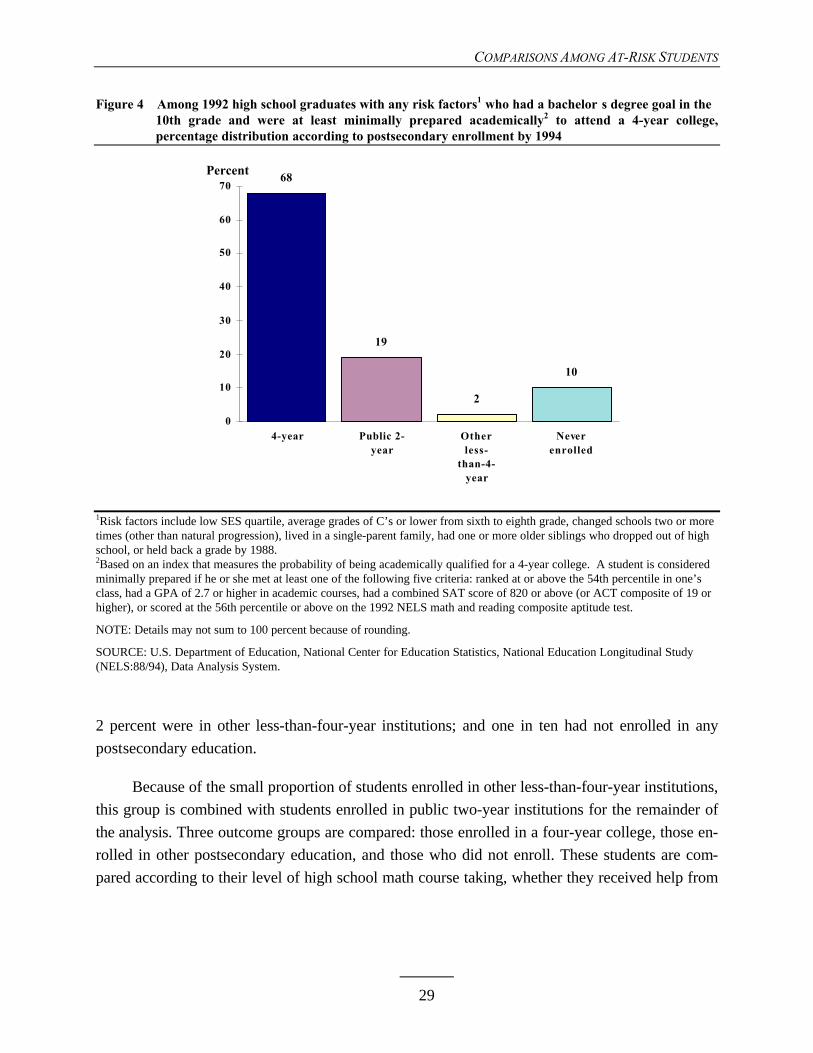
In order to minimize the differences associated with level of risk, the remainder of thisanalysis focuses only on at-risk students who completed steps 1 and 2 of the pipeline. Thus, com-parisons are limited to at-risk students who had aspired to earn a bachelor’s degree and were atleast minimally prepared academically to enroll in a four-year college. Just under half (44 percent)of at-risk students progressed this far in the pipeline (figure 1). Their postsecondary enrollmentoutcomes are shown in figure 4. As of 1994, about two-thirds (68 percent) had enrolled in a four-year college; one in five (19 percent) had enrolled in a public two-year institution;

COMPARISONS AMONG AT-RISK STUDENTS
28
COMPARISONS AMONG AT-RISK STUDENTS
29
Figure 4—Among 1992 high school graduates with any risk factors1 who had a bachelor’s degree goal in the 10th grade and were at least minimally prepared academically2 to attend a 4-year college,percentage distribution according to postsecondary enrollment by 1994
68
19
2
10
0
10
20
30
40
50
60
70
4-year Public 2-year
Otherless-
than-4-year
Neverenrolled
Percent
1Risk factors include low SES quartile, average grades of C’s or lower from sixth to eighth grade, changed schools two or moretimes (other than natural progression), lived in a single-parent family, had one or more older siblings who dropped out of highschool, or held back a grade by 1988.2Based on an index that measures the probability of being academically qualified for a 4-year college. A student is consideredminimally prepared if he or she met at least one of the following five criteria: ranked at or above the 54th percentile in one’sclass, had a GPA of 2.7 or higher in academic courses, had a combined SAT score of 820 or above (or ACT composite of 19 orhigher), or scored at the 56th percentile or above on the 1992 NELS math and reading composite aptitude test.
NOTE: Details may not sum to 100 percent because of rounding.
SOURCE: U.S. Department of Education, National Center for Education Statistics, National Education Longitudinal Study(NELS:88/94), Data Analysis System.
2 percent were in other less-than-four-year institutions; and one in ten had not enrolled in any
postsecondary education.
Because of the small proportion of students enrolled in other less-than-four-year institutions,
this group is combined with students enrolled in public two-year institutions for the remainder of
the analysis. Three outcome groups are compared: those enrolled in a four-year college, those en-
rolled in other postsecondary education, and those who did not enroll. These students are com-
pared according to their level of high school math course taking, whether they received help from

COMPARISONS AMONG AT-RISK STUDENTS
30
their school in the college application process, and according to the level of engagement exhibited
by students, their parents, and their peers.
MATH COURSE TAKING
A majority of at-risk students who aspired to a bachelor’s degree and were at least mini-
mally prepared academically to enroll in a four-year college had completed the “gatekeeping” se-
quence of high school math courses: 32 percent had completed courses through algebra II and
another 54 percent had completed at least one advanced math class (table 9).
There were clear differences, however, between students who enrolled in a four-year college
and those who enrolled in other postsecondary education or who did not enroll with respect to the
level of math courses completed. For example, about two-thirds (64 percent) of those who en-
rolled in a four-year college completed at least one advanced math course, compared with about
one-third who enrolled in other postsecondary education or who did not enroll at all (36 and 31
percent, respectively). There were no measurable differences in the proportion of students taking
advanced math courses, on the other hand, between those enrolled in less-than-four-year institu-
tions and those who did not enroll.
RECEIVED HELP FROM THE SCHOOL WITH THE POSTSECONDARY
APPLICATION PROCESS
Since at-risk students are much more likely to be the first in their family to go to college
than students not at risk, the school is an important source of information and assistance in mak-
ing the transition to college. Roughly half (52 percent) of the at-risk students who had a bache-
lor’s degree goal and were at least minimally prepared academically to enroll in a four-year
college reported receiving help from their school with filling out their postsecondary application
(for all postsecondary institutions) (table 10). However, those who enrolled in a four-year college
were more likely to report receiving such help (56 percent) than either those who enrolled in less-
than-four-year institutions (44 percent) or those who had never enrolled (43 percent).
Students with different postsecondary outcomes did not differ substantially, however, with
regard to taking a special course offered by the school to help them prepare for the college en-
trance exams: 21 percent of students enrolled in a four-year college, 16 percent of those enrolled
in other postsecondary education, and 18 percent who did not enroll reported taking such a
course.

COMPARISONS AMONG AT-RISK STUDENTS
31
Table 9—Among 1992 high school graduates with one or more risk factors1 who had a bachelor’s degree
Table 9—goal in the 10th grade and were at least minimally prepared academically to enroll in a 4-yearTable 9—college,
2 the percentage distribution according to the highest level of math courses completed in
Table 9—high school, by type of first postsecondary institution
No math/ Algebra l Calculusnon academic or and and/or other
low academic courses geometry Algebra ll advanced classes
Total 1.6 12.6 32.3 53.5
Type of first postsecondary institution 4-year 1.5 7.5 26.5 64.4 Less-than-4-year 0.2 19.3 44.3 36.2 Not enrolled 4.5 26.2 38.2 31.21Risk factors include low SES quartile, average grades of C’s or lower from sixth to eighth grade, changed schools two ormore times (other than natural progression), lived in a single parent family in eighth grade, had one or more older siblingswho dropped out of high school, or held back a grade by 1988.2Based on an index that measures the probability of being academically qualified for a 4-year college. A student is considered minimally prepared if he or she met at least one of the following five criteria: ranked at or above the 54th percentile in one’s class, had a GPA of 2.7 or higher in academic courses, had a combined SAT score of 820 or above (or ACT composite of 19 or higher), or scored at the 56th percentile or above on the 1992 NELS math and reading composite aptitude test.
NOTE: Details may not sum to 100 percent because of rounding.
SOURCE: U.S. Department of Education, National Center for Education Statistics, National Education LongitudinalStudy (NELS:88/94), Data Analysis System.
STUDENT, PARENT, AND PEER ENGAGEMENT
The following analysis attempts to discern the relationship between different postsecondary
enrollment outcomes and engagement indicators that are strong predictors of high school gradua-
tion.34 Specifically, it addresses whether engagement indicators associated with successfully com-
pleting high school facilitate the transition from high school to college enrollment among at-risk
high school graduates who aspired to a bachelor’s degree goal and who were at least minimally
prepared to enroll in a four-year college.
34Chen and Kaufman, “Risk and Resilience.”

COMPARISONS AMONG AT-RISK STUDENTS
32
Table 10—Among 1992 high school graduates with one or more risk factors1 who had a bachelor’s
Table 10—degree goal in the 10th grade and were at least minimally prepared academically to enroll Table 10—in a 4-year college,
2 the percentage who reported receiving help from their school in prepar-
Table 10—ing postsecondary education applications, by type of first postsecondary institution
Student received help from school in application process
Received Took special class help filling out to prepare for application entrance exam
Total 51.8 19.8 Type of first postsecondary institution 4-year 56.2 21.2 Less-than-4-year 44.2 16.1 Not enrolled 42.9 18.01Risk factors include low SES quartile, average grades of C’s or lower from sixth to eighth grade, changed schools twoor more times (other than natural progression), lived in a single parent family in eighth grade, had one or more oldersiblings who dropped out of high school, or held back a grade by 1988.2Based on an index that measures the probability of being academically qualified for a 4-year college. A student is considered minimally prepared if he or she met at least one of the following five criteria: ranked at or above the 54th percentile in one’s class, had a GPA of 2.7 or higher in academic courses, had a combined SAT score of 820 or above (or ACT composite of 19 or higher), or scored at the 56th percentile or above on the 1992 NELS math and reading composite aptitude test.
SOURCE: U.S. Department of Education, National Center for Education Statistics, National Education Longitudinal Study (NELS:88/94), Data Analysis System.
Student Engagement
Patterns of school attendance reported by the student, including absenteeism, cutting
classes, and being late for school, formed the basis for the first student engagement indicator.
Participating in two or more extracurricular activities was the second indicator.
Among at-risk students who aspired to a bachelor’s degree and were academically prepared
for college enrollment, where they eventually enrolled (or if they enrolled) did not appear to be
associated with the high school attendance indicator (table 11). For example, 28 percent of those
enrolled in four-year colleges were in the highest attendance group as were 23 percent of those
who had not enrolled.35
35There appear to be differences among the enrollment groups for low and moderate attendance, but there is not enough statis-tical evidence to conclude that they are different.

COMPARISONS AMONG AT-RISK STUDENTS
33
Table 11—Among 1992 high school graduates with one or more risk factors1 who had a bachelor’s degree
Table 11—goal in the 10th grade and were at least minimally prepared academically to enroll in a 4-yearTable 11—college,
2 the percentage distribution according to level of class attendance in high school and
Table 11—the percentage reporting two or more extracurricular activities, by type of first postsecondary Table 11—institution
Class attendance (1990) Two or more Low Moderate High extracurricular attendance attendance attendance activities
Total 15.5 58.6 25.9 44.7 Type of first postsecondary institution 4-year 14.5 57.9 27.6 47.9 Less-than-4-year 20.3 57.7 22.1 40.9 Not enrolled 11.6 65.6 22.9 34.41Risk factors include low SES quartile, average grades of C’s or lower from sixth to eighth grade, changed schools twoor more times (other than natural progression), lived in a single parent family in eighth grade, had one or more oldersiblings who dropped out of high school, or held back a grade by 1988.2Based on an index that measures the probability of being academically qualified for a 4-year college. A student is considered minimally prepared if he or she met at least one of the following five criteria: ranked at or above the 54th percentile in one’s class, had a GPA of 2.7 or higher in academic courses, had a combined SAT score of 820 or above (or ACT composite of 19 or higher), or scored at the 56th percentile or above on the 1992 NELS math and reading composite aptitude test.
NOTE: Details for percentage distribution (class attendance) may not sum to 100 percent because of rounding.
SOURCE: U.S. Department of Education, National Center for Education Statistics, National Education Longitudinal Study (NELS:88/94), Data Analysis System.
The rate at which students participated in two or more extracurricular activities, on the
other hand, did distinguish students who enrolled in a four-year college (48 percent) from those
who had never enrolled in postsecondary education (34 percent). However, with respect to this
indicator, four-year college enrollees did not differ significantly from their counterparts enrolled in
other postsecondary education (41 percent).
Parents’ Educational Expectations and Level of Engagement
Parents’ educational expectations and the frequency with which they reported having
school-related discussions with their teen were engagement variables that were used to assess
parent involvement. For at-risk students who had progressed as far as having a bachelor’s degree
goal and who were at least minimally prepared academically for a four-year college, nearly all (91
percent) of their parents expected them to complete a bachelor’s degree. For these students,
where (or if) they enrolled was not significantly associated with their parents’ educational expec-
tations (table 12).

COMPARISONS AMONG AT-RISK STUDENTS
34
Table 12—Among 1992 high school graduates with one or more risk factors1 who had a bachelor’s degree
Table 12—goal in the 10th grade and were at least minimally prepared academically to enroll in a 4-yearTable 12—college,
2 the percentage distribution according to parents’ educational expectations and the
Table 12—frequency of school-related discussions, by type of first postsecondary institution
Parents’ educational expectations Parents discuss school-related for child, 1990 matters with child, 1992
High school Vocational/ Bachelor’s Little to no Some Much or less some college or higher discussion discussion discussion
Total 0.9 8.4 90.7 15.7 46.6 37.8
Type of first postsecondary institution 4-year 0.6 7.1 92.3 13.1 46.6 40.4 Less-than-4-year 1.1 10.9 88.0 20.4 44.8 34.8 Not enrolled 1.7 12.3 86.0 24.3 50.2 25.6 1Risk factors include low SES quartile, average grades of C’s or lower from sixth to eighth grade, changed schools twoor more times (other than natural progression), lived in a single parent family in eighth grade, had one or more oldersiblings who dropped out of high school, or held back a grade by 1988.2Based on an index that measures the probability of being academically qualified for a 4-year college. A student is considered minimally prepared if he or she met at least one of the following five criteria: ranked at or above the 54th percentile in one’s class, had a GPA of 2.7 or higher in academic courses, had a combined SAT score of 820 or above (or ACT composite of 19 or higher), or scored at the 56th percentile or above on the 1992 NELS math and reading composite aptitude test.
NOTE: Details for each percentage distribution may not sum to 100 percent because of rounding.
SOURCE: U.S. Department of Education, National Center for Education Statistics, National Education Longitudinal Study (NELS:88/94), Data Analysis System.
On the other hand, the frequency with which parents reported discussing school-related
matters with their child did distinguish students who enrolled in a four-year college from those
who either enrolled in other postsecondary education or who did not enroll. For example, four-
year college enrollees were less likely to have parents who had little to no discussion with them
(13 percent) than were students who enrolled in other postsecondary education (20 percent) or
those who had never enrolled (24 percent). At the other end of the spectrum, the proportion of
parents reporting a high level of discussion (shown as “much discussion” in the table) did not dif-
fer between students enrolled in a four-year college and those enrolled in other postsecondary
education (40 percent and 35 percent, respectively). However, parents of four-year college enrol-
lees were more likely to report much discussion than students who had never enrolled (26 per-
cent).

COMPARISONS AMONG AT-RISK STUDENTS
35
Peer Engagement
The final set of engagement indicators concerns the extent to which students’ friends were
involved in school activities. Both peer engagement indicators are based on items reported by the
students about their friends. The first indicates how important students thought their friends con-
sidered the following learning activities: attending classes, studying, getting good grades, finishing
high school, and continuing education past high school. The second was the number of students’
friends with plans to attend a four-year college.
Among at-risk students who aspired to a bachelor’s degree and were at least minimally pre-
pared to enroll in a four-year college, there was no difference in the level of importance that
friends attributed to learning activities relative to postsecondary enrollment outcomes. Roughly
one-third of students reported that their friends considered these activities very important regard-
less of their enrollment status (table 13).
The number of students’ friends with plans to attend a four-year college, on the other hand,
was strongly associated with enrollment outcomes. Students who enrolled in a four-year college
were much more likely to report that all or most of their friends planned to attend (80 percent),
compared with those who enrolled in other postsecondary education (60 percent) or those who
never enrolled (49 percent).
CONTROLLING FOR RELATED VARIABLES
In analyzing how certain variables are associated with at-risk students’ likelihood of enroll-
ing in postsecondary education, the study thus far has examined each variable separately. How-
ever, some of the variables may be related to one another and also to other background
characteristics. For example, more highly educated parents may report discussing school-related
matters with their teen more often than parents with less education. Conversely, students who
have college-educated parents may not seek help from their school in applying to college as often
as students whose parents have not been to college. Therefore, linear regression models were
used to determine the individual influence of each variable examined in the tabular analysis, on the
likelihood of postsecondary enrollment (see appendix B for details about methods used). The
analysis is based only on at-risk students, and two different outcomes were considered: enrolling

COMPARISONS AMONG AT-RISK STUDENTS
36
Table 13—Among 1992 high school graduates with one or more risk factors1 who had a bachelor’s degree
Table 13—goal in the 10th grade and were at least minimally prepared academically to enroll in a 4-year Table 13—college,
2 the percentage distributions according to level of importance peers attribute to learn-
Table 13—ing activities, and the number of friends with college plans, by type of first postsecondaryTable 13—institution
Friends think learning is Number of friends who plan to important (1990) attend a 4-year college
Not very Moderately Highly No friends Few to some Most important important important plan college friends friends
Total 15.0 54.5 30.5 2.2 25.5 72.3 Type of first postsecondary institution 4-year 14.1 55.8 30.1 1.0 18.9 80.1 Less-than-4-year 15.1 52.5 32.4 2.4 38.0 59.6 Not enrolled 17.9 52.0 30.1 9.8 41.6 48.61Risk factors include low SES quartile, average grades of C’s or lower from sixth to eighth grade, changed schools twoor more times (other than natural progression), lived in a single parent family in eighth grade, had one or more oldersiblings who dropped out of high school, or held back a grade by 1988.2Based on an index that measures the probability of being academically qualified for a 4-year college. A student is considered minimally prepared if he or she met at least one of the following five criteria: ranked at or above the 54th percentile in one’s class, had a GPA of 2.7 or higher in academic courses, had a combined SAT score of 820 or above (or ACT composite of 19 or higher), or scored at the 56th percentile or above on the 1992 NELS math and reading composite aptitude test.
NOTE: Details for each percentage distribution may not sum to 100 percent because of rounding.
SOURCE: U.S. Department of Education, National Center for Education Statistics, National Education Longitudinal Study (NELS:88/94), Data Analysis System.
in a four-year college and enrolling in any postsecondary education. Independent variables in-
cluded in the models were high school math course taking; whether or not school assistance was
received in filling out college applications or preparing for entrance exams; and student, parent,
and peer engagement indicators. Also included in the model are parents’ education level, whether
or not students had aspirations for a bachelor’s degree in the tenth grade; and whether they were
at least minimally prepared academically to enroll in a four-year college.36
Enrollment in a Four-Year College
The results for four-year college enrollment are shown in table 14. In the first column are
the unadjusted percentages—the proportion of at-risk students for each row characteristic who
enrolled in a four-year college, before controlling for the other variables in the table. The second
36It should be noted that even though minimal academic preparation is controlled for in the model, there may be considerablevariation within each group (i.e., among those who are prepared and among those who are not prepared).

COMPARISONS AMONG AT-RISK STUDENTS
37
column displays the corresponding adjusted percentages, for which the variation of all the other
variables has been controlled. The italicized row is the comparison group for significance testing.
The asterisks indicate instances where a percentage for a specific row is significantly different
from the comparison group within the row category. For example, both before and after adjust-
ment, the proportion of at-risk students enrolled in a four-year college was much higher for stu-
dents who took at least one advanced math course than for at-risk students who took non- or
low-academic math courses (5 percent versus 68 percent, unadjusted; 31 percent versus 47 per-
cent, adjusted). Once the other variables are controlled for, the magnitude of the difference be-
tween the group taking non- or low-academic math courses and the group taking an advanced
course appears smaller, but still remained significant. In contrast, the differences between the
other math groups (algebra I/geometry and algebra II) and the comparison group (no higher than
low-academic courses) were no longer significant after adjustment (28 to 31 percent). This result
may be due to controlling for students’ academic preparation. Those who are prepared are more
likely to take higher level math courses. For example, as was shown in table 9, nearly all at-risk
students who were at least minimally prepared academically to enroll in a four-year college and
who aspired to a bachelor’s degree had completed algebra I and geometry. Alternatively, for
similar reasons, controlling for the educational expectations of students’ parents may also account
for this result. Those whose parents expect them to earn a bachelor’s degree may be more likely
to complete math courses through algebra II than students whose parents expect less education.
For the other variables included in the model, the adjusted results differed very little from
those found in the tabular analysis (which was limited to at-risk students with aspirations for a
bachelor’s degree and academically prepared to enroll in a four-year college).37 As was found in
the tabular analysis, two engagement variables had no significant effect on the likelihood of en-
rolling in a four-year college: students’ high school attendance level and parents’ educational ex-
pectations. Once academic preparation and degree aspirations are controlled for, there is little
variation for these indicators. Most students who are academically prepared have parents who ex-
pect them to attain a bachelor’s degree (see table 12). Similarly, academic preparation is also as-
sociated with a higher attendance level.38 On the other hand, the other student engagement
indicator (participating in two or more extracurricular activities compared to participating in
none) remained significant with respect to increasing the likelihood of enrollment.
37Note that the unadjusted proportions in table 13 are those for all at-risk students, whereas in the tabular analysis, compari-sons were made only for students who had a bachelor’s degree goal and were academically prepared. This was done to controlfor the effect of these variables on college enrollment. In the regression model, however, educational aspirations and academicpreparation are included as independent variables.38For example, among academically prepared students, 17 percent had low attendance levels, compared with 25 percent ofthose not prepared; the opposite pattern was found for high attendance (NELS:88/94 Data Analysis System).
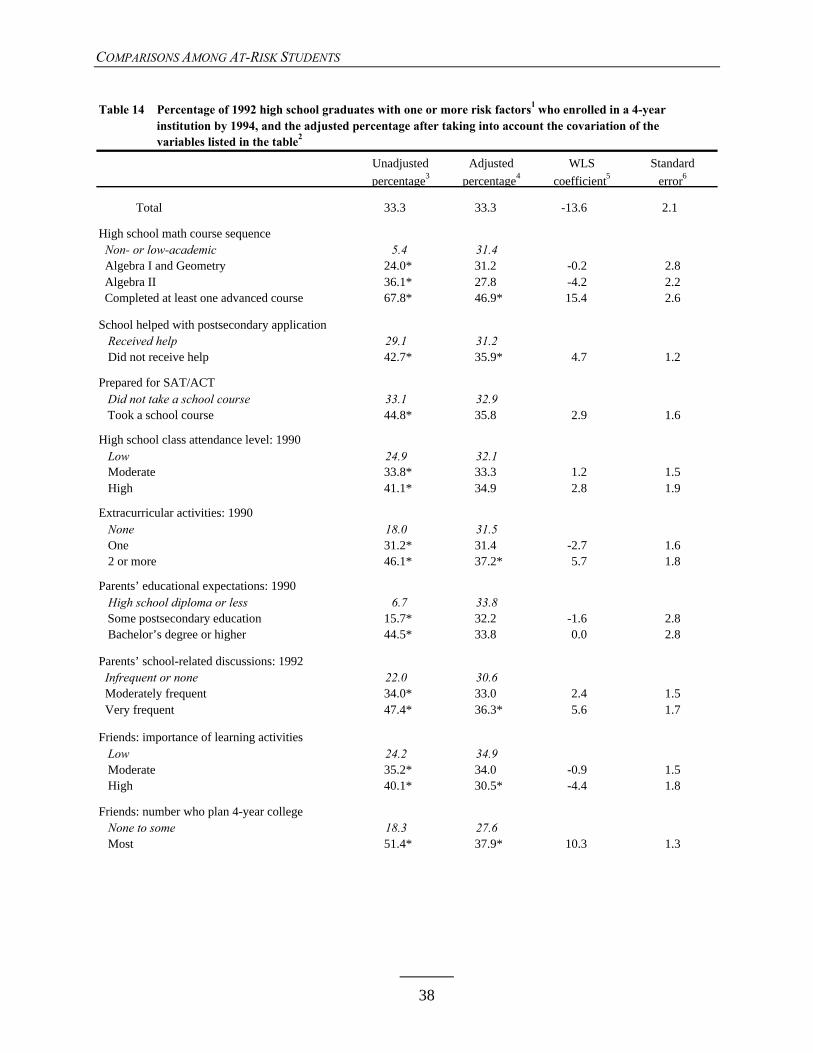
COMPARISONS AMONG AT-RISK STUDENTS
38
Table 14—Percentage of 1992 high school graduates with one or more risk factors1 who enrolled in a 4-yearTable 14—institution by 1994, and the adjusted percentage after taking into account the covariation of the Table 14—variables listed in the table2
Unadjusted Adjusted WLS Standard
percentage3 percentage4 coefficient5 error6
Total 33.3 33.3 -13.6 2.1
High school math course sequence Non- or low-academic 5.4 31.4 † † Algebra I and Geometry 24.0* 31.2 -0.2 2.8 Algebra II 36.1* 27.8 -4.2 2.2 Completed at least one advanced course 67.8* 46.9* 15.4 2.6
School helped with postsecondary application Received help 29.1 31.2 † † Did not receive help 42.7* 35.9* 4.7 1.2
Prepared for SAT/ACT Did not take a school course 33.1 32.9 † † Took a school course 44.8* 35.8 2.9 1.6
High school class attendance level: 1990 Low 24.9 32.1 † † Moderate 33.8* 33.3 1.2 1.5 High 41.1* 34.9 2.8 1.9
Extracurricular activities: 1990 None 18.0 31.5 † † One 31.2* 31.4 -2.7 1.6 2 or more 46.1* 37.2* 5.7 1.8
Parents’ educational expectations: 1990 High school diploma or less 6.7 33.8 † † Some postsecondary education 15.7* 32.2 -1.6 2.8 Bachelor’s degree or higher 44.5* 33.8 0.0 2.8
Parents’ school-related discussions: 1992 Infrequent or none 22.0 30.6 † † Moderately frequent 34.0* 33.0 2.4 1.5 Very frequent 47.4* 36.3* 5.6 1.7
Friends: importance of learning activities Low 24.2 34.9 † † Moderate 35.2* 34.0 -0.9 1.5 High 40.1* 30.5* -4.4 1.8
Friends: number who plan 4-year college None to some 18.3 27.6 † † Most 51.4* 37.9* 10.3 1.3

COMPARISONS AMONG AT-RISK STUDENTS
39
A change of relationship was found after adjustment for the peer engagement variable that
indicates students’ perception of the importance that friends attribute to learning activities. Having
friends who placed high importance on learning activities actually had a small but significant
negative effect on four-year college enrollment, compared to those whose friends placed low im-
portance on learning activities. Before adjustment the relationship was strongly positive: 47 per-
cent of students whose friends placed high importance on learning activities enrolled in a four-
year college, compared with 24 percent whose friends placed low importance on them. After ad-
justment the percentages were 31 percent and 35 percent, respectively. It is not entirely clear what
Table 14—Percentage of 1992 high school graduates with one or more risk factors1 who enrolled in a 4-yearTable 14—institution by 1994, and the adjusted percentage after taking into account the covariation of the Table 14—variables listed in the table2—Continued
Unadjusted Adjusted WLS Standard
percentage3 percentage4 coefficient5 error6
Parents highest education level High school diploma or less 21.1 29.9 † † Some postsecondary education 31.8* 32.0 2.1 1.4 Bachelor’s degree or higher 59.1* 41.1* 11.2 1.7
Student’s 10th-grade aspirations Less than a bachelor’s degree 11.9 27.3 † † Bachelor's degree or higher 53.0* 38.2* 10.9 1.5
Academic preparation for 4-year enrollment7
Not prepared 0.0 10.5 † † At least minimally prepared 56.8* 48.2* 37.7 1.5
*p < .05.†Not applicable for the reference group.1Risk factors include low SES quartile, average grades of C’s or lower from sixth to eighth grade, changed schools two
or more times (other than natural progression), lived in a single parent family in eighth grade, had one or more oldersiblings who dropped out of high school, or held back a grade by 1988.2The italicized group in each category is the reference group being compared.
3The estimates are from the NELS:88/94 Data Analysis System.
4The percentages are adjusted for differences associated with other variables in the table (see appendix B).
5Weighted least squares (WLS) coefficient (see appendix B) multiplied by 100 to reflect a percentage.
6Standard error of WLS coefficient, adjusted for design effect (see appendix B) and multiplied by 100 to reflect a percentage.
7Based on an index that measures the probability of being academically qualified for a 4-year college. A student is considered
minimally prepared if he or she met at least one of the following five criteria: ranked at or above the 54th percentile in one’sclass, had a GPA of 2.7 or higher in academic courses, had a combined SAT score of 820 or above (or ACT composite of 19or higher), or scored at the 56th percentile or above on the 1992 NELS math and reading composite aptitude test. Note, if students enrolled in a 4-year college and did not meet any of these academic criteria (about 10 percent of those enrolled), they were also codedas academically prepared.
SOURCE: U.S. Department of Education, National Center for Education Statistics, National Education Longitudinal Study (NELS:88/94), Data Analysis System.

COMPARISONS AMONG AT-RISK STUDENTS
40
caused this reversal in the relationship, but the difference between the two groups is relatively
small.
Obtaining help from their school in filling out postsecondary applications still increased the
likelihood of students enrolling in a four-year college after adjustment; taking a course to prepare
for entrance exams, on the other hand, did not affect enrollment after adjustment. These results
were consistent with the tabular analysis that was based only on at-risk students who were aca-
demically prepared and aspired to a bachelor’s degree.
The parent involvement indicator associated with a higher likelihood of enrolling in a four-
year college also remained significant after adjustment. Students whose parents reported having
frequent school-related discussions were still more likely to enroll in a four-year college than stu-
dents whose parents reported infrequent or no discussions.
Finally, even after adjustment, students who reported that most of their friends had plans to
attend a four-year college were still more likely to enroll in a four-year college than students who
had few or no friends who had college plans.
Enrollment in Any Postsecondary Education
The results for enrollment in any postsecondary education are shown in table 15 and are
similar to those found for enrollment in a four-year college with a few exceptions. Unlike four-
year college enrollment, participation in any extracurricular activities had no significant effect on
whether or not a student enrolled in postsecondary education after adjustment. This may be due
to the policy that most four-year colleges require a certain level of participation in extracurricular
activities as part of their admissions criteria, while sub-baccalaureate institutions generally have
open admission policies. Alternatively, some extracurricular activities may be specifically tailored
for students with intentions to enroll in a four-year college.
Another result that differed from that found for four-year college enrollment was for the
peer engagement indicator of friends’ attitudes toward learning. Both before and after adjustment,
the indicator was positively associated with enrolling in any postsecondary education. Students
who reported that their friends placed moderate or high importance on such activities were more
likely to enroll than those whose friends placed low importance on them.
Also unlike four-year college enrollment, parents’ educational expectations for their teen
had a positive effect on postsecondary enrollment: compared to having no expectations beyond
high school graduation, students whose parents expected them to obtain some postsecondary

COMPARISONS AMONG AT-RISK STUDENTS
41
education or to graduate from college were more likely to enroll in postsecondary education. In
addition, the positive effect of parents having school-related discussions with their teen remained
strong for predicting enrollment in any postsecondary education: compared to students whose
parents reported infrequent or no school-related discussions, students whose parents reported ei-
ther moderately or highly frequent discussions were more likely to enroll both before and after
adjustment.

COMPARISONS AMONG AT-RISK STUDENTS
42
Table 15—Percentage of 1992 high school graduates with one or more risk factors1 who enrolled in any Table 15—postsecondary education by 1994, and the adjusted percentage after taking into account the Table 15—covariation of the variables listed in the table2
Unadjusted Adjusted WLS Standard
percentage3 percentage4 coefficient5 error6
Total 68.0 68.0 -1.904 1.0
High school math course sequence Non- or low-academic 40.1 57.3 † † Algebra I and Geometry 63.1* 70.7* 13.5 3.1 Algebra II 73.5* 66.4* 9.1 2.4 Completed at least one advanced course 90.8* 73.9* 16.7 2.9
School helped with postsecondary application Received help 65.5 65.1 † † Did not receive help 77.7* 71.3* 6.2 1.3
Prepared for SAT/ACT Did not take a school course 67.3 67.2 † † Took a school course 78.6* 71.8 4.6 1.8
High school class attendance level: 1990 Low 64.3 70.5 † † Moderate 67.9 67.4 -3.1 1.7 High 71.7* 67.2 -3.3 2.1
Extracurricular activities: 1990 None 55.5 67.5 † † One 66.9* 67.2 -0.3 1.8 2 or more 76.9* 69.3 1.8 2.0
Parents’ educational expectations: 1990 High school diploma or less 25.2 49.3 † † Some postsecondary education 56.4 68.7* 19.4 3.1 Bachelor’s degree or higher 77.9* 69.2* 19.9 3.1
Parents’ school-related discussions: 1992 Infrequent or none 55.4 62.9 † † Moderately frequent 68.1* 67.4* 4.5 1.7 Very frequent 81.9* 73.2* 10.3 1.9
Friends: importance of learning activities Low 55.4 64.1 † † Moderate 69.7* 68.9* 4.9 1.7 High 76.9* 69.5* 5.4 2.0
Friends: number who plan 4-year college Few to some 58.0 64.8 † † Most 81.3 70.4* 5.6 1.5

COMPARISONS AMONG AT-RISK STUDENTS
43
Table 15—Percentage of 1992 high school graduates with one or more risk factors1 who enrolled in any Table 15—postsecondary education by 1994, and the adjusted percentage after taking into account the covariationTable 15—of the variables listed in the table2—Continued
Unadjusted Adjusted WLS Standard
percentage3
percentage4
coefficient5
error6
Parents highest education level High school diploma or less 54.7 62.6 † † Some postsecondary education 68.0 67.9* 5.3 1.5 Bachelor’s degree or higher 89.4* 76.1* 13.5 1.9
Student’s 10th-grade aspirations Less than a bachelor’s degree 48.6 62.2 † † Bachelor’s degree or higher 84.4* 72.6* 10.3 1.7
Academic preparation for 4-year enrollment7
Not prepared 41.1 52.3 † † At least minimally prepared 84.4* 78.1* 25.8 1.7
*p < .05.†Not applicable for the reference group.1Risk factors include low SES quartile, average grades of C’s or lower from sixth to eighth grade, changed schools two
or more times (other than natural progression), lived in a single parent family in eighth grade, had one or more older2The italicized group in each category is the reference group being compared.
3The estimates are from the NELS:88/94 Data Analysis System.
4The percentages are adjusted for differences associated with other variables in the table (see appendix B).
5Weighted least squares (WLS) coefficient (see appendix B) multiplied by 100 to reflect a percentage.
6Standard error of WLS coefficient, adjusted for design effect (see appendix B) and multiplied by 100 to reflect a percentage.
7Based on an index that measures the probability of being academically qualified for a 4-year college. A student is considered
minimally prepared if he or she met at least one of the following five criteria: ranked at or above the 54th percentile in one’sclass, had a GPA of 2.7 or higher in academic courses, had a combined SAT score of 820 or above (or ACT composite of 19or higher), or scored at the 56th percentile or above on the 1992 NELS math and reading composite aptitude test. Note, if students enrolled in a 4-year college and did not meet any of these academic criteria (about 10 percent of those enrolled), they were also codedas academically prepared.
SOURCE: U.S. Department of Education, National Center for Education Statistics, National Education Longitudinal Study (NELS:88/94), Data Analysis System.


45
SUMMARY AND CONCLUSIONS
The primary focus of this study was to explore why some students with a family background
or early educational experiences that increased their risk of dropping out of high school exhibited
considerable resiliency by successfully navigating the pipeline leading to college enrollment. To
set the context, comparisons were first made between high school graduates at risk and those not
at risk according to the rates at which each group completed five steps leading to college enroll-
ment. These steps included having aspirations in the tenth grade for completing a bachelor’s de-
gree, being academically prepared to enroll in college, taking college entrance exams, applying to
one or more four-year institutions, and enrolling in a four-year college.
The results indicated that 1992 high school graduates with risk factors associated with
dropping out remained at risk with respect to gaining access to higher education. Specifically,
students at risk were far less likely to have aspirations for a college degree, and if they did have
college aspirations, were less likely to be academically prepared to enroll. While these results are
consistent with those from earlier studies, this analysis also found that even at-risk students who
navigated the educational system well enough to at least minimally prepare themselves for admis-
sion to a four-year college were less likely than their peers not at risk to take the subsequent steps
necessary to enroll. That is, academically prepared at-risk students were less likely to take en-
trance exams, and if they took entrance exams, were less likely to apply to a four-year college.
Thus, it appears that some at-risk students who were likely to be admitted, completed the four-
year college pipeline at lower rates than their counterparts not at risk (at least within two years of
high school graduation).
Furthermore, among students who enrolled in any postsecondary education, students at risk
were less likely to exhibit strong indicators of persistence than their counterparts not at risk. This
was true both for students who enrolled in a four-year college and for those who enrolled in a
community college.
Nevertheless, despite differences that do exist in postsecondary enrollment outcomes be-
tween students at risk and those not at risk, approximately one-third of 1992 high school gradu-
ates at risk enrolled in a four-year college, and an additional one-quarter enrolled in a public two-
year institution. Moreover, among those who enrolled, more than two-thirds exhibited strong in-
dicators of persistence in postsecondary education. How these students differed from their at-risk

SUMMARY AND CONCLUSIONS
46
counterparts who did not enroll in any postsecondary education by 1994 was next addressed in
this report. The analysis also compared students who enrolled in a four-year college with those
who enrolled in a subbaccalaureate institution.
Comparisons were made in three areas: completion of math “gatekeeping” courses, the rate
at which students reported receiving help from their school in the college application process, and
last, the level of school involvement of students, their parents, and their peers. This part of the
analysis was limited to students who both aspired to a bachelor’s degree and were at least mini-
mally prepared academically to enroll in a four-year college.
Among these students, there were noticeable differences in the level of math courses com-
pleted between students who enrolled in a four-year college and those who either enrolled in a
subbaccalaureate institution or who did not enroll. While a majority of students had completed a
sequence of math courses through algebra II, those who enrolled in a four-year college were
much more likely than students who enrolled in other postsecondary education or who had not
enrolled to have taken at least one advanced math course such as calculus.
Students who enrolled in a four-year college were also more likely to report receiving help
from their school in filling out their application than were students who enrolled in other post-
secondary education or who did not enroll. Similar proportions of the latter two groups reported
receiving such help.
Finally, the results demonstrated the relative importance of several engagement indicators,
especially those for parents and peers. Students who enrolled in a four-year college were more
likely than students who did not enroll in any postsecondary education to have parents who re-
ported frequently discussing school-related matters with them. Students who reported that most
or all of their friends planned to attend a four-year college were far more likely to enroll in a four-
year college themselves than were students who had few or no friends with college plans.

47
APPENDIX A—GLOSSARY
This glossary describes the variables used in this report. The items were taken directly from the NationalEducation Longitudinal Study (NELS:88/94) Data Analysis System (DAS) (see appendix B for a description of theDAS). The variables used in this analysis were either items taken directly from the NELS surveys or they werederived by combining one or more items in these surveys. For direct survey items, those variable names beginningwith “BY” were collected in the base year (1988), “F1” variables were collected in the first followup (1990), F2 inthe second followup (1992), and F3 in the third (1994).
The variables listed in the index below are in the order they appear in the report; the glossary is in alpha-betical order by DAS variable name (displayed along the right-hand column).
Glossary Index
RISK FACTORS
Changed schools 2 or more times from 1st to 8th grade...................................BYP40Single parent family................................BYFCOMPLowest socioeconomic quartile...................... BYSESOlder siblings dropped out of high school .................................................F1S94Average grades C’s or lower from 6th to 8th grade...........................................BYGRD68Held back one or more grades by 1988 ...........BYS74Number of risk factors............................... BYRISK2
DEMOGRAPHIC VARIABLES
Gender...........................................................F3SEXRace–ethnicity ............................................F3RACEParents’ highest education level ............... F2PARED
PIPELINE VARIABLES
Sequential pipeline stepsStep 1: Bachelor’s degree aspirations ............. PIPE1Step 2: Academically prepared........................ PIPE2Step 3: Took entrance exams........................... PIPE3Step 4: Applied to a 4-year college .................. PIPE4Step 5: Enrolled in a 4-year college................. PIPE5
Other postsecondary education itemsNumber of pipeline steps taken .................PIPESUMQualified for a 4-year college ................... PIPEPREP
Enrolled in a 4-year college ....................... PIPE4YRIndicator of postsecondary persistence............................................. PSEINDXType of first institution ............................F3SEC2A1
MATH COURSE TAKING
Highest level math courses completed..........................................MTHQUAL8
HELP FROM SCHOOL WITH POSTSECONDARY
APPLICATION
High school help with postsecondary application.................................................F2S57AExam preparation .........................................F2S45A
ENGAGEMENT VARIABLES
Students’ class attendance ..................... F1ATTENDStudents’ extracurricular activities................................................F1EXCURParents’ educational expectations.........................................F1PAREXPParents discuss school-related matters with child.................................. F2PTALKFriends think selected learning activities are important.......................................F1FRSTUDNumber of friends who plan to attend a 4-year college ...................................F2FRCOLL

APPENDIX A—GLOSSARY
48
Single parent family BYFCOMP
Describes the family or household composition. It was constructed from the student responses to items BYS8A-I,taken from the 1988 survey. For this analysis the responses were aggregated as follows:39
Single parent family Household is composed of mother only or father only.
Not from a single parent family Household is composed of mother and father, mother andmale guardian, father and female guardian, or other combi-nation of relatives/guardians.
Average grades C’s or lower from 6th to 8th grade BYGRD68
Constructed from deciles of grade point averages categorized according to letter grades. For this analysis, the vari-able was aggregated as follows:
C’s or lower grades Student had average grades of C’s or lower from sixththrough eighth grade.
Higher than C grades Student had higher than a C average from sixth througheighth grade.
Changed schools 2 or more times from 1st to 8th grade BYP40
In the 1988 survey, parents were asked how many times their eighth grader had changed schools since he or sheentered first grade. Changes that occurred as a result of promotion to one grade or level or a move from one ele-mentary school to a middle school in the same district were not counted. This analysis aggregated the number ofschool changes as follows:
Two or more school changes Student changed schools two or more times between first andeighth grades.
No more than one school change Student changed schools between first and eighth grades nomore than one time.
Number of risk factors BYRISK2
The sum of six possible risk factors including being in the lowest SES quartile and five other risk factors that havebeen shown to increase the chances of dropping out of high school after controlling for SES and race–ethnicity.Risk factors are as follows:
1. Lowest SES quartile (BYSES)2. Single parent family (BYFCOMP)3. Older sibling dropped out of high school (F1S94)4. Changed schools 2 or more times (reported by the parent) (BYP40)
39In the DAS, aggregation of a variable is accomplished with the “lumping” tag function (for categorical variables) or the “cut”function for continuous variables.

APPENDIX A—GLOSSARY
49
5. Average grades of C’s or lower from 6th to 8th grades (BYGRD68)6. Repeated an earlier grade (BYS74)
All of the risk factors were identified as of the eighth grade with the exception of students having older siblingswho dropped out of high school, which was asked in the tenth grade. If a student had missing data for two or morerisk items, the variable was set to missing. Students with one or more risk factors were considered at risk.
Held back one or more grades by 1988 BYS74
A direct question asked of the 1988 eighth grader: Were you ever held back (made to repeat) a grade in school?
Held back Student was held back a grade in school.
Not held back Student was never held back a grade in school.
Lowest socioeconomic quartile BYSES
A composite measure constructed using the following parent questionnaire data:
Father’s education levelMother’s education levelFather’s occupationMother’s occupationFamily income
For cases where all parent data components were missing (8.1 percent of the participants), student data were usedto compute the socioeconomic status centile. The variable was aggregated to quartiles for this analysis.
Lowest quartile Socioeconomic status fell at or below the lowest 25th percen-tile.
Middle quartiles Socioeconomic status fell between the 25th percentile and the75th percentile.
Highest quartile Socioeconomic status fell at or above the 75th percentile.
Students’ class attendance F1ATTEND
A measure of students’ school attendance, asked in 1990. The variable is based on the following items reported bythe student:
How many times late for school (F1S10A)How many times skipped school (F1S10B)How many days absent (F1S13)
The index was aggregated into three categories by percentiles as follows:

APPENDIX A—GLOSSARY
50
Low attendance Student’s attendance value fell below the 25th percentile.
Moderate attendance Student’s attendance value fell between the 25th and 75th per-centiles.
High attendance Student’s attendance value fell above the 75th percentile.
Students’ extracurricular activities F1EXCUR
Number of extracurricular activities in a variety of areas reported by the student in 1990. Includes sports, band,theater, student government, academic societies, yearbook, service clubs, and hobby clubs. The variable was aggre-gated as follows:
None Student did not participate in any extracurricular activities.
One Student participated in one extracurricular activity.
Two or more Student participated in two or more extracurricular activities.
Friends think selected learning activities are important F1FRSTUD
A composite measure of students’ peer engagement with respect to the importance of learning activities. Based onthe following variables where students indicated how important friends thought it was to:
Attend classes (F1S70A)Study (F1S70B)Get good grades (F1S70D)Finish high school (F1S70F)Continue education past high school (F1S70I)
Not very important Students’ friends’ index of importance for learning fell belowthe 25th percentile.
Moderately important Students’ friends’ index of importance for learning fell be-tween the 25th and 75th percentile.
Highly important Students’ friends’ index of importance for learning fell abovethe 75th percentile.
Parents’ educational expectations F1PAREXP
Variable was based on the highest educational expectations reported by either the student’s father or mother in1990. For this analysis, the variable was aggregated as follows:
High school diploma or less Parents expected student to complete no more than a high

APPENDIX A—GLOSSARY
51
school diploma.
Some college Parents expected student to attain some postsecondary educa-tion, but short of a bachelor’s degree.
Bachelor’s degree or higher Parents expected student to attain a bachelor’s degree orhigher.
Older siblings dropped out of high school F1S94
In the 1990 survey, students were asked how many brothers or sisters (including adopted, step-, or half-siblings)left high school before graduating. For this analysis, the variable was aggregated to:
One or more siblings dropped out One or more siblings had dropped out of high school.
No siblings dropped out None of student’s siblings were in high school, student wasan only child or the oldest, none of student’s siblings haddropped out of high school.
Number of friends who plan to attend a 4-year college F2FRCOLL
Based on the item BYS69E: “How many of your friends plan to attend a 4-year college?” asked on the 1992 survey.
None None of student’s friends planned to attend 4-year college.
Few to some Few to some friends planned to attend 4-year college.
Most to all Most or all of student’s friends planned to attend 4-year col-lege.
Parents’ highest education level F2PARED
This composite variable characterizes the level of education attained by the student’s parent with the highest re-ported education level. It was constructed using the second follow-up parent questionnaire data. New student sup-plement data were used if parent data were missing. For this analysis, the variable was aggregated as follows:
High school or less Neither parent completed high school, or at least one parentcompleted high school or GED.
Some postsecondary education At least one parent attended some postsecondary education orcollege, but neither attained a bachelor’s degree.
Bachelor’s degree or higher At least one parent was a college graduate, or had attained anadvanced degree.
Exam preparation F2S45A

APPENDIX A—GLOSSARY
52
In 1992 students were asked if they took a special entrance exam preparation course offered by the school.
Took a course Student took a special course.
Did not take a course Student did not take a special course or the school did not offera course.
High school help with postsecondary application F2S57A
In 1992 students were asked if they received help in filling out vocational/technical school or college applicationsin high school.
Received help Student received help from the school.
Did not receive help Student did not receive help or the school did not offer help.
Parents discuss school-related matters with child F2PTALK
A composite measure of parent engagement determining how frequently parents discussed school matters withtheir child. It is based on the following variables: How frequently during the past two years have you and/or yourspouse/partner talked about the following with your teenager?
Selecting courses or programs at school (F2P49A)School activities or events of particular interest to your teenager (F2P49B)Things your teenager has studied in class (F2P49C)Your teen’s grades (F2P49D)Plans and preparation for the American College Testing test (ACT), Scholastic Assessment Test (SAT), or Armed Services Vocational Aptitude Battery (ASVAB) (F2P49E)Applying to colleges or other schools after high school (F2P49F)
The index was coded into quartiles as follows:
Little to no discussion Parents’ index for level of discussion fell below the 25th per-centile.
Some discussion Parents’ index for level of discussion fell between the 25th and75th percentile.
Much discussion Parents’ index for level of discussion fell above the 75th per-centile.
Race–ethnicity F3RACE
Based on the 1992 value unless it was missing or incorrect. In addition, if it became apparent from responses toother questions that the preloaded value was incorrect, the value was corrected in 1994. Sample members with thevalue of “Other” were assigned the value -1 (missing).
Asian/Pacific Islander A person having origins in any of the Pacific Islander peoplesof the Far East, Southeast Asia, the Indian subcontinent, or

APPENDIX A—GLOSSARY
53
Pacific Islands. This includes people from China, Japan, Ko-rea, the Philippine Islands, Samoa, India, and Vietnam.
Hispanic A person of Mexican, Puerto Rican, Cuban, Central or SouthAmerican, or other Spanish culture or origin, regardless ofrace.
Black, non-Hispanic A person having origins in any of the black racial groups ofAfrica, not of Hispanic origin.
White, non-Hispanic A person having origins in any of the original peoples ofEurope, North Africa, or the Middle East (except those ofHispanic origin).
American Indian/Alaskan Native A person having origins in any of the original peoples ofNorth America and who maintains cultural identificationthrough tribal affiliation or community recognition.
Type of first institution F3SEC2A1
This variable indicates the type of postsecondary institution first attended by the student. The primary source is theSECTOR variable in the 1993/94 Integrated Postsecondary Education Data System (IPEDS) data file. In the fewinstances where SECTOR is missing, the variable CONTROL from the same file is used. In this report categorieswere aggregated as follows:
No postsecondary education reported Student had not enrolled in any postsecondary education by1994.
4-year institution Student was enrolled in a public or private, not-for-profit 4-year institution.
Public, 2-year Student was enrolled in a public 2-year institution.
Other less-than-4-year Student was enrolled in a public, less-than-2-year institution;a private, not-for-profit less-than-4-year institution; or a pri-vate, for-profit institution.
Gender F3SEX
Male
Female
Highest level math courses completed MTHQUAL8
This variable describes the level of the highest sequence of math courses student completed in high school. It isbased on high school transcripts. For this analysis, the variable was aggregated as follows:
No math courses, non-academic Student did not take any math courses; took non-academic or low academic courses courses including those classified as “general mathematics”
or “basic skills mathematics”; low academic courses which

APPENDIX A—GLOSSARY
54
comprise preliminary (e.g., pre-algebra) or reduced rigor/pacemathematics courses (algebra I that is spread over two aca-demic years, and “informal geometry”).
Completed algebra I and geometry Completed two years of mathematics including algebra I andgeometry, or two years of unified mathematics.
Completed algebra II An additional year of mathematics was completed includingalgebra II or a third year of a unified mathematics program.
Completed at least one advanced Took at least one of any courses labeled as “advanced,” in- course cluding various trigonometry, probability, statistics, intro-
ductory analysis or precalculus, algebra III, or calculuscourses.
Step 1: Bachelor’s degree aspirations PIPE1
The pipeline refers to five consecutive steps usually necessary to enroll successfully in a 4-year college. These stepsinclude:
1. Having aspirations for a bachelor’s degree2. Being academically prepared3. Taking entrance exams4. Applying to a 4-year college5. Enrolling in a 4-year college
Each step was coded based on one or more items in the survey. In addition, a student had to complete all precedingsteps to be coded for the next step. For example, to complete step 2, a student had to have a bachelor’s degree goalin the tenth grade (step 1) and be academically prepared (step 2). To complete step 3, a student had to have abachelor’s degree goal (step 1), be academically prepared (step 2), and have taken entrance exam (step 3), and soon.
To complete step 1, a student reported having aspirations for a bachelor’s degree as of 1990. PIPE1 is based onF1S49, a direct questionnaire item asked of the student in 1990 as follows: As things stand now, how far in schooldo you think you will get? Those who indicated aspirations for a bachelor’s degree were coded as completing STEP1. If F1S49 was missing and the student had completed all other pipeline steps, student was coded as having com-pleted step 1. If student had completed no other pipeline steps, student was coded as not completing step 1.
Completed Student took first pipeline step.
Did not complete Student did not take first pipeline step.
Step 2: Academically prepared PIPE2
Completed Student took the first two steps in the pipeline.
Did not complete Student did not take the first two steps in the pipeline.Academic preparation was based on the composite item PIPEPREP (see separate glossary entry for this variable),which identifies students who are qualified to enroll in a 4-year college. If students completed step 1 (had aspira-

APPENDIX A—GLOSSARY
55
tions for a bachelor’s degree) and were at least minimally qualified for a 4-year college, they were coded as havingcompleted the first two steps of the pipeline. For more information about pipeline steps see PIPE1.
Step 3: Took entrance exams PIPE3
Completed Student took the first three steps in the pipeline.
Did not complete Student did not take the first three steps in the pipeline.
Based on the composite EXMAPLY2, which indicates whether or not a student took a SAT and/or ACT exam andapplied to a 4-year institution. If EXMAPLY2 was missing, but a student had enrolled in a 4-year institution, theywere coded as having taken the exams. If students completed steps 1 and 2 and had taken an entrance exam, theywere coded as completing step 3 of the pipeline. For more information about pipeline steps see PIPE1.
Step 4: Applied to a 4-year college PIPE4
Completed Student took the first four steps in the pipeline.
Did not complete Student did not take the first four steps in the pipeline.
Based on EXMAPLY2, which indicates whether or not a student took a SAT/ACT exam and applied to a 4-yearcollege. If EXMAPLY2 was missing and a student enrolled in a 4-year college, the student was coded as applying.If students completed steps 1 to 3 and had applied to at least one 4-year institution, they were coded as havingcompleted step 4 of the pipeline. For more information about pipeline steps see PIPE1.
Step 5: Enrolled in a 4-year college PIPE5
Enrolled Student took all five pipeline steps and successfully enrolledin a 4-year college.
Did not enroll Student did not take all five pipeline steps.
Based on the composite PIPE4YR (see separate glossary entry for this variable below). It is a composite ofF3SEC2A1 (first institution type) and ENST1092 (enrollment status as of October 1992). If students completed thefirst four steps of the pipeline and successfully enrolled in any 4-year institution, they were coded as completing allfive steps of the pipeline. For more information about pipeline steps see PIPE1.
Qualified for a 4-year college40 PIPEPREP
This variable is based on CQCOMV1, a 4-year college qualification composite variable that indicates whether ornot a student was at least minimally qualified to attend a 4-year college. CQCOMV1 was developed using five in-dicators of academic performance including cumulative GPAs, senior class rank, the NELS 1992 test scores, andthe SAT and ACT college entrance examination scores. Since admission standards and requirements vary widelyamong 4-year colleges and universities, the approach used the actual distribution of these five measures of aca-demic aptitude and achievement among those graduating seniors who did attend a 4-year college or university.
40For further information see L. Berkner and L. Chavez, Access to Postsecondary Education for the 1992 High School Gradu-ates (NCES 98-105) (Washington, D.C.: U.S. Department of Education, National Center for Education Statistics, 1998).

APPENDIX A—GLOSSARY
56
Data sources were available for approximately half (45 percent) of the NELS graduating seniors for four or five ofthe criteria: class rank, GPA, the NELS 2nd follow-up test, and ACT or SAT scores or both. For about one-third ofthe seniors only three data sources were available because they had no ACT or SAT scores. In order to identify asmany students as possible who were potentially academically qualified for a 4-year college, even if data weremissing for these students on some of the criteria, the seniors were classified according to the highest level theyhad achieved on any of the five criteria for which data were present. Finally, students who did not meet the mini-mum criteria but who actually enrolled in a 4-year institution (about 10 percent of 4-year college enrollees) werecoded as minimally qualified.41 If CQCOMV1 was missing (about 10 percent of high school graduates), a studentwho had indicated bachelor’s degree aspirations, taken entrance exams, applied to college, and enrolled was codedas academically qualified (5 percent recoded). Conversely, if CQCOMV1 was missing and a student had done noneof the above, the student was coded as not qualified (1.7 percent recoded).
For this analysis, the variable was aggregated as follows:
At least minimally prepared Students whose highest value on any of the five criteria wouldput them among the top 75 percent (i.e., in the third quartile)of 4-year college students for that criterion. Minimum valueswere GPA=2.7, class rank percentile=54, NELS test percen-tile=56, combined SAT=820, composite ACT=19. If studentsdid not meet the minimum criteria, but enrolled in a 4-yearcollege, they were coded as prepared.42
Not prepared academically Did not meet any of the minimum criteria and did not enrollin a 4-year college.
Enrolled in a 4-year college PIPE4YR
This variable is based on type of first postsecondary institution (F3SEC2A1), and indicates whether or not a stu-dent first enrolled in a 4-year college. In about 5 percent of cases, F3SEC2A1 was missing, and for these students,their enrollment status as of October 1992 was used (ENST1092). PIPE4YR differs from PIPE5 in that it is basedon all students. PIPE5, on the other hand, is a cumulative variable based on students having bachelor’s degree as-pirations, being academically qualified, taking entrance exams, and applying to a 4-year college.
4-year college Student’s first postsecondary institution was a 4-yearcollege.
Not a 4-year college Student’s first postsecondary institution was not a 4-year col-lege.
Number of pipeline steps taken PIPESUM
Refers to the total number of steps taken in a path toward enrolling in a 4-year college (from 0–5) regardless ofwhether they were taken in sequence. The steps include reporting a bachelor’s degree goal in the tenth grade, being
41These students may have met the admissions criteria for a specific institution without meeting the general academic criteria.In addition, students who enrolled without having met the academic criteria had fewer of the original five measures on whichqualification was based (see the Berkner and Chavez report cited above for more information).42Note that in the Berkner and Chavez report, students who did not meet the minimal criteria for the five academic indicatorswere coded as marginally or not qualified. The variable they used for their analysis (CQCOMV2) is available in the DAS.

APPENDIX A—GLOSSARY
57
academically prepared, taking entrance exams, applying to a 4-year college, and enrolling in a 4-year college.
Indicator of postsecondary persistence PSEINDX
For students who enrolled in postsecondary education, this variable indicates whether or not they enrolled full timewithin one year after high school graduation and attended continuously from first enrollment (i.e., all periods ofnon-enrollment were shorter than four months). In this analysis, it was used to indicate how likely students were topersist to degree attainment.
Strong persistence indicators Student enrolled full time within one year of high schoolgraduation and attended continuously.
Other Student delayed enrollment, started part time, or had non-continuous enrollment.


59
APPENDIX B—TECHNICAL NOTES ANDMETHODOLOGY
THE NATIONAL EDUCATION LONGITUDINAL STUDY OF 1988
The National Education Longitudinal Study of 1988 (NELS:88) is a survey that began with
a nationally representative sample of 1988 eighth graders and followed them every two years. The
most recent follow-up survey occurred in 1994. Respondents’ teachers and schools were also sur-
veyed in 1988, 1990, and 1992, while parents were surveyed in 1988 and 1992. In contrast to
previous longitudinal studies, NELS:88 began with eighth graders in order to collect data regard-
ing the transition from elementary to secondary education. The first follow-up in 1990 provided
the data necessary to understand the transition. Dropouts were administered a special survey to
understand the dropout process more thoroughly. For the purpose of providing a comparison
group to 1980 sophomores surveyed in High School and Beyond, the NELS:88 sample was also
“freshened” with new participants who were tenth graders in 1990.
In spring of 1992, when most of the NELS:88 sample were twelfth graders, the second fol-
low-up took place. This survey focused on the transition from high school to the labor force and
postsecondary education. The sample was also “freshened” in order to create a representative
sample of 1992 seniors for the purpose of conducting trend analyses with the 1972 and 1982
senior classes (NLS-72 and HS&B). Students identified as dropouts in the first follow-up were
also resurveyed in 1992. In spring of 1994, the third follow-up was administered. Sample mem-
bers were questioned about their labor force and postsecondary experiences, and family forma-
tion. For more information about the NELS:88 survey, consult the NELS:88/94 Methodology
Report.43
ACCURACY OF ESTIMATES
The statistics in this report are estimates derived from a sample. Two broad categories of er-
ror occur in such estimates: sampling and nonsampling errors. Sampling errors occur because ob-
43U.S. Department of Education, National Center for Education Statistics, National Education Longitudinal Study(NELS:88/94) Methodology Report (NCES 96-174) (Washington D.C.: 1996).

APPENDIX B—TECHNICAL NOTES AND METHODOLOGY
60
servations are made only on samples of students, not on entire populations. Nonsampling errors
occur not only in sample surveys but also in complete censuses of entire populations. Nonsam-
pling errors can be attributed to a number of sources: inability to obtain complete information
about all students in all institutions in the sample (some students or institutions refused to partici-
pate, or students participated but answered only certain items); ambiguous definitions; differences
in interpreting questions; inability or unwillingness to give correct information; mistakes in re-
cording or coding data; and other errors of collecting, processing, sampling, and imputing missing
data.
DATA ANALYSIS SYSTEM
The estimates presented in this report were produced using the NELS:88/94 Data Analysis
System (DAS). The DAS software makes it possible for users to specify and generate their own
tables from the NELS:88/94 data. With the DAS, users can replicate or expand upon the tables
presented in this report. In addition to the table estimates, the DAS calculates proper standard
errors and weighted sample sizes for these estimates.44 For example, table B1 contains standard
errors that correspond to table 2 in the text, and was generated by the DAS. If the number of
valid cases is too small to produce a reliable estimate (less than 30 cases), the DAS prints the
message “low-N” instead of the estimate.
In addition to tables, the DAS will also produce a correlation matrix of selected variables to
be used for linear regression models. Included in the output with the correlation matrix are the
design effects (DEFTs) for each variable in the matrix. Since statistical procedures generally com-
pute regression coefficients based on simple random sample assumptions, the standard errors must
be adjusted with the design effects to take into account the NELS:88 stratified sampling method.
(See discussion under “Statistical Procedures” below for the adjustment procedure.)
44The NELS:88/94 sample is not a simple random sample and, therefore, simple random sample techniques for estimatingsampling error cannot be applied to these data. The DAS takes into account the complexity of the sampling procedures andcalculates standard errors appropriate for such samples. The method for computing sampling errors used by the DAS involvesapproximating the estimator by the linear terms of a Taylor series expansion. The procedure is typically referred to as the Tay-lor series method.

APPENDIX B—TECHNICAL NOTES AND METHODOLOGY
61
For more information about the NELS:88/94 and other Data Analysis Systems, consult the
NCES DAS Website (WWW.PEDAR-DAS.org) or contact:
Aurora D’AmicoNCES Data Development and Longitudinal Studies Group555 New Jersey Avenue, NWWashington, DC 20208-5652(202) 219-1365Internet address: [email protected]

APPENDIX B—TECHNICAL NOTES AND METHODOLOGY
62
Table B1—Standard errors for table 2: Percentage of 1992 high school graduates with each risk factor, by Table b1—number of risk factors and all other risk factors
Changed schools Average Older Held back two or more grades C’s sibling(s) one or more times from Lowest or lower from Single dropped grades from
1st to 8th SES 6th to 8th parent out of 1st to 8thgrade quartile grade family high school grade
Total 0.71 0.66 0.57 0.56 0.44 0.46 Number of risk factors Any risk factors 1.01 1.01 0.90 0.89 0.70 0.77 One risk factor 1.26 0.93 0.89 1.00 0.62 0.58 Two risk factors 1.62 1.57 1.61 1.48 1.47 1.50 Three or more 2.17 2.57 2.42 2.48 2.58 2.56 Number of school changes from 1st to 8th grade Two or more times 0.00 1.16 1.34 1.36 0.96 1.24 Less than two 0.00 0.68 0.58 0.57 0.44 0.43 Socio-economic status 1988 Lowest quartile 1.46 0.00 1.20 1.47 1.22 1.15 Middle to high quartiles 0.78 0.00 0.62 0.58 0.40 0.49 Average grades from 6th to 8th grade C’s or lower 1.92 1.45 0.00 1.71 1.19 1.71 A’s or B’s 0.72 0.67 0.00 0.55 0.45 0.42 Family composition in 1988 Single parent family 2.08 1.81 1.85 0.00 1.36 1.88 Other than single parent 0.72 0.65 0.57 0.00 0.44 0.42 Older siblings who left high school One or more 1.93 1.89 1.62 1.72 0.00 1.78 None left or no siblings 0.76 0.63 0.62 0.60 0.00 0.48 Student ever held back a grade Yes 2.43 1.91 2.30 2.34 1.80 0.00 No 0.73 0.64 0.52 0.55 0.40 0.00
SOURCE: U.S. Department of Education, National Center for Education Statistics, National Education Longitudinal
Study (NELS:88/94), Data Analysis System.

APPENDIX B—TECHNICAL NOTES AND METHODOLOGY
63
STATISTICAL PROCEDURES
Two types of statistical procedures were employed in this report: testing differences be-
tween means, and adjustment of means after controlling for covariation among a group of vari-
ables. Each procedure is described below.
Differences Between Means
The descriptive comparisons were tested in this report using Student’s t statistic. Differ-
ences between estimates are tested against the probability of a Type I error, or significance level.
The significance levels were determined by calculating the Student’s t values for the differences
between each pair of means or proportions and comparing these with published tables of signifi-
cance levels for two-tailed hypothesis testing.
Student’s t values may be computed to test the difference between estimates with the fol-
lowing formula:
t = E - E
se +se
1 2
12
22
Error! Switch argument not specified. (1)
where E1 and E2 are the estimates to be compared and se1 and se2 are their corresponding stan-
dard errors. Note that this formula is valid only for independent estimates. When the estimates are
not independent (for example, when comparing a total percentage with that for a subgroup that is
included in the total), a covariance term must be added to the formula. If the comparison is be-
tween the mean of a subgroup and the mean of the total group, the following formula is used:
Esub − E tot
se sub2 + se tot
2 − 2p se sub2
(2)
where p is the proportion of the total group contained in the subgroup.45
When comparing two percentages from a distribution that adds to 100 percent, the follow-ing formula is used:
E E
Se Se rSe Se1 2
12
22
12
222
−
+ −(3)
45U.S. Department of Education, National Center for Education Statistics, A Note from the Chief Statistician, No. 2, 1993.

APPENDIX B—TECHNICAL NOTES AND METHODOLOGY
64
where r is the correlation between the two estimates.46 The estimates, standard errors, and corre-
lations can all be obtained from the DAS.
There are hazards in reporting statistical tests for each comparison. First, comparisons based
on large t statistics may appear to merit special attention. This can be misleading, since the mag-
nitude of the t statistic is related not only to the observed differences in means or percentages but
also to the number of students in the specific categories used for comparison. Hence, a small dif-
ference compared across a large number of students would produce a large t statistic.
A second hazard in reporting statistical tests for each comparison occurs when making mul-
tiple comparisons among categories of an independent variable. For example, when making paired
comparisons among different levels of income, the probability of a Type I error for these compari-
sons taken as a group is larger than the probability for a single comparison. When more than one
difference between groups of related characteristics or “families” are tested for statistical signifi-
cance, one must apply a standard that assures a level of significance for all of those comparisons
taken together.
Comparisons were made in this report only when p< .05/k for a particular pairwise compari-
son, where that comparison was one of k tests within a family. This guarantees both that the indi-
vidual comparison would have p< .05 and that for k comparisons within a family of possible
comparisons, the significance level for all the comparisons will sum to p< .05.47
For example, in a comparison of the percentages of students at risk to those not at risk who
enrolled in postsecondary education only one comparison is possible (at-risk versus not-at-risk
students). In this family, k=1, and the comparison can be evaluated without adjusting the signifi-
cance level. When students are divided into five racial–ethnic groups and all possible comparisons
are made, then k=10 and the significance level of each test must be p< .05/10, or p< .005. The
formula for calculating family size (k) is as follows:
k =j j −1( )
2(4)
46Ibid.47The standard that p<.05/k for each comparison is more stringent than the criterion that the significance level of the compari-sons should sum to p<.05. For tables showing the t statistic required to ensure that p<.05/k for a particular family size and de-grees of freedom, see Olive Jean Dunn, “Multiple Comparisons Among Means,” Journal of the American StatisticalAssociation 56 (1961): 52–64.

APPENDIX B—TECHNICAL NOTES AND METHODOLOGY
65
where j is the number of categories for the variable being tested. In the case of race–ethnicity,
there are five racial–ethnic groups (American Indian, Asian/Pacific Islander, black non-Hispanic,
Hispanic, and white non-Hispanic), so substituting 5 for j in equation 2,
k =5 5 −1( )
2= 10
Error! Switch argument not specified.Adjustment of Means to Control for BackgroundVariation
Tabular results are limited by sample size when attempting to control for additional factors
that may account for the variation observed between two variables. For example, when examining
the percentages of those who completed a degree, it is impossible to know to what extent the ob-
served variation is due to socioeconomic status (SES) differences and to what extent it is due to
differences in other factors related to SES, such as type of institution attended, intensity of en-
rollment, and so on. However, if a nested table were produced showing SES within type of insti-
tution attended, within enrollment intensity, the cell sizes would be too small to identify the
patterns. When the sample size becomes too small to support controls for another level of varia-
tion, one must use other methods to take such variation into account.
To overcome this difficulty, multiple linear regression was used to obtain means that were
adjusted for covariation among a list of control variables.48 Adjusted means for subgroups were
obtained by regressing the dependent variable on a set of descriptive variables such as parents’
education, students’ academic preparation, students’ educational aspirations, etc. Substituting
ones or zeros for the subgroup characteristic(s) of interest and the mean proportions for the other
variables results in an estimate of the adjusted proportion for the specified subgroup, holding all
other variables constant. For example, consider a hypothetical case in which two variables, race–
ethnicity and income, are used to describe an outcome, Y (such as attending a four-year college).
The variables race–ethnicity and family income are recoded into a dummy variable representing
race–ethnicity and a dummy variable representing family income:
Race–ethnicity R
Black students 1
48For more information about weighted least squares regression, see Michael S. Lewis-Beck, Applied Regression: An Intro-duction, Vol. 22 (Beverly Hills, CA: Sage Publications, Inc., 1980); William D. Berry and Stanley Feldman, Multiple Regres-sion in Practice, Vol. 50 (Beverly Hills, CA: Sage Publications, Inc., 1987).

APPENDIX B—TECHNICAL NOTES AND METHODOLOGY
66
Non-black students 0and
Family income F
Low income 1Not low-income 0
The following regression equation is then estimated from the correlation matrix output from the
DAS:
∧Y = a+ b1R+ b2F (5)
To estimate the adjusted mean for any subgroup evaluated at the mean of all other variables, one
substitutes the appropriate values for that subgroup’s dummy variables (1 or 0) and the mean for
the dummy variable(s) representing all other subgroups. For example, suppose we had a case
where Y was being described by race–ethnicity (R) and family income (F), coded as shown above,
and the means for R and F are as follows:
Variable Mean
R 0.109F 0.282
Suppose the regression equation results in:∧Y = 0.51 + (0.032)R + (-0.21)F (6)
To estimate the adjusted value for black students, one substitutes the appropriate parameter val-
ues into equation 4.
Variable Parameter Value
a 0.510 —R 0.032 1.000F -0.210 0.282

APPENDIX B—TECHNICAL NOTES AND METHODOLOGY
67
This results in:∧Y = 0.51 + (0.032)(1) + (-0.21)(0.282) = 0.48 (7)
In this case the probability of attending a four-year college for black students is 0.48 and repre-
sents the expected outcome for black students who look like the average student across the other
variables (in this example, family income). In other words, the adjusted percentage who enrolled
in a four-year college is 48 percent (0.48 x 100 for conversion to a percentage).
It is relatively straightforward to produce a multivariate model using the DAS, since one of
the DAS output options is a correlation matrix, computed using pairwise missing values.49 This
matrix can be used by most statistical software packages as the input data for least-squares re-
gression. That is the approach used for this report, with an additional adjustment to incorporate
the complex sample design into the statistical significance tests of the parameter estimates (de-
scribed below). For tabular presentation, parameter estimates and standard errors were multiplied
by 100 to match the scale used for reporting unadjusted and adjusted percentages.
Most statistical software packages assume simple random sampling when computing stan-
dard errors of parameter estimates. Because of the complex sampling design used for the
NELS:88/94 survey, this assumption is incorrect. A better approximation of their standard errors
is to multiply each standard error by the average design effect of the independent variable
(DEFT),50 where the DEFT is the ratio of the true standard error to the standard error computed
under the assumption of simple random sampling. It is calculated by the DAS and produced with
the correlation matrix.
49Although the DAS simplifies the process of making regression models, it also limits the range of models. Analysts who wishto use other than pairwise treatment of missing values or to estimate probit/logit models (which are the most appropriate formodels with categorical dependent variables) can apply for a restricted data license from NCES. See John H. Aldrich andForrest D. Nelson, Linear Probability, Logit and Probit Models (Quantitative Applications in the Social Sciences, Vol. 45)(Beverly Hills, CA: Sage University Press, 1984).50The adjustment procedure and its limitations are described in C.J. Skinner, D. Holt, and T.M.F. Smith, eds., Analysis ofComplex Surveys (New York: John Wiley & Sons, 1989).


69
APPENDIX C—SUPPLEMENTARY TABLES

APPENDIX C—SUPPLEMENTARY TABLES
70
Table C1—Percentage of 1992 high school graduates who enrolled in a 4-year institution by 1994, and the Table 16—adjusted percentage after taking into account the covariation of the variables listed in the table
1
Unadjusted Adjusted WLS Standardpercentage
2percentage
3coefficient
4error
5
Total 42.9 42.9 -56.2 7.2
Family composition in 1988 Single parent family 37.3* 36.2* -6.9 3.4 Other than single parent 46.1 43.1 † † Average grades from 6th to 8th grade C’s or lower 15.3* 18.6* -29.2 1.4 A’s or B’s 50.7 47.8 † † Number of school changes from 1st to 8th grade Less than two 38.1* 38.7* -5.7 1.3 Two or more times 25.5 16.0 † †
Student ever held back a grade Yes 19.4* 26.5* -18.5 1.7 No 49.1 45.0 † †
Socio-economic status 1988 Lowest quartile 20.7* 24.1* -23.0 1.4 Middle to high quartiles 50.0 47.1 † † Older siblings who left high school One or more 24.6* 30.9* -12.4 0.0 None left or no siblings 47.6 43.3 † †
*p < .05.†Not applicable for the reference group.1The italicized group in each category is the reference group being compared. They are slightly different from the percentages
in table 5 because they are based on a dichotomous variable with fewer missing cases. 2The estimates are from the NELS:88/94 Data Analysis System.3The percentages are adjusted for differences associated with other variables in the table (see appendix B).
4Weighted least squares (WLS) coefficient (see appendix B) multiplied by 100 to reflect a percentage.
5Standard error of WLS coefficient, adjusted for design effect (see appendix B) multiplied by 100 to reflect a percentage.
SOURCE: U.S. Department of Education, National Center for Education Statistics, National Education Longitudinal Study
(NELS:88/94), Data Analysis System.

APPENDIX C—SUPPLEMENTARY TABLES
71
Table C2—Percentage of 1992 high school graduates who enrolled in any postsecondary education by 1994, and Table 16—the adjusted percentage after taking into account the covariation of the variables listed in the table
1
Unadjusted Adjusted WLS Standardpercentage
2percentage
3coefficient
4error
5
Total 75.1 75.1 9.0 8.4
Family composition in 1988 Single parent family 71.4* 81.7* 6.8 3.0 Other than single parent 77.1 74.9 † † Average grades from 6th to 8th grade C’s or lower 53.8* 56.7* -22.1 1.2 A’s or B’s 80.7 78.8 † † Number of school changes from 1st to 8th grade Two or more times 73.9* 74.3 -1.1 1.0 Less than two 77.7 75.4 † † Student ever held back a grade Yes 55.8* 26.5* -16.0 1.5 No 79.7 76.9 † †
Socio-economic status 1988 Lowest quartile 53.2* 55.6* -23.9 1.2 Middle to high quartiles 81.2 79.5 † † Older siblings who left high school One or more 59.9* 66.3* -12.4 2.9 None left or no siblings 78.9 75.4 † †
*p < .05.†Not applicable for the reference group.1The italicized group in each category is the reference group being compared.2The estimates are from the NELS:88/94 Data Analysis System.
3The percentages are adjusted for differences associated with other variables in the table (see appendix B).
4Weighted least squares (WLS) coefficient (see appendix B).5Standard error of WLS coefficient, adjusted for design effect (see appendix B).
SOURCE: U.S. Department of Education, National Center for Education Statistics, National Education Longitudinal Study
(NELS:88/94), Data Analysis System.

APPENDIX C—SUPPLEMENTARY TABLES
72
Table C3—Among 1992 high school graduates who did not enroll in a 4-year college, the percentage who took Table C3—various combinations of pipeline steps
Pipeline steps Bachelor’s Academically Took Applied todegree goal prepared exams 4-year college Percent
Total 100.0
Took no steps 25.6
Took one step 24.8
* 8.4 * 8.2
* 7.4 * 0.8
Took two steps 19.8
* * 6.2 * * 5.7 * * 5.2
* * 1.8 * * 0.8
* * 0.1
Took three steps 18.0
* * * 10.5 * * * 3.8
* * * 3.3 * * * 0.4
Took four steps * * * * 11.7
*Took step
NOTE: This table represents all high school graduates who did not enroll in a 4-year college with respect to the numberof pipeline steps taken. For each number of steps, the total percent who took that number of steps appears at the top of the “per-cent” column for that group. For those who took one to three steps, the percent taking various combinations is shownbelow the total percent. For example, 19.8 percent took two steps, consisting of 6.2 percent who were academicallyprepared and took exams, 5.7 percent who had a bachelor's degree goal and took exams, 5.2 percent who had a degreegoal and were academically prepared, and so on.
SOURCE: U.S. Department of Education, National Center for Education Statistics, National Education LongitudinalStudy (NELS:88/94).