congestion evaluation best practices - vtpi. · pdf filefor presentation at the ... paper 12...
TRANSCRIPT

www.vtpi.org
250-360-1560
Congestion Evaluation Best Practices 12 March 2014
By Todd Litman
Victoria Transport Policy Institute
Email: [email protected]
Phone: 250-360-1560
For presentation at the
I-TED 2014
International Transportation Economic Development Conference
Paper 12
Abstract Traffic congestion can be evaluated in various ways that result in very different
conclusions about the nature of the problem and optimal solutions. This paper describes
various factors that affect congestion costing and the evaluation of potential congestion
reduction strategies, including the scope of analysis, baseline speeds, travel time unit
costs, the impacts of traffic speeds on accident and emission rates, consideration of
induced travel impacts, and consideration of co-benefits. It discusses how these factors
influence planning decisions, and describes best practices for comprehensive evaluation
of congestion impacts. It applies this comprehensive framework to evaluate various
congestion reduction strategies including roadway expansion, alternative mode
improvements, pricing reforms, smart growth policies and demand management
programs.
Keywords Congestion, Mobility, Economic Evaluation, Transport Planning, Road Pricing

Congestion Evaluation Best Practices Victoria Transport Policy Institute
2
Introduction Traffic congestion refers to the incremental delay caused by interactions among vehicles
on a roadway, particularly as traffic volumes approach a road’s capacity. Congestion can
be evaluated in various ways that can result in very different estimates of its costs and the
benefits of specific congestion reduction strategies. This paper describes best practices
for congestion evaluation based on recommendations by international experts.
Commonly-used congestion indicators, such as roadway level-of-service (LOS) and the
Travel Time Index (TTI) reflect congestion intensity, the amount that traffic speeds
decline during peak periods (1). Comprehensive evaluation measures congestion costs,
taking into account exposure, the amount that people must drive under urban-peak
conditions (2). An area can have relatively intense congestion but low congestion costs
due to good travel options, well connected roadway networks, and compact development
that minimize peak period automobile travel.
How congestion is measured can affect planning decisions in various ways. For example:
Converting a general traffic lane into a bus lane often reduces bus passenger delay but
increases delay in the remaining traffic lanes. Congestion intensity indicators only
measure vehicle traffic impacts, and so would conclude that congestion has increased,
even if total per capita delay hours decline.
Compact, transit-oriented cities such as New York, San Francisco and Boston tend to
have relatively intense congestion but less congestion delay per commuter than dispersed,
automobile-oriented cities such as Houston, Atlanta and Nashville due to lower auto
mode shares and shorter trip distances. Compact cities rank worse than dispersed cities if
compared by congestion intensity indicators but not if compared by congestion costs.
More central, infill locations often experience more intense local congestion than urban
fringe locations, but lower congestion costs, since a central location offers better travel
options (better walking, cycling and public transit access) and shorter trip distances.
Described differently, congestion evaluation is affected by whether analysis measures
mobility (travel speed) or accessibility (time and financial costs required to reach desired
services and activities). Modern transportation planning recognizes that mobility is
seldom an end in itself, accessibility is the ultimate goal of most travel activity.
Comprehensive congestion evaluation is part of the paradigm shift toward accessibility-
based planning.
This paper discusses various factors that affect congestion cost estimates and the
evaluation of potential congestion reduction strategies, discusses how different
methodologies and assumptions can influence planning decisions, and describes best
practices for comprehensive and multi-modal congestion evaluation. It should be of
interest to anybody involved in urban transportation planning.

Congestion Evaluation Best Practices Victoria Transport Policy Institute
3
Factors Affecting Congestion Evaluation This section summarizes the methods recommended by experts for quantifying congestion
costs and evaluating potential congestion reduction strategies (3, 4, 5, 6, 7, 8).
Congestion Indicators
Table 1 summarizes various traffic congestion indicators. Some measure congestion
intensity (the percentage reduction in vehicle traffic speeds on particular roads), while
others are more comprehensive (they consider total traffic delay, taking into account
travelers’ exposure to congestion as well congestion intensity) and multi-modal (they
consider delays to all travelers, not just motorists), and so measure total congestion costs.
Table 1 Congestion Indicators (9)
Indicator Description Comprehensive Multi-Modal
Roadway Level-Of-
Service (LOS)
Intensity of congestion on a road or intersection, rated
from A (uncongested) to F (most congested)
No No
Multi-modal Level-
Of-Service (LOS)
Service quality of walking, cycling, public transport
and automobile, rated from A to F
No Yes
Travel Time Index The ratio of peak to off-peak travel speeds No No
Avg. Traffic Speed Average peak-period vehicle traffic speeds No No
Avg. Commute Time The average time spent per commute trip Yes Yes
Congested Duration Duration of “rush hour” No No
Delay Hours Hours of extra travel time due to congestion Yes No if for vehicles,
yes if for people
Congestion Costs Monetized value of delay plus additional vehicle
operating costs
Yes No if for vehicles,
yes if for people
Various indicators are used to evaluate congestion. Only a few are comprehensive and multi-modal.
Intensity indicators are useful for making short-term decisions, such as how best to travel
across town during rush hour, but are unsuitable for strategic planning decisions that
affect the quality of travel options or land use development patterns. For example, a
compact city may have a 1.3 Travel Time Index (traffic speeds decline 30% during peak
periods), 60% automobile commute mode share, and 6-mile average trip lengths,
resulting in 34 average annual hours of delay per commuter; while a sprawled city has a
1.2 Travel Time Index, 90% automobile mode share, and 10-mile average trip lengths,
resulting in a much higher 45 average annual hours of delay. Intensity indicators imply
that the compact city has worse congestion since it has greater speed reductions, although
its residents experience lower total congestion costs because they drive less during peak
periods. Similarly, converting general traffic lanes into bus or High Occupant Vehicle
(HOV) lanes may increase congestion intensity but reduce total congestion costs if
incremental delays to low-occupant vehicle occupants are offset by reduced bus and
HOV passenger delays.

Congestion Evaluation Best Practices Victoria Transport Policy Institute
4
Described differently, intensity indicators reflect mobility while cost indicators reflect
accessibility, people’s ability to reach services and activities (10). Recent research
improves our understanding of the trade-offs between them:
Levine, et al. found that changes in development density affect the number of jobs and
services available within a given travel time about ten times more than proportional
changes in traffic speed (11).
Kuzmyak found that travelers in more compact neighborhoods experience less congestion
than in more sprawled, suburban neighborhoods due to shorter trip distances, more
connected streets, and better travel options, which more than offset higher trip generation
rates per square mile (12).
A study that measured the number of jobs accessible by automobile within certain time
periods for the 51 largest US metropolitan areas found that the five cities with the most
intense congestion (the highest Travel Time Index ratings) are among the best for
automobile employment access because their lower traffic speeds are more than offset by
higher employment densities which reduce commute distances (13).
Cortright found that roadway expansion that stimulates sprawl can increase residents’
total travel times, because higher traffic speeds are more than offset by longer travel
distances (14).
These studies indicate that transportation system changes intended to increase vehicle
traffic speeds can reduce overall accessibility and increase total transportation costs by
reducing the efficiency of other modes and stimulating sprawl.
Baseline Speeds
Baseline (also called threshold) speed is the speed below which congestion delays are
calculated. For example, if the baseline speed is 60 miles per hour (mph), and peak-
period traffic speeds are 50 mph, the 10 mph speed reduction is the basis for calculating
congestion delay. Table 2 summaries ways to define and measure baseline speeds, and
their equivalent roadway level-of-service (LOS) ratings.
Table 2 Baseline Speed Definitions
Name Measurement Method LOS Rating
Free-flow speeds Measured off-peak speeds A
Speed limits Maximum legal speeds A or B
Capacity-maximizing speeds Speeds that maximizes traffic capacity C or D
Economic efficiency-optimizing (also
called consumer-surplus maximizing) Users’ willingness-to-pay for faster travel C or D
There are several possible ways to define and measure baseline speeds. (LOS = Level-of-Service)
Roadway capacity tends to decline at speeds above 55 mph on limited access highways,
and about 40 mph on urban arterials, so roads typically carry about twice as much traffic
at LOS C than at LOS A (15). As a result, traffic engineers generally recommend
capacity-maximizing speeds, and economists generally recommend economic efficiency-
optimizing speeds, both of which result in level-of-service C or D baseline speeds (16).
Congestion Evaluation Best Practices Victoria Transport Policy Institute
5
For example, the Australian Bureau of Transport and Regional Economics calculates
congestion costs based on estimates of motorists’ willingness to pay for faster travel (17).
Using this method they estimate that congestion costs in major Australian cities totaled
$5.6 billion in 2005, less than half the $11.1 billion calculated using freeflow speeds.
Similarly, using capacity-maximizing baseline speeds, Wallis and Lupton estimate that in
2006, Auckland, New Zealand congestion costs totaled $250 million, a third of the
$1,250 million cost estimate using a freeflow baseline (18). Transport Canada calculates
congestion costs use 50%, 60% and 70% of free-flow speeds, which they consider a
reasonable range of optimal urban-peak traffic speeds (19). In contrast, traffic models
often use speed limit baselines, and the Urban Mobility Report uses measured freeflow
speed baselines, although they often exceed legal speed limits (20).
Travel Time Valuation
Another key factor is the cost assigned to travel delay. There is extensive research on travel
time valuation (21, 22). Most studies conclude that on average motorists are willing to pay
25-50% of wages for reduced delay; a minority, including commercial travelers and travelers
with urgent errands, would pay significantly more (23, 24). The U.S. Department of
Transportation recommends valuing personal travel time at 35% to 60% of prevailing
incomes (25).
The value of travel time used for analysis should reflect the travelers affected. A project
that reduces delay for all motorists, such as a roadway expansion, should be evaluated
based on overall average motorists’ willingness-to-pay, while a project that reduces
congestion for a particular group, such as value priced lanes, should be evaluated based
on willingness-to-pay by those who would pay the fee.
Fuel Consumption and Emission Impacts
The function used to calculate how traffic speed changes affect fuel economy and
pollution emissions affects congestion costs. Fuel economy usually peaks at 40-50 mph,
so reducing extreme congestion (such as shifting from LOS E-F to C-D) conserves fuel
and reduces emissions, but eliminating congestion (shifting from level-of-service C-D to
A-B) tends to increase fuel consumption and emissions (26, 27). Ignoring these effects
tends to exaggerate congestion costs and roadway expansion benefits.
Safety Impacts
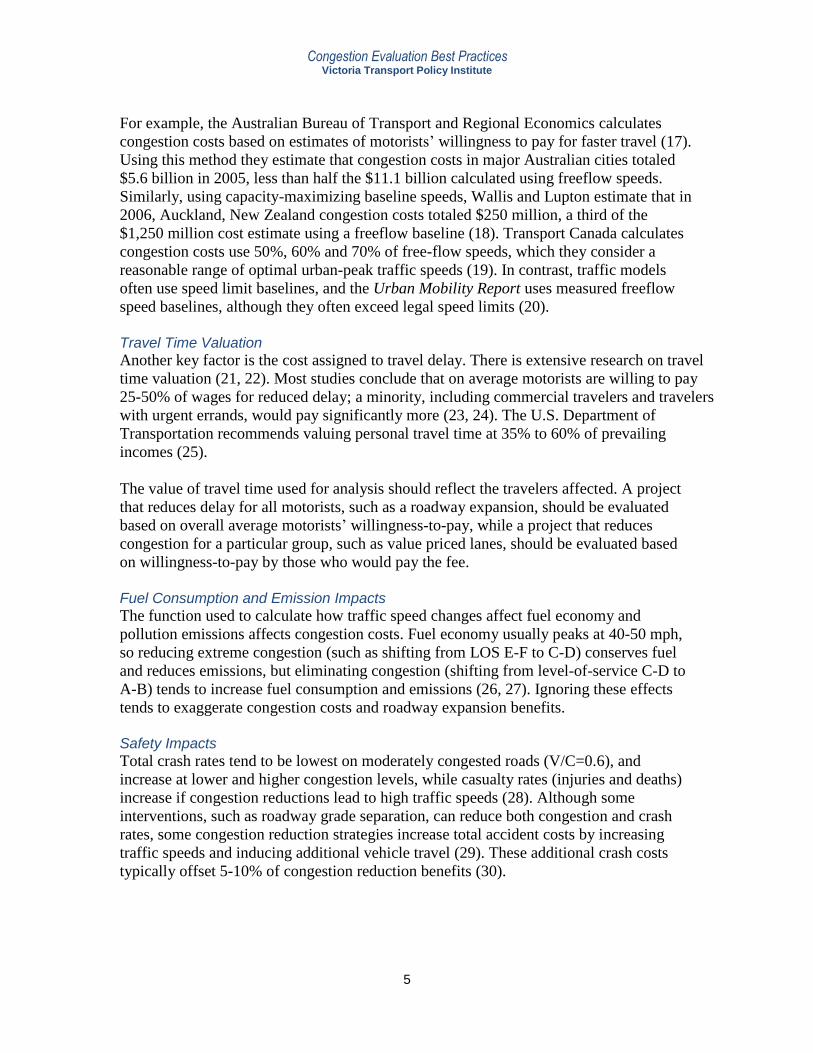
Total crash rates tend to be lowest on moderately congested roads (V/C=0.6), and
increase at lower and higher congestion levels, while casualty rates (injuries and deaths)
increase if congestion reductions lead to high traffic speeds (28). Although some
interventions, such as roadway grade separation, can reduce both congestion and crash
rates, some congestion reduction strategies increase total accident costs by increasing
traffic speeds and inducing additional vehicle travel (29). These additional crash costs
typically offset 5-10% of congestion reduction benefits (30).
Congestion Evaluation Best Practices Victoria Transport Policy Institute
6
Generated Traffic and Induced Travel
Congestion tends to maintain equilibrium: it increases until delays cause some travelers
to reduce peak-period trips by shifting travel times, routes, modes or destinations (31,
32). When roads are expanded, increased peak-period vehicle travel is called generated
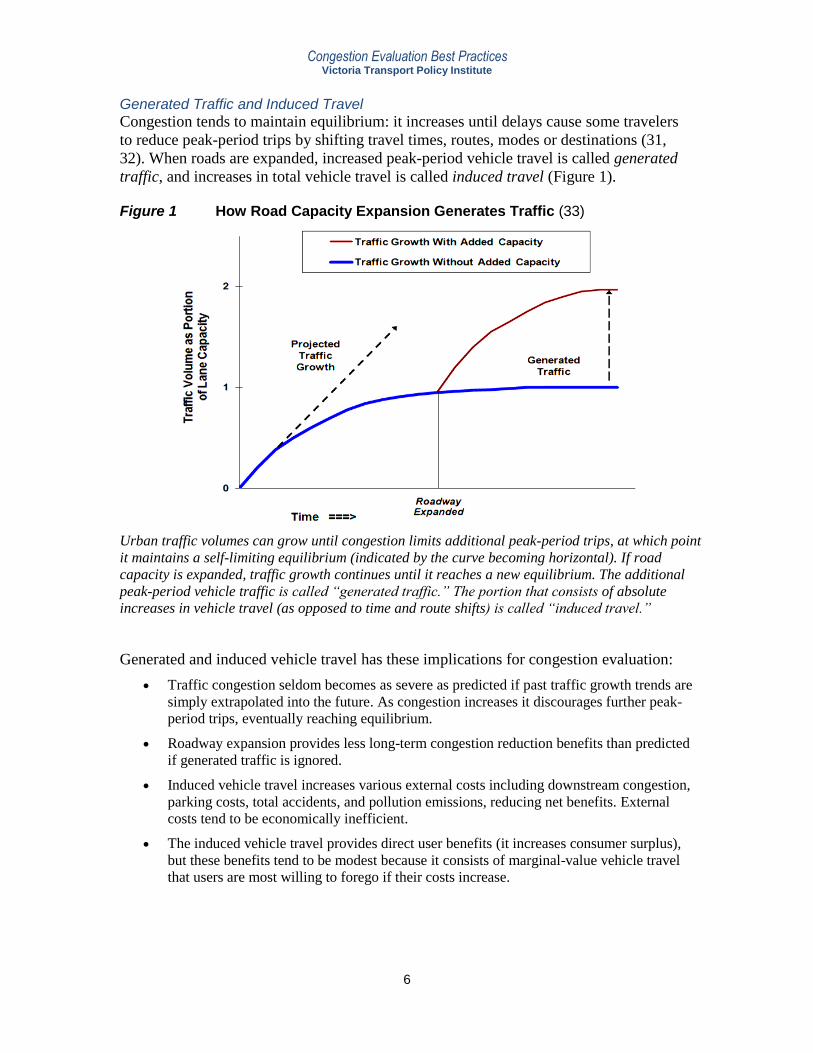
traffic, and increases in total vehicle travel is called induced travel (Figure 1). Figure 1 How Road Capacity Expansion Generates Traffic (33)
Urban traffic volumes can grow until congestion limits additional peak-period trips, at which point
it maintains a self-limiting equilibrium (indicated by the curve becoming horizontal). If road
capacity is expanded, traffic growth continues until it reaches a new equilibrium. The additional
peak-period vehicle traffic is called “generated traffic.” The portion that consists of absolute
increases in vehicle travel (as opposed to time and route shifts) is called “induced travel.”
Generated and induced vehicle travel has these implications for congestion evaluation:
Traffic congestion seldom becomes as severe as predicted if past traffic growth trends are
simply extrapolated into the future. As congestion increases it discourages further peak-
period trips, eventually reaching equilibrium.
Roadway expansion provides less long-term congestion reduction benefits than predicted
if generated traffic is ignored.
Induced vehicle travel increases various external costs including downstream congestion,
parking costs, total accidents, and pollution emissions, reducing net benefits. External
costs tend to be economically inefficient.
The induced vehicle travel provides direct user benefits (it increases consumer surplus),
but these benefits tend to be modest because it consists of marginal-value vehicle travel
that users are most willing to forego if their costs increase.

Congestion Evaluation Best Practices Victoria Transport Policy Institute
7
Barrier Effect
Wider roads and increased vehicle traffic tend to degrade walking and cycling access, and
therefore public transit access since most transit trips include walking and cycling links.
This is called the barrier effect or severance (34, 35). This impact can be significant,
particularly in urban areas (36).
Confounding Factors
All else being equal, traffic congestion tends to increase with city size (population),
density and employment rates. It is important to account for confounding factors such as
these when evaluating the effectiveness of specific congestion reduction strategies. For
example, some researchers find a positive correlation between public transit travel and
traffic congestion, which they claim proves that transit improvements are ineffective at
reducing congestion (37), but their research failed to account for factors such as city size,
density and employment, resulting in inaccurate results and conclusions (38).
Analysis Scale
It is important to evaluate congestion impacts using appropriate geographic scale and
scope. This usually means corridor scale analysis. Although transit only carries a minor
portion of total regional travel, its mode share tends to be much higher on congested
urban corridors. As a result, an automobile-to-transit mode shift that seems small
measured at the regional scale may provide significant congestion reductions. For
example, although Los Angeles has only 11% transit commute mode share, one study
found that transit reduces regional congestion costs by 11% to 38%, and when a strike
halted transit service, average highway congestion delay increased 47% (39, 40).
Evaluating Economic Efficiency
Efficiency refers to the ratio of benefits (outputs) to costs (inputs). Engineers and
economists both use this term but define and measure it differently. Traditional traffic
engineering evaluates roadway efficiency based on vehicle capacity and speed using
indicators such as roadway level-of-service; the new planning paradigm evaluates
roadway efficiency based on mobility, the capacity and speed of person and goods
transport (41). This recognizes that roads can become more efficient by favoring higher-
occupant vehicles. For example, a bus- and High Occupant Vehicles (HOV) lane often
carries more passengers than a general traffic lane, so increasing travel speeds on such
lanes increases roadway efficiency by allowing the road to carry more total passengers.
Economists also consider variations in the value of travel when evaluating transportation
efficiency. Economic efficiency increases if higher value travel receives priority in
traffic. For example, freight and other commercial vehicles, buses and other HOVs tend
to have values of travel time, so giving them priority in traffic tends to increase economic
efficiency. This can be achieved with special lanes, or even better, with congestion
pricing (road tolls with higher fees during congested conditions) that allows vehicles with
higher travel time values to outbid lower-value vehicles for scarce road space.
Economically optimal road pricing uses peak period tolls to reduce traffic volumes to
optimal levels, which is typically level-of-service C or D (42), or higher based on
consumer demand; in some situations users might be willing to pay tolls to allow LOS B
Congestion Evaluation Best Practices Victoria Transport Policy Institute
8
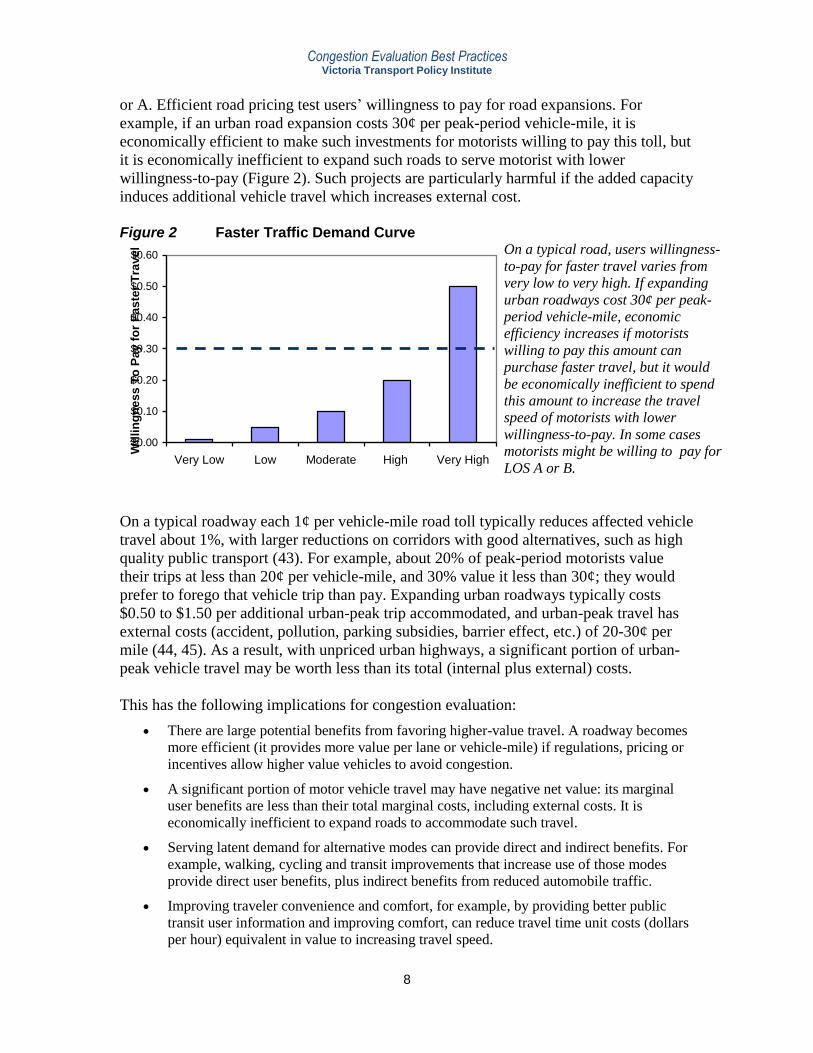
or A. Efficient road pricing test users’ willingness to pay for road expansions. For
example, if an urban road expansion costs 30¢ per peak-period vehicle-mile, it is
economically efficient to make such investments for motorists willing to pay this toll, but
it is economically inefficient to expand such roads to serve motorist with lower
willingness-to-pay (Figure 2). Such projects are particularly harmful if the added capacity
induces additional vehicle travel which increases external cost.
Figure 2 Faster Traffic Demand Curve
$0.00
$0.10
$0.20
$0.30
$0.40
$0.50
$0.60
Very Low Low Moderate High Very High
Wil
lin
gn
es
s T
o P
ay
fo
r F
as
ter
Tra
ve
l
On a typical road, users willingness-
to-pay for faster travel varies from
very low to very high. If expanding
urban roadways cost 30¢ per peak-
period vehicle-mile, economic
efficiency increases if motorists
willing to pay this amount can
purchase faster travel, but it would
be economically inefficient to spend
this amount to increase the travel
speed of motorists with lower
willingness-to-pay. In some cases
motorists might be willing to pay for
LOS A or B.
On a typical roadway each 1¢ per vehicle-mile road toll typically reduces affected vehicle
travel about 1%, with larger reductions on corridors with good alternatives, such as high
quality public transport (43). For example, about 20% of peak-period motorists value
their trips at less than 20¢ per vehicle-mile, and 30% value it less than 30¢; they would
prefer to forego that vehicle trip than pay. Expanding urban roadways typically costs
$0.50 to $1.50 per additional urban-peak trip accommodated, and urban-peak travel has
external costs (accident, pollution, parking subsidies, barrier effect, etc.) of 20-30¢ per
mile (44, 45). As a result, with unpriced urban highways, a significant portion of urban-
peak vehicle travel may be worth less than its total (internal plus external) costs.
This has the following implications for congestion evaluation:
There are large potential benefits from favoring higher-value travel. A roadway becomes
more efficient (it provides more value per lane or vehicle-mile) if regulations, pricing or
incentives allow higher value vehicles to avoid congestion.
A significant portion of motor vehicle travel may have negative net value: its marginal
user benefits are less than their total marginal costs, including external costs. It is
economically inefficient to expand roads to accommodate such travel.
Serving latent demand for alternative modes can provide direct and indirect benefits. For
example, walking, cycling and transit improvements that increase use of those modes
provide direct user benefits, plus indirect benefits from reduced automobile traffic.
Improving traveler convenience and comfort, for example, by providing better public
transit user information and improving comfort, can reduce travel time unit costs (dollars
per hour) equivalent in value to increasing travel speed.
Congestion Evaluation Best Practices Victoria Transport Policy Institute
9
Additional Costs and Benefits
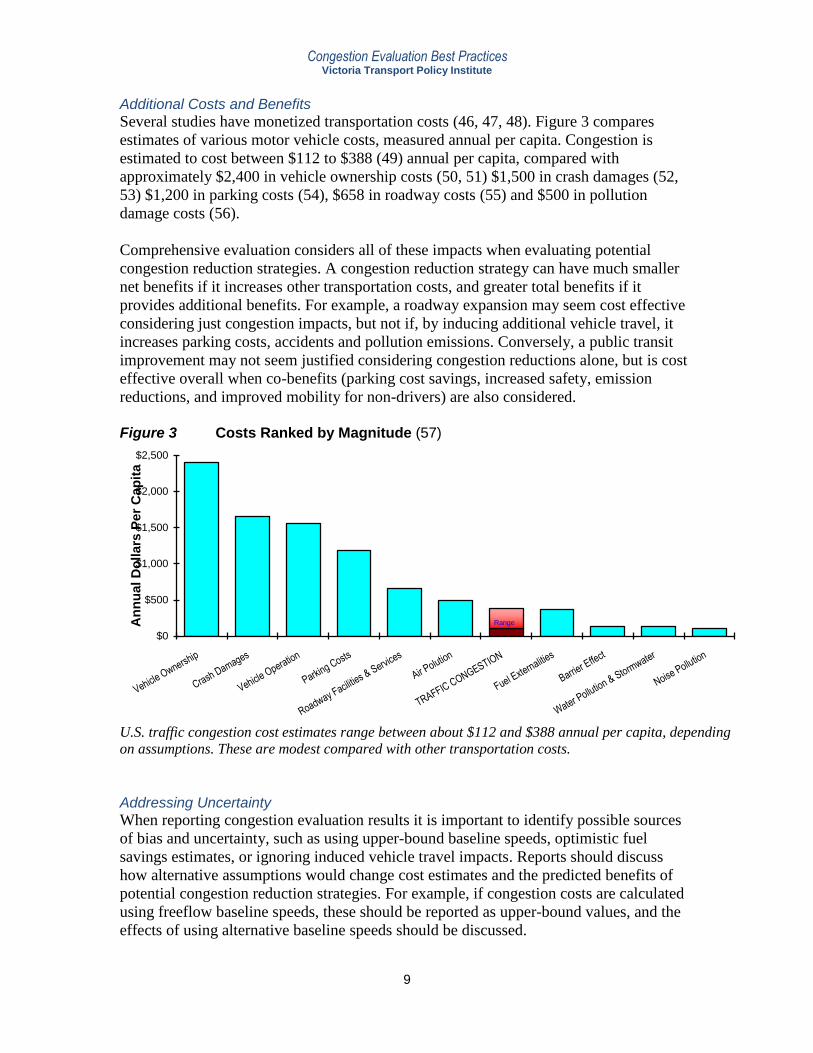
Several studies have monetized transportation costs (46, 47, 48). Figure 3 compares
estimates of various motor vehicle costs, measured annual per capita. Congestion is
estimated to cost between $112 to $388 (49) annual per capita, compared with
approximately $2,400 in vehicle ownership costs (50, 51) $1,500 in crash damages (52,
53) $1,200 in parking costs (54), $658 in roadway costs (55) and $500 in pollution
damage costs (56).
Comprehensive evaluation considers all of these impacts when evaluating potential
congestion reduction strategies. A congestion reduction strategy can have much smaller
net benefits if it increases other transportation costs, and greater total benefits if it
provides additional benefits. For example, a roadway expansion may seem cost effective
considering just congestion impacts, but not if, by inducing additional vehicle travel, it
increases parking costs, accidents and pollution emissions. Conversely, a public transit
improvement may not seem justified considering congestion reductions alone, but is cost
effective overall when co-benefits (parking cost savings, increased safety, emission
reductions, and improved mobility for non-drivers) are also considered.
Figure 3 Costs Ranked by Magnitude (57)
$0
$500
$1,000
$1,500
$2,000
$2,500
Vehicle Ownership
Crash Damages
Vehicle Operation
Parking Costs
Roadway Facilities & Services
Air Polution
TRAFFIC CONGESTION
Fuel Externalitie
s
Barrier E
ffect
Water Pollution & Storm
water
Noise Pollution
An
nu
al D
oll
ars
Pe
r C
ap
ita
Range
U.S. traffic congestion cost estimates range between about $112 and $388 annual per capita, depending
on assumptions. These are modest compared with other transportation costs.
Addressing Uncertainty
When reporting congestion evaluation results it is important to identify possible sources
of bias and uncertainty, such as using upper-bound baseline speeds, optimistic fuel
savings estimates, or ignoring induced vehicle travel impacts. Reports should discuss
how alternative assumptions would change cost estimates and the predicted benefits of
potential congestion reduction strategies. For example, if congestion costs are calculated
using freeflow baseline speeds, these should be reported as upper-bound values, and the
effects of using alternative baseline speeds should be discussed.

Congestion Evaluation Best Practices Victoria Transport Policy Institute
10
It is a good practice to perform sensitivity analysis to indicate how results would change
with different input values. For example, Figure 4 illustrates sensitivity analysis applied
to the Urban Mobility Report (58) using alternative baseline and travel time values.
Figure 4 Congestion Cost Estimate (59)
$121
$64
$32
$0
$20
$40
$60
$80
$100
$120
$140
Urban Mobility
Report (100%,
$16.79/hr)
Mid-Range
(70%, $12.00/hr)
Lower-Range
(50%, $8.37/hr)
Bil
lio
n D
oll
ars
(2011)
The Urban Mobility Report’s
$121 billion cost estimate is based
on higher baseline speeds and
travel time unit costs than most
economists recommend. The Mid-
Range is based on 70% of
baseline speeds and the U.S.
Department of Transportation’s
recommended $12.00 per hour
travel time unit costs; the lower-
range estimate is based on 50% of
baseline speed and the USDOT’s
lower travel time unit costs.

Congestion Evaluation Best Practices Victoria Transport Policy Institute
11
Summary of Congestion Costing Factors
Table 3 summarizes various factors to consider when evaluating traffic congestion costs.
Table 3 Congestion Costing Factors
Factor Recommended Best Practices Impacts on Evaluation
Congestion
indicators
For planning purposes, congestion impacts
should be evaluated using cost rather than
intensity indicators.
Intensity indicators ignore the influence of
mode share and trip distance on total congestion
costs.
Baseline speeds
Capacity-optimizing or user willingness-
to-pay for reduced delay.
Freeflow baseline speeds tend to exaggerate
congestion costs.
Travel time cost
values
Use values reflecting affected motorists’
willingness-to-pay for faster travel.
Excessive travel time values tend to exaggerate
congestion costs.
Speed-fuel
economy function
Account for the increased fuel
consumption and emissions caused by
traffic speeds over 50 mph.
Ignoring these effects exaggerates congestion
costs and roadway expansion benefits.
Crash risk
Account for increased crash costs that may
result from reduced congestion.
Ignoring this effect exaggerates congestion costs
and roadway expansion benefits.
Generated and
induced vehicle
travel
Recognize the tendency of traffic to be
self-limiting when projecting future
congestion costs. Account for generated
and induced vehicle travel impacts when
evaluating roadway expansions.
Ignoring the tendency of congestion to be self-
limiting tends to exaggerate future congestion
cost projections. Ignoring generated and
induced travel tends to exaggerate roadway
expansion benefits.
Confounding
factors
Take into account positive relationships
between traffic congestion, city size,
density and employment when evaluating
congestion reduction effectiveness.
Failing to account for these factors tends to
underestimate the effectiveness of public transit
improvements and smart growth policies in
reducing congestion costs.
Analysis scale
Use appropriate geographic scale
(generally urban corridors or centers).
Since traffic congestion is concentrated on
specific corridors, regional analysis can seldom
account for congestion impacts.
Barrier effect
Account for the tendency of wider roads
and increased traffic to reduce walking,
cycling and transit accessibility.
Ignoring this impact exaggerates roadway
expansion benefits.
Economic
efficiency
Consider economic efficiency when
evaluating potential congestion reduction
strategies. Recognize that some road users
have high willingness to pay.
Ignoring economic efficiency undervalues
congestion pricing and HOV priority policies.
Expand roads based on users’ willingness-to-
pay (if demand is sufficient, expand roads and
provide LOS A or B).
Additional costs
and benefits
Consider other costs and benefits, besides
congestion, when evaluating potential
congestion reduction strategies.
Ignoring additional impacts tends to exaggerate
roadway expansion benefits and undervalues
other strategies that provide co-benefits.
Addressing
uncertainty
Document all assumptions, discuss
potential biases, and perform sensitivity
analysis indicating how results would
change with different inputs.
Failing to identify possible biases and failing to
apply sensitivity analysis creates unjustified
confidence in results.
This table summarizes recommendations for comprehensive congestion evaluation.

Congestion Evaluation Best Practices Victoria Transport Policy Institute
12
Comprehensive Evaluation of Potential Congestion Reduction Strategies This analysis evaluates five potential traffic congestion reduction strategies:
Unpriced (no toll is charged) urban roadway expansions.
Alternative mode improvements, including walking, cycling, ridesharing, telework, and
particularly high-quality, grade-separated public transit services.
Pricing reforms, including road tolls, parking pricing (including cash out, which means
that travelers have the option of choose cash instead of a parking subsidy), fuel price
increases, distance-based insurance premiums, and particularly congestion pricing (road
tolls that are higher under congested conditions)
Smart growth policies that create more compact, mixed, multi-modal development.
Various Transportation Demand Management (TDM) programs, such as commute trip
reduction programs, mobility management marketing, parking management, and other
programs that encourage travelers to use more efficient modes.
All of these strategies can reduce traffic congestion, but their overall impacts vary
significantly. For example, roadway expansions reduce the traffic congestion intensity on
the expanded roads, but this benefit tends to decline over the long-run due to induced
vehicle travel which tends to increase external costs including downstream congestion,
parking demand, accident damages, pollution emissions and sprawl-related costs.
Analysis which ignores these factors will exaggerate roadway expansions net benefits.
Other congestion reduction strategies tend to have other impacts. For example, improving
alternative modes tends to improve mobility options for non-drivers (and therefore helps
achieve social equity objectives), increase affordability, reduce total accidents, pollution
emissions and sprawl-related costs. Pricing reforms increase costs to motorists and
generates revenue (an economic transfer, the resource costs are any additional transaction
costs), and by reducing total traffic can reduce external costs. Smart growth policies tend
to improve overall accessibility, may increase local congestion intensity (due increased
density), reduce total vehicle travel and associated costs, reduce the costs of providing
public services and preserve openspace. TDM programs have various benefits and costs,
depending on type.
Most of these strategies have direct implementation costs, such as the costs of improving
alternative modes, collecting tolls, or operating TDM programs, which are relatively easy
to determine, and some impose user costs, such as the effort for motorists to pay tolls.
The incremental user costs (changes in consumer surplus) associated with mode shifts
varies depending on specific conditions: if travelers shift in response to negative
incentives such as road tolls, they tend to be directly worse off (ignoring indirect impacts
provided by the revenue, such as reductions in other taxes); if they shift in response to
positive incentives such as improvements to alternative modes or financial rewards such
as parking cash out, they are generally better off or they would not make the change.
Some strategies have mixed user impacts. For example, converting a general traffic lane
into a bus lane tends to benefit bus operators (due to improved operating efficiency) and
bus passengers, but may increase congestion delay to motorists.

Congestion Evaluation Best Practices Victoria Transport Policy Institute
13
Some strategies have synergistic effects; they are more effective if implemented together.
For example, public transit improvements, efficient parking pricing and more compact
development might individually only reduce vehicle travel 5%, but if implemented
together provide 30% reductions because their effects are complementary. For this
reason, such strategies should be evaluated as integrated programs.
Comprehensive congestion evaluation considers all of these factors. Table 4 summarizes
these impacts and the degree they are considered in conventional transport modelling and
planning. This indicates that conventional evaluation tends to exaggerate roadway
expansion benefits by ignoring induced travel and the resulting increases in external
costs, and undervalues other strategies that provide significant co-benefits. Failure to
consider some motorists high willingness-to-pay for high quality road services (e.g., LOS
A or B) can undervalue congestion pricing and roadway capacity expansions.
Table 4 Congestion Reduction Strategies
Roadway Expansion
Improve Alt. Modes
Pricing Reforms
Smart Growth
TDM Programs
Congestion
impacts
Reduces short-run
congestion, but
this declines over
time due to
generated traffic.
Reduces but does
not eliminate
congestion.
Can significantly
reduce congestion.
May increase
local congestion
intensity but
reduces per capita
congestion costs.
Can reduce
congestion delays
and the costs to
users of those
delays
Direct user
impacts
Direct benefits to
peak-period
motorists.
Direct benefits to
existing and new
users.
Most increase user
costs (except parking
cash out and distance-
based pricing).
Mixed, depending
on specific
conditions and
user preferences.
Mixed, depending
on specific
conditions and
user preferences.
Additional
costs and
benefits
By inducing
additional vehicle
travel and sprawl
it tends to
increase indirect
costs. Minimal
co-benefits. Small
energy savings
and emission
reductions.
Numerous co-
benefits: parking
savings, improved,
safety and health,
better access for
non-drivers, user
savings, energy
conservation,
emission reductions,
etc.
Numerous co-
benefits. Revenue,
parking savings,
traffic safety, energy
conservation,
emission reductions,
improved public
health, etc. Overall
impacts depend on
use of revenues.
Numerous co-
benefits including
infrastructure
savings, safety
and health, user
savings, emission
reductions,
improved
accessibility for
non-drivers, etc.
Depends on
program type.
Most provide
significant co-
benefits.
Consideration
in traffic
modeling
Models often
exaggerate
benefits by
underestimating
generated traffic
and induced
travel.
Models often
underestimate the
congestion
reduction benefits
of high quality
alternative modes.
Varies. Can generally
evaluate congestion
pricing but are less
accurate for other
reforms such as
parking pricing.
Models often
underestimate
smart growth’s
ability to reduce
vehicle travel and
therefore
congestion.
Sometimes
considered.
Consideration
in current
planning
Commonly
considered and
funded.
Sometimes
considered,
particularly in large
cities.
Sometimes considered
but seldom
implemented.
Not generally
considered a
congestion
reduction strategy.
Sometimes
considered,
particularly in
large cities.
Congestion reduction strategies vary in their additional benefits and costs. Current traffic models and
planning practices tend to overlook or undervalue many of these impacts.
Congestion Evaluation Best Practices Victoria Transport Policy Institute
14
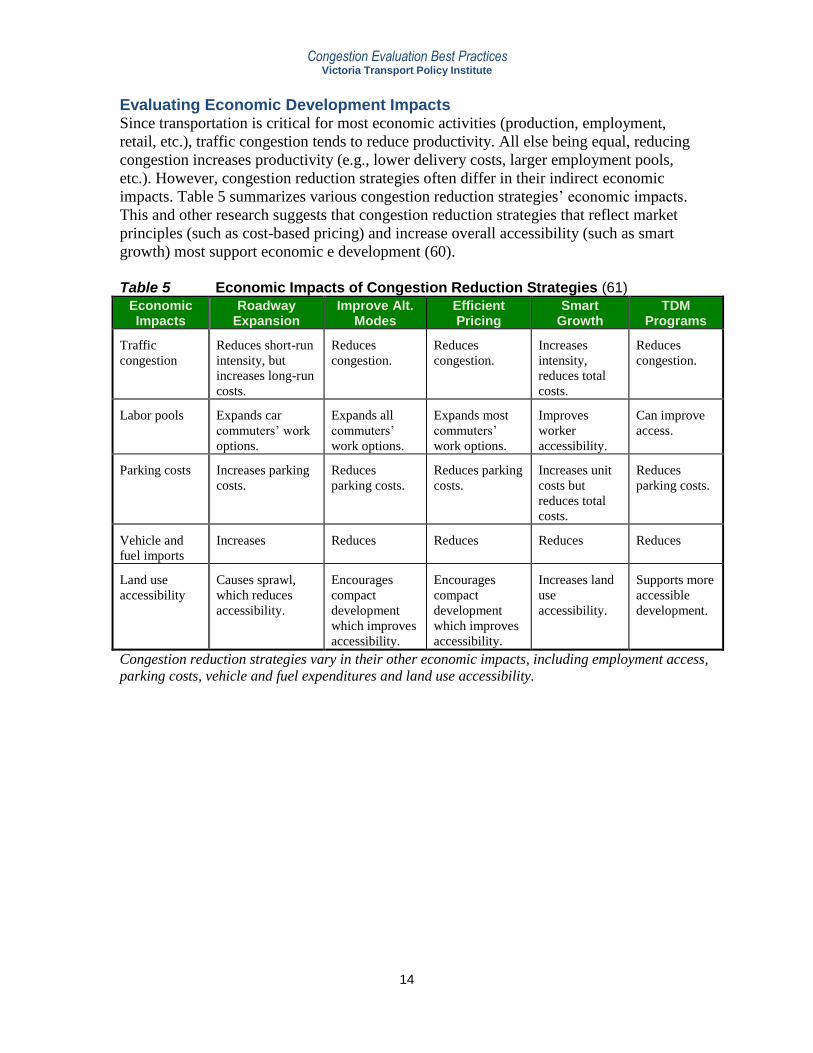
Evaluating Economic Development Impacts Since transportation is critical for most economic activities (production, employment,
retail, etc.), traffic congestion tends to reduce productivity. All else being equal, reducing
congestion increases productivity (e.g., lower delivery costs, larger employment pools,
etc.). However, congestion reduction strategies often differ in their indirect economic
impacts. Table 5 summarizes various congestion reduction strategies’ economic impacts.
This and other research suggests that congestion reduction strategies that reflect market
principles (such as cost-based pricing) and increase overall accessibility (such as smart
growth) most support economic e development (60).
Table 5 Economic Impacts of Congestion Reduction Strategies (61)
Economic Impacts
Roadway Expansion
Improve Alt. Modes
Efficient Pricing
Smart Growth
TDM Programs
Traffic
congestion
Reduces short-run
intensity, but
increases long-run
costs.
Reduces
congestion.
Reduces
congestion.
Increases
intensity,
reduces total
costs.
Reduces
congestion.
Labor pools Expands car
commuters’ work
options.
Expands all
commuters’
work options.
Expands most
commuters’
work options.
Improves
worker
accessibility.
Can improve
access.
Parking costs Increases parking
costs.
Reduces
parking costs.
Reduces parking
costs.
Increases unit
costs but
reduces total
costs.
Reduces
parking costs.
Vehicle and
fuel imports
Increases Reduces Reduces Reduces Reduces
Land use
accessibility
Causes sprawl,
which reduces
accessibility.
Encourages
compact
development
which improves
accessibility.
Encourages
compact
development
which improves
accessibility.
Increases land
use
accessibility.
Supports more
accessible
development.
Congestion reduction strategies vary in their other economic impacts, including employment access,
parking costs, vehicle and fuel expenditures and land use accessibility.

Congestion Evaluation Best Practices Victoria Transport Policy Institute
15
Conclusions It is important to accurately evaluate congestion impacts for transport planning. Various
factors can affect congestion cost estimates and the valuation of congestion reduction
strategies. Best practices include:
Evaluate transport system performance based on overall accessibility (people’s overall
ability to reach desired services and activities) rather than just vehicle traffic speeds.
Measure congestion costs rather than intensity. Congestion intensity indicators do not
account for congestion exposure (the amount residents drive during peak periods), and so
undervalue strategies that improve transport options or reduce trip distances.
Measure delays to all travelers, not just to motorists.
Use efficiency-optimizing (typically LOS C), rather than freeflow baseline speeds.
Efficiency-optimizing speeds maximize roadway capacity and fuel economy, and generally
reflect average road users’ willingness to pay for roadway capacity.
Use travel time values that reflect users’ actual willingness-to-pay for incremental speed
gains. For value priced lanes (lanes available for a fee) use consumer surplus analysis. For
general travel time savings, this is typically 30-50% of average wages for personal travel,
and wages, benefits and equipment costs for commercial travel.
Calculate the marginal congestion costs imposed by road users, rather than just the costs they
bear, when calculating transport prices and comparing congestion costs of different modes.
Recognize variations in travel time values, and therefore the efficiency gains provided by
policies that favor higher value over lower-value trips, such as congestion pricing. Recognize
that some motorists have very high values of time and are willing to pay for LOS A or B.
Use accurate fuel efficiency functions. Vehicle fuel efficiency generally peaks at about 50
miles per hour, so reducing moderate congestion (LOS C) often increases fuel consumption
and emissions, particularly if it induces additional vehicle travel.
Recognize that congestion tends to maintain self-limiting equilibrium: it increases to the
point that delays limit further peak-period vehicle travel. As a result, traffic volumes and
congestion costs seldom increase as much as predicted by extrapolating past trends.
Account for generated and induced vehicle travel when evaluating roadway capacity
expansions. These tend to reduce predicted congestion reduction benefits, provide user
benefits, and increase external costs.
Account for increased crash costs that result if congestion reductions lead to high traffic speeds.
Account for co-benefits when evaluating congestion reduction strategies. Strategies that
improve alternative modes, reduce total vehicle travel or increase land use accessibility tend
to reduce parking costs, provide user savings, improve non-drivers’ accessibility, increase
safety and health, reduce pollution emissions, and support strategic land use objectives.
Evaluate impacts on specific corridors. Although alternative modes, such as public transit,
may serve a small portion of total regional travel, their mode share is often much higher on
major urban corridors, so they can provide significant congestion reductions.
Apply comprehensive evaluation of economic productivity, including impacts on consumer
expenditures, non-drivers employment access, and development patterns.
Identify potential sources of bias and variability, and apply sensitivity analysis to test
alternative assumptions.

Congestion Evaluation Best Practices Victoria Transport Policy Institute
16
It is important that everybody involved in urban transportation planning understand how
these factors can influence congestion impact evaluation. More comprehensive and
accurate evaluation can help practitioners identify truly optimal solutions to congestion
problems that best respond to user demands and community values.
Acknowledgements Thanks to Bruce Lambert, Professor David Matthew Levinson and Ilona Kastenhofer for
their contributions to this article. The views expressed, and any errors it contains, are my
own.

Congestion Evaluation Best Practices Victoria Transport Policy Institute
17
Endnotes
1 Amudapuram Mohan Rao and Kalaga Ramachandra Rao (2012), “Measuring Urban Traffic Congestion –
A Review,” International Journal for Traffic and Transport Engineering, Vol. 2, No. 4, pp. 286-305; at
www.ijtte.com/uploads/2012-12-05/5ebd8343-5666-d395IJTTE_Vol%202(4)_1.pdf.
2 Todd Litman (2012), Smart Congestion Relief: Comprehensive Analysis Of Traffic Congestion Costs and
Congestion Reduction Benefits, Paper P12-5310, Transportation Research Board Annual Meeting; at
www.vtpi.org/cong_relief.pdf.
3 BTRE (2007), Estimating Urban Traffic And Congestion Cost Trends For Australian Cities, Working
Paper No 71. Bureau of Transport and Regional Economics (www.btre.gov.au); at
www.btre.gov.au/info.aspx?ResourceId=249&NodeId=59.
4 Susan Grant-Muller and James Laird (2007), International Literature Review of the Costs of Road Traffic
Congestion, Scottish Executive (www.scotland.gov.uk); at
www.scotland.gov.uk/Publications/2006/11/01103351/0.
5 TC (2006), The Cost Of Urban Congestion In Canada, Transport Canada (www.tc.gc.ca); at www.adec-
inc.ca/pdf/02-rapport/cong-canada-ang.pdf.
6 Ian Wallis and David Lupton (2013), The Costs Of Congestion Reappraised, Report 489, New Zealand
Transport Agency (www.nzta.govt.nz); at www.nzta.govt.nz/resources/research/reports/489/docs/489.pdf.
7 Todd Litman (2013), “Smarter Congestion Relief In Asian Cities: Win-Win Solutions To Urban Transport
Problems,” Transport and Communications Bulletin for Asia and the Pacific, No. 82
(www.unescap.org/publications/detail.asp?id=1581 ); at
www.unescap.org/ttdw/Publications/TPTS_pubs/bulletin82/b82_Chapter1.pdf.
8 TTI (annual reports), Urban Mobility Study, Texas Transportation Institute (http://mobility.tamu.edu).
9 Todd Litman (2009), “Congestion Costs,” Transportation Cost and Benefit Analysis, Victoria Transport
Policy Institute (www.vtpi.org/tca).
10 Todd Litman (2003), “Measuring Transportation: Traffic, Mobility and Accessibility,” ITE Journal
(www.ite.org), Vol. 73, No. 10, October, pp. 28-32, at www.vtpi.org/measure.pdf.
11 Jonathan Levine, Joe Grengs, Qingyun Shen and Qing Shen (2012), “Does Accessibility Require Density
or Speed?” Journal of the American Planning Association, Vol. 78, No. 2, pp. 157-172,
http://dx.doi.org/10.1080/01944363.2012.677119; at www.connectnorwalk.com/wp-
content/uploads/JAPA-article-mobility-vs-proximity.pdf.
12 J. Richard Kuzmyak (2012), Land Use and Traffic Congestion, Report 618, Arizona DOT
(www.azdot.gov); at www.azdot.gov/TPD/ATRC/publications/project_reports/PDF/AZ618.pdf.
13 David Levinson (2013), Access Across America, Report 13, Access to Destinations Study, Center for
Transportation at the University of Minnesota (www.cts.umn.edu); at
www.cts.umn.edu/Publications/ResearchReports/pdfdownload.pl?id=2280.
14 Joe Cortright (2010), Driven Apart: How Sprawl is Lengthening Our Commutes and Why Misleading
Mobility Measures are Making Things Worse, CEOs for Cities (www.ceosforcities.org); at
www.ceosforcities.org/work/driven-apart.
15 TRB (2010), Highway Capacity Manual, Transportation Research Board (www.trb.org).

Congestion Evaluation Best Practices Victoria Transport Policy Institute
18
16 Grant-Muller and Laird (2007).
17 BTRE (2007).
18 Wallis and Lupton (2013).
19 TC (2006).
20 TTI (2012).
21 Grant-Muller and Laird (2007).
22 “Travel Time Costs,” Litman (2009)
23 NCHRP (2006), Estimating Toll Road Demand and Revenue, NCHRP Synthesis 364, TRB
(www.trb.org); at: http://onlinepubs.trb.org/onlinepubs/nchrp/nchrp_syn_364.pdf.
24 Parsons Brinckerhoff (2012), Improving our Understanding of How Highway Congestion and Price
Affect Travel Demand: Executive Summary and Technical Report, SHRP 2 Capacity Project C04,
Transportation Research Board (www.trb.org); at
http://onlinepubs.trb.org/onlinepubs/shrp2/SHRP2prepubC04.pdf.
25 USDOT (2011), The Value of Travel Time Savings: Departmental Guidance for Conducting Economic
Evaluations, U.S. Department of Transportation (www.usdot.gov); at
http://ostpxweb.dot.gov/policy/reports/vot_guidance_092811c.pdf.
26 Matthew Barth and Kanok Boriboonsomin (2009), “Traffic Congestion And Greenhouse Gases,” Access
35, University of California Transportation Center (www.uctc.net), pp. 2-9; at
www.uctc.net/access/35/access35_Traffic_Congestion_and_Grenhouse_Gases.pdf.
27 Alexander York Bigazzi and Miguel Figliozzi (2012), “Congestion And Emissions Mitigation: A
Comparison Of Capacity, Demand, And Vehicle Based Strategies,” Transportation Research Part D:
Transport and Environment, Vol. 17, pp. 538-547,
www.sciencedirect.com/science/article/pii/S1361920912000727.
28 Min Zhou and Virginia Sisiopiku (1997), “On the Relationship Between Volume to Capacity Ratios in
Accident Rates,” Transportation Research Record 1581, Transportation Research Board (www.trb.org),
pp. 47-52; http://trb.metapress.com/content/b738x782168555g7.
29 Paula Marchesini and Wendy Weijermars (2010), The Relationship Between Road Safety And Congestion
On Motorways: A Literature Review Of Potential Effects, Report R-2010-12, SWOV Institute for Road
Safety Research (www.swov.nl); at www.swov.nl/rapport/R-2010-12.pdf.
30 Wallis and Lupton (2013).
31 Robert Cervero (2003), “Road Expansion, Urban Growth, and Induced Travel: A Path Analysis,” Journal
of the American Planning Association, Vol. 69, No. 2 (www.planning.org), Spring, pp. 145-163.
32 Todd Litman (2001), “Generated Traffic; Implications for Transport Planning,” ITE Journal, Vol. 71,
No. 4, April, pp. 38-47, ITE (www.ite.org); at www.vtpi.org/gentraf.pdf.
33 Litman (2001).

Congestion Evaluation Best Practices Victoria Transport Policy Institute
19
34 Todd Litman (2009), “Barrier Effect,” Transportation Cost and Benefit Analysis: Techniques, Estimates
and Implications, Victoria Transport Policy Institute (www.vtpi.org); at www.vtpi.org/tca/tca0513.pdf.
35 DfT (2009), Transport Analysis Guidance: 3.6.2: The Severance Sub-Objective, Department for
Transport (www.dft.gov.uk); at www.dft.gov.uk/webtag/documents/expert/unit3.6.2.php.
36 Richard Dowling, et al. (2008), Multimodal Level Of Service Analysis For Urban Streets, NCHRP
Report 616, Transportation Research Board (www.trb.org); at http://trb.org/news/blurb_detail.asp?id=9470.
37 Thomas A. Rubin and Fatma Mansour (2013), Transit Utilization and Traffic Congestion: Is There a
Connection?, Reason Foundation (www.reason.org); at
http://reason.org/files/transit_utilization_traffic_congestion.pdf.
38 Todd Litman (2014), Critique of “Transit Utilization and Traffic Congestion: Is There a Connection?”
Victoria Transport Policy Institute (www.vtpi.org); at www.vtpi.org/R&M_critique.pdf.
39 Michael L. Anderson (2013), Subways, Strikes, and Slowdowns: The Impacts of Public Transit on Traffic
Congestion, Working Paper No. 18757, National Bureau of Economic Research (www.nber.org); at
www.nber.org/papers/w18757.
40 Shih-Che Lo and Randolph W. Hall (2006), “Effects of the Los Angeles Transit Strike On Highway
Congestion,” Transportation Research A, Vol. 40, No. 10 (www.elsevier.com/locate/tra), December 2006,
pp. 903-917.
41 Todd Litman (2013), “The New Transportation Planning Paradigm,” ITE Journal (www.ite.org), Vo. 83,
No. 6, pp. 20-28; at http://digitaleditions.sheridan.com/publication/?i=161624.
42 Timothy D. Hau (1998), “Congestion Pricing and Road Investment,” in Road Pricing, Traffic Congestion
and the Environment: Issues of Efficiency and Social Feasibility (K.J. Button and E.T. Verhoef, eds.),
Edward Elgar (www.e-elgar.co.uk), pp. 39-78; at www.econ.hku.hk/~timhau/download.html.
43 Steven Spears, Marlon G. Boarnet and Susan Handy (2010), Draft Policy Brief on the Impacts of Road
User Pricing Based on a Review of the Empirical Literature, for Research on Impacts of Transportation
and Land Use-Related Policies, California Air Resources Board
(http://arb.ca.gov/cc/sb375/policies/policies.htm).
44 Todd Litman (2009), Transportation Cost and Benefit Analysis, Victoria Transport Policy Institute
(www.vtpi.org/tca).
45 Kara Kockelman, T. Donna Chen and Brice Nichols (2013), The Economics of Transportation Systems:
A Reference for Practitioners, Center for Transportation Research (www.utexas.edu/research/ctr); at
www.utexas.edu/research/ctr/pdf_reports/0_6628_P1.pdf.
46 Kockelman, Chen and Nichols (2013).
47 Litman (2009).
48 TC (2005-08).
49 The higher value is the Urban Mobility Report’s $121 billion estimate, divided by 310 million residents.
The lower value is this estimate recalculated using a 50% baseline speed and $8.37 per hour time value, as
discussed in Litman, 2012.

Congestion Evaluation Best Practices Victoria Transport Policy Institute
20
50 Based on “Vehicle Purchases” and “Other Vehicle Expenses” expenditures reported in the 2011 Bureau
of Labor Statistics’ Consumer Expenditure Survey.
51 AAA (2012), Your Driving Costs, American Automobile Association (www.aaa.com).
52 Cambridge Systematics (2011), Crashes vs. Congestion – What’s the Cost to Society?, American
Automobile Association (www.aaa.com); at bit.ly/AAAcrashes2011.
53 Lawrence Blincoe, et al. (2002), Economic Cost of Motor Vehicle Crashes 2000, USDOT, Pub. DOT HS
809 446. NHTSA (www.nhtsa.gov).
54 Donald Shoup (2005), The High Cost of Free Parking, Planners Press (www.planning.org).
55 FHWA (2011), Highway Statistics, FHWA, USDOT (www.fhwa.dot.gov/policy/ohpi/hss/hsspubs.cfm).
56 EDRG (2007), Monetary Valuation of Hard-to-Quantify Transportation Impacts: Valuing
Environmental, Health/Safety & Economic Development Impacts, NCHRP 8-36-61, TRB (www.trb.org).
57 Litman (2009).
58 TTI (2012).
59 Litman (2013).
60 Cambridge Systematics (2012), Assessing The Economic Benefit Of Transportation Infrastructure
Investment In A Mature Surface Transportation System, National Cooperative Highway Research Program,
Transportation Research Board (www.trb.org); at
http://onlinepubs.trb.org/onlinepubs/nchrp/docs/NCHRP20-24(80)_FR.pdf.
61 Matthias Sweet (2013), “Traffic Congestion’s Economic Impacts: Evidence from US Metropolitan
Regions,” Urban Studies, Vol. 50, No. 15;
http://usj.sagepub.com/content/early/2013/10/10/0042098013505883.
www.vtpi.org/ITED_congestion.pfd