connecticut labor force data for affirmative action plans · connecticut labor force data for...
TRANSCRIPT

Connecticut Department of Labor - Office of Research - Labor Market Information
ConnecticutConnecticutConnecticut Labor Force Labor Force Labor Force
Data for Data for Data for Affirmative Affirmative Affirmative
Action PlansAction PlansAction Plans
222ndndnd Quarter Quarter Quarter --- 2013 2013 2013
“All of us do not have equal talent, but all of us should have an equal opportunity
to develop our talents.” John F. Kennedy

Connecticut Data for Affirmative Action Plans ~ 2nd Quarter 2013
Connecticut Data for Affirmative Action Plans
Connecticut Data for Affirmative Action Plans provides labor force information for Connecticut and its nine labor market areas (LMAs). The data presented are designed to meet the requirements of the Office of Federal Contract Compliance Programs (OFCCP) and/or the Connecticut Commission on Human Rights and Opportunities (CHRO) for companies, State agencies, and municipalities that submit an Affirmative Action Plan. If you are completing an Affirmative Action Plan for a private company and you require regulations/guidelines to assist you in setting up your plan, please contact the OFCCP at (860) 240-4277. If you are completing an Affirmative Action Plan for a State agency, municipality, or any political subdivision, and you require regulation guidelines for setting up your plan, please contact the CHRO, Office of Diversity Programs at (860) 541-3400 or visit their contract compliance website at: http://www.ct.gov/chro/taxonomy/ct_taxonomy.asp?DLN=45583&chroNav=l45585l To order Equal Employment Opportunity posters at no charge, please contact either the OFCCP or the CHRO at the numbers listed above. If you need a listing of minority/female owned businesses, visit the Department of Administrative Services, Supplier Diversity Program’s website at: http://www.biznet.ct.gov/DASOpenAccess/SupplierDiversity/SDSearch.aspx Acknowledgement: Dana W. Placzek, Jungmin Charles Joo and Todd Bentsen prepared this report for publication.
This publication is available online at: www.ct.gov/dol
‘Labor Market Information’

Connecticut Department of Labor - Office of Research - Labor Market Information
Connecticut Data for Affirmative Action Plans 2nd Quarter 2013
TABLE OF CONTENTS
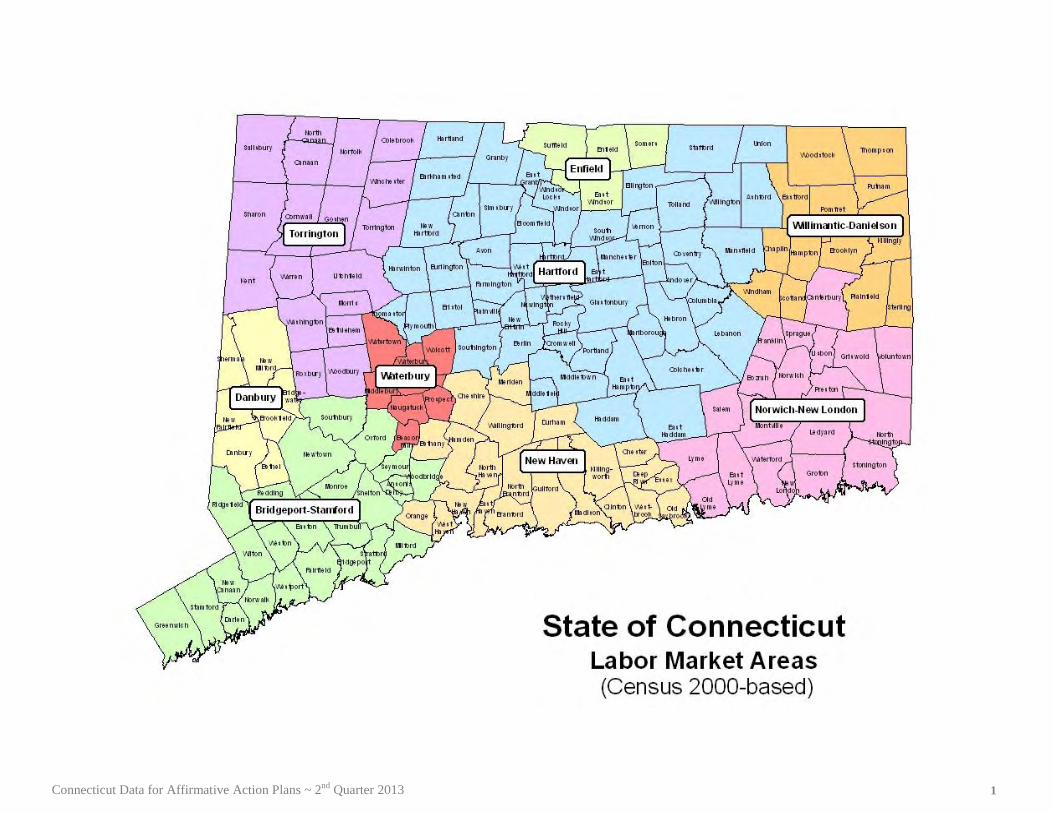
Connecticut Map ..................................................................................................................................................... 1 Shows boundaries and town composition of Connecticut’s labor market areas Estimated Total, Minority and Female Unemployment ...................................................................................... 2 Includes estimates of total State unemployment and of unemployed job seekers registered with CTWorks Career Centers Connecticut Job Seekers by Occupational Group ............................................................................................... 3 A graph showing the proportion of job seekers by major occupational group Characteristics of Job Seekers (Statewide and LMAs)........................................................................................ 4-42 Provides information on the broad occupational skills of job seekers, including female and minority job seekers, registered with CTWorks Career Centers
CONNECTICUT - STATEWIDE ................................................................................................................... 4-7
Bridgeport-Stamford Labor Market Area ..................................................................................................... 8-11
Danbury Labor Market Area .......................................................................................................................... 12-14
Enfield Labor Market Area ............................................................................................................................. 15-18
Hartford Labor Market Area .......................................................................................................................... 19-22
New Haven Labor Market Area...................................................................................................................... 23-26
Norwich-New London Labor Market Area.................................................................................................... 27-30
Torrington Labor Market Area ...................................................................................................................... 31-34
Waterbury Labor Market Area ...................................................................................................................... 35-38
Willimantic-Danielson Labor Market Area ................................................................................................... 39-42
Connecticut Data for Affirmative Action Plans ~ 2nd Quarter 2013 1
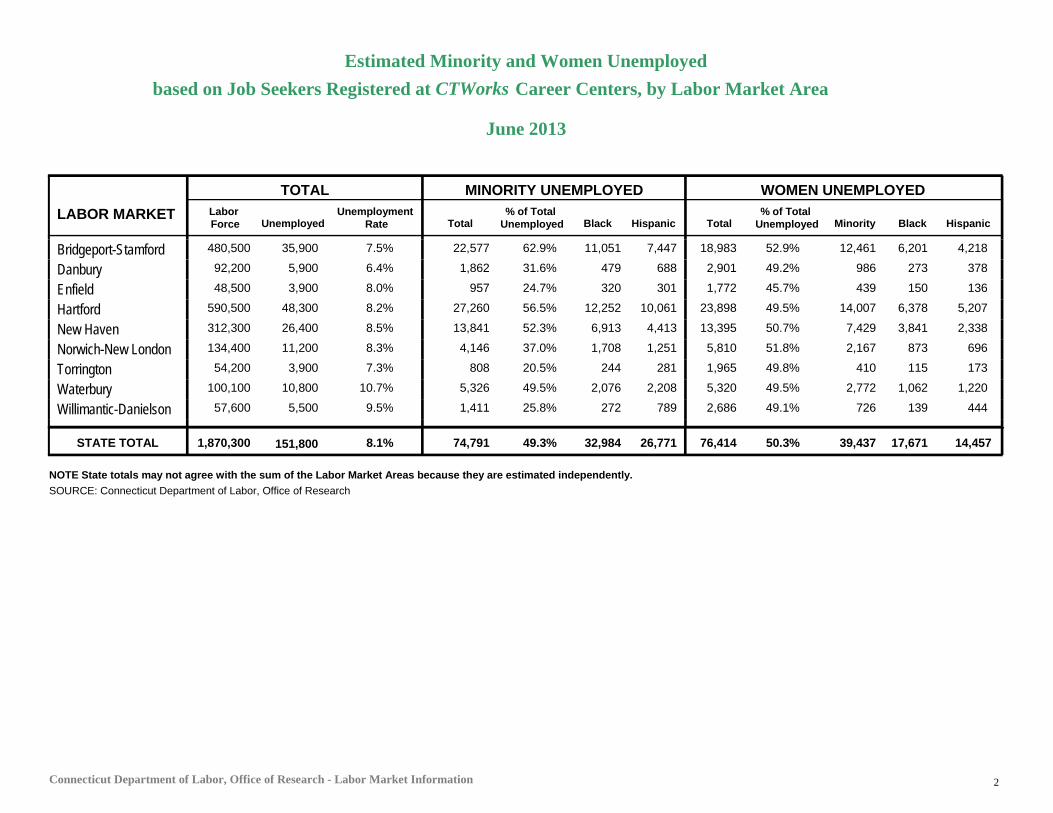
Estimated Minority and Women Unemployedbased on Job Seekers Registered at CTWorks Career Centers, by Labor Market Area
Unemployment Rate
Labor Force Unemployed
% of Total UnemployedTotal Black
WOMEN UNEMPLOYED% of Total
UnemployedLABOR MARKET
TOTAL MINORITY UNEMPLOYED
Total Black Hispanic HispanicMinority
June 2013
Bridgeport-Stamford 480,500 35,900 7.5% 22,577 62.9% 11,051 7,447 18,983 52.9% 12,461 6,201 4,218
Danbury 92,200 5,900 6.4% 1,862 31.6% 479 688 2,901 49.2% 986 273 378
Enfield 48,500 3,900 8.0% 957 24.7% 320 301 1,772 45.7% 439 150 136
Hartford 590,500 48,300 8.2% 27,260 56.5% 12,252 10,061 23,898 49.5% 14,007 6,378 5,207
New Haven 312,300 26,400 8.5% 13,841 52.3% 6,913 4,413 13,395 50.7% 7,429 3,841 2,338
Norwich-New London 134,400 11,200 8.3% 4,146 37.0% 1,708 1,251 5,810 51.8% 2,167 873 696
Torrington 54,200 3,900 7.3% 808 20.5% 244 281 1,965 49.8% 410 115 173
Waterbury 100,100 10,800 10.7% 5,326 49.5% 2,076 2,208 5,320 49.5% 2,772 1,062 1,220
Willimantic-Danielson 57,600 5,500 9.5% 1,411 25.8% 272 789 2,686 49.1% 726 139 444
NOTE State totals may not agree with the sum of the Labor Market Areas because they are estimated independently.SOURCE: Connecticut Department of Labor, Office of Research
STATE TOTAL 1,870,300 151,800 8.1% 74,791 49.3% 32,984 26,771 76,414 50.3% 39,437 17,671 14,457
2Connecticut Department of Labor, Office of Research - Labor Market Information

Connecticut Job Seekers by Major Occupational Category2nd Quarter 2013
Management, Business & Financial
10%
Professional & Related11%
Serv ice21%
Sales & Related10%
Office & Administrative Support
16%
Farming, Fishing & Forestry1%
Construction & Extraction10%
Installation, Maintenance, & Repair
4%
Production12%
Transportation & Material Moving
5%
Military-Specific0%
Professional & Related O ccupational Category Computer & Mathematical Architecture & Engineering Life, Physical, & Social Science Community & Social Services Legal Education, Training, & Library Arts, Design, Entertainment, Sports, & Media Healthcare Practitioners & Technical
Service Occupational Category Healthcare Support Protective Service Food Preparation & Serving Related Building & Grounds Cleaning & Maintenance Personal Care & Service
Production O ccupational Category Assembling & Fabricating Food Processing Metal & Plastic Printing Textile, Apparel, & Furnishings Woodworking Plant & System Operation
3Connecticut Data for Affirmative Action Plans ~ 2nd Quarter 2013

ConnecticutCharacteristics of Job Seekers registered with CT Works Career Centers
SOC CodeOccupation
Total Applicants
Total Male
Total Female
White Male
White Female
Black Male
Black Female
Hispanic Male
Hispanic Female
Other Male
Other Female
00Total - All Occupations 63,483 31,526 31,957 16,741 15,464 6,404 7,390 5,150 6,046 3,231 3,057
11Management Occupations 4,090 2,182 1,908 1,650 1,327 191 234 159 196 182 15111.10Top Executives 889 513 376 381 242 40 52 41 42 51 4011.20Advertising, Marketing, Promotions, Public Rel. Occupations 472 263 209 216 165 20 19 14 14 13 1111.30Operations Specialties Managers 744 343 401 276 287 24 40 21 41 22 3311.90Other Management Occupations 1,985 1,063 922 777 633 107 123 83 99 96 67
13Business & Financial Operations Occupations 2,420 1,080 1,340 744 832 143 253 92 121 101 13413.10Business Operations Specialists 673 291 382 212 249 36 72 26 27 17 3413.20Financial Specialists 912 441 471 293 300 58 77 38 40 52 5413.90Other Business & Financial Operations Occupations 835 348 487 239 283 49 104 28 54 32 46
15Computer & Mathematical Occupations 1,166 872 294 592 174 108 44 65 31 107 4515.10Computer Specialists 835 645 190 446 109 79 27 42 22 78 3215.20Mathematical Scientists 11 6 5 2 2 1 2 2 1 1 015.90Other Computer & Mathematical Occupations 320 221 99 144 63 28 15 21 8 28 13
17Architecture & Engineering Occupations 868 750 118 531 61 72 23 55 17 92 1717.10Architects, Surveyors, & Cartographers 32 25 7 19 3 2 1 2 0 2 317.20Engineers 429 380 49 277 27 31 13 22 5 50 417.30Drafters, Engineering, & Mapping Technicians 208 175 33 117 13 23 8 18 6 17 617.90Other Architecture & Engineering Occupations 199 170 29 118 18 16 1 13 6 23 4
19Life, Physical, & Social Science Occupations 360 165 195 121 126 16 20 7 21 21 2819.10Life Scientists 35 16 19 11 15 1 0 1 0 3 419.20Physical Scientists 48 29 19 22 9 1 3 2 0 4 719.30Social Scientists & Related Workers 112 41 71 30 48 4 9 2 10 5 419.40Life, Physical, & Social Science Technicians 41 14 27 8 20 4 1 0 3 2 319.90Other Life, Physical, & Social Science Occupations 124 65 59 50 34 6 7 2 8 7 10
21Community & Social Services Occupations 1,069 319 750 109 297 143 297 41 95 26 6121.10Counselors, Social Workers, Other Cmmty./Soc. Svcs. Workers 742 213 529 66 196 100 227 30 69 17 3721.20Religious Workers 15 6 9 4 3 2 4 0 1 0 121.90Other Community & Social Services Occupations 312 100 212 39 98 41 66 11 25 9 23
23Legal Occupations 564 160 404 106 260 18 69 16 47 20 2823.10Lawyers, Judges, & Related Workers 75 36 39 27 25 1 5 1 6 7 323.20Legal Support Workers 196 21 175 14 117 2 29 4 16 1 1323.90Other Legal Occupations 293 103 190 65 118 15 35 11 25 12 12
4Connecticut Department of Labor - Office of Research ~ Labor Market Information
ConnecticutCharacteristics of Job Seekers registered with CT Works Career Centers
SOC CodeOccupation
Total Applicants
Total Male
Total Female
White Male
White Female
Black Male
Black Female
Hispanic Male
Hispanic Female
Other Male
Other Female
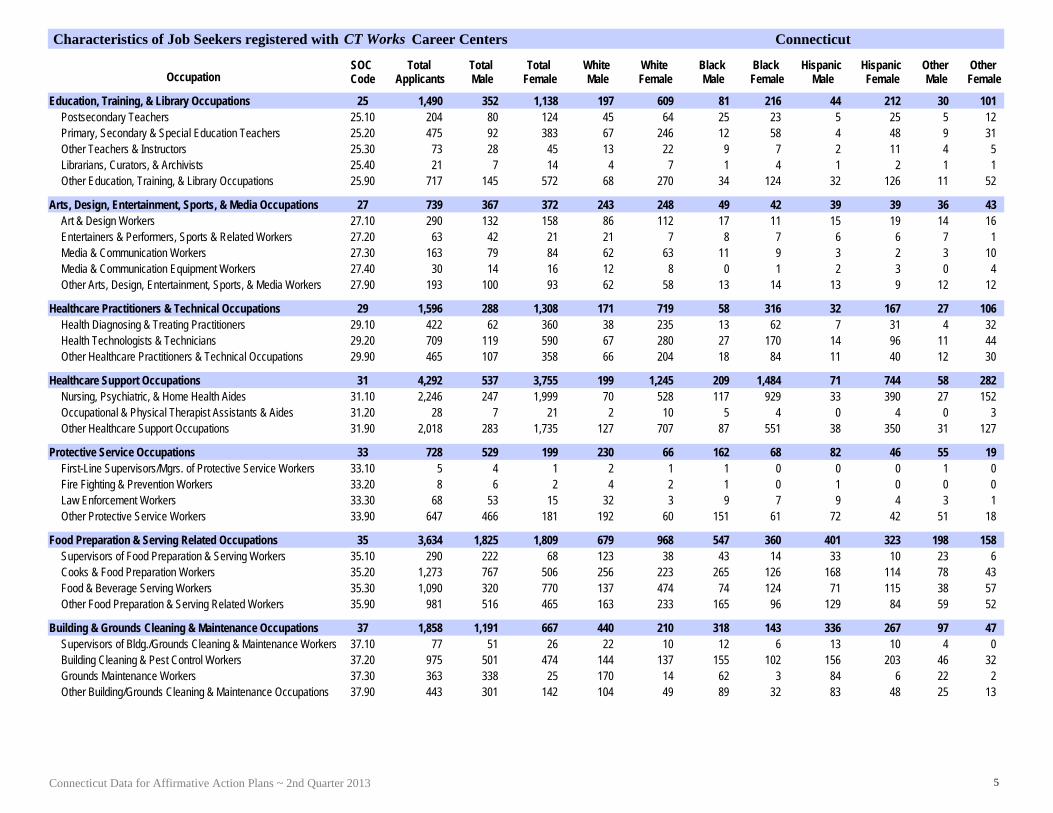
25Education, Training, & Library Occupations 1,490 352 1,138 197 609 81 216 44 212 30 10125.10Postsecondary Teachers 204 80 124 45 64 25 23 5 25 5 1225.20Primary, Secondary & Special Education Teachers 475 92 383 67 246 12 58 4 48 9 3125.30Other Teachers & Instructors 73 28 45 13 22 9 7 2 11 4 525.40Librarians, Curators, & Archivists 21 7 14 4 7 1 4 1 2 1 125.90Other Education, Training, & Library Occupations 717 145 572 68 270 34 124 32 126 11 52
27Arts, Design, Entertainment, Sports, & Media Occupations 739 367 372 243 248 49 42 39 39 36 4327.10Art & Design Workers 290 132 158 86 112 17 11 15 19 14 1627.20Entertainers & Performers, Sports & Related Workers 63 42 21 21 7 8 7 6 6 7 127.30Media & Communication Workers 163 79 84 62 63 11 9 3 2 3 1027.40Media & Communication Equipment Workers 30 14 16 12 8 0 1 2 3 0 427.90Other Arts, Design, Entertainment, Sports, & Media Workers 193 100 93 62 58 13 14 13 9 12 12
29Healthcare Practitioners & Technical Occupations 1,596 288 1,308 171 719 58 316 32 167 27 10629.10Health Diagnosing & Treating Practitioners 422 62 360 38 235 13 62 7 31 4 3229.20Health Technologists & Technicians 709 119 590 67 280 27 170 14 96 11 4429.90Other Healthcare Practitioners & Technical Occupations 465 107 358 66 204 18 84 11 40 12 30
31Healthcare Support Occupations 4,292 537 3,755 199 1,245 209 1,484 71 744 58 28231.10Nursing, Psychiatric, & Home Health Aides 2,246 247 1,999 70 528 117 929 33 390 27 15231.20Occupational & Physical Therapist Assistants & Aides 28 7 21 2 10 5 4 0 4 0 331.90Other Healthcare Support Occupations 2,018 283 1,735 127 707 87 551 38 350 31 127
33Protective Service Occupations 728 529 199 230 66 162 68 82 46 55 1933.10First-Line Supervisors/Mgrs. of Protective Service Workers 5 4 1 2 1 1 0 0 0 1 033.20Fire Fighting & Prevention Workers 8 6 2 4 2 1 0 1 0 0 033.30Law Enforcement Workers 68 53 15 32 3 9 7 9 4 3 133.90Other Protective Service Workers 647 466 181 192 60 151 61 72 42 51 18
35Food Preparation & Serving Related Occupations 3,634 1,825 1,809 679 968 547 360 401 323 198 15835.10Supervisors of Food Preparation & Serving Workers 290 222 68 123 38 43 14 33 10 23 635.20Cooks & Food Preparation Workers 1,273 767 506 256 223 265 126 168 114 78 4335.30Food & Beverage Serving Workers 1,090 320 770 137 474 74 124 71 115 38 5735.90Other Food Preparation & Serving Related Workers 981 516 465 163 233 165 96 129 84 59 52
37Building & Grounds Cleaning & Maintenance Occupations 1,858 1,191 667 440 210 318 143 336 267 97 4737.10Supervisors of Bldg./Grounds Cleaning & Maintenance Workers 77 51 26 22 10 12 6 13 10 4 037.20Building Cleaning & Pest Control Workers 975 501 474 144 137 155 102 156 203 46 3237.30Grounds Maintenance Workers 363 338 25 170 14 62 3 84 6 22 237.90Other Building/Grounds Cleaning & Maintenance Occupations 443 301 142 104 49 89 32 83 48 25 13
5Connecticut Data for Affirmative Action Plans ~ 2nd Quarter 2013

ConnecticutCharacteristics of Job Seekers registered with CT Works Career Centers
SOC CodeOccupation
Total Applicants
Total Male
Total Female
White Male
White Female
Black Male
Black Female
Hispanic Male
Hispanic Female
Other Male
Other Female
39Personal Care & Service Occupations 1,128 250 878 108 429 65 197 34 162 43 9039.10Supervisors of Personal Care & Service Workers 28 13 15 8 10 1 1 1 2 3 239.20Animal Care & Service Workers 15 2 13 2 12 0 0 0 0 0 139.30Entertainment Attendants & Related Workers 112 56 56 27 22 11 9 7 11 11 1439.40Funeral Service Workers 7 4 3 3 0 0 0 0 1 1 239.50Personal Appearance Workers 121 13 108 6 68 2 8 5 25 0 739.60Transportation, Tourism, & Lodging Attendants 14 6 8 3 4 2 2 0 2 1 039.90Other Personal Care & Service Workers 831 156 675 59 313 49 177 21 121 27 64
41Sales & Related Occupations 6,219 2,706 3,513 1,612 1,549 526 873 336 790 232 30141.10Supervisors of Sales Workers 431 212 219 148 163 21 29 20 19 23 841.20Retail Sales Workers 3,137 1,073 2,064 513 734 284 605 197 555 79 17041.30Sales Representatives, Services 959 596 363 432 227 79 53 31 49 54 3441.40Sales Representatives, Wholesale & Manufacturing 170 122 48 82 26 19 11 11 10 10 141.90Other Sales & Related Workers 1,522 703 819 437 399 123 175 77 157 66 88
43Office & Administrative Support Occupations 10,369 2,800 7,569 1,263 4,013 697 1,596 434 1,219 406 74143.10Supervisors of Office & Administrative Support Workers 69 10 59 7 41 2 7 0 7 1 443.20Communications Equipment Operators 23 3 20 1 8 2 6 0 4 0 243.30Financial Clerks 691 84 607 54 371 17 108 9 66 4 6243.40Information & Record Clerks 4,087 1,286 2,801 560 1,265 289 701 181 534 256 30143.50Material Recording, Scheduling, Dispatch/Distribution Workers 766 502 264 195 138 164 55 107 55 36 1643.60Secretaries & Administrative Assistants 1,577 97 1,480 59 941 19 213 11 193 8 13343.90Other Office & Administrative Support Workers 3,156 818 2,338 387 1,249 204 506 126 360 101 223
45Farming, Fishing, & Forestry Occupations 147 93 54 45 25 9 7 34 17 5 545.10Supervisors of Farming, Fishing, & Forestry Workers 6 2 4 2 4 0 0 0 0 0 045.20Agricultural Workers 77 46 31 18 12 3 2 22 14 3 345.30Fishing & Hunting Workers 3 3 0 0 0 1 0 2 0 0 045.40Forest, Conservation, & Logging Workers 13 12 1 10 1 1 0 1 0 0 045.90Other Farming, Fishing, & Forestry Workers 48 30 18 15 8 4 5 9 3 2 2
47Construction & Extraction Occupations 3,522 3,377 145 2,110 74 502 39 455 21 310 1147.10Supervisors of Construction & Extraction Workers 24 24 0 19 0 3 0 1 0 1 047.20Construction Trades Workers 2,075 1,995 80 1,232 41 279 19 287 13 197 747.30Helpers, Construction Trades 620 590 30 377 15 95 9 66 4 52 247.40Other Construction & Related Workers 121 114 7 45 1 27 4 27 1 15 147.50Extraction Workers 15 12 3 4 0 6 2 1 1 1 047.90Other Construction & Extraction Occupations 667 642 25 433 17 92 5 73 2 44 1
6Connecticut Department of Labor - Office of Research ~ Labor Market Information
ConnecticutCharacteristics of Job Seekers registered with CT Works Career Centers
SOC CodeOccupation
Total Applicants
Total Male
Total Female
White Male
White Female
Black Male
Black Female
Hispanic Male
Hispanic Female
Other Male
Other Female
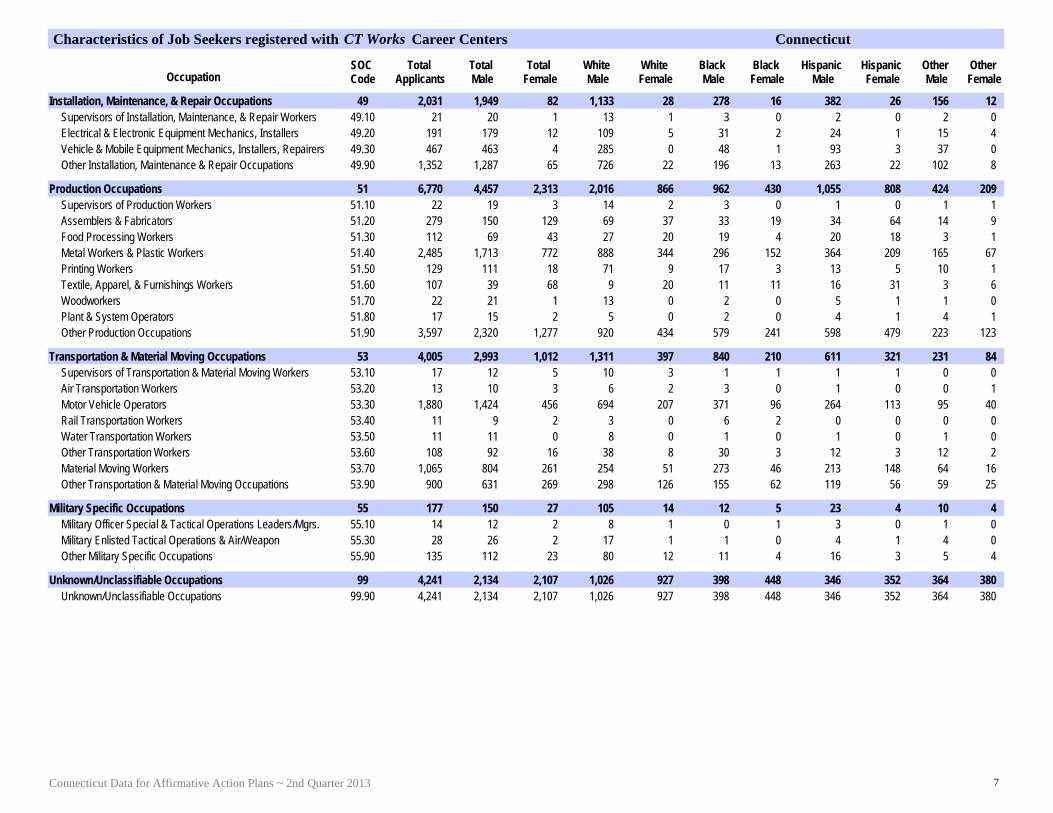
49Installation, Maintenance, & Repair Occupations 2,031 1,949 82 1,133 28 278 16 382 26 156 1249.10Supervisors of Installation, Maintenance, & Repair Workers 21 20 1 13 1 3 0 2 0 2 049.20Electrical & Electronic Equipment Mechanics, Installers 191 179 12 109 5 31 2 24 1 15 449.30Vehicle & Mobile Equipment Mechanics, Installers, Repairers 467 463 4 285 0 48 1 93 3 37 049.90Other Installation, Maintenance & Repair Occupations 1,352 1,287 65 726 22 196 13 263 22 102 8
51Production Occupations 6,770 4,457 2,313 2,016 866 962 430 1,055 808 424 20951.10Supervisors of Production Workers 22 19 3 14 2 3 0 1 0 1 151.20Assemblers & Fabricators 279 150 129 69 37 33 19 34 64 14 951.30Food Processing Workers 112 69 43 27 20 19 4 20 18 3 151.40Metal Workers & Plastic Workers 2,485 1,713 772 888 344 296 152 364 209 165 6751.50Printing Workers 129 111 18 71 9 17 3 13 5 10 151.60Textile, Apparel, & Furnishings Workers 107 39 68 9 20 11 11 16 31 3 651.70Woodworkers 22 21 1 13 0 2 0 5 1 1 051.80Plant & System Operators 17 15 2 5 0 2 0 4 1 4 151.90Other Production Occupations 3,597 2,320 1,277 920 434 579 241 598 479 223 123
53Transportation & Material Moving Occupations 4,005 2,993 1,012 1,311 397 840 210 611 321 231 8453.10Supervisors of Transportation & Material Moving Workers 17 12 5 10 3 1 1 1 1 0 053.20Air Transportation Workers 13 10 3 6 2 3 0 1 0 0 153.30Motor Vehicle Operators 1,880 1,424 456 694 207 371 96 264 113 95 4053.40Rail Transportation Workers 11 9 2 3 0 6 2 0 0 0 053.50Water Transportation Workers 11 11 0 8 0 1 0 1 0 1 053.60Other Transportation Workers 108 92 16 38 8 30 3 12 3 12 253.70Material Moving Workers 1,065 804 261 254 51 273 46 213 148 64 1653.90Other Transportation & Material Moving Occupations 900 631 269 298 126 155 62 119 56 59 25
55Military Specific Occupations 177 150 27 105 14 12 5 23 4 10 455.10Military Officer Special & Tactical Operations Leaders/Mgrs. 14 12 2 8 1 0 1 3 0 1 055.30Military Enlisted Tactical Operations & Air/Weapon 28 26 2 17 1 1 0 4 1 4 055.90Other Military Specific Occupations 135 112 23 80 12 11 4 16 3 5 4
99Unknown/Unclassifiable Occupations 4,241 2,134 2,107 1,026 927 398 448 346 352 364 38099.90Unknown/Unclassifiable Occupations 4,241 2,134 2,107 1,026 927 398 448 346 352 364 380
7Connecticut Data for Affirmative Action Plans ~ 2nd Quarter 2013

Bridgeport-StamfordCharacteristics of Job Seekers registered with CT Works Career Centers
SOC CodeOccupation
Total Applicants
Total Male
Total Female
White Male
White Female
Black Male
Black Female
Hispanic Male
Hispanic Female
Other Male
Other Female
00Total - All Occupations 10,523 4,961 5,562 1,997 1,911 1,421 1,817 946 1,236 597 598
11Management Occupations 707 352 355 241 209 40 56 38 47 33 4311.10Top Executives 143 68 75 44 37 5 16 11 14 8 811.20Advertising, Marketing, Promotions, Public Rel. Occupations 125 61 64 51 51 3 6 3 4 4 311.30Operations Specialties Managers 128 58 70 40 37 6 11 6 10 6 1211.90Other Management Occupations 311 165 146 106 84 26 23 18 19 15 20
13Business & Financial Operations Occupations 542 265 277 168 128 38 70 24 36 35 4313.10Business Operations Specialists 115 53 62 34 33 9 16 5 6 5 713.20Financial Specialists 245 141 104 85 42 18 26 14 15 24 2113.90Other Business & Financial Operations Occupations 182 71 111 49 53 11 28 5 15 6 15
15Computer & Mathematical Occupations 214 170 44 94 18 29 16 19 6 28 415.10Computer Specialists 154 126 28 76 11 21 9 10 5 19 315.20Mathematical Scientists 2 0 2 0 0 0 2 0 0 0 015.90Other Computer & Mathematical Occupations 58 44 14 18 7 8 5 9 1 9 1
17Architecture & Engineering Occupations 102 85 17 45 6 10 5 10 2 20 417.10Architects, Surveyors, & Cartographers 5 4 1 3 0 0 0 0 0 1 117.20Engineers 47 39 8 19 2 6 3 4 2 10 117.30Drafters, Engineering, & Mapping Technicians 21 17 4 10 0 3 2 1 0 3 217.90Other Architecture & Engineering Occupations 29 25 4 13 4 1 0 5 0 6 0
19Life, Physical, & Social Science Occupations 49 25 24 19 17 3 3 1 3 2 119.10Life Scientists 3 2 1 1 1 1 0 0 0 0 019.20Physical Scientists 1 1 0 1 0 0 0 0 0 0 019.30Social Scientists & Related Workers 26 12 14 8 10 1 1 1 3 2 019.40Life, Physical, & Social Science Technicians 4 1 3 0 3 1 0 0 0 0 019.90Other Life, Physical, & Social Science Occupations 15 9 6 9 3 0 2 0 0 0 1
21Community & Social Services Occupations 163 37 126 7 32 23 63 6 16 1 1521.10Counselors, Social Workers, Other Cmmty./Soc. Svcs. Workers 112 27 85 5 17 18 45 3 12 1 1121.20Religious Workers 4 1 3 1 1 0 2 0 0 0 021.90Other Community & Social Services Occupations 47 9 38 1 14 5 16 3 4 0 4
23Legal Occupations 129 45 84 27 41 5 19 4 17 9 723.10Lawyers, Judges, & Related Workers 25 15 10 8 5 0 2 1 3 6 023.20Legal Support Workers 42 7 35 4 17 1 9 1 5 1 423.90Other Legal Occupations 62 23 39 15 19 4 8 2 9 2 3
8Connecticut Department of Labor - Office of Research ~ Labor Market Information

Bridgeport-StamfordCharacteristics of Job Seekers registered with CT Works Career Centers
SOC CodeOccupation
Total Applicants
Total Male
Total Female
White Male
White Female
Black Male
Black Female
Hispanic Male
Hispanic Female
Other Male
Other Female
25Education, Training, & Library Occupations 254 53 201 21 79 18 67 7 36 7 1925.10Postsecondary Teachers 33 14 19 5 5 7 6 0 5 2 325.20Primary, Secondary & Special Education Teachers 71 14 57 9 27 3 17 0 6 2 725.30Other Teachers & Instructors 14 9 5 4 1 3 1 1 3 1 025.40Librarians, Curators, & Archivists 1 0 1 0 0 0 1 0 0 0 025.90Other Education, Training, & Library Occupations 135 16 119 3 46 5 42 6 22 2 9
27Arts, Design, Entertainment, Sports, & Media Occupations 186 95 91 61 62 17 13 8 7 9 927.10Art & Design Workers 68 33 35 20 27 9 1 2 4 2 327.20Entertainers & Performers, Sports & Related Workers 11 5 6 3 1 1 2 0 2 1 127.30Media & Communication Workers 43 19 24 18 16 0 4 1 1 0 327.40Media & Communication Equipment Workers 6 3 3 1 3 0 0 2 0 0 027.90Other Arts, Design, Entertainment, Sports, & Media Workers 58 35 23 19 15 7 6 3 0 6 2
29Healthcare Practitioners & Technical Occupations 315 51 264 25 91 16 101 5 44 5 2829.10Health Diagnosing & Treating Practitioners 83 14 69 6 32 7 16 1 6 0 1529.20Health Technologists & Technicians 143 22 121 11 30 6 52 3 31 2 829.90Other Healthcare Practitioners & Technical Occupations 89 15 74 8 29 3 33 1 7 3 5
31Healthcare Support Occupations 765 80 685 20 101 41 374 15 151 4 5931.10Nursing, Psychiatric, & Home Health Aides 400 37 363 7 30 19 223 7 75 4 3531.20Occupational & Physical Therapist Assistants & Aides 5 2 3 0 1 2 1 0 1 0 031.90Other Healthcare Support Occupations 360 41 319 13 70 20 150 8 75 0 24
33Protective Service Occupations 123 97 26 23 5 42 10 18 9 14 233.20Fire Fighting & Prevention Workers 1 1 0 0 0 1 0 0 0 0 033.30Law Enforcement Workers 4 2 2 2 1 0 0 0 1 0 033.90Other Protective Service Workers 118 94 24 21 4 41 10 18 8 14 2
35Food Preparation & Serving Related Occupations 499 266 233 70 92 88 68 76 57 32 1635.10Supervisors of Food Preparation & Serving Workers 51 42 9 20 3 11 5 6 1 5 035.20Cooks & Food Preparation Workers 172 99 73 17 24 36 23 35 20 11 635.30Food & Beverage Serving Workers 138 47 91 19 49 12 19 10 19 6 435.90Other Food Preparation & Serving Related Workers 138 78 60 14 16 29 21 25 17 10 6
37Building & Grounds Cleaning & Maintenance Occupations 252 178 74 29 8 79 18 59 42 11 637.10Supervisors of Bldg./Grounds Cleaning & Maintenance Workers 10 7 3 2 0 3 2 1 1 1 037.20Building Cleaning & Pest Control Workers 135 74 61 9 6 39 14 21 35 5 637.30Grounds Maintenance Workers 52 50 2 12 1 13 0 23 1 2 037.90Other Building/Grounds Cleaning & Maintenance Occupations 55 47 8 6 1 24 2 14 5 3 0
9Connecticut Data for Affirmative Action Plans ~ 2nd Quarter 2013

Bridgeport-StamfordCharacteristics of Job Seekers registered with CT Works Career Centers
SOC CodeOccupation
Total Applicants
Total Male
Total Female
White Male
White Female
Black Male
Black Female
Hispanic Male
Hispanic Female
Other Male
Other Female
39Personal Care & Service Occupations 181 30 151 11 56 14 42 2 37 3 1639.10Supervisors of Personal Care & Service Workers 1 0 1 0 1 0 0 0 0 0 039.20Animal Care & Service Workers 1 0 1 0 1 0 0 0 0 0 039.30Entertainment Attendants & Related Workers 3 3 0 1 0 1 0 1 0 0 039.40Funeral Service Workers 1 1 0 1 0 0 0 0 0 0 039.50Personal Appearance Workers 21 3 18 1 9 1 3 1 5 0 139.60Transportation, Tourism, & Lodging Attendants 3 2 1 1 0 1 1 0 0 0 039.90Other Personal Care & Service Workers 151 21 130 7 45 11 38 0 32 3 15
41Sales & Related Occupations 1,140 534 606 279 178 126 230 78 144 51 5441.10Supervisors of Sales Workers 71 37 34 22 18 8 10 5 5 2 141.20Retail Sales Workers 561 199 362 58 69 71 158 46 101 24 3441.30Sales Representatives, Services 221 145 76 112 44 13 17 4 7 16 841.40Sales Representatives, Wholesale & Manufacturing 31 18 13 15 8 3 4 0 1 0 041.90Other Sales & Related Workers 256 135 121 72 39 31 41 23 30 9 11
43Office & Administrative Support Occupations 1,838 496 1,342 153 531 174 394 80 265 89 15243.10Supervisors of Office & Administrative Support Workers 11 1 10 0 8 1 2 0 0 0 043.20Communications Equipment Operators 4 0 4 0 0 0 2 0 2 0 043.30Financial Clerks 129 14 115 7 54 3 36 3 12 1 1343.40Information & Record Clerks 739 242 497 78 142 69 184 36 122 59 4943.50Material Recording, Scheduling, Dispatch/Distribution Workers 113 76 37 11 13 35 13 21 9 9 243.60Secretaries & Administrative Assistants 349 27 322 15 157 7 66 4 54 1 4543.90Other Office & Administrative Support Workers 493 136 357 42 157 59 91 16 66 19 43
45Farming, Fishing, & Forestry Occupations 20 12 8 3 5 0 2 9 1 0 045.20Agricultural Workers 5 5 0 1 0 0 0 4 0 0 045.30Fishing & Hunting Workers 1 1 0 0 0 0 0 1 0 0 045.40Forest, Conservation, & Logging Workers 2 1 1 0 1 0 0 1 0 0 045.90Other Farming, Fishing, & Forestry Workers 12 5 7 2 4 0 2 3 1 0 0
47Construction & Extraction Occupations 438 422 16 195 6 101 4 87 4 39 247.10Supervisors of Construction & Extraction Workers 5 5 0 4 0 1 0 0 0 0 047.20Construction Trades Workers 262 253 9 107 4 67 1 55 3 24 147.30Helpers, Construction Trades 76 74 2 36 0 13 1 18 0 7 147.40Other Construction & Related Workers 15 15 0 3 0 4 0 4 0 4 047.50Extraction Workers 2 1 1 0 0 0 0 0 1 1 047.90Other Construction & Extraction Occupations 78 74 4 45 2 16 2 10 0 3 0
49Installation, Maintenance, & Repair Occupations 299 287 12 89 3 82 4 82 3 34 249.10Supervisors of Installation, Maintenance, & Repair Workers 3 3 0 1 0 1 0 1 0 0 049.20Electrical & Electronic Equipment Mechanics, Installers 32 26 6 12 2 12 2 2 0 0 249.30Vehicle & Mobile Equipment Mechanics, Installers, Repairers 55 55 0 20 0 10 0 18 0 7 049.90Other Installation, Maintenance & Repair Occupations 209 203 6 56 1 59 2 61 3 27 0
10Connecticut Department of Labor - Office of Research ~ Labor Market Information

Bridgeport-StamfordCharacteristics of Job Seekers registered with CT Works Career Centers
SOC CodeOccupation
Total Applicants
Total Male
Total Female
White Male
White Female
Black Male
Black Female
Hispanic Male
Hispanic Female
Other Male
Other Female
51Production Occupations 885 498 387 131 72 175 109 129 167 63 3951.20Assemblers & Fabricators 45 21 24 7 2 7 4 4 17 3 151.30Food Processing Workers 14 9 5 3 0 3 1 3 4 0 051.40Metal Workers & Plastic Workers 340 182 158 61 36 53 51 43 61 25 1051.50Printing Workers 9 7 2 2 1 1 0 3 1 1 051.60Textile, Apparel, & Furnishings Workers 13 4 9 0 2 1 1 2 3 1 351.70Woodworkers 3 3 0 1 0 0 0 1 0 1 051.80Plant & System Operators 2 1 1 0 0 0 0 1 1 0 051.90Other Production Occupations 459 271 188 57 31 110 52 72 80 32 25
53Transportation & Material Moving Occupations 659 521 138 151 35 201 38 120 52 49 1353.10Supervisors of Transportation & Material Moving Workers 1 1 0 1 0 0 0 0 0 0 053.20Air Transportation Workers 1 1 0 1 0 0 0 0 0 0 053.30Motor Vehicle Operators 345 288 57 91 14 100 19 70 19 27 553.40Rail Transportation Workers 3 3 0 0 0 3 0 0 0 0 053.50Water Transportation Workers 1 1 0 0 0 1 0 0 0 0 053.60Other Transportation Workers 13 13 0 5 0 4 0 0 0 4 053.70Material Moving Workers 159 113 46 22 8 52 8 28 26 11 453.90Other Transportation & Material Moving Occupations 136 101 35 31 13 41 11 22 7 7 4
55Military Specific Occupations 17 15 2 12 1 0 0 3 0 0 155.10Military Officer Special & Tactical Operations Leaders/Mgrs. 2 2 0 2 0 0 0 0 0 0 055.30Military Enlisted Tactical Operations & Air/Weapon 3 3 0 2 0 0 0 1 0 0 055.90Other Military Specific Occupations 12 10 2 8 1 0 0 2 0 0 1
99Unknown/Unclassifiable Occupations 746 347 399 123 135 99 111 66 90 59 6399.90Unknown/Unclassifiable Occupations 746 347 399 123 135 99 111 66 90 59 63
11Connecticut Data for Affirmative Action Plans ~ 2nd Quarter 2013
DanburyCharacteristics of Job Seekers registered with CT Works Career Centers
SOC CodeOccupation
Total Applicants
Total Male
Total Female
White Male
White Female
Black Male
Black Female
Hispanic Male
Hispanic Female
Other Male
Other Female
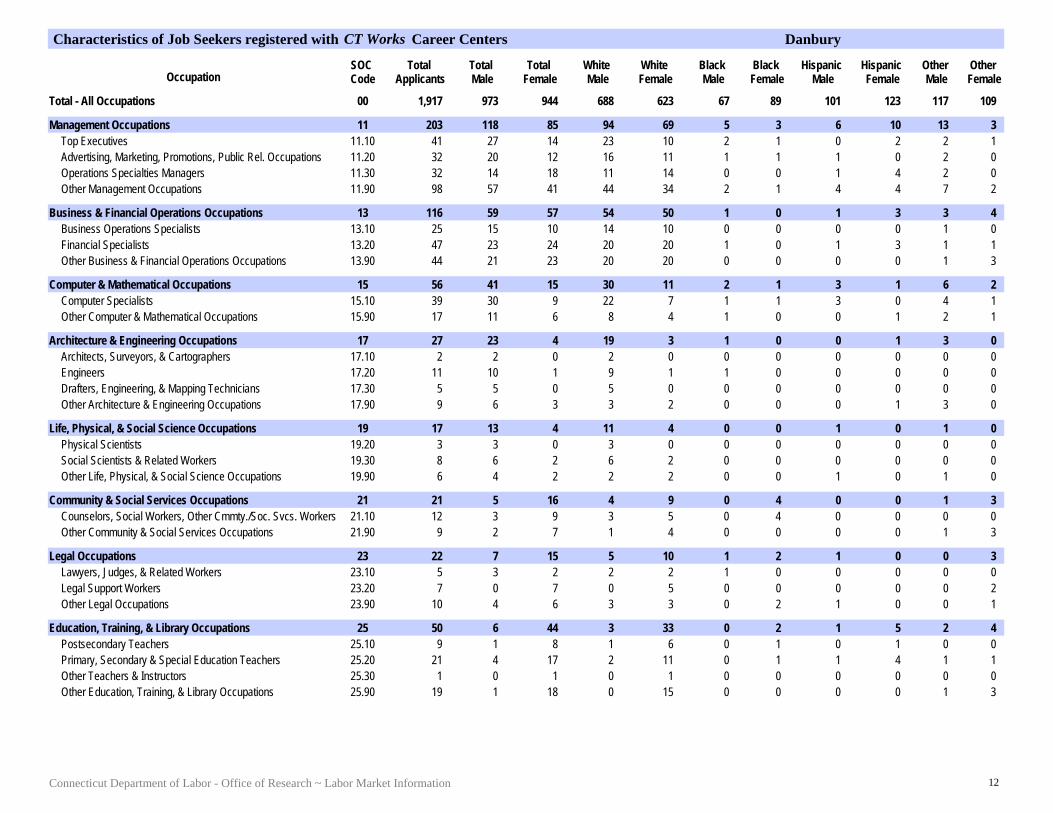
00Total - All Occupations 1,917 973 944 688 623 67 89 101 123 117 109
11Management Occupations 203 118 85 94 69 5 3 6 10 13 311.10Top Executives 41 27 14 23 10 2 1 0 2 2 111.20Advertising, Marketing, Promotions, Public Rel. Occupations 32 20 12 16 11 1 1 1 0 2 011.30Operations Specialties Managers 32 14 18 11 14 0 0 1 4 2 011.90Other Management Occupations 98 57 41 44 34 2 1 4 4 7 2
13Business & Financial Operations Occupations 116 59 57 54 50 1 0 1 3 3 413.10Business Operations Specialists 25 15 10 14 10 0 0 0 0 1 013.20Financial Specialists 47 23 24 20 20 1 0 1 3 1 113.90Other Business & Financial Operations Occupations 44 21 23 20 20 0 0 0 0 1 3
15Computer & Mathematical Occupations 56 41 15 30 11 2 1 3 1 6 215.10Computer Specialists 39 30 9 22 7 1 1 3 0 4 115.90Other Computer & Mathematical Occupations 17 11 6 8 4 1 0 0 1 2 1
17Architecture & Engineering Occupations 27 23 4 19 3 1 0 0 1 3 017.10Architects, Surveyors, & Cartographers 2 2 0 2 0 0 0 0 0 0 017.20Engineers 11 10 1 9 1 1 0 0 0 0 017.30Drafters, Engineering, & Mapping Technicians 5 5 0 5 0 0 0 0 0 0 017.90Other Architecture & Engineering Occupations 9 6 3 3 2 0 0 0 1 3 0
19Life, Physical, & Social Science Occupations 17 13 4 11 4 0 0 1 0 1 019.20Physical Scientists 3 3 0 3 0 0 0 0 0 0 019.30Social Scientists & Related Workers 8 6 2 6 2 0 0 0 0 0 019.90Other Life, Physical, & Social Science Occupations 6 4 2 2 2 0 0 1 0 1 0
21Community & Social Services Occupations 21 5 16 4 9 0 4 0 0 1 321.10Counselors, Social Workers, Other Cmmty./Soc. Svcs. Workers 12 3 9 3 5 0 4 0 0 0 021.90Other Community & Social Services Occupations 9 2 7 1 4 0 0 0 0 1 3
23Legal Occupations 22 7 15 5 10 1 2 1 0 0 323.10Lawyers, Judges, & Related Workers 5 3 2 2 2 1 0 0 0 0 023.20Legal Support Workers 7 0 7 0 5 0 0 0 0 0 223.90Other Legal Occupations 10 4 6 3 3 0 2 1 0 0 1
25Education, Training, & Library Occupations 50 6 44 3 33 0 2 1 5 2 425.10Postsecondary Teachers 9 1 8 1 6 0 1 0 1 0 025.20Primary, Secondary & Special Education Teachers 21 4 17 2 11 0 1 1 4 1 125.30Other Teachers & Instructors 1 0 1 0 1 0 0 0 0 0 025.90Other Education, Training, & Library Occupations 19 1 18 0 15 0 0 0 0 1 3
12Connecticut Department of Labor - Office of Research ~ Labor Market Information
DanburyCharacteristics of Job Seekers registered with CT Works Career Centers
SOC CodeOccupation
Total Applicants
Total Male
Total Female
White Male
White Female
Black Male
Black Female
Hispanic Male
Hispanic Female
Other Male
Other Female
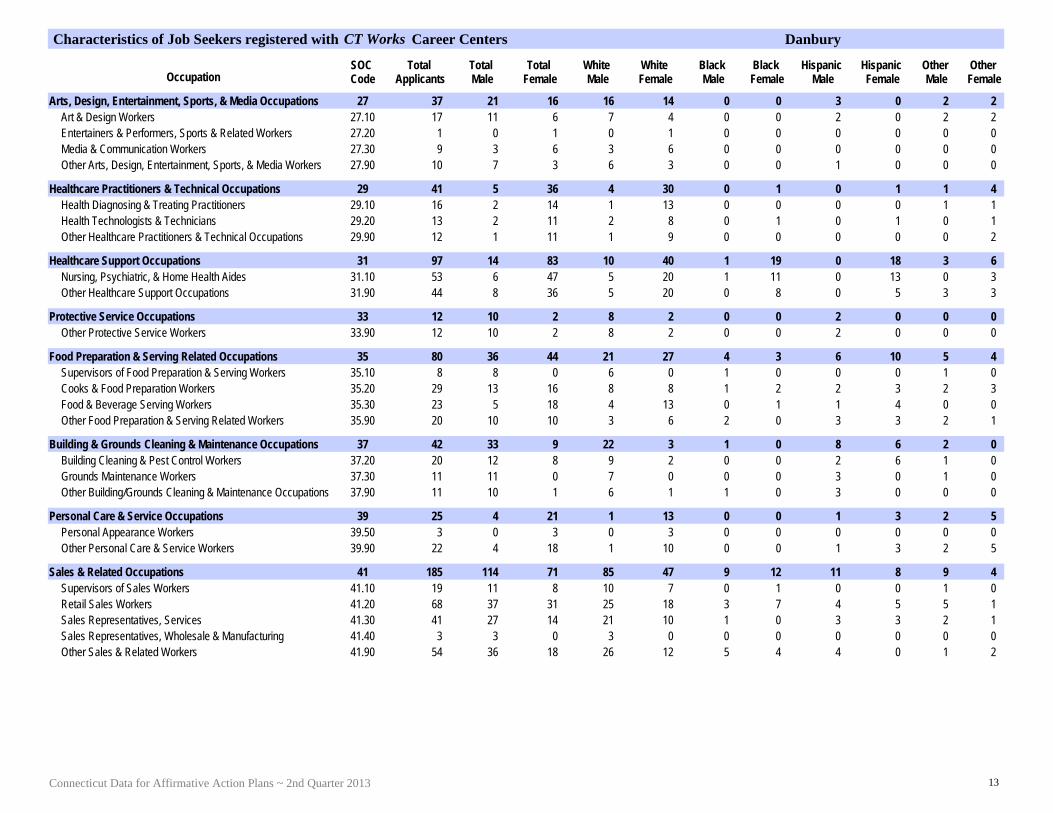
27Arts, Design, Entertainment, Sports, & Media Occupations 37 21 16 16 14 0 0 3 0 2 227.10Art & Design Workers 17 11 6 7 4 0 0 2 0 2 227.20Entertainers & Performers, Sports & Related Workers 1 0 1 0 1 0 0 0 0 0 027.30Media & Communication Workers 9 3 6 3 6 0 0 0 0 0 027.90Other Arts, Design, Entertainment, Sports, & Media Workers 10 7 3 6 3 0 0 1 0 0 0
29Healthcare Practitioners & Technical Occupations 41 5 36 4 30 0 1 0 1 1 429.10Health Diagnosing & Treating Practitioners 16 2 14 1 13 0 0 0 0 1 129.20Health Technologists & Technicians 13 2 11 2 8 0 1 0 1 0 129.90Other Healthcare Practitioners & Technical Occupations 12 1 11 1 9 0 0 0 0 0 2
31Healthcare Support Occupations 97 14 83 10 40 1 19 0 18 3 631.10Nursing, Psychiatric, & Home Health Aides 53 6 47 5 20 1 11 0 13 0 331.90Other Healthcare Support Occupations 44 8 36 5 20 0 8 0 5 3 3
33Protective Service Occupations 12 10 2 8 2 0 0 2 0 0 033.90Other Protective Service Workers 12 10 2 8 2 0 0 2 0 0 0
35Food Preparation & Serving Related Occupations 80 36 44 21 27 4 3 6 10 5 435.10Supervisors of Food Preparation & Serving Workers 8 8 0 6 0 1 0 0 0 1 035.20Cooks & Food Preparation Workers 29 13 16 8 8 1 2 2 3 2 335.30Food & Beverage Serving Workers 23 5 18 4 13 0 1 1 4 0 035.90Other Food Preparation & Serving Related Workers 20 10 10 3 6 2 0 3 3 2 1
37Building & Grounds Cleaning & Maintenance Occupations 42 33 9 22 3 1 0 8 6 2 037.20Building Cleaning & Pest Control Workers 20 12 8 9 2 0 0 2 6 1 037.30Grounds Maintenance Workers 11 11 0 7 0 0 0 3 0 1 037.90Other Building/Grounds Cleaning & Maintenance Occupations 11 10 1 6 1 1 0 3 0 0 0
39Personal Care & Service Occupations 25 4 21 1 13 0 0 1 3 2 539.50Personal Appearance Workers 3 0 3 0 3 0 0 0 0 0 039.90Other Personal Care & Service Workers 22 4 18 1 10 0 0 1 3 2 5
41Sales & Related Occupations 185 114 71 85 47 9 12 11 8 9 441.10Supervisors of Sales Workers 19 11 8 10 7 0 1 0 0 1 041.20Retail Sales Workers 68 37 31 25 18 3 7 4 5 5 141.30Sales Representatives, Services 41 27 14 21 10 1 0 3 3 2 141.40Sales Representatives, Wholesale & Manufacturing 3 3 0 3 0 0 0 0 0 0 041.90Other Sales & Related Workers 54 36 18 26 12 5 4 4 0 1 2
13Connecticut Data for Affirmative Action Plans ~ 2nd Quarter 2013

DanburyCharacteristics of Job Seekers registered with CT Works Career Centers
SOC CodeOccupation
Total Applicants
Total Male
Total Female
White Male
White Female
Black Male
Black Female
Hispanic Male
Hispanic Female
Other Male
Other Female
43Office & Administrative Support Occupations 324 89 235 57 161 13 19 10 31 9 2443.10Supervisors of Office & Administrative Support Workers 7 2 5 2 4 0 0 0 1 0 043.30Financial Clerks 15 1 14 1 7 0 2 0 2 0 343.40Information & Record Clerks 121 48 73 30 42 5 11 6 9 7 1143.50Material Recording, Scheduling, Dispatch/Distribution Workers 15 12 3 6 2 4 0 2 1 0 043.60Secretaries & Administrative Assistants 65 2 63 1 47 0 3 0 7 1 643.90Other Office & Administrative Support Workers 101 24 77 17 59 4 3 2 11 1 4
47Construction & Extraction Occupations 81 76 5 59 4 3 1 10 0 4 047.10Supervisors of Construction & Extraction Workers 1 1 0 1 0 0 0 0 0 0 047.20Construction Trades Workers 48 46 2 37 1 0 1 7 0 2 047.30Helpers, Construction Trades 13 11 2 8 2 1 0 1 0 1 047.40Other Construction & Related Workers 2 2 0 0 0 1 0 0 0 1 047.90Other Construction & Extraction Occupations 17 16 1 13 1 1 0 2 0 0 0
49Installation, Maintenance, & Repair Occupations 54 53 1 40 0 2 0 8 1 3 049.20Electrical & Electronic Equipment Mechanics, Installers 6 6 0 4 0 0 0 1 0 1 049.30Vehicle & Mobile Equipment Mechanics, Installers, Repairers 14 14 0 11 0 1 0 2 0 0 049.90Other Installation, Maintenance & Repair Occupations 34 33 1 25 0 1 0 5 1 2 0
51Production Occupations 145 96 49 58 19 13 7 10 13 15 1051.10Supervisors of Production Workers 1 1 0 0 0 0 0 0 0 1 051.20Assemblers & Fabricators 6 4 2 3 0 0 0 1 0 0 251.30Food Processing Workers 2 1 1 1 1 0 0 0 0 0 051.40Metal Workers & Plastic Workers 58 41 17 26 9 4 3 5 1 6 451.50Printing Workers 5 5 0 5 0 0 0 0 0 0 051.60Textile, Apparel, & Furnishings Workers 2 0 2 0 0 0 1 0 1 0 051.90Other Production Occupations 71 44 27 23 9 9 3 4 11 8 4
53Transportation & Material Moving Occupations 105 66 39 39 30 7 2 12 5 8 253.10Supervisors of Transportation & Material Moving Workers 1 1 0 1 0 0 0 0 0 0 053.20Air Transportation Workers 1 1 0 0 0 1 0 0 0 0 053.30Motor Vehicle Operators 61 35 26 23 20 2 1 6 3 4 253.70Material Moving Workers 15 14 1 5 0 2 0 6 1 1 053.90Other Transportation & Material Moving Occupations 27 15 12 10 10 2 1 0 1 3 0
55Military Specific Occupations 3 1 2 1 1 0 0 0 1 0 055.30Military Enlisted Tactical Operations & Air/Weapon 1 0 1 0 0 0 0 0 1 0 055.90Other Military Specific Occupations 2 1 1 1 1 0 0 0 0 0 0
99Unknown/Unclassifiable Occupations 174 83 91 47 43 4 13 7 6 25 2999.90Unknown/Unclassifiable Occupations 174 83 91 47 43 4 13 7 6 25 29
14Connecticut Department of Labor - Office of Research ~ Labor Market Information
EnfieldCharacteristics of Job Seekers registered with CT Works Career Centers
SOC CodeOccupation
Total Applicants
Total Male
Total Female
White Male
White Female
Black Male
Black Female
Hispanic Male
Hispanic Female
Other Male
Other Female
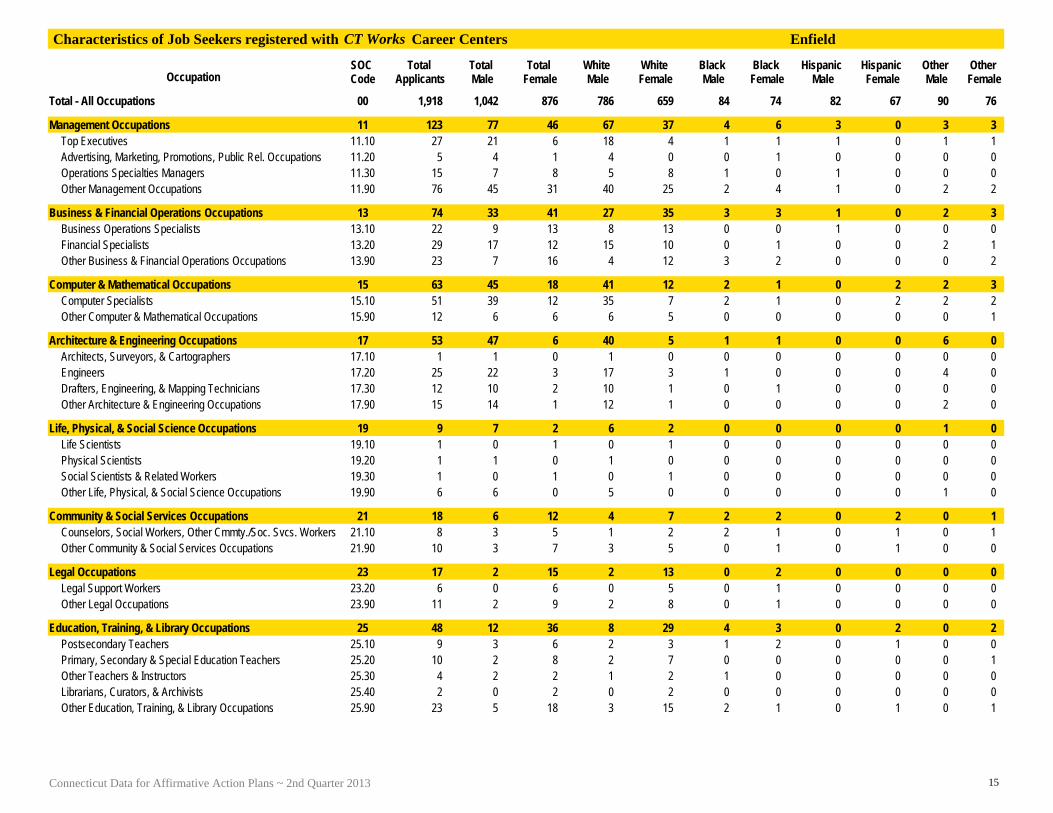
00Total - All Occupations 1,918 1,042 876 786 659 84 74 82 67 90 76
11Management Occupations 123 77 46 67 37 4 6 3 0 3 311.10Top Executives 27 21 6 18 4 1 1 1 0 1 111.20Advertising, Marketing, Promotions, Public Rel. Occupations 5 4 1 4 0 0 1 0 0 0 011.30Operations Specialties Managers 15 7 8 5 8 1 0 1 0 0 011.90Other Management Occupations 76 45 31 40 25 2 4 1 0 2 2
13Business & Financial Operations Occupations 74 33 41 27 35 3 3 1 0 2 313.10Business Operations Specialists 22 9 13 8 13 0 0 1 0 0 013.20Financial Specialists 29 17 12 15 10 0 1 0 0 2 113.90Other Business & Financial Operations Occupations 23 7 16 4 12 3 2 0 0 0 2
15Computer & Mathematical Occupations 63 45 18 41 12 2 1 0 2 2 315.10Computer Specialists 51 39 12 35 7 2 1 0 2 2 215.90Other Computer & Mathematical Occupations 12 6 6 6 5 0 0 0 0 0 1
17Architecture & Engineering Occupations 53 47 6 40 5 1 1 0 0 6 017.10Architects, Surveyors, & Cartographers 1 1 0 1 0 0 0 0 0 0 017.20Engineers 25 22 3 17 3 1 0 0 0 4 017.30Drafters, Engineering, & Mapping Technicians 12 10 2 10 1 0 1 0 0 0 017.90Other Architecture & Engineering Occupations 15 14 1 12 1 0 0 0 0 2 0
19Life, Physical, & Social Science Occupations 9 7 2 6 2 0 0 0 0 1 019.10Life Scientists 1 0 1 0 1 0 0 0 0 0 019.20Physical Scientists 1 1 0 1 0 0 0 0 0 0 019.30Social Scientists & Related Workers 1 0 1 0 1 0 0 0 0 0 019.90Other Life, Physical, & Social Science Occupations 6 6 0 5 0 0 0 0 0 1 0
21Community & Social Services Occupations 18 6 12 4 7 2 2 0 2 0 121.10Counselors, Social Workers, Other Cmmty./Soc. Svcs. Workers 8 3 5 1 2 2 1 0 1 0 121.90Other Community & Social Services Occupations 10 3 7 3 5 0 1 0 1 0 0
23Legal Occupations 17 2 15 2 13 0 2 0 0 0 023.20Legal Support Workers 6 0 6 0 5 0 1 0 0 0 023.90Other Legal Occupations 11 2 9 2 8 0 1 0 0 0 0
25Education, Training, & Library Occupations 48 12 36 8 29 4 3 0 2 0 225.10Postsecondary Teachers 9 3 6 2 3 1 2 0 1 0 025.20Primary, Secondary & Special Education Teachers 10 2 8 2 7 0 0 0 0 0 125.30Other Teachers & Instructors 4 2 2 1 2 1 0 0 0 0 025.40Librarians, Curators, & Archivists 2 0 2 0 2 0 0 0 0 0 025.90Other Education, Training, & Library Occupations 23 5 18 3 15 2 1 0 1 0 1
15Connecticut Data for Affirmative Action Plans ~ 2nd Quarter 2013
EnfieldCharacteristics of Job Seekers registered with CT Works Career Centers
SOC CodeOccupation
Total Applicants
Total Male
Total Female
White Male
White Female
Black Male
Black Female
Hispanic Male
Hispanic Female
Other Male
Other Female
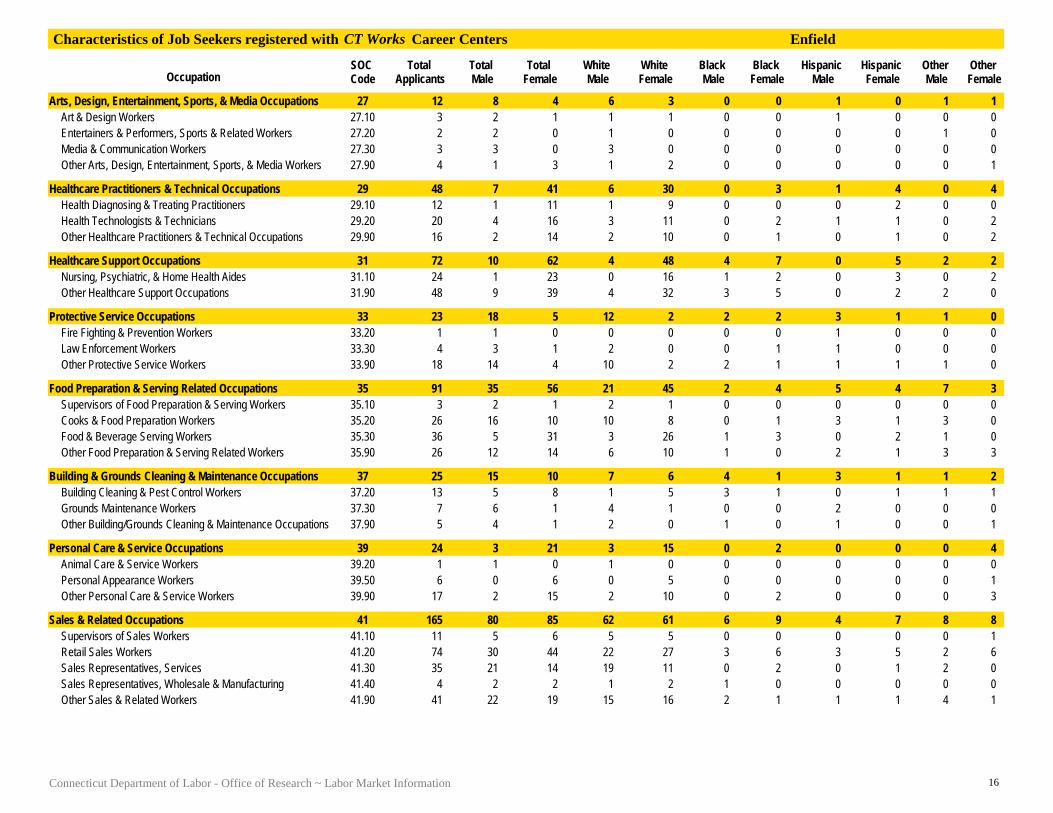
27Arts, Design, Entertainment, Sports, & Media Occupations 12 8 4 6 3 0 0 1 0 1 127.10Art & Design Workers 3 2 1 1 1 0 0 1 0 0 027.20Entertainers & Performers, Sports & Related Workers 2 2 0 1 0 0 0 0 0 1 027.30Media & Communication Workers 3 3 0 3 0 0 0 0 0 0 027.90Other Arts, Design, Entertainment, Sports, & Media Workers 4 1 3 1 2 0 0 0 0 0 1
29Healthcare Practitioners & Technical Occupations 48 7 41 6 30 0 3 1 4 0 429.10Health Diagnosing & Treating Practitioners 12 1 11 1 9 0 0 0 2 0 029.20Health Technologists & Technicians 20 4 16 3 11 0 2 1 1 0 229.90Other Healthcare Practitioners & Technical Occupations 16 2 14 2 10 0 1 0 1 0 2
31Healthcare Support Occupations 72 10 62 4 48 4 7 0 5 2 231.10Nursing, Psychiatric, & Home Health Aides 24 1 23 0 16 1 2 0 3 0 231.90Other Healthcare Support Occupations 48 9 39 4 32 3 5 0 2 2 0
33Protective Service Occupations 23 18 5 12 2 2 2 3 1 1 033.20Fire Fighting & Prevention Workers 1 1 0 0 0 0 0 1 0 0 033.30Law Enforcement Workers 4 3 1 2 0 0 1 1 0 0 033.90Other Protective Service Workers 18 14 4 10 2 2 1 1 1 1 0
35Food Preparation & Serving Related Occupations 91 35 56 21 45 2 4 5 4 7 335.10Supervisors of Food Preparation & Serving Workers 3 2 1 2 1 0 0 0 0 0 035.20Cooks & Food Preparation Workers 26 16 10 10 8 0 1 3 1 3 035.30Food & Beverage Serving Workers 36 5 31 3 26 1 3 0 2 1 035.90Other Food Preparation & Serving Related Workers 26 12 14 6 10 1 0 2 1 3 3
37Building & Grounds Cleaning & Maintenance Occupations 25 15 10 7 6 4 1 3 1 1 237.20Building Cleaning & Pest Control Workers 13 5 8 1 5 3 1 0 1 1 137.30Grounds Maintenance Workers 7 6 1 4 1 0 0 2 0 0 037.90Other Building/Grounds Cleaning & Maintenance Occupations 5 4 1 2 0 1 0 1 0 0 1
39Personal Care & Service Occupations 24 3 21 3 15 0 2 0 0 0 439.20Animal Care & Service Workers 1 1 0 1 0 0 0 0 0 0 039.50Personal Appearance Workers 6 0 6 0 5 0 0 0 0 0 139.90Other Personal Care & Service Workers 17 2 15 2 10 0 2 0 0 0 3
41Sales & Related Occupations 165 80 85 62 61 6 9 4 7 8 841.10Supervisors of Sales Workers 11 5 6 5 5 0 0 0 0 0 141.20Retail Sales Workers 74 30 44 22 27 3 6 3 5 2 641.30Sales Representatives, Services 35 21 14 19 11 0 2 0 1 2 041.40Sales Representatives, Wholesale & Manufacturing 4 2 2 1 2 1 0 0 0 0 041.90Other Sales & Related Workers 41 22 19 15 16 2 1 1 1 4 1
16Connecticut Department of Labor - Office of Research ~ Labor Market Information

EnfieldCharacteristics of Job Seekers registered with CT Works Career Centers
SOC CodeOccupation
Total Applicants
Total Male
Total Female
White Male
White Female
Black Male
Black Female
Hispanic Male
Hispanic Female
Other Male
Other Female
43Office & Administrative Support Occupations 346 107 239 71 175 14 20 6 20 16 2443.10Supervisors of Office & Administrative Support Workers 2 1 1 1 1 0 0 0 0 0 043.20Communications Equipment Operators 1 0 1 0 1 0 0 0 0 0 043.30Financial Clerks 25 6 19 6 16 0 1 0 0 0 243.40Information & Record Clerks 132 52 80 32 54 6 13 3 5 11 843.50Material Recording, Scheduling, Dispatch/Distribution Workers 16 8 8 4 4 4 0 0 3 0 143.60Secretaries & Administrative Assistants 45 1 44 0 32 0 2 1 7 0 343.90Other Office & Administrative Support Workers 125 39 86 28 67 4 4 2 5 5 10
45Farming, Fishing, & Forestry Occupations 2 1 1 1 0 0 0 0 1 0 045.20Agricultural Workers 1 0 1 0 0 0 0 0 1 0 045.90Other Farming, Fishing, & Forestry Workers 1 1 0 1 0 0 0 0 0 0 0
47Construction & Extraction Occupations 98 96 2 76 0 2 0 9 2 9 047.20Construction Trades Workers 51 51 0 38 0 0 0 7 0 6 047.30Helpers, Construction Trades 17 17 0 17 0 0 0 0 0 0 047.40Other Construction & Related Workers 2 1 1 1 0 0 0 0 1 0 047.50Extraction Workers 1 1 0 0 0 1 0 0 0 0 047.90Other Construction & Extraction Occupations 27 26 1 20 0 1 0 2 1 3 0
49Installation, Maintenance, & Repair Occupations 75 73 2 57 2 5 0 7 0 4 049.20Electrical & Electronic Equipment Mechanics, Installers 7 7 0 5 0 0 0 2 0 0 049.30Vehicle & Mobile Equipment Mechanics, Installers, Repairers 14 14 0 12 0 2 0 0 0 0 049.90Other Installation, Maintenance & Repair Occupations 54 52 2 40 2 3 0 5 0 4 0
51Production Occupations 252 181 71 138 58 13 1 14 8 16 451.10Supervisors of Production Workers 2 2 0 2 0 0 0 0 0 0 051.20Assemblers & Fabricators 7 5 2 4 1 1 0 0 1 0 051.30Food Processing Workers 3 3 0 3 0 0 0 0 0 0 051.40Metal Workers & Plastic Workers 105 82 23 65 19 6 0 6 2 5 251.50Printing Workers 7 5 2 5 1 0 0 0 0 0 151.60Textile, Apparel, & Furnishings Workers 1 1 0 0 0 1 0 0 0 0 051.90Other Production Occupations 127 83 44 59 37 5 1 8 5 11 1
53Transportation & Material Moving Occupations 144 100 44 69 31 11 3 12 4 8 653.10Supervisors of Transportation & Material Moving Workers 2 2 0 2 0 0 0 0 0 0 053.30Motor Vehicle Operators 66 43 23 32 14 3 2 5 3 3 453.60Other Transportation Workers 2 2 0 2 0 0 0 0 0 0 053.70Material Moving Workers 24 19 5 11 4 2 1 4 0 2 053.90Other Transportation & Material Moving Occupations 50 34 16 22 13 6 0 3 1 3 2
55Military Specific Occupations 5 4 1 3 1 0 0 0 0 1 055.30Military Enlisted Tactical Operations & Air/Weapon 2 2 0 1 0 0 0 0 0 1 055.90Other Military Specific Occupations 3 2 1 2 1 0 0 0 0 0 0
17Connecticut Data for Affirmative Action Plans ~ 2nd Quarter 2013

EnfieldCharacteristics of Job Seekers registered with CT Works Career Centers
SOC CodeOccupation
Total Applicants
Total Male
Total Female
White Male
White Female
Black Male
Black Female
Hispanic Male
Hispanic Female
Other Male
Other Female
99Unknown/Unclassifiable Occupations 131 75 56 55 42 5 4 13 4 2 699.90Unknown/Unclassifiable Occupations 131 75 56 55 42 5 4 13 4 2 6
18Connecticut Department of Labor - Office of Research ~ Labor Market Information

HartfordCharacteristics of Job Seekers registered with CT Works Career Centers
SOC CodeOccupation
Total Applicants
Total Male
Total Female
White Male
White Female
Black Male
Black Female
Hispanic Male
Hispanic Female
Other Male
Other Female
00Total - All Occupations 17,279 8,728 8,551 3,986 3,539 2,102 2,282 1,737 1,863 903 867
11Management Occupations 1,036 530 506 369 326 66 76 44 63 51 4111.10Top Executives 222 121 101 76 63 18 15 14 12 13 1111.20Advertising, Marketing, Promotions, Public Rel. Occupations 95 57 38 43 28 7 4 6 3 1 311.30Operations Specialties Managers 188 81 107 63 70 7 16 3 13 8 811.90Other Management Occupations 531 271 260 187 165 34 41 21 35 29 19
13Business & Financial Operations Occupations 718 312 406 213 241 49 93 27 36 23 3613.10Business Operations Specialists 238 96 142 72 89 12 31 9 11 3 1113.20Financial Specialists 223 108 115 70 71 19 21 8 8 11 1513.90Other Business & Financial Operations Occupations 257 108 149 71 81 18 41 10 17 9 10
15Computer & Mathematical Occupations 323 243 80 156 47 37 12 17 9 33 1215.10Computer Specialists 229 174 55 110 33 28 7 12 6 24 915.20Mathematical Scientists 3 3 0 0 0 1 0 1 0 1 015.90Other Computer & Mathematical Occupations 91 66 25 46 14 8 5 4 3 8 3
17Architecture & Engineering Occupations 263 234 29 154 18 31 6 22 2 27 317.10Architects, Surveyors, & Cartographers 13 10 3 7 2 1 0 1 0 1 117.20Engineers 137 126 11 92 8 9 3 9 0 16 017.30Drafters, Engineering, & Mapping Technicians 57 49 8 24 4 9 2 9 1 7 117.90Other Architecture & Engineering Occupations 56 49 7 31 4 12 1 3 1 3 1
19Life, Physical, & Social Science Occupations 76 32 44 22 28 6 6 2 6 2 419.10Life Scientists 5 2 3 1 3 0 0 1 0 0 019.20Physical Scientists 9 4 5 4 3 0 1 0 0 0 119.30Social Scientists & Related Workers 30 9 21 6 14 2 3 1 3 0 119.40Life, Physical, & Social Science Technicians 10 4 6 1 4 2 0 0 1 1 119.90Other Life, Physical, & Social Science Occupations 22 13 9 10 4 2 2 0 2 1 1
21Community & Social Services Occupations 326 101 225 23 74 48 105 19 31 11 1521.10Counselors, Social Workers, Other Cmmty./Soc. Svcs. Workers 231 64 167 12 54 32 80 14 22 6 1121.20Religious Workers 5 3 2 2 1 1 1 0 0 0 021.90Other Community & Social Services Occupations 90 34 56 9 19 15 24 5 9 5 4
23Legal Occupations 146 42 104 25 55 3 25 7 12 7 1223.10Lawyers, Judges, & Related Workers 22 11 11 10 6 0 2 0 1 1 223.20Legal Support Workers 50 6 44 2 23 1 9 3 6 0 623.90Other Legal Occupations 74 25 49 13 26 2 14 4 5 6 4
19Connecticut Data for Affirmative Action Plans ~ 2nd Quarter 2013

HartfordCharacteristics of Job Seekers registered with CT Works Career Centers
SOC CodeOccupation
Total Applicants
Total Male
Total Female
White Male
White Female
Black Male
Black Female
Hispanic Male
Hispanic Female
Other Male
Other Female
25Education, Training, & Library Occupations 408 103 305 56 131 27 65 12 77 8 3225.10Postsecondary Teachers 48 25 23 13 7 8 4 3 10 1 225.20Primary, Secondary & Special Education Teachers 140 24 116 16 68 5 18 0 19 3 1125.30Other Teachers & Instructors 20 6 14 3 5 3 4 0 3 0 225.40Librarians, Curators, & Archivists 6 3 3 2 0 1 2 0 1 0 025.90Other Education, Training, & Library Occupations 194 45 149 22 51 10 37 9 44 4 17
27Arts, Design, Entertainment, Sports, & Media Occupations 165 80 85 45 52 12 12 14 13 9 827.10Art & Design Workers 60 25 35 14 21 2 3 4 8 5 327.20Entertainers & Performers, Sports & Related Workers 15 11 4 3 2 5 2 2 0 1 027.30Media & Communication Workers 34 17 17 10 13 5 3 2 0 0 127.40Media & Communication Equipment Workers 6 3 3 3 1 0 1 0 0 0 127.90Other Arts, Design, Entertainment, Sports, & Media Workers 50 24 26 15 15 0 3 6 5 3 3
29Healthcare Practitioners & Technical Occupations 403 86 317 46 152 22 92 7 38 11 3529.10Health Diagnosing & Treating Practitioners 117 16 101 9 62 3 21 2 6 2 1229.20Health Technologists & Technicians 178 39 139 20 52 12 48 3 23 4 1629.90Other Healthcare Practitioners & Technical Occupations 108 31 77 17 38 7 23 2 9 5 7
31Healthcare Support Occupations 1,038 146 892 44 232 60 372 24 210 18 7831.10Nursing, Psychiatric, & Home Health Aides 502 60 442 12 72 31 234 9 96 8 4031.20Occupational & Physical Therapist Assistants & Aides 5 3 2 2 1 1 1 0 0 0 031.90Other Healthcare Support Occupations 531 83 448 30 159 28 137 15 114 10 38
33Protective Service Occupations 202 128 74 46 23 47 30 23 17 12 433.10First-Line Supervisors/Mgrs. of Protective Service Workers 1 0 1 0 1 0 0 0 0 0 033.20Fire Fighting & Prevention Workers 3 2 1 2 1 0 0 0 0 0 033.30Law Enforcement Workers 21 17 4 12 1 2 2 3 1 0 033.90Other Protective Service Workers 177 109 68 32 20 45 28 20 16 12 4
35Food Preparation & Serving Related Occupations 992 558 434 145 190 193 105 152 89 68 5035.10Supervisors of Food Preparation & Serving Workers 85 67 18 23 11 17 4 16 1 11 235.20Cooks & Food Preparation Workers 359 229 130 59 41 93 41 51 37 26 1135.30Food & Beverage Serving Workers 271 98 173 30 90 27 35 30 26 11 2235.90Other Food Preparation & Serving Related Workers 277 164 113 33 48 56 25 55 25 20 15
37Building & Grounds Cleaning & Maintenance Occupations 500 318 182 88 37 78 40 124 91 28 1437.10Supervisors of Bldg./Grounds Cleaning & Maintenance Workers 28 19 9 7 3 3 3 7 3 2 037.20Building Cleaning & Pest Control Workers 265 137 128 32 23 29 22 64 72 12 1137.30Grounds Maintenance Workers 89 84 5 29 2 23 1 25 2 7 037.90Other Building/Grounds Cleaning & Maintenance Occupations 118 78 40 20 9 23 14 28 14 7 3
20Connecticut Department of Labor - Office of Research ~ Labor Market Information
HartfordCharacteristics of Job Seekers registered with CT Works Career Centers
SOC CodeOccupation
Total Applicants
Total Male
Total Female
White Male
White Female
Black Male
Black Female
Hispanic Male
Hispanic Female
Other Male
Other Female
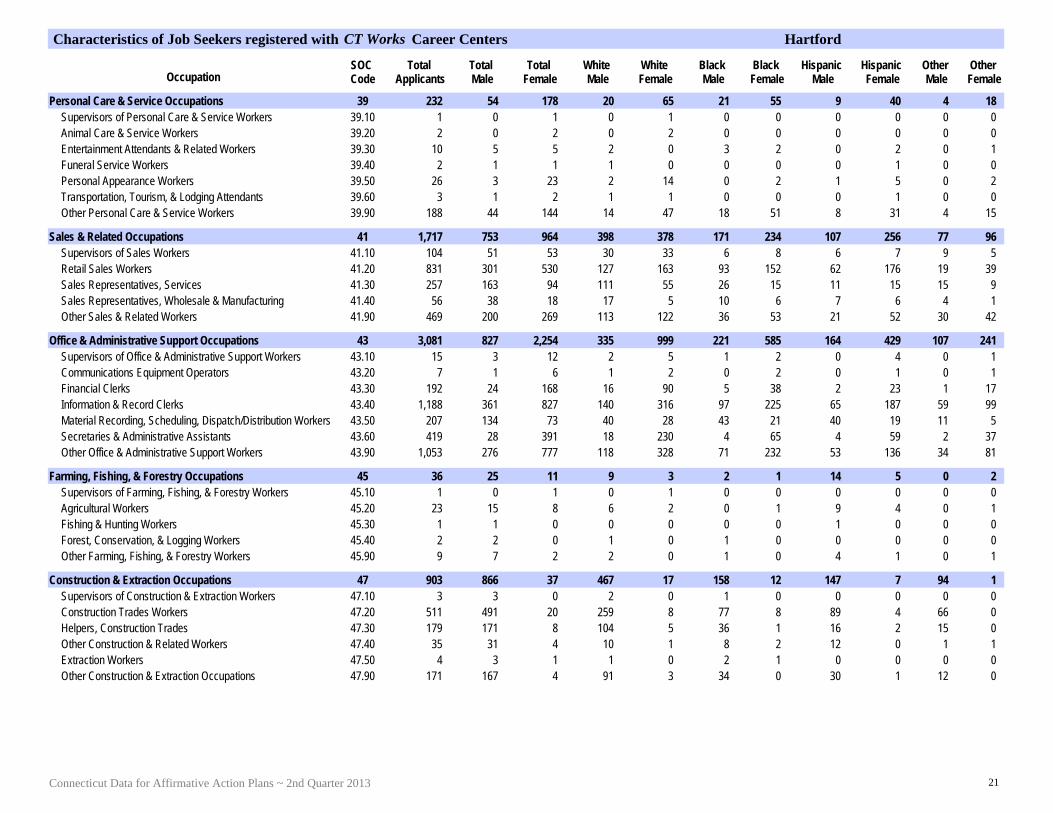
39Personal Care & Service Occupations 232 54 178 20 65 21 55 9 40 4 1839.10Supervisors of Personal Care & Service Workers 1 0 1 0 1 0 0 0 0 0 039.20Animal Care & Service Workers 2 0 2 0 2 0 0 0 0 0 039.30Entertainment Attendants & Related Workers 10 5 5 2 0 3 2 0 2 0 139.40Funeral Service Workers 2 1 1 1 0 0 0 0 1 0 039.50Personal Appearance Workers 26 3 23 2 14 0 2 1 5 0 239.60Transportation, Tourism, & Lodging Attendants 3 1 2 1 1 0 0 0 1 0 039.90Other Personal Care & Service Workers 188 44 144 14 47 18 51 8 31 4 15
41Sales & Related Occupations 1,717 753 964 398 378 171 234 107 256 77 9641.10Supervisors of Sales Workers 104 51 53 30 33 6 8 6 7 9 541.20Retail Sales Workers 831 301 530 127 163 93 152 62 176 19 3941.30Sales Representatives, Services 257 163 94 111 55 26 15 11 15 15 941.40Sales Representatives, Wholesale & Manufacturing 56 38 18 17 5 10 6 7 6 4 141.90Other Sales & Related Workers 469 200 269 113 122 36 53 21 52 30 42
43Office & Administrative Support Occupations 3,081 827 2,254 335 999 221 585 164 429 107 24143.10Supervisors of Office & Administrative Support Workers 15 3 12 2 5 1 2 0 4 0 143.20Communications Equipment Operators 7 1 6 1 2 0 2 0 1 0 143.30Financial Clerks 192 24 168 16 90 5 38 2 23 1 1743.40Information & Record Clerks 1,188 361 827 140 316 97 225 65 187 59 9943.50Material Recording, Scheduling, Dispatch/Distribution Workers 207 134 73 40 28 43 21 40 19 11 543.60Secretaries & Administrative Assistants 419 28 391 18 230 4 65 4 59 2 3743.90Other Office & Administrative Support Workers 1,053 276 777 118 328 71 232 53 136 34 81
45Farming, Fishing, & Forestry Occupations 36 25 11 9 3 2 1 14 5 0 245.10Supervisors of Farming, Fishing, & Forestry Workers 1 0 1 0 1 0 0 0 0 0 045.20Agricultural Workers 23 15 8 6 2 0 1 9 4 0 145.30Fishing & Hunting Workers 1 1 0 0 0 0 0 1 0 0 045.40Forest, Conservation, & Logging Workers 2 2 0 1 0 1 0 0 0 0 045.90Other Farming, Fishing, & Forestry Workers 9 7 2 2 0 1 0 4 1 0 1
47Construction & Extraction Occupations 903 866 37 467 17 158 12 147 7 94 147.10Supervisors of Construction & Extraction Workers 3 3 0 2 0 1 0 0 0 0 047.20Construction Trades Workers 511 491 20 259 8 77 8 89 4 66 047.30Helpers, Construction Trades 179 171 8 104 5 36 1 16 2 15 047.40Other Construction & Related Workers 35 31 4 10 1 8 2 12 0 1 147.50Extraction Workers 4 3 1 1 0 2 1 0 0 0 047.90Other Construction & Extraction Occupations 171 167 4 91 3 34 0 30 1 12 0
21Connecticut Data for Affirmative Action Plans ~ 2nd Quarter 2013

HartfordCharacteristics of Job Seekers registered with CT Works Career Centers
SOC CodeOccupation
Total Applicants
Total Male
Total Female
White Male
White Female
Black Male
Black Female
Hispanic Male
Hispanic Female
Other Male
Other Female
49Installation, Maintenance, & Repair Occupations 551 528 23 274 7 84 5 132 8 38 349.10Supervisors of Installation, Maintenance, & Repair Workers 4 4 0 3 0 1 0 0 0 0 049.20Electrical & Electronic Equipment Mechanics, Installers 53 50 3 26 1 10 0 10 1 4 149.30Vehicle & Mobile Equipment Mechanics, Installers, Repairers 130 128 2 64 0 19 0 32 2 13 049.90Other Installation, Maintenance & Repair Occupations 364 346 18 181 6 54 5 90 5 21 2
51Production Occupations 1,994 1,386 608 516 195 361 146 370 204 139 6351.10Supervisors of Production Workers 5 3 2 3 2 0 0 0 0 0 051.20Assemblers & Fabricators 63 39 24 20 8 5 4 10 8 4 451.30Food Processing Workers 30 18 12 8 7 4 0 4 5 2 051.40Metal Workers & Plastic Workers 745 530 215 232 90 113 50 131 49 54 2651.50Printing Workers 39 34 5 23 2 7 1 3 2 1 051.60Textile, Apparel, & Furnishings Workers 44 16 28 4 3 3 5 8 19 1 151.70Woodworkers 6 5 1 1 0 1 0 3 1 0 051.80Plant & System Operators 2 2 0 0 0 1 0 0 0 1 051.90Other Production Occupations 1,060 739 321 225 83 227 86 211 120 76 32
53Transportation & Material Moving Occupations 1,029 765 264 261 58 267 77 178 104 59 2553.10Supervisors of Transportation & Material Moving Workers 5 2 3 2 2 0 1 0 0 0 053.20Air Transportation Workers 4 3 1 1 0 1 0 1 0 0 153.30Motor Vehicle Operators 479 352 127 136 28 117 42 74 47 25 1053.40Rail Transportation Workers 1 1 0 0 0 1 0 0 0 0 053.50Water Transportation Workers 2 2 0 2 0 0 0 0 0 0 053.60Other Transportation Workers 22 18 4 2 3 8 0 6 0 2 153.70Material Moving Workers 283 227 56 54 7 93 11 66 33 14 553.90Other Transportation & Material Moving Occupations 233 160 73 64 18 47 23 31 24 18 8
55Military Specific Occupations 47 41 6 25 3 7 2 7 1 2 055.10Military Officer Special & Tactical Operations Leaders/Mgrs. 2 2 0 1 0 0 0 1 0 0 055.30Military Enlisted Tactical Operations & Air/Weapon 11 10 1 7 1 1 0 1 0 1 055.90Other Military Specific Occupations 34 29 5 17 2 6 2 5 1 1 0
99Unknown/Unclassifiable Occupations 1,093 570 523 249 208 131 126 115 115 75 7499.90Unknown/Unclassifiable Occupations 1,093 570 523 249 208 131 126 115 115 75 74
22Connecticut Department of Labor - Office of Research ~ Labor Market Information

New HavenCharacteristics of Job Seekers registered with CT Works Career Centers
SOC CodeOccupation
Total Applicants
Total Male
Total Female
White Male
White Female
Black Male
Black Female
Hispanic Male
Hispanic Female
Other Male
Other Female
00Total - All Occupations 11,786 5,816 5,970 2,958 2,659 1,369 1,712 925 1,042 564 557
11Management Occupations 700 353 347 276 233 36 56 24 30 17 2811.10Top Executives 152 78 74 60 52 7 10 6 4 5 811.20Advertising, Marketing, Promotions, Public Rel. Occupations 80 46 34 36 26 5 5 1 2 4 111.30Operations Specialties Managers 132 70 62 56 42 5 6 8 7 1 711.90Other Management Occupations 336 159 177 124 113 19 35 9 17 7 12
13Business & Financial Operations Occupations 403 172 231 114 138 28 45 14 20 16 2813.10Business Operations Specialists 100 42 58 26 31 7 16 5 3 4 813.20Financial Specialists 170 74 96 47 65 14 13 5 8 8 1013.90Other Business & Financial Operations Occupations 133 56 77 41 42 7 16 4 9 4 10
15Computer & Mathematical Occupations 179 134 45 98 27 18 6 8 3 10 915.10Computer Specialists 126 94 32 70 18 12 5 4 2 8 715.20Mathematical Scientists 1 0 1 0 0 0 0 0 1 0 015.90Other Computer & Mathematical Occupations 52 40 12 28 9 6 1 4 0 2 2
17Architecture & Engineering Occupations 134 114 20 81 10 13 5 7 3 13 217.10Architects, Surveyors, & Cartographers 5 4 1 4 0 0 1 0 0 0 017.20Engineers 61 54 7 40 5 6 2 1 0 7 017.30Drafters, Engineering, & Mapping Technicians 30 25 5 13 1 6 2 4 1 2 117.90Other Architecture & Engineering Occupations 38 31 7 24 4 1 0 2 2 4 1
19Life, Physical, & Social Science Occupations 84 39 45 30 22 2 7 0 6 7 1019.10Life Scientists 10 5 5 4 3 0 0 0 0 1 219.20Physical Scientists 20 15 5 13 2 0 1 0 0 2 219.30Social Scientists & Related Workers 16 5 11 3 4 0 4 0 2 2 119.40Life, Physical, & Social Science Technicians 9 2 7 1 4 1 1 0 1 0 119.90Other Life, Physical, & Social Science Occupations 29 12 17 9 9 1 1 0 3 2 4
21Community & Social Services Occupations 176 66 110 18 37 37 51 6 13 5 921.10Counselors, Social Workers, Other Cmmty./Soc. Svcs. Workers 116 43 73 12 21 22 42 6 8 3 221.20Religious Workers 3 2 1 1 0 1 1 0 0 0 021.90Other Community & Social Services Occupations 57 21 36 5 16 14 8 0 5 2 7
23Legal Occupations 101 28 73 21 54 4 9 2 6 1 423.10Lawyers, Judges, & Related Workers 15 6 9 6 8 0 0 0 0 0 123.20Legal Support Workers 30 3 27 3 21 0 3 0 3 0 023.90Other Legal Occupations 56 19 37 12 25 4 6 2 3 1 3
23Connecticut Data for Affirmative Action Plans ~ 2nd Quarter 2013

New HavenCharacteristics of Job Seekers registered with CT Works Career Centers
SOC CodeOccupation
Total Applicants
Total Male
Total Female
White Male
White Female
Black Male
Black Female
Hispanic Male
Hispanic Female
Other Male
Other Female
25Education, Training, & Library Occupations 269 61 208 32 110 13 43 10 39 6 1625.10Postsecondary Teachers 31 7 24 4 17 1 4 0 2 2 125.20Primary, Secondary & Special Education Teachers 94 19 75 14 47 3 15 0 11 2 225.30Other Teachers & Instructors 9 2 7 1 3 0 1 1 2 0 125.40Librarians, Curators, & Archivists 3 2 1 1 1 0 0 0 0 1 025.90Other Education, Training, & Library Occupations 132 31 101 12 42 9 23 9 24 1 12
27Arts, Design, Entertainment, Sports, & Media Occupations 117 59 58 49 40 7 6 1 5 2 727.10Art & Design Workers 46 19 27 17 22 1 2 0 2 1 127.20Entertainers & Performers, Sports & Related Workers 10 7 3 6 1 0 1 0 1 1 027.30Media & Communication Workers 27 15 12 11 9 4 0 0 1 0 227.40Media & Communication Equipment Workers 6 4 2 4 0 0 0 0 0 0 227.90Other Arts, Design, Entertainment, Sports, & Media Workers 28 14 14 11 8 2 3 1 1 0 2
29Healthcare Practitioners & Technical Occupations 296 50 246 29 143 8 62 8 24 5 1729.10Health Diagnosing & Treating Practitioners 73 10 63 7 47 1 11 1 4 1 129.20Health Technologists & Technicians 138 17 121 9 59 4 38 3 14 1 1029.90Other Healthcare Practitioners & Technical Occupations 85 23 62 13 37 3 13 4 6 3 6
31Healthcare Support Occupations 845 87 758 26 196 42 388 10 119 9 5531.10Nursing, Psychiatric, & Home Health Aides 481 47 434 8 82 29 261 4 63 6 2831.20Occupational & Physical Therapist Assistants & Aides 1 0 1 0 0 0 0 0 1 0 031.90Other Healthcare Support Occupations 363 40 323 18 114 13 127 6 55 3 27
33Protective Service Occupations 160 114 46 51 12 36 18 12 11 15 533.10First-Line Supervisors/Mgrs. of Protective Service Workers 1 1 0 0 0 0 0 0 0 1 033.20Fire Fighting & Prevention Workers 1 1 0 1 0 0 0 0 0 0 033.30Law Enforcement Workers 14 10 4 5 0 3 2 0 1 2 133.90Other Protective Service Workers 144 102 42 45 12 33 16 12 10 12 4
35Food Preparation & Serving Related Occupations 626 309 317 118 150 115 92 53 50 23 2535.10Supervisors of Food Preparation & Serving Workers 39 29 10 22 4 4 4 3 2 0 035.20Cooks & Food Preparation Workers 213 133 80 36 25 63 33 22 14 12 835.30Food & Beverage Serving Workers 189 53 136 21 73 13 32 13 19 6 1235.90Other Food Preparation & Serving Related Workers 185 94 91 39 48 35 23 15 15 5 5
37Building & Grounds Cleaning & Maintenance Occupations 313 190 123 57 28 70 42 42 45 21 837.10Supervisors of Bldg./Grounds Cleaning & Maintenance Workers 7 6 1 2 0 2 0 2 1 0 037.20Building Cleaning & Pest Control Workers 194 106 88 27 20 42 32 23 31 14 537.30Grounds Maintenance Workers 36 32 4 19 2 6 1 5 1 2 037.90Other Building/Grounds Cleaning & Maintenance Occupations 76 46 30 9 6 20 9 12 12 5 3
24Connecticut Department of Labor - Office of Research ~ Labor Market Information

New HavenCharacteristics of Job Seekers registered with CT Works Career Centers
SOC CodeOccupation
Total Applicants
Total Male
Total Female
White Male
White Female
Black Male
Black Female
Hispanic Male
Hispanic Female
Other Male
Other Female
39Personal Care & Service Occupations 166 37 129 17 63 10 38 3 19 7 939.10Supervisors of Personal Care & Service Workers 1 1 0 1 0 0 0 0 0 0 039.30Entertainment Attendants & Related Workers 3 1 2 1 0 0 0 0 1 0 139.40Funeral Service Workers 1 1 0 1 0 0 0 0 0 0 039.50Personal Appearance Workers 14 1 13 1 11 0 0 0 2 0 039.60Transportation, Tourism, & Lodging Attendants 1 0 1 0 1 0 0 0 0 0 039.90Other Personal Care & Service Workers 146 33 113 13 51 10 38 3 16 7 8
41Sales & Related Occupations 1,163 479 684 279 283 114 218 51 130 35 5341.10Supervisors of Sales Workers 87 39 48 24 37 6 7 5 4 4 041.20Retail Sales Workers 596 194 402 96 125 58 152 31 87 9 3841.30Sales Representatives, Services 169 102 67 64 46 21 9 5 7 12 541.40Sales Representatives, Wholesale & Manufacturing 23 19 4 18 4 0 0 0 0 1 041.90Other Sales & Related Workers 288 125 163 77 71 29 50 10 32 9 10
43Office & Administrative Support Occupations 1,948 546 1,402 244 720 147 338 77 206 78 13843.10Supervisors of Office & Administrative Support Workers 5 2 3 2 1 0 1 0 0 0 143.20Communications Equipment Operators 5 2 3 0 2 2 1 0 0 0 043.30Financial Clerks 122 14 108 7 70 5 13 1 13 1 1243.40Information & Record Clerks 818 253 565 105 245 57 173 40 85 51 6243.50Material Recording, Scheduling, Dispatch/Distribution Workers 151 102 49 41 25 45 9 13 11 3 443.60Secretaries & Administrative Assistants 292 12 280 7 178 3 40 0 38 2 2443.90Other Office & Administrative Support Workers 555 161 394 82 199 35 101 23 59 21 35
45Farming, Fishing, & Forestry Occupations 17 10 7 4 0 3 3 2 2 1 245.20Agricultural Workers 7 4 3 1 0 1 0 2 2 0 145.30Fishing & Hunting Workers 1 1 0 0 0 1 0 0 0 0 045.40Forest, Conservation, & Logging Workers 1 1 0 1 0 0 0 0 0 0 045.90Other Farming, Fishing, & Forestry Workers 8 4 4 2 0 1 3 0 0 1 1
47Construction & Extraction Occupations 723 686 37 415 16 123 14 97 4 51 347.10Supervisors of Construction & Extraction Workers 1 1 0 1 0 0 0 0 0 0 047.20Construction Trades Workers 425 404 21 233 10 73 5 64 3 34 347.30Helpers, Construction Trades 137 126 11 81 4 24 6 14 1 7 047.40Other Construction & Related Workers 22 20 2 6 0 6 2 6 0 2 047.90Other Construction & Extraction Occupations 138 135 3 94 2 20 1 13 0 8 0
49Installation, Maintenance, & Repair Occupations 386 372 14 214 6 51 5 74 2 33 149.10Supervisors of Installation, Maintenance, & Repair Workers 3 2 1 1 1 0 0 1 0 0 049.20Electrical & Electronic Equipment Mechanics, Installers 34 34 0 21 0 4 0 4 0 5 049.30Vehicle & Mobile Equipment Mechanics, Installers, Repairers 83 82 1 51 0 6 1 19 0 6 049.90Other Installation, Maintenance & Repair Occupations 266 254 12 141 5 41 4 50 2 22 1
25Connecticut Data for Affirmative Action Plans ~ 2nd Quarter 2013

New HavenCharacteristics of Job Seekers registered with CT Works Career Centers
SOC CodeOccupation
Total Applicants
Total Male
Total Female
White Male
White Female
Black Male
Black Female
Hispanic Male
Hispanic Female
Other Male
Other Female
51Production Occupations 1,269 816 453 324 151 190 93 229 173 73 3651.10Supervisors of Production Workers 4 3 1 2 0 1 0 0 0 0 151.20Assemblers & Fabricators 56 30 26 8 6 11 3 7 17 4 051.30Food Processing Workers 26 22 4 7 1 10 1 5 1 0 151.40Metal Workers & Plastic Workers 422 279 143 132 68 50 26 74 42 23 751.50Printing Workers 26 21 5 9 1 4 2 2 2 6 051.60Textile, Apparel, & Furnishings Workers 22 7 15 2 5 2 4 2 4 1 251.70Woodworkers 4 4 0 3 0 0 0 1 0 0 051.80Plant & System Operators 3 2 1 0 0 0 0 0 0 2 151.90Other Production Occupations 706 448 258 161 70 112 57 138 107 37 24
53Transportation & Material Moving Occupations 821 628 193 249 46 201 60 119 67 59 2053.10Supervisors of Transportation & Material Moving Workers 3 3 0 3 0 0 0 0 0 0 053.20Air Transportation Workers 1 1 0 1 0 0 0 0 0 0 053.30Motor Vehicle Operators 348 282 66 126 22 91 20 46 16 19 853.40Rail Transportation Workers 3 3 0 1 0 2 0 0 0 0 053.50Water Transportation Workers 4 4 0 3 0 0 0 0 0 1 053.60Other Transportation Workers 22 21 1 7 0 10 1 1 0 3 053.70Material Moving Workers 258 183 75 46 11 69 18 45 40 23 653.90Other Transportation & Material Moving Occupations 182 131 51 62 13 29 21 27 11 13 6
55Military Specific Occupations 32 25 7 15 1 2 3 6 2 2 155.10Military Officer Special & Tactical Operations Leaders/Mgrs. 2 1 1 0 0 0 1 1 0 0 055.30Military Enlisted Tactical Operations & Air/Weapon 3 3 0 1 0 0 0 1 0 1 055.90Other Military Specific Occupations 27 21 6 14 1 2 2 4 2 1 1
99Unknown/Unclassifiable Occupations 858 441 417 197 173 99 110 70 63 75 7199.90Unknown/Unclassifiable Occupations 858 441 417 197 173 99 110 70 63 75 71
26Connecticut Department of Labor - Office of Research ~ Labor Market Information
Norwich-New LondonCharacteristics of Job Seekers registered with CT Works Career Centers
SOC CodeOccupation
Total Applicants
Total Male
Total Female
White Male
White Female
Black Male
Black Female
Hispanic Male
Hispanic Female
Other Male
Other Female
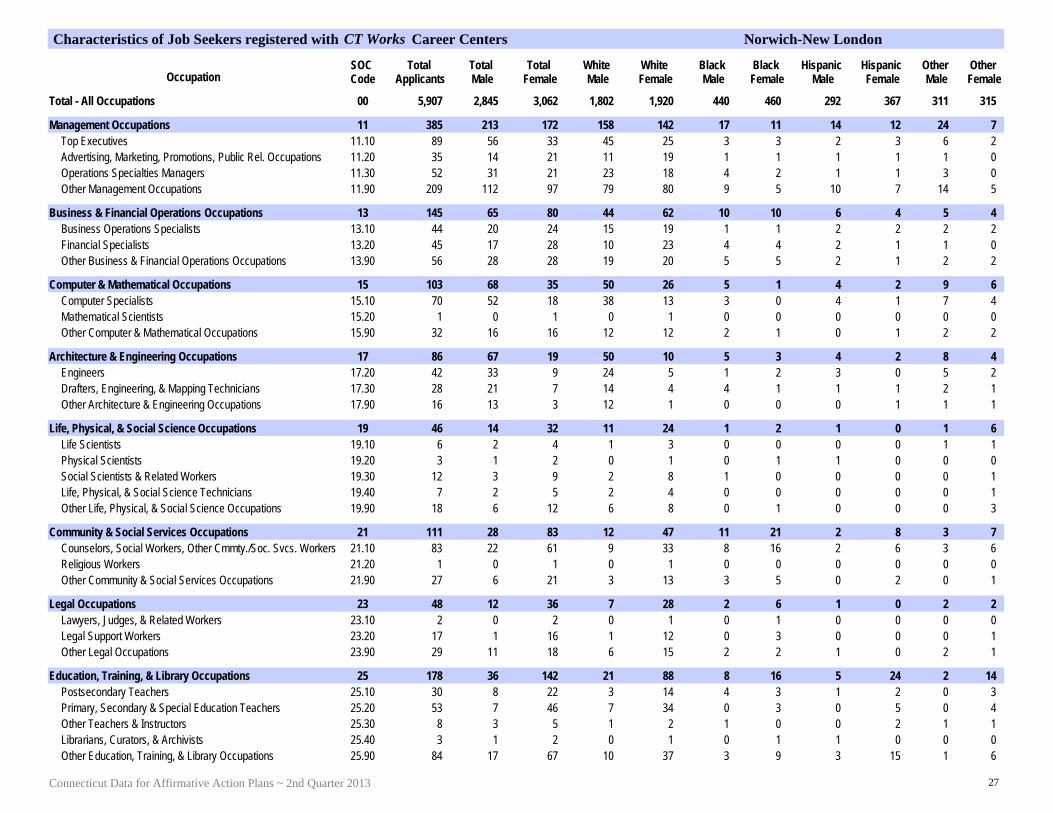
00Total - All Occupations 5,907 2,845 3,062 1,802 1,920 440 460 292 367 311 315
11Management Occupations 385 213 172 158 142 17 11 14 12 24 711.10Top Executives 89 56 33 45 25 3 3 2 3 6 211.20Advertising, Marketing, Promotions, Public Rel. Occupations 35 14 21 11 19 1 1 1 1 1 011.30Operations Specialties Managers 52 31 21 23 18 4 2 1 1 3 011.90Other Management Occupations 209 112 97 79 80 9 5 10 7 14 5
13Business & Financial Operations Occupations 145 65 80 44 62 10 10 6 4 5 413.10Business Operations Specialists 44 20 24 15 19 1 1 2 2 2 213.20Financial Specialists 45 17 28 10 23 4 4 2 1 1 013.90Other Business & Financial Operations Occupations 56 28 28 19 20 5 5 2 1 2 2
15Computer & Mathematical Occupations 103 68 35 50 26 5 1 4 2 9 615.10Computer Specialists 70 52 18 38 13 3 0 4 1 7 415.20Mathematical Scientists 1 0 1 0 1 0 0 0 0 0 015.90Other Computer & Mathematical Occupations 32 16 16 12 12 2 1 0 1 2 2
17Architecture & Engineering Occupations 86 67 19 50 10 5 3 4 2 8 417.20Engineers 42 33 9 24 5 1 2 3 0 5 217.30Drafters, Engineering, & Mapping Technicians 28 21 7 14 4 4 1 1 1 2 117.90Other Architecture & Engineering Occupations 16 13 3 12 1 0 0 0 1 1 1
19Life, Physical, & Social Science Occupations 46 14 32 11 24 1 2 1 0 1 619.10Life Scientists 6 2 4 1 3 0 0 0 0 1 119.20Physical Scientists 3 1 2 0 1 0 1 1 0 0 019.30Social Scientists & Related Workers 12 3 9 2 8 1 0 0 0 0 119.40Life, Physical, & Social Science Technicians 7 2 5 2 4 0 0 0 0 0 119.90Other Life, Physical, & Social Science Occupations 18 6 12 6 8 0 1 0 0 0 3
21Community & Social Services Occupations 111 28 83 12 47 11 21 2 8 3 721.10Counselors, Social Workers, Other Cmmty./Soc. Svcs. Workers 83 22 61 9 33 8 16 2 6 3 621.20Religious Workers 1 0 1 0 1 0 0 0 0 0 021.90Other Community & Social Services Occupations 27 6 21 3 13 3 5 0 2 0 1
23Legal Occupations 48 12 36 7 28 2 6 1 0 2 223.10Lawyers, Judges, & Related Workers 2 0 2 0 1 0 1 0 0 0 023.20Legal Support Workers 17 1 16 1 12 0 3 0 0 0 123.90Other Legal Occupations 29 11 18 6 15 2 2 1 0 2 1
25Education, Training, & Library Occupations 178 36 142 21 88 8 16 5 24 2 1425.10Postsecondary Teachers 30 8 22 3 14 4 3 1 2 0 325.20Primary, Secondary & Special Education Teachers 53 7 46 7 34 0 3 0 5 0 425.30Other Teachers & Instructors 8 3 5 1 2 1 0 0 2 1 125.40Librarians, Curators, & Archivists 3 1 2 0 1 0 1 1 0 0 025.90Other Education, Training, & Library Occupations 84 17 67 10 37 3 9 3 15 1 6
27Connecticut Data for Affirmative Action Plans ~ 2nd Quarter 2013

Norwich-New LondonCharacteristics of Job Seekers registered with CT Works Career Centers
SOC CodeOccupation
Total Applicants
Total Male
Total Female
White Male
White Female
Black Male
Black Female
Hispanic Male
Hispanic Female
Other Male
Other Female
27Arts, Design, Entertainment, Sports, & Media Occupations 73 30 43 18 21 4 8 4 6 4 827.10Art & Design Workers 31 13 18 9 8 1 4 2 3 1 327.20Entertainers & Performers, Sports & Related Workers 6 3 3 2 1 0 2 1 0 0 027.30Media & Communication Workers 18 7 11 5 7 1 1 0 0 1 327.40Media & Communication Equipment Workers 2 0 2 0 0 0 0 0 1 0 127.90Other Arts, Design, Entertainment, Sports, & Media Workers 16 7 9 2 5 2 1 1 2 2 1
29Healthcare Practitioners & Technical Occupations 146 26 120 17 84 4 16 2 16 3 429.10Health Diagnosing & Treating Practitioners 30 7 23 5 13 2 6 0 3 0 129.20Health Technologists & Technicians 61 12 49 7 35 1 5 1 6 3 329.90Other Healthcare Practitioners & Technical Occupations 55 7 48 5 36 1 5 1 7 0 0
31Healthcare Support Occupations 430 70 360 29 181 23 105 7 48 11 2631.10Nursing, Psychiatric, & Home Health Aides 184 21 163 5 76 9 51 3 26 4 1031.20Occupational & Physical Therapist Assistants & Aides 7 2 5 0 4 2 0 0 0 0 131.90Other Healthcare Support Occupations 239 47 192 24 101 12 54 4 22 7 15
33Protective Service Occupations 76 64 12 34 6 11 2 12 0 7 433.10First-Line Supervisors/Mgrs. of Protective Service Workers 2 2 0 1 0 1 0 0 0 0 033.30Law Enforcement Workers 7 6 1 2 0 1 1 2 0 1 033.90Other Protective Service Workers 67 56 11 31 6 9 1 10 0 6 4
35Food Preparation & Serving Related Occupations 500 219 281 101 179 62 37 27 29 29 3635.10Supervisors of Food Preparation & Serving Workers 25 19 6 12 3 0 0 4 0 3 335.20Cooks & Food Preparation Workers 170 98 72 43 40 31 8 14 14 10 1035.30Food & Beverage Serving Workers 162 36 126 19 92 8 16 2 8 7 1035.90Other Food Preparation & Serving Related Workers 143 66 77 27 44 23 13 7 7 9 13
37Building & Grounds Cleaning & Maintenance Occupations 245 134 111 66 45 27 28 28 31 13 737.10Supervisors of Bldg./Grounds Cleaning & Maintenance Workers 14 8 6 6 3 1 1 1 2 0 037.20Building Cleaning & Pest Control Workers 145 63 82 29 31 10 26 16 22 8 337.30Grounds Maintenance Workers 40 38 2 20 1 9 0 5 0 4 137.90Other Building/Grounds Cleaning & Maintenance Occupations 46 25 21 11 10 7 1 6 7 1 3
39Personal Care & Service Occupations 205 70 135 36 72 12 20 9 21 13 2239.10Supervisors of Personal Care & Service Workers 20 9 11 5 6 1 1 1 2 2 239.20Animal Care & Service Workers 2 0 2 0 2 0 0 0 0 0 039.30Entertainment Attendants & Related Workers 80 41 39 21 17 6 5 5 7 9 1039.40Funeral Service Workers 1 0 1 0 0 0 0 0 0 0 139.50Personal Appearance Workers 9 1 8 1 3 0 0 0 5 0 039.60Transportation, Tourism, & Lodging Attendants 3 1 2 0 1 1 1 0 0 0 039.90Other Personal Care & Service Workers 90 18 72 9 43 4 13 3 7 2 9
28Connecticut Department of Labor - Office of Research ~ Labor Market Information

Norwich-New LondonCharacteristics of Job Seekers registered with CT Works Career Centers
SOC CodeOccupation
Total Applicants
Total Male
Total Female
White Male
White Female
Black Male
Black Female
Hispanic Male
Hispanic Female
Other Male
Other Female
41Sales & Related Occupations 540 192 348 125 221 30 48 19 46 18 3341.10Supervisors of Sales Workers 39 17 22 12 22 0 0 1 0 4 041.20Retail Sales Workers 281 78 203 45 112 17 39 9 33 7 1941.30Sales Representatives, Services 60 32 28 24 21 5 2 3 3 0 241.40Sales Representatives, Wholesale & Manufacturing 11 7 4 1 3 2 0 1 1 3 041.90Other Sales & Related Workers 149 58 91 43 63 6 7 5 9 4 12
43Office & Administrative Support Occupations 808 215 593 118 395 40 71 16 61 41 6643.10Supervisors of Office & Administrative Support Workers 8 0 8 0 5 0 1 0 1 0 143.20Communications Equipment Operators 3 0 3 0 1 0 1 0 1 0 043.30Financial Clerks 43 6 37 4 24 1 2 0 7 1 443.40Information & Record Clerks 334 110 224 55 137 20 28 6 24 29 3543.50Material Recording, Scheduling, Dispatch/Distribution Workers 51 35 16 22 12 6 2 4 1 3 143.60Secretaries & Administrative Assistants 125 10 115 8 92 1 12 0 6 1 543.90Other Office & Administrative Support Workers 244 54 190 29 124 12 25 6 21 7 20
45Farming, Fishing, & Forestry Occupations 11 6 5 2 4 1 0 2 1 1 045.10Supervisors of Farming, Fishing, & Forestry Workers 2 2 0 2 0 0 0 0 0 0 045.20Agricultural Workers 9 4 5 0 4 1 0 2 1 1 0
47Construction & Extraction Occupations 407 387 20 285 15 42 4 21 0 39 147.10Supervisors of Construction & Extraction Workers 3 3 0 2 0 0 0 1 0 0 047.20Construction Trades Workers 254 242 12 183 9 22 2 14 0 23 147.30Helpers, Construction Trades 60 57 3 36 2 10 1 2 0 9 047.40Other Construction & Related Workers 10 10 0 6 0 2 0 1 0 1 047.50Extraction Workers 4 3 1 1 0 2 1 0 0 0 047.90Other Construction & Extraction Occupations 76 72 4 57 4 6 0 3 0 6 0
49Installation, Maintenance, & Repair Occupations 191 179 12 130 2 19 0 18 5 12 549.10Supervisors of Installation, Maintenance, & Repair Workers 4 4 0 3 0 0 0 0 0 1 049.20Electrical & Electronic Equipment Mechanics, Installers 14 13 1 10 0 2 0 0 0 1 149.30Vehicle & Mobile Equipment Mechanics, Installers, Repairers 46 46 0 33 0 3 0 7 0 3 049.90Other Installation, Maintenance & Repair Occupations 127 116 11 84 2 14 0 11 5 7 4
51Production Occupations 449 310 139 185 79 50 18 45 27 30 1551.10Supervisors of Production Workers 1 1 0 1 0 0 0 0 0 0 051.20Assemblers & Fabricators 11 6 5 4 3 0 0 1 2 1 051.30Food Processing Workers 7 2 5 0 2 0 1 1 2 1 051.40Metal Workers & Plastic Workers 172 125 47 88 29 10 6 16 5 11 751.50Printing Workers 1 1 0 0 0 1 0 0 0 0 051.60Textile, Apparel, & Furnishings Workers 6 3 3 0 2 2 0 1 1 0 051.70Woodworkers 1 1 0 0 0 1 0 0 0 0 051.80Plant & System Operators 7 7 0 3 0 0 0 3 0 1 051.90Other Production Occupations 243 164 79 89 43 36 11 23 17 16 8
29Connecticut Data for Affirmative Action Plans ~ 2nd Quarter 2013

Norwich-New LondonCharacteristics of Job Seekers registered with CT Works Career Centers
SOC CodeOccupation
Total Applicants
Total Male
Total Female
White Male
White Female
Black Male
Black Female
Hispanic Male
Hispanic Female
Other Male
Other Female
53Transportation & Material Moving Occupations 336 236 100 146 72 42 10 32 10 16 853.10Supervisors of Transportation & Material Moving Workers 2 1 1 1 0 0 0 0 1 0 053.20Air Transportation Workers 3 2 1 1 1 1 0 0 0 0 053.30Motor Vehicle Operators 150 97 53 63 43 17 3 12 2 5 553.40Rail Transportation Workers 2 0 2 0 0 0 2 0 0 0 053.50Water Transportation Workers 3 3 0 3 0 0 0 0 0 0 053.60Other Transportation Workers 18 15 3 8 1 3 2 2 0 2 053.70Material Moving Workers 80 68 12 39 4 14 3 11 4 4 153.90Other Transportation & Material Moving Occupations 78 50 28 31 23 7 0 7 3 5 2
55Military Specific Occupations 33 30 3 25 2 1 0 2 0 2 155.10Military Officer Special & Tactical Operations Leaders/Mgrs. 3 3 0 2 0 0 0 1 0 0 055.30Military Enlisted Tactical Operations & Air/Weapon 1 1 0 1 0 0 0 0 0 0 055.90Other Military Specific Occupations 29 26 3 22 2 1 0 1 0 2 1
99Unknown/Unclassifiable Occupations 355 174 181 132 115 13 23 11 14 18 2999.90Unknown/Unclassifiable Occupations 355 174 181 132 115 13 23 11 14 18 29
30Connecticut Department of Labor - Office of Research ~ Labor Market Information

TorringtonCharacteristics of Job Seekers registered with CT Works Career Centers
SOC CodeOccupation
Total Applicants
Total Male
Total Female
White Male
White Female
Black Male
Black Female
Hispanic Male
Hispanic Female
Other Male
Other Female
00Total - All Occupations 1,615 810 805 647 637 53 47 44 71 66 50
11Management Occupations 102 58 44 54 41 2 0 0 0 2 311.10Top Executives 16 13 3 11 2 1 0 0 0 1 111.20Advertising, Marketing, Promotions, Public Rel. Occupations 10 4 6 4 6 0 0 0 0 0 011.30Operations Specialties Managers 34 16 18 15 17 0 0 0 0 1 111.90Other Management Occupations 42 25 17 24 16 1 0 0 0 0 1
13Business & Financial Operations Occupations 45 14 31 13 27 0 1 0 0 1 313.10Business Operations Specialists 15 6 9 6 7 0 1 0 0 0 113.20Financial Specialists 17 4 13 4 12 0 0 0 0 0 113.90Other Business & Financial Operations Occupations 13 4 9 3 8 0 0 0 0 1 1
15Computer & Mathematical Occupations 31 23 8 19 6 1 1 0 1 3 015.10Computer Specialists 27 20 7 16 5 1 1 0 1 3 015.90Other Computer & Mathematical Occupations 4 3 1 3 1 0 0 0 0 0 0
17Architecture & Engineering Occupations 35 33 2 29 1 1 0 0 0 3 117.20Engineers 22 21 1 19 0 1 0 0 0 1 117.30Drafters, Engineering, & Mapping Technicians 8 7 1 6 1 0 0 0 0 1 017.90Other Architecture & Engineering Occupations 5 5 0 4 0 0 0 0 0 1 0
19Life, Physical, & Social Science Occupations 9 3 6 3 3 0 0 0 1 0 219.10Life Scientists 1 0 1 0 0 0 0 0 0 0 119.20Physical Scientists 2 0 2 0 1 0 0 0 0 0 119.30Social Scientists & Related Workers 1 1 0 1 0 0 0 0 0 0 019.40Life, Physical, & Social Science Technicians 2 1 1 1 1 0 0 0 0 0 019.90Other Life, Physical, & Social Science Occupations 3 1 2 1 1 0 0 0 1 0 0
21Community & Social Services Occupations 28 8 20 6 13 1 4 0 2 1 121.10Counselors, Social Workers, Other Cmmty./Soc. Svcs. Workers 19 3 16 1 11 1 3 0 1 1 121.90Other Community & Social Services Occupations 9 5 4 5 2 0 1 0 1 0 0
23Legal Occupations 13 1 12 1 9 0 1 0 2 0 023.10Lawyers, Judges, & Related Workers 2 0 2 0 1 0 0 0 1 0 023.20Legal Support Workers 5 0 5 0 5 0 0 0 0 0 023.90Other Legal Occupations 6 1 5 1 3 0 1 0 1 0 0
25Education, Training, & Library Occupations 36 13 23 7 22 2 1 3 0 1 025.10Postsecondary Teachers 4 3 1 1 1 1 0 1 0 0 025.20Primary, Secondary & Special Education Teachers 16 6 10 4 10 0 0 2 0 0 025.30Other Teachers & Instructors 5 1 4 0 4 0 0 0 0 1 025.90Other Education, Training, & Library Occupations 11 3 8 2 7 1 1 0 0 0 0
31Connecticut Data for Affirmative Action Plans ~ 2nd Quarter 2013

TorringtonCharacteristics of Job Seekers registered with CT Works Career Centers
SOC CodeOccupation
Total Applicants
Total Male
Total Female
White Male
White Female
Black Male
Black Female
Hispanic Male
Hispanic Female
Other Male
Other Female
27Arts, Design, Entertainment, Sports, & Media Occupations 23 8 15 7 15 0 0 0 0 1 027.10Art & Design Workers 9 3 6 2 6 0 0 0 0 1 027.20Entertainers & Performers, Sports & Related Workers 1 0 1 0 1 0 0 0 0 0 027.30Media & Communication Workers 5 2 3 2 3 0 0 0 0 0 027.40Media & Communication Equipment Workers 3 3 0 3 0 0 0 0 0 0 027.90Other Arts, Design, Entertainment, Sports, & Media Workers 5 0 5 0 5 0 0 0 0 0 0
29Healthcare Practitioners & Technical Occupations 43 10 33 7 29 0 1 2 2 1 129.10Health Diagnosing & Treating Practitioners 9 2 7 2 6 0 0 0 0 0 129.20Health Technologists & Technicians 19 3 16 1 15 0 0 1 1 1 029.90Other Healthcare Practitioners & Technical Occupations 15 5 10 4 8 0 1 1 1 0 0
31Healthcare Support Occupations 135 16 119 10 92 4 7 0 11 2 931.10Nursing, Psychiatric, & Home Health Aides 93 8 85 6 64 2 7 0 7 0 731.90Other Healthcare Support Occupations 42 8 34 4 28 2 0 0 4 2 2
33Protective Service Occupations 9 6 3 6 1 0 0 0 1 0 133.30Law Enforcement Workers 1 1 0 1 0 0 0 0 0 0 033.90Other Protective Service Workers 8 5 3 5 1 0 0 0 1 0 1
35Food Preparation & Serving Related Occupations 99 41 58 28 44 4 3 4 7 5 435.10Supervisors of Food Preparation & Serving Workers 11 5 6 5 5 0 0 0 1 0 035.20Cooks & Food Preparation Workers 36 20 16 13 13 1 1 4 2 2 035.30Food & Beverage Serving Workers 34 6 28 5 19 0 1 0 4 1 435.90Other Food Preparation & Serving Related Workers 18 10 8 5 7 3 1 0 0 2 0
37Building & Grounds Cleaning & Maintenance Occupations 66 40 26 33 16 4 1 0 7 3 237.10Supervisors of Bldg./Grounds Cleaning & Maintenance Workers 3 2 1 1 1 0 0 0 0 1 037.20Building Cleaning & Pest Control Workers 30 11 19 7 12 3 0 0 5 1 237.30Grounds Maintenance Workers 21 18 3 17 3 0 0 0 0 1 037.90Other Building/Grounds Cleaning & Maintenance Occupations 12 9 3 8 0 1 1 0 2 0 0
39Personal Care & Service Occupations 34 2 32 1 23 0 3 1 3 0 339.10Supervisors of Personal Care & Service Workers 2 1 1 1 1 0 0 0 0 0 039.20Animal Care & Service Workers 3 0 3 0 3 0 0 0 0 0 039.30Entertainment Attendants & Related Workers 1 0 1 0 0 0 1 0 0 0 039.50Personal Appearance Workers 4 1 3 0 0 0 1 1 1 0 139.90Other Personal Care & Service Workers 24 0 24 0 19 0 1 0 2 0 2
41Sales & Related Occupations 126 51 75 43 58 5 8 0 6 3 341.10Supervisors of Sales Workers 19 10 9 10 9 0 0 0 0 0 041.20Retail Sales Workers 72 25 47 21 33 3 6 0 5 1 341.30Sales Representatives, Services 15 8 7 6 5 2 1 0 1 0 041.40Sales Representatives, Wholesale & Manufacturing 3 3 0 2 0 0 0 0 0 1 041.90Other Sales & Related Workers 17 5 12 4 11 0 1 0 0 1 0
32Connecticut Department of Labor - Office of Research ~ Labor Market Information

TorringtonCharacteristics of Job Seekers registered with CT Works Career Centers
SOC CodeOccupation
Total Applicants
Total Male
Total Female
White Male
White Female
Black Male
Black Female
Hispanic Male
Hispanic Female
Other Male
Other Female
43Office & Administrative Support Occupations 233 63 170 49 147 5 7 3 8 6 843.10Supervisors of Office & Administrative Support Workers 6 0 6 0 5 0 0 0 0 0 143.30Financial Clerks 26 2 24 1 22 1 0 0 2 0 043.40Information & Record Clerks 71 24 47 16 39 3 3 0 4 5 143.50Material Recording, Scheduling, Dispatch/Distribution Workers 32 22 10 18 9 0 0 3 0 1 143.60Secretaries & Administrative Assistants 33 1 32 1 29 0 2 0 0 0 143.90Other Office & Administrative Support Workers 65 14 51 13 43 1 2 0 2 0 4
45Farming, Fishing, & Forestry Occupations 8 5 3 5 3 0 0 0 0 0 045.20Agricultural Workers 3 2 1 2 1 0 0 0 0 0 045.40Forest, Conservation, & Logging Workers 2 2 0 2 0 0 0 0 0 0 045.90Other Farming, Fishing, & Forestry Workers 3 1 2 1 2 0 0 0 0 0 0
47Construction & Extraction Occupations 118 116 2 100 2 3 0 3 0 10 047.20Construction Trades Workers 81 80 1 68 1 2 0 3 0 7 047.30Helpers, Construction Trades 20 20 0 18 0 1 0 0 0 1 047.40Other Construction & Related Workers 3 3 0 1 0 0 0 0 0 2 047.90Other Construction & Extraction Occupations 14 13 1 13 1 0 0 0 0 0 0
49Installation, Maintenance, & Repair Occupations 61 59 2 50 0 3 1 2 1 4 049.10Supervisors of Installation, Maintenance, & Repair Workers 5 5 0 3 0 1 0 0 0 1 049.20Electrical & Electronic Equipment Mechanics, Installers 2 2 0 2 0 0 0 0 0 0 049.30Vehicle & Mobile Equipment Mechanics, Installers, Repairers 15 15 0 13 0 0 0 0 0 2 049.90Other Installation, Maintenance & Repair Occupations 39 37 2 32 0 2 1 2 1 1 0
51Production Occupations 190 135 55 95 35 6 3 22 13 12 451.20Assemblers & Fabricators 13 6 7 4 2 0 0 2 5 0 051.30Food Processing Workers 3 3 0 1 0 0 0 2 0 0 051.40Metal Workers & Plastic Workers 84 68 16 50 12 4 1 8 2 6 151.50Printing Workers 5 5 0 4 0 0 0 0 0 1 051.60Textile, Apparel, & Furnishings Workers 1 0 1 0 1 0 0 0 0 0 051.70Woodworkers 4 4 0 4 0 0 0 0 0 0 051.90Other Production Occupations 80 49 31 32 20 2 2 10 6 5 3
53Transportation & Material Moving Occupations 101 68 33 49 27 12 0 3 5 4 153.20Air Transportation Workers 1 0 1 0 1 0 0 0 0 0 053.30Motor Vehicle Operators 53 38 15 28 14 5 0 3 1 2 053.60Other Transportation Workers 1 1 0 1 0 0 0 0 0 0 053.70Material Moving Workers 24 18 6 11 3 5 0 0 3 2 053.90Other Transportation & Material Moving Occupations 22 11 11 9 9 2 0 0 1 0 1
55Military Specific Occupations 3 2 1 1 0 0 0 1 0 0 155.30Military Enlisted Tactical Operations & Air/Weapon 1 1 0 1 0 0 0 0 0 0 055.90Other Military Specific Occupations 2 1 1 0 0 0 0 1 0 0 1
33Connecticut Data for Affirmative Action Plans ~ 2nd Quarter 2013

TorringtonCharacteristics of Job Seekers registered with CT Works Career Centers
SOC CodeOccupation
Total Applicants
Total Male
Total Female
White Male
White Female
Black Male
Black Female
Hispanic Male
Hispanic Female
Other Male
Other Female
99Unknown/Unclassifiable Occupations 67 35 32 31 23 0 5 0 1 4 399.90Unknown/Unclassifiable Occupations 67 35 32 31 23 0 5 0 1 4 3
34Connecticut Department of Labor - Office of Research ~ Labor Market Information

WaterburyCharacteristics of Job Seekers registered with CT Works Career Centers
SOC CodeOccupation
Total Applicants
Total Male
Total Female
White Male
White Female
Black Male
Black Female
Hispanic Male
Hispanic Female
Other Male
Other Female
00Total - All Occupations 8,053 4,070 3,983 2,158 1,908 759 795 740 913 413 367
11Management Occupations 537 321 216 258 156 18 22 22 22 23 1611.10Top Executives 110 73 37 57 21 3 5 6 5 7 611.20Advertising, Marketing, Promotions, Public Rel. Occupations 61 42 19 38 15 2 1 1 0 1 311.30Operations Specialties Managers 112 46 66 43 55 1 4 1 4 1 311.90Other Management Occupations 254 160 94 120 65 12 12 14 13 14 4
13Business & Financial Operations Occupations 266 120 146 80 92 14 30 15 17 11 713.10Business Operations Specialists 80 37 43 26 27 7 7 3 5 1 413.20Financial Specialists 104 45 59 32 41 2 12 6 3 5 313.90Other Business & Financial Operations Occupations 82 38 44 22 24 5 11 6 9 5 0
15Computer & Mathematical Occupations 114 80 34 52 18 10 5 10 5 8 615.10Computer Specialists 79 56 23 38 12 8 3 5 3 5 515.20Mathematical Scientists 4 3 1 2 1 0 0 1 0 0 015.90Other Computer & Mathematical Occupations 31 21 10 12 5 2 2 4 2 3 1
17Architecture & Engineering Occupations 107 96 11 70 3 7 2 10 5 9 117.10Architects, Surveyors, & Cartographers 3 2 1 2 1 0 0 0 0 0 017.20Engineers 57 52 5 37 1 4 2 5 2 6 017.30Drafters, Engineering, & Mapping Technicians 29 25 4 21 1 1 0 2 2 1 117.90Other Architecture & Engineering Occupations 18 17 1 10 0 2 0 3 1 2 0
19Life, Physical, & Social Science Occupations 51 21 30 12 18 3 2 2 5 4 519.10Life Scientists 6 3 3 2 3 0 0 0 0 1 019.20Physical Scientists 8 4 4 0 1 1 0 1 0 2 319.30Social Scientists & Related Workers 15 3 12 3 8 0 1 0 2 0 119.40Life, Physical, & Social Science Technicians 6 2 4 2 3 0 0 0 1 0 019.90Other Life, Physical, & Social Science Occupations 16 9 7 5 3 2 1 1 2 1 1
21Community & Social Services Occupations 141 48 93 19 38 21 39 5 11 3 521.10Counselors, Social Workers, Other Cmmty./Soc. Svcs. Workers 101 34 67 11 24 17 30 4 11 2 221.90Other Community & Social Services Occupations 40 14 26 8 14 4 9 1 0 1 3
23Legal Occupations 58 16 42 13 29 3 5 0 8 0 023.10Lawyers, Judges, & Related Workers 2 0 2 0 1 0 0 0 1 0 023.20Legal Support Workers 27 4 23 4 18 0 4 0 1 0 023.90Other Legal Occupations 29 12 17 9 10 3 1 0 6 0 0
25Education, Training, & Library Occupations 127 35 92 22 56 7 15 3 13 3 825.10Postsecondary Teachers 20 9 11 7 4 2 3 0 2 0 225.20Primary, Secondary & Special Education Teachers 34 8 26 6 19 1 4 0 1 1 225.30Other Teachers & Instructors 6 3 3 2 2 1 0 0 0 0 125.40Librarians, Curators, & Archivists 2 0 2 0 1 0 0 0 1 0 025.90Other Education, Training, & Library Occupations 65 15 50 7 30 3 8 3 9 2 3
35Connecticut Data for Affirmative Action Plans ~ 2nd Quarter 2013

WaterburyCharacteristics of Job Seekers registered with CT Works Career Centers
SOC CodeOccupation
Total Applicants
Total Male
Total Female
White Male
White Female
Black Male
Black Female
Hispanic Male
Hispanic Female
Other Male
Other Female
27Arts, Design, Entertainment, Sports, & Media Occupations 80 47 33 27 18 9 2 6 5 5 827.10Art & Design Workers 33 19 14 11 10 4 0 3 0 1 427.20Entertainers & Performers, Sports & Related Workers 14 11 3 5 0 2 0 3 3 1 027.30Media & Communication Workers 14 8 6 5 4 1 1 0 0 2 127.40Media & Communication Equipment Workers 4 1 3 1 2 0 0 0 1 0 027.90Other Arts, Design, Entertainment, Sports, & Media Workers 15 8 7 5 2 2 1 0 1 1 3
29Healthcare Practitioners & Technical Occupations 214 38 176 24 102 7 36 6 27 1 1129.10Health Diagnosing & Treating Practitioners 54 7 47 5 33 0 7 2 6 0 129.20Health Technologists & Technicians 103 14 89 8 48 4 22 2 16 0 329.90Other Healthcare Practitioners & Technical Occupations 57 17 40 11 21 3 7 2 5 1 7
31Healthcare Support Occupations 640 79 561 32 195 28 187 10 149 9 3031.10Nursing, Psychiatric, & Home Health Aides 391 51 340 19 100 19 126 8 94 5 2031.20Occupational & Physical Therapist Assistants & Aides 8 0 8 0 2 0 2 0 2 0 231.90Other Healthcare Support Occupations 241 28 213 13 93 9 59 2 53 4 8
33Protective Service Occupations 83 64 19 29 5 21 5 9 6 5 333.20Fire Fighting & Prevention Workers 1 1 0 1 0 0 0 0 0 0 033.30Law Enforcement Workers 11 9 2 4 1 3 1 2 0 0 033.90Other Protective Service Workers 71 54 17 24 4 18 4 7 6 5 3
35Food Preparation & Serving Related Occupations 390 199 191 78 103 58 38 43 41 20 935.10Supervisors of Food Preparation & Serving Workers 34 26 8 13 4 7 1 3 3 3 035.20Cooks & Food Preparation Workers 132 88 44 26 22 32 13 21 8 9 135.30Food & Beverage Serving Workers 127 35 92 17 55 8 16 7 17 3 435.90Other Food Preparation & Serving Related Workers 97 50 47 22 22 11 8 12 13 5 4
37Building & Grounds Cleaning & Maintenance Occupations 231 170 61 74 32 48 8 35 16 13 537.10Supervisors of Bldg./Grounds Cleaning & Maintenance Workers 8 4 4 1 3 2 0 1 1 0 037.20Building Cleaning & Pest Control Workers 98 63 35 17 17 29 5 13 12 4 137.30Grounds Maintenance Workers 72 65 7 40 4 10 1 13 1 2 137.90Other Building/Grounds Cleaning & Maintenance Occupations 53 38 15 16 8 7 2 8 2 7 3
39Personal Care & Service Occupations 148 27 121 6 56 7 34 5 26 9 539.10Supervisors of Personal Care & Service Workers 2 1 1 0 1 0 0 0 0 1 039.20Animal Care & Service Workers 2 0 2 0 1 0 0 0 0 0 139.30Entertainment Attendants & Related Workers 3 2 1 0 0 1 1 0 0 1 039.50Personal Appearance Workers 23 3 20 1 12 1 2 1 6 0 039.60Transportation, Tourism, & Lodging Attendants 2 1 1 0 0 0 0 0 1 1 039.90Other Personal Care & Service Workers 116 20 96 5 42 5 31 4 19 6 4
36Connecticut Department of Labor - Office of Research ~ Labor Market Information

WaterburyCharacteristics of Job Seekers registered with CT Works Career Centers
SOC CodeOccupation
Total Applicants
Total Male
Total Female
White Male
White Female
Black Male
Black Female
Hispanic Male
Hispanic Female
Other Male
Other Female
41Sales & Related Occupations 770 330 440 201 175 56 97 55 128 18 4041.10Supervisors of Sales Workers 51 28 23 22 18 1 3 2 1 3 141.20Retail Sales Workers 413 133 280 61 91 31 75 34 91 7 2341.30Sales Representatives, Services 111 64 47 47 24 9 4 5 10 3 941.40Sales Representatives, Wholesale & Manufacturing 26 22 4 16 2 2 0 3 2 1 041.90Other Sales & Related Workers 169 83 86 55 40 13 15 11 24 4 7
43Office & Administrative Support Occupations 1,143 301 842 137 494 74 144 57 138 33 6643.10Supervisors of Office & Administrative Support Workers 9 0 9 0 8 0 1 0 0 0 043.20Communications Equipment Operators 2 0 2 0 2 0 0 0 0 0 043.30Financial Clerks 87 10 77 6 51 2 14 2 5 0 743.40Information & Record Clerks 426 124 302 64 155 27 56 15 62 18 2943.50Material Recording, Scheduling, Dispatch/Distribution Workers 133 83 50 31 27 26 10 20 11 6 243.60Secretaries & Administrative Assistants 154 8 146 5 102 2 22 1 16 0 643.90Other Office & Administrative Support Workers 332 76 256 31 149 17 41 19 44 9 22
45Farming, Fishing, & Forestry Occupations 12 10 2 6 1 2 0 0 1 2 045.20Agricultural Workers 5 3 2 2 1 0 0 0 1 1 045.40Forest, Conservation, & Logging Workers 1 1 0 1 0 0 0 0 0 0 045.90Other Farming, Fishing, & Forestry Workers 6 6 0 3 0 2 0 0 0 1 0
47Construction & Extraction Occupations 442 425 17 257 6 65 4 62 4 41 347.10Supervisors of Construction & Extraction Workers 8 8 0 6 0 1 0 0 0 1 047.20Construction Trades Workers 261 252 9 158 2 35 2 36 3 23 247.30Helpers, Construction Trades 70 66 4 38 2 9 0 12 1 7 147.40Other Construction & Related Workers 27 27 0 15 0 6 0 4 0 2 047.50Extraction Workers 2 2 0 0 0 1 0 1 0 0 047.90Other Construction & Extraction Occupations 74 70 4 40 2 13 2 9 0 8 0
49Installation, Maintenance, & Repair Occupations 240 233 7 149 4 26 1 42 1 16 149.10Supervisors of Installation, Maintenance, & Repair Workers 1 1 0 1 0 0 0 0 0 0 049.20Electrical & Electronic Equipment Mechanics, Installers 23 22 1 14 1 2 0 2 0 4 049.30Vehicle & Mobile Equipment Mechanics, Installers, Repairers 74 73 1 52 0 7 0 11 1 3 049.90Other Installation, Maintenance & Repair Occupations 142 137 5 82 3 17 1 29 0 9 1
37Connecticut Data for Affirmative Action Plans ~ 2nd Quarter 2013

WaterburyCharacteristics of Job Seekers registered with CT Works Career Centers
SOC CodeOccupation
Total Applicants
Total Male
Total Female
White Male
White Female
Black Male
Black Female
Hispanic Male
Hispanic Female
Other Male
Other Female
51Production Occupations 1,071 688 383 289 130 146 51 193 168 60 3451.10Supervisors of Production Workers 7 7 0 4 0 2 0 1 0 0 051.20Assemblers & Fabricators 66 30 36 10 12 9 8 9 14 2 251.30Food Processing Workers 13 6 7 1 5 1 1 4 1 0 051.40Metal Workers & Plastic Workers 384 277 107 126 43 52 14 70 41 29 951.50Printing Workers 28 25 3 16 3 4 0 4 0 1 051.60Textile, Apparel, & Furnishings Workers 12 4 8 1 5 2 0 1 3 0 051.70Woodworkers 1 1 0 1 0 0 0 0 0 0 051.80Plant & System Operators 2 2 0 1 0 1 0 0 0 0 051.90Other Production Occupations 558 336 222 129 62 75 28 104 109 28 23
53Transportation & Material Moving Occupations 527 393 134 186 47 86 18 101 64 20 553.10Supervisors of Transportation & Material Moving Workers 3 2 1 0 1 1 0 1 0 0 053.20Air Transportation Workers 1 1 0 1 0 0 0 0 0 0 053.30Motor Vehicle Operators 245 190 55 116 25 31 8 37 20 6 253.50Water Transportation Workers 1 1 0 0 0 0 0 1 0 0 053.60Other Transportation Workers 17 10 7 2 3 4 0 3 3 1 153.70Material Moving Workers 157 113 44 31 5 33 4 42 35 7 053.90Other Transportation & Material Moving Occupations 103 76 27 36 13 17 6 17 6 6 2
55Military Specific Occupations 21 19 2 14 2 2 0 1 0 2 055.10Military Officer Special & Tactical Operations Leaders/Mgrs. 3 3 0 2 0 0 0 0 0 1 055.30Military Enlisted Tactical Operations & Air/Weapon 5 5 0 4 0 0 0 0 0 1 055.90Other Military Specific Occupations 13 11 2 8 2 2 0 1 0 0 0
99Unknown/Unclassifiable Occupations 640 310 330 123 128 41 50 48 53 98 9999.90Unknown/Unclassifiable Occupations 640 310 330 123 128 41 50 48 53 98 99
38Connecticut Department of Labor - Office of Research ~ Labor Market Information

Willimantic-DanielsonCharacteristics of Job Seekers registered with CT Works Career Centers
SOC CodeOccupation
Total Applicants
Total Male
Total Female
White Male
White Female
Black Male
Black Female
Hispanic Male
Hispanic Female
Other Male
Other Female
00Total - All Occupations 4,485 2,281 2,204 1,719 1,608 109 114 283 364 170 118
11Management Occupations 297 160 137 133 114 3 4 8 12 16 711.10Top Executives 89 56 33 47 28 0 1 1 2 8 211.20Advertising, Marketing, Promotions, Public Rel. Occupations 29 15 14 13 9 1 0 1 4 0 111.30Operations Specialties Managers 51 20 31 20 26 0 1 0 2 0 211.90Other Management Occupations 128 69 59 53 51 2 2 6 4 8 2
13Business & Financial Operations Occupations 111 40 71 31 59 0 1 4 5 5 613.10Business Operations Specialists 34 13 21 11 20 0 0 1 0 1 113.20Financial Specialists 32 12 20 10 16 0 0 2 2 0 213.90Other Business & Financial Operations Occupations 45 15 30 10 23 0 1 1 3 4 3
15Computer & Mathematical Occupations 83 68 15 52 9 4 1 4 2 8 315.10Computer Specialists 60 54 6 41 3 3 0 4 2 6 115.90Other Computer & Mathematical Occupations 23 14 9 11 6 1 1 0 0 2 2
17Architecture & Engineering Occupations 61 51 10 43 5 3 1 2 2 3 217.10Architects, Surveyors, & Cartographers 3 2 1 0 0 1 0 1 0 0 117.20Engineers 27 23 4 20 2 2 1 0 1 1 017.30Drafters, Engineering, & Mapping Technicians 18 16 2 14 1 0 0 1 1 1 017.90Other Architecture & Engineering Occupations 13 10 3 9 2 0 0 0 0 1 1
19Life, Physical, & Social Science Occupations 19 11 8 7 8 1 0 0 0 3 019.10Life Scientists 3 2 1 2 1 0 0 0 0 0 019.20Physical Scientists 1 0 1 0 1 0 0 0 0 0 019.30Social Scientists & Related Workers 3 2 1 1 1 0 0 0 0 1 019.40Life, Physical, & Social Science Technicians 3 2 1 1 1 0 0 0 0 1 019.90Other Life, Physical, & Social Science Occupations 9 5 4 3 4 1 0 0 0 1 0
21Community & Social Services Occupations 85 20 65 16 40 0 8 3 12 1 521.10Counselors, Social Workers, Other Cmmty./Soc. Svcs. Workers 60 14 46 12 29 0 6 1 8 1 321.20Religious Workers 2 0 2 0 0 0 0 0 1 0 121.90Other Community & Social Services Occupations 23 6 17 4 11 0 2 2 3 0 1
23Legal Occupations 30 7 23 5 21 0 0 1 2 1 023.10Lawyers, Judges, & Related Workers 2 1 1 1 1 0 0 0 0 0 023.20Legal Support Workers 12 0 12 0 11 0 0 0 1 0 023.90Other Legal Occupations 16 6 10 4 9 0 0 1 1 1 0
25Education, Training, & Library Occupations 120 33 87 27 61 2 4 3 16 1 625.10Postsecondary Teachers 20 10 10 9 7 1 0 0 2 0 125.20Primary, Secondary & Special Education Teachers 36 8 28 7 23 0 0 1 2 0 325.30Other Teachers & Instructors 6 2 4 1 2 0 1 0 1 1 025.40Librarians, Curators, & Archivists 4 1 3 1 2 0 0 0 0 0 125.90Other Education, Training, & Library Occupations 54 12 42 9 27 1 3 2 11 0 1
39Connecticut Data for Affirmative Action Plans ~ 2nd Quarter 2013

Willimantic-DanielsonCharacteristics of Job Seekers registered with CT Works Career Centers
SOC CodeOccupation
Total Applicants
Total Male
Total Female
White Male
White Female
Black Male
Black Female
Hispanic Male
Hispanic Female
Other Male
Other Female
27Arts, Design, Entertainment, Sports, & Media Occupations 46 19 27 14 23 0 1 2 3 3 027.10Art & Design Workers 23 7 16 5 13 0 1 1 2 1 027.20Entertainers & Performers, Sports & Related Workers 3 3 0 1 0 0 0 0 0 2 027.30Media & Communication Workers 10 5 5 5 5 0 0 0 0 0 027.40Media & Communication Equipment Workers 3 0 3 0 2 0 0 0 1 0 027.90Other Arts, Design, Entertainment, Sports, & Media Workers 7 4 3 3 3 0 0 1 0 0 0
29Healthcare Practitioners & Technical Occupations 90 15 75 13 58 1 4 1 11 0 229.10Health Diagnosing & Treating Practitioners 28 3 25 2 20 0 1 1 4 0 029.20Health Technologists & Technicians 34 6 28 6 22 0 2 0 3 0 129.90Other Healthcare Practitioners & Technical Occupations 28 6 22 5 16 1 1 0 4 0 1
31Healthcare Support Occupations 270 35 235 24 160 6 25 5 33 0 1731.10Nursing, Psychiatric, & Home Health Aides 118 16 102 8 68 6 14 2 13 0 731.20Occupational & Physical Therapist Assistants & Aides 2 0 2 0 2 0 0 0 0 0 031.90Other Healthcare Support Occupations 150 19 131 16 90 0 11 3 20 0 10
33Protective Service Occupations 40 28 12 21 10 3 1 3 1 1 033.10First-Line Supervisors/Mgrs. of Protective Service Workers 1 1 0 1 0 0 0 0 0 0 033.20Fire Fighting & Prevention Workers 1 0 1 0 1 0 0 0 0 0 033.30Law Enforcement Workers 6 5 1 4 0 0 0 1 1 0 033.90Other Protective Service Workers 32 22 10 16 9 3 1 2 0 1 0
35Food Preparation & Serving Related Occupations 357 162 195 97 138 21 10 35 36 9 1135.10Supervisors of Food Preparation & Serving Workers 34 24 10 20 7 3 0 1 2 0 135.20Cooks & Food Preparation Workers 136 71 65 44 42 8 4 16 15 3 435.30Food & Beverage Serving Workers 110 35 75 19 57 5 1 8 16 3 135.90Other Food Preparation & Serving Related Workers 77 32 45 14 32 5 5 10 3 3 5
37Building & Grounds Cleaning & Maintenance Occupations 184 113 71 64 35 7 5 37 28 5 337.10Supervisors of Bldg./Grounds Cleaning & Maintenance Workers 7 5 2 3 0 1 0 1 2 0 037.20Building Cleaning & Pest Control Workers 75 30 45 13 21 0 2 17 19 0 337.30Grounds Maintenance Workers 35 34 1 22 0 1 0 8 1 3 037.90Other Building/Grounds Cleaning & Maintenance Occupations 67 44 23 26 14 5 3 11 6 2 0
39Personal Care & Service Occupations 113 23 90 13 66 1 3 4 13 5 839.10Supervisors of Personal Care & Service Workers 1 1 0 1 0 0 0 0 0 0 039.20Animal Care & Service Workers 4 1 3 1 3 0 0 0 0 0 039.30Entertainment Attendants & Related Workers 12 4 8 2 5 0 0 1 1 1 239.40Funeral Service Workers 2 1 1 0 0 0 0 0 0 1 139.50Personal Appearance Workers 15 1 14 0 11 0 0 1 1 0 239.60Transportation, Tourism, & Lodging Attendants 2 1 1 1 1 0 0 0 0 0 039.90Other Personal Care & Service Workers 77 14 63 8 46 1 3 2 11 3 3
40Connecticut Department of Labor - Office of Research ~ Labor Market Information

Willimantic-DanielsonCharacteristics of Job Seekers registered with CT Works Career Centers
SOC CodeOccupation
Total Applicants
Total Male
Total Female
White Male
White Female
Black Male
Black Female
Hispanic Male
Hispanic Female
Other Male
Other Female
41Sales & Related Occupations 413 173 240 140 148 9 17 11 65 13 1041.10Supervisors of Sales Workers 30 14 16 13 14 0 0 1 2 0 041.20Retail Sales Workers 241 76 165 58 96 5 10 8 52 5 741.30Sales Representatives, Services 50 34 16 28 11 2 3 0 2 4 041.40Sales Representatives, Wholesale & Manufacturing 13 10 3 9 2 1 1 0 0 0 041.90Other Sales & Related Workers 79 39 40 32 25 1 3 2 9 4 3
43Office & Administrative Support Occupations 648 156 492 99 391 9 18 21 61 27 2243.10Supervisors of Office & Administrative Support Workers 6 1 5 0 4 0 0 0 1 1 043.20Communications Equipment Operators 1 0 1 0 0 0 0 0 0 0 143.30Financial Clerks 52 7 45 6 37 0 2 1 2 0 443.40Information & Record Clerks 258 72 186 40 135 5 8 10 36 17 743.50Material Recording, Scheduling, Dispatch/Distribution Workers 48 30 18 22 18 1 0 4 0 3 043.60Secretaries & Administrative Assistants 95 8 87 4 74 2 1 1 6 1 643.90Other Office & Administrative Support Workers 188 38 150 27 123 1 7 5 16 5 4
45Farming, Fishing, & Forestry Occupations 41 24 17 15 9 1 1 7 6 1 145.10Supervisors of Farming, Fishing, & Forestry Workers 3 0 3 0 3 0 0 0 0 0 045.20Agricultural Workers 24 13 11 6 4 1 1 5 5 1 145.40Forest, Conservation, & Logging Workers 5 5 0 5 0 0 0 0 0 0 045.90Other Farming, Fishing, & Forestry Workers 9 6 3 4 2 0 0 2 1 0 0
47Construction & Extraction Occupations 312 303 9 256 8 5 0 19 0 23 147.10Supervisors of Construction & Extraction Workers 3 3 0 3 0 0 0 0 0 0 047.20Construction Trades Workers 182 176 6 149 6 3 0 12 0 12 047.30Helpers, Construction Trades 48 48 0 39 0 1 0 3 0 5 047.40Other Construction & Related Workers 5 5 0 3 0 0 0 0 0 2 047.50Extraction Workers 2 2 0 2 0 0 0 0 0 0 047.90Other Construction & Extraction Occupations 72 69 3 60 2 1 0 4 0 4 1
49Installation, Maintenance, & Repair Occupations 174 165 9 130 4 6 0 17 5 12 049.10Supervisors of Installation, Maintenance, & Repair Workers 1 1 0 1 0 0 0 0 0 0 049.20Electrical & Electronic Equipment Mechanics, Installers 20 19 1 15 1 1 0 3 0 0 049.30Vehicle & Mobile Equipment Mechanics, Installers, Repairers 36 36 0 29 0 0 0 4 0 3 049.90Other Installation, Maintenance & Repair Occupations 117 109 8 85 3 5 0 10 5 9 0
41Connecticut Data for Affirmative Action Plans ~ 2nd Quarter 2013

Willimantic-DanielsonCharacteristics of Job Seekers registered with CT Works Career Centers
SOC CodeOccupation
Total Applicants
Total Male
Total Female
White Male
White Female
Black Male
Black Female
Hispanic Male
Hispanic Female
Other Male
Other Female
51Production Occupations 515 347 168 280 127 8 2 43 35 16 451.10Supervisors of Production Workers 2 2 0 2 0 0 0 0 0 0 051.20Assemblers & Fabricators 12 9 3 9 3 0 0 0 0 0 051.30Food Processing Workers 14 5 9 3 4 1 0 1 5 0 051.40Metal Workers & Plastic Workers 175 129 46 108 38 4 1 11 6 6 151.50Printing Workers 9 8 1 7 1 0 0 1 0 0 051.60Textile, Apparel, & Furnishings Workers 6 4 2 2 2 0 0 2 0 0 051.70Woodworkers 3 3 0 3 0 0 0 0 0 0 051.80Plant & System Operators 1 1 0 1 0 0 0 0 0 0 051.90Other Production Occupations 293 186 107 145 79 3 1 28 24 10 3
53Transportation & Material Moving Occupations 283 216 67 161 51 13 2 34 10 8 453.20Air Transportation Workers 1 1 0 1 0 0 0 0 0 0 053.30Motor Vehicle Operators 133 99 34 79 27 5 1 11 2 4 453.40Rail Transportation Workers 2 2 0 2 0 0 0 0 0 0 053.60Other Transportation Workers 13 12 1 11 1 1 0 0 0 0 053.70Material Moving Workers 65 49 16 35 9 3 1 11 6 0 053.90Other Transportation & Material Moving Occupations 69 53 16 33 14 4 0 12 2 4 0
55Military Specific Occupations 16 13 3 9 3 0 0 3 0 1 055.10Military Officer Special & Tactical Operations Leaders/Mgrs. 2 1 1 1 1 0 0 0 0 0 055.30Military Enlisted Tactical Operations & Air/Weapon 1 1 0 0 0 0 0 1 0 0 055.90Other Military Specific Occupations 13 11 2 8 2 0 0 2 0 1 0
99Unknown/Unclassifiable Occupations 177 99 78 69 60 6 6 16 6 8 699.90Unknown/Unclassifiable Occupations 177 99 78 69 60 6 6 16 6 8 6
42Connecticut Department of Labor - Office of Research ~ Labor Market Information