connectkaro 2015 - land management for smart cities - gujarat
TRANSCRIPT

Dt. 15th April 2015
P L Sharma
Chief Town Planner Government of Gujarat
Town Planning - Gujarat
Tool for
Planned, Fair and Equitable Urban Development
1

1. Planning Regime in Gujarat
2
3
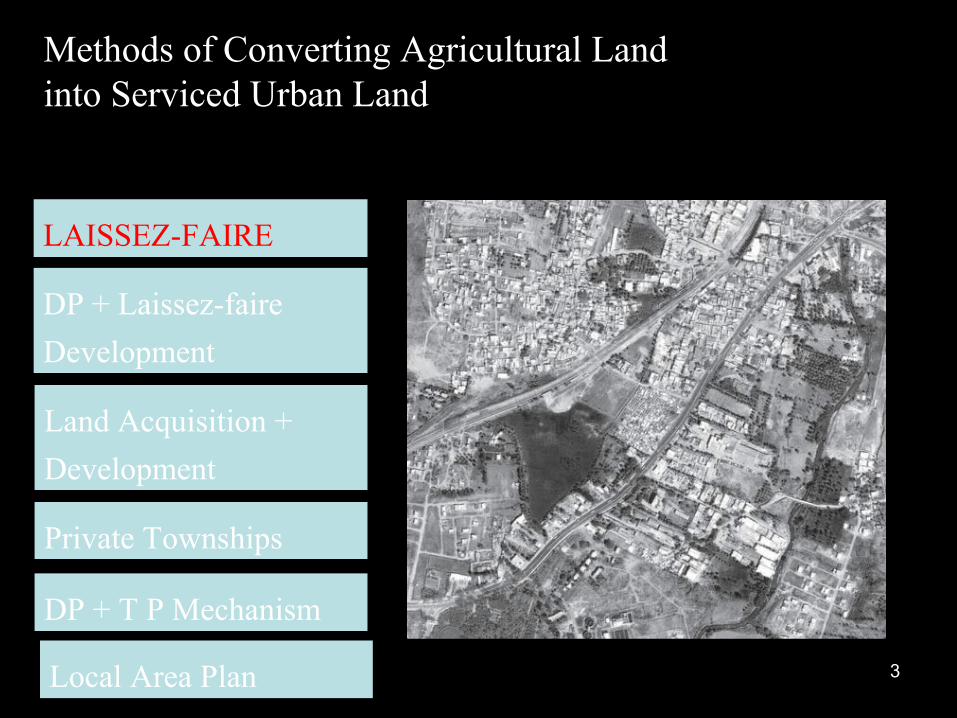
LAISSEZ-FAIRE
Methods of Converting Agricultural Landinto Serviced Urban Land
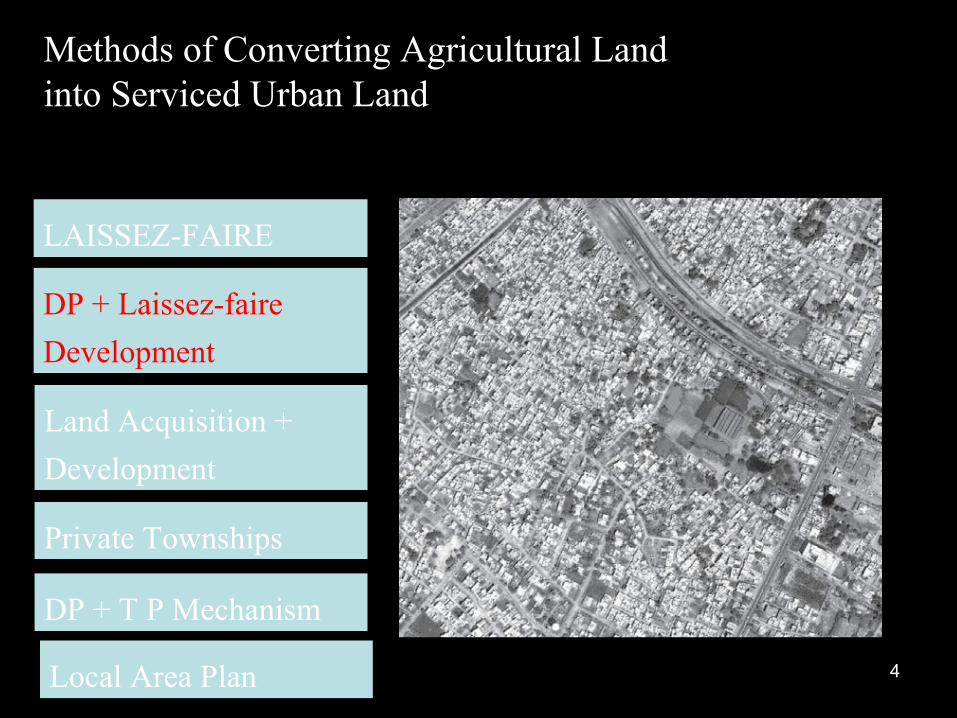
DP + Laissez-faire
Development
Land Acquisition +
Development
Private Townships
DP + T P Mechanism
Local Area Plan
4
LAISSEZ-FAIRE
Methods of Converting Agricultural Landinto Serviced Urban Land
DP + Laissez-faire
Development
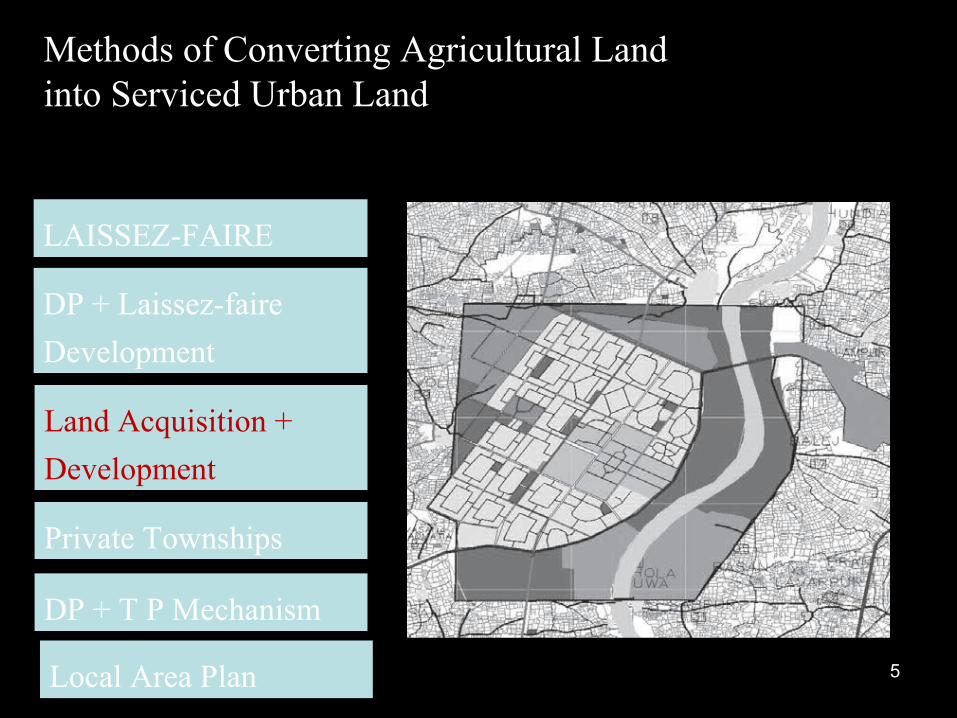
Land Acquisition +
Development
Private Townships
DP + T P Mechanism
Local Area Plan
5
LAISSEZ-FAIRE
Methods of Converting Agricultural Landinto Serviced Urban Land
DP + Laissez-faire
Development
Land Acquisition +
Development
Private Townships
DP + T P Mechanism
Local Area Plan

6
LAISSEZ-FAIRE
Methods of Converting Agricultural Landinto Serviced Urban Land
DP + Laissez-faire
Development
Land Acquisition +
Development
Private Townships
DP + T P Mechanism
Residential Township Policy
2009
Local Area Plan

7
LAISSEZ-FAIRE
Methods of Converting Agricultural Landinto Serviced Urban Land
DP + Laissez-faire
Development
Land Acquisition +
Development
Private Townships
DP + T P Mechanism
Residential Township Policy
2009
Presentation for Govt of Rajasthan
Local Area Plan

8
LAISSEZ-FAIRE
Methods of Converting Agricultural Landinto Serviced Urban Land
DP + Laissez-faire
Development
Land Acquisition +
Development
Private Townships
DP + T P Mechanism
Local Area Plan
9
LAISSEZ-FAIRE
Methods of Converting Agricultural Landinto Serviced Urban Land
DP + Laissez-faire
Development
Land Acquisition +
Development
Private Townships
DP + T P Mechanism
Local Area Plan
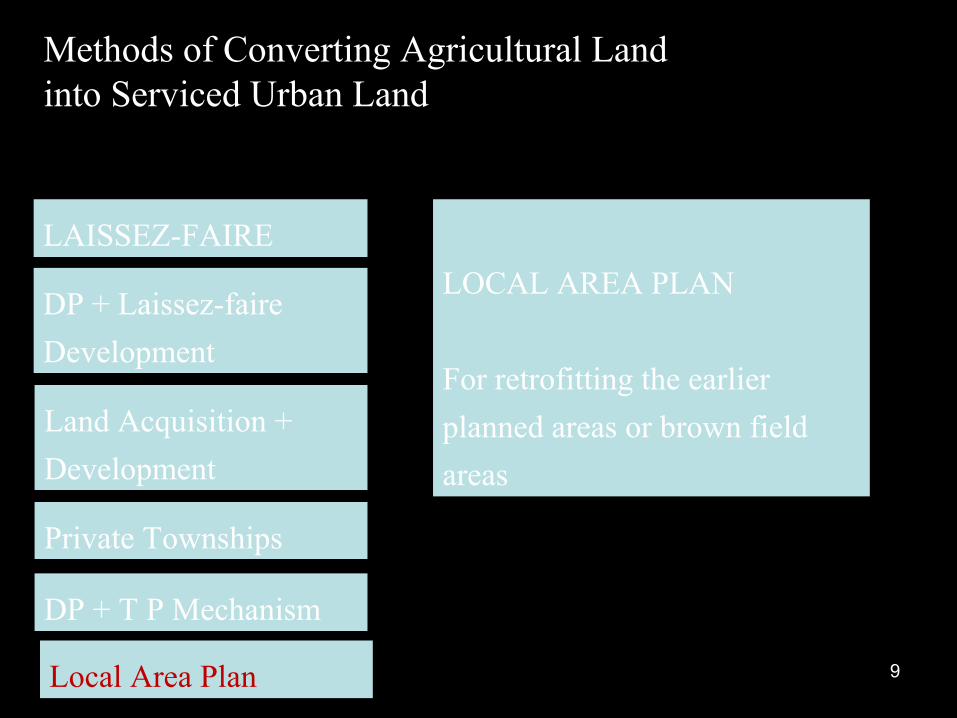
LOCAL AREA PLAN
For retrofitting the earlier
planned areas or brown field
areas

Planning Regime in Gujarat
Macro Level - Development Plan
• New areas
• Zoning, Density control
• City level road network and infrastructure -designation
Micro Level – Town Planning Scheme
• Neighborhood / city level road network ad infrastructure
• Reconstitution and appropriation of land holdings
• Land availability for neighborhood / city level social and physical infrastructure
• Financing of neighborhood level infrastructure
Micro Level Re-planning or Retrofitting – Local Areal Planning
ULBs manage delivery of serviced land through a 3 tier process
10

Town Planning in Gujarat
• Town Planning regime ………..
• 1915 : applied to Salsette island – Bombay
• 1925 : First Town Pooling Scheme of Jamalpur in Gujarat
• 1954 : Amended Bombay Town Planning Legislation
• 1960 : 1st development plans prepared by Ahmedabad and others
• 1976 : New Act in Gujarat (GTPUD)Act, having more provisions
• 1995, 1999, 2001 & 2014 : Amendments in GTPUD Act
• Gujarat experience ……….
• pooling regime almost 100 years
• proved to be a sovereign tool , backed by special law & following principles of
Cooperative participation11

Gujarat Land Consolidation / Pooling
12

• Concept………..
• promote efficient, sustainable & equitable land development
• achieve planned & sustainable growth through Co-operative public
participation
• Consolidation For………..
• Development of greenfield & brownfield areas
• Redevelopment / Revitalization of down towns
• Consolidation of land for Infrastructure (addition & improvement)
Land Consolidation
Consolidation through Land Pooling …………13

19th Century British Town Improvement Schemes
14
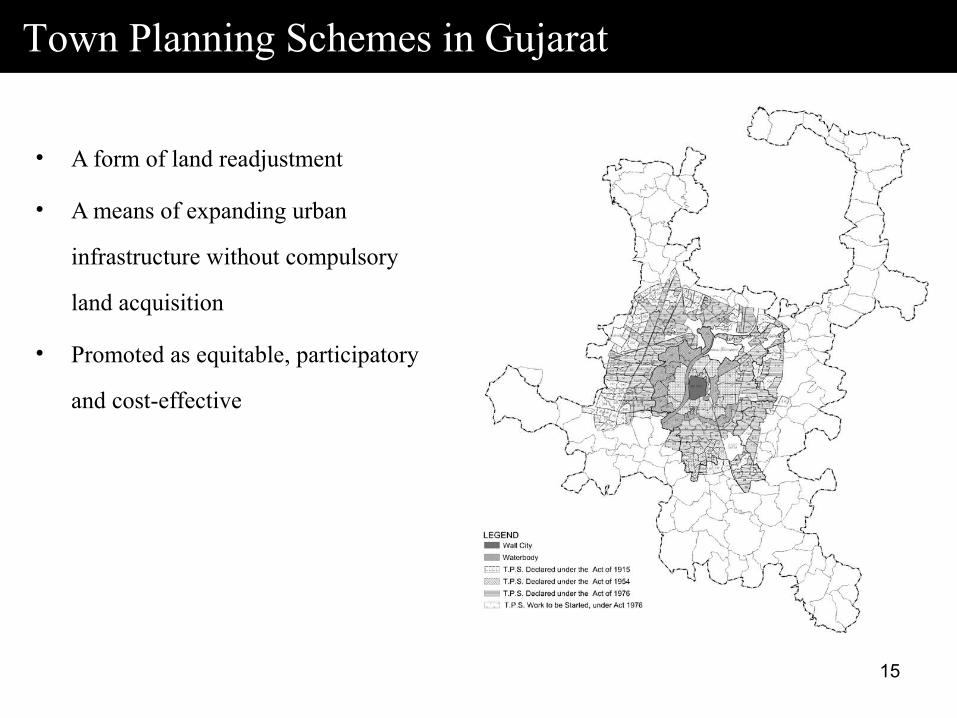
Town Planning Schemes in Gujarat
• A form of land readjustment
• A means of expanding urban
infrastructure without compulsory
land acquisition
• Promoted as equitable, participatory
and cost-effective
15

The First TPS of Ahmedabad, 1925
16

Jamalpur TPS Ahmedabad
To provide proper access
17
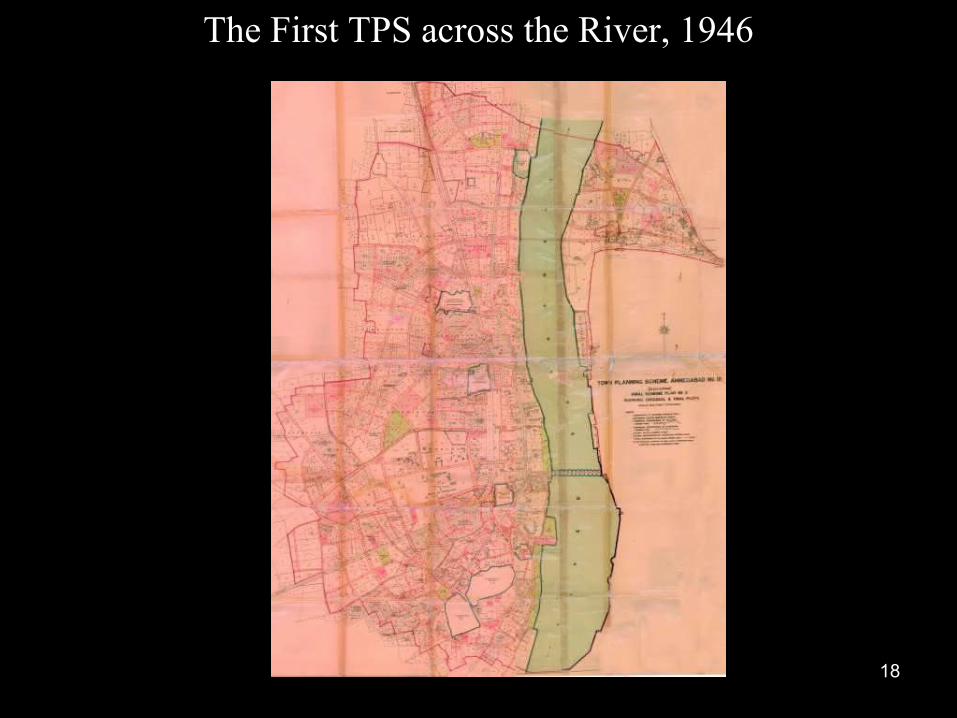
The First TPS across the River, 1946
18

TPS the present format :
• Areas designated for urban expansion in the city’s
development plan
• Divided into TP schemes of ~100-3000 hectares
covering ~100-2500 parcels
• Government pools the land, uses 25-50% for roads,
open space, other public purposes, including 5-10%
for sale.
• The remaining 50-75% is returned to original owners,
whose land value has increased
• Urban land use is now allowed on these parcels
• Landowner consultation at various stages, regarding
their individual parcels
• Land Value Capture – Incremental Contribution 19

Land Pooling – Gujarat
• First TPS Declared in 1920 with 270 Ha.
• TPS in 2012 are of 1200 Ha in urban areas to 8000 Ha in DHOLERA & DAHEJ SIR
• Significant Rise in TPS after 1985
• Timely amendment of the ACT has facilitated more TPS
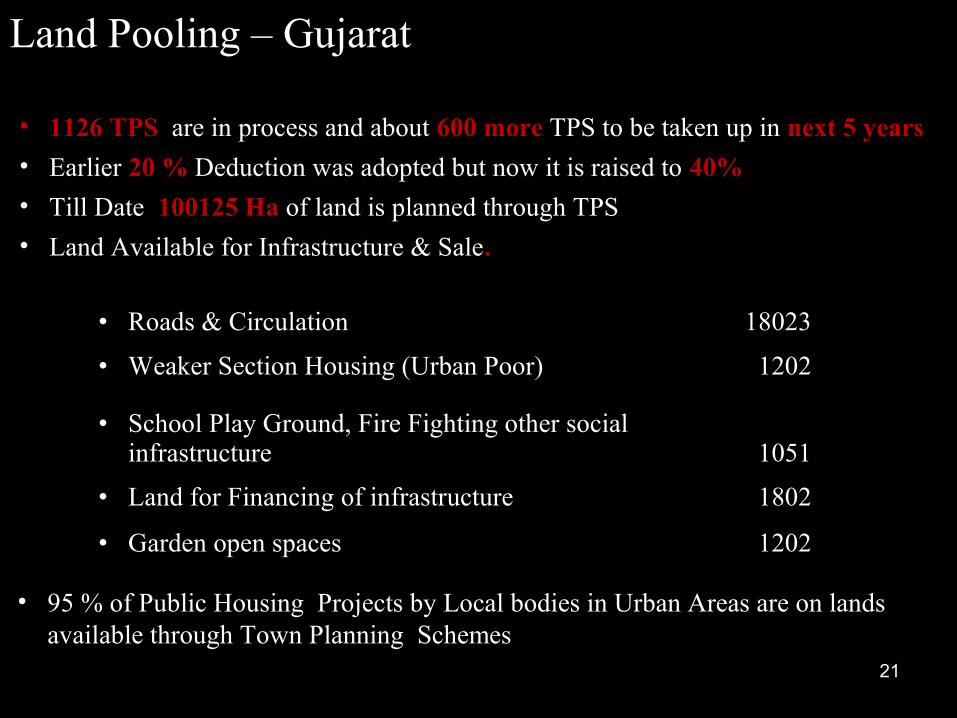
• 1126 TPS are in process and about 600 more TPS to be taken up in next 5 years
• Earlier 20 % Deduction was adopted but now it is raised to 40%
95% of the area (except down town) is developed by TPS in Ahmedabad 20
Land Pooling – Gujarat
• 1126 TPS are in process and about 600 more TPS to be taken up in next 5 years
• Earlier 20 % Deduction was adopted but now it is raised to 40%
• Till Date 100125 Ha of land is planned through TPS
• Land Available for Infrastructure & Sale.
• Roads & Circulation 18023
• Weaker Section Housing (Urban Poor) 1202
• School Play Ground, Fire Fighting other social infrastructure 1051
• Land for Financing of infrastructure 1802
• Garden open spaces 1202
21
• 95 % of Public Housing Projects by Local bodies in Urban Areas are on lands available through Town Planning Schemes

5. What is the TPS Mechanism?
• A Simplified Example
• A Real Example
22
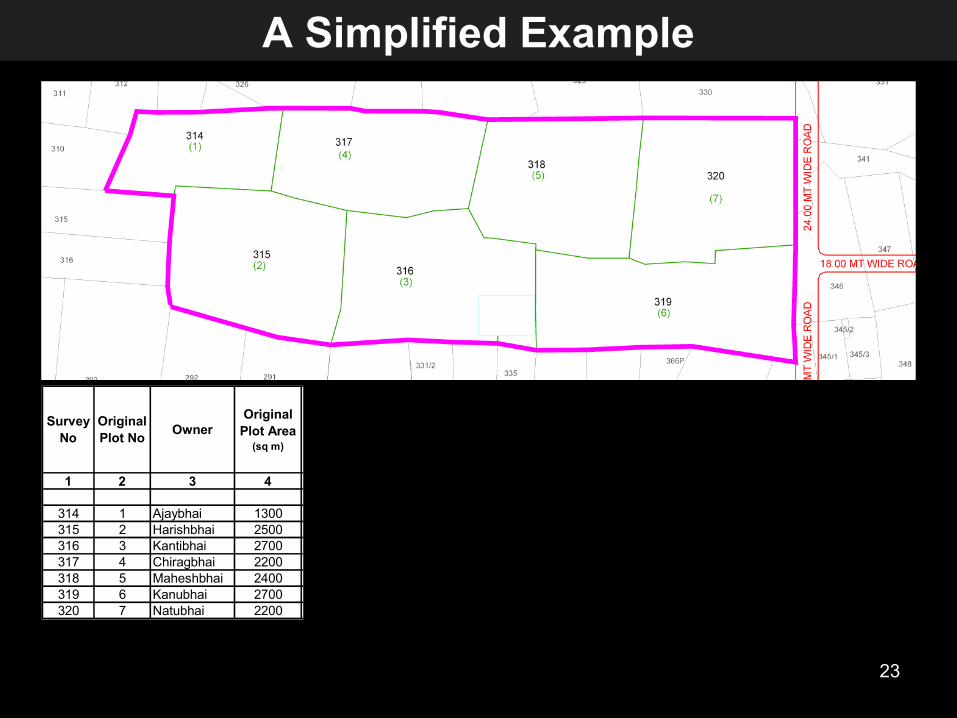
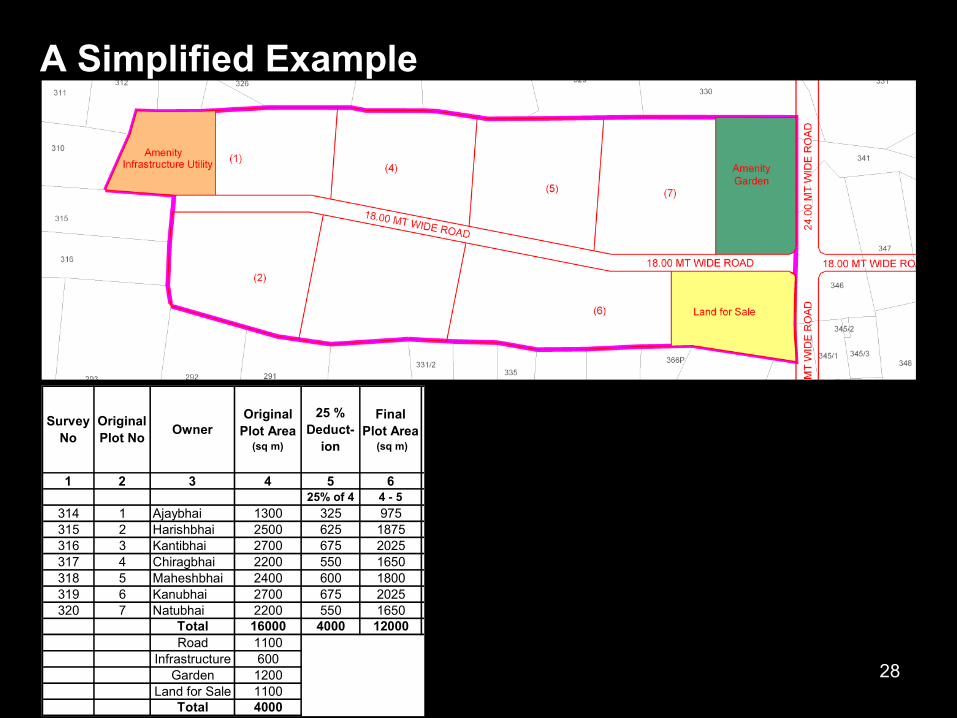
Survey No
Original Plot No
OwnerOriginal
Plot Area(sq m)
25 % Deduct-
ion
Final Plot Area
(sq m)
Original Plot Value(Rs. persq m)
Original Plot Value
(Rs.)
Compensation
(Rs.)
Final Plot
Value(Rs. persq m)
Final Plot Value(Rs.)
Increment in Land Value
(Rs.)
50% of Increment
in Land Value (Rs.)
Net Demand
(Rs.)
1 2 3 4 5 6 7 8 9 10 11 12 13 1425% of 4 4 - 5 4 x 7 5 x 7 6 x 10 11 - (6x7) 50% of 12 12 - 9
314 1 Ajaybhai 1300 325 975 175 227500 56875 525 511875 341250 170625 113750315 2 Harishbhai 2500 625 1875 175 437500 109375 525 984375 656250 328125 218750316 3 Kantibhai 2700 675 2025 200 540000 135000 600 1215000 810000 405000 270000317 4 Chiragbhai 2200 550 1650 200 440000 110000 600 990000 660000 330000 220000318 5 Maheshbhai 2400 600 1800 200 480000 120000 600 1080000 720000 360000 240000319 6 Kanubhai 2700 675 2025 225 607500 151875 675 1366875 911250 455625 303750320 7 Natubhai 2200 550 1650 225 495000 123750 675 1113750 742500 371250 247500
Total 16000 4000 12000Road 1100
Infrastructure 600Garden 1200
Land for Sale 1100Total 4000
A Simplified Example
23

Survey No
Original Plot No
OwnerOriginal
Plot Area(sq m)
25 % Deduct-
ion
Final Plot Area
(sq m)
Original Plot Value(Rs. persq m)
Original Plot Value
(Rs.)
Compensation
(Rs.)
Final Plot
Value(Rs. persq m)
Final Plot Value(Rs.)
Increment in Land Value
(Rs.)
50% of Increment
in Land Value (Rs.)
Net Demand
(Rs.)
1 2 3 4 5 6 7 8 9 10 11 12 13 1425% of 4 4 - 5 4 x 7 5 x 7 6 x 10 11 - (6x7) 50% of 12 12 - 9
314 1 Ajaybhai 1300 325 975 175 227500 56875 525 511875 341250 170625 113750315 2 Harishbhai 2500 625 1875 175 437500 109375 525 984375 656250 328125 218750316 3 Kantibhai 2700 675 2025 200 540000 135000 600 1215000 810000 405000 270000317 4 Chiragbhai 2200 550 1650 200 440000 110000 600 990000 660000 330000 220000318 5 Maheshbhai 2400 600 1800 200 480000 120000 600 1080000 720000 360000 240000319 6 Kanubhai 2700 675 2025 225 607500 151875 675 1366875 911250 455625 303750320 7 Natubhai 2200 550 1650 225 495000 123750 675 1113750 742500 371250 247500
Total 16000 4000 12000Road 1100
Infrastructure 600Garden 1200
Land for Sale 1100Total 4000
4000 sq mts (conveniently) happens to be 25% of the total area
A Simplified Example
24

Survey No
Original Plot No
OwnerOriginal
Plot Area(sq m)
25 % Deduct-
ion
Final Plot Area
(sq m)
Original Plot Value(Rs. persq m)
Original Plot Value(Rs.)
Compensation
(Rs.)
Final Plot
Value(Rs. persq m)
Final Plot Value(Rs.)
Increment in Land Value
(Rs.)
50% of Increment
in Land Value (Rs.)
Net Demand
(Rs.)
1 2 3 4 5 6 7 8 9 10 11 12 13 1425% of 4 4 - 5 4 x 7 5 x 7 6 x 10 11 - (6x7) 50% of 12 12 - 9
314 1 Ajaybhai 1300 325 975 175 227500 56875 525 511875 341250 170625 113750315 2 Harishbhai 2500 625 1875 175 437500 109375 525 984375 656250 328125 218750316 3 Kantibhai 2700 675 2025 200 540000 135000 600 1215000 810000 405000 270000317 4 Chiragbhai 2200 550 1650 200 440000 110000 600 990000 660000 330000 220000318 5 Maheshbhai 2400 600 1800 200 480000 120000 600 1080000 720000 360000 240000319 6 Kanubhai 2700 675 2025 225 607500 151875 675 1366875 911250 455625 303750320 7 Natubhai 2200 550 1650 225 495000 123750 675 1113750 742500 371250 247500
Total 16000 4000 12000Road 1100
Infrastructure 600Garden 1200
Land for Sale 1100Total 4000
A Simplified Example
25

Survey No
Original Plot No
OwnerOriginal
Plot Area(sq m)
25 % Deduct-
ion
Final Plot Area
(sq m)
Original Plot Value(Rs. persq m)
Original Plot Value(Rs.)
Compensation
(Rs.)
Final Plot
Value(Rs. persq m)
Final Plot Value(Rs.)
Increment in Land Value
(Rs.)
50% of Increment
in Land Value (Rs.)
Net Demand
(Rs.)
1 2 3 4 5 6 7 8 9 10 11 12 13 1425% of 4 4 - 5 4 x 7 5 x 7 6 x 10 11 - (6x7) 50% of 12 12 - 9
314 1 Ajaybhai 1300 325 975 175 227500 56875 525 511875 341250 170625 113750315 2 Harishbhai 2500 625 1875 175 437500 109375 525 984375 656250 328125 218750316 3 Kantibhai 2700 675 2025 200 540000 135000 600 1215000 810000 405000 270000317 4 Chiragbhai 2200 550 1650 200 440000 110000 600 990000 660000 330000 220000318 5 Maheshbhai 2400 600 1800 200 480000 120000 600 1080000 720000 360000 240000319 6 Kanubhai 2700 675 2025 225 607500 151875 675 1366875 911250 455625 303750320 7 Natubhai 2200 550 1650 225 495000 123750 675 1113750 742500 371250 247500
Total 16000 4000 12000Road 1100
Infrastructure 600Garden 1200
Land for Sale 1100Total 4000
A Simplified Example
26

A Simplified Example
Survey No
Original Plot No
OwnerOriginal
Plot Area(sq m)
25 % Deduct-
ion
Final Plot Area
(sq m)
Original Plot Value(Rs. persq m)
Original Plot Value(Rs.)
Compensation
(Rs.)
Final Plot
Value(Rs. persq m)
Final Plot Value(Rs.)
Increment in Land Value
(Rs.)
50% of Increment
in Land Value (Rs.)
Net Demand
(Rs.)
1 2 3 4 5 6 7 8 9 10 11 12 13 1425% of 4 4 - 5 4 x 7 5 x 7 6 x 10 11 - (6x7) 50% of 12 12 - 9
314 1 Ajaybhai 1300 325 975 175 227500 56875 525 511875 341250 170625 113750315 2 Harishbhai 2500 625 1875 175 437500 109375 525 984375 656250 328125 218750316 3 Kantibhai 2700 675 2025 200 540000 135000 600 1215000 810000 405000 270000317 4 Chiragbhai 2200 550 1650 200 440000 110000 600 990000 660000 330000 220000318 5 Maheshbhai 2400 600 1800 200 480000 120000 600 1080000 720000 360000 240000319 6 Kanubhai 2700 675 2025 225 607500 151875 675 1366875 911250 455625 303750320 7 Natubhai 2200 550 1650 225 495000 123750 675 1113750 742500 371250 247500
Total 16000 4000 12000Road 1100
Infrastructure 600Garden 1200
Land for Sale 1100Total 4000
27
A Simplified Example
Survey No
Original Plot No
OwnerOriginal
Plot Area(sq m)
25 % Deduct-
ion
Final Plot Area
(sq m)
Original Plot Value(Rs. persq m)
Original Plot Value(Rs.)
Compensation
(Rs.)
Final Plot
Value(Rs. persq m)
Final Plot Value(Rs.)
Increment in Land Value
(Rs.)
50% of Increment
in Land Value (Rs.)
Net Demand
(Rs.)
1 2 3 4 5 6 7 8 9 10 11 12 13 1425% of 4 4 - 5 4 x 7 5 x 7 6 x 10 11 - (6x7) 50% of 12 12 - 9
314 1 Ajaybhai 1300 325 975 175 227500 56875 525 511875 341250 170625 113750315 2 Harishbhai 2500 625 1875 175 437500 109375 525 984375 656250 328125 218750316 3 Kantibhai 2700 675 2025 200 540000 135000 600 1215000 810000 405000 270000317 4 Chiragbhai 2200 550 1650 200 440000 110000 600 990000 660000 330000 220000318 5 Maheshbhai 2400 600 1800 200 480000 120000 600 1080000 720000 360000 240000319 6 Kanubhai 2700 675 2025 225 607500 151875 675 1366875 911250 455625 303750320 7 Natubhai 2200 550 1650 225 495000 123750 675 1113750 742500 371250 247500
Total 16000 4000 12000Road 1100
Infrastructure 600Garden 1200
Land for Sale 1100Total 4000
28

Survey No
Original Plot No
OwnerOriginal
Plot Area(sq m)
25 % Deduct-
ion
Final Plot Area
(sq m)
Original Plot Value(Rs. persq m)
Original Plot Value(Rs.)
Compensation
(Rs.)
Final Plot
Value(Rs. persq m)
Final Plot Value(Rs.)
Increment in Land Value
(Rs.)
50% of Increment
in Land Value (Rs.)
Net Demand
(Rs.)
1 2 3 4 5 6 7 8 9 10 11 12 13 1425% of 4 4 - 5 4 x 7 5 x 7 6 x 10 11 - (6x7) 50% of 12 12 - 9
314 1 Ajaybhai 1300 325 975 175 227500 56875 525 511875 341250 170625 113750315 2 Harishbhai 2500 625 1875 175 437500 109375 525 984375 656250 328125 218750316 3 Kantibhai 2700 675 2025 200 540000 135000 600 1215000 810000 405000 270000317 4 Chiragbhai 2200 550 1650 200 440000 110000 600 990000 660000 330000 220000318 5 Maheshbhai 2400 600 1800 200 480000 120000 600 1080000 720000 360000 240000319 6 Kanubhai 2700 675 2025 225 607500 151875 675 1366875 911250 455625 303750320 7 Natubhai 2200 550 1650 225 495000 123750 675 1113750 742500 371250 247500
Total 16000 4000 12000Road 1100
Infrastructure 600Garden 1200
Land for Sale 1100Total 4000
Now we need to:1.Compensate people for land lost2.To extract a portion of increment in land value
A Simplified Example
29

Survey No
Original Plot No
OwnerOriginal
Plot Area(sq m)
25 % Deduct-
ion
Final Plot Area
(sq m)
Original Plot
Value(Rs. persq m)
Compensation
(Rs.)
Final Plot
Value(Rs. persq m)
Final Plot Value(Rs.)
Increment in Land Value
(Rs.)
50% of Increment
in Land Value (Rs.)
Net Demand
(Rs.)
Net Gain of Land Owner
(Rs.)
1 2 3 4 5 6 7 8 9 10 11 12 13 1425% of 4 4 - 5 5 x 7 6 x 9 10 - (6x7) 50% of 11 12 - 8 10 - 13
314 1 Ajaybhai 1300 325 975 175 56875 525 511875 341250 170625 113750 170625315 2 Harishbhai 2500 625 1875 175 109375 525 984375 656250 328125 218750 328125316 3 Kantibhai 2700 675 2025 200 135000 600 1215000 810000 405000 270000 405000317 4 Chiragbhai 2200 550 1650 200 110000 600 990000 660000 330000 220000 330000318 5 Maheshbhai 2400 600 1800 200 120000 600 1080000 720000 360000 240000 360000319 6 Kanubhai 2700 675 2025 225 151875 675 1366875 911250 455625 303750 455625320 7 Natubhai 2200 550 1650 225 123750 675 1113750 742500 371250 247500 371250
Total 16000 4000 12000Road 1100
Infrastructure 600Garden 1200
Land for Sale 1100Total 4000
A Simplified Example
30

Survey No
Original Plot No
OwnerOriginal
Plot Area(sq m)
25 % Deduct-
ion
Final Plot Area
(sq m)
Original Plot
Value(Rs. persq m)
Compensation
(Rs.)
Final Plot
Value(Rs. persq m)
Final Plot Value(Rs.)
Increment in Land Value
(Rs.)
50% of Increment
in Land Value (Rs.)
Net Demand
(Rs.)
Net Gain of Land Owner
(Rs.)
1 2 3 4 5 6 7 8 9 10 11 12 13 1425% of 4 4 - 5 5 x 7 6 x 9 10 - (6x7) 50% of 11 12 - 8 10 - 13
314 1 Ajaybhai 1300 325 975 175 56875 525 511875 341250 170625 113750 170625315 2 Harishbhai 2500 625 1875 175 109375 525 984375 656250 328125 218750 328125316 3 Kantibhai 2700 675 2025 200 135000 600 1215000 810000 405000 270000 405000317 4 Chiragbhai 2200 550 1650 200 110000 600 990000 660000 330000 220000 330000318 5 Maheshbhai 2400 600 1800 200 120000 600 1080000 720000 360000 240000 360000319 6 Kanubhai 2700 675 2025 225 151875 675 1366875 911250 455625 303750 455625320 7 Natubhai 2200 550 1650 225 123750 675 1113750 742500 371250 247500 371250
Total 16000 4000 12000Road 1100
Infrastructure 600Garden 1200
Land for Sale 1100Total 4000
A Simplified Example
31
Survey No
Original Plot No
OwnerOriginal
Plot Area(sq m)
25 % Deduct-
ion
Final Plot Area
(sq m)
Original Plot
Value(Rs. persq m)
Compensation
(Rs.)
Final Plot
Value(Rs. persq m)
Final Plot Value(Rs.)
Increment in Land Value(Rs.)
50% of Increment
in Land Value (Rs.)
Net Demand
(Rs.)
Net Gain of Land Owner
(Rs.)
1 2 3 4 5 6 7 8 9 10 11 12 13 1425% of 4 4 - 5 5 x 7 6 x 9 10 - (6x7) 50% of 11 12 - 8 10 - 13
314 1 Ajaybhai 1300 325 975 175 56875 525 511875 341250 170625 113750 170625315 2 Harishbhai 2500 625 1875 175 109375 525 984375 656250 328125 218750 328125316 3 Kantibhai 2700 675 2025 200 135000 600 1215000 810000 405000 270000 405000317 4 Chiragbhai 2200 550 1650 200 110000 600 990000 660000 330000 220000 330000318 5 Maheshbhai 2400 600 1800 200 120000 600 1080000 720000 360000 240000 360000319 6 Kanubhai 2700 675 2025 225 151875 675 1366875 911250 455625 303750 455625320 7 Natubhai 2200 550 1650 225 123750 675 1113750 742500 371250 247500 371250
Total 16000 4000 12000Road 1100
Infrastructure 600Garden 1200
Land for Sale 1100Total 4000
A Simplified Example
32

Survey No
Original Plot No
OwnerOriginal
Plot Area(sq m)
25 % Deduct-
ion
Final Plot Area
(sq m)
Original Plot
Value(Rs. persq m)
Compensation
(Rs.)
Final Plot
Value(Rs. persq m)
Final Plot Value(Rs.)
Increment in Land Value
(Rs.)
50% of Increment
in Land Value (Rs.)
Net Demand
(Rs.)
Net Gain of Land Owner
(Rs.)
1 2 3 4 5 6 7 8 9 10 11 12 13 1425% of 4 4 - 5 5 x 7 6 x 9 10 - (6x7) 50% of 11 12 - 8 10 - 13
314 1 Ajaybhai 1300 325 975 175 56875 525 511875 341250 170625 113750 170625315 2 Harishbhai 2500 625 1875 175 109375 525 984375 656250 328125 218750 328125316 3 Kantibhai 2700 675 2025 200 135000 600 1215000 810000 405000 270000 405000317 4 Chiragbhai 2200 550 1650 200 110000 600 990000 660000 330000 220000 330000318 5 Maheshbhai 2400 600 1800 200 120000 600 1080000 720000 360000 240000 360000319 6 Kanubhai 2700 675 2025 225 151875 675 1366875 911250 455625 303750 455625320 7 Natubhai 2200 550 1650 225 123750 675 1113750 742500 371250 247500 371250
Total 16000 4000 12000Road 1100
Infrastructure 600Garden 1200
Land for Sale 1100Total 4000
A Simplified Example
33

Survey No
Original Plot No
OwnerOriginal
Plot Area(sq m)
25 % Deduct-
ion
Final Plot Area
(sq m)
Original Plot
Value(Rs. persq m)
Compensation
(Rs.)
Final Plot
Value(Rs. persq m)
Final Plot Value(Rs.)
Increment in Land Value
(Rs.)
50% of Increment
in Land Value (Rs.)
Net Demand
(Rs.)
Net Gain of Land Owner
(Rs.)
1 2 3 4 5 6 7 8 9 10 11 12 13 1425% of 4 4 - 5 5 x 7 6 x 9 10 - (6x7) 50% of 11 12 - 8 10 - 13
314 1 Ajaybhai 1300 325 975 175 56875 525 511875 341250 170625 113750 170625315 2 Harishbhai 2500 625 1875 175 109375 525 984375 656250 328125 218750 328125316 3 Kantibhai 2700 675 2025 200 135000 600 1215000 810000 405000 270000 405000317 4 Chiragbhai 2200 550 1650 200 110000 600 990000 660000 330000 220000 330000318 5 Maheshbhai 2400 600 1800 200 120000 600 1080000 720000 360000 240000 360000319 6 Kanubhai 2700 675 2025 225 151875 675 1366875 911250 455625 303750 455625320 7 Natubhai 2200 550 1650 225 123750 675 1113750 742500 371250 247500 371250
Total 16000 4000 12000Road 1100
Infrastructure 600Garden 1200
Land for Sale 1100Total 4000
A Simplified Example
34

Survey No
Original Plot No
OwnerOriginal
Plot Area(sq m)
25 % Deduct-
ion
Final Plot Area
(sq m)
Original Plot
Value(Rs. persq m)
Compensation
(Rs.)
Final Plot
Value(Rs. persq m)
Final Plot Value(Rs.)
Increment in Land Value
(Rs.)
50% of Increment
in Land Value (Rs.)
Net Demand
(Rs.)
Net Gain of Land Owner
(Rs.)
1 2 3 4 5 6 7 8 9 10 11 12 13 1425% of 4 4 - 5 5 x 7 6 x 9 10 - (6x7) 50% of 11 12 - 8 10 - 13
314 1 Ajaybhai 1300 325 975 175 56875 525 511875 341250 170625 113750 170625315 2 Harishbhai 2500 625 1875 175 109375 525 984375 656250 328125 218750 328125316 3 Kantibhai 2700 675 2025 200 135000 600 1215000 810000 405000 270000 405000317 4 Chiragbhai 2200 550 1650 200 110000 600 990000 660000 330000 220000 330000318 5 Maheshbhai 2400 600 1800 200 120000 600 1080000 720000 360000 240000 360000319 6 Kanubhai 2700 675 2025 225 151875 675 1366875 911250 455625 303750 455625320 7 Natubhai 2200 550 1650 225 123750 675 1113750 742500 371250 247500 371250
Total 16000 4000 12000Road 1100
Infrastructure 600Garden 1200
Land for Sale 1100Total 4000
A Simplified Example
35
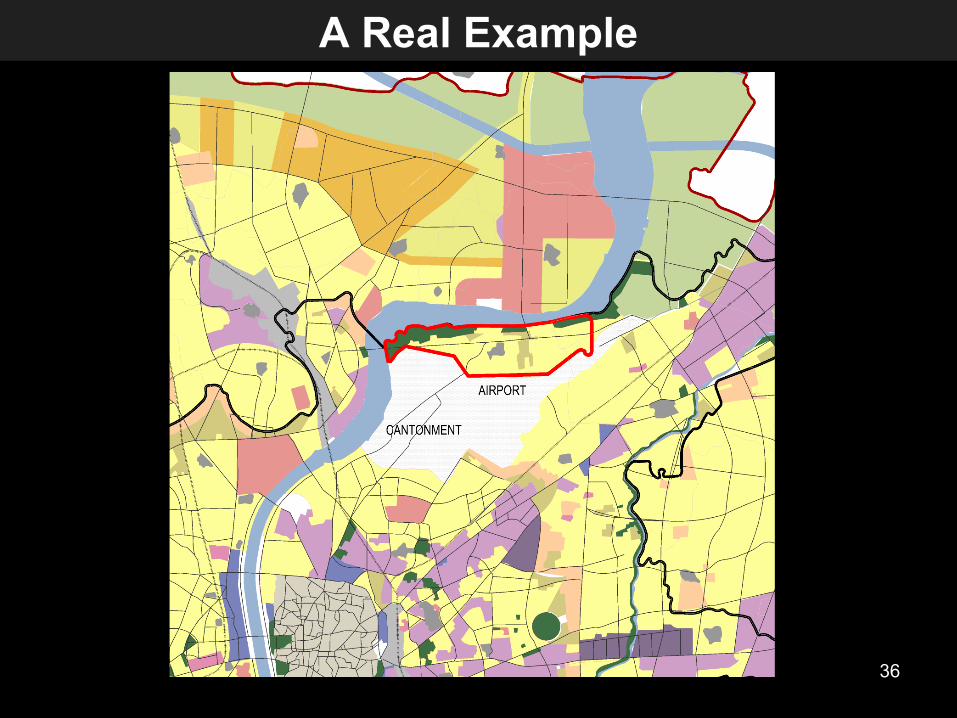
A Real Example
36

An area of approximately 100 to 150 hectares is taken up for planning
A Real Example
37

The area is surveyed
A Real Example
38

Boundaries of the detailed planning area are defined
A Real Example
39

Ownership details of every plot are reviewed
A Real Example
40

Ownership, plot size, land value details tabulated
A Real Example
41

Original plots are marked on the survey
A Real Example
42
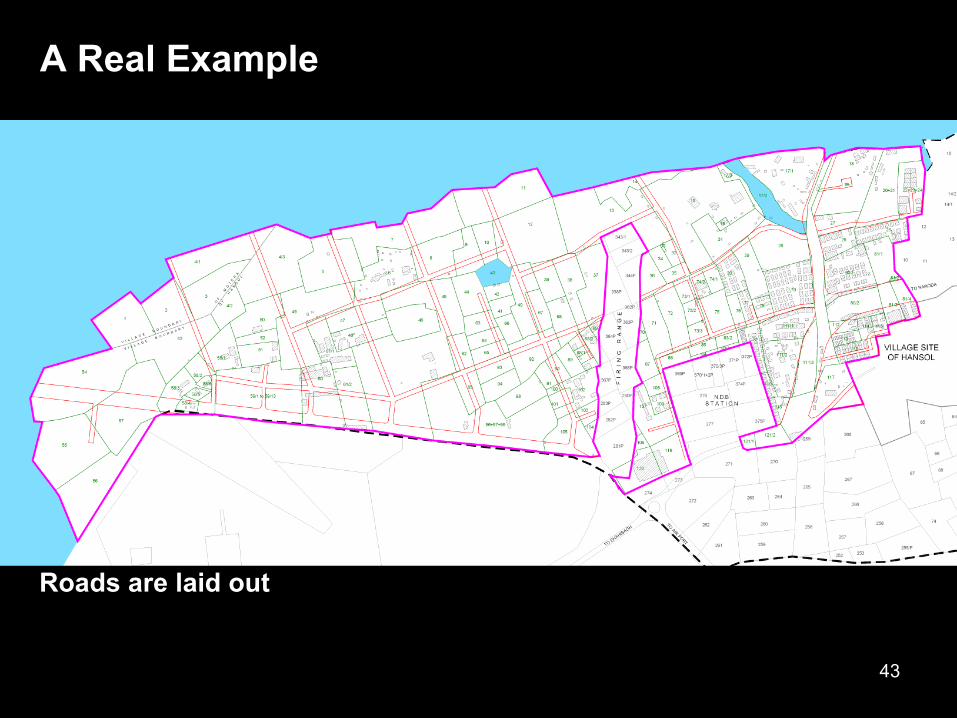
Roads are laid out
A Real Example
43

Plots for amenities, revenue generation are carved
A Real Example
44

Final plots are delineated
A Real Example
45

Final plots are delineated
A Real Example
46

Final plot sizes & land value increments tabulated
A Real Example
47

Betterment levies tabulated
A Real Example
48

The TPS is presented to the land owners
A Real Example
49

Objections & suggestions are accepted
The TPS is altered appropriately
A Real Example
50

Roads are taken possession of
Infrastructure is built
A Real Example
51

A quasi judicial officer hears grievances
Alters the TPS as appropriate
State Government sanctions the TPS
A Real Example
52

Final plots are handed over
Betterment levies are collected
Private plots are developed as permitted
A Real Example
53

A Real Example
54
Various Uses of the TPS Mechanism
• City Level Infrastructure• Infrastructure in Unauthorized Colonies • Infrastructure in Dense Inner City Areas• Social Infrastructure• Land Consolidation
55

City Level Infrastructure
To implement ring road without acquiring land under Land Acquisition
Ring Road
76 kms long
60 m wide
56
Surat 26 km lentgth of 90 mts wide part of ring road undertaken

Ahmedabad’s Ring Road was developed through the TPS mechanism
City Level Infrastructure
57

Source: Google Earth
Ahmedabad’s Ring Road was developed through the TPS mechanism
City Level Infrastructure
58

Central Garden of 50 Hect. In TPS of 1250 HA
City Level Infrastructure - Garden
City level50 ha
Garden
59

City Infrastructure through TPS (Garden)
Category Area in HANeighborhood 33.6Community 127.3City 542.3
TOTAL 706.2
Ahmedabad Land Available for Infrastructure
60

Various Uses of the TPS Mechanism
• City Level Infrastructure• Infrastructure in Unauthorized Colonies • Infrastructure in Dense Inner City Areas• Social Infrastructure• Land Consolidation
61
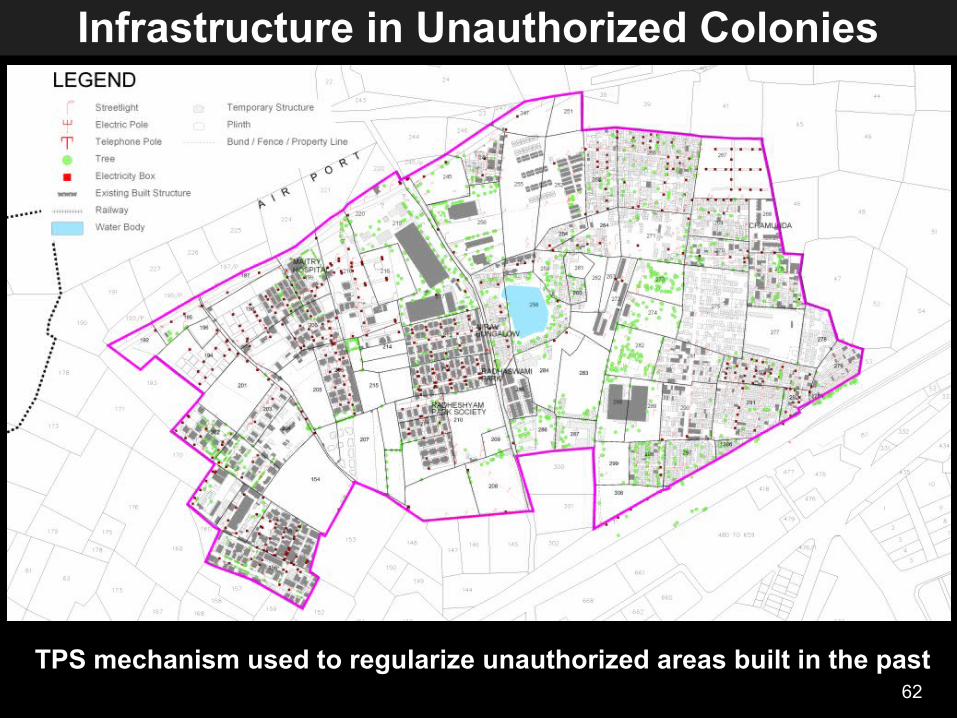
TPS mechanism used to regularize unauthorized areas built in the past
Infrastructure in Unauthorized Colonies
62

TPS mechanism used to regularize unauthorized areas built in the past
Infrastructure in Unauthorized Colonies
Infrastructure in Unauthorized Colonies
63
Various Uses of the TPS Mechanism
• City Level Infrastructure• Infrastructure in Unauthorized Colonies • Infrastructure in Dense Inner City Areas• Social Infrastructure• Land Consolidation
64

Most of the inner city of Bhuj was destroyed
Infrastructure in Dense Inner City Areas
January 26, 2001 8:46:43 hrs (IST)
65

Infrastructure in Dense Inner City Areas
66

Standing Structures
Infrastructure in Dense Inner City Areas
67

Infrastructure in Dense Inner City Areas
Conceptual road network
68

Infrastructure in Dense Inner City Areas
• TPS accommodating 3000 Properties – 16000 Population
• Downtown with Commercial & Residential
69

Infrastructure in Dense Inner City Areas
TPS delineated, each scheme a manageable design unit
70

71
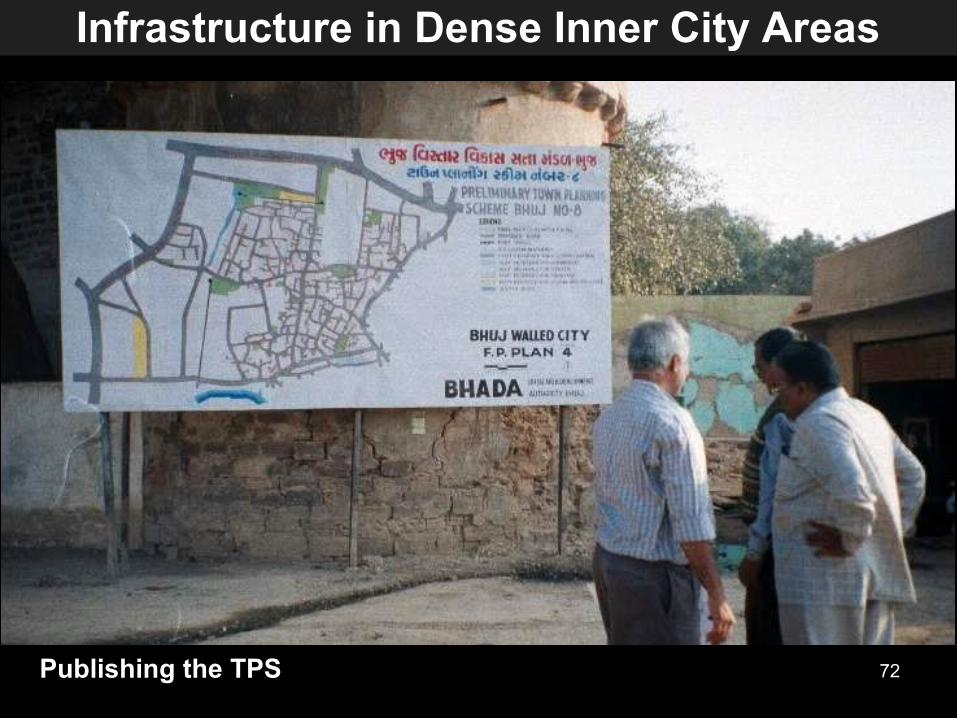
Publishing the TPS
Infrastructure in Dense Inner City Areas
72

Soniwad, January 20 , 2004 73

Various Uses of the TPS Mechanism
• City Level Infrastructure• Infrastructure in Unauthorized Colonies • Infrastructure in Dense Inner City Areas• Social Infrastructure• Land Consolidation
74

Prahladnagar TPS – land appropriated for affordable housing
Social Infrastructure
75

Layout plan
Social Infrastructure
76

Social Infrastructure
77

Various Uses of the TPS Mechanism
• City Level Infrastructure• Infrastructure in Unauthorized Colonies • Infrastructure in Dense Inner City Areas• Social Infrastructure• Land Consolidation
78

CITY – VADODARA Village DENA-KOTALI-AMALARIYA
2000 Ha. Designated in Development Plan as IT Node (Declared)
• 65 Ha - 5% of Central Core to be carved out through land poling to be Developed as IT-Node - a catalyst for development
• To be developed as Knowledge Node through PPP mode
65 Ha. For for IT
79
Land Consolidation

CITY – SURAT
• 25Ha carved out through land poling to be Developed as Amusement Park - a catalyst for development
• To be developed through PPP mode – Work Commenced
25 Ha Amusement
Park
80
Land Consolidation

VADODARA URBAN DEVELOPMENT AUTHORITY AREAII REVISED DEVELOPMENT PLAN (DRAFT)
KNOWLEDGE TOWNSHIPLANDUSE PLAN
N
S
W E
VUDA BO UNDARYVMC BOUNDARYVILLAGE BOUNDARYGAMTALTPS BOUNDARYPROPOSED ROADSBROAD GUAG E RAILWAYPROPOS ED BRIDGESEXIS TING ROBROAD OV ER BRIDGE
MUJARGOMDI
MARETHA
JAMBUVA
KHALIPURALAMGIR
V ILLAGE SITE (GAMTAL) - GTRESIDENTIAL ZONE - RIRESIDENTIAL ZONE - RIIEDUCATION & RESEARCH - IEDUCATION & RESEARCH - IISPECIAL COMME RCIAL ZONE - SCZNON OBNIX IOUS INDUS TRIAL ZONE - NOZPUBLIC PURPOS E - PPZWATER BODY (TANKS , WATERWAY, RIVE R, CANAL) WBRECREATION PURPOSE - RPRESTRICTED ZONE - RZ IITRANS PORT (ROAD & RAILWAY) - TZIAGRICULTURAL ZONE - AZTOTAL
PROPOSED RLY STRAILWAY GOOD YARDPUBLIC BUS TERMINUSTRANSPORT GODOWNSCITY CE NTERCONVENTION CENTERCENTER FOR ART & CULTUREMUSIUM & ART GALARYENGINEERIANG & TECHNOLOGYBIOTECH EDUCATION & RESEARCHAGRICULTURE RESEARCHINFORMATION TECHNOLOGY RESEARCHPUBLIC GARDEN
123456789
10111213
TPS 114
4500
2086036
074--
89-
932
TPS 21020
496651015
28503
18-
172-
1094
Total24
470496273
7051
28577
58-
261-
2026
TPS - 1
TPS - 2
VMCLIMITS
VUDALIMITS
Land Consolidation
• 100 Ha - 5% of Central Core to be carved out through land poling
• To be developed as Knowledge Node through PPP mode
CITY – VADODARA Future Planning
2226 Ha. Designated in Development Plan as Knowledge Node
81

Key Questions further required to be solved …..
82

Points to ponder………..
• Are we looking at Land only or total built environment • Should we not think for Seamless Space rather than buildings; • Should we not redesign the Planning Regime to consider….
• Built Form in 3 D rather than just defining Land-use & Development Control
• Sensitive to Sustainability Efficiency• More adaptable for both green field and brown field areas• To adopt Performance DCR
• Land as an asset to create infrastructure not just monetization• Create infrastructure which is inclusive not just utility• Redefine the Land Disposal policies and look forward in development
of public spaces through PPP
83

Before
Thank You…
For more information - [email protected](Source for some slides: HCP Ahmedabad) 84