connectkaro 2015 - 5b - disrupting cities for good - personal environment mapping
TRANSCRIPT
+
Personal Environment Mapping Smartphone driven PAQS platform leveraged IoT ready solutions
A Vaidyanathan Personal Air Quality Systems Pvt. Ltd.
www.paqs.biz
www.myairmyhealth.com
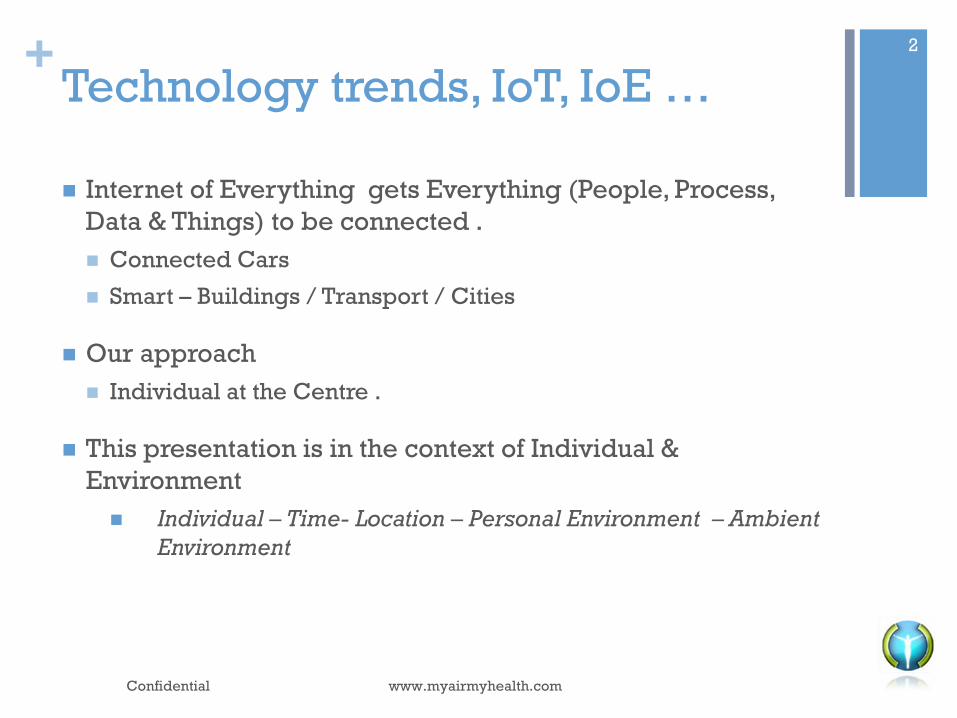
+ Technology trends, IoT, IoE …
Internet of Everything gets Everything (People, Process,
Data & Things) to be connected .
Connected Cars
Smart – Buildings / Transport / Cities
Our approach
Individual at the Centre .
This presentation is in the context of Individual &
Environment
Individual – Time- Location – Personal Environment – Ambient
Environment
Confidential www.myairmyhealth.com
2

+ Story of our logo We create innovative technology solutions that enhance an
individual’s health and comfor
THE INDIVIDUAL
Symbolizes the individual’s health.
Our solutions are centered around
the individual
PERSONAL ENVIRONMENT
Symbolizes My Space / Individual
Environment / Micro Environment.
Green color emphasizes the need for
clean and fresh environment
WORLD PRESENCE
Representing presence in the
world /Globe/Atmosphere
+
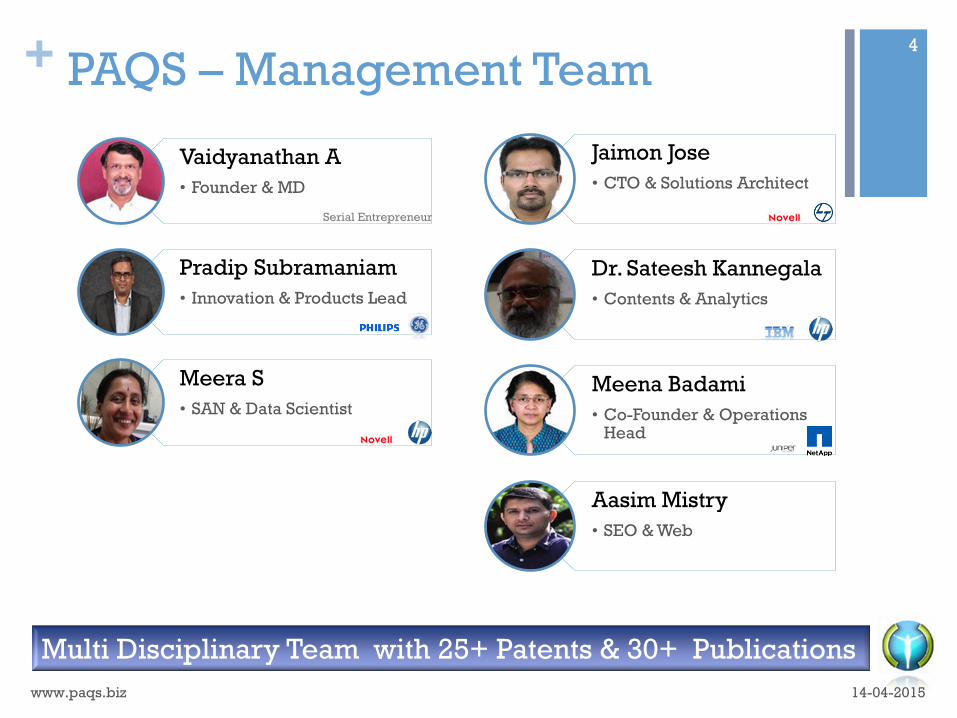
Jaimon Jose
• CTO & Solutions Architect
Dr. Sateesh Kannegala
• Contents & Analytics
Meena Badami
• Co-Founder & Operations Head
Aasim Mistry
• SEO & Web
PAQS – Management Team
14-04-2015 www.paqs.biz
4
Multi Disciplinary Team with 25+ Patents & 30+ Publications
Vaidyanathan A
• Founder & MD
Pradip Subramaniam
• Innovation & Products Lead
Meera S
• SAN & Data Scientist
Serial Entrepreneur
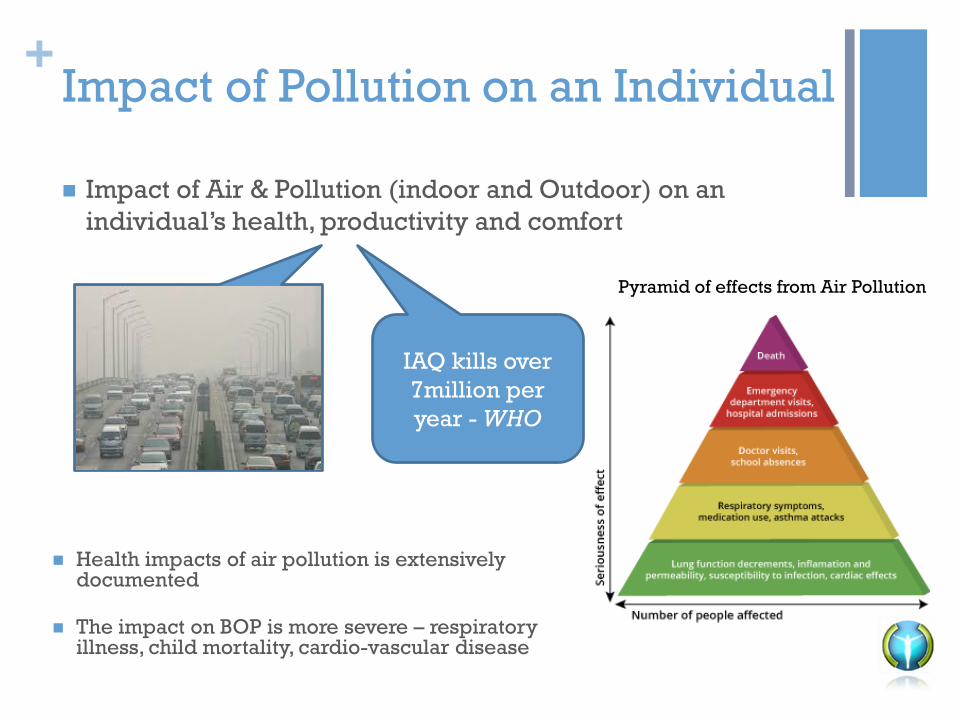
+ Impact of Pollution on an Individual
Impact of Air & Pollution (indoor and Outdoor) on an
individual’s health, productivity and comfort
IAQ kills over
7million per
year - WHO
Pyramid of effects from Air Pollution
Health impacts of air pollution is extensively documented
The impact on BOP is more severe – respiratory illness, child mortality, cardio-vascular disease
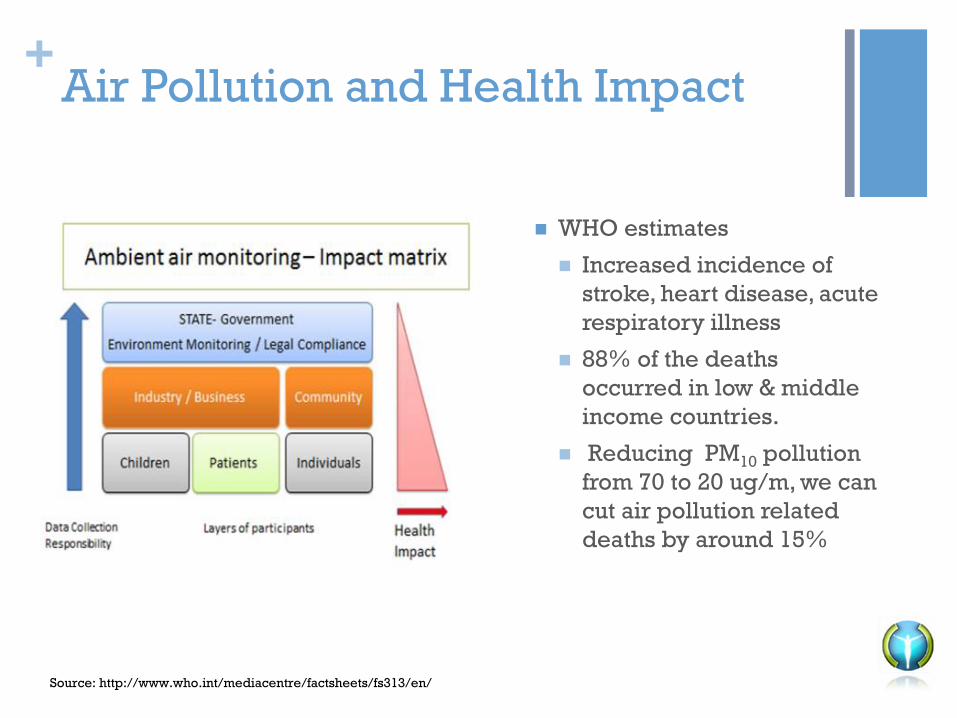
+ Air Pollution and Health Impact
WHO estimates
Increased incidence of
stroke, heart disease, acute
respiratory illness
88% of the deaths
occurred in low & middle
income countries.
Reducing PM10 pollution
from 70 to 20 ug/m, we can
cut air pollution related
deaths by around 15%
Source: http://www.who.int/mediacentre/factsheets/fs313/en/

+ How It Works?
Our solutions leverage ubiquitous SmartPhones
Our offerings:
Solutions Device App Subscriptions Analytics
Smart
Homes/Buildings
√ √ √
Smart Cities √ √ √
Health care √ √ √ √

+
In
te
rn
et
M
y
A
i
r
M
y
A
i
r
M
y
A
i
r
M
y
A
i
r
M
y
A
i
r
M
y
A
i
r
M
y
A
i
r
M
y
A
i
r
M
y
A
i
r
M
y
A
i
r
M
y
A
i
r
M
y
A
i
r
M
y
A
i
r
Air
Engi
ne
E
T
L
Device
(PEM)
Device
(PEM)
Device
(PEM)
Device
(PEM)
Mobile Devices
Mobile Devices
BlackBerry
Android
Phones
Windows
Phones
IOS
Browsers
Dynamic Mapping – Our Solution

+ Track Air for Pollution
Mapping
Track Air is a device that can be
attached to a mobile vehicle
Senses properties of outside air
Maps pollution vis-à-vis GPS
location and time
Communicates directly to the
Server
4/14/2015 PAQS Confidential
9
Actual photo of the device

+ Real Time Pollution Mapping
4/14/2015
10
PAQS Confidential

+ City Pollution Mapping Dashboard
4/14/2015
11
PAQS Confidential

+ Dynamic Pollution Mapping
Devices to capture Pollution properties
Mobile – attached to moving vehicles
Stationary – Important locations
AQI display as per norms
Alternate Routes
Specific advisories
Advanced Analytics
14-04-2015 www.myairmyhealth.com
12
Actual photo of the device
APP on Mobile

+ Data for Dynamic decision /
intervention
Real Time Dynamic Pollution data would be available as
REST API
Pollution APP
Direct Feeds
Algorithms would drive traffic signals based on intensity of traffic reflected through pollution data
Smoother cleaner drive – greener drive
14-04-2015 www.myairmyhealth.com
13
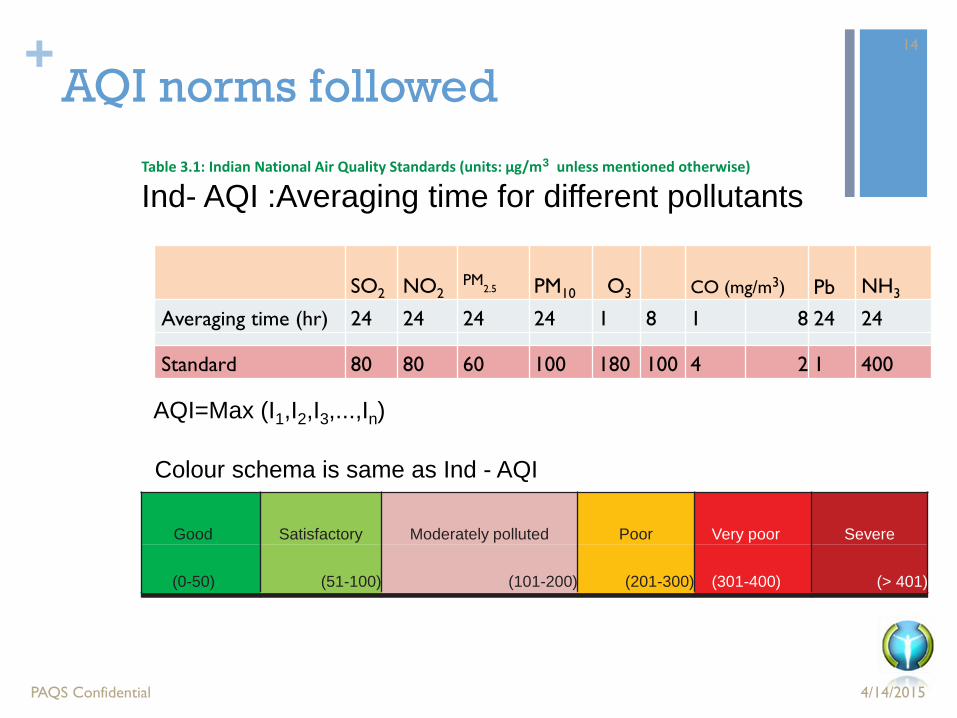
+ AQI norms followed
4/14/2015 PAQS Confidential
14
Good Satisfactory Moderately polluted Poor Very poor Severe
(0-50) (51-100) (101-200) (201-300) (301-400) (> 401)
SO2 NO2 PM
2.5 PM10 O3 CO (mg/m3) Pb NH3
Averaging time (hr) 24 24 24 24 1 8 1 8 24 24
Standard 80 80 60 100 180 100 4 2 1 400
Table 3.1: Indian National Air Quality Standards (units: μg/m3 unless mentioned otherwise)
Ind- AQI :Averaging time for different pollutants
Colour schema is same as Ind - AQI
AQI=Max (I1,I2,I3,...,In)

+
Questions?