consanguineous marriage: facts versus...
TRANSCRIPT

Consanguineous marriage: facts versus fiction
Alan Bittles
Centre for Comparative Genomics, Murdoch University and School of Medical Sciences, Edith Cowan University,
Perth, Australia European Genetics Foundation, 13th May, 2012


Papal ruling on consanguineous marriage
AD 597 Letter of Pope Gregory I to Augustine of Canterbury
“Experience shows that such marriages (between cousins) do not result in children”. “Sacred law forbids a man to uncover the nakedness of his kindred”.
Source: Bede (c. 731)

Biblical stricture on inbreeding
‘None of you shall approach to any that is near kin to him, to uncover their nakedness: I am the Lord.’
Source: Leviticus 18:6

Specific Biblical prohibitions on inbreeding
Prohibited in the previous generation: Mother, father’s wife, father’s brother’s wife, father’s sister, mother’s sister
Prohibited in the same generation: Full sister, half sister, brother’s wife, wife’s sister
Prohibited in the following generation: Son’s wife, son’s daughter, daughter’s daughter
Source: Leviticus 18: 7-18
Consanguineous marriage
1. Consanguinity in human history 2. Definition of a consanguineous marriage
and genetic implications 3. Why is consanguinity favoured, and by
whom? 4. What are the health outcomes? 5. What is the influence of non-genetic
variables and population stratification? 6. Consanguineous marriage in the future?
Homo sapiens - the evolutionary perspective
Out-of-Africa migration 60,000 – 70,000 years before present, i.e. 2,400 – 2,800 generations.
Estimates of the migrating human population: 700 – 10,000 breeding individuals. Sources: Harpending et al. (1998); Zhivotovsky et al. (2003); Tenesa et al. (2007); Liu et al. (2008); Gronau et al. (2011)

Homo sapiens - a fast-breeding species
The descendants of the ~10,000 humans who left Africa ~70,000 years ago have increased in number to 5.95 billion, i.e. a 595,000-fold increase over 2,800 generations.
By ~14,500 years ago, a human community of 30+ persons was already established in southern Chile.


Founder effect
Endogamy
Consanguinity
Drift
Effective population size
Early and historical populations

Human genomic history: Runs of homozygosity (ROH)
Stretches of the genome with uninterrupted runs of homozygosity exceeding 1 Mb in length and up to 17.9 Mb – even in communities and populations with no record of consanguineous marriage in the preceding 5- 10 generations. Sources: Broman & Weber (1999); Gibson et al. (2006);
McQuillan et al. (2008); Pemberton et al. (2010); Kirin et al. (2011); Leutenegger et al. (2011)

Consanguineous marriage
1. Consanguinity in human history 2. Definition of a consanguineous marriage
and genetic implications 3. Why is consanguinity favoured, and by
whom? 4. What are the health outcomes? 5. What is the influence of non-genetic
variables and population stratification? 6. Consanguineous marriage in the future?

Human mating/marriage as a genetic continuum
Random mating
Positive assortative mating
Endogamous marriage
Consanguineous marriage
All humans are genetically related. These four categories of marriage simply differ in the degree of their genetic relationship.

Consanguineous relationships
Biological relationship
Genetic relationship
Coefficient of relationship (r)
Coefficient of inbreeding (F)
Incest Half-sib, double first cousin, uncle-niece
1st degree 2nd degree
0.5 0.25
0.25 0.125
First cousin 3rd degree 0.125 0.0625
First cousin once removed Second cousin
Third cousin
4th degree 5th degree
7th degree
0.0625 0.0313 0.0078
0.0313 0.0156 0.0039

Predicted health outcomes of consanguineous marriage: 1
Consanguinity will exert a significant adverse effect on health via the expression of detrimental recessive genes, whose incidence in the general population is rare. If a disease gene is common in the overall population gene pool, consanguinity will have only a limited effect on its expression.
Predicted health outcomes of consanguineous marriage: 2
By definition, consanguinity results in increased homozygosity. The automatic assumption of homozygous expression of a recessive disease gene in the progeny of a consanguineous unions may, however, be erroneous.
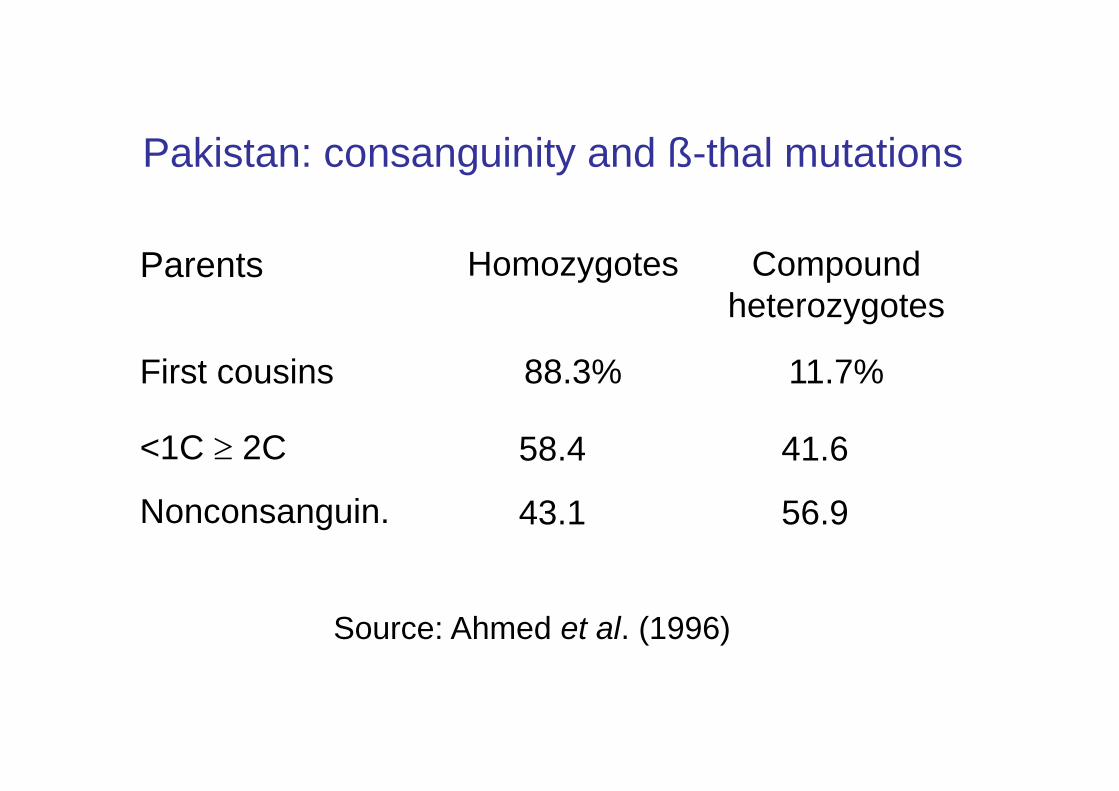
Pakistan: consanguinity and ß-thal mutations
56.9 43.1 Nonconsanguin.
41.6 58.4 <1C ≥ 2C
11.7% 88.3% First cousins
Compound heterozygotes
Homozygotes Parents
Source: Ahmed et al. (1996)

Multiple mutations encoding single gene defects in consanguineous kindreds
Metachromatic leucodystrophy: 5 mutations in Arab communities in a single geographical locality
Congenital nephrotic syndrome: 3 novel mutations in 12 affected children from a village established ~250 years ago by a single founder family
Familial Mediterranean Fever: 5 different FMF mutations in a single consanguineous family with 31 affected individuals
Sources: Heinisch et al. (1995); Frishberg et al. (2007); Medlej-Hashim et al. (2011)

Predicted health outcomes of consanguineous marriage: 3
When both spouses are carriers of the same recessive mutation, the more successful pregnancies they initiate the greater the probability that at least one affected child will be born.
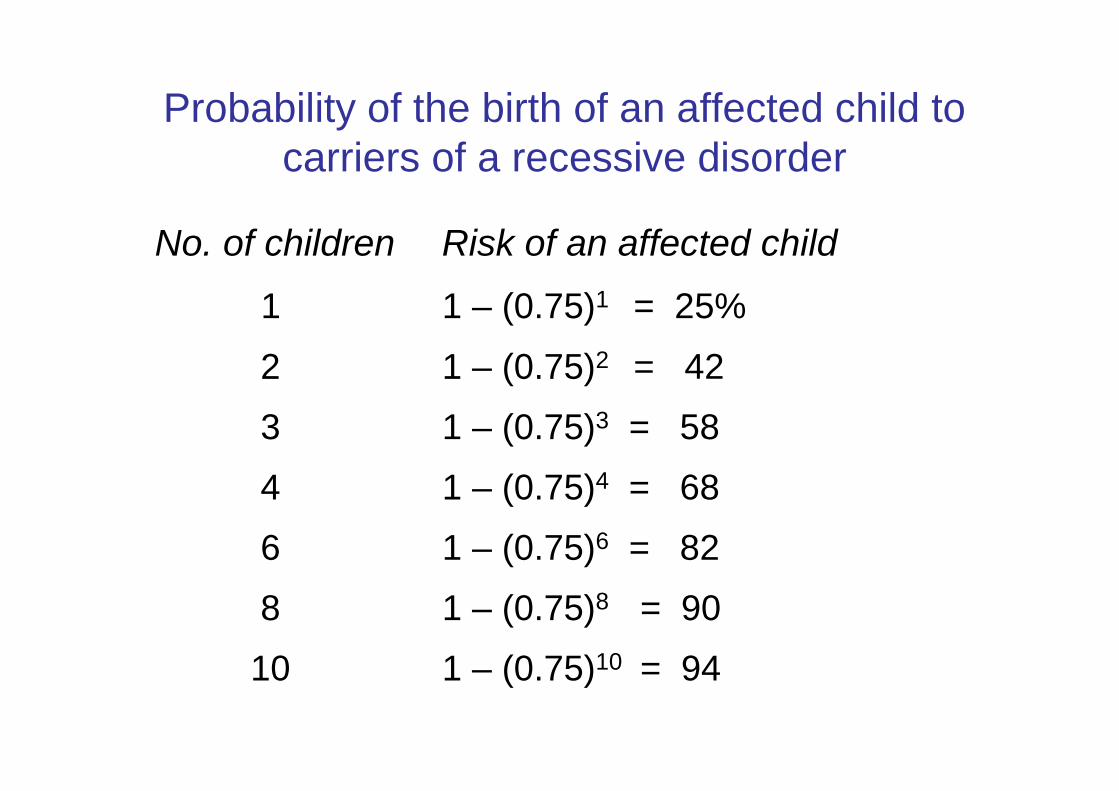
Probability of the birth of an affected child to carriers of a recessive disorder
No. of children Risk of an affected child
1 1 – (0.75)1 = 25%
2 1 – (0.75)2 = 42
3 1 – (0.75)3 = 58
4 1 – (0.75)4 = 68
6 1 – (0.75)6 = 82
8 1 – (0.75)8 = 90
10 1 – (0.75)10 = 94

Consanguineous marriage
1. Consanguinity in human history 2. Definition of a consanguineous marriage
and genetic implications 3. Why is consanguinity favoured, and by
whom? 4. What are the health outcomes? 5. What is the influence of non-genetic
variables and population stratification? 6. Consanguineous marriage in the future?
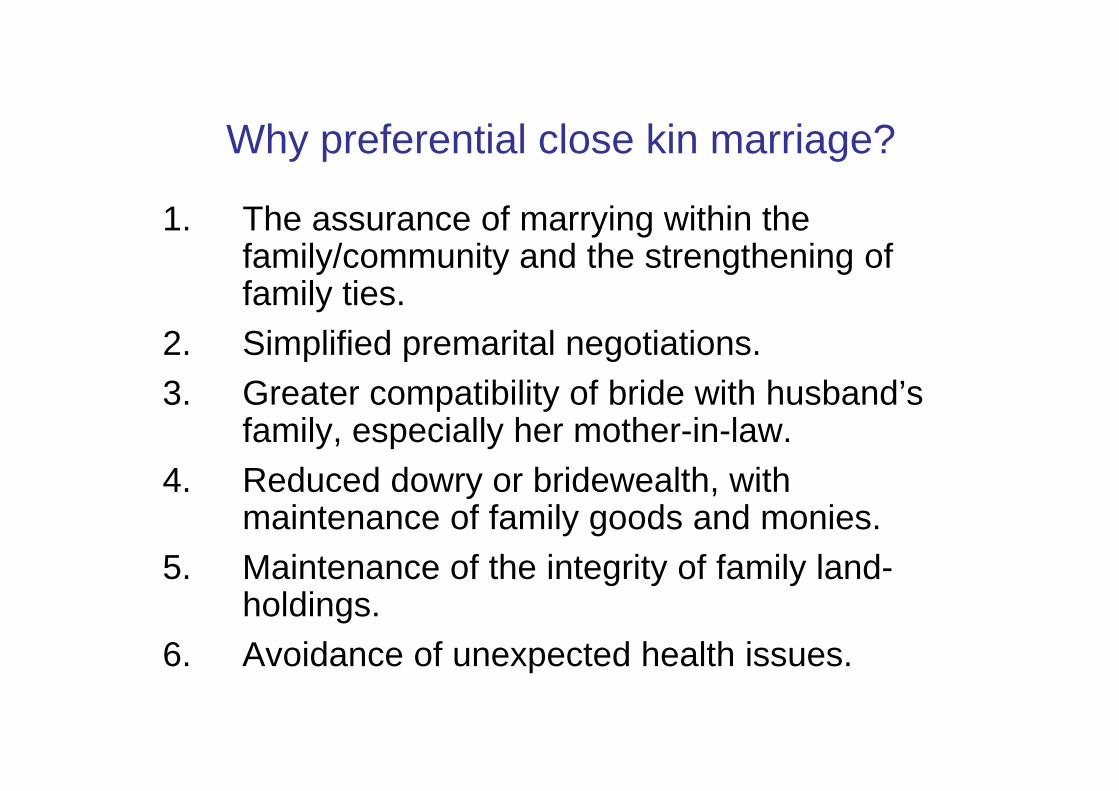
Why preferential close kin marriage?
1. The assurance of marrying within the family/community and the strengthening of family ties.
2. Simplified premarital negotiations. 3. Greater compatibility of bride with husband’s
family, especially her mother-in-law. 4. Reduced dowry or bridewealth, with
maintenance of family goods and monies. 5. Maintenance of the integrity of family land-
holdings. 6. Avoidance of unexpected health issues.
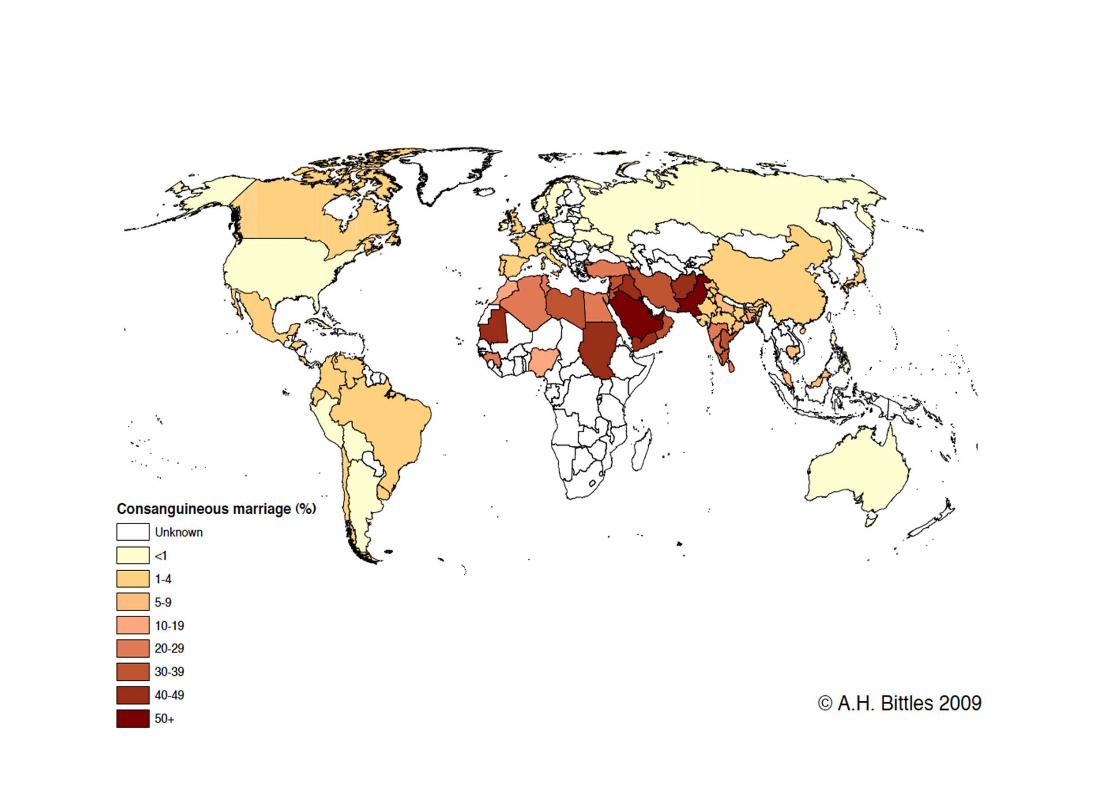

Global consanguineous marriage
Conservatively, 1,100+ million people live in countries where 20-50+% of marriages are consanguineous – predominantly first cousin unions. This equates to an estimated 10.2% of the current world population related as second cousins or closer.
Sources: Bittles (2008), Bittles & Black (2010); www.consang.net

Religious attitudes to consanguineous marriage
Parsi/Zoroastrianism
Judaism
Islam
Sikhism Hinduism (Dravidian)
Hinduism (Indo-European) Christianity (Protestant)
Christianity (RC/Orthodox) Buddhism
Restricted/proscribed Permissive

Civil legislation on first cousin marriage
Subject to civil or criminal prohibition in:
31 states of the USA Peoples Republic of China and Taiwan North and South Korea The Philippines

Consanguineous marriage
1. Consanguinity in human history 2. Definition of a consanguineous marriage
and genetic implications 3. Why is consanguinity favoured, and by
whom? 4. What are the health outcomes? 5. What is the influence of non-genetic
variables and population stratification? 6. Consanguineous marriage in the future?
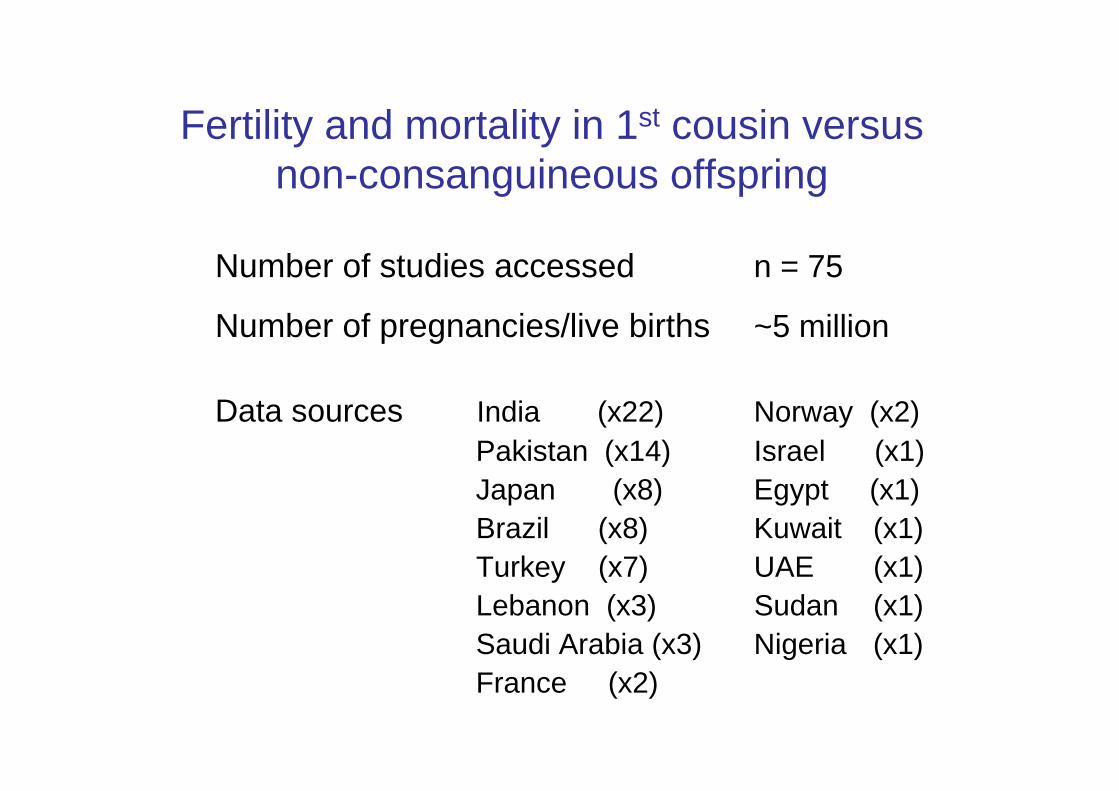
Fertility and mortality in 1st cousin versus non-consanguineous offspring
Number of studies accessed n = 75
Number of pregnancies/live births ~5 million Data sources India (x22) Norway (x2) Pakistan (x14) Israel (x1) Japan (x8) Egypt (x1) Brazil (x8) Kuwait (x1) Turkey (x7) UAE (x1) Lebanon (x3) Sudan (x1) Saudi Arabia (x3) Nigeria (x1) France (x2)
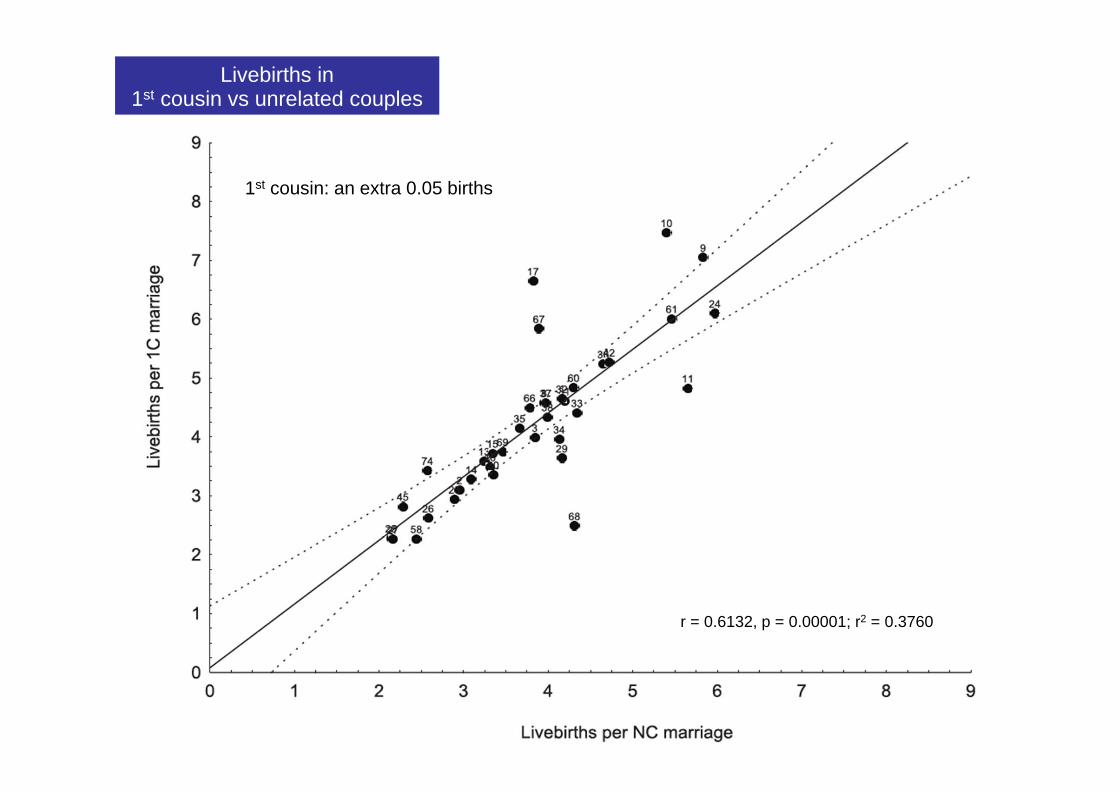
Livebirths in 1st cousin vs unrelated couples
1st cousin: an extra 0.05 births
r = 0.6132, p = 0.00001; r2 = 0.3760
Prenatal losses: 1st cousin vs non-consanguineous pregnancies
Significantly higher levels of prenatal losses reported in 11/29 studies conducted in 19 countries.
No evidence of aberrant sex ratios at birth.
Source: Bittles (2012)

Stillbirths in 1st cousin vs unrelated progeny
1st cousin: an excess 5/1000 stillbirths
r = 0.7625, p = 0.0000; r2 = 0.5814

Infant mortality in 1st cousin vs unrelated progeny
1st cousin: excess12.5/1000 births
r = 0.8678, p = 0.0000; r2 = 0.7531

Prereproductive deaths in 1st cousin vs unrelated progeny
1st cousin: an excess 37/1000 pregnancies/births
r = 0.9173, p = 0.0000; r2 = 0.8415
Congenital defects: 1st cousin vs non-consanguineous progeny
17/17 studies conducted in 7 countries showed an excess of defects in first cousin progeny
Mean excess in 1C progeny = 41/1000 Median excess in 1C progeny = 33/1000 Range: 3/1000 to 100/1000
Source: Bittles (2012)

Congenital defects: 1st cousin vs non-consanguineous progeny
Diagnostic definition of a major congenital defect? Control for socioeconomic status? Maternal nutrition/medication? Transplacental infections?

Neural tube defects: consanguineous vs non-consanguineous progeny
17 studies conducted in 12 countries Significantly higher levels of neural tube
defects among 1C progeny in 15/17 studies
Control for: diet? socioeconomic status? pre-conceptual folate?
Source: Bittles (2012)

Oral and facial clefts: consanguineous vs non-consanguineous progeny
15 studies conducted in 10 countries Significantly higher levels of OFC among 1C
progeny in 8/15 studies
Control for maternal anticonvulsant medication?
Source: Bittles (2012)

Congenital heart defects: consanguineous vs non-consanguineous progeny
18 studies conducted in 8 countries Age range of subjects, 1 week to 35 years Differential between subjects with normal
karyotypes and those with Down syndrome and other chromosomal anomalies?
Discussion of disease severity?

Congenital heart defects: consanguineous vs non-consanguineous progeny
In most studies the rates of congenital heart defects cited is 4-8/1,000.
Yet in Israeli studies, 53/1,000 of births were diagnosed with ventriculoseptal defects alone, 89% of which spontaneously closed.
How common are CHD in neonates?
Sources: Roguin et al. (1995); Du et al. (1996); Pierpont et al. (2007)

Consanguinity and the reported prevalence of major congenital anomalies
ECLAMC: n = 34,102 with 47 defects studied
Significant excess of hydrocephalus, postaxial polydactyly, bilateral oral and facial clefts only
Source: Rittler et al. (2001)

Consanguinity and disorders of adulthood
Disorders included cardiovascular disease, stroke, diabetes, cancers, ulcers, behavioural and psychiatric disorders.
Overall +ve association in 9/15 studies Limited or no control for non-genetic
variables, e.g. age, sex, smoking, obesity.
Source: Bittles (2012)
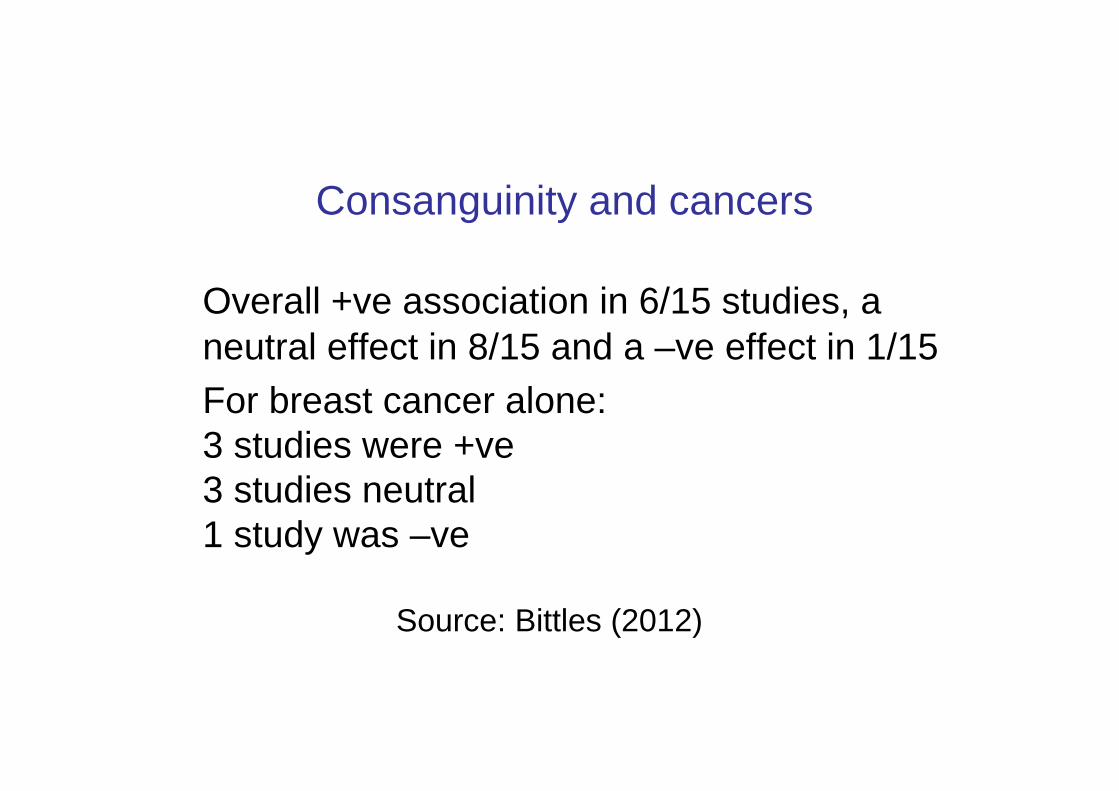
Consanguinity and cancers
Overall +ve association in 6/15 studies, a neutral effect in 8/15 and a –ve effect in 1/15
For breast cancer alone: 3 studies were +ve 3 studies neutral 1 study was –ve
Source: Bittles (2012)

Consanguineous marriage
1. Consanguinity in human history 2. Definition of a consanguineous marriage
and genetic implications 3. Why is consanguinity favoured, and by
whom? 4. What are the health outcomes? 5. What is the influence of non-genetic
variables, and population stratification? 6. Consanguineous marriage in the future?

Sociodemographic variables in consanguineous marriage
1. Socioeconomic status 2. Rural/urban residence 3. Maternal literacy 4. Younger parental age at marriage and first
birth 5. Lower contraceptive usage 6. Longer reproductive span

Consanguinity, income and infant mortality
Country Infant deaths (per 1,000)
Consanguinity (%)
Per capita income, US$
Qatar 8 44.5 179,000 Oman 12 35.9 24,530 Saudi Arabia
18 40.6 24,020
Lebanon 21 35.5 13,400 Jordan 23 39.7 5,730 Yemen 51 33.9 2,330
Source: Bittles (2012)


India: population stratification and endogamy
Total population 1,149 million
15 major languages
7 religions with > 1 million followers
~ 3,000 castes + sub-castes ~ 1,050 scheduled castes (dalits) ~ 580 scheduled tribes
Source: Bhasin et al. (1992), Gadgil et al. (1998),
Bittles (2002), PRB (2008)

Abbad tribe - Jordan
120,000 individuals
76 male lineages, each 250 – 2,000 individuals 90% of all marriages intra-tribal 32% within-group (F = 0.0146)
47% within-lineage (F = 0.0216)
Source: Nabulsi (1995)

Oman: tribal endogamy and genetic disease
185 tribes but ~ 700 tribes/sub-tribes
Sickle cell disease <40% of tribes affected >50% of cases from 24 tribes
β-thalassaemia 10% of tribes affected >50% of cases from 1 tribe
Source: Rajab and Patton (1997, 1999)
Consanguineous marriage
1. Consanguinity in human history 2. Definition of a consanguineous marriage
and genetic implications 3. Why is consanguinity favoured, and by
whom? 4. What are the health outcomes? 5. What is the influence of non-genetic
variables and population stratification? 6. Consanguineous marriage in the future?

Lifestyle
Endogamy Socioeconomic status
Cultural beliefs
Consanguinity
Contemporary populations

Consanguinity - changing times, changing circumstances, changing values
1. Legal considerations, e.g. UN Declaration of Human Rights (1948) European Convention on Human Rights (1953) UNESCO Universal Declaration on the
Genome and Human Rights (1997) 2. Sociodemographic realities: decreasing family sizes with fewer cousins to
marry; wider marriage pools through education later female age at marriage

Social Biological Pre-Industrial
Industrial Biological Social
Social benefits of consanguinity
vs Biological disadvantages of consanguinity

Consanguinity and health
‘No-one, I think, with a previously unbiased mind, can read the numerous examples which are cited to prove as the result of such unions sterility, deaf-mutism, idiocy and other characteristics of degeneracy, without coming to the conclusion that the cases from which they argue are selected ones, and that the cause they advocate is damaged by special pleading where there should have been judicial deliberation’.
Source: Dr John Langdon Down (1866)
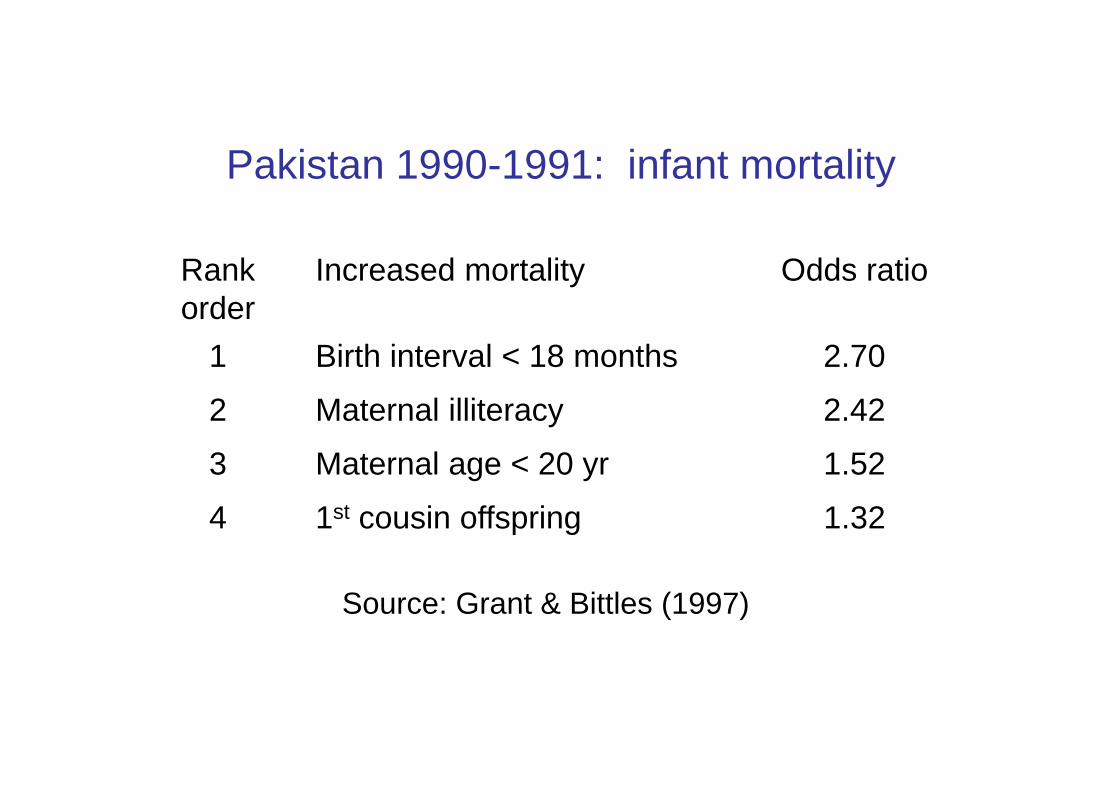
Pakistan 1990-1991: infant mortality
Rank order
Increased mortality Odds ratio
1 Birth interval < 18 months 2.70
2 Maternal illiteracy 2.42
3 Maternal age < 20 yr 1.52
4 1st cousin offspring 1.32
Source: Grant & Bittles (1997)

Pakistan 1990-1991: mortality 2-5 yr.
Rank order
Increased mortality Odds ratio
1 Maternal illiteracy 5.31
2 Birth interval < 18 months 1.83
3 Maternal age < 20 yr 1.56
4 Male sex 1.48
Source: Grant & Bittles (1997)