consistently estimating route choice models using indirect - diva
TRANSCRIPT

Tongzhou Bai
Supervisors Anders Karlstroumlm Marcus Sundberg
Division of Transport and Location Analysis
Department of Transport Science
KTH Royal Institute of Technology Stockholm
Summer 2011
TSC-MT 11-016
Master of Science Thesis
Consistently Estimating Route
Choice Models using Indirect
Inference Based on Empirical
Observation Data
2
Abstract
In the thesis a proposed route choice model is tested on the empirical observation data
The model gives link specific errors to the links in the network which allows natural
correlation structure among paths Indirect inference method is used to consistently
estimate the route choice model and a logit model is chosen to be the auxiliary model
The observation data with multiple OD pairs was collected in the Borlaumlnge a city located
in the middle part of Sweden Two main experiments are carried out one with only one
attribute length to be specific in the route choice model and the other with two attributes
namely length and speed bump dummy The final estimates of parameters have positive
signs as anticipated and the magnitudes are reasonable In addition judging from the
estimated binding functions parameters in the cost function have negative effect on
utility in the logti model and the parameter in the logit model are more apparently
affected by its indirectly inferred parameter in the route choice model than the others do
Some other trials of the model are also carried out but the estimates are not satisfying
This may be due to lack of attributes in the route choice model and further suggestion on
better defined model is given out A Monte Carlo experiment is also carried out to test
the efficiency of model with unfixed scale parameter to the random term in the route
choice model
Acknowledgement
I would like to show my sincere gratitude to my supervisor Anders Karlstroumlm who has
been giving patient instructions and brilliant ideas during the past few months on how the
thesis moves on Without all these I couldnrsquot have finished it in time with fine quality
My work is basically started from the work dedicated by Vivian who helped me a lot in
getting familiar with relevant theories Marcus paid attention to my work intently and
gave inspiring advices on possible modifications of the model In addition Per guided me
a lot in using C I would like to thank these colleagues for their useful help
Of course my thanks go to all that are in the office of TLA who contribute to the
wonderful atmosphere where I worked happily on my thesis
3
Contents Abstract 2
Acknowledgement 2
List of Figures 5
List of Tables 6
1 Introduction 7
11 Motivation 7
12 Background 7
13 Objective 8
14 Scope of the Thesis 9
2 Literature Review11
3 Methodology 18
31 Multinomial Logit Model (MNL) 18
311 Model Description 18
312 Model Estimation 21
32 Dijkstrarsquos Algorithm 22
321 Introduction 22
322 Algorithm 23
323 Explanatory Example 24
324 Discussion 26
33 Indirect Inference 26
331 Introduction 26
332 Definition of the method 27
333 Choices of the metrics 29
334 Consistency Interpretation 30
34 Model Specification in the Thesis 30
341 Basic Route Choice Model 30
342 Auxiliary Model 33
343 Consistency Discussion 35
344 Binding Function 37
4 Data 39
41 Road Network 39
42 Observation Data 42
43 Further Exploration of data 44
4
5 Experiment Design 46
6 Results 49
61 Validation of Binding Function 49
62 Estimation of model with one attribute 51
63 Estimation of model with two attributes 52
64 Estimations of other trial formulations of the model 58
641 Model with exponential form of cost function 58
642 Model with estimated scale parameter for random term 62
643 Monte Carlo evidence of model with estimated scale parameter for random term 66
7 Conclusions 71
Bibliography 73
5
List of Figures
Figure 1 S-shaped relationship between probability and deterministic part of utility 20
Figure 2 A simple network for Dijstrrarsquoa Algorithm explanation 24
Figure 3 Illustration of the Borlaumlnge road network 39
Figure 4 Histogram of link length data 40
Figure 5 Histogram of link length data (zoomed within 1km) 41
Figure 6 Illustration of links with speed bumps 41
Figure 7 Histogram of link numbers in observations data set 43
Figure 8 Illustration of the flow in the experiment 46
Figure 9 Scatter plots of the 90 beta-theta pairs 49
Figure 10 OLS regression based on the 10 beta-theta points from one run 50
Figure 11 Scatter plot of the input values for beta_length and beta_sb 53
Figure 12 Scatter plot of theta_length with regard to beta_length and beta_sb 54
Figure 13 Display of the estimated binding function for theta_length 54
Figure 14 Scatter plot of theta_sb with regard to beta_length and beta_sb 55
Figure 15 Display of the estimated binding function for theta_sb 55
Figure 16 Scatter plots of theta_sb against beta_sb and beta_length 57
Figure 17 Scatter plot of theta_length against beta_length and beta_sb estimated binding
function 59
Figure 18 Scatter plot of theta_sb against beta_length and beta_sb estimated binding
function 60
Figure 19 Scatter plot of theta_ln against beta_length and beta_sb estimated binding
function 60
Figure 20 Plots of theta_length against beta_length beta_sb and sigma respectively 63
Figure 21 Plots of theta_sb against beta_length beta_sb and sigma respectively 64
Figure 22 Plots of theta_ln against beta_length beta_sb and sigma respectively 65
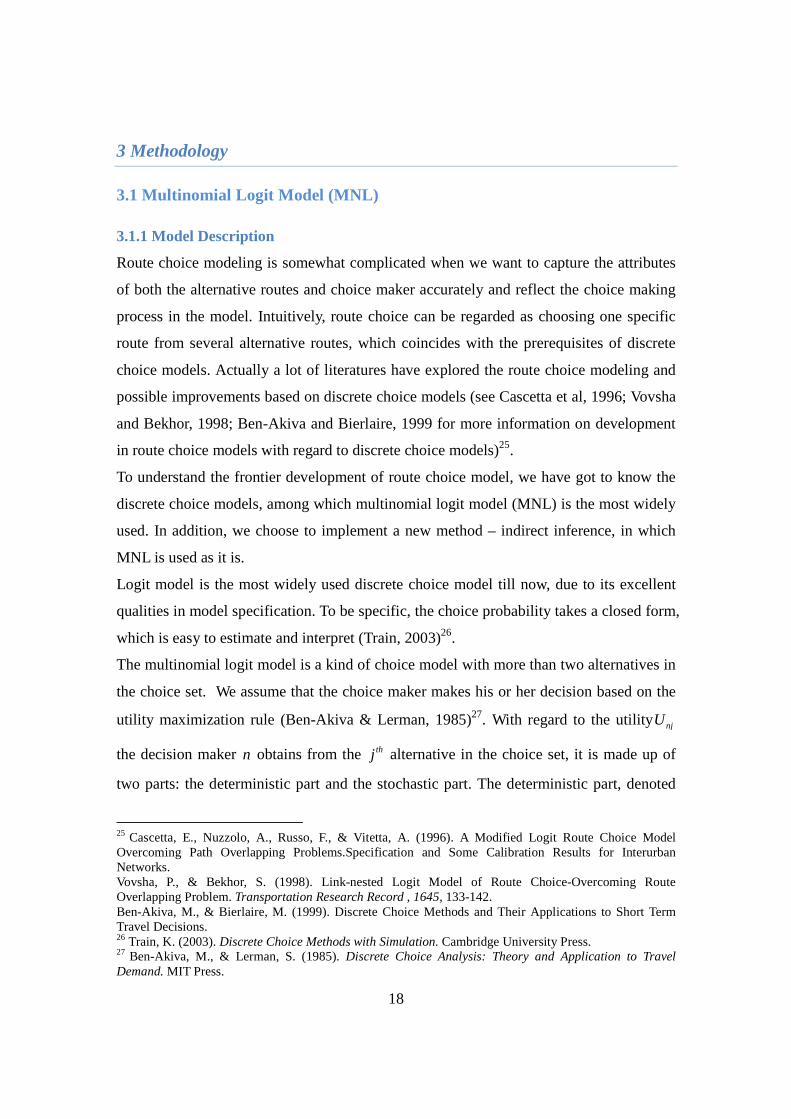
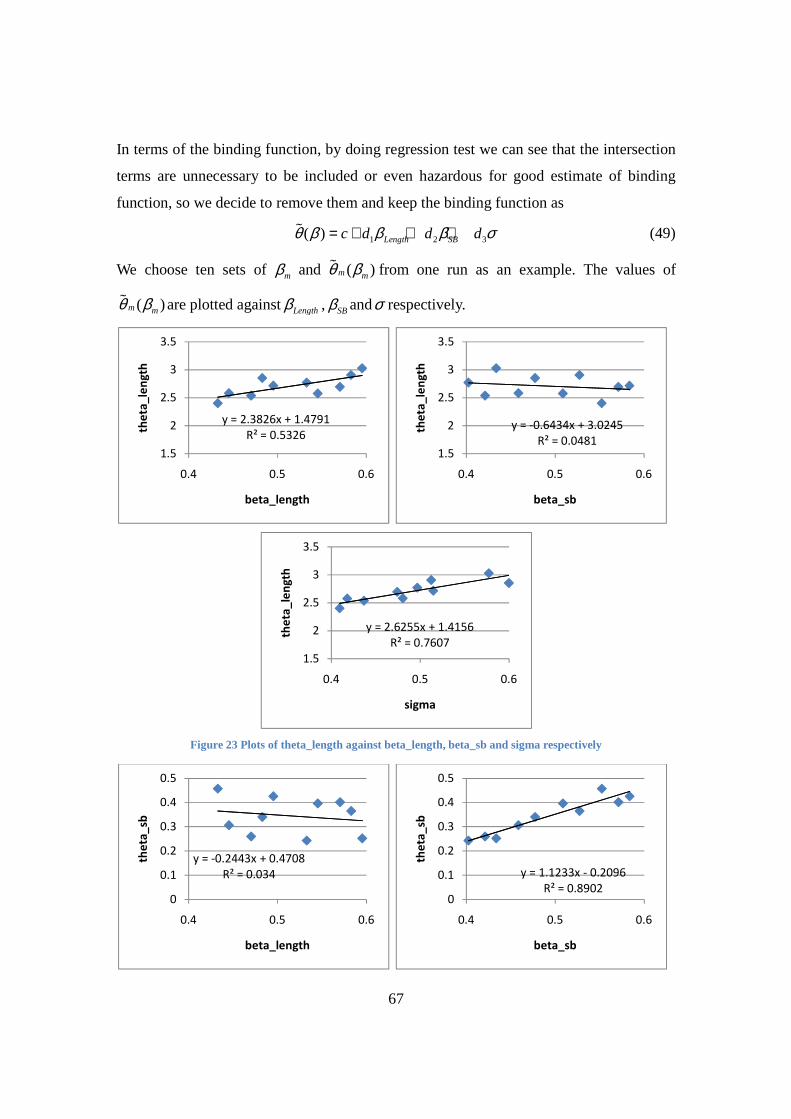
Figure 23 Plots of theta_length against beta_length beta_sb and sigma respectively 67
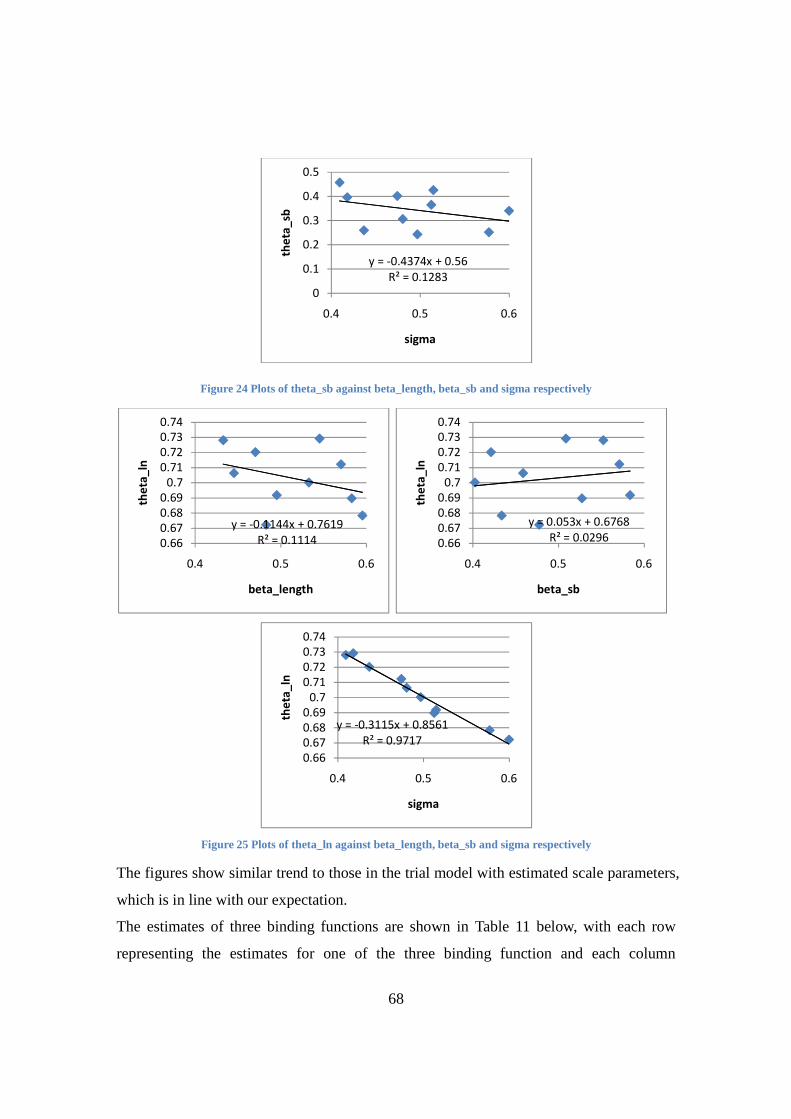
Figure 24 Plots of theta_sb against beta_length beta_sb and sigma respectively 68
Figure 25 Plots of theta_ln against beta_length beta_sb and sigma respectively 68
6
List of Tables
Table 1 Descriptive statistics of link length 40
Table 2 Descriptive statistics of link numbers in observation data set 43
Table 3 Descriptive statistics of estimated travel time on links 44
Table 4 Descriptive statistics of duration of trips 45
Table 5 Statistics of estimation of beta_length 51
Table 6 Estimated coefficients of binding function for model with two attributes 56
Table 7 Statistics of estimation of beta_length and beta_sb 56
Table 8 Estimated coefficients of binding functions for model with exponential cost
function 61
Table 9 Statistics of estimation of beta_length and beta_sb in exponential-cost-function
model 61
Table 10 Estimates of three binding functions 65
Table 11 Estimates of three binding functions in the Monte Carlo experiment 69
Table 12 Statistics of estimation of beta_length beta_sb and sigma in the Monte Carlo
experiment 69
7
1 Introduction
11 Motivation
With the development of ITS there is a stronger desire for more accurate and efficient
vehicle orientation systems and devices which relies much on the mechanism of route
choice models In other cases well estimated route choice models reveals travel behavior
of the car drivers which contributes to system-scaled analysis such as design and
appraisal of road pricing system across the road network On the other hand newly
developed GIS techniques provide sufficient route choice data as solid basement for
research on route choice behaviors Both the desire for better developed model and more
available prerequisites stimulate the research on route choice modeling
12 Background
Route choice modeling has been discussed for a long time Given a basement network
composed by a finite number of nodes which are connected by directed links we assume
that individuals travel from an origin node to a destination node in the network Thus the
choice of an individual turns out to be an observed path represented by a sequence of
links considering inherent attributes of links such as length or presence of speed bumps
From this point of view individuals make discrete choices the behavioral mechanism of
which could be seen in two different ways Individuals could either be seen as choosing
links from each junction node or choosing from possible paths connecting the origin node
and the destination one In line with a great body of literatures we focus on the path-
based approaches to develop our model
There are two important issues that need to be considered for this kind of approach
namely the generation of choice set and model formulation to address alternative
correlation due to path overlapping To be specific when we assume that individuals
choose from paths connecting the origin and destination it is infeasible to enumerate the
full-size choice set or universal choice set which includes all possible paths between the
OD pair in a given road network Individuals may not virtually consider the universal
choice set when they make decisions and in practice algorithms implemented to find the
shortest paths avoid the usage of choice set at all such as the Dijkstrarsquos algorithm we
implement in the model Hence we give each individual the right to consider all possible
8
paths It is common practice to generate samples from the universal choice set yet this
may easily introduce biases to the estimation Samples are supposed to be randomly
drawn from the population and good samples can reproduce the features in the population
Since in real-size network it is impossible to know the full-size choice set let alone to
reproduce the features of it We could only draw from certain known paths and this is
more like an importance sampling which gives links different possibilities to the drawn
into paths As a result estimation based on the sampled paths will have biases
The other problem with regard to path-based approaches is the inherent limitation of
multinomial logit model (MNL) which requires no correlation among alternatives This
is practically unrealistic since in the context of route choice modeling paths sharing
certain links are correlated due to unobserved features of the common links Numerous
literatures contribute to improvement in terms of the problem based on logit models
We choose to use an approach with additive link specific errors which belongs to probit-
like models This kind of model is efficient for applications yet it is still not able to be
estimated consistently given a partial choice set So we turn to indirect inference as the
tool to estimate the probit-like model with additive link specific errors All feasible paths
for each individual are technically allowed which means that a universal choice set is
provided for each OD pair to avoid bias caused by sampling from full choice sets The
universal choice set generated here is a so-called pseudo-universal choice set which
contains as many feasible paths as desired to eliminate possible biases but not all paths
since it is practically impossible to get the true universal choice set We choose to use an
MNL model as the auxiliary model which is easy to estimate The estimate of MNL
model is biased based on the choice set we generate as discussed above yet the estimate
of parameters in the basic route choice model will be consistent thanks to the features of
the indirect inference method
13 Objective
A Monte Carlo simulation experiment has been carried out based on synthetic trip data
and real-sized road network to appraise the proposed model (See Karlstroumlm Sundberg amp
9
Wang 2011)1 The basic route choice model includes two attributes namely length and
speed bump dummy while an MNL model is chosen as the auxiliary model with the
same two attributes Simulated trip data given two pseudo-true values for coefficients of
length and speed bump dummy are used as a substitution of the empirical data The
presence of speed bumps is randomly allocated over the network Estimation results and
sensitivity test confirm the efficiency and consistency of the proposed estimator
What needs to be done in the thesis is that true trip data should be implemented as well as
the modification of the network To be specific realistic speed bump distribution is used
to replace the randomly allocated one Without knowing the true values of the
coefficients several iterations need to be carried out to get to know the raw domain of the
values and by shrinking input intervals more accurate estimates will be attained as the
accomplishment of the thesis
14 Scope of the Thesis
Based on the route choice model used in the synthetic experiment extensions are done in
five main aspects First we implement the newly proposed estimator in real world issues
by replacing the simulated observations with the true observations collected in a real
world network Unlike the simulated data which is generated following certain
assumptions the true observations have more noises inside and thus more difficult to
capture their features Second the observations we use contain many OD pairs and not
restricted with one or four of them as in the synthetic experiment this gets rid of the
possibility of bias caused by restricted OD pairs Third since we are implementing the
new method in true observations the formulation of route choice model cost function to
be specific is not known beforehand and correspondingly the formulation of the utility
function in the logit model is not for sure as well We need several trials to get well
defined formulations to capture the features of the data Fourth we have no idea what the
parameters are like based on true observation and thus a raw guess of input domain is
needed at first and centered with shrinkage in later iterations Last but not least in one
trial we included a scale parameter to the random term in the cost function and use
number of links in the auxiliary model to infer it To test the efficiency of this trial a
1 Karlstroumlm A Sundberg M amp Wang Q (2011) Consistently estimating flexible route choice models using an MNL lense International Choice Modeling Conference Leeds
10
Monte Carlo simulation experiment is carried out with some arbitrary pseudo-true values
of the parameters based on which simulated observations are used
On the other hand what is done in the synthetic experiment such as test with simulated
observations for one OD and four ODs sensitivity of estimates with choice set size and
number of observations is not included in this thesis Instead we will identify some
limitations of the model formulation tried in the thesis and make suggestions how the
model can be improved
As follows Section 2 reviews relevant literatures on route choice modeling as well as
indirect inference In Section 3 relevant methods are introduced in detail as backgrounds
afterwards methods and models used in this thesis are illustrated Section 4 gives
description of the empirical data we use for estimating and Section 5 shows the
estimation results of the Monte Carlo simulation-based experiment followed by some
conclusions in Section 6
11
2 Literature Review
Route choice modeling has long been discussed and many efforts have been made to
solve this problem Simple and easy to estimate the multinomial logit model (MNL) is
widely used in choice modeling yet it has certain restrictions to be implemented in route
choice context Due to its inherent property of Independence from Irrelevant Alternatives
(IIA) the multinomial logit model is not easily applicable since routes in the choice set
tend to be correlated with the presence of overlapping paths Cascetta et al (1996)
proposed a correction term called Commonality Factor (CF) in the deterministic part of
the utility function2 And the probability of path i to be chosen from the choice set nC
becomes( )
( )( | )in in
jn jn
n
V CF
n V CF
j C
eP i C
e
micro
micro
minus
minus
isin
=sum
As proposed by Cascetta et al the Commonality
Factor is specified as ln ( )n
ijin CF
j C i j
LCF
L Lγβ
isin
= sum in which ijL is the length of links
common to path i and pathj while iL and jL are the total length of path i and pathj
respectively The parameter γ is left to be estimated or practically constrained to a fixed
value like 1 or 2 The CF term of one path is proportional to the length of overlapping
part with other paths This proposed model is referred to as C-Logit model Bearing some
similarities Ben-Akiva and Bierlaire (1999) proposed the Path Size Logit (PSL) model3
This model is based on a different theoretical basis as the C-Logit The original
formulation of Path Size (PS) comes from the discrete choice theory of aggregate
alternatives Similar to the CF in C-Logit the log of Path Size (PS) is added to the utility
function The probability of path i to be chosen from the choice set nC becomes
( ln )
( ln )( | )in in
jn jn
n
V PS
n V PS
j C
eP i C
e
micro
micro
+
+
isin
=sum
The Path Size is specified as
1
i n
n
ain
a Ciaj
j C j
lPS
LL
LδisinΓ
isin
= sumsum
in
2 Cascetta E Nuzzolo A Russo F amp Vitetta A (1996) A Modified Logit Route Choice Model Overcoming Path Overlapping ProblemsSpecification and Some Calibration Results for Interurban Networks In J Lesort (Ed) the 13th International Symposium on Transportation and Traffic Theory Lyon France 3 Ben-Akiva M amp Bierlaire M (1999) Discrete Choice Methods and Their Applications to Short Term Travel Decisions In Chapter for the Transport Science Handbook Preliminary Draft
12
which iΓ is the set of links in pathi al and iL are the length of link a and pathi
respectively ajδ is the link incidence variable with value of 1 when link abelongs to path
j and zero otherwise And nCL is the shortest path in choice setnC The size of a path has
a maximum value of one when it shares no links with other paths
C-Logit model and PSL model are the most widely used models in practice of route
choice modeling due to their simple forms Since both of them originate from the MNL
model and maintain the basic MNL structure they can be estimated by existing software
designed for logit models Apart from these two types of models there are other recent
efforts in the route choice context
Bekhor Ben-Akiva and Ramming (2002) adapted the Logit Kernel model to apply in a
route choice context4 The Logit Kernel5 model was proposed by combing Gaussian and
Type I Extreme Value error terms by researchers such as Ben-Akiva and Bolduc (1996)
and McFadden and Train (2000) who also referred to it as Mixed Logit6 By making
certain assumptions under route choice context Bekhor Ben-Akiva and Ramming (2002)
proposed a way to apply the model to route choice modeling7 Based on the data from
Boston several kinds of models are estimated including multinomial logit model Path
Size Logit and the newly proposed Logit Kernel model Seen from the estimation results
Logit Kernel has a better overall performance than the other two kinds of models This
result needs to be verified in other data sets since the one used in the paper has a
relatively small size
Frejinger and Bierlaire (2007) proposed an approach to capture correlation among
alternative routes with subnetworks and carried out estimation based on several kinds of
route choice models8 The paper gives an overview of the latest development of route
choice modeling and discusses the Path Size Logit model in detail As part of the
4 Bekhor S Ben-Akiva M amp Ramming M (2002) Adaptation of Logit Kernel to Route Choice Situation Transportation Research Board of the National Academics 1805 78-85 5 Ben-Akiva M amp Bolduc D (1996) Multinomial Probit with a Logit Kernel and a General Parametric Specification of the Covariance Structure Working Paper 6 McFadden D amp Train K (2000) Mixed MNL Models for Discrete Response Journal of Applied Econometrics 7 Bekhor S Ben-Akiva M amp Ramming M (2002) Adaptation of Logit Kernel to Route Choice Situation 8 Frejinger E amp Bierlaire M (2007) Capturing Correlation with Subnetworks in Route Choice Models Transportation Research Part B 41 363-378
13
conclusion a behavioral interpretation of the Path Size in the model is given The
subnetwork is defined so that the alternative routes sharing the same section of it are
seen as correlated This correlation is captured using the Error Component model and
estimation results show that this new approach gives better property than PSL models To
complement the paper uses a real size network and true travel data is collected which is
the same network we are going to use in this thesis project Additionally the paper
displays forecasting results which indicates that models with Path Size component tend
to have bad performance in prediction
Ben-Akiva and Bierlaire (2003) pointed out that under route choice context the
significant correlation among alternatives due to path overlapping and the generation of
choice set are two important issues and main difficulties9
There are some algorithms used in practice for generating choice set for route choice
modeling both deterministic methods and stochastic ones The deterministic methods
tend to give the same set of paths for a given OD pair Some examples are the link
penalty algorithm (De La Barra Peacuterez amp Anez 1993) which increases gradually the
impedance of all the links on the shortest path10 the link elimination algorithm (Azevedo
Costa Madeira amp Martins 1993) which removes links on the shortest path in sequence
to generate new paths11 and the labeled paths (Ben-Akiva Bergman Daly amp
Ramaswamy 1984)12 In terms of the stochastic methods they tend to produce individual
specific choice set One example is the simulation method (Ramming 2001) which
generates alternative paths by drawing link impedances from different distribution
densities13
When it comes to appraisal of the generated choice set some literatures give evaluations
on the efficiency of different sampling algorithms for choice set generation (See Bekhor
9 Ben-Akiva M amp Bierlaire M (2003) Discrete Choice Models with Applications to Departure Time and Route Choice In Handbook of Transportation Science (second ed) Kluwer 10 De La Barra T Peacuterez B amp Anez J (1993) Multidimensional Path Search and Assignment 21st PTRC Summer Meeting (pp 307-319) 11 Azevedo J Costa M Madeira J amp Martins E (1993) An Algorithm for the Ranking of Shortest Paths European Journal of Operational Research 69 (1) 97-106 12 Ben-Akiva M Bergman M Daly A amp Ramaswamy R (1984) Modeling Inter Urban Route Choice Behaviour In J Vollmuller amp R Hamerslag (Ed) the 9th International Symposium on Transportation and Traffic Theory (pp 299-330) Utrecht Netherlands VNU Science Press 13 Ramming M (2001) Network Knowledge and Route Choice PhD Thesis Massachusetts Institute of Technology
14
Ben-Akiva amp Ramming 2006 for example) Apart from this there are some recently
proposed methods for sampling alternatives under route choice context (See Frejinger
Bierlaire amp Ben-Akiva 2009 for example)
Nerella and Bhat (2004) carried out a numerical analysis on the effect of sample size on
the efficiency of the estimation of parameters14 The analysis is done for two kinds of
discrete choice models namely the multinomial logit model for which consistency of
estimation based on subset of alternatives is theoretically proved and non-MNL model
taking mixed multinomial logit model as an example Four evaluation criteria are chosen
namely the ability to recover model parameters ability to estimate overall log-likelihood
function value ability to estimate individual choice probabilities and ability to estimate
aggregate shares of alternatives The results show that the MNL model works well on
small sample size yet certain portion of full choice set need to be kept as a practical
baseline For the non-MNL model small sample size gives poor estimation and increase
of sample size gives obvious increase of estimation quality Certain portion of full choice
set is suggested for practical convenience yet the generalization of sample size portion is
not feasible since difference kinds of models may require different portion to guarantee
accuracy In general for the non-MNL models full choice set is suggested to be used if
feasible and larger sample gives better estimation
Bekhor Ben-Akiva and Ramming (2006) carried out route choice modeling based on a
large-scale urban network including both choice set generation part and route choice
estimation part which compose the process of route choice modeling together15 Given
that previous literatures did not pay too much attention to empirical estimation the paper
used a true observation data set collected in Boston As the first step several choice set
generation algorithms are listed and compared in their efficiency of reproducing the
observed paths on which the evaluation of the algorithms are based The data in Boston
is described in the paper and used in the second step ie model estimation Several route
choice models are presented and estimation results based on different kinds of models are
shown for comparison of the efficiency of the models The Path Size Logit model is
14 Nerella S amp Bhat C (2004) Numerical Analysis of Effect of Sampling of Alternatives in Discrete Choice Models Transportation Research Record 1894 11-19 15 Bekhor S Ben-Akiva M amp Ramming M (2006) Evaluation of Choice Set Generation Algorithms for Route Choice Models Annals of Operations Research 114 (1) 235-247
15
proposed for its property to overcoming the drawbacks of the conventional MNL models
This type of model can be easily estimated using popularized software The main
conclusion is that route choice models could be estimated for large-scale networks based
on the true observation data and prominent computing resources
Frejinger Bierlaire and Ben-Akiva (2009) proposed a paradigm for choice set generation
based on sampling for route choice modeling16 In the context of route choice modeling
the universal choice set which denotes all possible alternatives for a traveler to choose
from is not able to be enumerated So we practically work on a sampled choice set from
the universal one which may easily introduce bias to the final estimate In this paradigm
they focus on unbiased estimation of parameters instead of generating actual choice set
The path generation is seen as an importance sampling approach and a correction of
sampling is added to the path utility Since the following estimation process is based on
the sampled choice set which is treated as the universal one a correction for sampling is
added to the path size attribute in the commonly used path size logit (PSL) model ending
up with the expanded path size Modification in the previous two steps guarantees
unbiased estimation of the parameters Numerical results based on synthetic data are
presented in the paper to reveal that models with a sampling correction in the path utility
are better than those without it The proposed expanded path size logit model provides
unbiased estimation and is better than the original path size models
In this paper we will examine indirect inference Indirect inference is not a new method
it was first introduced by Smith (1990 1993)17 Then Gourieacuteroux et al (1993) gave
overall introduction to the methods and extended it in important ways18 Gallant and
McCulloch (2004) transferred the idea of indirect inference and used it for Bayesian
inference in models where likelihood function is intractable19
16 Frejinger E Bierlaire M amp Ben-Akiva M (2009) Sampling of Alternatives for Route Choice Modeling Transportation Research Part B Methodological 43 (10) 984-994 17 Smith A (1990) Three Essays on the Solution and Estimation of Dynamic Macroeconomic Models PhD Dissertation Duke University Smith A (1993) Estimating Nonlinear Time-series Models Using Simulated Vector Autoregressions Journal of Applied Econometrics 8 63-84 18 Gourieacuteroux C Monfort A amp Renault E (1993) Indirect Inference Journal of Applied Econometrics 8 85-118 19 Gallant A amp McCulloch R (2004) On the Determination of General Scientific Models Manuscript Duke University
16
Gourieacuteroux Monfort and Renault (1993) proposed the inference methods based on an
ldquoincorrectrdquo criterion which does not give consistent estimation to parameters of interest
directly20 The argument of the criterion is called the auxiliary parameter which may
have a larger dimension than the parameters of interest in the basic model After the
auxiliary parameters are selected a simulation-based process is carried out to get a
consistent and asymptotically normal estimator of parameters of interest As a simulation-
based method the only requirement for the basic model is that it could be simulated
regardless of formulations of the model So it could be used for estimating models which
are too complex to carry out direct approaches The paper shows how this kind of method
can be applied in fields such as micro-econometrics macro-econometrics and
econometrics of finance
Keane and Smith (2003) proposed a generalized form of the indirect inference method to
be implemented in the discrete choice model context21 Theoretically indirect inference
could deal with estimation of any economic models yet it has some limitations per se that
decrease the estimation efficiency or even make it difficult to implement Problems arise
when we use indirect inference in estimating discrete choice models since the objective
function the metric of distance between the auxiliary models estimated on observed data
and simulated data to be specific is inherently discrete which leaves the gradient-based
optimization methods infeasible Keane and Smith (2003) proposed that the estimation
procedures used for observed data and simulated data can be different22 Instead of the
discrete choice a continuous function of latent utilities including a smoothing parameter
is used as the dependent variable in the auxiliary model When the smoothing parameter
goes to zero the function of latent utilities converges to the discrete choices this way to
guarantee consistency According to the Monte Carlo results the generalized indirect
inference method proposed in this paper yields good estimates in small samples being as
efficient as maximum likelihood estimates in comparison
20 Gourieacuteroux C Monfort A amp Renault E (1993) Indirect Inference 21 Keane M amp Smith A (2003) Generalized Indirect Inference for Discrete Choice Models Manuscript Yale University 22 Keane M amp Smith A (2003) Generalized Indirect Inference for Discrete Choice Models
17
Creel (2009) presented a data mining approach to indirect inference23 which is similar to
the regular indirect inference method yet with certain advantages over it The method is a
simulation-based estimator relying also on an auxiliary model In line with the indirect
inference method an underlying economic model with parameterβ is referenced by an
auxiliary model with parameterθ Certain values of the parameter hβ in underlying
economic model are drawn randomly from a known density simulated data is generated
using Monte Carlo methods to estimate ɶh
θ of auxiliary model which ends up with a set
of tuples ɶ( )hhβ θ Nonparametric methods are used to get the function ɶ( | )E aβ θ = and
the final estimate of β is supposed to be the result of regression function evaluated at the
estimate of θ based on true observations ɶ ɵ( | )Eβ β θ θ= = Creel (2009) also presented a
way of calculating confidence intervals24 Monte Carlo results in dynamic and nonlinear
panel models and vector autoregressions show good performance of the new estimator
23 Creel M (2009) A Data Mining Approach to Indirect Inference Universitat Autonoma de Barcelona Department of Economics and Economic History 24 Creel M (2009) A Data Mining Approach to Indirect Inference
18
3 Methodology
31 Multinomial Logit Model (MNL)
311 Model Description
Route choice modeling is somewhat complicated when we want to capture the attributes
of both the alternative routes and choice maker accurately and reflect the choice making
process in the model Intuitively route choice can be regarded as choosing one specific
route from several alternative routes which coincides with the prerequisites of discrete
choice models Actually a lot of literatures have explored the route choice modeling and
possible improvements based on discrete choice models (see Cascetta et al 1996 Vovsha
and Bekhor 1998 Ben-Akiva and Bierlaire 1999 for more information on development
in route choice models with regard to discrete choice models)25
To understand the frontier development of route choice model we have got to know the
discrete choice models among which multinomial logit model (MNL) is the most widely
used In addition we choose to implement a new method ndash indirect inference in which
MNL is used as it is
Logit model is the most widely used discrete choice model till now due to its excellent
qualities in model specification To be specific the choice probability takes a closed form
which is easy to estimate and interpret (Train 2003)26
The multinomial logit model is a kind of choice model with more than two alternatives in
the choice set We assume that the choice maker makes his or her decision based on the
utility maximization rule (Ben-Akiva amp Lerman 1985)27 With regard to the utility njU
the decision maker n obtains from the thj alternative in the choice set it is made up of
two parts the deterministic part and the stochastic part The deterministic part denoted
25 Cascetta E Nuzzolo A Russo F amp Vitetta A (1996) A Modified Logit Route Choice Model Overcoming Path Overlapping ProblemsSpecification and Some Calibration Results for Interurban Networks Vovsha P amp Bekhor S (1998) Link-nested Logit Model of Route Choice-Overcoming Route Overlapping Problem Transportation Research Record 1645 133-142 Ben-Akiva M amp Bierlaire M (1999) Discrete Choice Methods and Their Applications to Short Term Travel Decisions 26 Train K (2003) Discrete Choice Methods with Simulation Cambridge University Press 27 Ben-Akiva M amp Lerman S (1985) Discrete Choice Analysis Theory and Application to Travel Demand MIT Press
19
by njV contains attributes known by the modelers while the stochastic part denoted by
njε is the attributes affecting peoplersquos the decision which cannot be observed by the
modelers yet are known by the decision makers themselves So the utility function turns
out to be
nj nj njU V jε= + forall (1)
The type of choice model is basically decided by the distribution of the stochastic part
When we assume that njε is independently identically Gumbel distributed the model
becomes a logit model
As stated above the decision follows utility maximization rule which means that the
decision maker n chooses the alternative with the highest utility say the thi alternative
Use as the probability the thi alternative is chosen over the others we have
( max ) ( )
( )
( )
ni ni nj ni njj C
ni ni nj nj
nj ni ni nj
P P U U P U U j i
P V V j i
P V V j i
ε εε ε
isin= = = ge forall ne
= + gt + forall ne
= minus lt minus forall ne (2)
With Equation (2) above and the assumption that njε follows iid Gumbel distribution we
could derive the probability of decision maker n chooses alternativei which is
ni
nj
V
ni V
j
eP
e=sum
(3)
Typically we specify the deterministic part of the utility function in a linear form which
is nj njV xβ= Then the probability becomes
ni
nj
x
ni x
j
eP
e
β
β=sum
(4)
This is the most common form of probability function for multinomial logit models
There are some good properties for this kind of logit probability as discussed by Train
(2009)28 With this form the probability of choosing certain alternative will be between
zero and one inherently which is basically required for probability definition Yet the
28 Train K (2003) Discrete Choice Methods with Simulation
20
value of niP will never drop to zero mathematically which means that all the alternatives
in the choice set are perceived to have chance to be chosen On the other hand if an
alternative is perceived never to be chosen it should not be included in the choice set at
all
The probabilities for all the alternatives in the choice set sums to be one which is easily
illustrated from the analytical properties 1 1 1
( ) 1njni
J J JVV
nii i j
P e e= = =
= =sum sum sum in which J denotes
the number of alternatives in the choice set
The logit probability and the deterministic part of the utility function follow an S-shaped
curve line shown in Figure 1 below
Figure 1 S-shaped relationship between probability and deterministic part of utility
This property gives implications for possible impacts of the deterministic utility of certain
alternative on its chances to be chosen We could see that when an alternative has about
50 probability to be chosen which infers to the steepest part on the curve a small
change in the deterministic part of the utility function could lead to a large change in the
probability the alternative has to be chosen
Apart from the nice properties of logit probability logit models have some disadvantages
as well (Bartels Boztug amp Muumlller 1999)29 One shortcoming is the assumption of
29 Bartels K Boztug Y amp Muumlller M (1999) Testing the Multinomial Logit Model Working paper University Potsdam Germany
21
Gumbel distribution of error terms in the utility function The inherent requirement for
iid property sets restrictions for logit model to be widely used especially in route choice
modeling context Several models have been proposed to overcome this shortcoming in
particular modifications based on MNL to adjust it to route choice practices have been
proposed Another drawback is the assumption of the linear composition for the
deterministic part of utility function Actually this assumption is for ease of following
estimation process since McFadden (1974) demonstrated that under this condition the
probabilities will be universally concave with regard to the coefficientsβ 30 which
improves the performance of numerical estimation Yet there could be nonlinear
compositions in the deterministic part to relax the restriction Under this condition the
universal concavity cannot be guaranteed which may lead to local convergence in the
estimation process
312 Model Estimation
The most commonly used numerical estimation method for multinomial logit models is
the Maximum Likelihood Estimation (MLE) In principle given a set of data and the
underlying probability model the method tries to find coefficients of the probability
model with which produced data has a distribution most likely resembles the distribution
of the observed data
Consider the case that N decision makers with their choice data are obtained Parameters
to be estimated are the coefficients in the utility function denoted byβ We could then
use the MLE to try to get the values of β vector with which the probability that choice
maker choose their observed alternatives is maximized
The probability of choice maker n to choose his or her observed alternative can be
written as
( ) niyni
i
Pprod (5)
in which niy is a dummy with value 1 if choice maker choose alternative i and value 0
otherwise
30 McFadden D (1974) Conditional Logit Analysis of Qualitative Choice Behaviour (P Zarembka Ed) Frontiers in Econometrics 105-142
22
Choice makers choose their alternative independently from each other so the probability
of all sampled choice makers choose their observed alternative is
1
( ) ( ) ni
Ny
nin i
L Pβ=
= prodprod (6)
This is the likelihood function with regard to the parameters to be estimated β in this
case We can take the logarithm of it to get the log-likelihood function
1
( ) lnN
ni nin i
LL y Pβ=
=sumsum (7)
Since we aim at getting the value of β to make the log-likelihood function maximized
we can take the derivative of it with respect to β and set it to zero
( )
0dLL
d
ββ
= (8)
By solving this equation we could get the estimate of β
32 Dijkstrarsquos Algorithm
321 Introduction
A method is needed for generating feasible alternatives and compose the choice set as
well as for deriving simulated observations for each OD pair in the process of indirect
inference As for choice set generation we would like to include certain number of high
ranking shortest paths in the choice set since these paths tend to have more possibility to
be chosen Similar to this the simulated observation is generated as the shortest path
between each OD pair We implement a method for shortest path finding which is the
Dijkstrarsquos Algorithm
Dijkstrarsquos Algorithm is named after the Dutch computer scientist Edsger Dijkstra who
conceived this method in 1956 and got it published in 195931 This is a graph search
algorithm aiming at solving shortest path problem for a graph the edge cost of which is
defined nonnegative The outcome of it is a shortest path tree demonstrating the path with
lowest value with respect to the defined cost
31 Dijkstra E (1959) A note on two problems in connexion with graphs Numerische Mathematik 1 269-271
23
This algorithm deals with single-source problem To be specific given one source node in
the graph the algorithm will give paths with the lowest value with regard to cost from
this source node to every other node in the network Given certain criterion we could use
the algorithm to find shortest path between two specific nodes by setting one node as the
source and the other as the target
After released it is widely used in path searching problems especially in transportation
related practices Routing problem is considered in investigation on traffic assignment
and optimization in logistics Real sized road network could be perceived as a graph with
vertices and edges in which cities can be abstracted as the vertices in the graph and the
roads connecting cities can then be regarded as the edges With the aid of Dijkstrarsquos
Algorithm the shortest path with respect to cost could be found from certain city to the
other cities The outcome is valuable for logistics corporations to work out their region-
wide distribution plans32
322 Algorithm
We connect a ldquodistancerdquo value with all the vertices in the graph indicating its distance
from the source vertex To be accurate the ldquodistancerdquo could be actual length of edges or
the generalized cost on the edges or anything desired The source vertex is defined as the
initial node with a value of zero In the process Dijkstrarsquos Algorithm will assign values
to vertices detected in one loop and update the values in the following loops till a
minimum value is found for each vertex The steps for searching and updating are
presented below
1 Initialize the network and assign the distance values of vertices other than the initial
node as infinity
2 When one vertex is to be detected it is denoted as current node All the vertices that
have been detected and attained the minimum distance values will be marked as detected
and will not be detected in the following loops while the vertices remaining unvisited
will be marked undetected To initialize all the vertices are marked undetected and the
initial node is set as current node
32 Wang H (2011) Logistics Distribution Shortest Path Based on Dijkstra Algorithm Computer and Digital Engineering 3
24
3 For current node all its directly connected adjacent nodes are considered except for
the newly detected vertex Labeled distance values of the neighbor vertices will be
updated if the calculated values from current node are smaller than their current values
For example current node A has a distance value of 4 and one of its neighbors B has a
value of 8 The edge linking A and B has a distance of 2 The newly calculated distance
value for B will be 4+2=6 which is smaller than 8 So the labeled distance value for B
will be updated to 6 indicating that the minimum distance from the source vertex to B till
now is 6 and the path should pass A
4 When all the neighbors of the current node are considered and updated mark the
current node as detected And mark the undetected node with the lowest distance value as
the current node and do the detection in step 3 again
5 When all the vertices in the network are marked detected the algorithm is finished and
we get the minimum distance from the source to all the other vertices The shortest path
from the source to a specific vertex could be found out following the detecting process
As mentioned above the stop criterion could also be modified as we desired If we aim at
finding the shortest path between two vertices at the beginning one vertex should be set
as the initial node and the algorithm could be stopped once the other vertex is marked as
detected
323 Explanatory Example
Here is a simple network to illustrate the mechanism of Dijstrarsquos Algorithm There are
five vertices and six edges with distance values labeled beside We define A as the source
and set it the initial node
Figure 2 A simple network for Dijstrrarsquoa Algorithm explanation
25
Initialization
Initial node A
Detected null
Distance value A=0 B=C=D=E=+infin
Loop 1
Current node A
Adjacent vertices B C
Detected null
Distance value A=0 B=4 C=1 D=E=+infin
Loop 2
Current node C
Adjacent vertices B D
Detected A
Distance value A=0 C=1 B=min 4 C+2 =3 D=C+3=4 E=+infin
Loop 3
Current node B
Adjacent vertices E
Detected A C
Distance value A=0 C=1 B=3 D=4 E=B+3=6
Loop 4
Current node E
Adjacent vertices null
Detected A B C D
Distance value A=0 C=1 B=3 D=4 E=6
If we want to get the shortest path from A to E following the detecting process we could
know that it should be A-C-B-E
26
324 Discussion
Dijkstrarsquos Algorithm has a clear logical structure which makes it easy to understand as
well as to implement in programming Nonetheless this method cannot search directly
from one node towards the other to find the shortest path between the two It works more
like detecting all the adjacent nodes in terms of shortest paths and expands from the
source iteratively until the target node is included and that is when we could figure out
the shortest path between the two specific vertices This reveals the fact that the method
wastes a lot of time in the blind search leaving it inefficient In addition this method is
not able to deal with networks with negative edge values yet this is not a problem in our
research since link cost on our network is defined nonnegative
33 Indirect Inference
331 Introduction
For problems in route choice context choice set size may be way too large to enumerate
all the alternatives Yet estimation based on sampled choice set may introduce biases
which can be corrected in some special cases (see Frejinger Bierlaire amp Ben-Akiva
2009)33 While in cases where estimation models are not based on MNL say multinomial
probit model we could not find corrections for biases caused by sampled choice set
Estimator based on the principle of indirect inference is then introduced to overcome
inconsistency problem34
Indirect inference35 is a simulation-based method for estimating parameters in economic
models by making references to the parameters of interest (Smith 2008) It is motivated
when general statistical estimation method such as Maximum Likelihood is intractable or
as discussed above consistent estimation is required given that only sampled choice set is
available Since in economic analysis we tend to build models which guarantee scientific
logic and inclusion of necessary attributes quite often the models will end up
33 Frejinger E Bierlaire M amp Ben-Akiva M (2009) Sampling of Alternatives for Route Choice Modeling 34 Karlstroumlm A Sundberg M amp Wang Q (2011) Consistently estimating flexible route choice models using an MNL lense 35 Smith A (2008) Indirect Inference In S Durlauf amp L Blume (Eds) The New Palgrave Dictionary of Economics (Second ed) Palgrave Macmillan
27
complicated from statistical estimation point of view This in sequence spurs the wide use
of indirect inference in economic analysis
It is common character that simulation-based methods allows modelers to simulate data
from the economic model of interest given certain perceived values of the parameters to
be estimated Since to generate data is essential and simple the true challenge is how to
estimate coefficients Indirect inference uses an auxiliary model which gives a rich
description of the covariance patterns in the data by including certain variables from the
basic economic model On the other hand the auxiliary model does not need to reflect
accurately the data generating process since it is supposed to be estimated based on the
data derived not to generate data itself The basic function of the auxiliary model is that
it provides a criterion to compare observed data and simulated data from the basic
economics model
We do iterations with the aim of finding the parameters of the basic economic model so
the observed data and the simulated data from the basic model looks almost the same by
the criterion of auxiliary model To be specific the auxiliary model is estimated based on
both observed data and simulated data we choose parameters for the basic model to
make sure that the two estimator of auxiliary model are as close as possible Based on
this idea the auxiliary model should be easy to estimate
332 Definition of the method
We define an economic model with the form of
( ) 12t t ty G x t Tε β= = (9)
in which 1 Tt tx = is a sequence of observed exogenous variables 1 T
t ty = is a sequence of
observed endogenous variables and 1 Tt tε = is a sequence of unobserved random error
terms β is a k -dimensional coefficient vector of the exogenous variables (Smith
2008)36
This model generally describes a relation that ty is dependent ontx with some random
errors Given the distribution of the random errors we could get the probability density
36 Smith A (2008) Indirect Inference
28
function of ty conditional on tx We will not focus on this density and instead this model
is only used for simulating data in indirect inference
In terms of the auxiliary model it could be defined by a probability density function with
the form of
( | )t tf y x θ (10)
in which θ is a p -dimensional coefficient vector and p is supposed to be not smaller
than k since we should capture characteristics of all the parameters in the underlying
economic model In addition the auxiliary model needs not be defined to reproduce the
distribution of ty in the basic model yet it needs to have a convenient analytical format
Based on the observed data we could estimate the parameters in the auxiliary model
using Maximum Likelihood Method
ɵ
1
arg max log ( | )T
t tt
f y xθ
θ θ=
= sum (11)
The estimated coefficient vectorɵθ could be used as an indicator of certain features of the
observed data
On the other hand the auxiliary model can be estimated based on simulated data from the
basic model as well We need to draw a sequence of random error terms 1 m Tt tε = from the
defined distribution in which m denotes the number of simulation with an interval of [1
M ] generally Given a coefficient vectorβ we could generate the values of endogenous
variables ɶ 1 ( )m T
tty β = which are explicitly dependent onβ With the help of Maximum
Likelihood Method we could get
ɶ ɶ
1 1
( ) arg max log ( ( ) | )M T m
ttm t
f y xθ
θ β β θ= =
= sumsum (12)
According to the principle of indirect inference we try to find the values of β to make
ɶ( )θ β as close toɵθ as possible Practically we need a metric to measure the distance
between ɵθ andɶ( )θ β and by minimizing the distance we could find out the estimates of
β in the basic economic model
29
333 Choices of the metrics
As mentioned above we need a metric to measure the distance betweenɵθ andɶ( )θ β
There are three approaches corresponding to the three classical hypothesis tests namely
Wald likelihood ratio (LR) and Lagrange multiplier (LM)37
In the Wald approach we try to minimize a quadratic form in the difference between the
two estimators ofɵθ andɶ( )θ β which is
ɵ ɶ ɵ ɶarg min( ( )) ( ( ))Wald
Wβ
β θ θ β θ θ β= minus minus (13)
in which W is a positive definite ldquoweightingrdquo matrix
In the LR approach a metric is formed based on the likelihood function related to the
auxiliary model which is
ɵ ɶ
1 1
arg min( log ( | ) log ( | ( )))T TLR
t t t tt t
f y x f y xβ
β θ θ β= =
= minussum sum (14)
According to the definition ofɵθ the first part of the objective function before the minus
sign on the right-hand side is always larger than the second part after the minus sign And
the first part is not dependent onβ
To minimize the objective function is equivalent to maximizing the log-likelihood
function withɶ( )θ β that is
ɶ
1
arg max( log ( | ( )))TLR
t tt
f y xβ
β θ β=
= sum (15)
In the LM approach the metric is formed using the derivative of the log-likelihood
function related to the auxiliary model which is
arg min ( ) ( )LM
S VSβ
β β β= (16)
in which
ɶ ɵ
1 1
( ) log ( ( ) | )M T m
ttm t
S f y xβ β θθ= =
part=partsumsum
(17)
and V is a positive definite matrix
37 Smith A (2008) Indirect Inference
30
By using any of the approaches we aim at getting the minimized distance betweenɵθ and
ɶ( )θ β so the value will approach to zero as expected So the hypothesis test of the
minimized value could be used as an indicator of whether the auxiliary model is suitably
specified In other words the minimized value being significantly different from zero
indicates a bad specification of the auxiliary model
In comparison the LM approach has an advantage over the others in computation when
it is relatively time-consuming to estimate the auxiliary model
334 Consistency Interpretation
Suppose the observed sample size T grows large while total number of simulations stays
fixed as M the estimator based on simulated data ɶ( )θ β will converge to a pseudo-true
value denoted as( )h β which is also dependent onβ This is called binding function
which characterized the relationship between the coefficients in the basic model and the
auxiliary model At the same time the estimator based on observed data ɵθ will converge
to a pseudo-true value0θ In case that T grows to a large number the aim of indirect
inference changes to finding β that guarantees0 ( )hθ β= This could explain that indirect
inference gives consistent estimate of the parameters in the basic economic model
In this project the binding function is what we focus on to get the correct estimates
instead of finding certain metrics Detailed methods will be discussed in the following
part
34 Model Specification in the Thesis
341 Basic Route Choice Model
Based on all the methods mentioned in previous sections the specification of models and
methods we use in the thesis will be explained in this section Since we are to estimate
the model based on true observations no model is known beforehand to adjust to the data
we use Several formulations of the model have been tested in the thesis The one
explained here could be seen as an example and all the other trials contain modifications
based on this model The other specifications of model will be explained along with the
results in the result section
31
We start by describing the underlying route choice model of interest38 We need to define
a road network as a representation of a real-size one from which we collected the trip
data The network denoted asN consists of a set of nodes (vertices) v and links (edges)
l Each link has a source node ( )s l and a target node or a destination node( )d l which
together indicate the direction of the link A path from an origin node ov to a destination
node dv could be seen as a sequence of links1 nl lhellip of which 1( ) os l v= 1( ) ( )i id l s l +=
and ( ) dnd l v= So a path can be defined by the index of links which is 1 nl lπ = hellip
A vector of characteristics denoted aslx is associated to each link as well as a strictly
positive cost function( )l lic x ε β in which liε is an individual specific random link cost
with i denoting the individual and β is a vector of coefficients of the link characteristics
left to be estimated In the Indirect Inference context we need an auxiliary model with
easily-estimated analytical form yet there is no such requirement for the basic model
Although not necessary we assume that the cost function has a linear deterministic form
the deterministic part and the random part are additively separable So we have the cost
function as
( ) Tl li l lic x xε β β ε= + (18)
In addition one important assumption is that the link cost is additive which means that
the cost of a path can be attained by the sum of all the link costs along the path This way
we have the cost of a path π as
( ) ( )l lil
C c xπ
π ε βisin
=sum (19)
We focus on the path-based model which means that the individuals choose among all
possible paths As defined above this turns out to be a random utility choice model As
indicated by the standard assumptions of this kind of models choice makers are assumed
to know both the link characteristics and their idiosyncratic random utility liε associated
to each link Since the choice makers maximize their utility this means that they will
choose the path with the lowest generalized cost in this model This way we have the
choice of individual i as
38 Karlstroumlm A Sundberg M amp Wang Q (2011) Consistently estimating flexible route choice models using an MNL lense
32
( )
arg min ( )o di i
iv v
Cπ
π πisinΩ
= (20)
in which oiv denotes the origin point of the trip for individual i and d
iv denotes the
destination ( )o di iv vΩ denotes all possible paths connecting the origin and destination in
the network for individual i which forms the choice set for the individual
When implementing the model we assume that the random utility component liε follows
a truncated normal distribution To be specific liε follows a standard normal distribution
yet with only the positive values retrieved This way we could guarantee that the link
costs are always positive so that additively the path would not have infinite loops With
this feature of the random component we could say that our model is probit-like Based
on this assumption the prerequisite of Dijkstrarsquos Algorithm is satisfied which always
needs positive edge values on the network We can use the Dijkstrarsquos Algorithm to find
the shortest paths iπ as an intermediate step in the implementation Apart from this we
assume that the unobserved cost captured by the random term is proportional to the
length of link To embody this in the cost function we add a fixed scale parameter to the
random term with a form of ( )Length l Lengthx Mean x in which ( )LengthMean x is the average
length of links in the network
We will assume that the data consists of J paths as dependent variables which means
that the dependent variables for the choice model are 1 Ji iy π == In addition the observed
characteristics of links in the network are provided 1 Ll lx x == To be specific we choose
to use two attributes of the links namely the length of the links Lengthx and the dummy
variable indicating the presence of speed bumps on the links SBx The cost function then
is specified as
( ) ( )l li Length Length l SB SB l li Length l Lengthc x x x x Mean xε β β ε= + + sdot (21)
Now the objective is to estimate the parametersβ in the model for which we will make
use of an auxiliary model
33
342 Auxiliary Model
Based on the idea of Indirect Inference we treat the route choice model defined above as
the basic model of interest which might have complex formation and be difficult to
estimate directly Then we need an auxiliary model to form a criterion which takes into
certain aspects of data to focus the analysis The auxiliary model needs not to reflect the
data generating process exactly as in the basic model yet it needs to include attributes of
interest in order for reference and to be easy to estimate We choose to use a logit model
for route choice as the auxiliary model since the logit model has always been a useful
tool for discrete choice analysis thanks to its analytical form and there is software for
estimating logit models which ensures that we can estimate very efficiently
As to the auxiliary model it is chosen to be a logit model for route choice We consider
that each individual i is choosing from a set of alternative routesr Each route r is given
a utility of riU
- Tri r ri r riU V Xε θ ε= + = + (22)
in which θ is the vector of auxiliary parameters which gives inference to the parameters
in the basic model One thing to be mentioned is that as expected the coefficients in the
utility function should have negative signs To make it easier for comparison with the
coefficients in the basic route choice model we assume the sign of θ to be positive per
se and add a negative sign ahead of it to guarantee that the coefficient part is negative as a
whole rX denotes route characteristics and riε is the random utility for each individual
which is assumed to follow an iid (independently identically distributed) Gumbel
distribution following the standard assumption of logit models
Note that as required for the auxiliary model it should be flexible enough to capture the
variability in the data and thus contains no fewer attributes than the basic model39 In
order to infer the parameters in the basic model and in consideration of efficiency we
pick the same attributes of interest in the basic models which are the link length Lengthx
and the speed bump dummy variableSBx So the utility function turns out to be
- -ri Length Length r SB SB r riU x xθ θ ε= + (23)
39 Karlstroumlm A Sundberg M amp Wang Q (2011) Consistently estimating flexible route choice models using an MNL lense
34
The probability of individual i choosing path r given an individual specific choice set
( )iI o d is
( )
ri
si
i
V
ri V
s I o d
eP
eisin
=sum
(24)
Theoretically we allow the individuals to choose from all possible paths between the
origin and destination in the network which intuitively could be infinite and impossible
to enumerate When implementing the model we generate the individual choice set based
on the basic route choice model Through simulation of the basic model we generate
infinite unique shortest paths for all the unique OD pairs by redrawing the random link
cost liε Without loss of generality the number of paths generated would be big enough
with fully consideration of efficiency We name the finite choice set composed by the
shortest paths generated as the pseudo-universal choice set ( )I o d which is a sample of
the infinite universal choice set The individual specific choice sets are generated by
randomly drawing certain number of paths out of the pseudo-universal choice set And
the size of individual specific choice set could be equal to or smaller than that of the
pseudo-universal one
The resulting individual specific choice set ( )iI o d describes a finite subset of all possible
paths connecting the origin oand destinationd for individuali When implementing the
methods the way of generating the choice set ( )iI o d for each individual i is viewed as
part of the auxiliary model
After the auxiliary model is built it could be estimated using a Maximum Likelihood
estimator based on the observed data of individual choices y and attributes variablesx
for individual 1 i N= hellip The estimate of parameters in the auxiliary model is
ɵ arg max ( )L y xθ
θ θ= (25)
in which ( )L y x θ is the log-likelihood function for the auxiliary model
Given the data of the link attributes xand some random draws of structural parameters
mβ 1 m M= hellip we can simulate choice data through the basic route choice model With
M draws of β from some given density we could simulate M sets of data resulting in
35
simulated choicesɶ( )my β Same as before parameters θ in the auxiliary model can be
estimated based on the simulated data as
ɶ ɶ( ) arg max ( ( ) )m m mL y xθ
θ β β θ= (26)
As the process indicated the simulated choice data depends on the structural parameterβ
in the basic route choice model and in sequence the estimates of parameters θ in the
auxiliary model depends on β when estimated based on the simulated data Based on
this theoretically we have a relationship of ( )θ β referred to as the binding function in
indirect inference literatures which we will discuss in detail for implementation of model
in this thesis A metric is then chosen to measure the distance between the observed and
simulated data viewed by the auxiliary model as a way to indirectly infer the values of
parameters β in the basic model To be specific for each draw of the structural parameter
mβ we can get the estimates of ɶ ( )m mθ β based on the simulated data and the distance
between ɶ ( )m mθ β and ɵθ measured by the chosen metric By doing more iteration with the
aim of minimizing the distance we will get the value of mβ which spurs the ɶ ( )m mθ β
closest toɵθ and this mβ is the inferred estimates of the parameter in the basic model
343 Consistency Discussion
The process of indirectly estimating parameters in the basic model is described above yet
we need to know whether the method we provide gives consistent estimation Here are
some discussions explaining the consistency in estimating by which consistency of the
estimator we proposed is illustrated
As proved the multinomial logit model (MNL) can be estimated consistently based on a
subset of alternatives (McFadden 1978)40 We may need to use the classical conditional
maximum likelihood estimator to deal with the problem at the same time the probability
that an individual n chooses an alternative i conditional on the subset of alternatives
denoted asnc becomes the conditional probability
40 McFadden D (1978) Modeling the Choice of Residential Location In A Karlqvist L Lundqvist F Snickars amp J Weibull (Ed) Spatial Interaction Theory and Residential Location (pp 75-96) Amsterdam North-Holland
36
ln ( | )
ln ( | )( | )in n
jn n
n
V q c i
n V q c j
j c
eP i c
e
micro
micro
+
+
isin
=sum
(27)
in which micro is a scale parameter and inV is the deterministic part of the utility There is a
term ln ( | )nq c j for correcting the sampling bias in which ( | )nq c j denotes the probability
of sampling nc given that alternative j is chosen
If all the alternatives in the choice set have the same probability to be chosen into the
subset the estimation on the subset of alternatives is equivalent to that on the full choice
set To be specific in this case ( | )nq c i is equal to ( | )n nq c j j cforall isin so by calculation the
term for sampling bias correction will cancel out in the probability function
In route choice context the alternative paths between an origin and a destination may be
in large amount and it is inefficient to give some very long-distance paths the same
probability as those short and attractive ones This means that we may need the
importance sampling method when generating subsets of alternatives which selects
attractive alternatives with higher probability than unattractive ones And the correction
term does not cancel out in this case Note that if alternative specific constants are
estimated we can get unbiased estimates of all the parameters except the constants even
if the correction term is not included in the utility function (Manski amp Lerman 1977)41
Back to the route choice context we tend to use large number of alternatives even with
subset of the full choice set which means that it is generally impossible to estimate the
constants and thus the correction term is essential To solve this problem Frejinger et al
(2009) developed a sampling approach in the context of route choice42
The discussion above focuses on the usage of MNL for route choice modeling When it
comes to our method the individual specific choice set is generated by randomly drawing
alternatives from the pseudo-universal choice set with the same probability yet there is
bias when generating the pseudo-universal ones since the pseudo-universal choice set is
composed of certain number of shortest paths between two nodes and this generating
process gives some paths higher probability to be included into the choice set So we
41 Manski C amp Lerman S (1977) The Estimation of Choice Probabilities from Choice Based Samples Econometrica 45 (8) 1977-1988 42 Frejinger E Bierlaire M amp Ben-Akiva M (2009) Sampling of Alternatives for Route Choice Modeling
37
actually use importance sampling to get the choice set which may consequently
introduce bias in estimating the parameterθ in the auxiliary model as discussed above
With the idea of indirect inference we consider only the relationship between θ andβ
denoted as( )θ β and use this relation to infer the value ofβ From this point of view
whether θ is estimated with bias or not does not matter since the relation between it and
β could always be captured which is the specific thing we focus on using the method of
indirect inference So we can say that even with biased subset of alternatives we could
still get consistent estimation by using indirect inference
344 Binding Function
As discussed in indirect inference method section when the sample size N increases
which means that we have more observations of choice the estimated parameter in the
auxiliary modelɶ ( )m mθ β will converge to a stable value ( )mθ β which is often referred
to as the binding function
Given that route choice model deals with discrete choices and by using indirect inference
we have a discrete choice model as the auxiliary model as well the estimates of binding
function ( )mθ β will inherit the discontinuous feature due to discrete individual choices
ɶ( )my β Keane and Smith (2003) proposed a solution of using logit-smoothing on the
simulated dependent choice data43 Following this idea we assume a continuous binding
functionɶ( )θ β for simplicity which could be approximated by a linear function locally
within small intervals With the M randomly drawn values of mβ and the corresponding
estimated parameters ɶ ( )m mθ β in the auxiliary model we could perform an Ordinary
Least Square (OLS) regression to estimate the local approximation of binding function
ɶ( ) c Dθ β β= + (28)
in which cdenotes the constant vector and D denotes the OLS parameter matrix44 To be
specific in our case each parameter in the auxiliary model will have a restriction
function with regard to both parameters in the basic model which is
43 Keane M amp Smith A (2003) Generalized Indirect Inference for Discrete Choice Models 44 Karlstroumlm A Sundberg M amp Wang Q (2011) Consistently estimating flexible route choice models using an MNL lense
38
ɶ1 11 12( )Length Length SBc d dθ β β β= + +
(29)
ɶ2 21 22( )SB Length SBc d dθ β β β= + +
(30)
Based on the observed data of choices y and explanatory variables xand the estimated
binding function which indicates the restrictions between ɶθ andβ we could use the
maximum likelihood method to give estimation of the parameters of interest The
likelihood ratio approach to indirect inference is following ideas of Smith (1993)45 and
Keane and Smith (2003)46
ɶ=arg max ( ( ))L y xβ
β θ β (31)
in which β is the estimate of the parameter of interest β in the basic economic model
With the restriction of binding function this is actually an indirectly inferred estimate In
line with the estimating process in auxiliary model ( )L sdot is the likelihood function of the
auxiliary model
Note that the form of binding function is based on an assumption in the result part we
will verify that this assumption is realistic
45 Smith A (1993) Estimating Nonlinear Time-series Models Using Simulated Vector Autoregressions 46 Keane M amp Smith A (2003) Generalized Indirect Inference for Discrete Choice Models
39
4 Data
41 Road Network
The data we use for estimation is based on a GPS data set collected in the Swedish city of
Borlaumlnge Borlaumlnge is located in the middle part of Sweden and has a population of about
47 000 inhabitants
The virtual road network contains 3077 nodes and 7459 unidirectional links (Frejinger amp
Bierlaire 2007)47 of which 3061 nodes and 7288 links are included in the network for
estimation Figure 3 gives a visual illustration of the road network in Borlaumlnge
Figure 3 Illustration of the Borlaumlnge road network
With regard to our research two of the link attributes are included namely link length
and speed bump dummy Link length is in the unit of km and speed bump dummy is an
indication of speed bump existence on the links which has the value 1 when there is a
speed bump on the link and 0 otherwise
Link length
47 Frejinger E amp Bierlaire M (2007) Capturing Correlation with Subnetworks in Route Choice Models
40
Some descriptive statistics of the link length data for the whole network is presented in
Table 1 below
Table 1 Descriptive statistics of link length
Number of links 7288
Minimum 0001
Maximum 7599
Mean 0184487
Median 0102
Variance 0103722
Lexis ratio (varmean) 1016884
Skewness 9871144
To describe the overall character of the link length attribute the histogram is shown in
Figure 4 below
Figure 4 Histogram of link length data
We could see that the link length data is quite clustered most of which lies within the
range of 01km and 06km Nonetheless there are some extreme values far away from the
range indicating extremely long links To display the variation in the relatively clustered
area we draw a histogram zoomed in the interval of (0 1km] shown Figure 5 in below
0
01
02
03
04
05
06
Fre
qu
en
cy
Link length (km)
Histogram
41
Figure 5 Histogram of link length data (zoomed within 1km)
Over 80 of all the links have length shorter than 03 km indicating concentration of
link length data
Speed bump dummy
Speed bump dummy is based on true situation in the network Of all the links 82 links
are equipped with speed bumps which account for a percentage of 113 The following
Figure 6 displays the locations of links with speed bumps
Figure 6 Illustration of links with speed bumps
0005
01015
02025
03035
04045
05
Fre
qu
en
cy
Link length (km)
Histogram(zoom in)
42
42 Observation Data
The GPS data set is collected as a part of the Swedish Intelligent Speed Adaptation (ISA)
study which aims at traffic safety effects of in-car information systems In the study 186
vehicles were equipped with GPS devices and traced within a radius of 25 km from the
center of Borlaumlnge The monitoring lasted for 30 days from 22th June 2000 to 4th March
2002 obtaining 49 667 vehicle days of travel and nearly a quarter of a million trips (for
more information on the GPS data set check Axhausen Schoumlnfelder Wolf Oliveira amp
Samaga 2003 Schoumlnfelder amp Samaga 2003 Schoumlnfelder Axhausen Antille amp Bierlaire
2002)48
The data collection is not originally designed for route choice analysis so the raw data
cannot be used in our research directly Extensive data processing is performed by the
company GeoStats in Atlanta to retrieve new data set available for route choice analysis
which contains 24 vehicles and 16 035 observations The final data set we use is provided
by Emma Frejinger which contains in total 1832 observations corresponding to 1458
observed unique routes made by 24 vehicles and 1409 unique origin-destination pairs
Considering that certain route may have been observed more than once we make a
distinction between observations and unique routes and number of unique routes should
be less than that of observations consistently with the numbers listed above
As indicated by data collection in the ISA study only licensed drivers with access to his
or her only car are recruited to minimize sharing or swapping of cars Minimum socio-
economic data of the drivers is included in data collection so we have no way to
understand driver characteristics from the data set Logically we make an assumption
that there is only one individual per vehicle
In the observation data a route is represented by a series of links and also an origin-
destination pair With relatively intensively distributed link length number of links could
48 Axhausen K Schoumlnfelder S Wolf J Oliveira M amp Samaga U (2003) 80 Weeks of GPS Traces Approaches to Enriching the Trip Information Transportation Research Record 1870 46-54 Schoumlnfelder S amp Samaga U (2003) Where Do You Want to Go Today-More Observations on Daily Mobility Third Swiss Transport Research Conference Ascona Schoumlnfelder S Axhausen K Antille N amp Bierlaire M (2002) Exploring the Potentials of Automatically Collected GPS Data for Travel Behaviour Analysis- A Swedish Data Source In J Moumlltgen amp A Wytzisk (Ed) GI-Technologien fuumlr Verkehr und Logistik number 13 Institut fuumlr Geoinformatik Universitaumlt Muumlnster (pp 155-179) Munster IfGIprints
43
be used to indicate total length of routes Some of the descriptive statistics of link number
is shown in Table 2 below
Table 2 Descriptive statistics of link numbers in observation data set
Number of observations 1832
Minimum 5
Maximum 106
Mean 202877
Median 16
Variance 1871968
Lexis ratio (varmean) 9227126
Skewness 1732597
For further overall inspection of link number distribution in the observation data set the
histogram is shown in Figure 7 below
Figure 7 Histogram of link numbers in observations data set
Seen from the histogram distribution of number of links is relatively dispersed with a
large range interval Judging by the statistics in general the routes observed have about
000
200
400
600
800
1000
1200
1400
1600
5 8
11
14
17
20
23
26
29
32
35
38
41
44
47
50
53
56
59
62
65
68
71
74
77
80
83
86
89
92
95
98
10
1
10
4
10
7
Mo
re
Fre
qu
en
cy
Number of links
Histogram
44
20 links in average Yet the data has a big variance which is reasonable As stated above
there are 1409 unique OD pairs for 1832 observations indicating that for most OD pairs
there is only one observation Spread within the detecting area different OD pairs could
have various numbers of links in between
Following our experiment design only a portion of the data could be used To be specific
routes with number of links fewer than ten would be eliminated when used for estimation
43 Further Exploration of data
Apart from the characters discussed above there are some other attributes in the data set
interesting to be explored Both in link attribute data set and observation data set there is
travel time data which to some extent is parallel with length in indicating distance
between two nodes
In the link attribute data set one attribute is denotes the estimated travel time of links in
unit of hour Some of the descriptive statistics is shown in Table 3 below switching unit
to minute
Table 3 Descriptive statistics of estimated travel time on links
Number of links 7288
Minimum 000186
Maximum 578268
Mean 0281696
Median 018744
Variance 0119337
Lexis ratio (varmean) 0423638
Skewness 5785361
Seen from Table 3 estimated travel time seems to have a more clustered distribution than
link length judging by lexis ratio and skewness Yet this time is roughly estimated not so
qualified as link length to use in estimation since the latter is much easier to measure and
guarantee precision
In the observation data set we have the duration time of the observations in the unit of
minute Some of the descriptive statistics is shown in Table 4 below
45
Table 4 Descriptive statistics of duration of trips
Number of observations 1832
Minimum 007
Maximum 316
Mean 4991195
Median 3925
Variance 1775639
Lexis ratio (varmean) 3557542
Skewness 2174728
Duration of trips can be used as an indication of distance between origin and destination
yet it is roughly measured and strongly affected by traffic condition on the road network
With similar reasons as discussed on estimated travel time on link we use number of
links instead of duration of trips to indicate the distance between OD pairs
46
5 Experiment Design
When doing the simulation-based estimation it is physically divided into two parts for
convenience of operation As discussed in the method section we choose to use a pseudo-
universal choice set which is generated and stored in the first part and ready for use in
the following experiment Then in the second part we do the simulation-based
experiment to carry out indirect inference method for estimating the parameters of
interest in the basic model β to be specific The Figure 8 below illustrates an abstracted
flow of how the estimation is carried out given certain origin-destination pair
Figure 8 Illustration of the flow in the experiment
As shown in the flow chart we get all the unique OD pairs in the trip data For each of
the OD pairs the Dijkstrarsquos algorithm is used to find the shortest paths between them
without duplicates We set the intended number of paths to be 400 as well as time
terminator in case not enough paths could be generated within certain bearable time
47
interval The generated paths form the pseudo-universal choice set of each OD pair
which is stored for future use Note that we abandon some OD pairs with too few paths
in the pseudo-universal choice set Observations containing the kept OD pairs are used
for following estimation which turns out to be 940 of them
For the OD pair in a given observation 200 alternatives are randomly drawn from the
pseudo-universal choice set and the sequential links in the observation itself is read as an
alternative path The 201 paths compose the observed choice set On the other hand a
given value of mβ is drawn from a predefined domainD The shortest path is generated
based on the given mβ as the simulated observation Like in the observed choice set part
200 alternatives are randomly drawn from the pseudo-universal choice set to form the
simulated choice set together with the simulated observation The auxiliary model is
estimated based on the simulated choice set and we could get a set of ɶ( ( ))mm mβ θ β pairs
which will be used to estimate the binding function Based on the binding function and
the observed choice set the parameters in the basic model could be indirectly estimated
The process described above is abstracted with no illustration of iterations Since this is
an experiment based on simulations certain loops of iteration should be carried out to get
statistics of the results
Given observed trip data at first we have no idea of the value of β In the process of
retrieving value ofβ the estimation process is repeated for several stages denoted asS
starting from a rough guess of the domainsD while for each following stage the domain
shrinks Since we tend to use a local OLS regression to approximate the smooth binding
function the draws of smβ need to be around the true value to prevent misspecification of
OLS regression due to the possibly inherent nonlinearity of the binding function The
estimated 0
β is not satisfactory in precision in the first stage yet it could give a hint of
where the true value lies The domain1D is centered on 0
β with smaller interval before
the estimation in the second stage This way +1sD is dependent on sD with smaller
interval As it goes on we will get a more accurate domain and as a result a well specified
OLS regression to approximate the binding function
48
The process of experiment with iterations is described below Suppose that we have the
experiment carried out for K times and the number of observations used isN
for run 1 k K= hellip for true observation 1 i N= hellip
Randomly draw alternatives from the pseudo-universal choice set end Form the observed choice sety for stage 1 s S= hellip
for 1 m M= hellip
Draw ksmβ from the domain ksD
Simulate paths for OD pairs in the used observations with mβ
for simulated observation 1 i N= hellip Randomly draw alternatives from the pseudo-universal choice set end
Form a simulated route choice setɶ( )ksmy β
Estimate ɶ ( )ks ksm mθ β in Equation (26)
end
Estimate ɶ ( )ks
θ β in Equation (28)
Estimate ks
β in Equation (31) end
Center the domain 1k sD + on ks
β and shrink the interval end
As a trial we first do the experiment on a route choice model with one parameter link
length to be specific For simplicity the random term is not scaled as described in the
model specification section which means we attach a truncated normally distributed
random term to the cost function without scaling it with link length After getting the
estimation of Lengthβ we move on to estimating the route choice model with both
parameters as described in the model specification Results under these two formulations
of models are presented separately in the result part
49
6 Results
61 Validation of Binding Function
As discussed in the binding function section we assume the binding function to be
continuous and feasible to be approximated by a linear function locally The assumption
of binding function can be verified based on the ɶ( ( ))mm mβ θ β pairs we attained as
intermediate results To explain this more explicitly we carry out a simple example with
only one parameter in the route choice model Lengthβ to be specific
The cost function is specified as
( )l li Length Length l lic x xε β ε= + (32)
corresponding to which the auxiliary model is
-ri Length Length r riU xθ ε= + (33)
For each run 10 values ofLengthβ are evenly drawn from a given domain By simulating
observations and estimating the auxiliary model 10 corresponding Lengthθ are generated to
form ten ɶ( ( ))mm mβ θ β pairs As assumed the binding functionɶ( )θ β is continuous which
could be approximated by a linear function locally To display the trend of binding
function we choose a relatively large domain for Lengthβ in the beginning [010]D = and
carry out 10 runs which generate 100 points in the beta-theta diagram shown in Figure 9
below
Figure 9 Scatter plots of the 90 beta-theta pairs
y = 12804x + 16264
Rsup2 = 09959
0
2
4
6
8
10
12
14
16
0 2 4 6 8 10
the
ta_
len
gth
beta_length
50
We do OLS regression for the dots and estimate the binding function Intuitively the
smaller the domain is the more accurate is the approximation of the binding function We
shrink the input domain based on the final estimate of Lengthβ from last trial
As it turned out to be we choose an input domain of [1214]D = for Lengthβ and the
binding function is assumed to take the form of
ɶ1 11( )Length Lengthc dθ β β= +
(34)
The result for one run is displayed in Figure 10 below
Figure 10 OLS regression based on the 10 beta-theta points from one run
The estimated binding function based on the 10 points is
ɶ ( ) 17371+10838Length Lengthθ β β= (35)
as indicated by 2 09783R = the function describes the trend of points very well Since
the interval is quite small we could use the estimated function to approximate the
binding function
When it comes to more parameters in the route choice model what we do is simply to
add more elements in the binding function After getting a vector of β and the
corresponding vector ofɶ( )θ β binding functions of each element in vector ɶ( )θ β with
y = 17371x + 10838
Rsup2 = 09783
315
32
325
33
335
34
345
35
355
12 125 13 135 14
the
ta_
len
gth
beta_length
51
regard to all the elements in vector β are estimated One example is shown in the
Equation (29) and Equation (30)
62 Estimation of model with one attribute
The route choice model with one attribute we used is the one described in Section 61
above After several trials by shrinking input interval every time we finally affirm that
the true value Lengthβ of lies in a relatively small interval of [12 14] Based on this
domain 50K = runs are carried out to get statistics of the estimate of Lengthβ As
discussed in the experimental design several stages Smean different trials before final
affirmation of input interval yet for the statistics only one stage is carried out for each
run Within each run 10M = values of input Lengthβ are drawn for estimating binding
function
The estimation statistics of Lengthβ is shown in Table 5 below
Table 5 Statistics of estimation of beta_length
Parameter Lengthβ
Mean 1337353
Standard deviation 0107537
RMSE 0013227
In the table RMSE is the root-mean-square error which is used to measure the distances
between the observed values being estimated and the predicted values by the estimator
The individual differences are called residuals and RMSE is an aggregated measure of
the residuals To be specific
ɵ ɵ ɵ 2( ) ( ) (( ) )RMSE MSE Eθ θ θ θ= = minus (36)
in which ɵθ is the estimator and θ is the parameter to be estimated so the RMSE is the
square root of the mean square error As defined the smaller the value of RMSE is the
better the estimator is
52
Here the RMSE is calculated based on the ten points ɶ( ( ))mm mβ θ β for estimating binding
function so basically it describes the goodness of fit of the estimated binding function
with regard to the points we generated The Equation (36) is specified as
ɶ 2( ( )) (( ( ) ( )) )mm m mRMSE Meanθ β θ β θ β= minus (37)
The value of RMSE displayed in the Table 5 is the mean value of all the RMSE values
for 50 runs Seen from this we have well-estimated binding function for all the 50 runs
on average In terms of the estimates of binding function taking the one in Section 61 as
an example the binding function estimated in the interval of [12 14] in Equation (35)
has a positive constant and a positive coefficient for Lengthβ which indicates that with
larger value of Lengthβ we will get larger value ofɶ Lengthθ and as a result a negative
coefficient for length in the utility function of the logit model This is reasonable for
bigger Lengthβ reveals larger incremental effect on the cost of certain path while lower
ɶ- Lengthθ reveals larger disutility effect on certain path these two effects are in fact
equivalent
By the way the high fitness of binding function is probably due to the relatively small
input interval of Lengthβ after certain trials and shrinkage As the final estimate indicates
Lengthβ falls right into the interval of [12 14] with small standard deviation So we can
say that the estimate is quite good
63 Estimation of model with two attributes
We use the model described in the model specification section to carry out the estimation
Two attributes are used namely length and speed bump dummy Similar to the one
attribute case we carried out several trials and shrinkage to finally determine the
relatively small input intervals forLengthβ and SBβ [05 1] and [0 05] respectively
50K = runs are carried out to get statistics of the estimates of the two parameters Within
each run 10M = values are drawn for inputs Lengthβ and SBβ respectively for estimating
binding function
53
One important thing to mention here is that the inputs are drawn evenly from the domain
yet to guarantee that the values of Lengthβ and SBβ are independent from each other or to
get rid of collinearity49 the domains of two parameters are defined in two dimensions To
explain this more explicitly we choose data of one run as an example The input points of
( Lengthβ SBβ ) are shown in Figure 11 below
Figure 11 Scatter plot of the input values for beta_length and beta_sb
We can see from Figure 11 that the points spread evenly in the domain quadrant Based
on these draws we could estimate the binding function and evaluate the relationship
between parameters in the logit model and Lengthβ and SBβ without worrying about
possible correlation between Lengthβ and SBβ
As discussed before in the binding function we are supposed to find the relationship
between each of the parameters in the logit model and both parameters in the route choice
model Mathematically this binding function should be a surface in the 3D coordinate
system We take the results of one run as an example and thus we have ten sets of Lengthβ
and SBβ along with corresponding ɶ Lengthθ andɶ SBθ
49 A set of points is collinear if they lie on a single straight line or a projective line (for example projective line over any field) and this way the two factors represented by the points are correlated
0
005
01
015
02
025
03
035
04
045
05
05 06 07 08 09 1
be
ta_
sb
beta_length
54
For the first binding function ɶ Lengthθ and ( Lengthβ SBβ ) are plotted in Figure 12 below
And the binding function takes a form as described in Equation (29)
Figure 12 Scatter plot of theta_length with regard to beta_length and beta_sb
By multi-linear regression we can get a surface to approximate the binding function
locally The estimated binding function is displayed in Figure 13 below
Figure 13 Display of the estimated binding function for theta_length
And the first binding function has a formula of
55
ɶ 18234+16933 +00633Length Length SBθ β β= (38)
For the second binding function ɶSBθ and ( Lengthβ SBβ ) are plotted in Figure 14 below
And the binding function takes a form as described in Equation (30)
Figure 14 Scatter plot of theta_sb with regard to beta_length and beta_sb
By multi-linear regression we can get a surface to approximate the binding function
locally The estimated binding function is displayed in Figure 15 below
Figure 15 Display of the estimated binding function for theta_sb
56
And the second binding function has a formula of
ɶ -06698+00371 +17619SB Length SBθ β β= (39)
The t-test of estimated parameters in the binding function is carried out with null
hypothesis of zero Estimates that are significantly different from zero with 95
confidence interval are marked as bold
Table 6 Estimated coefficients of binding function for model with two attributes
Constant Lengthβ SBβ
ɶLengthθ 18234
(43632) 16933
(33481) 00633 (1392)
ɶSBθ -06698
(-7991) 00371 (0366)
17619 (19323)
Seen from the magnitude of coefficients in the binding functions both Lengthβ and SBβ
have positive effect on ɶ Lengthθ andɶ SBθ and in sequence negative effect on the coefficients
in the logit model In addition coefficients of SBβ with regard to ɶ Lengthθ and Lengthβ with
regard to ɶ SBθ are not significantly different from zero so we can say Lengthβ has a more
apparent effect on ɶ Lengthθ than SBβ does while SBβ has a more apparent effect on ɶ SBθ
than Lengthβ does
Based on the estimated binding functions and the true observation data we could get the
estimates of Lengthβ and SBβ as shown in Table 7 below
Table 7 Statistics of estimation of beta_length and beta_sb
Parameter Lengthβ
SBβ
Mean 0761383 0079874
Standard deviation 0068493 0034375
RMSE 0022772 0085113
Seen from the RMSE results the relatively small values indicate that we have well-
estimated binding functions for all the 50 runs on average With regard to the estimates of
parameters in the route choice model both of them fall into the input domain we choose
57
and the standard deviation is quite small So we can say that the estimates are actually
very good
One thing to notice here is that the final estimate of Lengthβ falls approximately in the
middle of the input domain [05 1] while the estimate of SBβ falls closer to the left limit
which might need further shrinkage of input domain and more precise estimate of the
binding function To get rid of this we use the binding function estimate from all the 500
points to give a hint on the reasonability of acceptance of the estimate of SBβ The scatter
plots of theta_sb against beta_sb and beta_length are shown in Figure 16 below
Figure 16 Scatter plots of theta_sb against beta_sb and beta_length
The scatter plots in Figure 16 above are the decompositions of the binding function from
three dimensions to two dimensions Seen from the linear regression in the two plots ɶSBθ
is almost strictly positive proportional to SBβ and hardly effected byLengthβ This means
y = 19132x - 06404
Rsup2 = 0936
-1
-08
-06
-04
-02
0
02
04
06
0 01 02 03 04 05
the
ta_
sb
beta_sb
y = 00123x - 01717
Rsup2 = 4E-05
-1
-08
-06
-04
-02
0
02
04
06
05 06 07 08 09 1
the
ta_
sb
beta_length
58
that by shrinking the input domain ofSBβ we would probably get the same estimate of
binding function since it changes little in current domain And this leads to our
acceptance of the final estimate of SBβ
Given that we have a random cost following a truncated standard normal distribution and
the magnitudes of the estimated parameters are relatively small this would mean that the
randomness of the cost function are relatively large which in sequence leads to relatively
large randomness in individualrsquos choice of route
Another thing to be mentioned is that the magnitude of Lengthβ is smaller than that when
estimated singly Though these two values are not logically comparable with different
formation of random term in the cost function we could still get a hint from the
comparison This difference is probably due to the form of random cost we used which is
( )li Length l Lengthx E xε sdot and the effect of length on the cost is partially captured by this
random term
64 Estimations of other trial formulations of the model
641 Model with exponential form of cost function
During the process of estimation we carried out a lot of other trials in the formulations of
the basic route choice model the cost function to be specific and the auxiliary logit model
As it turned out the there are negative estimates of coefficients in the cost function
which conflicts our anticipation To capture this kind of negative estimation we choose to
use the exponential form of the cost function Without loss of generality the random term
is not scaled by the length of links The cost function is specified as
( ) Length Length l SB SB l lix x
i lic x eβ β εε + += (40)
Two attributes are used namely length and speed bump dummy variable Unlike the form
in Section 63 we allow the parameters Lengthβ and SBβ to have negative input and the
random term liε now follow a standard normal distribution without truncation Since we
take the exponential form of the cost function the cost of links could be kept positive
thus allowing the use of Dijkstrarsquos Algorithm to operate
59
In terms of the auxiliary model since we could have more attributes in the auxiliary
model than the underlying model Instead of using the same attributes as in the cost
function we choose to add an attributes which is number of links in the pathLNx So the
utility function of the logit model is specified as
- - -ri Length Length r SB SB r LN LN r riU x x xθ θ θ ε= + (41)
We still expect the value of θ to be positive and the coefficient of variables with the form
of -θ would be negative
Several trials and shrinkage were carried out for this formulation of our model to finally
determine the relatively small input intervals forLengthβ and SBβ [25 27] and [-05 0]
respectively 15K = runs are carried out to get statistics of the estimates of the two
parameters Within each run 10M = values are drawn for inputs Lengthβ and SBβ
respectively for estimating binding function
To visualize the trend of binding function more clearly we make use all the 150 sets of
vector β and vector θ to estimate the binding function Since we have three variables in
the logit model we have to estimate three binding functions
For the first binding function ɶ Lengthθ and ( Lengthβ SBβ ) are plotted in Figure 17 below
shown along with the estimated binding function
Figure 17 Scatter plot of theta_length against beta_length and beta_sb estimated binding function
The first binding function takes the form of
ɶ 41312+09114 +44845 10Length Length SBθ β βminus= sdot (42)
60
For the second binding function ɶSBθ and ( Lengthβ SBβ ) are plotted in Figure 18 below
shown along with the estimated binding function
Figure 18 Scatter plot of theta_sb against beta_length and beta_sb estimated binding function
The second binding function takes the form of
ɶ 01147 01362 +07119SB Length SBθ β β= minus (43)
For the third binding function ɶ LNθ and ( Lengthβ SBβ ) are plotted in Figure 19 below
shown along with the estimated binding function
Figure 19 Scatter plot of theta_ln against beta_length and beta_sb estimated binding function
The third binding function takes the form of
ɶ 10043 03378 +00068LN Length SBθ β β= minus (44)
The t-test of estimated parameters in the binding function is carried out with null
hypothesis of zero Estimates that are significantly different from zero with 95
confidence interval are marked as bold
61
Table 8 Estimated coefficients of binding functions for model with exponential cost function
Constant Lengthβ SBβ
ɶLengthθ 1312
(2411) 09114 (4360)
4484510-4 (0005)
ɶSBθ 01147
(0425) -01362 (-1314)
07119 (17221)
ɶLNθ 10043
(13767) -03378
(-12051) 00068 (0607)
Same as in the model with two attributes ɶ Lengthθ andɶ SBθ are significantly affected by
Lengthβ and SBβ respectively The negative signs for Lengthβ in the second and third binding
functions draw our attention Since in the second binding function it is not significantly
different from zero we can disregard the effect In the third binding function Lengthβ has
significantly negative effect on ɶ LNθ The larger value of Lengthβ we have the more
influential of path length on cost is With negative effect on ɶ LNθ we can say at the same
time number of links become less influential on the utility This is reasonable since
intuitively if we are sensitive to the path length we wouldnrsquot care too much of having to
switch several more or fewer links based on that path length and number of links are
more or less correlated to each other
Based on the estimated binding functions and the true observation data we could get the
estimates of Lengthβ and SBβ as shown in Table 9 below
Table 9 Statistics of estimation of beta_length and beta_sb in exponential-cost-function model
Parameter Lengthβ
SBβ
Mean 2537672 -045601
Standard deviation 0068377 0133036
We have negative estimate of SBβ which conflicts our assumption that length and
presence of speed bump on the path may increase the cost of traveling through certain
path This is probably due to omission of important attributes in the deterministic part of
the cost function Based on the estimate we are led to think that presence of speed bump
decrease the cost and individuals would prefer to drive on paths with speed bumps Yet
62
this is not true based on our estimation since we are only using two attributes And there
are great chance that some important features are not captured which accidentally are
related with speed bump So the estimate of SBβ is misleading per se in the simple model
as we are using To get more accurate estimate of SBβ we may need to include more
variables in the deterministic part of the cost function
642 Model with estimated scale parameter for random term
Considering the trial with two attributes in Section 63 we add a fixed scale parameter to
the random term to make it proportional to the length of links This appeals to our
assumption yet lays restrictions to the model Apart from this we also try to add an
unfixed scale parameter σ and estimate it along with the other two parameters Lengthβ and
SBβ Note that if we add a scale parameter directly to the random term it wonrsquot work out
as we expect since that way the scale parameter will scale the other two parameters
Lengthβ and SBβ as well as shown below
= ( )Length SBLength Length l SB SB l li Length l SB l lix x x x
β ββ β ε σ σ εσ σ
+ + sdot + + (45)
The right side equation is equivalent to Length Length l SB SB l lix xβ β ε+ + thus making no
difference So we choose to add a new random term including the scale parameter In
addition since we can get good estimate by assuming the random term proportional to
length we will keep this in the newly added random term Now the cost function is
specified as
1 ( ) + ( )l li li Length Length l SB SB l li li Length l Lengthc x x x x Mean xε ε β β ε η σ= + + sdot sdot 2
(46)
liε and liη follow the same truncated normal distribution but are drawn separately so that
they are not equal
In terms of the auxiliary model since now we have three parameters to be estimated in
the underlying model we need one more attribute in the logit model and number of links
in the path LNx is chosen The utility function of the logit model is actually the same as in
Section 641 which is
- - -ri Length Length r SB SB r LN LN r riU x x xθ θ θ ε= + (47)
63
With three parameters in the underlying model it is more reasonable to include
interactions of parameters in the binding function The binding functions take the form of
ɶ
1 2 3
4 5 6 7
( )
Length SB
Length SB Length SB Length SB
c d d d
d d d d
θ β β β σβ β β σ β σ β β σ
= + + +
+ + + + (48)
Since the estimates are not good we did not carry out too many trials to center the input
interval As a result the binding function may be of more interest in this case The chosen
interval is a trial one which is identical [0 3] for Lengthβ SBβ andσ We choose ten sets of
mβ and ɶ ( )m mθ β from one run as an example The values of ɶ ( )m mθ β are plotted against
Lengthβ SBβ andσ respectively The interactions are not shown in the figure yet we have
the estimates of binding function which will give a numerical description of how the
interactions impact theɶ ( )m mθ β
Figure 20 Plots of theta_length against beta_length beta_sb and sigma respectively
y = 09114x + 27818
Rsup2 = 07361
0
1
2
3
4
5
6
0 1 2 3 4
the
ta_
len
gth
beta_length
y = 03568x + 36215
Rsup2 = 00897
0
1
2
3
4
5
6
0 1 2 3 4
the
ta_
len
gth
beta_sb
y = 02572x + 38468
Rsup2 = 00516
0
1
2
3
4
5
6
0 1 2 3
the
ta_
len
gth
sigma
64
Figure 21 Plots of theta_sb against beta_length beta_sb and sigma respectively
y = 02363x + 0835
Rsup2 = 0088
0
05
1
15
2
25
3
0 1 2 3 4
the
ta_
sb
beta_length
y = 06351x + 01759
Rsup2 = 05054
0
05
1
15
2
25
3
0 1 2 3 4
the
ta_
sb
beta_sb
y = -03801x + 17212
Rsup2 = 02001
0
05
1
15
2
25
3
0 1 2 3
the
ta_
len
gth
sigma
y = 00477x + 04521
Rsup2 = 005460
02
04
06
08
1
0 1 2 3 4
the
ta_
ln
beta_length
y = -00553x + 06156
Rsup2 = 00582
0
02
04
06
08
1
0 1 2 3 4
the
ta_
ln
beta_sb
65
Figure 22 Plots of theta_ln against beta_length beta_sb and sigma respectively
As we can see from the three figures above ɶ Lengthθ ɶSBθ and ɶ LNθ are more affected by
Lengthβ SBβ andσ respectively Especially we can see a strong relationship between ɶ LNθ
and σ which assures that number of links can be used to infer the scale parameter in the
underlying model
The estimates of three binding functions are shown in Table 10 below with each row
representing the estimates for one of the three binding function and each column
representing certain variable in the binding function In the parenthesis below each
estimate of the coefficients is the t-test value with the null hypothesis of zero We take the
90 confidence interval and estimates with t-test value larger than 164 are supposed to
be significantly different from zero which are marked as bold
Table 10 Estimates of three binding functions
Constant Lengthβ SBβ σ
Length SBβ β
Lengthβ σ
SBβ σ Length SBβ β σ
ɶLengthθ
1814 (3085)
0861 (2417)
-0089 (-0258)
1038 (2913)
0202 (1030)
-0246 (-1240)
-0056 (-0292)
-0045 (-0412)
ɶSBθ 0284
(1482) -0125
(-1081) 0942
(8371) -0247
(-2127) 0118
(1856) 0070
(1086) -0141
(-2275) -0067
(-1883)
ɶLNθ 0819
(18643) 0015
(0577) -0026
(-0997) -0261
(-9794) 0006
(0419) 0007
(0498) 0024
(1663) -0007
(-0803)
As the constants indicate given no other attributes length and number of links have more
negative effects on the utility than the speed bump dummy does Judging from the
significance of coefficients for the three input parametersɶ Lengthθ ɶSBθ and ɶ LNθ are
significantly affected by Lengthβ SBβ andσ respectively As we can see σ has a negative
y = -02164x + 08218
Rsup2 = 09867
0
02
04
06
08
1
0 1 2 3th
eta
_ln
sigma
66
effect on ɶSBθ andɶ LNθ Since to some extent σ measures the scale of randomness we
could say that the more randomness of the costs on the links have the less influential of
presence of speed bump and number of links become ForɶSBθ it is significantly affected
by some of the interaction terms Notice that SBβ has positive effect onɶSBθ while σ has
effect The interaction terms including both σ and SBβ have negative effect onɶSBθ which
indicates that randomness of cost is more influential than presence of speed bump on the
disutility of speed bump
In terms of the final estimate as stated above the estimates of Lengthβ and SBβ have
negative signs whileσ has positive sign This result conflict our expectation that Lengthβ
and SBβ should have positive signs so we did not carry out more trials and shrinkage The
possible reason for negative estimate is similar to that in the model with exponential form
of cost function Given more attributes in the deterministic part of both the cost function
and utility function in the logit model we might be able to capture the features of the data
better and have the right sign in the final estimates
643 Monte Carlo evidence of model with estimated scale parameter for random
term
Based on the model formulation with estimated scale parameter for random term we also
carried out a Monte Carlo simulation experiment to verify the efficiency of using number
of links in the logti model to infer the scale parameter in the cost function and what we
do is to simulated observations instead of the true ones
We take three arbitrary values for the three parameters in the cost functionLengthβ SBβ and
σ to be 05 And simulated observations are generated based on the given values of
parameters in the cost function Since we know the true values for the parameters the
input domain is centered around the true values to be [04 06] for Lengthβ SBβ andσ
10K = runs are carried out to get statistics of the estimates of the three parameters
Within each run 10M = values are drawn for inputsLengthβ SBβ andσ respectively for
estimating binding function
67
In terms of the binding function by doing regression test we can see that the intersection
terms are unnecessary to be included or even hazardous for good estimate of binding
function so we decide to remove them and keep the binding function as
ɶ1 2 3( ) Length SBc d d dθ β β β σ= + + + (49)
We choose ten sets of mβ and ɶ ( )m mθ β from one run as an example The values of
ɶ ( )m mθ β are plotted againstLengthβ SBβ andσ respectively
Figure 23 Plots of theta_length against beta_length beta_sb and sigma respectively
y = 23826x + 14791
Rsup2 = 05326
15
2
25
3
35
04 05 06
the
ta_
len
gth
beta_length
y = -06434x + 30245
Rsup2 = 0048115
2
25
3
35
04 05 06
the
ta_
len
gth
beta_sb
y = 26255x + 14156
Rsup2 = 07607
15
2
25
3
35
04 05 06
the
ta_
len
gth
sigma
y = -02443x + 04708
Rsup2 = 0034
0
01
02
03
04
05
04 05 06
the
ta_
sb
beta_length
y = 11233x - 02096
Rsup2 = 089020
01
02
03
04
05
04 05 06
the
ta_
sb
beta_sb
68
Figure 24 Plots of theta_sb against beta_length beta_sb and sigma respectively
Figure 25 Plots of theta_ln against beta_length beta_sb and sigma respectively
The figures show similar trend to those in the trial model with estimated scale parameters
which is in line with our expectation
The estimates of three binding functions are shown in Table 11 below with each row
representing the estimates for one of the three binding function and each column
y = -04374x + 056
Rsup2 = 01283
0
01
02
03
04
05
04 05 06
the
ta_
sb
sigma
y = -01144x + 07619
Rsup2 = 01114066
067
068
069
07
071
072
073
074
04 05 06
the
ta_
ln
beta_length
y = 0053x + 06768
Rsup2 = 00296066
067
068
069
07
071
072
073
074
04 05 06
the
ta_
ln
beta_sb
y = -03115x + 08561
Rsup2 = 09717
066
067
068
069
07
071
072
073
074
04 05 06
the
ta_
ln
sigma
69
representing certain variable in the binding function In the parenthesis below each
estimate of the coefficients is the t-test value with the null hypothesis of zero We take the
95 confidence interval and estimates with t-test value larger than 196 are supposed to
be significantly different from zero which are marked as bold
Table 11 Estimates of three binding functions in the Monte Carlo experiment
Constant Lengthβ SBβ σ
ɶLengthθ 0853
(3606) 1009
(3724) -0034
(-0125) 2569
(9482)
ɶSBθ -0062
(-0385) -0104
(-0564) 1208
(6591) -0226
(-1227)
ɶLNθ 0854
(46688) 0013
(0624) -0004
(-0185) -0302
(-14428)
The estimates of binding function have similar characteristics as in the trial model with
estimated scale parameters as well They contain almost the same significant coefficients
and those significant estimates have the same signs as in the trial with true observations
Based on the estimated binding function and the simulated observations given true values
of the three parameters to be 05 the final estimates of Lengthβ SBβ andσ are shown in
Table 12 below
Table 12 Statistics of estimation of beta_length beta_sb and sigma in the Monte Carlo experiment
Parameter Lengthβ
SBβ σ
Mean 0404138359 0458624533 0639191487
Standard deviation 1109279424 0242570421 0377069799
As we can see the estimates of Lengthβ SBβ andσ are quite close to their true values What
is not satisfying is that the estimate of σ is a little large and lies outside the input domain
of [04 06] but is still quite near to this interval In addition the estimate of Lengthβ is
within the input domain yet the variation is large This is understandable since we scale
the random term by length together with the scale parameter and thus the parameter for
length could be influenced by the random term and turns out to have large variations In a
word the result of Monte Carlo experiment verifies that we get use the model
70
formulation with unfixed scale parameter for the random term to get the right estimate of
the true values And number of links is strongly related withσ which means that it is
reasonable and efficient to use it as a reference to σ in the cost function
71
7 Conclusions
This thesis aims at implementing the newly proposed route choice model based on
indirect inference in true observations The model assigns links specific errors for a
network which allows natural correlations among paths and is practical in simulating
observations by means of shortest path searching algorithms like the Dijkstrarsquos Algorithm
used in our experiment To get consistent estimation of this kind of model indirect
inference method is used and a simple model like logit model is used as an auxiliary
model The route choice model and indirect inference estimator has been tested on
synthetic data with simulated observations and proved to be capable of consistently
estimated
Compared to the synthetic experiment some extensions are done in this thesis By
replacing the simulated observations with the true observations the method is tested on
the empirical circumstance to prove that it could be used in solving practical problems
The true observations have more noises than the simulated ones thus more difficulty to
capture their features We know neither the right formulations of models based on the
data nor the values of parameters in the route choice model yet as defined the
parameters should have positive signs As it turned out to be in the experiment with only
length in the model we get the estimates of Lengthβ as 1337 while with two attributes in
the model we get the estimates of Lengthβ and SBβ as 0761 and 00799 respectively The
estimates in both experiments seem reasonable with the right sign In addition seen from
the estimation of the binding function the coefficients in the logit model is negatively
affected by the parameters they infer in the basic route choice model in the two attributes
case one parameter in the logit model is more apparently affected by the parameter it
refers than the other parameter in basic model
In the trial where we include a scale parameter to the random term and estimate it along
with the other parameters in the route choice model a Monte Carlo simulation
experiment is carried out using simulated observations The result shows that it is
efficient to use number of links in the auxiliary model to infer the scale parameter in the
basic rout choice model
72
In other trial formulations of the model we got negative estimates which may probably
be due to missing attributes in the cost function Future work should be done to include
more attributes
Another thing to recommend for future is that we generate the pseudo-universal choice
set as part of the auxiliary model Since the pseudo-universal choice set is partially used
for deciding which ODs and observations to be used in the project it is essential and
should be generated beforehand But from the choice set generation point of view we
could generate individual specific choice set directly instead of random drawing paths
from the pseudo-universal choice set This would increase computational efficiency
73
Bibliography
Axhausen K Schoumlnfelder S Wolf J Oliveira M amp Samaga U (2003) 80 Weeks of
GPS Traces Approaches to Enriching the Trip Information Transportation Research
Record 1870 46-54
Azevedo J Costa M Madeira J amp Martins E (1993) An Algorithm for the Ranking
of Shortest Paths European Journal of Operational Research 69 (1) 97-106
Bartels K Boztug Y amp Muumlller M (1999) Testing the Multinomial Logit Model
Working paper University Potsdam Germany
Bekhor S Ben-Akiva M amp Ramming M (2002) Adaptation of Logit Kernel to Route
Choice Situation Transportation Research Board of the National Academics 1805 78-85
Bekhor S Ben-Akiva M amp Ramming M (2006) Evaluation of Choice Set Generation
Algorithms for Route Choice Models Annals of Operations Research 114 (1) 235-247
Ben-Akiva M amp Bierlaire M (1999) Discrete Choice Methods and Their Applications
to Short Term Travel Decisions In Chapter for the Transport Science Handbook
Preliminary Draft
Ben-Akiva M amp Bierlaire M (2003) Discrete Choice Models with Applications to
Departure Time and Route Choice In Handbook of Transportation Science (second ed)
Kluwer
Ben-Akiva M amp Bolduc D (1996) Multinomial Probit with a Logit Kernel and a
General Parametric Specification of the Covariance Structure Working Paper
Ben-Akiva M amp Lerman S (1985) Discrete Choice Analysis Theory and Application
to Travel Demand MIT Press
Ben-Akiva M Bergman M Daly A amp Ramaswamy R (1984) Modeling Inter Urban
Route Choice Behaviour In J Vollmuller amp R Hamerslag (Ed) the 9th International
Symposium on Transportation and Traffic Theory (pp 299-330) Utrecht Netherlands
VNU Science Press
Cascetta E Nuzzolo A Russo F amp Vitetta A (1996) A Modified Logit Route Choice
Model Overcoming Path Overlapping ProblemsSpecification and Some Calibration
Results for Interurban Networks In J Lesort (Ed) the 13th International Symposium on
Transportation and Traffic Theory Lyon France
74
Creel M (2009) A Data Mining Approach to Indirect Inference Universitat Autonoma
de Barcelona Department of Economics and Economic History
De La Barra T Peacuterez B amp Anez J (1993) Multidimensional Path Search and
Assignment 21st PTRC Summer Meeting (pp 307-319)
Dijkstra E (1959) A note on two problems in connexion with graphs Numerische
Mathematik 1 269-271
Frejinger E amp Bierlaire M (2007) Capturing Correlation with Subnetworks in Route
Choice Models Transportation Research Part B 41 363-378
Frejinger E Bierlaire M amp Ben-Akiva M (2009) Sampling of Alternatives for Route
Choice Modeling Transportation Research Part B Methodological 43 (10) 984-994
Gallant A amp McCulloch R (2004) On the Determination of General Scientific Models
Manuscript Duke University
Gourieacuteroux C Monfort A amp Renault E (1993) Indirect Inference Journal of Applied
Econometrics 8 85-118
Karlstroumlm A Sundberg M amp Wang Q (2011) Consistently estimating flexible route
choice models using an MNL lense International Choice Modeling Conference Leeds
Keane M amp Smith A (2003) Generalized Indirect Inference for Discrete Choice
Models Manuscript Yale University
Manski C amp Lerman S (1977) The Estimation of Choice Probabilities from Choice
Based Samples Econometrica 45 (8) 1977-1988
McFadden D (1974) Conditional Logit Analysis of Qualitative Choice Behaviour (P
Zarembka Ed) Frontiers in Econometrics 105-142
McFadden D (1978) Modeling the Choice of Residential Location In A Karlqvist L
Lundqvist F Snickars amp J Weibull (Ed) Spatial Interaction Theory and Residential
Location (pp 75-96) Amsterdam North-Holland
McFadden D amp Train K (2000) Mixed MNL Models for Discrete Response Journal
of Applied Econometrics
Nerella S amp Bhat C (2004) Numerical Analysis of Effect of Sampling of Alternatives
in Discrete Choice Models Transportation Research Record 1894 11-19
Ramming M (2001) Network Knowledge and Route Choice PhD Thesis Massachusetts
Institute of Technology
75
Schoumlnfelder S amp Samaga U (2003) Where Do You Want to Go Today-More
Observations on Daily Mobility Third Swiss Transport Research Conference Ascona
Schoumlnfelder S Axhausen K Antille N amp Bierlaire M (2002) Exploring the
Potentials of Automatically Collected GPS Data for Travel Behaviour Analysis- A
Swedish Data Source i J Moumlltgen amp A Wytzisk (Red) GI-Technologien fuumlr Verkehr
und Logistik number 13 Institut fuumlr Geoinformatik Universitaumlt Muumlnster (ss 155-179)
Munster IfGIprints
Smith A (1993) Estimating Nonlinear Time-series Models Using Simulated Vector
Autoregressions Journal of Applied Econometrics 8 63-84
Smith A (2008) Indirect Inference In S Durlauf amp L Blume (Eds) The New
Palgrave Dictionary of Economics (Second ed) Palgrave Macmillan
Smith A (1990) Three Essays on the Solution and Estimation of Dynamic
Macroeconomic Models PhD Dissertation Duke University
Train K (2003) Discrete Choice Methods with Simulation Cambridge University Press
Vovsha P amp Bekhor S (1998) Link-nested Logit Model of Route Choice-Overcoming
Route Overlapping Problem Transportation Research Record 1645 133-142
Wang H (2011) Logistics Distribution Shortest Path Based on Dijkstra Algorithm
Computer and Digital Engineering 3
Assigned publication number
TSC-MT 11-016
wwwkthse

2
Abstract
In the thesis a proposed route choice model is tested on the empirical observation data
The model gives link specific errors to the links in the network which allows natural
correlation structure among paths Indirect inference method is used to consistently
estimate the route choice model and a logit model is chosen to be the auxiliary model
The observation data with multiple OD pairs was collected in the Borlaumlnge a city located
in the middle part of Sweden Two main experiments are carried out one with only one
attribute length to be specific in the route choice model and the other with two attributes
namely length and speed bump dummy The final estimates of parameters have positive
signs as anticipated and the magnitudes are reasonable In addition judging from the
estimated binding functions parameters in the cost function have negative effect on
utility in the logti model and the parameter in the logit model are more apparently
affected by its indirectly inferred parameter in the route choice model than the others do
Some other trials of the model are also carried out but the estimates are not satisfying
This may be due to lack of attributes in the route choice model and further suggestion on
better defined model is given out A Monte Carlo experiment is also carried out to test
the efficiency of model with unfixed scale parameter to the random term in the route
choice model
Acknowledgement
I would like to show my sincere gratitude to my supervisor Anders Karlstroumlm who has
been giving patient instructions and brilliant ideas during the past few months on how the
thesis moves on Without all these I couldnrsquot have finished it in time with fine quality
My work is basically started from the work dedicated by Vivian who helped me a lot in
getting familiar with relevant theories Marcus paid attention to my work intently and
gave inspiring advices on possible modifications of the model In addition Per guided me
a lot in using C I would like to thank these colleagues for their useful help
Of course my thanks go to all that are in the office of TLA who contribute to the
wonderful atmosphere where I worked happily on my thesis
3
Contents Abstract 2
Acknowledgement 2
List of Figures 5
List of Tables 6
1 Introduction 7
11 Motivation 7
12 Background 7
13 Objective 8
14 Scope of the Thesis 9
2 Literature Review11
3 Methodology 18
31 Multinomial Logit Model (MNL) 18
311 Model Description 18
312 Model Estimation 21
32 Dijkstrarsquos Algorithm 22
321 Introduction 22
322 Algorithm 23
323 Explanatory Example 24
324 Discussion 26
33 Indirect Inference 26
331 Introduction 26
332 Definition of the method 27
333 Choices of the metrics 29
334 Consistency Interpretation 30
34 Model Specification in the Thesis 30
341 Basic Route Choice Model 30
342 Auxiliary Model 33
343 Consistency Discussion 35
344 Binding Function 37
4 Data 39
41 Road Network 39
42 Observation Data 42
43 Further Exploration of data 44
4
5 Experiment Design 46
6 Results 49
61 Validation of Binding Function 49
62 Estimation of model with one attribute 51
63 Estimation of model with two attributes 52
64 Estimations of other trial formulations of the model 58
641 Model with exponential form of cost function 58
642 Model with estimated scale parameter for random term 62
643 Monte Carlo evidence of model with estimated scale parameter for random term 66
7 Conclusions 71
Bibliography 73
5
List of Figures
Figure 1 S-shaped relationship between probability and deterministic part of utility 20
Figure 2 A simple network for Dijstrrarsquoa Algorithm explanation 24
Figure 3 Illustration of the Borlaumlnge road network 39
Figure 4 Histogram of link length data 40
Figure 5 Histogram of link length data (zoomed within 1km) 41
Figure 6 Illustration of links with speed bumps 41
Figure 7 Histogram of link numbers in observations data set 43
Figure 8 Illustration of the flow in the experiment 46
Figure 9 Scatter plots of the 90 beta-theta pairs 49
Figure 10 OLS regression based on the 10 beta-theta points from one run 50
Figure 11 Scatter plot of the input values for beta_length and beta_sb 53
Figure 12 Scatter plot of theta_length with regard to beta_length and beta_sb 54
Figure 13 Display of the estimated binding function for theta_length 54
Figure 14 Scatter plot of theta_sb with regard to beta_length and beta_sb 55
Figure 15 Display of the estimated binding function for theta_sb 55
Figure 16 Scatter plots of theta_sb against beta_sb and beta_length 57
Figure 17 Scatter plot of theta_length against beta_length and beta_sb estimated binding
function 59
Figure 18 Scatter plot of theta_sb against beta_length and beta_sb estimated binding
function 60
Figure 19 Scatter plot of theta_ln against beta_length and beta_sb estimated binding
function 60
Figure 20 Plots of theta_length against beta_length beta_sb and sigma respectively 63
Figure 21 Plots of theta_sb against beta_length beta_sb and sigma respectively 64
Figure 22 Plots of theta_ln against beta_length beta_sb and sigma respectively 65
Figure 23 Plots of theta_length against beta_length beta_sb and sigma respectively 67
Figure 24 Plots of theta_sb against beta_length beta_sb and sigma respectively 68
Figure 25 Plots of theta_ln against beta_length beta_sb and sigma respectively 68
6
List of Tables
Table 1 Descriptive statistics of link length 40
Table 2 Descriptive statistics of link numbers in observation data set 43
Table 3 Descriptive statistics of estimated travel time on links 44
Table 4 Descriptive statistics of duration of trips 45
Table 5 Statistics of estimation of beta_length 51
Table 6 Estimated coefficients of binding function for model with two attributes 56
Table 7 Statistics of estimation of beta_length and beta_sb 56
Table 8 Estimated coefficients of binding functions for model with exponential cost
function 61
Table 9 Statistics of estimation of beta_length and beta_sb in exponential-cost-function
model 61
Table 10 Estimates of three binding functions 65
Table 11 Estimates of three binding functions in the Monte Carlo experiment 69
Table 12 Statistics of estimation of beta_length beta_sb and sigma in the Monte Carlo
experiment 69
7
1 Introduction
11 Motivation
With the development of ITS there is a stronger desire for more accurate and efficient
vehicle orientation systems and devices which relies much on the mechanism of route
choice models In other cases well estimated route choice models reveals travel behavior
of the car drivers which contributes to system-scaled analysis such as design and
appraisal of road pricing system across the road network On the other hand newly
developed GIS techniques provide sufficient route choice data as solid basement for
research on route choice behaviors Both the desire for better developed model and more
available prerequisites stimulate the research on route choice modeling
12 Background
Route choice modeling has been discussed for a long time Given a basement network
composed by a finite number of nodes which are connected by directed links we assume
that individuals travel from an origin node to a destination node in the network Thus the
choice of an individual turns out to be an observed path represented by a sequence of
links considering inherent attributes of links such as length or presence of speed bumps
From this point of view individuals make discrete choices the behavioral mechanism of
which could be seen in two different ways Individuals could either be seen as choosing
links from each junction node or choosing from possible paths connecting the origin node
and the destination one In line with a great body of literatures we focus on the path-
based approaches to develop our model
There are two important issues that need to be considered for this kind of approach
namely the generation of choice set and model formulation to address alternative
correlation due to path overlapping To be specific when we assume that individuals
choose from paths connecting the origin and destination it is infeasible to enumerate the
full-size choice set or universal choice set which includes all possible paths between the
OD pair in a given road network Individuals may not virtually consider the universal
choice set when they make decisions and in practice algorithms implemented to find the
shortest paths avoid the usage of choice set at all such as the Dijkstrarsquos algorithm we
implement in the model Hence we give each individual the right to consider all possible
8
paths It is common practice to generate samples from the universal choice set yet this
may easily introduce biases to the estimation Samples are supposed to be randomly
drawn from the population and good samples can reproduce the features in the population
Since in real-size network it is impossible to know the full-size choice set let alone to
reproduce the features of it We could only draw from certain known paths and this is
more like an importance sampling which gives links different possibilities to the drawn
into paths As a result estimation based on the sampled paths will have biases
The other problem with regard to path-based approaches is the inherent limitation of
multinomial logit model (MNL) which requires no correlation among alternatives This
is practically unrealistic since in the context of route choice modeling paths sharing
certain links are correlated due to unobserved features of the common links Numerous
literatures contribute to improvement in terms of the problem based on logit models
We choose to use an approach with additive link specific errors which belongs to probit-
like models This kind of model is efficient for applications yet it is still not able to be
estimated consistently given a partial choice set So we turn to indirect inference as the
tool to estimate the probit-like model with additive link specific errors All feasible paths
for each individual are technically allowed which means that a universal choice set is
provided for each OD pair to avoid bias caused by sampling from full choice sets The
universal choice set generated here is a so-called pseudo-universal choice set which
contains as many feasible paths as desired to eliminate possible biases but not all paths
since it is practically impossible to get the true universal choice set We choose to use an
MNL model as the auxiliary model which is easy to estimate The estimate of MNL
model is biased based on the choice set we generate as discussed above yet the estimate
of parameters in the basic route choice model will be consistent thanks to the features of
the indirect inference method
13 Objective
A Monte Carlo simulation experiment has been carried out based on synthetic trip data
and real-sized road network to appraise the proposed model (See Karlstroumlm Sundberg amp
9
Wang 2011)1 The basic route choice model includes two attributes namely length and
speed bump dummy while an MNL model is chosen as the auxiliary model with the
same two attributes Simulated trip data given two pseudo-true values for coefficients of
length and speed bump dummy are used as a substitution of the empirical data The
presence of speed bumps is randomly allocated over the network Estimation results and
sensitivity test confirm the efficiency and consistency of the proposed estimator
What needs to be done in the thesis is that true trip data should be implemented as well as
the modification of the network To be specific realistic speed bump distribution is used
to replace the randomly allocated one Without knowing the true values of the
coefficients several iterations need to be carried out to get to know the raw domain of the
values and by shrinking input intervals more accurate estimates will be attained as the
accomplishment of the thesis
14 Scope of the Thesis
Based on the route choice model used in the synthetic experiment extensions are done in
five main aspects First we implement the newly proposed estimator in real world issues
by replacing the simulated observations with the true observations collected in a real
world network Unlike the simulated data which is generated following certain
assumptions the true observations have more noises inside and thus more difficult to
capture their features Second the observations we use contain many OD pairs and not
restricted with one or four of them as in the synthetic experiment this gets rid of the
possibility of bias caused by restricted OD pairs Third since we are implementing the
new method in true observations the formulation of route choice model cost function to
be specific is not known beforehand and correspondingly the formulation of the utility
function in the logit model is not for sure as well We need several trials to get well
defined formulations to capture the features of the data Fourth we have no idea what the
parameters are like based on true observation and thus a raw guess of input domain is
needed at first and centered with shrinkage in later iterations Last but not least in one
trial we included a scale parameter to the random term in the cost function and use
number of links in the auxiliary model to infer it To test the efficiency of this trial a
1 Karlstroumlm A Sundberg M amp Wang Q (2011) Consistently estimating flexible route choice models using an MNL lense International Choice Modeling Conference Leeds
10
Monte Carlo simulation experiment is carried out with some arbitrary pseudo-true values
of the parameters based on which simulated observations are used
On the other hand what is done in the synthetic experiment such as test with simulated
observations for one OD and four ODs sensitivity of estimates with choice set size and
number of observations is not included in this thesis Instead we will identify some
limitations of the model formulation tried in the thesis and make suggestions how the
model can be improved
As follows Section 2 reviews relevant literatures on route choice modeling as well as
indirect inference In Section 3 relevant methods are introduced in detail as backgrounds
afterwards methods and models used in this thesis are illustrated Section 4 gives
description of the empirical data we use for estimating and Section 5 shows the
estimation results of the Monte Carlo simulation-based experiment followed by some
conclusions in Section 6
11
2 Literature Review
Route choice modeling has long been discussed and many efforts have been made to
solve this problem Simple and easy to estimate the multinomial logit model (MNL) is
widely used in choice modeling yet it has certain restrictions to be implemented in route
choice context Due to its inherent property of Independence from Irrelevant Alternatives
(IIA) the multinomial logit model is not easily applicable since routes in the choice set
tend to be correlated with the presence of overlapping paths Cascetta et al (1996)
proposed a correction term called Commonality Factor (CF) in the deterministic part of
the utility function2 And the probability of path i to be chosen from the choice set nC
becomes( )
( )( | )in in
jn jn
n
V CF
n V CF
j C
eP i C
e
micro
micro
minus
minus
isin
=sum
As proposed by Cascetta et al the Commonality
Factor is specified as ln ( )n
ijin CF
j C i j
LCF
L Lγβ
isin
= sum in which ijL is the length of links
common to path i and pathj while iL and jL are the total length of path i and pathj
respectively The parameter γ is left to be estimated or practically constrained to a fixed
value like 1 or 2 The CF term of one path is proportional to the length of overlapping
part with other paths This proposed model is referred to as C-Logit model Bearing some
similarities Ben-Akiva and Bierlaire (1999) proposed the Path Size Logit (PSL) model3
This model is based on a different theoretical basis as the C-Logit The original
formulation of Path Size (PS) comes from the discrete choice theory of aggregate
alternatives Similar to the CF in C-Logit the log of Path Size (PS) is added to the utility
function The probability of path i to be chosen from the choice set nC becomes
( ln )
( ln )( | )in in
jn jn
n
V PS
n V PS
j C
eP i C
e
micro
micro
+
+
isin
=sum
The Path Size is specified as
1
i n
n
ain
a Ciaj
j C j
lPS
LL
LδisinΓ
isin
= sumsum
in
2 Cascetta E Nuzzolo A Russo F amp Vitetta A (1996) A Modified Logit Route Choice Model Overcoming Path Overlapping ProblemsSpecification and Some Calibration Results for Interurban Networks In J Lesort (Ed) the 13th International Symposium on Transportation and Traffic Theory Lyon France 3 Ben-Akiva M amp Bierlaire M (1999) Discrete Choice Methods and Their Applications to Short Term Travel Decisions In Chapter for the Transport Science Handbook Preliminary Draft
12
which iΓ is the set of links in pathi al and iL are the length of link a and pathi
respectively ajδ is the link incidence variable with value of 1 when link abelongs to path
j and zero otherwise And nCL is the shortest path in choice setnC The size of a path has
a maximum value of one when it shares no links with other paths
C-Logit model and PSL model are the most widely used models in practice of route
choice modeling due to their simple forms Since both of them originate from the MNL
model and maintain the basic MNL structure they can be estimated by existing software
designed for logit models Apart from these two types of models there are other recent
efforts in the route choice context
Bekhor Ben-Akiva and Ramming (2002) adapted the Logit Kernel model to apply in a
route choice context4 The Logit Kernel5 model was proposed by combing Gaussian and
Type I Extreme Value error terms by researchers such as Ben-Akiva and Bolduc (1996)
and McFadden and Train (2000) who also referred to it as Mixed Logit6 By making
certain assumptions under route choice context Bekhor Ben-Akiva and Ramming (2002)
proposed a way to apply the model to route choice modeling7 Based on the data from
Boston several kinds of models are estimated including multinomial logit model Path
Size Logit and the newly proposed Logit Kernel model Seen from the estimation results
Logit Kernel has a better overall performance than the other two kinds of models This
result needs to be verified in other data sets since the one used in the paper has a
relatively small size
Frejinger and Bierlaire (2007) proposed an approach to capture correlation among
alternative routes with subnetworks and carried out estimation based on several kinds of
route choice models8 The paper gives an overview of the latest development of route
choice modeling and discusses the Path Size Logit model in detail As part of the
4 Bekhor S Ben-Akiva M amp Ramming M (2002) Adaptation of Logit Kernel to Route Choice Situation Transportation Research Board of the National Academics 1805 78-85 5 Ben-Akiva M amp Bolduc D (1996) Multinomial Probit with a Logit Kernel and a General Parametric Specification of the Covariance Structure Working Paper 6 McFadden D amp Train K (2000) Mixed MNL Models for Discrete Response Journal of Applied Econometrics 7 Bekhor S Ben-Akiva M amp Ramming M (2002) Adaptation of Logit Kernel to Route Choice Situation 8 Frejinger E amp Bierlaire M (2007) Capturing Correlation with Subnetworks in Route Choice Models Transportation Research Part B 41 363-378
13
conclusion a behavioral interpretation of the Path Size in the model is given The
subnetwork is defined so that the alternative routes sharing the same section of it are
seen as correlated This correlation is captured using the Error Component model and
estimation results show that this new approach gives better property than PSL models To
complement the paper uses a real size network and true travel data is collected which is
the same network we are going to use in this thesis project Additionally the paper
displays forecasting results which indicates that models with Path Size component tend
to have bad performance in prediction
Ben-Akiva and Bierlaire (2003) pointed out that under route choice context the
significant correlation among alternatives due to path overlapping and the generation of
choice set are two important issues and main difficulties9
There are some algorithms used in practice for generating choice set for route choice
modeling both deterministic methods and stochastic ones The deterministic methods
tend to give the same set of paths for a given OD pair Some examples are the link
penalty algorithm (De La Barra Peacuterez amp Anez 1993) which increases gradually the
impedance of all the links on the shortest path10 the link elimination algorithm (Azevedo
Costa Madeira amp Martins 1993) which removes links on the shortest path in sequence
to generate new paths11 and the labeled paths (Ben-Akiva Bergman Daly amp
Ramaswamy 1984)12 In terms of the stochastic methods they tend to produce individual
specific choice set One example is the simulation method (Ramming 2001) which
generates alternative paths by drawing link impedances from different distribution
densities13
When it comes to appraisal of the generated choice set some literatures give evaluations
on the efficiency of different sampling algorithms for choice set generation (See Bekhor
9 Ben-Akiva M amp Bierlaire M (2003) Discrete Choice Models with Applications to Departure Time and Route Choice In Handbook of Transportation Science (second ed) Kluwer 10 De La Barra T Peacuterez B amp Anez J (1993) Multidimensional Path Search and Assignment 21st PTRC Summer Meeting (pp 307-319) 11 Azevedo J Costa M Madeira J amp Martins E (1993) An Algorithm for the Ranking of Shortest Paths European Journal of Operational Research 69 (1) 97-106 12 Ben-Akiva M Bergman M Daly A amp Ramaswamy R (1984) Modeling Inter Urban Route Choice Behaviour In J Vollmuller amp R Hamerslag (Ed) the 9th International Symposium on Transportation and Traffic Theory (pp 299-330) Utrecht Netherlands VNU Science Press 13 Ramming M (2001) Network Knowledge and Route Choice PhD Thesis Massachusetts Institute of Technology
14
Ben-Akiva amp Ramming 2006 for example) Apart from this there are some recently
proposed methods for sampling alternatives under route choice context (See Frejinger
Bierlaire amp Ben-Akiva 2009 for example)
Nerella and Bhat (2004) carried out a numerical analysis on the effect of sample size on
the efficiency of the estimation of parameters14 The analysis is done for two kinds of
discrete choice models namely the multinomial logit model for which consistency of
estimation based on subset of alternatives is theoretically proved and non-MNL model
taking mixed multinomial logit model as an example Four evaluation criteria are chosen
namely the ability to recover model parameters ability to estimate overall log-likelihood
function value ability to estimate individual choice probabilities and ability to estimate
aggregate shares of alternatives The results show that the MNL model works well on
small sample size yet certain portion of full choice set need to be kept as a practical
baseline For the non-MNL model small sample size gives poor estimation and increase
of sample size gives obvious increase of estimation quality Certain portion of full choice
set is suggested for practical convenience yet the generalization of sample size portion is
not feasible since difference kinds of models may require different portion to guarantee
accuracy In general for the non-MNL models full choice set is suggested to be used if
feasible and larger sample gives better estimation
Bekhor Ben-Akiva and Ramming (2006) carried out route choice modeling based on a
large-scale urban network including both choice set generation part and route choice
estimation part which compose the process of route choice modeling together15 Given
that previous literatures did not pay too much attention to empirical estimation the paper
used a true observation data set collected in Boston As the first step several choice set
generation algorithms are listed and compared in their efficiency of reproducing the
observed paths on which the evaluation of the algorithms are based The data in Boston
is described in the paper and used in the second step ie model estimation Several route
choice models are presented and estimation results based on different kinds of models are
shown for comparison of the efficiency of the models The Path Size Logit model is
14 Nerella S amp Bhat C (2004) Numerical Analysis of Effect of Sampling of Alternatives in Discrete Choice Models Transportation Research Record 1894 11-19 15 Bekhor S Ben-Akiva M amp Ramming M (2006) Evaluation of Choice Set Generation Algorithms for Route Choice Models Annals of Operations Research 114 (1) 235-247
15
proposed for its property to overcoming the drawbacks of the conventional MNL models
This type of model can be easily estimated using popularized software The main
conclusion is that route choice models could be estimated for large-scale networks based
on the true observation data and prominent computing resources
Frejinger Bierlaire and Ben-Akiva (2009) proposed a paradigm for choice set generation
based on sampling for route choice modeling16 In the context of route choice modeling
the universal choice set which denotes all possible alternatives for a traveler to choose
from is not able to be enumerated So we practically work on a sampled choice set from
the universal one which may easily introduce bias to the final estimate In this paradigm
they focus on unbiased estimation of parameters instead of generating actual choice set
The path generation is seen as an importance sampling approach and a correction of
sampling is added to the path utility Since the following estimation process is based on
the sampled choice set which is treated as the universal one a correction for sampling is
added to the path size attribute in the commonly used path size logit (PSL) model ending
up with the expanded path size Modification in the previous two steps guarantees
unbiased estimation of the parameters Numerical results based on synthetic data are
presented in the paper to reveal that models with a sampling correction in the path utility
are better than those without it The proposed expanded path size logit model provides
unbiased estimation and is better than the original path size models
In this paper we will examine indirect inference Indirect inference is not a new method
it was first introduced by Smith (1990 1993)17 Then Gourieacuteroux et al (1993) gave
overall introduction to the methods and extended it in important ways18 Gallant and
McCulloch (2004) transferred the idea of indirect inference and used it for Bayesian
inference in models where likelihood function is intractable19
16 Frejinger E Bierlaire M amp Ben-Akiva M (2009) Sampling of Alternatives for Route Choice Modeling Transportation Research Part B Methodological 43 (10) 984-994 17 Smith A (1990) Three Essays on the Solution and Estimation of Dynamic Macroeconomic Models PhD Dissertation Duke University Smith A (1993) Estimating Nonlinear Time-series Models Using Simulated Vector Autoregressions Journal of Applied Econometrics 8 63-84 18 Gourieacuteroux C Monfort A amp Renault E (1993) Indirect Inference Journal of Applied Econometrics 8 85-118 19 Gallant A amp McCulloch R (2004) On the Determination of General Scientific Models Manuscript Duke University
16
Gourieacuteroux Monfort and Renault (1993) proposed the inference methods based on an
ldquoincorrectrdquo criterion which does not give consistent estimation to parameters of interest
directly20 The argument of the criterion is called the auxiliary parameter which may
have a larger dimension than the parameters of interest in the basic model After the
auxiliary parameters are selected a simulation-based process is carried out to get a
consistent and asymptotically normal estimator of parameters of interest As a simulation-
based method the only requirement for the basic model is that it could be simulated
regardless of formulations of the model So it could be used for estimating models which
are too complex to carry out direct approaches The paper shows how this kind of method
can be applied in fields such as micro-econometrics macro-econometrics and
econometrics of finance
Keane and Smith (2003) proposed a generalized form of the indirect inference method to
be implemented in the discrete choice model context21 Theoretically indirect inference
could deal with estimation of any economic models yet it has some limitations per se that
decrease the estimation efficiency or even make it difficult to implement Problems arise
when we use indirect inference in estimating discrete choice models since the objective
function the metric of distance between the auxiliary models estimated on observed data
and simulated data to be specific is inherently discrete which leaves the gradient-based
optimization methods infeasible Keane and Smith (2003) proposed that the estimation
procedures used for observed data and simulated data can be different22 Instead of the
discrete choice a continuous function of latent utilities including a smoothing parameter
is used as the dependent variable in the auxiliary model When the smoothing parameter
goes to zero the function of latent utilities converges to the discrete choices this way to
guarantee consistency According to the Monte Carlo results the generalized indirect
inference method proposed in this paper yields good estimates in small samples being as
efficient as maximum likelihood estimates in comparison
20 Gourieacuteroux C Monfort A amp Renault E (1993) Indirect Inference 21 Keane M amp Smith A (2003) Generalized Indirect Inference for Discrete Choice Models Manuscript Yale University 22 Keane M amp Smith A (2003) Generalized Indirect Inference for Discrete Choice Models
17
Creel (2009) presented a data mining approach to indirect inference23 which is similar to
the regular indirect inference method yet with certain advantages over it The method is a
simulation-based estimator relying also on an auxiliary model In line with the indirect
inference method an underlying economic model with parameterβ is referenced by an
auxiliary model with parameterθ Certain values of the parameter hβ in underlying
economic model are drawn randomly from a known density simulated data is generated
using Monte Carlo methods to estimate ɶh
θ of auxiliary model which ends up with a set
of tuples ɶ( )hhβ θ Nonparametric methods are used to get the function ɶ( | )E aβ θ = and
the final estimate of β is supposed to be the result of regression function evaluated at the
estimate of θ based on true observations ɶ ɵ( | )Eβ β θ θ= = Creel (2009) also presented a
way of calculating confidence intervals24 Monte Carlo results in dynamic and nonlinear
panel models and vector autoregressions show good performance of the new estimator
23 Creel M (2009) A Data Mining Approach to Indirect Inference Universitat Autonoma de Barcelona Department of Economics and Economic History 24 Creel M (2009) A Data Mining Approach to Indirect Inference
18
3 Methodology
31 Multinomial Logit Model (MNL)
311 Model Description
Route choice modeling is somewhat complicated when we want to capture the attributes
of both the alternative routes and choice maker accurately and reflect the choice making
process in the model Intuitively route choice can be regarded as choosing one specific
route from several alternative routes which coincides with the prerequisites of discrete
choice models Actually a lot of literatures have explored the route choice modeling and
possible improvements based on discrete choice models (see Cascetta et al 1996 Vovsha
and Bekhor 1998 Ben-Akiva and Bierlaire 1999 for more information on development
in route choice models with regard to discrete choice models)25
To understand the frontier development of route choice model we have got to know the
discrete choice models among which multinomial logit model (MNL) is the most widely
used In addition we choose to implement a new method ndash indirect inference in which
MNL is used as it is
Logit model is the most widely used discrete choice model till now due to its excellent
qualities in model specification To be specific the choice probability takes a closed form
which is easy to estimate and interpret (Train 2003)26
The multinomial logit model is a kind of choice model with more than two alternatives in
the choice set We assume that the choice maker makes his or her decision based on the
utility maximization rule (Ben-Akiva amp Lerman 1985)27 With regard to the utility njU
the decision maker n obtains from the thj alternative in the choice set it is made up of
two parts the deterministic part and the stochastic part The deterministic part denoted
25 Cascetta E Nuzzolo A Russo F amp Vitetta A (1996) A Modified Logit Route Choice Model Overcoming Path Overlapping ProblemsSpecification and Some Calibration Results for Interurban Networks Vovsha P amp Bekhor S (1998) Link-nested Logit Model of Route Choice-Overcoming Route Overlapping Problem Transportation Research Record 1645 133-142 Ben-Akiva M amp Bierlaire M (1999) Discrete Choice Methods and Their Applications to Short Term Travel Decisions 26 Train K (2003) Discrete Choice Methods with Simulation Cambridge University Press 27 Ben-Akiva M amp Lerman S (1985) Discrete Choice Analysis Theory and Application to Travel Demand MIT Press
19
by njV contains attributes known by the modelers while the stochastic part denoted by
njε is the attributes affecting peoplersquos the decision which cannot be observed by the
modelers yet are known by the decision makers themselves So the utility function turns
out to be
nj nj njU V jε= + forall (1)
The type of choice model is basically decided by the distribution of the stochastic part
When we assume that njε is independently identically Gumbel distributed the model
becomes a logit model
As stated above the decision follows utility maximization rule which means that the
decision maker n chooses the alternative with the highest utility say the thi alternative
Use as the probability the thi alternative is chosen over the others we have
( max ) ( )
( )
( )
ni ni nj ni njj C
ni ni nj nj
nj ni ni nj
P P U U P U U j i
P V V j i
P V V j i
ε εε ε
isin= = = ge forall ne
= + gt + forall ne
= minus lt minus forall ne (2)
With Equation (2) above and the assumption that njε follows iid Gumbel distribution we
could derive the probability of decision maker n chooses alternativei which is
ni
nj
V
ni V
j
eP
e=sum
(3)
Typically we specify the deterministic part of the utility function in a linear form which
is nj njV xβ= Then the probability becomes
ni
nj
x
ni x
j
eP
e
β
β=sum
(4)
This is the most common form of probability function for multinomial logit models
There are some good properties for this kind of logit probability as discussed by Train
(2009)28 With this form the probability of choosing certain alternative will be between
zero and one inherently which is basically required for probability definition Yet the
28 Train K (2003) Discrete Choice Methods with Simulation
20
value of niP will never drop to zero mathematically which means that all the alternatives
in the choice set are perceived to have chance to be chosen On the other hand if an
alternative is perceived never to be chosen it should not be included in the choice set at
all
The probabilities for all the alternatives in the choice set sums to be one which is easily
illustrated from the analytical properties 1 1 1
( ) 1njni
J J JVV
nii i j
P e e= = =
= =sum sum sum in which J denotes
the number of alternatives in the choice set
The logit probability and the deterministic part of the utility function follow an S-shaped
curve line shown in Figure 1 below
Figure 1 S-shaped relationship between probability and deterministic part of utility
This property gives implications for possible impacts of the deterministic utility of certain
alternative on its chances to be chosen We could see that when an alternative has about
50 probability to be chosen which infers to the steepest part on the curve a small
change in the deterministic part of the utility function could lead to a large change in the
probability the alternative has to be chosen
Apart from the nice properties of logit probability logit models have some disadvantages
as well (Bartels Boztug amp Muumlller 1999)29 One shortcoming is the assumption of
29 Bartels K Boztug Y amp Muumlller M (1999) Testing the Multinomial Logit Model Working paper University Potsdam Germany
21
Gumbel distribution of error terms in the utility function The inherent requirement for
iid property sets restrictions for logit model to be widely used especially in route choice
modeling context Several models have been proposed to overcome this shortcoming in
particular modifications based on MNL to adjust it to route choice practices have been
proposed Another drawback is the assumption of the linear composition for the
deterministic part of utility function Actually this assumption is for ease of following
estimation process since McFadden (1974) demonstrated that under this condition the
probabilities will be universally concave with regard to the coefficientsβ 30 which
improves the performance of numerical estimation Yet there could be nonlinear
compositions in the deterministic part to relax the restriction Under this condition the
universal concavity cannot be guaranteed which may lead to local convergence in the
estimation process
312 Model Estimation
The most commonly used numerical estimation method for multinomial logit models is
the Maximum Likelihood Estimation (MLE) In principle given a set of data and the
underlying probability model the method tries to find coefficients of the probability
model with which produced data has a distribution most likely resembles the distribution
of the observed data
Consider the case that N decision makers with their choice data are obtained Parameters
to be estimated are the coefficients in the utility function denoted byβ We could then
use the MLE to try to get the values of β vector with which the probability that choice
maker choose their observed alternatives is maximized
The probability of choice maker n to choose his or her observed alternative can be
written as
( ) niyni
i
Pprod (5)
in which niy is a dummy with value 1 if choice maker choose alternative i and value 0
otherwise
30 McFadden D (1974) Conditional Logit Analysis of Qualitative Choice Behaviour (P Zarembka Ed) Frontiers in Econometrics 105-142
22
Choice makers choose their alternative independently from each other so the probability
of all sampled choice makers choose their observed alternative is
1
( ) ( ) ni
Ny
nin i
L Pβ=
= prodprod (6)
This is the likelihood function with regard to the parameters to be estimated β in this
case We can take the logarithm of it to get the log-likelihood function
1
( ) lnN
ni nin i
LL y Pβ=
=sumsum (7)
Since we aim at getting the value of β to make the log-likelihood function maximized
we can take the derivative of it with respect to β and set it to zero
( )
0dLL
d
ββ
= (8)
By solving this equation we could get the estimate of β
32 Dijkstrarsquos Algorithm
321 Introduction
A method is needed for generating feasible alternatives and compose the choice set as
well as for deriving simulated observations for each OD pair in the process of indirect
inference As for choice set generation we would like to include certain number of high
ranking shortest paths in the choice set since these paths tend to have more possibility to
be chosen Similar to this the simulated observation is generated as the shortest path
between each OD pair We implement a method for shortest path finding which is the
Dijkstrarsquos Algorithm
Dijkstrarsquos Algorithm is named after the Dutch computer scientist Edsger Dijkstra who
conceived this method in 1956 and got it published in 195931 This is a graph search
algorithm aiming at solving shortest path problem for a graph the edge cost of which is
defined nonnegative The outcome of it is a shortest path tree demonstrating the path with
lowest value with respect to the defined cost
31 Dijkstra E (1959) A note on two problems in connexion with graphs Numerische Mathematik 1 269-271
23
This algorithm deals with single-source problem To be specific given one source node in
the graph the algorithm will give paths with the lowest value with regard to cost from
this source node to every other node in the network Given certain criterion we could use
the algorithm to find shortest path between two specific nodes by setting one node as the
source and the other as the target
After released it is widely used in path searching problems especially in transportation
related practices Routing problem is considered in investigation on traffic assignment
and optimization in logistics Real sized road network could be perceived as a graph with
vertices and edges in which cities can be abstracted as the vertices in the graph and the
roads connecting cities can then be regarded as the edges With the aid of Dijkstrarsquos
Algorithm the shortest path with respect to cost could be found from certain city to the
other cities The outcome is valuable for logistics corporations to work out their region-
wide distribution plans32
322 Algorithm
We connect a ldquodistancerdquo value with all the vertices in the graph indicating its distance
from the source vertex To be accurate the ldquodistancerdquo could be actual length of edges or
the generalized cost on the edges or anything desired The source vertex is defined as the
initial node with a value of zero In the process Dijkstrarsquos Algorithm will assign values
to vertices detected in one loop and update the values in the following loops till a
minimum value is found for each vertex The steps for searching and updating are
presented below
1 Initialize the network and assign the distance values of vertices other than the initial
node as infinity
2 When one vertex is to be detected it is denoted as current node All the vertices that
have been detected and attained the minimum distance values will be marked as detected
and will not be detected in the following loops while the vertices remaining unvisited
will be marked undetected To initialize all the vertices are marked undetected and the
initial node is set as current node
32 Wang H (2011) Logistics Distribution Shortest Path Based on Dijkstra Algorithm Computer and Digital Engineering 3
24
3 For current node all its directly connected adjacent nodes are considered except for
the newly detected vertex Labeled distance values of the neighbor vertices will be
updated if the calculated values from current node are smaller than their current values
For example current node A has a distance value of 4 and one of its neighbors B has a
value of 8 The edge linking A and B has a distance of 2 The newly calculated distance
value for B will be 4+2=6 which is smaller than 8 So the labeled distance value for B
will be updated to 6 indicating that the minimum distance from the source vertex to B till
now is 6 and the path should pass A
4 When all the neighbors of the current node are considered and updated mark the
current node as detected And mark the undetected node with the lowest distance value as
the current node and do the detection in step 3 again
5 When all the vertices in the network are marked detected the algorithm is finished and
we get the minimum distance from the source to all the other vertices The shortest path
from the source to a specific vertex could be found out following the detecting process
As mentioned above the stop criterion could also be modified as we desired If we aim at
finding the shortest path between two vertices at the beginning one vertex should be set
as the initial node and the algorithm could be stopped once the other vertex is marked as
detected
323 Explanatory Example
Here is a simple network to illustrate the mechanism of Dijstrarsquos Algorithm There are
five vertices and six edges with distance values labeled beside We define A as the source
and set it the initial node
Figure 2 A simple network for Dijstrrarsquoa Algorithm explanation
25
Initialization
Initial node A
Detected null
Distance value A=0 B=C=D=E=+infin
Loop 1
Current node A
Adjacent vertices B C
Detected null
Distance value A=0 B=4 C=1 D=E=+infin
Loop 2
Current node C
Adjacent vertices B D
Detected A
Distance value A=0 C=1 B=min 4 C+2 =3 D=C+3=4 E=+infin
Loop 3
Current node B
Adjacent vertices E
Detected A C
Distance value A=0 C=1 B=3 D=4 E=B+3=6
Loop 4
Current node E
Adjacent vertices null
Detected A B C D
Distance value A=0 C=1 B=3 D=4 E=6
If we want to get the shortest path from A to E following the detecting process we could
know that it should be A-C-B-E
26
324 Discussion
Dijkstrarsquos Algorithm has a clear logical structure which makes it easy to understand as
well as to implement in programming Nonetheless this method cannot search directly
from one node towards the other to find the shortest path between the two It works more
like detecting all the adjacent nodes in terms of shortest paths and expands from the
source iteratively until the target node is included and that is when we could figure out
the shortest path between the two specific vertices This reveals the fact that the method
wastes a lot of time in the blind search leaving it inefficient In addition this method is
not able to deal with networks with negative edge values yet this is not a problem in our
research since link cost on our network is defined nonnegative
33 Indirect Inference
331 Introduction
For problems in route choice context choice set size may be way too large to enumerate
all the alternatives Yet estimation based on sampled choice set may introduce biases
which can be corrected in some special cases (see Frejinger Bierlaire amp Ben-Akiva
2009)33 While in cases where estimation models are not based on MNL say multinomial
probit model we could not find corrections for biases caused by sampled choice set
Estimator based on the principle of indirect inference is then introduced to overcome
inconsistency problem34
Indirect inference35 is a simulation-based method for estimating parameters in economic
models by making references to the parameters of interest (Smith 2008) It is motivated
when general statistical estimation method such as Maximum Likelihood is intractable or
as discussed above consistent estimation is required given that only sampled choice set is
available Since in economic analysis we tend to build models which guarantee scientific
logic and inclusion of necessary attributes quite often the models will end up
33 Frejinger E Bierlaire M amp Ben-Akiva M (2009) Sampling of Alternatives for Route Choice Modeling 34 Karlstroumlm A Sundberg M amp Wang Q (2011) Consistently estimating flexible route choice models using an MNL lense 35 Smith A (2008) Indirect Inference In S Durlauf amp L Blume (Eds) The New Palgrave Dictionary of Economics (Second ed) Palgrave Macmillan
27
complicated from statistical estimation point of view This in sequence spurs the wide use
of indirect inference in economic analysis
It is common character that simulation-based methods allows modelers to simulate data
from the economic model of interest given certain perceived values of the parameters to
be estimated Since to generate data is essential and simple the true challenge is how to
estimate coefficients Indirect inference uses an auxiliary model which gives a rich
description of the covariance patterns in the data by including certain variables from the
basic economic model On the other hand the auxiliary model does not need to reflect
accurately the data generating process since it is supposed to be estimated based on the
data derived not to generate data itself The basic function of the auxiliary model is that
it provides a criterion to compare observed data and simulated data from the basic
economics model
We do iterations with the aim of finding the parameters of the basic economic model so
the observed data and the simulated data from the basic model looks almost the same by
the criterion of auxiliary model To be specific the auxiliary model is estimated based on
both observed data and simulated data we choose parameters for the basic model to
make sure that the two estimator of auxiliary model are as close as possible Based on
this idea the auxiliary model should be easy to estimate
332 Definition of the method
We define an economic model with the form of
( ) 12t t ty G x t Tε β= = (9)
in which 1 Tt tx = is a sequence of observed exogenous variables 1 T
t ty = is a sequence of
observed endogenous variables and 1 Tt tε = is a sequence of unobserved random error
terms β is a k -dimensional coefficient vector of the exogenous variables (Smith
2008)36
This model generally describes a relation that ty is dependent ontx with some random
errors Given the distribution of the random errors we could get the probability density
36 Smith A (2008) Indirect Inference
28
function of ty conditional on tx We will not focus on this density and instead this model
is only used for simulating data in indirect inference
In terms of the auxiliary model it could be defined by a probability density function with
the form of
( | )t tf y x θ (10)
in which θ is a p -dimensional coefficient vector and p is supposed to be not smaller
than k since we should capture characteristics of all the parameters in the underlying
economic model In addition the auxiliary model needs not be defined to reproduce the
distribution of ty in the basic model yet it needs to have a convenient analytical format
Based on the observed data we could estimate the parameters in the auxiliary model
using Maximum Likelihood Method
ɵ
1
arg max log ( | )T
t tt
f y xθ
θ θ=
= sum (11)
The estimated coefficient vectorɵθ could be used as an indicator of certain features of the
observed data
On the other hand the auxiliary model can be estimated based on simulated data from the
basic model as well We need to draw a sequence of random error terms 1 m Tt tε = from the
defined distribution in which m denotes the number of simulation with an interval of [1
M ] generally Given a coefficient vectorβ we could generate the values of endogenous
variables ɶ 1 ( )m T
tty β = which are explicitly dependent onβ With the help of Maximum
Likelihood Method we could get
ɶ ɶ
1 1
( ) arg max log ( ( ) | )M T m
ttm t
f y xθ
θ β β θ= =
= sumsum (12)
According to the principle of indirect inference we try to find the values of β to make
ɶ( )θ β as close toɵθ as possible Practically we need a metric to measure the distance
between ɵθ andɶ( )θ β and by minimizing the distance we could find out the estimates of
β in the basic economic model
29
333 Choices of the metrics
As mentioned above we need a metric to measure the distance betweenɵθ andɶ( )θ β
There are three approaches corresponding to the three classical hypothesis tests namely
Wald likelihood ratio (LR) and Lagrange multiplier (LM)37
In the Wald approach we try to minimize a quadratic form in the difference between the
two estimators ofɵθ andɶ( )θ β which is
ɵ ɶ ɵ ɶarg min( ( )) ( ( ))Wald
Wβ
β θ θ β θ θ β= minus minus (13)
in which W is a positive definite ldquoweightingrdquo matrix
In the LR approach a metric is formed based on the likelihood function related to the
auxiliary model which is
ɵ ɶ
1 1
arg min( log ( | ) log ( | ( )))T TLR
t t t tt t
f y x f y xβ
β θ θ β= =
= minussum sum (14)
According to the definition ofɵθ the first part of the objective function before the minus
sign on the right-hand side is always larger than the second part after the minus sign And
the first part is not dependent onβ
To minimize the objective function is equivalent to maximizing the log-likelihood
function withɶ( )θ β that is
ɶ
1
arg max( log ( | ( )))TLR
t tt
f y xβ
β θ β=
= sum (15)
In the LM approach the metric is formed using the derivative of the log-likelihood
function related to the auxiliary model which is
arg min ( ) ( )LM
S VSβ
β β β= (16)
in which
ɶ ɵ
1 1
( ) log ( ( ) | )M T m
ttm t
S f y xβ β θθ= =
part=partsumsum
(17)
and V is a positive definite matrix
37 Smith A (2008) Indirect Inference
30
By using any of the approaches we aim at getting the minimized distance betweenɵθ and
ɶ( )θ β so the value will approach to zero as expected So the hypothesis test of the
minimized value could be used as an indicator of whether the auxiliary model is suitably
specified In other words the minimized value being significantly different from zero
indicates a bad specification of the auxiliary model
In comparison the LM approach has an advantage over the others in computation when
it is relatively time-consuming to estimate the auxiliary model
334 Consistency Interpretation
Suppose the observed sample size T grows large while total number of simulations stays
fixed as M the estimator based on simulated data ɶ( )θ β will converge to a pseudo-true
value denoted as( )h β which is also dependent onβ This is called binding function
which characterized the relationship between the coefficients in the basic model and the
auxiliary model At the same time the estimator based on observed data ɵθ will converge
to a pseudo-true value0θ In case that T grows to a large number the aim of indirect
inference changes to finding β that guarantees0 ( )hθ β= This could explain that indirect
inference gives consistent estimate of the parameters in the basic economic model
In this project the binding function is what we focus on to get the correct estimates
instead of finding certain metrics Detailed methods will be discussed in the following
part
34 Model Specification in the Thesis
341 Basic Route Choice Model
Based on all the methods mentioned in previous sections the specification of models and
methods we use in the thesis will be explained in this section Since we are to estimate
the model based on true observations no model is known beforehand to adjust to the data
we use Several formulations of the model have been tested in the thesis The one
explained here could be seen as an example and all the other trials contain modifications
based on this model The other specifications of model will be explained along with the
results in the result section
31
We start by describing the underlying route choice model of interest38 We need to define
a road network as a representation of a real-size one from which we collected the trip
data The network denoted asN consists of a set of nodes (vertices) v and links (edges)
l Each link has a source node ( )s l and a target node or a destination node( )d l which
together indicate the direction of the link A path from an origin node ov to a destination
node dv could be seen as a sequence of links1 nl lhellip of which 1( ) os l v= 1( ) ( )i id l s l +=
and ( ) dnd l v= So a path can be defined by the index of links which is 1 nl lπ = hellip
A vector of characteristics denoted aslx is associated to each link as well as a strictly
positive cost function( )l lic x ε β in which liε is an individual specific random link cost
with i denoting the individual and β is a vector of coefficients of the link characteristics
left to be estimated In the Indirect Inference context we need an auxiliary model with
easily-estimated analytical form yet there is no such requirement for the basic model
Although not necessary we assume that the cost function has a linear deterministic form
the deterministic part and the random part are additively separable So we have the cost
function as
( ) Tl li l lic x xε β β ε= + (18)
In addition one important assumption is that the link cost is additive which means that
the cost of a path can be attained by the sum of all the link costs along the path This way
we have the cost of a path π as
( ) ( )l lil
C c xπ
π ε βisin
=sum (19)
We focus on the path-based model which means that the individuals choose among all
possible paths As defined above this turns out to be a random utility choice model As
indicated by the standard assumptions of this kind of models choice makers are assumed
to know both the link characteristics and their idiosyncratic random utility liε associated
to each link Since the choice makers maximize their utility this means that they will
choose the path with the lowest generalized cost in this model This way we have the
choice of individual i as
38 Karlstroumlm A Sundberg M amp Wang Q (2011) Consistently estimating flexible route choice models using an MNL lense
32
( )
arg min ( )o di i
iv v
Cπ
π πisinΩ
= (20)
in which oiv denotes the origin point of the trip for individual i and d
iv denotes the
destination ( )o di iv vΩ denotes all possible paths connecting the origin and destination in
the network for individual i which forms the choice set for the individual
When implementing the model we assume that the random utility component liε follows
a truncated normal distribution To be specific liε follows a standard normal distribution
yet with only the positive values retrieved This way we could guarantee that the link
costs are always positive so that additively the path would not have infinite loops With
this feature of the random component we could say that our model is probit-like Based
on this assumption the prerequisite of Dijkstrarsquos Algorithm is satisfied which always
needs positive edge values on the network We can use the Dijkstrarsquos Algorithm to find
the shortest paths iπ as an intermediate step in the implementation Apart from this we
assume that the unobserved cost captured by the random term is proportional to the
length of link To embody this in the cost function we add a fixed scale parameter to the
random term with a form of ( )Length l Lengthx Mean x in which ( )LengthMean x is the average
length of links in the network
We will assume that the data consists of J paths as dependent variables which means
that the dependent variables for the choice model are 1 Ji iy π == In addition the observed
characteristics of links in the network are provided 1 Ll lx x == To be specific we choose
to use two attributes of the links namely the length of the links Lengthx and the dummy
variable indicating the presence of speed bumps on the links SBx The cost function then
is specified as
( ) ( )l li Length Length l SB SB l li Length l Lengthc x x x x Mean xε β β ε= + + sdot (21)
Now the objective is to estimate the parametersβ in the model for which we will make
use of an auxiliary model
33
342 Auxiliary Model
Based on the idea of Indirect Inference we treat the route choice model defined above as
the basic model of interest which might have complex formation and be difficult to
estimate directly Then we need an auxiliary model to form a criterion which takes into
certain aspects of data to focus the analysis The auxiliary model needs not to reflect the
data generating process exactly as in the basic model yet it needs to include attributes of
interest in order for reference and to be easy to estimate We choose to use a logit model
for route choice as the auxiliary model since the logit model has always been a useful
tool for discrete choice analysis thanks to its analytical form and there is software for
estimating logit models which ensures that we can estimate very efficiently
As to the auxiliary model it is chosen to be a logit model for route choice We consider
that each individual i is choosing from a set of alternative routesr Each route r is given
a utility of riU
- Tri r ri r riU V Xε θ ε= + = + (22)
in which θ is the vector of auxiliary parameters which gives inference to the parameters
in the basic model One thing to be mentioned is that as expected the coefficients in the
utility function should have negative signs To make it easier for comparison with the
coefficients in the basic route choice model we assume the sign of θ to be positive per
se and add a negative sign ahead of it to guarantee that the coefficient part is negative as a
whole rX denotes route characteristics and riε is the random utility for each individual
which is assumed to follow an iid (independently identically distributed) Gumbel
distribution following the standard assumption of logit models
Note that as required for the auxiliary model it should be flexible enough to capture the
variability in the data and thus contains no fewer attributes than the basic model39 In
order to infer the parameters in the basic model and in consideration of efficiency we
pick the same attributes of interest in the basic models which are the link length Lengthx
and the speed bump dummy variableSBx So the utility function turns out to be
- -ri Length Length r SB SB r riU x xθ θ ε= + (23)
39 Karlstroumlm A Sundberg M amp Wang Q (2011) Consistently estimating flexible route choice models using an MNL lense
34
The probability of individual i choosing path r given an individual specific choice set
( )iI o d is
( )
ri
si
i
V
ri V
s I o d
eP
eisin
=sum
(24)
Theoretically we allow the individuals to choose from all possible paths between the
origin and destination in the network which intuitively could be infinite and impossible
to enumerate When implementing the model we generate the individual choice set based
on the basic route choice model Through simulation of the basic model we generate
infinite unique shortest paths for all the unique OD pairs by redrawing the random link
cost liε Without loss of generality the number of paths generated would be big enough
with fully consideration of efficiency We name the finite choice set composed by the
shortest paths generated as the pseudo-universal choice set ( )I o d which is a sample of
the infinite universal choice set The individual specific choice sets are generated by
randomly drawing certain number of paths out of the pseudo-universal choice set And
the size of individual specific choice set could be equal to or smaller than that of the
pseudo-universal one
The resulting individual specific choice set ( )iI o d describes a finite subset of all possible
paths connecting the origin oand destinationd for individuali When implementing the
methods the way of generating the choice set ( )iI o d for each individual i is viewed as
part of the auxiliary model
After the auxiliary model is built it could be estimated using a Maximum Likelihood
estimator based on the observed data of individual choices y and attributes variablesx
for individual 1 i N= hellip The estimate of parameters in the auxiliary model is
ɵ arg max ( )L y xθ
θ θ= (25)
in which ( )L y x θ is the log-likelihood function for the auxiliary model
Given the data of the link attributes xand some random draws of structural parameters
mβ 1 m M= hellip we can simulate choice data through the basic route choice model With
M draws of β from some given density we could simulate M sets of data resulting in
35
simulated choicesɶ( )my β Same as before parameters θ in the auxiliary model can be
estimated based on the simulated data as
ɶ ɶ( ) arg max ( ( ) )m m mL y xθ
θ β β θ= (26)
As the process indicated the simulated choice data depends on the structural parameterβ
in the basic route choice model and in sequence the estimates of parameters θ in the
auxiliary model depends on β when estimated based on the simulated data Based on
this theoretically we have a relationship of ( )θ β referred to as the binding function in
indirect inference literatures which we will discuss in detail for implementation of model
in this thesis A metric is then chosen to measure the distance between the observed and
simulated data viewed by the auxiliary model as a way to indirectly infer the values of
parameters β in the basic model To be specific for each draw of the structural parameter
mβ we can get the estimates of ɶ ( )m mθ β based on the simulated data and the distance
between ɶ ( )m mθ β and ɵθ measured by the chosen metric By doing more iteration with the
aim of minimizing the distance we will get the value of mβ which spurs the ɶ ( )m mθ β
closest toɵθ and this mβ is the inferred estimates of the parameter in the basic model
343 Consistency Discussion
The process of indirectly estimating parameters in the basic model is described above yet
we need to know whether the method we provide gives consistent estimation Here are
some discussions explaining the consistency in estimating by which consistency of the
estimator we proposed is illustrated
As proved the multinomial logit model (MNL) can be estimated consistently based on a
subset of alternatives (McFadden 1978)40 We may need to use the classical conditional
maximum likelihood estimator to deal with the problem at the same time the probability
that an individual n chooses an alternative i conditional on the subset of alternatives
denoted asnc becomes the conditional probability
40 McFadden D (1978) Modeling the Choice of Residential Location In A Karlqvist L Lundqvist F Snickars amp J Weibull (Ed) Spatial Interaction Theory and Residential Location (pp 75-96) Amsterdam North-Holland
36
ln ( | )
ln ( | )( | )in n
jn n
n
V q c i
n V q c j
j c
eP i c
e
micro
micro
+
+
isin
=sum
(27)
in which micro is a scale parameter and inV is the deterministic part of the utility There is a
term ln ( | )nq c j for correcting the sampling bias in which ( | )nq c j denotes the probability
of sampling nc given that alternative j is chosen
If all the alternatives in the choice set have the same probability to be chosen into the
subset the estimation on the subset of alternatives is equivalent to that on the full choice
set To be specific in this case ( | )nq c i is equal to ( | )n nq c j j cforall isin so by calculation the
term for sampling bias correction will cancel out in the probability function
In route choice context the alternative paths between an origin and a destination may be
in large amount and it is inefficient to give some very long-distance paths the same
probability as those short and attractive ones This means that we may need the
importance sampling method when generating subsets of alternatives which selects
attractive alternatives with higher probability than unattractive ones And the correction
term does not cancel out in this case Note that if alternative specific constants are
estimated we can get unbiased estimates of all the parameters except the constants even
if the correction term is not included in the utility function (Manski amp Lerman 1977)41
Back to the route choice context we tend to use large number of alternatives even with
subset of the full choice set which means that it is generally impossible to estimate the
constants and thus the correction term is essential To solve this problem Frejinger et al
(2009) developed a sampling approach in the context of route choice42
The discussion above focuses on the usage of MNL for route choice modeling When it
comes to our method the individual specific choice set is generated by randomly drawing
alternatives from the pseudo-universal choice set with the same probability yet there is
bias when generating the pseudo-universal ones since the pseudo-universal choice set is
composed of certain number of shortest paths between two nodes and this generating
process gives some paths higher probability to be included into the choice set So we
41 Manski C amp Lerman S (1977) The Estimation of Choice Probabilities from Choice Based Samples Econometrica 45 (8) 1977-1988 42 Frejinger E Bierlaire M amp Ben-Akiva M (2009) Sampling of Alternatives for Route Choice Modeling
37
actually use importance sampling to get the choice set which may consequently
introduce bias in estimating the parameterθ in the auxiliary model as discussed above
With the idea of indirect inference we consider only the relationship between θ andβ
denoted as( )θ β and use this relation to infer the value ofβ From this point of view
whether θ is estimated with bias or not does not matter since the relation between it and
β could always be captured which is the specific thing we focus on using the method of
indirect inference So we can say that even with biased subset of alternatives we could
still get consistent estimation by using indirect inference
344 Binding Function
As discussed in indirect inference method section when the sample size N increases
which means that we have more observations of choice the estimated parameter in the
auxiliary modelɶ ( )m mθ β will converge to a stable value ( )mθ β which is often referred
to as the binding function
Given that route choice model deals with discrete choices and by using indirect inference
we have a discrete choice model as the auxiliary model as well the estimates of binding
function ( )mθ β will inherit the discontinuous feature due to discrete individual choices
ɶ( )my β Keane and Smith (2003) proposed a solution of using logit-smoothing on the
simulated dependent choice data43 Following this idea we assume a continuous binding
functionɶ( )θ β for simplicity which could be approximated by a linear function locally
within small intervals With the M randomly drawn values of mβ and the corresponding
estimated parameters ɶ ( )m mθ β in the auxiliary model we could perform an Ordinary
Least Square (OLS) regression to estimate the local approximation of binding function
ɶ( ) c Dθ β β= + (28)
in which cdenotes the constant vector and D denotes the OLS parameter matrix44 To be
specific in our case each parameter in the auxiliary model will have a restriction
function with regard to both parameters in the basic model which is
43 Keane M amp Smith A (2003) Generalized Indirect Inference for Discrete Choice Models 44 Karlstroumlm A Sundberg M amp Wang Q (2011) Consistently estimating flexible route choice models using an MNL lense
38
ɶ1 11 12( )Length Length SBc d dθ β β β= + +
(29)
ɶ2 21 22( )SB Length SBc d dθ β β β= + +
(30)
Based on the observed data of choices y and explanatory variables xand the estimated
binding function which indicates the restrictions between ɶθ andβ we could use the
maximum likelihood method to give estimation of the parameters of interest The
likelihood ratio approach to indirect inference is following ideas of Smith (1993)45 and
Keane and Smith (2003)46
ɶ=arg max ( ( ))L y xβ
β θ β (31)
in which β is the estimate of the parameter of interest β in the basic economic model
With the restriction of binding function this is actually an indirectly inferred estimate In
line with the estimating process in auxiliary model ( )L sdot is the likelihood function of the
auxiliary model
Note that the form of binding function is based on an assumption in the result part we
will verify that this assumption is realistic
45 Smith A (1993) Estimating Nonlinear Time-series Models Using Simulated Vector Autoregressions 46 Keane M amp Smith A (2003) Generalized Indirect Inference for Discrete Choice Models
39
4 Data
41 Road Network
The data we use for estimation is based on a GPS data set collected in the Swedish city of
Borlaumlnge Borlaumlnge is located in the middle part of Sweden and has a population of about
47 000 inhabitants
The virtual road network contains 3077 nodes and 7459 unidirectional links (Frejinger amp
Bierlaire 2007)47 of which 3061 nodes and 7288 links are included in the network for
estimation Figure 3 gives a visual illustration of the road network in Borlaumlnge
Figure 3 Illustration of the Borlaumlnge road network
With regard to our research two of the link attributes are included namely link length
and speed bump dummy Link length is in the unit of km and speed bump dummy is an
indication of speed bump existence on the links which has the value 1 when there is a
speed bump on the link and 0 otherwise
Link length
47 Frejinger E amp Bierlaire M (2007) Capturing Correlation with Subnetworks in Route Choice Models
40
Some descriptive statistics of the link length data for the whole network is presented in
Table 1 below
Table 1 Descriptive statistics of link length
Number of links 7288
Minimum 0001
Maximum 7599
Mean 0184487
Median 0102
Variance 0103722
Lexis ratio (varmean) 1016884
Skewness 9871144
To describe the overall character of the link length attribute the histogram is shown in
Figure 4 below
Figure 4 Histogram of link length data
We could see that the link length data is quite clustered most of which lies within the
range of 01km and 06km Nonetheless there are some extreme values far away from the
range indicating extremely long links To display the variation in the relatively clustered
area we draw a histogram zoomed in the interval of (0 1km] shown Figure 5 in below
0
01
02
03
04
05
06
Fre
qu
en
cy
Link length (km)
Histogram
41
Figure 5 Histogram of link length data (zoomed within 1km)
Over 80 of all the links have length shorter than 03 km indicating concentration of
link length data
Speed bump dummy
Speed bump dummy is based on true situation in the network Of all the links 82 links
are equipped with speed bumps which account for a percentage of 113 The following
Figure 6 displays the locations of links with speed bumps
Figure 6 Illustration of links with speed bumps
0005
01015
02025
03035
04045
05
Fre
qu
en
cy
Link length (km)
Histogram(zoom in)
42
42 Observation Data
The GPS data set is collected as a part of the Swedish Intelligent Speed Adaptation (ISA)
study which aims at traffic safety effects of in-car information systems In the study 186
vehicles were equipped with GPS devices and traced within a radius of 25 km from the
center of Borlaumlnge The monitoring lasted for 30 days from 22th June 2000 to 4th March
2002 obtaining 49 667 vehicle days of travel and nearly a quarter of a million trips (for
more information on the GPS data set check Axhausen Schoumlnfelder Wolf Oliveira amp
Samaga 2003 Schoumlnfelder amp Samaga 2003 Schoumlnfelder Axhausen Antille amp Bierlaire
2002)48
The data collection is not originally designed for route choice analysis so the raw data
cannot be used in our research directly Extensive data processing is performed by the
company GeoStats in Atlanta to retrieve new data set available for route choice analysis
which contains 24 vehicles and 16 035 observations The final data set we use is provided
by Emma Frejinger which contains in total 1832 observations corresponding to 1458
observed unique routes made by 24 vehicles and 1409 unique origin-destination pairs
Considering that certain route may have been observed more than once we make a
distinction between observations and unique routes and number of unique routes should
be less than that of observations consistently with the numbers listed above
As indicated by data collection in the ISA study only licensed drivers with access to his
or her only car are recruited to minimize sharing or swapping of cars Minimum socio-
economic data of the drivers is included in data collection so we have no way to
understand driver characteristics from the data set Logically we make an assumption
that there is only one individual per vehicle
In the observation data a route is represented by a series of links and also an origin-
destination pair With relatively intensively distributed link length number of links could
48 Axhausen K Schoumlnfelder S Wolf J Oliveira M amp Samaga U (2003) 80 Weeks of GPS Traces Approaches to Enriching the Trip Information Transportation Research Record 1870 46-54 Schoumlnfelder S amp Samaga U (2003) Where Do You Want to Go Today-More Observations on Daily Mobility Third Swiss Transport Research Conference Ascona Schoumlnfelder S Axhausen K Antille N amp Bierlaire M (2002) Exploring the Potentials of Automatically Collected GPS Data for Travel Behaviour Analysis- A Swedish Data Source In J Moumlltgen amp A Wytzisk (Ed) GI-Technologien fuumlr Verkehr und Logistik number 13 Institut fuumlr Geoinformatik Universitaumlt Muumlnster (pp 155-179) Munster IfGIprints
43
be used to indicate total length of routes Some of the descriptive statistics of link number
is shown in Table 2 below
Table 2 Descriptive statistics of link numbers in observation data set
Number of observations 1832
Minimum 5
Maximum 106
Mean 202877
Median 16
Variance 1871968
Lexis ratio (varmean) 9227126
Skewness 1732597
For further overall inspection of link number distribution in the observation data set the
histogram is shown in Figure 7 below
Figure 7 Histogram of link numbers in observations data set
Seen from the histogram distribution of number of links is relatively dispersed with a
large range interval Judging by the statistics in general the routes observed have about
000
200
400
600
800
1000
1200
1400
1600
5 8
11
14
17
20
23
26
29
32
35
38
41
44
47
50
53
56
59
62
65
68
71
74
77
80
83
86
89
92
95
98
10
1
10
4
10
7
Mo
re
Fre
qu
en
cy
Number of links
Histogram
44
20 links in average Yet the data has a big variance which is reasonable As stated above
there are 1409 unique OD pairs for 1832 observations indicating that for most OD pairs
there is only one observation Spread within the detecting area different OD pairs could
have various numbers of links in between
Following our experiment design only a portion of the data could be used To be specific
routes with number of links fewer than ten would be eliminated when used for estimation
43 Further Exploration of data
Apart from the characters discussed above there are some other attributes in the data set
interesting to be explored Both in link attribute data set and observation data set there is
travel time data which to some extent is parallel with length in indicating distance
between two nodes
In the link attribute data set one attribute is denotes the estimated travel time of links in
unit of hour Some of the descriptive statistics is shown in Table 3 below switching unit
to minute
Table 3 Descriptive statistics of estimated travel time on links
Number of links 7288
Minimum 000186
Maximum 578268
Mean 0281696
Median 018744
Variance 0119337
Lexis ratio (varmean) 0423638
Skewness 5785361
Seen from Table 3 estimated travel time seems to have a more clustered distribution than
link length judging by lexis ratio and skewness Yet this time is roughly estimated not so
qualified as link length to use in estimation since the latter is much easier to measure and
guarantee precision
In the observation data set we have the duration time of the observations in the unit of
minute Some of the descriptive statistics is shown in Table 4 below
45
Table 4 Descriptive statistics of duration of trips
Number of observations 1832
Minimum 007
Maximum 316
Mean 4991195
Median 3925
Variance 1775639
Lexis ratio (varmean) 3557542
Skewness 2174728
Duration of trips can be used as an indication of distance between origin and destination
yet it is roughly measured and strongly affected by traffic condition on the road network
With similar reasons as discussed on estimated travel time on link we use number of
links instead of duration of trips to indicate the distance between OD pairs
46
5 Experiment Design
When doing the simulation-based estimation it is physically divided into two parts for
convenience of operation As discussed in the method section we choose to use a pseudo-
universal choice set which is generated and stored in the first part and ready for use in
the following experiment Then in the second part we do the simulation-based
experiment to carry out indirect inference method for estimating the parameters of
interest in the basic model β to be specific The Figure 8 below illustrates an abstracted
flow of how the estimation is carried out given certain origin-destination pair
Figure 8 Illustration of the flow in the experiment
As shown in the flow chart we get all the unique OD pairs in the trip data For each of
the OD pairs the Dijkstrarsquos algorithm is used to find the shortest paths between them
without duplicates We set the intended number of paths to be 400 as well as time
terminator in case not enough paths could be generated within certain bearable time
47
interval The generated paths form the pseudo-universal choice set of each OD pair
which is stored for future use Note that we abandon some OD pairs with too few paths
in the pseudo-universal choice set Observations containing the kept OD pairs are used
for following estimation which turns out to be 940 of them
For the OD pair in a given observation 200 alternatives are randomly drawn from the
pseudo-universal choice set and the sequential links in the observation itself is read as an
alternative path The 201 paths compose the observed choice set On the other hand a
given value of mβ is drawn from a predefined domainD The shortest path is generated
based on the given mβ as the simulated observation Like in the observed choice set part
200 alternatives are randomly drawn from the pseudo-universal choice set to form the
simulated choice set together with the simulated observation The auxiliary model is
estimated based on the simulated choice set and we could get a set of ɶ( ( ))mm mβ θ β pairs
which will be used to estimate the binding function Based on the binding function and
the observed choice set the parameters in the basic model could be indirectly estimated
The process described above is abstracted with no illustration of iterations Since this is
an experiment based on simulations certain loops of iteration should be carried out to get
statistics of the results
Given observed trip data at first we have no idea of the value of β In the process of
retrieving value ofβ the estimation process is repeated for several stages denoted asS
starting from a rough guess of the domainsD while for each following stage the domain
shrinks Since we tend to use a local OLS regression to approximate the smooth binding
function the draws of smβ need to be around the true value to prevent misspecification of
OLS regression due to the possibly inherent nonlinearity of the binding function The
estimated 0
β is not satisfactory in precision in the first stage yet it could give a hint of
where the true value lies The domain1D is centered on 0
β with smaller interval before
the estimation in the second stage This way +1sD is dependent on sD with smaller
interval As it goes on we will get a more accurate domain and as a result a well specified
OLS regression to approximate the binding function
48
The process of experiment with iterations is described below Suppose that we have the
experiment carried out for K times and the number of observations used isN
for run 1 k K= hellip for true observation 1 i N= hellip
Randomly draw alternatives from the pseudo-universal choice set end Form the observed choice sety for stage 1 s S= hellip
for 1 m M= hellip
Draw ksmβ from the domain ksD
Simulate paths for OD pairs in the used observations with mβ
for simulated observation 1 i N= hellip Randomly draw alternatives from the pseudo-universal choice set end
Form a simulated route choice setɶ( )ksmy β
Estimate ɶ ( )ks ksm mθ β in Equation (26)
end
Estimate ɶ ( )ks
θ β in Equation (28)
Estimate ks
β in Equation (31) end
Center the domain 1k sD + on ks
β and shrink the interval end
As a trial we first do the experiment on a route choice model with one parameter link
length to be specific For simplicity the random term is not scaled as described in the
model specification section which means we attach a truncated normally distributed
random term to the cost function without scaling it with link length After getting the
estimation of Lengthβ we move on to estimating the route choice model with both
parameters as described in the model specification Results under these two formulations
of models are presented separately in the result part
49
6 Results
61 Validation of Binding Function
As discussed in the binding function section we assume the binding function to be
continuous and feasible to be approximated by a linear function locally The assumption
of binding function can be verified based on the ɶ( ( ))mm mβ θ β pairs we attained as
intermediate results To explain this more explicitly we carry out a simple example with
only one parameter in the route choice model Lengthβ to be specific
The cost function is specified as
( )l li Length Length l lic x xε β ε= + (32)
corresponding to which the auxiliary model is
-ri Length Length r riU xθ ε= + (33)
For each run 10 values ofLengthβ are evenly drawn from a given domain By simulating
observations and estimating the auxiliary model 10 corresponding Lengthθ are generated to
form ten ɶ( ( ))mm mβ θ β pairs As assumed the binding functionɶ( )θ β is continuous which
could be approximated by a linear function locally To display the trend of binding
function we choose a relatively large domain for Lengthβ in the beginning [010]D = and
carry out 10 runs which generate 100 points in the beta-theta diagram shown in Figure 9
below
Figure 9 Scatter plots of the 90 beta-theta pairs
y = 12804x + 16264
Rsup2 = 09959
0
2
4
6
8
10
12
14
16
0 2 4 6 8 10
the
ta_
len
gth
beta_length
50
We do OLS regression for the dots and estimate the binding function Intuitively the
smaller the domain is the more accurate is the approximation of the binding function We
shrink the input domain based on the final estimate of Lengthβ from last trial
As it turned out to be we choose an input domain of [1214]D = for Lengthβ and the
binding function is assumed to take the form of
ɶ1 11( )Length Lengthc dθ β β= +
(34)
The result for one run is displayed in Figure 10 below
Figure 10 OLS regression based on the 10 beta-theta points from one run
The estimated binding function based on the 10 points is
ɶ ( ) 17371+10838Length Lengthθ β β= (35)
as indicated by 2 09783R = the function describes the trend of points very well Since
the interval is quite small we could use the estimated function to approximate the
binding function
When it comes to more parameters in the route choice model what we do is simply to
add more elements in the binding function After getting a vector of β and the
corresponding vector ofɶ( )θ β binding functions of each element in vector ɶ( )θ β with
y = 17371x + 10838
Rsup2 = 09783
315
32
325
33
335
34
345
35
355
12 125 13 135 14
the
ta_
len
gth
beta_length
51
regard to all the elements in vector β are estimated One example is shown in the
Equation (29) and Equation (30)
62 Estimation of model with one attribute
The route choice model with one attribute we used is the one described in Section 61
above After several trials by shrinking input interval every time we finally affirm that
the true value Lengthβ of lies in a relatively small interval of [12 14] Based on this
domain 50K = runs are carried out to get statistics of the estimate of Lengthβ As
discussed in the experimental design several stages Smean different trials before final
affirmation of input interval yet for the statistics only one stage is carried out for each
run Within each run 10M = values of input Lengthβ are drawn for estimating binding
function
The estimation statistics of Lengthβ is shown in Table 5 below
Table 5 Statistics of estimation of beta_length
Parameter Lengthβ
Mean 1337353
Standard deviation 0107537
RMSE 0013227
In the table RMSE is the root-mean-square error which is used to measure the distances
between the observed values being estimated and the predicted values by the estimator
The individual differences are called residuals and RMSE is an aggregated measure of
the residuals To be specific
ɵ ɵ ɵ 2( ) ( ) (( ) )RMSE MSE Eθ θ θ θ= = minus (36)
in which ɵθ is the estimator and θ is the parameter to be estimated so the RMSE is the
square root of the mean square error As defined the smaller the value of RMSE is the
better the estimator is
52
Here the RMSE is calculated based on the ten points ɶ( ( ))mm mβ θ β for estimating binding
function so basically it describes the goodness of fit of the estimated binding function
with regard to the points we generated The Equation (36) is specified as
ɶ 2( ( )) (( ( ) ( )) )mm m mRMSE Meanθ β θ β θ β= minus (37)
The value of RMSE displayed in the Table 5 is the mean value of all the RMSE values
for 50 runs Seen from this we have well-estimated binding function for all the 50 runs
on average In terms of the estimates of binding function taking the one in Section 61 as
an example the binding function estimated in the interval of [12 14] in Equation (35)
has a positive constant and a positive coefficient for Lengthβ which indicates that with
larger value of Lengthβ we will get larger value ofɶ Lengthθ and as a result a negative
coefficient for length in the utility function of the logit model This is reasonable for
bigger Lengthβ reveals larger incremental effect on the cost of certain path while lower
ɶ- Lengthθ reveals larger disutility effect on certain path these two effects are in fact
equivalent
By the way the high fitness of binding function is probably due to the relatively small
input interval of Lengthβ after certain trials and shrinkage As the final estimate indicates
Lengthβ falls right into the interval of [12 14] with small standard deviation So we can
say that the estimate is quite good
63 Estimation of model with two attributes
We use the model described in the model specification section to carry out the estimation
Two attributes are used namely length and speed bump dummy Similar to the one
attribute case we carried out several trials and shrinkage to finally determine the
relatively small input intervals forLengthβ and SBβ [05 1] and [0 05] respectively
50K = runs are carried out to get statistics of the estimates of the two parameters Within
each run 10M = values are drawn for inputs Lengthβ and SBβ respectively for estimating
binding function
53
One important thing to mention here is that the inputs are drawn evenly from the domain
yet to guarantee that the values of Lengthβ and SBβ are independent from each other or to
get rid of collinearity49 the domains of two parameters are defined in two dimensions To
explain this more explicitly we choose data of one run as an example The input points of
( Lengthβ SBβ ) are shown in Figure 11 below
Figure 11 Scatter plot of the input values for beta_length and beta_sb
We can see from Figure 11 that the points spread evenly in the domain quadrant Based
on these draws we could estimate the binding function and evaluate the relationship
between parameters in the logit model and Lengthβ and SBβ without worrying about
possible correlation between Lengthβ and SBβ
As discussed before in the binding function we are supposed to find the relationship
between each of the parameters in the logit model and both parameters in the route choice
model Mathematically this binding function should be a surface in the 3D coordinate
system We take the results of one run as an example and thus we have ten sets of Lengthβ
and SBβ along with corresponding ɶ Lengthθ andɶ SBθ
49 A set of points is collinear if they lie on a single straight line or a projective line (for example projective line over any field) and this way the two factors represented by the points are correlated
0
005
01
015
02
025
03
035
04
045
05
05 06 07 08 09 1
be
ta_
sb
beta_length
54
For the first binding function ɶ Lengthθ and ( Lengthβ SBβ ) are plotted in Figure 12 below
And the binding function takes a form as described in Equation (29)
Figure 12 Scatter plot of theta_length with regard to beta_length and beta_sb
By multi-linear regression we can get a surface to approximate the binding function
locally The estimated binding function is displayed in Figure 13 below
Figure 13 Display of the estimated binding function for theta_length
And the first binding function has a formula of
55
ɶ 18234+16933 +00633Length Length SBθ β β= (38)
For the second binding function ɶSBθ and ( Lengthβ SBβ ) are plotted in Figure 14 below
And the binding function takes a form as described in Equation (30)
Figure 14 Scatter plot of theta_sb with regard to beta_length and beta_sb
By multi-linear regression we can get a surface to approximate the binding function
locally The estimated binding function is displayed in Figure 15 below
Figure 15 Display of the estimated binding function for theta_sb
56
And the second binding function has a formula of
ɶ -06698+00371 +17619SB Length SBθ β β= (39)
The t-test of estimated parameters in the binding function is carried out with null
hypothesis of zero Estimates that are significantly different from zero with 95
confidence interval are marked as bold
Table 6 Estimated coefficients of binding function for model with two attributes
Constant Lengthβ SBβ
ɶLengthθ 18234
(43632) 16933
(33481) 00633 (1392)
ɶSBθ -06698
(-7991) 00371 (0366)
17619 (19323)
Seen from the magnitude of coefficients in the binding functions both Lengthβ and SBβ
have positive effect on ɶ Lengthθ andɶ SBθ and in sequence negative effect on the coefficients
in the logit model In addition coefficients of SBβ with regard to ɶ Lengthθ and Lengthβ with
regard to ɶ SBθ are not significantly different from zero so we can say Lengthβ has a more
apparent effect on ɶ Lengthθ than SBβ does while SBβ has a more apparent effect on ɶ SBθ
than Lengthβ does
Based on the estimated binding functions and the true observation data we could get the
estimates of Lengthβ and SBβ as shown in Table 7 below
Table 7 Statistics of estimation of beta_length and beta_sb
Parameter Lengthβ
SBβ
Mean 0761383 0079874
Standard deviation 0068493 0034375
RMSE 0022772 0085113
Seen from the RMSE results the relatively small values indicate that we have well-
estimated binding functions for all the 50 runs on average With regard to the estimates of
parameters in the route choice model both of them fall into the input domain we choose
57
and the standard deviation is quite small So we can say that the estimates are actually
very good
One thing to notice here is that the final estimate of Lengthβ falls approximately in the
middle of the input domain [05 1] while the estimate of SBβ falls closer to the left limit
which might need further shrinkage of input domain and more precise estimate of the
binding function To get rid of this we use the binding function estimate from all the 500
points to give a hint on the reasonability of acceptance of the estimate of SBβ The scatter
plots of theta_sb against beta_sb and beta_length are shown in Figure 16 below
Figure 16 Scatter plots of theta_sb against beta_sb and beta_length
The scatter plots in Figure 16 above are the decompositions of the binding function from
three dimensions to two dimensions Seen from the linear regression in the two plots ɶSBθ
is almost strictly positive proportional to SBβ and hardly effected byLengthβ This means
y = 19132x - 06404
Rsup2 = 0936
-1
-08
-06
-04
-02
0
02
04
06
0 01 02 03 04 05
the
ta_
sb
beta_sb
y = 00123x - 01717
Rsup2 = 4E-05
-1
-08
-06
-04
-02
0
02
04
06
05 06 07 08 09 1
the
ta_
sb
beta_length
58
that by shrinking the input domain ofSBβ we would probably get the same estimate of
binding function since it changes little in current domain And this leads to our
acceptance of the final estimate of SBβ
Given that we have a random cost following a truncated standard normal distribution and
the magnitudes of the estimated parameters are relatively small this would mean that the
randomness of the cost function are relatively large which in sequence leads to relatively
large randomness in individualrsquos choice of route
Another thing to be mentioned is that the magnitude of Lengthβ is smaller than that when
estimated singly Though these two values are not logically comparable with different
formation of random term in the cost function we could still get a hint from the
comparison This difference is probably due to the form of random cost we used which is
( )li Length l Lengthx E xε sdot and the effect of length on the cost is partially captured by this
random term
64 Estimations of other trial formulations of the model
641 Model with exponential form of cost function
During the process of estimation we carried out a lot of other trials in the formulations of
the basic route choice model the cost function to be specific and the auxiliary logit model
As it turned out the there are negative estimates of coefficients in the cost function
which conflicts our anticipation To capture this kind of negative estimation we choose to
use the exponential form of the cost function Without loss of generality the random term
is not scaled by the length of links The cost function is specified as
( ) Length Length l SB SB l lix x
i lic x eβ β εε + += (40)
Two attributes are used namely length and speed bump dummy variable Unlike the form
in Section 63 we allow the parameters Lengthβ and SBβ to have negative input and the
random term liε now follow a standard normal distribution without truncation Since we
take the exponential form of the cost function the cost of links could be kept positive
thus allowing the use of Dijkstrarsquos Algorithm to operate
59
In terms of the auxiliary model since we could have more attributes in the auxiliary
model than the underlying model Instead of using the same attributes as in the cost
function we choose to add an attributes which is number of links in the pathLNx So the
utility function of the logit model is specified as
- - -ri Length Length r SB SB r LN LN r riU x x xθ θ θ ε= + (41)
We still expect the value of θ to be positive and the coefficient of variables with the form
of -θ would be negative
Several trials and shrinkage were carried out for this formulation of our model to finally
determine the relatively small input intervals forLengthβ and SBβ [25 27] and [-05 0]
respectively 15K = runs are carried out to get statistics of the estimates of the two
parameters Within each run 10M = values are drawn for inputs Lengthβ and SBβ
respectively for estimating binding function
To visualize the trend of binding function more clearly we make use all the 150 sets of
vector β and vector θ to estimate the binding function Since we have three variables in
the logit model we have to estimate three binding functions
For the first binding function ɶ Lengthθ and ( Lengthβ SBβ ) are plotted in Figure 17 below
shown along with the estimated binding function
Figure 17 Scatter plot of theta_length against beta_length and beta_sb estimated binding function
The first binding function takes the form of
ɶ 41312+09114 +44845 10Length Length SBθ β βminus= sdot (42)
60
For the second binding function ɶSBθ and ( Lengthβ SBβ ) are plotted in Figure 18 below
shown along with the estimated binding function
Figure 18 Scatter plot of theta_sb against beta_length and beta_sb estimated binding function
The second binding function takes the form of
ɶ 01147 01362 +07119SB Length SBθ β β= minus (43)
For the third binding function ɶ LNθ and ( Lengthβ SBβ ) are plotted in Figure 19 below
shown along with the estimated binding function
Figure 19 Scatter plot of theta_ln against beta_length and beta_sb estimated binding function
The third binding function takes the form of
ɶ 10043 03378 +00068LN Length SBθ β β= minus (44)
The t-test of estimated parameters in the binding function is carried out with null
hypothesis of zero Estimates that are significantly different from zero with 95
confidence interval are marked as bold
61
Table 8 Estimated coefficients of binding functions for model with exponential cost function
Constant Lengthβ SBβ
ɶLengthθ 1312
(2411) 09114 (4360)
4484510-4 (0005)
ɶSBθ 01147
(0425) -01362 (-1314)
07119 (17221)
ɶLNθ 10043
(13767) -03378
(-12051) 00068 (0607)
Same as in the model with two attributes ɶ Lengthθ andɶ SBθ are significantly affected by
Lengthβ and SBβ respectively The negative signs for Lengthβ in the second and third binding
functions draw our attention Since in the second binding function it is not significantly
different from zero we can disregard the effect In the third binding function Lengthβ has
significantly negative effect on ɶ LNθ The larger value of Lengthβ we have the more
influential of path length on cost is With negative effect on ɶ LNθ we can say at the same
time number of links become less influential on the utility This is reasonable since
intuitively if we are sensitive to the path length we wouldnrsquot care too much of having to
switch several more or fewer links based on that path length and number of links are
more or less correlated to each other
Based on the estimated binding functions and the true observation data we could get the
estimates of Lengthβ and SBβ as shown in Table 9 below
Table 9 Statistics of estimation of beta_length and beta_sb in exponential-cost-function model
Parameter Lengthβ
SBβ
Mean 2537672 -045601
Standard deviation 0068377 0133036
We have negative estimate of SBβ which conflicts our assumption that length and
presence of speed bump on the path may increase the cost of traveling through certain
path This is probably due to omission of important attributes in the deterministic part of
the cost function Based on the estimate we are led to think that presence of speed bump
decrease the cost and individuals would prefer to drive on paths with speed bumps Yet
62
this is not true based on our estimation since we are only using two attributes And there
are great chance that some important features are not captured which accidentally are
related with speed bump So the estimate of SBβ is misleading per se in the simple model
as we are using To get more accurate estimate of SBβ we may need to include more
variables in the deterministic part of the cost function
642 Model with estimated scale parameter for random term
Considering the trial with two attributes in Section 63 we add a fixed scale parameter to
the random term to make it proportional to the length of links This appeals to our
assumption yet lays restrictions to the model Apart from this we also try to add an
unfixed scale parameter σ and estimate it along with the other two parameters Lengthβ and
SBβ Note that if we add a scale parameter directly to the random term it wonrsquot work out
as we expect since that way the scale parameter will scale the other two parameters
Lengthβ and SBβ as well as shown below
= ( )Length SBLength Length l SB SB l li Length l SB l lix x x x
β ββ β ε σ σ εσ σ
+ + sdot + + (45)
The right side equation is equivalent to Length Length l SB SB l lix xβ β ε+ + thus making no
difference So we choose to add a new random term including the scale parameter In
addition since we can get good estimate by assuming the random term proportional to
length we will keep this in the newly added random term Now the cost function is
specified as
1 ( ) + ( )l li li Length Length l SB SB l li li Length l Lengthc x x x x Mean xε ε β β ε η σ= + + sdot sdot 2
(46)
liε and liη follow the same truncated normal distribution but are drawn separately so that
they are not equal
In terms of the auxiliary model since now we have three parameters to be estimated in
the underlying model we need one more attribute in the logit model and number of links
in the path LNx is chosen The utility function of the logit model is actually the same as in
Section 641 which is
- - -ri Length Length r SB SB r LN LN r riU x x xθ θ θ ε= + (47)
63
With three parameters in the underlying model it is more reasonable to include
interactions of parameters in the binding function The binding functions take the form of
ɶ
1 2 3
4 5 6 7
( )
Length SB
Length SB Length SB Length SB
c d d d
d d d d
θ β β β σβ β β σ β σ β β σ
= + + +
+ + + + (48)
Since the estimates are not good we did not carry out too many trials to center the input
interval As a result the binding function may be of more interest in this case The chosen
interval is a trial one which is identical [0 3] for Lengthβ SBβ andσ We choose ten sets of
mβ and ɶ ( )m mθ β from one run as an example The values of ɶ ( )m mθ β are plotted against
Lengthβ SBβ andσ respectively The interactions are not shown in the figure yet we have
the estimates of binding function which will give a numerical description of how the
interactions impact theɶ ( )m mθ β
Figure 20 Plots of theta_length against beta_length beta_sb and sigma respectively
y = 09114x + 27818
Rsup2 = 07361
0
1
2
3
4
5
6
0 1 2 3 4
the
ta_
len
gth
beta_length
y = 03568x + 36215
Rsup2 = 00897
0
1
2
3
4
5
6
0 1 2 3 4
the
ta_
len
gth
beta_sb
y = 02572x + 38468
Rsup2 = 00516
0
1
2
3
4
5
6
0 1 2 3
the
ta_
len
gth
sigma
64
Figure 21 Plots of theta_sb against beta_length beta_sb and sigma respectively
y = 02363x + 0835
Rsup2 = 0088
0
05
1
15
2
25
3
0 1 2 3 4
the
ta_
sb
beta_length
y = 06351x + 01759
Rsup2 = 05054
0
05
1
15
2
25
3
0 1 2 3 4
the
ta_
sb
beta_sb
y = -03801x + 17212
Rsup2 = 02001
0
05
1
15
2
25
3
0 1 2 3
the
ta_
len
gth
sigma
y = 00477x + 04521
Rsup2 = 005460
02
04
06
08
1
0 1 2 3 4
the
ta_
ln
beta_length
y = -00553x + 06156
Rsup2 = 00582
0
02
04
06
08
1
0 1 2 3 4
the
ta_
ln
beta_sb
65
Figure 22 Plots of theta_ln against beta_length beta_sb and sigma respectively
As we can see from the three figures above ɶ Lengthθ ɶSBθ and ɶ LNθ are more affected by
Lengthβ SBβ andσ respectively Especially we can see a strong relationship between ɶ LNθ
and σ which assures that number of links can be used to infer the scale parameter in the
underlying model
The estimates of three binding functions are shown in Table 10 below with each row
representing the estimates for one of the three binding function and each column
representing certain variable in the binding function In the parenthesis below each
estimate of the coefficients is the t-test value with the null hypothesis of zero We take the
90 confidence interval and estimates with t-test value larger than 164 are supposed to
be significantly different from zero which are marked as bold
Table 10 Estimates of three binding functions
Constant Lengthβ SBβ σ
Length SBβ β
Lengthβ σ
SBβ σ Length SBβ β σ
ɶLengthθ
1814 (3085)
0861 (2417)
-0089 (-0258)
1038 (2913)
0202 (1030)
-0246 (-1240)
-0056 (-0292)
-0045 (-0412)
ɶSBθ 0284
(1482) -0125
(-1081) 0942
(8371) -0247
(-2127) 0118
(1856) 0070
(1086) -0141
(-2275) -0067
(-1883)
ɶLNθ 0819
(18643) 0015
(0577) -0026
(-0997) -0261
(-9794) 0006
(0419) 0007
(0498) 0024
(1663) -0007
(-0803)
As the constants indicate given no other attributes length and number of links have more
negative effects on the utility than the speed bump dummy does Judging from the
significance of coefficients for the three input parametersɶ Lengthθ ɶSBθ and ɶ LNθ are
significantly affected by Lengthβ SBβ andσ respectively As we can see σ has a negative
y = -02164x + 08218
Rsup2 = 09867
0
02
04
06
08
1
0 1 2 3th
eta
_ln
sigma
66
effect on ɶSBθ andɶ LNθ Since to some extent σ measures the scale of randomness we
could say that the more randomness of the costs on the links have the less influential of
presence of speed bump and number of links become ForɶSBθ it is significantly affected
by some of the interaction terms Notice that SBβ has positive effect onɶSBθ while σ has
effect The interaction terms including both σ and SBβ have negative effect onɶSBθ which
indicates that randomness of cost is more influential than presence of speed bump on the
disutility of speed bump
In terms of the final estimate as stated above the estimates of Lengthβ and SBβ have
negative signs whileσ has positive sign This result conflict our expectation that Lengthβ
and SBβ should have positive signs so we did not carry out more trials and shrinkage The
possible reason for negative estimate is similar to that in the model with exponential form
of cost function Given more attributes in the deterministic part of both the cost function
and utility function in the logit model we might be able to capture the features of the data
better and have the right sign in the final estimates
643 Monte Carlo evidence of model with estimated scale parameter for random
term
Based on the model formulation with estimated scale parameter for random term we also
carried out a Monte Carlo simulation experiment to verify the efficiency of using number
of links in the logti model to infer the scale parameter in the cost function and what we
do is to simulated observations instead of the true ones
We take three arbitrary values for the three parameters in the cost functionLengthβ SBβ and
σ to be 05 And simulated observations are generated based on the given values of
parameters in the cost function Since we know the true values for the parameters the
input domain is centered around the true values to be [04 06] for Lengthβ SBβ andσ
10K = runs are carried out to get statistics of the estimates of the three parameters
Within each run 10M = values are drawn for inputsLengthβ SBβ andσ respectively for
estimating binding function
67
In terms of the binding function by doing regression test we can see that the intersection
terms are unnecessary to be included or even hazardous for good estimate of binding
function so we decide to remove them and keep the binding function as
ɶ1 2 3( ) Length SBc d d dθ β β β σ= + + + (49)
We choose ten sets of mβ and ɶ ( )m mθ β from one run as an example The values of
ɶ ( )m mθ β are plotted againstLengthβ SBβ andσ respectively
Figure 23 Plots of theta_length against beta_length beta_sb and sigma respectively
y = 23826x + 14791
Rsup2 = 05326
15
2
25
3
35
04 05 06
the
ta_
len
gth
beta_length
y = -06434x + 30245
Rsup2 = 0048115
2
25
3
35
04 05 06
the
ta_
len
gth
beta_sb
y = 26255x + 14156
Rsup2 = 07607
15
2
25
3
35
04 05 06
the
ta_
len
gth
sigma
y = -02443x + 04708
Rsup2 = 0034
0
01
02
03
04
05
04 05 06
the
ta_
sb
beta_length
y = 11233x - 02096
Rsup2 = 089020
01
02
03
04
05
04 05 06
the
ta_
sb
beta_sb
68
Figure 24 Plots of theta_sb against beta_length beta_sb and sigma respectively
Figure 25 Plots of theta_ln against beta_length beta_sb and sigma respectively
The figures show similar trend to those in the trial model with estimated scale parameters
which is in line with our expectation
The estimates of three binding functions are shown in Table 11 below with each row
representing the estimates for one of the three binding function and each column
y = -04374x + 056
Rsup2 = 01283
0
01
02
03
04
05
04 05 06
the
ta_
sb
sigma
y = -01144x + 07619
Rsup2 = 01114066
067
068
069
07
071
072
073
074
04 05 06
the
ta_
ln
beta_length
y = 0053x + 06768
Rsup2 = 00296066
067
068
069
07
071
072
073
074
04 05 06
the
ta_
ln
beta_sb
y = -03115x + 08561
Rsup2 = 09717
066
067
068
069
07
071
072
073
074
04 05 06
the
ta_
ln
sigma
69
representing certain variable in the binding function In the parenthesis below each
estimate of the coefficients is the t-test value with the null hypothesis of zero We take the
95 confidence interval and estimates with t-test value larger than 196 are supposed to
be significantly different from zero which are marked as bold
Table 11 Estimates of three binding functions in the Monte Carlo experiment
Constant Lengthβ SBβ σ
ɶLengthθ 0853
(3606) 1009
(3724) -0034
(-0125) 2569
(9482)
ɶSBθ -0062
(-0385) -0104
(-0564) 1208
(6591) -0226
(-1227)
ɶLNθ 0854
(46688) 0013
(0624) -0004
(-0185) -0302
(-14428)
The estimates of binding function have similar characteristics as in the trial model with
estimated scale parameters as well They contain almost the same significant coefficients
and those significant estimates have the same signs as in the trial with true observations
Based on the estimated binding function and the simulated observations given true values
of the three parameters to be 05 the final estimates of Lengthβ SBβ andσ are shown in
Table 12 below
Table 12 Statistics of estimation of beta_length beta_sb and sigma in the Monte Carlo experiment
Parameter Lengthβ
SBβ σ
Mean 0404138359 0458624533 0639191487
Standard deviation 1109279424 0242570421 0377069799
As we can see the estimates of Lengthβ SBβ andσ are quite close to their true values What
is not satisfying is that the estimate of σ is a little large and lies outside the input domain
of [04 06] but is still quite near to this interval In addition the estimate of Lengthβ is
within the input domain yet the variation is large This is understandable since we scale
the random term by length together with the scale parameter and thus the parameter for
length could be influenced by the random term and turns out to have large variations In a
word the result of Monte Carlo experiment verifies that we get use the model
70
formulation with unfixed scale parameter for the random term to get the right estimate of
the true values And number of links is strongly related withσ which means that it is
reasonable and efficient to use it as a reference to σ in the cost function
71
7 Conclusions
This thesis aims at implementing the newly proposed route choice model based on
indirect inference in true observations The model assigns links specific errors for a
network which allows natural correlations among paths and is practical in simulating
observations by means of shortest path searching algorithms like the Dijkstrarsquos Algorithm
used in our experiment To get consistent estimation of this kind of model indirect
inference method is used and a simple model like logit model is used as an auxiliary
model The route choice model and indirect inference estimator has been tested on
synthetic data with simulated observations and proved to be capable of consistently
estimated
Compared to the synthetic experiment some extensions are done in this thesis By
replacing the simulated observations with the true observations the method is tested on
the empirical circumstance to prove that it could be used in solving practical problems
The true observations have more noises than the simulated ones thus more difficulty to
capture their features We know neither the right formulations of models based on the
data nor the values of parameters in the route choice model yet as defined the
parameters should have positive signs As it turned out to be in the experiment with only
length in the model we get the estimates of Lengthβ as 1337 while with two attributes in
the model we get the estimates of Lengthβ and SBβ as 0761 and 00799 respectively The
estimates in both experiments seem reasonable with the right sign In addition seen from
the estimation of the binding function the coefficients in the logit model is negatively
affected by the parameters they infer in the basic route choice model in the two attributes
case one parameter in the logit model is more apparently affected by the parameter it
refers than the other parameter in basic model
In the trial where we include a scale parameter to the random term and estimate it along
with the other parameters in the route choice model a Monte Carlo simulation
experiment is carried out using simulated observations The result shows that it is
efficient to use number of links in the auxiliary model to infer the scale parameter in the
basic rout choice model
72
In other trial formulations of the model we got negative estimates which may probably
be due to missing attributes in the cost function Future work should be done to include
more attributes
Another thing to recommend for future is that we generate the pseudo-universal choice
set as part of the auxiliary model Since the pseudo-universal choice set is partially used
for deciding which ODs and observations to be used in the project it is essential and
should be generated beforehand But from the choice set generation point of view we
could generate individual specific choice set directly instead of random drawing paths
from the pseudo-universal choice set This would increase computational efficiency
73
Bibliography
Axhausen K Schoumlnfelder S Wolf J Oliveira M amp Samaga U (2003) 80 Weeks of
GPS Traces Approaches to Enriching the Trip Information Transportation Research
Record 1870 46-54
Azevedo J Costa M Madeira J amp Martins E (1993) An Algorithm for the Ranking
of Shortest Paths European Journal of Operational Research 69 (1) 97-106
Bartels K Boztug Y amp Muumlller M (1999) Testing the Multinomial Logit Model
Working paper University Potsdam Germany
Bekhor S Ben-Akiva M amp Ramming M (2002) Adaptation of Logit Kernel to Route
Choice Situation Transportation Research Board of the National Academics 1805 78-85
Bekhor S Ben-Akiva M amp Ramming M (2006) Evaluation of Choice Set Generation
Algorithms for Route Choice Models Annals of Operations Research 114 (1) 235-247
Ben-Akiva M amp Bierlaire M (1999) Discrete Choice Methods and Their Applications
to Short Term Travel Decisions In Chapter for the Transport Science Handbook
Preliminary Draft
Ben-Akiva M amp Bierlaire M (2003) Discrete Choice Models with Applications to
Departure Time and Route Choice In Handbook of Transportation Science (second ed)
Kluwer
Ben-Akiva M amp Bolduc D (1996) Multinomial Probit with a Logit Kernel and a
General Parametric Specification of the Covariance Structure Working Paper
Ben-Akiva M amp Lerman S (1985) Discrete Choice Analysis Theory and Application
to Travel Demand MIT Press
Ben-Akiva M Bergman M Daly A amp Ramaswamy R (1984) Modeling Inter Urban
Route Choice Behaviour In J Vollmuller amp R Hamerslag (Ed) the 9th International
Symposium on Transportation and Traffic Theory (pp 299-330) Utrecht Netherlands
VNU Science Press
Cascetta E Nuzzolo A Russo F amp Vitetta A (1996) A Modified Logit Route Choice
Model Overcoming Path Overlapping ProblemsSpecification and Some Calibration
Results for Interurban Networks In J Lesort (Ed) the 13th International Symposium on
Transportation and Traffic Theory Lyon France
74
Creel M (2009) A Data Mining Approach to Indirect Inference Universitat Autonoma
de Barcelona Department of Economics and Economic History
De La Barra T Peacuterez B amp Anez J (1993) Multidimensional Path Search and
Assignment 21st PTRC Summer Meeting (pp 307-319)
Dijkstra E (1959) A note on two problems in connexion with graphs Numerische
Mathematik 1 269-271
Frejinger E amp Bierlaire M (2007) Capturing Correlation with Subnetworks in Route
Choice Models Transportation Research Part B 41 363-378
Frejinger E Bierlaire M amp Ben-Akiva M (2009) Sampling of Alternatives for Route
Choice Modeling Transportation Research Part B Methodological 43 (10) 984-994
Gallant A amp McCulloch R (2004) On the Determination of General Scientific Models
Manuscript Duke University
Gourieacuteroux C Monfort A amp Renault E (1993) Indirect Inference Journal of Applied
Econometrics 8 85-118
Karlstroumlm A Sundberg M amp Wang Q (2011) Consistently estimating flexible route
choice models using an MNL lense International Choice Modeling Conference Leeds
Keane M amp Smith A (2003) Generalized Indirect Inference for Discrete Choice
Models Manuscript Yale University
Manski C amp Lerman S (1977) The Estimation of Choice Probabilities from Choice
Based Samples Econometrica 45 (8) 1977-1988
McFadden D (1974) Conditional Logit Analysis of Qualitative Choice Behaviour (P
Zarembka Ed) Frontiers in Econometrics 105-142
McFadden D (1978) Modeling the Choice of Residential Location In A Karlqvist L
Lundqvist F Snickars amp J Weibull (Ed) Spatial Interaction Theory and Residential
Location (pp 75-96) Amsterdam North-Holland
McFadden D amp Train K (2000) Mixed MNL Models for Discrete Response Journal
of Applied Econometrics
Nerella S amp Bhat C (2004) Numerical Analysis of Effect of Sampling of Alternatives
in Discrete Choice Models Transportation Research Record 1894 11-19
Ramming M (2001) Network Knowledge and Route Choice PhD Thesis Massachusetts
Institute of Technology
75
Schoumlnfelder S amp Samaga U (2003) Where Do You Want to Go Today-More
Observations on Daily Mobility Third Swiss Transport Research Conference Ascona
Schoumlnfelder S Axhausen K Antille N amp Bierlaire M (2002) Exploring the
Potentials of Automatically Collected GPS Data for Travel Behaviour Analysis- A
Swedish Data Source i J Moumlltgen amp A Wytzisk (Red) GI-Technologien fuumlr Verkehr
und Logistik number 13 Institut fuumlr Geoinformatik Universitaumlt Muumlnster (ss 155-179)
Munster IfGIprints
Smith A (1993) Estimating Nonlinear Time-series Models Using Simulated Vector
Autoregressions Journal of Applied Econometrics 8 63-84
Smith A (2008) Indirect Inference In S Durlauf amp L Blume (Eds) The New
Palgrave Dictionary of Economics (Second ed) Palgrave Macmillan
Smith A (1990) Three Essays on the Solution and Estimation of Dynamic
Macroeconomic Models PhD Dissertation Duke University
Train K (2003) Discrete Choice Methods with Simulation Cambridge University Press
Vovsha P amp Bekhor S (1998) Link-nested Logit Model of Route Choice-Overcoming
Route Overlapping Problem Transportation Research Record 1645 133-142
Wang H (2011) Logistics Distribution Shortest Path Based on Dijkstra Algorithm
Computer and Digital Engineering 3
Assigned publication number
TSC-MT 11-016
wwwkthse

3
Contents Abstract 2
Acknowledgement 2
List of Figures 5
List of Tables 6
1 Introduction 7
11 Motivation 7
12 Background 7
13 Objective 8
14 Scope of the Thesis 9
2 Literature Review11
3 Methodology 18
31 Multinomial Logit Model (MNL) 18
311 Model Description 18
312 Model Estimation 21
32 Dijkstrarsquos Algorithm 22
321 Introduction 22
322 Algorithm 23
323 Explanatory Example 24
324 Discussion 26
33 Indirect Inference 26
331 Introduction 26
332 Definition of the method 27
333 Choices of the metrics 29
334 Consistency Interpretation 30
34 Model Specification in the Thesis 30
341 Basic Route Choice Model 30
342 Auxiliary Model 33
343 Consistency Discussion 35
344 Binding Function 37
4 Data 39
41 Road Network 39
42 Observation Data 42
43 Further Exploration of data 44
4
5 Experiment Design 46
6 Results 49
61 Validation of Binding Function 49
62 Estimation of model with one attribute 51
63 Estimation of model with two attributes 52
64 Estimations of other trial formulations of the model 58
641 Model with exponential form of cost function 58
642 Model with estimated scale parameter for random term 62
643 Monte Carlo evidence of model with estimated scale parameter for random term 66
7 Conclusions 71
Bibliography 73
5
List of Figures
Figure 1 S-shaped relationship between probability and deterministic part of utility 20
Figure 2 A simple network for Dijstrrarsquoa Algorithm explanation 24
Figure 3 Illustration of the Borlaumlnge road network 39
Figure 4 Histogram of link length data 40
Figure 5 Histogram of link length data (zoomed within 1km) 41
Figure 6 Illustration of links with speed bumps 41
Figure 7 Histogram of link numbers in observations data set 43
Figure 8 Illustration of the flow in the experiment 46
Figure 9 Scatter plots of the 90 beta-theta pairs 49
Figure 10 OLS regression based on the 10 beta-theta points from one run 50
Figure 11 Scatter plot of the input values for beta_length and beta_sb 53
Figure 12 Scatter plot of theta_length with regard to beta_length and beta_sb 54
Figure 13 Display of the estimated binding function for theta_length 54
Figure 14 Scatter plot of theta_sb with regard to beta_length and beta_sb 55
Figure 15 Display of the estimated binding function for theta_sb 55
Figure 16 Scatter plots of theta_sb against beta_sb and beta_length 57
Figure 17 Scatter plot of theta_length against beta_length and beta_sb estimated binding
function 59
Figure 18 Scatter plot of theta_sb against beta_length and beta_sb estimated binding
function 60
Figure 19 Scatter plot of theta_ln against beta_length and beta_sb estimated binding
function 60
Figure 20 Plots of theta_length against beta_length beta_sb and sigma respectively 63
Figure 21 Plots of theta_sb against beta_length beta_sb and sigma respectively 64
Figure 22 Plots of theta_ln against beta_length beta_sb and sigma respectively 65
Figure 23 Plots of theta_length against beta_length beta_sb and sigma respectively 67
Figure 24 Plots of theta_sb against beta_length beta_sb and sigma respectively 68
Figure 25 Plots of theta_ln against beta_length beta_sb and sigma respectively 68
6
List of Tables
Table 1 Descriptive statistics of link length 40
Table 2 Descriptive statistics of link numbers in observation data set 43
Table 3 Descriptive statistics of estimated travel time on links 44
Table 4 Descriptive statistics of duration of trips 45
Table 5 Statistics of estimation of beta_length 51
Table 6 Estimated coefficients of binding function for model with two attributes 56
Table 7 Statistics of estimation of beta_length and beta_sb 56
Table 8 Estimated coefficients of binding functions for model with exponential cost
function 61
Table 9 Statistics of estimation of beta_length and beta_sb in exponential-cost-function
model 61
Table 10 Estimates of three binding functions 65
Table 11 Estimates of three binding functions in the Monte Carlo experiment 69
Table 12 Statistics of estimation of beta_length beta_sb and sigma in the Monte Carlo
experiment 69
7
1 Introduction
11 Motivation
With the development of ITS there is a stronger desire for more accurate and efficient
vehicle orientation systems and devices which relies much on the mechanism of route
choice models In other cases well estimated route choice models reveals travel behavior
of the car drivers which contributes to system-scaled analysis such as design and
appraisal of road pricing system across the road network On the other hand newly
developed GIS techniques provide sufficient route choice data as solid basement for
research on route choice behaviors Both the desire for better developed model and more
available prerequisites stimulate the research on route choice modeling
12 Background
Route choice modeling has been discussed for a long time Given a basement network
composed by a finite number of nodes which are connected by directed links we assume
that individuals travel from an origin node to a destination node in the network Thus the
choice of an individual turns out to be an observed path represented by a sequence of
links considering inherent attributes of links such as length or presence of speed bumps
From this point of view individuals make discrete choices the behavioral mechanism of
which could be seen in two different ways Individuals could either be seen as choosing
links from each junction node or choosing from possible paths connecting the origin node
and the destination one In line with a great body of literatures we focus on the path-
based approaches to develop our model
There are two important issues that need to be considered for this kind of approach
namely the generation of choice set and model formulation to address alternative
correlation due to path overlapping To be specific when we assume that individuals
choose from paths connecting the origin and destination it is infeasible to enumerate the
full-size choice set or universal choice set which includes all possible paths between the
OD pair in a given road network Individuals may not virtually consider the universal
choice set when they make decisions and in practice algorithms implemented to find the
shortest paths avoid the usage of choice set at all such as the Dijkstrarsquos algorithm we
implement in the model Hence we give each individual the right to consider all possible
8
paths It is common practice to generate samples from the universal choice set yet this
may easily introduce biases to the estimation Samples are supposed to be randomly
drawn from the population and good samples can reproduce the features in the population
Since in real-size network it is impossible to know the full-size choice set let alone to
reproduce the features of it We could only draw from certain known paths and this is
more like an importance sampling which gives links different possibilities to the drawn
into paths As a result estimation based on the sampled paths will have biases
The other problem with regard to path-based approaches is the inherent limitation of
multinomial logit model (MNL) which requires no correlation among alternatives This
is practically unrealistic since in the context of route choice modeling paths sharing
certain links are correlated due to unobserved features of the common links Numerous
literatures contribute to improvement in terms of the problem based on logit models
We choose to use an approach with additive link specific errors which belongs to probit-
like models This kind of model is efficient for applications yet it is still not able to be
estimated consistently given a partial choice set So we turn to indirect inference as the
tool to estimate the probit-like model with additive link specific errors All feasible paths
for each individual are technically allowed which means that a universal choice set is
provided for each OD pair to avoid bias caused by sampling from full choice sets The
universal choice set generated here is a so-called pseudo-universal choice set which
contains as many feasible paths as desired to eliminate possible biases but not all paths
since it is practically impossible to get the true universal choice set We choose to use an
MNL model as the auxiliary model which is easy to estimate The estimate of MNL
model is biased based on the choice set we generate as discussed above yet the estimate
of parameters in the basic route choice model will be consistent thanks to the features of
the indirect inference method
13 Objective
A Monte Carlo simulation experiment has been carried out based on synthetic trip data
and real-sized road network to appraise the proposed model (See Karlstroumlm Sundberg amp
9
Wang 2011)1 The basic route choice model includes two attributes namely length and
speed bump dummy while an MNL model is chosen as the auxiliary model with the
same two attributes Simulated trip data given two pseudo-true values for coefficients of
length and speed bump dummy are used as a substitution of the empirical data The
presence of speed bumps is randomly allocated over the network Estimation results and
sensitivity test confirm the efficiency and consistency of the proposed estimator
What needs to be done in the thesis is that true trip data should be implemented as well as
the modification of the network To be specific realistic speed bump distribution is used
to replace the randomly allocated one Without knowing the true values of the
coefficients several iterations need to be carried out to get to know the raw domain of the
values and by shrinking input intervals more accurate estimates will be attained as the
accomplishment of the thesis
14 Scope of the Thesis
Based on the route choice model used in the synthetic experiment extensions are done in
five main aspects First we implement the newly proposed estimator in real world issues
by replacing the simulated observations with the true observations collected in a real
world network Unlike the simulated data which is generated following certain
assumptions the true observations have more noises inside and thus more difficult to
capture their features Second the observations we use contain many OD pairs and not
restricted with one or four of them as in the synthetic experiment this gets rid of the
possibility of bias caused by restricted OD pairs Third since we are implementing the
new method in true observations the formulation of route choice model cost function to
be specific is not known beforehand and correspondingly the formulation of the utility
function in the logit model is not for sure as well We need several trials to get well
defined formulations to capture the features of the data Fourth we have no idea what the
parameters are like based on true observation and thus a raw guess of input domain is
needed at first and centered with shrinkage in later iterations Last but not least in one
trial we included a scale parameter to the random term in the cost function and use
number of links in the auxiliary model to infer it To test the efficiency of this trial a
1 Karlstroumlm A Sundberg M amp Wang Q (2011) Consistently estimating flexible route choice models using an MNL lense International Choice Modeling Conference Leeds
10
Monte Carlo simulation experiment is carried out with some arbitrary pseudo-true values
of the parameters based on which simulated observations are used
On the other hand what is done in the synthetic experiment such as test with simulated
observations for one OD and four ODs sensitivity of estimates with choice set size and
number of observations is not included in this thesis Instead we will identify some
limitations of the model formulation tried in the thesis and make suggestions how the
model can be improved
As follows Section 2 reviews relevant literatures on route choice modeling as well as
indirect inference In Section 3 relevant methods are introduced in detail as backgrounds
afterwards methods and models used in this thesis are illustrated Section 4 gives
description of the empirical data we use for estimating and Section 5 shows the
estimation results of the Monte Carlo simulation-based experiment followed by some
conclusions in Section 6
11
2 Literature Review
Route choice modeling has long been discussed and many efforts have been made to
solve this problem Simple and easy to estimate the multinomial logit model (MNL) is
widely used in choice modeling yet it has certain restrictions to be implemented in route
choice context Due to its inherent property of Independence from Irrelevant Alternatives
(IIA) the multinomial logit model is not easily applicable since routes in the choice set
tend to be correlated with the presence of overlapping paths Cascetta et al (1996)
proposed a correction term called Commonality Factor (CF) in the deterministic part of
the utility function2 And the probability of path i to be chosen from the choice set nC
becomes( )
( )( | )in in
jn jn
n
V CF
n V CF
j C
eP i C
e
micro
micro
minus
minus
isin
=sum
As proposed by Cascetta et al the Commonality
Factor is specified as ln ( )n
ijin CF
j C i j
LCF
L Lγβ
isin
= sum in which ijL is the length of links
common to path i and pathj while iL and jL are the total length of path i and pathj
respectively The parameter γ is left to be estimated or practically constrained to a fixed
value like 1 or 2 The CF term of one path is proportional to the length of overlapping
part with other paths This proposed model is referred to as C-Logit model Bearing some
similarities Ben-Akiva and Bierlaire (1999) proposed the Path Size Logit (PSL) model3
This model is based on a different theoretical basis as the C-Logit The original
formulation of Path Size (PS) comes from the discrete choice theory of aggregate
alternatives Similar to the CF in C-Logit the log of Path Size (PS) is added to the utility
function The probability of path i to be chosen from the choice set nC becomes
( ln )
( ln )( | )in in
jn jn
n
V PS
n V PS
j C
eP i C
e
micro
micro
+
+
isin
=sum
The Path Size is specified as
1
i n
n
ain
a Ciaj
j C j
lPS
LL
LδisinΓ
isin
= sumsum
in
2 Cascetta E Nuzzolo A Russo F amp Vitetta A (1996) A Modified Logit Route Choice Model Overcoming Path Overlapping ProblemsSpecification and Some Calibration Results for Interurban Networks In J Lesort (Ed) the 13th International Symposium on Transportation and Traffic Theory Lyon France 3 Ben-Akiva M amp Bierlaire M (1999) Discrete Choice Methods and Their Applications to Short Term Travel Decisions In Chapter for the Transport Science Handbook Preliminary Draft
12
which iΓ is the set of links in pathi al and iL are the length of link a and pathi
respectively ajδ is the link incidence variable with value of 1 when link abelongs to path
j and zero otherwise And nCL is the shortest path in choice setnC The size of a path has
a maximum value of one when it shares no links with other paths
C-Logit model and PSL model are the most widely used models in practice of route
choice modeling due to their simple forms Since both of them originate from the MNL
model and maintain the basic MNL structure they can be estimated by existing software
designed for logit models Apart from these two types of models there are other recent
efforts in the route choice context
Bekhor Ben-Akiva and Ramming (2002) adapted the Logit Kernel model to apply in a
route choice context4 The Logit Kernel5 model was proposed by combing Gaussian and
Type I Extreme Value error terms by researchers such as Ben-Akiva and Bolduc (1996)
and McFadden and Train (2000) who also referred to it as Mixed Logit6 By making
certain assumptions under route choice context Bekhor Ben-Akiva and Ramming (2002)
proposed a way to apply the model to route choice modeling7 Based on the data from
Boston several kinds of models are estimated including multinomial logit model Path
Size Logit and the newly proposed Logit Kernel model Seen from the estimation results
Logit Kernel has a better overall performance than the other two kinds of models This
result needs to be verified in other data sets since the one used in the paper has a
relatively small size
Frejinger and Bierlaire (2007) proposed an approach to capture correlation among
alternative routes with subnetworks and carried out estimation based on several kinds of
route choice models8 The paper gives an overview of the latest development of route
choice modeling and discusses the Path Size Logit model in detail As part of the
4 Bekhor S Ben-Akiva M amp Ramming M (2002) Adaptation of Logit Kernel to Route Choice Situation Transportation Research Board of the National Academics 1805 78-85 5 Ben-Akiva M amp Bolduc D (1996) Multinomial Probit with a Logit Kernel and a General Parametric Specification of the Covariance Structure Working Paper 6 McFadden D amp Train K (2000) Mixed MNL Models for Discrete Response Journal of Applied Econometrics 7 Bekhor S Ben-Akiva M amp Ramming M (2002) Adaptation of Logit Kernel to Route Choice Situation 8 Frejinger E amp Bierlaire M (2007) Capturing Correlation with Subnetworks in Route Choice Models Transportation Research Part B 41 363-378
13
conclusion a behavioral interpretation of the Path Size in the model is given The
subnetwork is defined so that the alternative routes sharing the same section of it are
seen as correlated This correlation is captured using the Error Component model and
estimation results show that this new approach gives better property than PSL models To
complement the paper uses a real size network and true travel data is collected which is
the same network we are going to use in this thesis project Additionally the paper
displays forecasting results which indicates that models with Path Size component tend
to have bad performance in prediction
Ben-Akiva and Bierlaire (2003) pointed out that under route choice context the
significant correlation among alternatives due to path overlapping and the generation of
choice set are two important issues and main difficulties9
There are some algorithms used in practice for generating choice set for route choice
modeling both deterministic methods and stochastic ones The deterministic methods
tend to give the same set of paths for a given OD pair Some examples are the link
penalty algorithm (De La Barra Peacuterez amp Anez 1993) which increases gradually the
impedance of all the links on the shortest path10 the link elimination algorithm (Azevedo
Costa Madeira amp Martins 1993) which removes links on the shortest path in sequence
to generate new paths11 and the labeled paths (Ben-Akiva Bergman Daly amp
Ramaswamy 1984)12 In terms of the stochastic methods they tend to produce individual
specific choice set One example is the simulation method (Ramming 2001) which
generates alternative paths by drawing link impedances from different distribution
densities13
When it comes to appraisal of the generated choice set some literatures give evaluations
on the efficiency of different sampling algorithms for choice set generation (See Bekhor
9 Ben-Akiva M amp Bierlaire M (2003) Discrete Choice Models with Applications to Departure Time and Route Choice In Handbook of Transportation Science (second ed) Kluwer 10 De La Barra T Peacuterez B amp Anez J (1993) Multidimensional Path Search and Assignment 21st PTRC Summer Meeting (pp 307-319) 11 Azevedo J Costa M Madeira J amp Martins E (1993) An Algorithm for the Ranking of Shortest Paths European Journal of Operational Research 69 (1) 97-106 12 Ben-Akiva M Bergman M Daly A amp Ramaswamy R (1984) Modeling Inter Urban Route Choice Behaviour In J Vollmuller amp R Hamerslag (Ed) the 9th International Symposium on Transportation and Traffic Theory (pp 299-330) Utrecht Netherlands VNU Science Press 13 Ramming M (2001) Network Knowledge and Route Choice PhD Thesis Massachusetts Institute of Technology
14
Ben-Akiva amp Ramming 2006 for example) Apart from this there are some recently
proposed methods for sampling alternatives under route choice context (See Frejinger
Bierlaire amp Ben-Akiva 2009 for example)
Nerella and Bhat (2004) carried out a numerical analysis on the effect of sample size on
the efficiency of the estimation of parameters14 The analysis is done for two kinds of
discrete choice models namely the multinomial logit model for which consistency of
estimation based on subset of alternatives is theoretically proved and non-MNL model
taking mixed multinomial logit model as an example Four evaluation criteria are chosen
namely the ability to recover model parameters ability to estimate overall log-likelihood
function value ability to estimate individual choice probabilities and ability to estimate
aggregate shares of alternatives The results show that the MNL model works well on
small sample size yet certain portion of full choice set need to be kept as a practical
baseline For the non-MNL model small sample size gives poor estimation and increase
of sample size gives obvious increase of estimation quality Certain portion of full choice
set is suggested for practical convenience yet the generalization of sample size portion is
not feasible since difference kinds of models may require different portion to guarantee
accuracy In general for the non-MNL models full choice set is suggested to be used if
feasible and larger sample gives better estimation
Bekhor Ben-Akiva and Ramming (2006) carried out route choice modeling based on a
large-scale urban network including both choice set generation part and route choice
estimation part which compose the process of route choice modeling together15 Given
that previous literatures did not pay too much attention to empirical estimation the paper
used a true observation data set collected in Boston As the first step several choice set
generation algorithms are listed and compared in their efficiency of reproducing the
observed paths on which the evaluation of the algorithms are based The data in Boston
is described in the paper and used in the second step ie model estimation Several route
choice models are presented and estimation results based on different kinds of models are
shown for comparison of the efficiency of the models The Path Size Logit model is
14 Nerella S amp Bhat C (2004) Numerical Analysis of Effect of Sampling of Alternatives in Discrete Choice Models Transportation Research Record 1894 11-19 15 Bekhor S Ben-Akiva M amp Ramming M (2006) Evaluation of Choice Set Generation Algorithms for Route Choice Models Annals of Operations Research 114 (1) 235-247
15
proposed for its property to overcoming the drawbacks of the conventional MNL models
This type of model can be easily estimated using popularized software The main
conclusion is that route choice models could be estimated for large-scale networks based
on the true observation data and prominent computing resources
Frejinger Bierlaire and Ben-Akiva (2009) proposed a paradigm for choice set generation
based on sampling for route choice modeling16 In the context of route choice modeling
the universal choice set which denotes all possible alternatives for a traveler to choose
from is not able to be enumerated So we practically work on a sampled choice set from
the universal one which may easily introduce bias to the final estimate In this paradigm
they focus on unbiased estimation of parameters instead of generating actual choice set
The path generation is seen as an importance sampling approach and a correction of
sampling is added to the path utility Since the following estimation process is based on
the sampled choice set which is treated as the universal one a correction for sampling is
added to the path size attribute in the commonly used path size logit (PSL) model ending
up with the expanded path size Modification in the previous two steps guarantees
unbiased estimation of the parameters Numerical results based on synthetic data are
presented in the paper to reveal that models with a sampling correction in the path utility
are better than those without it The proposed expanded path size logit model provides
unbiased estimation and is better than the original path size models
In this paper we will examine indirect inference Indirect inference is not a new method
it was first introduced by Smith (1990 1993)17 Then Gourieacuteroux et al (1993) gave
overall introduction to the methods and extended it in important ways18 Gallant and
McCulloch (2004) transferred the idea of indirect inference and used it for Bayesian
inference in models where likelihood function is intractable19
16 Frejinger E Bierlaire M amp Ben-Akiva M (2009) Sampling of Alternatives for Route Choice Modeling Transportation Research Part B Methodological 43 (10) 984-994 17 Smith A (1990) Three Essays on the Solution and Estimation of Dynamic Macroeconomic Models PhD Dissertation Duke University Smith A (1993) Estimating Nonlinear Time-series Models Using Simulated Vector Autoregressions Journal of Applied Econometrics 8 63-84 18 Gourieacuteroux C Monfort A amp Renault E (1993) Indirect Inference Journal of Applied Econometrics 8 85-118 19 Gallant A amp McCulloch R (2004) On the Determination of General Scientific Models Manuscript Duke University
16
Gourieacuteroux Monfort and Renault (1993) proposed the inference methods based on an
ldquoincorrectrdquo criterion which does not give consistent estimation to parameters of interest
directly20 The argument of the criterion is called the auxiliary parameter which may
have a larger dimension than the parameters of interest in the basic model After the
auxiliary parameters are selected a simulation-based process is carried out to get a
consistent and asymptotically normal estimator of parameters of interest As a simulation-
based method the only requirement for the basic model is that it could be simulated
regardless of formulations of the model So it could be used for estimating models which
are too complex to carry out direct approaches The paper shows how this kind of method
can be applied in fields such as micro-econometrics macro-econometrics and
econometrics of finance
Keane and Smith (2003) proposed a generalized form of the indirect inference method to
be implemented in the discrete choice model context21 Theoretically indirect inference
could deal with estimation of any economic models yet it has some limitations per se that
decrease the estimation efficiency or even make it difficult to implement Problems arise
when we use indirect inference in estimating discrete choice models since the objective
function the metric of distance between the auxiliary models estimated on observed data
and simulated data to be specific is inherently discrete which leaves the gradient-based
optimization methods infeasible Keane and Smith (2003) proposed that the estimation
procedures used for observed data and simulated data can be different22 Instead of the
discrete choice a continuous function of latent utilities including a smoothing parameter
is used as the dependent variable in the auxiliary model When the smoothing parameter
goes to zero the function of latent utilities converges to the discrete choices this way to
guarantee consistency According to the Monte Carlo results the generalized indirect
inference method proposed in this paper yields good estimates in small samples being as
efficient as maximum likelihood estimates in comparison
20 Gourieacuteroux C Monfort A amp Renault E (1993) Indirect Inference 21 Keane M amp Smith A (2003) Generalized Indirect Inference for Discrete Choice Models Manuscript Yale University 22 Keane M amp Smith A (2003) Generalized Indirect Inference for Discrete Choice Models
17
Creel (2009) presented a data mining approach to indirect inference23 which is similar to
the regular indirect inference method yet with certain advantages over it The method is a
simulation-based estimator relying also on an auxiliary model In line with the indirect
inference method an underlying economic model with parameterβ is referenced by an
auxiliary model with parameterθ Certain values of the parameter hβ in underlying
economic model are drawn randomly from a known density simulated data is generated
using Monte Carlo methods to estimate ɶh
θ of auxiliary model which ends up with a set
of tuples ɶ( )hhβ θ Nonparametric methods are used to get the function ɶ( | )E aβ θ = and
the final estimate of β is supposed to be the result of regression function evaluated at the
estimate of θ based on true observations ɶ ɵ( | )Eβ β θ θ= = Creel (2009) also presented a
way of calculating confidence intervals24 Monte Carlo results in dynamic and nonlinear
panel models and vector autoregressions show good performance of the new estimator
23 Creel M (2009) A Data Mining Approach to Indirect Inference Universitat Autonoma de Barcelona Department of Economics and Economic History 24 Creel M (2009) A Data Mining Approach to Indirect Inference
18
3 Methodology
31 Multinomial Logit Model (MNL)
311 Model Description
Route choice modeling is somewhat complicated when we want to capture the attributes
of both the alternative routes and choice maker accurately and reflect the choice making
process in the model Intuitively route choice can be regarded as choosing one specific
route from several alternative routes which coincides with the prerequisites of discrete
choice models Actually a lot of literatures have explored the route choice modeling and
possible improvements based on discrete choice models (see Cascetta et al 1996 Vovsha
and Bekhor 1998 Ben-Akiva and Bierlaire 1999 for more information on development
in route choice models with regard to discrete choice models)25
To understand the frontier development of route choice model we have got to know the
discrete choice models among which multinomial logit model (MNL) is the most widely
used In addition we choose to implement a new method ndash indirect inference in which
MNL is used as it is
Logit model is the most widely used discrete choice model till now due to its excellent
qualities in model specification To be specific the choice probability takes a closed form
which is easy to estimate and interpret (Train 2003)26
The multinomial logit model is a kind of choice model with more than two alternatives in
the choice set We assume that the choice maker makes his or her decision based on the
utility maximization rule (Ben-Akiva amp Lerman 1985)27 With regard to the utility njU
the decision maker n obtains from the thj alternative in the choice set it is made up of
two parts the deterministic part and the stochastic part The deterministic part denoted
25 Cascetta E Nuzzolo A Russo F amp Vitetta A (1996) A Modified Logit Route Choice Model Overcoming Path Overlapping ProblemsSpecification and Some Calibration Results for Interurban Networks Vovsha P amp Bekhor S (1998) Link-nested Logit Model of Route Choice-Overcoming Route Overlapping Problem Transportation Research Record 1645 133-142 Ben-Akiva M amp Bierlaire M (1999) Discrete Choice Methods and Their Applications to Short Term Travel Decisions 26 Train K (2003) Discrete Choice Methods with Simulation Cambridge University Press 27 Ben-Akiva M amp Lerman S (1985) Discrete Choice Analysis Theory and Application to Travel Demand MIT Press
19
by njV contains attributes known by the modelers while the stochastic part denoted by
njε is the attributes affecting peoplersquos the decision which cannot be observed by the
modelers yet are known by the decision makers themselves So the utility function turns
out to be
nj nj njU V jε= + forall (1)
The type of choice model is basically decided by the distribution of the stochastic part
When we assume that njε is independently identically Gumbel distributed the model
becomes a logit model
As stated above the decision follows utility maximization rule which means that the
decision maker n chooses the alternative with the highest utility say the thi alternative
Use as the probability the thi alternative is chosen over the others we have
( max ) ( )
( )
( )
ni ni nj ni njj C
ni ni nj nj
nj ni ni nj
P P U U P U U j i
P V V j i
P V V j i
ε εε ε
isin= = = ge forall ne
= + gt + forall ne
= minus lt minus forall ne (2)
With Equation (2) above and the assumption that njε follows iid Gumbel distribution we
could derive the probability of decision maker n chooses alternativei which is
ni
nj
V
ni V
j
eP
e=sum
(3)
Typically we specify the deterministic part of the utility function in a linear form which
is nj njV xβ= Then the probability becomes
ni
nj
x
ni x
j
eP
e
β
β=sum
(4)
This is the most common form of probability function for multinomial logit models
There are some good properties for this kind of logit probability as discussed by Train
(2009)28 With this form the probability of choosing certain alternative will be between
zero and one inherently which is basically required for probability definition Yet the
28 Train K (2003) Discrete Choice Methods with Simulation
20
value of niP will never drop to zero mathematically which means that all the alternatives
in the choice set are perceived to have chance to be chosen On the other hand if an
alternative is perceived never to be chosen it should not be included in the choice set at
all
The probabilities for all the alternatives in the choice set sums to be one which is easily
illustrated from the analytical properties 1 1 1
( ) 1njni
J J JVV
nii i j
P e e= = =
= =sum sum sum in which J denotes
the number of alternatives in the choice set
The logit probability and the deterministic part of the utility function follow an S-shaped
curve line shown in Figure 1 below
Figure 1 S-shaped relationship between probability and deterministic part of utility
This property gives implications for possible impacts of the deterministic utility of certain
alternative on its chances to be chosen We could see that when an alternative has about
50 probability to be chosen which infers to the steepest part on the curve a small
change in the deterministic part of the utility function could lead to a large change in the
probability the alternative has to be chosen
Apart from the nice properties of logit probability logit models have some disadvantages
as well (Bartels Boztug amp Muumlller 1999)29 One shortcoming is the assumption of
29 Bartels K Boztug Y amp Muumlller M (1999) Testing the Multinomial Logit Model Working paper University Potsdam Germany
21
Gumbel distribution of error terms in the utility function The inherent requirement for
iid property sets restrictions for logit model to be widely used especially in route choice
modeling context Several models have been proposed to overcome this shortcoming in
particular modifications based on MNL to adjust it to route choice practices have been
proposed Another drawback is the assumption of the linear composition for the
deterministic part of utility function Actually this assumption is for ease of following
estimation process since McFadden (1974) demonstrated that under this condition the
probabilities will be universally concave with regard to the coefficientsβ 30 which
improves the performance of numerical estimation Yet there could be nonlinear
compositions in the deterministic part to relax the restriction Under this condition the
universal concavity cannot be guaranteed which may lead to local convergence in the
estimation process
312 Model Estimation
The most commonly used numerical estimation method for multinomial logit models is
the Maximum Likelihood Estimation (MLE) In principle given a set of data and the
underlying probability model the method tries to find coefficients of the probability
model with which produced data has a distribution most likely resembles the distribution
of the observed data
Consider the case that N decision makers with their choice data are obtained Parameters
to be estimated are the coefficients in the utility function denoted byβ We could then
use the MLE to try to get the values of β vector with which the probability that choice
maker choose their observed alternatives is maximized
The probability of choice maker n to choose his or her observed alternative can be
written as
( ) niyni
i
Pprod (5)
in which niy is a dummy with value 1 if choice maker choose alternative i and value 0
otherwise
30 McFadden D (1974) Conditional Logit Analysis of Qualitative Choice Behaviour (P Zarembka Ed) Frontiers in Econometrics 105-142
22
Choice makers choose their alternative independently from each other so the probability
of all sampled choice makers choose their observed alternative is
1
( ) ( ) ni
Ny
nin i
L Pβ=
= prodprod (6)
This is the likelihood function with regard to the parameters to be estimated β in this
case We can take the logarithm of it to get the log-likelihood function
1
( ) lnN
ni nin i
LL y Pβ=
=sumsum (7)
Since we aim at getting the value of β to make the log-likelihood function maximized
we can take the derivative of it with respect to β and set it to zero
( )
0dLL
d
ββ
= (8)
By solving this equation we could get the estimate of β
32 Dijkstrarsquos Algorithm
321 Introduction
A method is needed for generating feasible alternatives and compose the choice set as
well as for deriving simulated observations for each OD pair in the process of indirect
inference As for choice set generation we would like to include certain number of high
ranking shortest paths in the choice set since these paths tend to have more possibility to
be chosen Similar to this the simulated observation is generated as the shortest path
between each OD pair We implement a method for shortest path finding which is the
Dijkstrarsquos Algorithm
Dijkstrarsquos Algorithm is named after the Dutch computer scientist Edsger Dijkstra who
conceived this method in 1956 and got it published in 195931 This is a graph search
algorithm aiming at solving shortest path problem for a graph the edge cost of which is
defined nonnegative The outcome of it is a shortest path tree demonstrating the path with
lowest value with respect to the defined cost
31 Dijkstra E (1959) A note on two problems in connexion with graphs Numerische Mathematik 1 269-271
23
This algorithm deals with single-source problem To be specific given one source node in
the graph the algorithm will give paths with the lowest value with regard to cost from
this source node to every other node in the network Given certain criterion we could use
the algorithm to find shortest path between two specific nodes by setting one node as the
source and the other as the target
After released it is widely used in path searching problems especially in transportation
related practices Routing problem is considered in investigation on traffic assignment
and optimization in logistics Real sized road network could be perceived as a graph with
vertices and edges in which cities can be abstracted as the vertices in the graph and the
roads connecting cities can then be regarded as the edges With the aid of Dijkstrarsquos
Algorithm the shortest path with respect to cost could be found from certain city to the
other cities The outcome is valuable for logistics corporations to work out their region-
wide distribution plans32
322 Algorithm
We connect a ldquodistancerdquo value with all the vertices in the graph indicating its distance
from the source vertex To be accurate the ldquodistancerdquo could be actual length of edges or
the generalized cost on the edges or anything desired The source vertex is defined as the
initial node with a value of zero In the process Dijkstrarsquos Algorithm will assign values
to vertices detected in one loop and update the values in the following loops till a
minimum value is found for each vertex The steps for searching and updating are
presented below
1 Initialize the network and assign the distance values of vertices other than the initial
node as infinity
2 When one vertex is to be detected it is denoted as current node All the vertices that
have been detected and attained the minimum distance values will be marked as detected
and will not be detected in the following loops while the vertices remaining unvisited
will be marked undetected To initialize all the vertices are marked undetected and the
initial node is set as current node
32 Wang H (2011) Logistics Distribution Shortest Path Based on Dijkstra Algorithm Computer and Digital Engineering 3
24
3 For current node all its directly connected adjacent nodes are considered except for
the newly detected vertex Labeled distance values of the neighbor vertices will be
updated if the calculated values from current node are smaller than their current values
For example current node A has a distance value of 4 and one of its neighbors B has a
value of 8 The edge linking A and B has a distance of 2 The newly calculated distance
value for B will be 4+2=6 which is smaller than 8 So the labeled distance value for B
will be updated to 6 indicating that the minimum distance from the source vertex to B till
now is 6 and the path should pass A
4 When all the neighbors of the current node are considered and updated mark the
current node as detected And mark the undetected node with the lowest distance value as
the current node and do the detection in step 3 again
5 When all the vertices in the network are marked detected the algorithm is finished and
we get the minimum distance from the source to all the other vertices The shortest path
from the source to a specific vertex could be found out following the detecting process
As mentioned above the stop criterion could also be modified as we desired If we aim at
finding the shortest path between two vertices at the beginning one vertex should be set
as the initial node and the algorithm could be stopped once the other vertex is marked as
detected
323 Explanatory Example
Here is a simple network to illustrate the mechanism of Dijstrarsquos Algorithm There are
five vertices and six edges with distance values labeled beside We define A as the source
and set it the initial node
Figure 2 A simple network for Dijstrrarsquoa Algorithm explanation
25
Initialization
Initial node A
Detected null
Distance value A=0 B=C=D=E=+infin
Loop 1
Current node A
Adjacent vertices B C
Detected null
Distance value A=0 B=4 C=1 D=E=+infin
Loop 2
Current node C
Adjacent vertices B D
Detected A
Distance value A=0 C=1 B=min 4 C+2 =3 D=C+3=4 E=+infin
Loop 3
Current node B
Adjacent vertices E
Detected A C
Distance value A=0 C=1 B=3 D=4 E=B+3=6
Loop 4
Current node E
Adjacent vertices null
Detected A B C D
Distance value A=0 C=1 B=3 D=4 E=6
If we want to get the shortest path from A to E following the detecting process we could
know that it should be A-C-B-E
26
324 Discussion
Dijkstrarsquos Algorithm has a clear logical structure which makes it easy to understand as
well as to implement in programming Nonetheless this method cannot search directly
from one node towards the other to find the shortest path between the two It works more
like detecting all the adjacent nodes in terms of shortest paths and expands from the
source iteratively until the target node is included and that is when we could figure out
the shortest path between the two specific vertices This reveals the fact that the method
wastes a lot of time in the blind search leaving it inefficient In addition this method is
not able to deal with networks with negative edge values yet this is not a problem in our
research since link cost on our network is defined nonnegative
33 Indirect Inference
331 Introduction
For problems in route choice context choice set size may be way too large to enumerate
all the alternatives Yet estimation based on sampled choice set may introduce biases
which can be corrected in some special cases (see Frejinger Bierlaire amp Ben-Akiva
2009)33 While in cases where estimation models are not based on MNL say multinomial
probit model we could not find corrections for biases caused by sampled choice set
Estimator based on the principle of indirect inference is then introduced to overcome
inconsistency problem34
Indirect inference35 is a simulation-based method for estimating parameters in economic
models by making references to the parameters of interest (Smith 2008) It is motivated
when general statistical estimation method such as Maximum Likelihood is intractable or
as discussed above consistent estimation is required given that only sampled choice set is
available Since in economic analysis we tend to build models which guarantee scientific
logic and inclusion of necessary attributes quite often the models will end up
33 Frejinger E Bierlaire M amp Ben-Akiva M (2009) Sampling of Alternatives for Route Choice Modeling 34 Karlstroumlm A Sundberg M amp Wang Q (2011) Consistently estimating flexible route choice models using an MNL lense 35 Smith A (2008) Indirect Inference In S Durlauf amp L Blume (Eds) The New Palgrave Dictionary of Economics (Second ed) Palgrave Macmillan
27
complicated from statistical estimation point of view This in sequence spurs the wide use
of indirect inference in economic analysis
It is common character that simulation-based methods allows modelers to simulate data
from the economic model of interest given certain perceived values of the parameters to
be estimated Since to generate data is essential and simple the true challenge is how to
estimate coefficients Indirect inference uses an auxiliary model which gives a rich
description of the covariance patterns in the data by including certain variables from the
basic economic model On the other hand the auxiliary model does not need to reflect
accurately the data generating process since it is supposed to be estimated based on the
data derived not to generate data itself The basic function of the auxiliary model is that
it provides a criterion to compare observed data and simulated data from the basic
economics model
We do iterations with the aim of finding the parameters of the basic economic model so
the observed data and the simulated data from the basic model looks almost the same by
the criterion of auxiliary model To be specific the auxiliary model is estimated based on
both observed data and simulated data we choose parameters for the basic model to
make sure that the two estimator of auxiliary model are as close as possible Based on
this idea the auxiliary model should be easy to estimate
332 Definition of the method
We define an economic model with the form of
( ) 12t t ty G x t Tε β= = (9)
in which 1 Tt tx = is a sequence of observed exogenous variables 1 T
t ty = is a sequence of
observed endogenous variables and 1 Tt tε = is a sequence of unobserved random error
terms β is a k -dimensional coefficient vector of the exogenous variables (Smith
2008)36
This model generally describes a relation that ty is dependent ontx with some random
errors Given the distribution of the random errors we could get the probability density
36 Smith A (2008) Indirect Inference
28
function of ty conditional on tx We will not focus on this density and instead this model
is only used for simulating data in indirect inference
In terms of the auxiliary model it could be defined by a probability density function with
the form of
( | )t tf y x θ (10)
in which θ is a p -dimensional coefficient vector and p is supposed to be not smaller
than k since we should capture characteristics of all the parameters in the underlying
economic model In addition the auxiliary model needs not be defined to reproduce the
distribution of ty in the basic model yet it needs to have a convenient analytical format
Based on the observed data we could estimate the parameters in the auxiliary model
using Maximum Likelihood Method
ɵ
1
arg max log ( | )T
t tt
f y xθ
θ θ=
= sum (11)
The estimated coefficient vectorɵθ could be used as an indicator of certain features of the
observed data
On the other hand the auxiliary model can be estimated based on simulated data from the
basic model as well We need to draw a sequence of random error terms 1 m Tt tε = from the
defined distribution in which m denotes the number of simulation with an interval of [1
M ] generally Given a coefficient vectorβ we could generate the values of endogenous
variables ɶ 1 ( )m T
tty β = which are explicitly dependent onβ With the help of Maximum
Likelihood Method we could get
ɶ ɶ
1 1
( ) arg max log ( ( ) | )M T m
ttm t
f y xθ
θ β β θ= =
= sumsum (12)
According to the principle of indirect inference we try to find the values of β to make
ɶ( )θ β as close toɵθ as possible Practically we need a metric to measure the distance
between ɵθ andɶ( )θ β and by minimizing the distance we could find out the estimates of
β in the basic economic model
29
333 Choices of the metrics
As mentioned above we need a metric to measure the distance betweenɵθ andɶ( )θ β
There are three approaches corresponding to the three classical hypothesis tests namely
Wald likelihood ratio (LR) and Lagrange multiplier (LM)37
In the Wald approach we try to minimize a quadratic form in the difference between the
two estimators ofɵθ andɶ( )θ β which is
ɵ ɶ ɵ ɶarg min( ( )) ( ( ))Wald
Wβ
β θ θ β θ θ β= minus minus (13)
in which W is a positive definite ldquoweightingrdquo matrix
In the LR approach a metric is formed based on the likelihood function related to the
auxiliary model which is
ɵ ɶ
1 1
arg min( log ( | ) log ( | ( )))T TLR
t t t tt t
f y x f y xβ
β θ θ β= =
= minussum sum (14)
According to the definition ofɵθ the first part of the objective function before the minus
sign on the right-hand side is always larger than the second part after the minus sign And
the first part is not dependent onβ
To minimize the objective function is equivalent to maximizing the log-likelihood
function withɶ( )θ β that is
ɶ
1
arg max( log ( | ( )))TLR
t tt
f y xβ
β θ β=
= sum (15)
In the LM approach the metric is formed using the derivative of the log-likelihood
function related to the auxiliary model which is
arg min ( ) ( )LM
S VSβ
β β β= (16)
in which
ɶ ɵ
1 1
( ) log ( ( ) | )M T m
ttm t
S f y xβ β θθ= =
part=partsumsum
(17)
and V is a positive definite matrix
37 Smith A (2008) Indirect Inference
30
By using any of the approaches we aim at getting the minimized distance betweenɵθ and
ɶ( )θ β so the value will approach to zero as expected So the hypothesis test of the
minimized value could be used as an indicator of whether the auxiliary model is suitably
specified In other words the minimized value being significantly different from zero
indicates a bad specification of the auxiliary model
In comparison the LM approach has an advantage over the others in computation when
it is relatively time-consuming to estimate the auxiliary model
334 Consistency Interpretation
Suppose the observed sample size T grows large while total number of simulations stays
fixed as M the estimator based on simulated data ɶ( )θ β will converge to a pseudo-true
value denoted as( )h β which is also dependent onβ This is called binding function
which characterized the relationship between the coefficients in the basic model and the
auxiliary model At the same time the estimator based on observed data ɵθ will converge
to a pseudo-true value0θ In case that T grows to a large number the aim of indirect
inference changes to finding β that guarantees0 ( )hθ β= This could explain that indirect
inference gives consistent estimate of the parameters in the basic economic model
In this project the binding function is what we focus on to get the correct estimates
instead of finding certain metrics Detailed methods will be discussed in the following
part
34 Model Specification in the Thesis
341 Basic Route Choice Model
Based on all the methods mentioned in previous sections the specification of models and
methods we use in the thesis will be explained in this section Since we are to estimate
the model based on true observations no model is known beforehand to adjust to the data
we use Several formulations of the model have been tested in the thesis The one
explained here could be seen as an example and all the other trials contain modifications
based on this model The other specifications of model will be explained along with the
results in the result section
31
We start by describing the underlying route choice model of interest38 We need to define
a road network as a representation of a real-size one from which we collected the trip
data The network denoted asN consists of a set of nodes (vertices) v and links (edges)
l Each link has a source node ( )s l and a target node or a destination node( )d l which
together indicate the direction of the link A path from an origin node ov to a destination
node dv could be seen as a sequence of links1 nl lhellip of which 1( ) os l v= 1( ) ( )i id l s l +=
and ( ) dnd l v= So a path can be defined by the index of links which is 1 nl lπ = hellip
A vector of characteristics denoted aslx is associated to each link as well as a strictly
positive cost function( )l lic x ε β in which liε is an individual specific random link cost
with i denoting the individual and β is a vector of coefficients of the link characteristics
left to be estimated In the Indirect Inference context we need an auxiliary model with
easily-estimated analytical form yet there is no such requirement for the basic model
Although not necessary we assume that the cost function has a linear deterministic form
the deterministic part and the random part are additively separable So we have the cost
function as
( ) Tl li l lic x xε β β ε= + (18)
In addition one important assumption is that the link cost is additive which means that
the cost of a path can be attained by the sum of all the link costs along the path This way
we have the cost of a path π as
( ) ( )l lil
C c xπ
π ε βisin
=sum (19)
We focus on the path-based model which means that the individuals choose among all
possible paths As defined above this turns out to be a random utility choice model As
indicated by the standard assumptions of this kind of models choice makers are assumed
to know both the link characteristics and their idiosyncratic random utility liε associated
to each link Since the choice makers maximize their utility this means that they will
choose the path with the lowest generalized cost in this model This way we have the
choice of individual i as
38 Karlstroumlm A Sundberg M amp Wang Q (2011) Consistently estimating flexible route choice models using an MNL lense
32
( )
arg min ( )o di i
iv v
Cπ
π πisinΩ
= (20)
in which oiv denotes the origin point of the trip for individual i and d
iv denotes the
destination ( )o di iv vΩ denotes all possible paths connecting the origin and destination in
the network for individual i which forms the choice set for the individual
When implementing the model we assume that the random utility component liε follows
a truncated normal distribution To be specific liε follows a standard normal distribution
yet with only the positive values retrieved This way we could guarantee that the link
costs are always positive so that additively the path would not have infinite loops With
this feature of the random component we could say that our model is probit-like Based
on this assumption the prerequisite of Dijkstrarsquos Algorithm is satisfied which always
needs positive edge values on the network We can use the Dijkstrarsquos Algorithm to find
the shortest paths iπ as an intermediate step in the implementation Apart from this we
assume that the unobserved cost captured by the random term is proportional to the
length of link To embody this in the cost function we add a fixed scale parameter to the
random term with a form of ( )Length l Lengthx Mean x in which ( )LengthMean x is the average
length of links in the network
We will assume that the data consists of J paths as dependent variables which means
that the dependent variables for the choice model are 1 Ji iy π == In addition the observed
characteristics of links in the network are provided 1 Ll lx x == To be specific we choose
to use two attributes of the links namely the length of the links Lengthx and the dummy
variable indicating the presence of speed bumps on the links SBx The cost function then
is specified as
( ) ( )l li Length Length l SB SB l li Length l Lengthc x x x x Mean xε β β ε= + + sdot (21)
Now the objective is to estimate the parametersβ in the model for which we will make
use of an auxiliary model
33
342 Auxiliary Model
Based on the idea of Indirect Inference we treat the route choice model defined above as
the basic model of interest which might have complex formation and be difficult to
estimate directly Then we need an auxiliary model to form a criterion which takes into
certain aspects of data to focus the analysis The auxiliary model needs not to reflect the
data generating process exactly as in the basic model yet it needs to include attributes of
interest in order for reference and to be easy to estimate We choose to use a logit model
for route choice as the auxiliary model since the logit model has always been a useful
tool for discrete choice analysis thanks to its analytical form and there is software for
estimating logit models which ensures that we can estimate very efficiently
As to the auxiliary model it is chosen to be a logit model for route choice We consider
that each individual i is choosing from a set of alternative routesr Each route r is given
a utility of riU
- Tri r ri r riU V Xε θ ε= + = + (22)
in which θ is the vector of auxiliary parameters which gives inference to the parameters
in the basic model One thing to be mentioned is that as expected the coefficients in the
utility function should have negative signs To make it easier for comparison with the
coefficients in the basic route choice model we assume the sign of θ to be positive per
se and add a negative sign ahead of it to guarantee that the coefficient part is negative as a
whole rX denotes route characteristics and riε is the random utility for each individual
which is assumed to follow an iid (independently identically distributed) Gumbel
distribution following the standard assumption of logit models
Note that as required for the auxiliary model it should be flexible enough to capture the
variability in the data and thus contains no fewer attributes than the basic model39 In
order to infer the parameters in the basic model and in consideration of efficiency we
pick the same attributes of interest in the basic models which are the link length Lengthx
and the speed bump dummy variableSBx So the utility function turns out to be
- -ri Length Length r SB SB r riU x xθ θ ε= + (23)
39 Karlstroumlm A Sundberg M amp Wang Q (2011) Consistently estimating flexible route choice models using an MNL lense
34
The probability of individual i choosing path r given an individual specific choice set
( )iI o d is
( )
ri
si
i
V
ri V
s I o d
eP
eisin
=sum
(24)
Theoretically we allow the individuals to choose from all possible paths between the
origin and destination in the network which intuitively could be infinite and impossible
to enumerate When implementing the model we generate the individual choice set based
on the basic route choice model Through simulation of the basic model we generate
infinite unique shortest paths for all the unique OD pairs by redrawing the random link
cost liε Without loss of generality the number of paths generated would be big enough
with fully consideration of efficiency We name the finite choice set composed by the
shortest paths generated as the pseudo-universal choice set ( )I o d which is a sample of
the infinite universal choice set The individual specific choice sets are generated by
randomly drawing certain number of paths out of the pseudo-universal choice set And
the size of individual specific choice set could be equal to or smaller than that of the
pseudo-universal one
The resulting individual specific choice set ( )iI o d describes a finite subset of all possible
paths connecting the origin oand destinationd for individuali When implementing the
methods the way of generating the choice set ( )iI o d for each individual i is viewed as
part of the auxiliary model
After the auxiliary model is built it could be estimated using a Maximum Likelihood
estimator based on the observed data of individual choices y and attributes variablesx
for individual 1 i N= hellip The estimate of parameters in the auxiliary model is
ɵ arg max ( )L y xθ
θ θ= (25)
in which ( )L y x θ is the log-likelihood function for the auxiliary model
Given the data of the link attributes xand some random draws of structural parameters
mβ 1 m M= hellip we can simulate choice data through the basic route choice model With
M draws of β from some given density we could simulate M sets of data resulting in
35
simulated choicesɶ( )my β Same as before parameters θ in the auxiliary model can be
estimated based on the simulated data as
ɶ ɶ( ) arg max ( ( ) )m m mL y xθ
θ β β θ= (26)
As the process indicated the simulated choice data depends on the structural parameterβ
in the basic route choice model and in sequence the estimates of parameters θ in the
auxiliary model depends on β when estimated based on the simulated data Based on
this theoretically we have a relationship of ( )θ β referred to as the binding function in
indirect inference literatures which we will discuss in detail for implementation of model
in this thesis A metric is then chosen to measure the distance between the observed and
simulated data viewed by the auxiliary model as a way to indirectly infer the values of
parameters β in the basic model To be specific for each draw of the structural parameter
mβ we can get the estimates of ɶ ( )m mθ β based on the simulated data and the distance
between ɶ ( )m mθ β and ɵθ measured by the chosen metric By doing more iteration with the
aim of minimizing the distance we will get the value of mβ which spurs the ɶ ( )m mθ β
closest toɵθ and this mβ is the inferred estimates of the parameter in the basic model
343 Consistency Discussion
The process of indirectly estimating parameters in the basic model is described above yet
we need to know whether the method we provide gives consistent estimation Here are
some discussions explaining the consistency in estimating by which consistency of the
estimator we proposed is illustrated
As proved the multinomial logit model (MNL) can be estimated consistently based on a
subset of alternatives (McFadden 1978)40 We may need to use the classical conditional
maximum likelihood estimator to deal with the problem at the same time the probability
that an individual n chooses an alternative i conditional on the subset of alternatives
denoted asnc becomes the conditional probability
40 McFadden D (1978) Modeling the Choice of Residential Location In A Karlqvist L Lundqvist F Snickars amp J Weibull (Ed) Spatial Interaction Theory and Residential Location (pp 75-96) Amsterdam North-Holland
36
ln ( | )
ln ( | )( | )in n
jn n
n
V q c i
n V q c j
j c
eP i c
e
micro
micro
+
+
isin
=sum
(27)
in which micro is a scale parameter and inV is the deterministic part of the utility There is a
term ln ( | )nq c j for correcting the sampling bias in which ( | )nq c j denotes the probability
of sampling nc given that alternative j is chosen
If all the alternatives in the choice set have the same probability to be chosen into the
subset the estimation on the subset of alternatives is equivalent to that on the full choice
set To be specific in this case ( | )nq c i is equal to ( | )n nq c j j cforall isin so by calculation the
term for sampling bias correction will cancel out in the probability function
In route choice context the alternative paths between an origin and a destination may be
in large amount and it is inefficient to give some very long-distance paths the same
probability as those short and attractive ones This means that we may need the
importance sampling method when generating subsets of alternatives which selects
attractive alternatives with higher probability than unattractive ones And the correction
term does not cancel out in this case Note that if alternative specific constants are
estimated we can get unbiased estimates of all the parameters except the constants even
if the correction term is not included in the utility function (Manski amp Lerman 1977)41
Back to the route choice context we tend to use large number of alternatives even with
subset of the full choice set which means that it is generally impossible to estimate the
constants and thus the correction term is essential To solve this problem Frejinger et al
(2009) developed a sampling approach in the context of route choice42
The discussion above focuses on the usage of MNL for route choice modeling When it
comes to our method the individual specific choice set is generated by randomly drawing
alternatives from the pseudo-universal choice set with the same probability yet there is
bias when generating the pseudo-universal ones since the pseudo-universal choice set is
composed of certain number of shortest paths between two nodes and this generating
process gives some paths higher probability to be included into the choice set So we
41 Manski C amp Lerman S (1977) The Estimation of Choice Probabilities from Choice Based Samples Econometrica 45 (8) 1977-1988 42 Frejinger E Bierlaire M amp Ben-Akiva M (2009) Sampling of Alternatives for Route Choice Modeling
37
actually use importance sampling to get the choice set which may consequently
introduce bias in estimating the parameterθ in the auxiliary model as discussed above
With the idea of indirect inference we consider only the relationship between θ andβ
denoted as( )θ β and use this relation to infer the value ofβ From this point of view
whether θ is estimated with bias or not does not matter since the relation between it and
β could always be captured which is the specific thing we focus on using the method of
indirect inference So we can say that even with biased subset of alternatives we could
still get consistent estimation by using indirect inference
344 Binding Function
As discussed in indirect inference method section when the sample size N increases
which means that we have more observations of choice the estimated parameter in the
auxiliary modelɶ ( )m mθ β will converge to a stable value ( )mθ β which is often referred
to as the binding function
Given that route choice model deals with discrete choices and by using indirect inference
we have a discrete choice model as the auxiliary model as well the estimates of binding
function ( )mθ β will inherit the discontinuous feature due to discrete individual choices
ɶ( )my β Keane and Smith (2003) proposed a solution of using logit-smoothing on the
simulated dependent choice data43 Following this idea we assume a continuous binding
functionɶ( )θ β for simplicity which could be approximated by a linear function locally
within small intervals With the M randomly drawn values of mβ and the corresponding
estimated parameters ɶ ( )m mθ β in the auxiliary model we could perform an Ordinary
Least Square (OLS) regression to estimate the local approximation of binding function
ɶ( ) c Dθ β β= + (28)
in which cdenotes the constant vector and D denotes the OLS parameter matrix44 To be
specific in our case each parameter in the auxiliary model will have a restriction
function with regard to both parameters in the basic model which is
43 Keane M amp Smith A (2003) Generalized Indirect Inference for Discrete Choice Models 44 Karlstroumlm A Sundberg M amp Wang Q (2011) Consistently estimating flexible route choice models using an MNL lense
38
ɶ1 11 12( )Length Length SBc d dθ β β β= + +
(29)
ɶ2 21 22( )SB Length SBc d dθ β β β= + +
(30)
Based on the observed data of choices y and explanatory variables xand the estimated
binding function which indicates the restrictions between ɶθ andβ we could use the
maximum likelihood method to give estimation of the parameters of interest The
likelihood ratio approach to indirect inference is following ideas of Smith (1993)45 and
Keane and Smith (2003)46
ɶ=arg max ( ( ))L y xβ
β θ β (31)
in which β is the estimate of the parameter of interest β in the basic economic model
With the restriction of binding function this is actually an indirectly inferred estimate In
line with the estimating process in auxiliary model ( )L sdot is the likelihood function of the
auxiliary model
Note that the form of binding function is based on an assumption in the result part we
will verify that this assumption is realistic
45 Smith A (1993) Estimating Nonlinear Time-series Models Using Simulated Vector Autoregressions 46 Keane M amp Smith A (2003) Generalized Indirect Inference for Discrete Choice Models
39
4 Data
41 Road Network
The data we use for estimation is based on a GPS data set collected in the Swedish city of
Borlaumlnge Borlaumlnge is located in the middle part of Sweden and has a population of about
47 000 inhabitants
The virtual road network contains 3077 nodes and 7459 unidirectional links (Frejinger amp
Bierlaire 2007)47 of which 3061 nodes and 7288 links are included in the network for
estimation Figure 3 gives a visual illustration of the road network in Borlaumlnge
Figure 3 Illustration of the Borlaumlnge road network
With regard to our research two of the link attributes are included namely link length
and speed bump dummy Link length is in the unit of km and speed bump dummy is an
indication of speed bump existence on the links which has the value 1 when there is a
speed bump on the link and 0 otherwise
Link length
47 Frejinger E amp Bierlaire M (2007) Capturing Correlation with Subnetworks in Route Choice Models
40
Some descriptive statistics of the link length data for the whole network is presented in
Table 1 below
Table 1 Descriptive statistics of link length
Number of links 7288
Minimum 0001
Maximum 7599
Mean 0184487
Median 0102
Variance 0103722
Lexis ratio (varmean) 1016884
Skewness 9871144
To describe the overall character of the link length attribute the histogram is shown in
Figure 4 below
Figure 4 Histogram of link length data
We could see that the link length data is quite clustered most of which lies within the
range of 01km and 06km Nonetheless there are some extreme values far away from the
range indicating extremely long links To display the variation in the relatively clustered
area we draw a histogram zoomed in the interval of (0 1km] shown Figure 5 in below
0
01
02
03
04
05
06
Fre
qu
en
cy
Link length (km)
Histogram
41
Figure 5 Histogram of link length data (zoomed within 1km)
Over 80 of all the links have length shorter than 03 km indicating concentration of
link length data
Speed bump dummy
Speed bump dummy is based on true situation in the network Of all the links 82 links
are equipped with speed bumps which account for a percentage of 113 The following
Figure 6 displays the locations of links with speed bumps
Figure 6 Illustration of links with speed bumps
0005
01015
02025
03035
04045
05
Fre
qu
en
cy
Link length (km)
Histogram(zoom in)
42
42 Observation Data
The GPS data set is collected as a part of the Swedish Intelligent Speed Adaptation (ISA)
study which aims at traffic safety effects of in-car information systems In the study 186
vehicles were equipped with GPS devices and traced within a radius of 25 km from the
center of Borlaumlnge The monitoring lasted for 30 days from 22th June 2000 to 4th March
2002 obtaining 49 667 vehicle days of travel and nearly a quarter of a million trips (for
more information on the GPS data set check Axhausen Schoumlnfelder Wolf Oliveira amp
Samaga 2003 Schoumlnfelder amp Samaga 2003 Schoumlnfelder Axhausen Antille amp Bierlaire
2002)48
The data collection is not originally designed for route choice analysis so the raw data
cannot be used in our research directly Extensive data processing is performed by the
company GeoStats in Atlanta to retrieve new data set available for route choice analysis
which contains 24 vehicles and 16 035 observations The final data set we use is provided
by Emma Frejinger which contains in total 1832 observations corresponding to 1458
observed unique routes made by 24 vehicles and 1409 unique origin-destination pairs
Considering that certain route may have been observed more than once we make a
distinction between observations and unique routes and number of unique routes should
be less than that of observations consistently with the numbers listed above
As indicated by data collection in the ISA study only licensed drivers with access to his
or her only car are recruited to minimize sharing or swapping of cars Minimum socio-
economic data of the drivers is included in data collection so we have no way to
understand driver characteristics from the data set Logically we make an assumption
that there is only one individual per vehicle
In the observation data a route is represented by a series of links and also an origin-
destination pair With relatively intensively distributed link length number of links could
48 Axhausen K Schoumlnfelder S Wolf J Oliveira M amp Samaga U (2003) 80 Weeks of GPS Traces Approaches to Enriching the Trip Information Transportation Research Record 1870 46-54 Schoumlnfelder S amp Samaga U (2003) Where Do You Want to Go Today-More Observations on Daily Mobility Third Swiss Transport Research Conference Ascona Schoumlnfelder S Axhausen K Antille N amp Bierlaire M (2002) Exploring the Potentials of Automatically Collected GPS Data for Travel Behaviour Analysis- A Swedish Data Source In J Moumlltgen amp A Wytzisk (Ed) GI-Technologien fuumlr Verkehr und Logistik number 13 Institut fuumlr Geoinformatik Universitaumlt Muumlnster (pp 155-179) Munster IfGIprints
43
be used to indicate total length of routes Some of the descriptive statistics of link number
is shown in Table 2 below
Table 2 Descriptive statistics of link numbers in observation data set
Number of observations 1832
Minimum 5
Maximum 106
Mean 202877
Median 16
Variance 1871968
Lexis ratio (varmean) 9227126
Skewness 1732597
For further overall inspection of link number distribution in the observation data set the
histogram is shown in Figure 7 below
Figure 7 Histogram of link numbers in observations data set
Seen from the histogram distribution of number of links is relatively dispersed with a
large range interval Judging by the statistics in general the routes observed have about
000
200
400
600
800
1000
1200
1400
1600
5 8
11
14
17
20
23
26
29
32
35
38
41
44
47
50
53
56
59
62
65
68
71
74
77
80
83
86
89
92
95
98
10
1
10
4
10
7
Mo
re
Fre
qu
en
cy
Number of links
Histogram
44
20 links in average Yet the data has a big variance which is reasonable As stated above
there are 1409 unique OD pairs for 1832 observations indicating that for most OD pairs
there is only one observation Spread within the detecting area different OD pairs could
have various numbers of links in between
Following our experiment design only a portion of the data could be used To be specific
routes with number of links fewer than ten would be eliminated when used for estimation
43 Further Exploration of data
Apart from the characters discussed above there are some other attributes in the data set
interesting to be explored Both in link attribute data set and observation data set there is
travel time data which to some extent is parallel with length in indicating distance
between two nodes
In the link attribute data set one attribute is denotes the estimated travel time of links in
unit of hour Some of the descriptive statistics is shown in Table 3 below switching unit
to minute
Table 3 Descriptive statistics of estimated travel time on links
Number of links 7288
Minimum 000186
Maximum 578268
Mean 0281696
Median 018744
Variance 0119337
Lexis ratio (varmean) 0423638
Skewness 5785361
Seen from Table 3 estimated travel time seems to have a more clustered distribution than
link length judging by lexis ratio and skewness Yet this time is roughly estimated not so
qualified as link length to use in estimation since the latter is much easier to measure and
guarantee precision
In the observation data set we have the duration time of the observations in the unit of
minute Some of the descriptive statistics is shown in Table 4 below
45
Table 4 Descriptive statistics of duration of trips
Number of observations 1832
Minimum 007
Maximum 316
Mean 4991195
Median 3925
Variance 1775639
Lexis ratio (varmean) 3557542
Skewness 2174728
Duration of trips can be used as an indication of distance between origin and destination
yet it is roughly measured and strongly affected by traffic condition on the road network
With similar reasons as discussed on estimated travel time on link we use number of
links instead of duration of trips to indicate the distance between OD pairs
46
5 Experiment Design
When doing the simulation-based estimation it is physically divided into two parts for
convenience of operation As discussed in the method section we choose to use a pseudo-
universal choice set which is generated and stored in the first part and ready for use in
the following experiment Then in the second part we do the simulation-based
experiment to carry out indirect inference method for estimating the parameters of
interest in the basic model β to be specific The Figure 8 below illustrates an abstracted
flow of how the estimation is carried out given certain origin-destination pair
Figure 8 Illustration of the flow in the experiment
As shown in the flow chart we get all the unique OD pairs in the trip data For each of
the OD pairs the Dijkstrarsquos algorithm is used to find the shortest paths between them
without duplicates We set the intended number of paths to be 400 as well as time
terminator in case not enough paths could be generated within certain bearable time
47
interval The generated paths form the pseudo-universal choice set of each OD pair
which is stored for future use Note that we abandon some OD pairs with too few paths
in the pseudo-universal choice set Observations containing the kept OD pairs are used
for following estimation which turns out to be 940 of them
For the OD pair in a given observation 200 alternatives are randomly drawn from the
pseudo-universal choice set and the sequential links in the observation itself is read as an
alternative path The 201 paths compose the observed choice set On the other hand a
given value of mβ is drawn from a predefined domainD The shortest path is generated
based on the given mβ as the simulated observation Like in the observed choice set part
200 alternatives are randomly drawn from the pseudo-universal choice set to form the
simulated choice set together with the simulated observation The auxiliary model is
estimated based on the simulated choice set and we could get a set of ɶ( ( ))mm mβ θ β pairs
which will be used to estimate the binding function Based on the binding function and
the observed choice set the parameters in the basic model could be indirectly estimated
The process described above is abstracted with no illustration of iterations Since this is
an experiment based on simulations certain loops of iteration should be carried out to get
statistics of the results
Given observed trip data at first we have no idea of the value of β In the process of
retrieving value ofβ the estimation process is repeated for several stages denoted asS
starting from a rough guess of the domainsD while for each following stage the domain
shrinks Since we tend to use a local OLS regression to approximate the smooth binding
function the draws of smβ need to be around the true value to prevent misspecification of
OLS regression due to the possibly inherent nonlinearity of the binding function The
estimated 0
β is not satisfactory in precision in the first stage yet it could give a hint of
where the true value lies The domain1D is centered on 0
β with smaller interval before
the estimation in the second stage This way +1sD is dependent on sD with smaller
interval As it goes on we will get a more accurate domain and as a result a well specified
OLS regression to approximate the binding function
48
The process of experiment with iterations is described below Suppose that we have the
experiment carried out for K times and the number of observations used isN
for run 1 k K= hellip for true observation 1 i N= hellip
Randomly draw alternatives from the pseudo-universal choice set end Form the observed choice sety for stage 1 s S= hellip
for 1 m M= hellip
Draw ksmβ from the domain ksD
Simulate paths for OD pairs in the used observations with mβ
for simulated observation 1 i N= hellip Randomly draw alternatives from the pseudo-universal choice set end
Form a simulated route choice setɶ( )ksmy β
Estimate ɶ ( )ks ksm mθ β in Equation (26)
end
Estimate ɶ ( )ks
θ β in Equation (28)
Estimate ks
β in Equation (31) end
Center the domain 1k sD + on ks
β and shrink the interval end
As a trial we first do the experiment on a route choice model with one parameter link
length to be specific For simplicity the random term is not scaled as described in the
model specification section which means we attach a truncated normally distributed
random term to the cost function without scaling it with link length After getting the
estimation of Lengthβ we move on to estimating the route choice model with both
parameters as described in the model specification Results under these two formulations
of models are presented separately in the result part
49
6 Results
61 Validation of Binding Function
As discussed in the binding function section we assume the binding function to be
continuous and feasible to be approximated by a linear function locally The assumption
of binding function can be verified based on the ɶ( ( ))mm mβ θ β pairs we attained as
intermediate results To explain this more explicitly we carry out a simple example with
only one parameter in the route choice model Lengthβ to be specific
The cost function is specified as
( )l li Length Length l lic x xε β ε= + (32)
corresponding to which the auxiliary model is
-ri Length Length r riU xθ ε= + (33)
For each run 10 values ofLengthβ are evenly drawn from a given domain By simulating
observations and estimating the auxiliary model 10 corresponding Lengthθ are generated to
form ten ɶ( ( ))mm mβ θ β pairs As assumed the binding functionɶ( )θ β is continuous which
could be approximated by a linear function locally To display the trend of binding
function we choose a relatively large domain for Lengthβ in the beginning [010]D = and
carry out 10 runs which generate 100 points in the beta-theta diagram shown in Figure 9
below
Figure 9 Scatter plots of the 90 beta-theta pairs
y = 12804x + 16264
Rsup2 = 09959
0
2
4
6
8
10
12
14
16
0 2 4 6 8 10
the
ta_
len
gth
beta_length
50
We do OLS regression for the dots and estimate the binding function Intuitively the
smaller the domain is the more accurate is the approximation of the binding function We
shrink the input domain based on the final estimate of Lengthβ from last trial
As it turned out to be we choose an input domain of [1214]D = for Lengthβ and the
binding function is assumed to take the form of
ɶ1 11( )Length Lengthc dθ β β= +
(34)
The result for one run is displayed in Figure 10 below
Figure 10 OLS regression based on the 10 beta-theta points from one run
The estimated binding function based on the 10 points is
ɶ ( ) 17371+10838Length Lengthθ β β= (35)
as indicated by 2 09783R = the function describes the trend of points very well Since
the interval is quite small we could use the estimated function to approximate the
binding function
When it comes to more parameters in the route choice model what we do is simply to
add more elements in the binding function After getting a vector of β and the
corresponding vector ofɶ( )θ β binding functions of each element in vector ɶ( )θ β with
y = 17371x + 10838
Rsup2 = 09783
315
32
325
33
335
34
345
35
355
12 125 13 135 14
the
ta_
len
gth
beta_length
51
regard to all the elements in vector β are estimated One example is shown in the
Equation (29) and Equation (30)
62 Estimation of model with one attribute
The route choice model with one attribute we used is the one described in Section 61
above After several trials by shrinking input interval every time we finally affirm that
the true value Lengthβ of lies in a relatively small interval of [12 14] Based on this
domain 50K = runs are carried out to get statistics of the estimate of Lengthβ As
discussed in the experimental design several stages Smean different trials before final
affirmation of input interval yet for the statistics only one stage is carried out for each
run Within each run 10M = values of input Lengthβ are drawn for estimating binding
function
The estimation statistics of Lengthβ is shown in Table 5 below
Table 5 Statistics of estimation of beta_length
Parameter Lengthβ
Mean 1337353
Standard deviation 0107537
RMSE 0013227
In the table RMSE is the root-mean-square error which is used to measure the distances
between the observed values being estimated and the predicted values by the estimator
The individual differences are called residuals and RMSE is an aggregated measure of
the residuals To be specific
ɵ ɵ ɵ 2( ) ( ) (( ) )RMSE MSE Eθ θ θ θ= = minus (36)
in which ɵθ is the estimator and θ is the parameter to be estimated so the RMSE is the
square root of the mean square error As defined the smaller the value of RMSE is the
better the estimator is
52
Here the RMSE is calculated based on the ten points ɶ( ( ))mm mβ θ β for estimating binding
function so basically it describes the goodness of fit of the estimated binding function
with regard to the points we generated The Equation (36) is specified as
ɶ 2( ( )) (( ( ) ( )) )mm m mRMSE Meanθ β θ β θ β= minus (37)
The value of RMSE displayed in the Table 5 is the mean value of all the RMSE values
for 50 runs Seen from this we have well-estimated binding function for all the 50 runs
on average In terms of the estimates of binding function taking the one in Section 61 as
an example the binding function estimated in the interval of [12 14] in Equation (35)
has a positive constant and a positive coefficient for Lengthβ which indicates that with
larger value of Lengthβ we will get larger value ofɶ Lengthθ and as a result a negative
coefficient for length in the utility function of the logit model This is reasonable for
bigger Lengthβ reveals larger incremental effect on the cost of certain path while lower
ɶ- Lengthθ reveals larger disutility effect on certain path these two effects are in fact
equivalent
By the way the high fitness of binding function is probably due to the relatively small
input interval of Lengthβ after certain trials and shrinkage As the final estimate indicates
Lengthβ falls right into the interval of [12 14] with small standard deviation So we can
say that the estimate is quite good
63 Estimation of model with two attributes
We use the model described in the model specification section to carry out the estimation
Two attributes are used namely length and speed bump dummy Similar to the one
attribute case we carried out several trials and shrinkage to finally determine the
relatively small input intervals forLengthβ and SBβ [05 1] and [0 05] respectively
50K = runs are carried out to get statistics of the estimates of the two parameters Within
each run 10M = values are drawn for inputs Lengthβ and SBβ respectively for estimating
binding function
53
One important thing to mention here is that the inputs are drawn evenly from the domain
yet to guarantee that the values of Lengthβ and SBβ are independent from each other or to
get rid of collinearity49 the domains of two parameters are defined in two dimensions To
explain this more explicitly we choose data of one run as an example The input points of
( Lengthβ SBβ ) are shown in Figure 11 below
Figure 11 Scatter plot of the input values for beta_length and beta_sb
We can see from Figure 11 that the points spread evenly in the domain quadrant Based
on these draws we could estimate the binding function and evaluate the relationship
between parameters in the logit model and Lengthβ and SBβ without worrying about
possible correlation between Lengthβ and SBβ
As discussed before in the binding function we are supposed to find the relationship
between each of the parameters in the logit model and both parameters in the route choice
model Mathematically this binding function should be a surface in the 3D coordinate
system We take the results of one run as an example and thus we have ten sets of Lengthβ
and SBβ along with corresponding ɶ Lengthθ andɶ SBθ
49 A set of points is collinear if they lie on a single straight line or a projective line (for example projective line over any field) and this way the two factors represented by the points are correlated
0
005
01
015
02
025
03
035
04
045
05
05 06 07 08 09 1
be
ta_
sb
beta_length
54
For the first binding function ɶ Lengthθ and ( Lengthβ SBβ ) are plotted in Figure 12 below
And the binding function takes a form as described in Equation (29)
Figure 12 Scatter plot of theta_length with regard to beta_length and beta_sb
By multi-linear regression we can get a surface to approximate the binding function
locally The estimated binding function is displayed in Figure 13 below
Figure 13 Display of the estimated binding function for theta_length
And the first binding function has a formula of
55
ɶ 18234+16933 +00633Length Length SBθ β β= (38)
For the second binding function ɶSBθ and ( Lengthβ SBβ ) are plotted in Figure 14 below
And the binding function takes a form as described in Equation (30)
Figure 14 Scatter plot of theta_sb with regard to beta_length and beta_sb
By multi-linear regression we can get a surface to approximate the binding function
locally The estimated binding function is displayed in Figure 15 below
Figure 15 Display of the estimated binding function for theta_sb
56
And the second binding function has a formula of
ɶ -06698+00371 +17619SB Length SBθ β β= (39)
The t-test of estimated parameters in the binding function is carried out with null
hypothesis of zero Estimates that are significantly different from zero with 95
confidence interval are marked as bold
Table 6 Estimated coefficients of binding function for model with two attributes
Constant Lengthβ SBβ
ɶLengthθ 18234
(43632) 16933
(33481) 00633 (1392)
ɶSBθ -06698
(-7991) 00371 (0366)
17619 (19323)
Seen from the magnitude of coefficients in the binding functions both Lengthβ and SBβ
have positive effect on ɶ Lengthθ andɶ SBθ and in sequence negative effect on the coefficients
in the logit model In addition coefficients of SBβ with regard to ɶ Lengthθ and Lengthβ with
regard to ɶ SBθ are not significantly different from zero so we can say Lengthβ has a more
apparent effect on ɶ Lengthθ than SBβ does while SBβ has a more apparent effect on ɶ SBθ
than Lengthβ does
Based on the estimated binding functions and the true observation data we could get the
estimates of Lengthβ and SBβ as shown in Table 7 below
Table 7 Statistics of estimation of beta_length and beta_sb
Parameter Lengthβ
SBβ
Mean 0761383 0079874
Standard deviation 0068493 0034375
RMSE 0022772 0085113
Seen from the RMSE results the relatively small values indicate that we have well-
estimated binding functions for all the 50 runs on average With regard to the estimates of
parameters in the route choice model both of them fall into the input domain we choose
57
and the standard deviation is quite small So we can say that the estimates are actually
very good
One thing to notice here is that the final estimate of Lengthβ falls approximately in the
middle of the input domain [05 1] while the estimate of SBβ falls closer to the left limit
which might need further shrinkage of input domain and more precise estimate of the
binding function To get rid of this we use the binding function estimate from all the 500
points to give a hint on the reasonability of acceptance of the estimate of SBβ The scatter
plots of theta_sb against beta_sb and beta_length are shown in Figure 16 below
Figure 16 Scatter plots of theta_sb against beta_sb and beta_length
The scatter plots in Figure 16 above are the decompositions of the binding function from
three dimensions to two dimensions Seen from the linear regression in the two plots ɶSBθ
is almost strictly positive proportional to SBβ and hardly effected byLengthβ This means
y = 19132x - 06404
Rsup2 = 0936
-1
-08
-06
-04
-02
0
02
04
06
0 01 02 03 04 05
the
ta_
sb
beta_sb
y = 00123x - 01717
Rsup2 = 4E-05
-1
-08
-06
-04
-02
0
02
04
06
05 06 07 08 09 1
the
ta_
sb
beta_length
58
that by shrinking the input domain ofSBβ we would probably get the same estimate of
binding function since it changes little in current domain And this leads to our
acceptance of the final estimate of SBβ
Given that we have a random cost following a truncated standard normal distribution and
the magnitudes of the estimated parameters are relatively small this would mean that the
randomness of the cost function are relatively large which in sequence leads to relatively
large randomness in individualrsquos choice of route
Another thing to be mentioned is that the magnitude of Lengthβ is smaller than that when
estimated singly Though these two values are not logically comparable with different
formation of random term in the cost function we could still get a hint from the
comparison This difference is probably due to the form of random cost we used which is
( )li Length l Lengthx E xε sdot and the effect of length on the cost is partially captured by this
random term
64 Estimations of other trial formulations of the model
641 Model with exponential form of cost function
During the process of estimation we carried out a lot of other trials in the formulations of
the basic route choice model the cost function to be specific and the auxiliary logit model
As it turned out the there are negative estimates of coefficients in the cost function
which conflicts our anticipation To capture this kind of negative estimation we choose to
use the exponential form of the cost function Without loss of generality the random term
is not scaled by the length of links The cost function is specified as
( ) Length Length l SB SB l lix x
i lic x eβ β εε + += (40)
Two attributes are used namely length and speed bump dummy variable Unlike the form
in Section 63 we allow the parameters Lengthβ and SBβ to have negative input and the
random term liε now follow a standard normal distribution without truncation Since we
take the exponential form of the cost function the cost of links could be kept positive
thus allowing the use of Dijkstrarsquos Algorithm to operate
59
In terms of the auxiliary model since we could have more attributes in the auxiliary
model than the underlying model Instead of using the same attributes as in the cost
function we choose to add an attributes which is number of links in the pathLNx So the
utility function of the logit model is specified as
- - -ri Length Length r SB SB r LN LN r riU x x xθ θ θ ε= + (41)
We still expect the value of θ to be positive and the coefficient of variables with the form
of -θ would be negative
Several trials and shrinkage were carried out for this formulation of our model to finally
determine the relatively small input intervals forLengthβ and SBβ [25 27] and [-05 0]
respectively 15K = runs are carried out to get statistics of the estimates of the two
parameters Within each run 10M = values are drawn for inputs Lengthβ and SBβ
respectively for estimating binding function
To visualize the trend of binding function more clearly we make use all the 150 sets of
vector β and vector θ to estimate the binding function Since we have three variables in
the logit model we have to estimate three binding functions
For the first binding function ɶ Lengthθ and ( Lengthβ SBβ ) are plotted in Figure 17 below
shown along with the estimated binding function
Figure 17 Scatter plot of theta_length against beta_length and beta_sb estimated binding function
The first binding function takes the form of
ɶ 41312+09114 +44845 10Length Length SBθ β βminus= sdot (42)
60
For the second binding function ɶSBθ and ( Lengthβ SBβ ) are plotted in Figure 18 below
shown along with the estimated binding function
Figure 18 Scatter plot of theta_sb against beta_length and beta_sb estimated binding function
The second binding function takes the form of
ɶ 01147 01362 +07119SB Length SBθ β β= minus (43)
For the third binding function ɶ LNθ and ( Lengthβ SBβ ) are plotted in Figure 19 below
shown along with the estimated binding function
Figure 19 Scatter plot of theta_ln against beta_length and beta_sb estimated binding function
The third binding function takes the form of
ɶ 10043 03378 +00068LN Length SBθ β β= minus (44)
The t-test of estimated parameters in the binding function is carried out with null
hypothesis of zero Estimates that are significantly different from zero with 95
confidence interval are marked as bold
61
Table 8 Estimated coefficients of binding functions for model with exponential cost function
Constant Lengthβ SBβ
ɶLengthθ 1312
(2411) 09114 (4360)
4484510-4 (0005)
ɶSBθ 01147
(0425) -01362 (-1314)
07119 (17221)
ɶLNθ 10043
(13767) -03378
(-12051) 00068 (0607)
Same as in the model with two attributes ɶ Lengthθ andɶ SBθ are significantly affected by
Lengthβ and SBβ respectively The negative signs for Lengthβ in the second and third binding
functions draw our attention Since in the second binding function it is not significantly
different from zero we can disregard the effect In the third binding function Lengthβ has
significantly negative effect on ɶ LNθ The larger value of Lengthβ we have the more
influential of path length on cost is With negative effect on ɶ LNθ we can say at the same
time number of links become less influential on the utility This is reasonable since
intuitively if we are sensitive to the path length we wouldnrsquot care too much of having to
switch several more or fewer links based on that path length and number of links are
more or less correlated to each other
Based on the estimated binding functions and the true observation data we could get the
estimates of Lengthβ and SBβ as shown in Table 9 below
Table 9 Statistics of estimation of beta_length and beta_sb in exponential-cost-function model
Parameter Lengthβ
SBβ
Mean 2537672 -045601
Standard deviation 0068377 0133036
We have negative estimate of SBβ which conflicts our assumption that length and
presence of speed bump on the path may increase the cost of traveling through certain
path This is probably due to omission of important attributes in the deterministic part of
the cost function Based on the estimate we are led to think that presence of speed bump
decrease the cost and individuals would prefer to drive on paths with speed bumps Yet
62
this is not true based on our estimation since we are only using two attributes And there
are great chance that some important features are not captured which accidentally are
related with speed bump So the estimate of SBβ is misleading per se in the simple model
as we are using To get more accurate estimate of SBβ we may need to include more
variables in the deterministic part of the cost function
642 Model with estimated scale parameter for random term
Considering the trial with two attributes in Section 63 we add a fixed scale parameter to
the random term to make it proportional to the length of links This appeals to our
assumption yet lays restrictions to the model Apart from this we also try to add an
unfixed scale parameter σ and estimate it along with the other two parameters Lengthβ and
SBβ Note that if we add a scale parameter directly to the random term it wonrsquot work out
as we expect since that way the scale parameter will scale the other two parameters
Lengthβ and SBβ as well as shown below
= ( )Length SBLength Length l SB SB l li Length l SB l lix x x x
β ββ β ε σ σ εσ σ
+ + sdot + + (45)
The right side equation is equivalent to Length Length l SB SB l lix xβ β ε+ + thus making no
difference So we choose to add a new random term including the scale parameter In
addition since we can get good estimate by assuming the random term proportional to
length we will keep this in the newly added random term Now the cost function is
specified as
1 ( ) + ( )l li li Length Length l SB SB l li li Length l Lengthc x x x x Mean xε ε β β ε η σ= + + sdot sdot 2
(46)
liε and liη follow the same truncated normal distribution but are drawn separately so that
they are not equal
In terms of the auxiliary model since now we have three parameters to be estimated in
the underlying model we need one more attribute in the logit model and number of links
in the path LNx is chosen The utility function of the logit model is actually the same as in
Section 641 which is
- - -ri Length Length r SB SB r LN LN r riU x x xθ θ θ ε= + (47)
63
With three parameters in the underlying model it is more reasonable to include
interactions of parameters in the binding function The binding functions take the form of
ɶ
1 2 3
4 5 6 7
( )
Length SB
Length SB Length SB Length SB
c d d d
d d d d
θ β β β σβ β β σ β σ β β σ
= + + +
+ + + + (48)
Since the estimates are not good we did not carry out too many trials to center the input
interval As a result the binding function may be of more interest in this case The chosen
interval is a trial one which is identical [0 3] for Lengthβ SBβ andσ We choose ten sets of
mβ and ɶ ( )m mθ β from one run as an example The values of ɶ ( )m mθ β are plotted against
Lengthβ SBβ andσ respectively The interactions are not shown in the figure yet we have
the estimates of binding function which will give a numerical description of how the
interactions impact theɶ ( )m mθ β
Figure 20 Plots of theta_length against beta_length beta_sb and sigma respectively
y = 09114x + 27818
Rsup2 = 07361
0
1
2
3
4
5
6
0 1 2 3 4
the
ta_
len
gth
beta_length
y = 03568x + 36215
Rsup2 = 00897
0
1
2
3
4
5
6
0 1 2 3 4
the
ta_
len
gth
beta_sb
y = 02572x + 38468
Rsup2 = 00516
0
1
2
3
4
5
6
0 1 2 3
the
ta_
len
gth
sigma
64
Figure 21 Plots of theta_sb against beta_length beta_sb and sigma respectively
y = 02363x + 0835
Rsup2 = 0088
0
05
1
15
2
25
3
0 1 2 3 4
the
ta_
sb
beta_length
y = 06351x + 01759
Rsup2 = 05054
0
05
1
15
2
25
3
0 1 2 3 4
the
ta_
sb
beta_sb
y = -03801x + 17212
Rsup2 = 02001
0
05
1
15
2
25
3
0 1 2 3
the
ta_
len
gth
sigma
y = 00477x + 04521
Rsup2 = 005460
02
04
06
08
1
0 1 2 3 4
the
ta_
ln
beta_length
y = -00553x + 06156
Rsup2 = 00582
0
02
04
06
08
1
0 1 2 3 4
the
ta_
ln
beta_sb
65
Figure 22 Plots of theta_ln against beta_length beta_sb and sigma respectively
As we can see from the three figures above ɶ Lengthθ ɶSBθ and ɶ LNθ are more affected by
Lengthβ SBβ andσ respectively Especially we can see a strong relationship between ɶ LNθ
and σ which assures that number of links can be used to infer the scale parameter in the
underlying model
The estimates of three binding functions are shown in Table 10 below with each row
representing the estimates for one of the three binding function and each column
representing certain variable in the binding function In the parenthesis below each
estimate of the coefficients is the t-test value with the null hypothesis of zero We take the
90 confidence interval and estimates with t-test value larger than 164 are supposed to
be significantly different from zero which are marked as bold
Table 10 Estimates of three binding functions
Constant Lengthβ SBβ σ
Length SBβ β
Lengthβ σ
SBβ σ Length SBβ β σ
ɶLengthθ
1814 (3085)
0861 (2417)
-0089 (-0258)
1038 (2913)
0202 (1030)
-0246 (-1240)
-0056 (-0292)
-0045 (-0412)
ɶSBθ 0284
(1482) -0125
(-1081) 0942
(8371) -0247
(-2127) 0118
(1856) 0070
(1086) -0141
(-2275) -0067
(-1883)
ɶLNθ 0819
(18643) 0015
(0577) -0026
(-0997) -0261
(-9794) 0006
(0419) 0007
(0498) 0024
(1663) -0007
(-0803)
As the constants indicate given no other attributes length and number of links have more
negative effects on the utility than the speed bump dummy does Judging from the
significance of coefficients for the three input parametersɶ Lengthθ ɶSBθ and ɶ LNθ are
significantly affected by Lengthβ SBβ andσ respectively As we can see σ has a negative
y = -02164x + 08218
Rsup2 = 09867
0
02
04
06
08
1
0 1 2 3th
eta
_ln
sigma
66
effect on ɶSBθ andɶ LNθ Since to some extent σ measures the scale of randomness we
could say that the more randomness of the costs on the links have the less influential of
presence of speed bump and number of links become ForɶSBθ it is significantly affected
by some of the interaction terms Notice that SBβ has positive effect onɶSBθ while σ has
effect The interaction terms including both σ and SBβ have negative effect onɶSBθ which
indicates that randomness of cost is more influential than presence of speed bump on the
disutility of speed bump
In terms of the final estimate as stated above the estimates of Lengthβ and SBβ have
negative signs whileσ has positive sign This result conflict our expectation that Lengthβ
and SBβ should have positive signs so we did not carry out more trials and shrinkage The
possible reason for negative estimate is similar to that in the model with exponential form
of cost function Given more attributes in the deterministic part of both the cost function
and utility function in the logit model we might be able to capture the features of the data
better and have the right sign in the final estimates
643 Monte Carlo evidence of model with estimated scale parameter for random
term
Based on the model formulation with estimated scale parameter for random term we also
carried out a Monte Carlo simulation experiment to verify the efficiency of using number
of links in the logti model to infer the scale parameter in the cost function and what we
do is to simulated observations instead of the true ones
We take three arbitrary values for the three parameters in the cost functionLengthβ SBβ and
σ to be 05 And simulated observations are generated based on the given values of
parameters in the cost function Since we know the true values for the parameters the
input domain is centered around the true values to be [04 06] for Lengthβ SBβ andσ
10K = runs are carried out to get statistics of the estimates of the three parameters
Within each run 10M = values are drawn for inputsLengthβ SBβ andσ respectively for
estimating binding function
67
In terms of the binding function by doing regression test we can see that the intersection
terms are unnecessary to be included or even hazardous for good estimate of binding
function so we decide to remove them and keep the binding function as
ɶ1 2 3( ) Length SBc d d dθ β β β σ= + + + (49)
We choose ten sets of mβ and ɶ ( )m mθ β from one run as an example The values of
ɶ ( )m mθ β are plotted againstLengthβ SBβ andσ respectively
Figure 23 Plots of theta_length against beta_length beta_sb and sigma respectively
y = 23826x + 14791
Rsup2 = 05326
15
2
25
3
35
04 05 06
the
ta_
len
gth
beta_length
y = -06434x + 30245
Rsup2 = 0048115
2
25
3
35
04 05 06
the
ta_
len
gth
beta_sb
y = 26255x + 14156
Rsup2 = 07607
15
2
25
3
35
04 05 06
the
ta_
len
gth
sigma
y = -02443x + 04708
Rsup2 = 0034
0
01
02
03
04
05
04 05 06
the
ta_
sb
beta_length
y = 11233x - 02096
Rsup2 = 089020
01
02
03
04
05
04 05 06
the
ta_
sb
beta_sb
68
Figure 24 Plots of theta_sb against beta_length beta_sb and sigma respectively
Figure 25 Plots of theta_ln against beta_length beta_sb and sigma respectively
The figures show similar trend to those in the trial model with estimated scale parameters
which is in line with our expectation
The estimates of three binding functions are shown in Table 11 below with each row
representing the estimates for one of the three binding function and each column
y = -04374x + 056
Rsup2 = 01283
0
01
02
03
04
05
04 05 06
the
ta_
sb
sigma
y = -01144x + 07619
Rsup2 = 01114066
067
068
069
07
071
072
073
074
04 05 06
the
ta_
ln
beta_length
y = 0053x + 06768
Rsup2 = 00296066
067
068
069
07
071
072
073
074
04 05 06
the
ta_
ln
beta_sb
y = -03115x + 08561
Rsup2 = 09717
066
067
068
069
07
071
072
073
074
04 05 06
the
ta_
ln
sigma
69
representing certain variable in the binding function In the parenthesis below each
estimate of the coefficients is the t-test value with the null hypothesis of zero We take the
95 confidence interval and estimates with t-test value larger than 196 are supposed to
be significantly different from zero which are marked as bold
Table 11 Estimates of three binding functions in the Monte Carlo experiment
Constant Lengthβ SBβ σ
ɶLengthθ 0853
(3606) 1009
(3724) -0034
(-0125) 2569
(9482)
ɶSBθ -0062
(-0385) -0104
(-0564) 1208
(6591) -0226
(-1227)
ɶLNθ 0854
(46688) 0013
(0624) -0004
(-0185) -0302
(-14428)
The estimates of binding function have similar characteristics as in the trial model with
estimated scale parameters as well They contain almost the same significant coefficients
and those significant estimates have the same signs as in the trial with true observations
Based on the estimated binding function and the simulated observations given true values
of the three parameters to be 05 the final estimates of Lengthβ SBβ andσ are shown in
Table 12 below
Table 12 Statistics of estimation of beta_length beta_sb and sigma in the Monte Carlo experiment
Parameter Lengthβ
SBβ σ
Mean 0404138359 0458624533 0639191487
Standard deviation 1109279424 0242570421 0377069799
As we can see the estimates of Lengthβ SBβ andσ are quite close to their true values What
is not satisfying is that the estimate of σ is a little large and lies outside the input domain
of [04 06] but is still quite near to this interval In addition the estimate of Lengthβ is
within the input domain yet the variation is large This is understandable since we scale
the random term by length together with the scale parameter and thus the parameter for
length could be influenced by the random term and turns out to have large variations In a
word the result of Monte Carlo experiment verifies that we get use the model
70
formulation with unfixed scale parameter for the random term to get the right estimate of
the true values And number of links is strongly related withσ which means that it is
reasonable and efficient to use it as a reference to σ in the cost function
71
7 Conclusions
This thesis aims at implementing the newly proposed route choice model based on
indirect inference in true observations The model assigns links specific errors for a
network which allows natural correlations among paths and is practical in simulating
observations by means of shortest path searching algorithms like the Dijkstrarsquos Algorithm
used in our experiment To get consistent estimation of this kind of model indirect
inference method is used and a simple model like logit model is used as an auxiliary
model The route choice model and indirect inference estimator has been tested on
synthetic data with simulated observations and proved to be capable of consistently
estimated
Compared to the synthetic experiment some extensions are done in this thesis By
replacing the simulated observations with the true observations the method is tested on
the empirical circumstance to prove that it could be used in solving practical problems
The true observations have more noises than the simulated ones thus more difficulty to
capture their features We know neither the right formulations of models based on the
data nor the values of parameters in the route choice model yet as defined the
parameters should have positive signs As it turned out to be in the experiment with only
length in the model we get the estimates of Lengthβ as 1337 while with two attributes in
the model we get the estimates of Lengthβ and SBβ as 0761 and 00799 respectively The
estimates in both experiments seem reasonable with the right sign In addition seen from
the estimation of the binding function the coefficients in the logit model is negatively
affected by the parameters they infer in the basic route choice model in the two attributes
case one parameter in the logit model is more apparently affected by the parameter it
refers than the other parameter in basic model
In the trial where we include a scale parameter to the random term and estimate it along
with the other parameters in the route choice model a Monte Carlo simulation
experiment is carried out using simulated observations The result shows that it is
efficient to use number of links in the auxiliary model to infer the scale parameter in the
basic rout choice model
72
In other trial formulations of the model we got negative estimates which may probably
be due to missing attributes in the cost function Future work should be done to include
more attributes
Another thing to recommend for future is that we generate the pseudo-universal choice
set as part of the auxiliary model Since the pseudo-universal choice set is partially used
for deciding which ODs and observations to be used in the project it is essential and
should be generated beforehand But from the choice set generation point of view we
could generate individual specific choice set directly instead of random drawing paths
from the pseudo-universal choice set This would increase computational efficiency
73
Bibliography
Axhausen K Schoumlnfelder S Wolf J Oliveira M amp Samaga U (2003) 80 Weeks of
GPS Traces Approaches to Enriching the Trip Information Transportation Research
Record 1870 46-54
Azevedo J Costa M Madeira J amp Martins E (1993) An Algorithm for the Ranking
of Shortest Paths European Journal of Operational Research 69 (1) 97-106
Bartels K Boztug Y amp Muumlller M (1999) Testing the Multinomial Logit Model
Working paper University Potsdam Germany
Bekhor S Ben-Akiva M amp Ramming M (2002) Adaptation of Logit Kernel to Route
Choice Situation Transportation Research Board of the National Academics 1805 78-85
Bekhor S Ben-Akiva M amp Ramming M (2006) Evaluation of Choice Set Generation
Algorithms for Route Choice Models Annals of Operations Research 114 (1) 235-247
Ben-Akiva M amp Bierlaire M (1999) Discrete Choice Methods and Their Applications
to Short Term Travel Decisions In Chapter for the Transport Science Handbook
Preliminary Draft
Ben-Akiva M amp Bierlaire M (2003) Discrete Choice Models with Applications to
Departure Time and Route Choice In Handbook of Transportation Science (second ed)
Kluwer
Ben-Akiva M amp Bolduc D (1996) Multinomial Probit with a Logit Kernel and a
General Parametric Specification of the Covariance Structure Working Paper
Ben-Akiva M amp Lerman S (1985) Discrete Choice Analysis Theory and Application
to Travel Demand MIT Press
Ben-Akiva M Bergman M Daly A amp Ramaswamy R (1984) Modeling Inter Urban
Route Choice Behaviour In J Vollmuller amp R Hamerslag (Ed) the 9th International
Symposium on Transportation and Traffic Theory (pp 299-330) Utrecht Netherlands
VNU Science Press
Cascetta E Nuzzolo A Russo F amp Vitetta A (1996) A Modified Logit Route Choice
Model Overcoming Path Overlapping ProblemsSpecification and Some Calibration
Results for Interurban Networks In J Lesort (Ed) the 13th International Symposium on
Transportation and Traffic Theory Lyon France
74
Creel M (2009) A Data Mining Approach to Indirect Inference Universitat Autonoma
de Barcelona Department of Economics and Economic History
De La Barra T Peacuterez B amp Anez J (1993) Multidimensional Path Search and
Assignment 21st PTRC Summer Meeting (pp 307-319)
Dijkstra E (1959) A note on two problems in connexion with graphs Numerische
Mathematik 1 269-271
Frejinger E amp Bierlaire M (2007) Capturing Correlation with Subnetworks in Route
Choice Models Transportation Research Part B 41 363-378
Frejinger E Bierlaire M amp Ben-Akiva M (2009) Sampling of Alternatives for Route
Choice Modeling Transportation Research Part B Methodological 43 (10) 984-994
Gallant A amp McCulloch R (2004) On the Determination of General Scientific Models
Manuscript Duke University
Gourieacuteroux C Monfort A amp Renault E (1993) Indirect Inference Journal of Applied
Econometrics 8 85-118
Karlstroumlm A Sundberg M amp Wang Q (2011) Consistently estimating flexible route
choice models using an MNL lense International Choice Modeling Conference Leeds
Keane M amp Smith A (2003) Generalized Indirect Inference for Discrete Choice
Models Manuscript Yale University
Manski C amp Lerman S (1977) The Estimation of Choice Probabilities from Choice
Based Samples Econometrica 45 (8) 1977-1988
McFadden D (1974) Conditional Logit Analysis of Qualitative Choice Behaviour (P
Zarembka Ed) Frontiers in Econometrics 105-142
McFadden D (1978) Modeling the Choice of Residential Location In A Karlqvist L
Lundqvist F Snickars amp J Weibull (Ed) Spatial Interaction Theory and Residential
Location (pp 75-96) Amsterdam North-Holland
McFadden D amp Train K (2000) Mixed MNL Models for Discrete Response Journal
of Applied Econometrics
Nerella S amp Bhat C (2004) Numerical Analysis of Effect of Sampling of Alternatives
in Discrete Choice Models Transportation Research Record 1894 11-19
Ramming M (2001) Network Knowledge and Route Choice PhD Thesis Massachusetts
Institute of Technology
75
Schoumlnfelder S amp Samaga U (2003) Where Do You Want to Go Today-More
Observations on Daily Mobility Third Swiss Transport Research Conference Ascona
Schoumlnfelder S Axhausen K Antille N amp Bierlaire M (2002) Exploring the
Potentials of Automatically Collected GPS Data for Travel Behaviour Analysis- A
Swedish Data Source i J Moumlltgen amp A Wytzisk (Red) GI-Technologien fuumlr Verkehr
und Logistik number 13 Institut fuumlr Geoinformatik Universitaumlt Muumlnster (ss 155-179)
Munster IfGIprints
Smith A (1993) Estimating Nonlinear Time-series Models Using Simulated Vector
Autoregressions Journal of Applied Econometrics 8 63-84
Smith A (2008) Indirect Inference In S Durlauf amp L Blume (Eds) The New
Palgrave Dictionary of Economics (Second ed) Palgrave Macmillan
Smith A (1990) Three Essays on the Solution and Estimation of Dynamic
Macroeconomic Models PhD Dissertation Duke University
Train K (2003) Discrete Choice Methods with Simulation Cambridge University Press
Vovsha P amp Bekhor S (1998) Link-nested Logit Model of Route Choice-Overcoming
Route Overlapping Problem Transportation Research Record 1645 133-142
Wang H (2011) Logistics Distribution Shortest Path Based on Dijkstra Algorithm
Computer and Digital Engineering 3
Assigned publication number
TSC-MT 11-016
wwwkthse

4
5 Experiment Design 46
6 Results 49
61 Validation of Binding Function 49
62 Estimation of model with one attribute 51
63 Estimation of model with two attributes 52
64 Estimations of other trial formulations of the model 58
641 Model with exponential form of cost function 58
642 Model with estimated scale parameter for random term 62
643 Monte Carlo evidence of model with estimated scale parameter for random term 66
7 Conclusions 71
Bibliography 73
5
List of Figures
Figure 1 S-shaped relationship between probability and deterministic part of utility 20
Figure 2 A simple network for Dijstrrarsquoa Algorithm explanation 24
Figure 3 Illustration of the Borlaumlnge road network 39
Figure 4 Histogram of link length data 40
Figure 5 Histogram of link length data (zoomed within 1km) 41
Figure 6 Illustration of links with speed bumps 41
Figure 7 Histogram of link numbers in observations data set 43
Figure 8 Illustration of the flow in the experiment 46
Figure 9 Scatter plots of the 90 beta-theta pairs 49
Figure 10 OLS regression based on the 10 beta-theta points from one run 50
Figure 11 Scatter plot of the input values for beta_length and beta_sb 53
Figure 12 Scatter plot of theta_length with regard to beta_length and beta_sb 54
Figure 13 Display of the estimated binding function for theta_length 54
Figure 14 Scatter plot of theta_sb with regard to beta_length and beta_sb 55
Figure 15 Display of the estimated binding function for theta_sb 55
Figure 16 Scatter plots of theta_sb against beta_sb and beta_length 57
Figure 17 Scatter plot of theta_length against beta_length and beta_sb estimated binding
function 59
Figure 18 Scatter plot of theta_sb against beta_length and beta_sb estimated binding
function 60
Figure 19 Scatter plot of theta_ln against beta_length and beta_sb estimated binding
function 60
Figure 20 Plots of theta_length against beta_length beta_sb and sigma respectively 63
Figure 21 Plots of theta_sb against beta_length beta_sb and sigma respectively 64
Figure 22 Plots of theta_ln against beta_length beta_sb and sigma respectively 65
Figure 23 Plots of theta_length against beta_length beta_sb and sigma respectively 67
Figure 24 Plots of theta_sb against beta_length beta_sb and sigma respectively 68
Figure 25 Plots of theta_ln against beta_length beta_sb and sigma respectively 68
6
List of Tables
Table 1 Descriptive statistics of link length 40
Table 2 Descriptive statistics of link numbers in observation data set 43
Table 3 Descriptive statistics of estimated travel time on links 44
Table 4 Descriptive statistics of duration of trips 45
Table 5 Statistics of estimation of beta_length 51
Table 6 Estimated coefficients of binding function for model with two attributes 56
Table 7 Statistics of estimation of beta_length and beta_sb 56
Table 8 Estimated coefficients of binding functions for model with exponential cost
function 61
Table 9 Statistics of estimation of beta_length and beta_sb in exponential-cost-function
model 61
Table 10 Estimates of three binding functions 65
Table 11 Estimates of three binding functions in the Monte Carlo experiment 69
Table 12 Statistics of estimation of beta_length beta_sb and sigma in the Monte Carlo
experiment 69
7
1 Introduction
11 Motivation
With the development of ITS there is a stronger desire for more accurate and efficient
vehicle orientation systems and devices which relies much on the mechanism of route
choice models In other cases well estimated route choice models reveals travel behavior
of the car drivers which contributes to system-scaled analysis such as design and
appraisal of road pricing system across the road network On the other hand newly
developed GIS techniques provide sufficient route choice data as solid basement for
research on route choice behaviors Both the desire for better developed model and more
available prerequisites stimulate the research on route choice modeling
12 Background
Route choice modeling has been discussed for a long time Given a basement network
composed by a finite number of nodes which are connected by directed links we assume
that individuals travel from an origin node to a destination node in the network Thus the
choice of an individual turns out to be an observed path represented by a sequence of
links considering inherent attributes of links such as length or presence of speed bumps
From this point of view individuals make discrete choices the behavioral mechanism of
which could be seen in two different ways Individuals could either be seen as choosing
links from each junction node or choosing from possible paths connecting the origin node
and the destination one In line with a great body of literatures we focus on the path-
based approaches to develop our model
There are two important issues that need to be considered for this kind of approach
namely the generation of choice set and model formulation to address alternative
correlation due to path overlapping To be specific when we assume that individuals
choose from paths connecting the origin and destination it is infeasible to enumerate the
full-size choice set or universal choice set which includes all possible paths between the
OD pair in a given road network Individuals may not virtually consider the universal
choice set when they make decisions and in practice algorithms implemented to find the
shortest paths avoid the usage of choice set at all such as the Dijkstrarsquos algorithm we
implement in the model Hence we give each individual the right to consider all possible
8
paths It is common practice to generate samples from the universal choice set yet this
may easily introduce biases to the estimation Samples are supposed to be randomly
drawn from the population and good samples can reproduce the features in the population
Since in real-size network it is impossible to know the full-size choice set let alone to
reproduce the features of it We could only draw from certain known paths and this is
more like an importance sampling which gives links different possibilities to the drawn
into paths As a result estimation based on the sampled paths will have biases
The other problem with regard to path-based approaches is the inherent limitation of
multinomial logit model (MNL) which requires no correlation among alternatives This
is practically unrealistic since in the context of route choice modeling paths sharing
certain links are correlated due to unobserved features of the common links Numerous
literatures contribute to improvement in terms of the problem based on logit models
We choose to use an approach with additive link specific errors which belongs to probit-
like models This kind of model is efficient for applications yet it is still not able to be
estimated consistently given a partial choice set So we turn to indirect inference as the
tool to estimate the probit-like model with additive link specific errors All feasible paths
for each individual are technically allowed which means that a universal choice set is
provided for each OD pair to avoid bias caused by sampling from full choice sets The
universal choice set generated here is a so-called pseudo-universal choice set which
contains as many feasible paths as desired to eliminate possible biases but not all paths
since it is practically impossible to get the true universal choice set We choose to use an
MNL model as the auxiliary model which is easy to estimate The estimate of MNL
model is biased based on the choice set we generate as discussed above yet the estimate
of parameters in the basic route choice model will be consistent thanks to the features of
the indirect inference method
13 Objective
A Monte Carlo simulation experiment has been carried out based on synthetic trip data
and real-sized road network to appraise the proposed model (See Karlstroumlm Sundberg amp
9
Wang 2011)1 The basic route choice model includes two attributes namely length and
speed bump dummy while an MNL model is chosen as the auxiliary model with the
same two attributes Simulated trip data given two pseudo-true values for coefficients of
length and speed bump dummy are used as a substitution of the empirical data The
presence of speed bumps is randomly allocated over the network Estimation results and
sensitivity test confirm the efficiency and consistency of the proposed estimator
What needs to be done in the thesis is that true trip data should be implemented as well as
the modification of the network To be specific realistic speed bump distribution is used
to replace the randomly allocated one Without knowing the true values of the
coefficients several iterations need to be carried out to get to know the raw domain of the
values and by shrinking input intervals more accurate estimates will be attained as the
accomplishment of the thesis
14 Scope of the Thesis
Based on the route choice model used in the synthetic experiment extensions are done in
five main aspects First we implement the newly proposed estimator in real world issues
by replacing the simulated observations with the true observations collected in a real
world network Unlike the simulated data which is generated following certain
assumptions the true observations have more noises inside and thus more difficult to
capture their features Second the observations we use contain many OD pairs and not
restricted with one or four of them as in the synthetic experiment this gets rid of the
possibility of bias caused by restricted OD pairs Third since we are implementing the
new method in true observations the formulation of route choice model cost function to
be specific is not known beforehand and correspondingly the formulation of the utility
function in the logit model is not for sure as well We need several trials to get well
defined formulations to capture the features of the data Fourth we have no idea what the
parameters are like based on true observation and thus a raw guess of input domain is
needed at first and centered with shrinkage in later iterations Last but not least in one
trial we included a scale parameter to the random term in the cost function and use
number of links in the auxiliary model to infer it To test the efficiency of this trial a
1 Karlstroumlm A Sundberg M amp Wang Q (2011) Consistently estimating flexible route choice models using an MNL lense International Choice Modeling Conference Leeds
10
Monte Carlo simulation experiment is carried out with some arbitrary pseudo-true values
of the parameters based on which simulated observations are used
On the other hand what is done in the synthetic experiment such as test with simulated
observations for one OD and four ODs sensitivity of estimates with choice set size and
number of observations is not included in this thesis Instead we will identify some
limitations of the model formulation tried in the thesis and make suggestions how the
model can be improved
As follows Section 2 reviews relevant literatures on route choice modeling as well as
indirect inference In Section 3 relevant methods are introduced in detail as backgrounds
afterwards methods and models used in this thesis are illustrated Section 4 gives
description of the empirical data we use for estimating and Section 5 shows the
estimation results of the Monte Carlo simulation-based experiment followed by some
conclusions in Section 6
11
2 Literature Review
Route choice modeling has long been discussed and many efforts have been made to
solve this problem Simple and easy to estimate the multinomial logit model (MNL) is
widely used in choice modeling yet it has certain restrictions to be implemented in route
choice context Due to its inherent property of Independence from Irrelevant Alternatives
(IIA) the multinomial logit model is not easily applicable since routes in the choice set
tend to be correlated with the presence of overlapping paths Cascetta et al (1996)
proposed a correction term called Commonality Factor (CF) in the deterministic part of
the utility function2 And the probability of path i to be chosen from the choice set nC
becomes( )
( )( | )in in
jn jn
n
V CF
n V CF
j C
eP i C
e
micro
micro
minus
minus
isin
=sum
As proposed by Cascetta et al the Commonality
Factor is specified as ln ( )n
ijin CF
j C i j
LCF
L Lγβ
isin
= sum in which ijL is the length of links
common to path i and pathj while iL and jL are the total length of path i and pathj
respectively The parameter γ is left to be estimated or practically constrained to a fixed
value like 1 or 2 The CF term of one path is proportional to the length of overlapping
part with other paths This proposed model is referred to as C-Logit model Bearing some
similarities Ben-Akiva and Bierlaire (1999) proposed the Path Size Logit (PSL) model3
This model is based on a different theoretical basis as the C-Logit The original
formulation of Path Size (PS) comes from the discrete choice theory of aggregate
alternatives Similar to the CF in C-Logit the log of Path Size (PS) is added to the utility
function The probability of path i to be chosen from the choice set nC becomes
( ln )
( ln )( | )in in
jn jn
n
V PS
n V PS
j C
eP i C
e
micro
micro
+
+
isin
=sum
The Path Size is specified as
1
i n
n
ain
a Ciaj
j C j
lPS
LL
LδisinΓ
isin
= sumsum
in
2 Cascetta E Nuzzolo A Russo F amp Vitetta A (1996) A Modified Logit Route Choice Model Overcoming Path Overlapping ProblemsSpecification and Some Calibration Results for Interurban Networks In J Lesort (Ed) the 13th International Symposium on Transportation and Traffic Theory Lyon France 3 Ben-Akiva M amp Bierlaire M (1999) Discrete Choice Methods and Their Applications to Short Term Travel Decisions In Chapter for the Transport Science Handbook Preliminary Draft
12
which iΓ is the set of links in pathi al and iL are the length of link a and pathi
respectively ajδ is the link incidence variable with value of 1 when link abelongs to path
j and zero otherwise And nCL is the shortest path in choice setnC The size of a path has
a maximum value of one when it shares no links with other paths
C-Logit model and PSL model are the most widely used models in practice of route
choice modeling due to their simple forms Since both of them originate from the MNL
model and maintain the basic MNL structure they can be estimated by existing software
designed for logit models Apart from these two types of models there are other recent
efforts in the route choice context
Bekhor Ben-Akiva and Ramming (2002) adapted the Logit Kernel model to apply in a
route choice context4 The Logit Kernel5 model was proposed by combing Gaussian and
Type I Extreme Value error terms by researchers such as Ben-Akiva and Bolduc (1996)
and McFadden and Train (2000) who also referred to it as Mixed Logit6 By making
certain assumptions under route choice context Bekhor Ben-Akiva and Ramming (2002)
proposed a way to apply the model to route choice modeling7 Based on the data from
Boston several kinds of models are estimated including multinomial logit model Path
Size Logit and the newly proposed Logit Kernel model Seen from the estimation results
Logit Kernel has a better overall performance than the other two kinds of models This
result needs to be verified in other data sets since the one used in the paper has a
relatively small size
Frejinger and Bierlaire (2007) proposed an approach to capture correlation among
alternative routes with subnetworks and carried out estimation based on several kinds of
route choice models8 The paper gives an overview of the latest development of route
choice modeling and discusses the Path Size Logit model in detail As part of the
4 Bekhor S Ben-Akiva M amp Ramming M (2002) Adaptation of Logit Kernel to Route Choice Situation Transportation Research Board of the National Academics 1805 78-85 5 Ben-Akiva M amp Bolduc D (1996) Multinomial Probit with a Logit Kernel and a General Parametric Specification of the Covariance Structure Working Paper 6 McFadden D amp Train K (2000) Mixed MNL Models for Discrete Response Journal of Applied Econometrics 7 Bekhor S Ben-Akiva M amp Ramming M (2002) Adaptation of Logit Kernel to Route Choice Situation 8 Frejinger E amp Bierlaire M (2007) Capturing Correlation with Subnetworks in Route Choice Models Transportation Research Part B 41 363-378
13
conclusion a behavioral interpretation of the Path Size in the model is given The
subnetwork is defined so that the alternative routes sharing the same section of it are
seen as correlated This correlation is captured using the Error Component model and
estimation results show that this new approach gives better property than PSL models To
complement the paper uses a real size network and true travel data is collected which is
the same network we are going to use in this thesis project Additionally the paper
displays forecasting results which indicates that models with Path Size component tend
to have bad performance in prediction
Ben-Akiva and Bierlaire (2003) pointed out that under route choice context the
significant correlation among alternatives due to path overlapping and the generation of
choice set are two important issues and main difficulties9
There are some algorithms used in practice for generating choice set for route choice
modeling both deterministic methods and stochastic ones The deterministic methods
tend to give the same set of paths for a given OD pair Some examples are the link
penalty algorithm (De La Barra Peacuterez amp Anez 1993) which increases gradually the
impedance of all the links on the shortest path10 the link elimination algorithm (Azevedo
Costa Madeira amp Martins 1993) which removes links on the shortest path in sequence
to generate new paths11 and the labeled paths (Ben-Akiva Bergman Daly amp
Ramaswamy 1984)12 In terms of the stochastic methods they tend to produce individual
specific choice set One example is the simulation method (Ramming 2001) which
generates alternative paths by drawing link impedances from different distribution
densities13
When it comes to appraisal of the generated choice set some literatures give evaluations
on the efficiency of different sampling algorithms for choice set generation (See Bekhor
9 Ben-Akiva M amp Bierlaire M (2003) Discrete Choice Models with Applications to Departure Time and Route Choice In Handbook of Transportation Science (second ed) Kluwer 10 De La Barra T Peacuterez B amp Anez J (1993) Multidimensional Path Search and Assignment 21st PTRC Summer Meeting (pp 307-319) 11 Azevedo J Costa M Madeira J amp Martins E (1993) An Algorithm for the Ranking of Shortest Paths European Journal of Operational Research 69 (1) 97-106 12 Ben-Akiva M Bergman M Daly A amp Ramaswamy R (1984) Modeling Inter Urban Route Choice Behaviour In J Vollmuller amp R Hamerslag (Ed) the 9th International Symposium on Transportation and Traffic Theory (pp 299-330) Utrecht Netherlands VNU Science Press 13 Ramming M (2001) Network Knowledge and Route Choice PhD Thesis Massachusetts Institute of Technology
14
Ben-Akiva amp Ramming 2006 for example) Apart from this there are some recently
proposed methods for sampling alternatives under route choice context (See Frejinger
Bierlaire amp Ben-Akiva 2009 for example)
Nerella and Bhat (2004) carried out a numerical analysis on the effect of sample size on
the efficiency of the estimation of parameters14 The analysis is done for two kinds of
discrete choice models namely the multinomial logit model for which consistency of
estimation based on subset of alternatives is theoretically proved and non-MNL model
taking mixed multinomial logit model as an example Four evaluation criteria are chosen
namely the ability to recover model parameters ability to estimate overall log-likelihood
function value ability to estimate individual choice probabilities and ability to estimate
aggregate shares of alternatives The results show that the MNL model works well on
small sample size yet certain portion of full choice set need to be kept as a practical
baseline For the non-MNL model small sample size gives poor estimation and increase
of sample size gives obvious increase of estimation quality Certain portion of full choice
set is suggested for practical convenience yet the generalization of sample size portion is
not feasible since difference kinds of models may require different portion to guarantee
accuracy In general for the non-MNL models full choice set is suggested to be used if
feasible and larger sample gives better estimation
Bekhor Ben-Akiva and Ramming (2006) carried out route choice modeling based on a
large-scale urban network including both choice set generation part and route choice
estimation part which compose the process of route choice modeling together15 Given
that previous literatures did not pay too much attention to empirical estimation the paper
used a true observation data set collected in Boston As the first step several choice set
generation algorithms are listed and compared in their efficiency of reproducing the
observed paths on which the evaluation of the algorithms are based The data in Boston
is described in the paper and used in the second step ie model estimation Several route
choice models are presented and estimation results based on different kinds of models are
shown for comparison of the efficiency of the models The Path Size Logit model is
14 Nerella S amp Bhat C (2004) Numerical Analysis of Effect of Sampling of Alternatives in Discrete Choice Models Transportation Research Record 1894 11-19 15 Bekhor S Ben-Akiva M amp Ramming M (2006) Evaluation of Choice Set Generation Algorithms for Route Choice Models Annals of Operations Research 114 (1) 235-247
15
proposed for its property to overcoming the drawbacks of the conventional MNL models
This type of model can be easily estimated using popularized software The main
conclusion is that route choice models could be estimated for large-scale networks based
on the true observation data and prominent computing resources
Frejinger Bierlaire and Ben-Akiva (2009) proposed a paradigm for choice set generation
based on sampling for route choice modeling16 In the context of route choice modeling
the universal choice set which denotes all possible alternatives for a traveler to choose
from is not able to be enumerated So we practically work on a sampled choice set from
the universal one which may easily introduce bias to the final estimate In this paradigm
they focus on unbiased estimation of parameters instead of generating actual choice set
The path generation is seen as an importance sampling approach and a correction of
sampling is added to the path utility Since the following estimation process is based on
the sampled choice set which is treated as the universal one a correction for sampling is
added to the path size attribute in the commonly used path size logit (PSL) model ending
up with the expanded path size Modification in the previous two steps guarantees
unbiased estimation of the parameters Numerical results based on synthetic data are
presented in the paper to reveal that models with a sampling correction in the path utility
are better than those without it The proposed expanded path size logit model provides
unbiased estimation and is better than the original path size models
In this paper we will examine indirect inference Indirect inference is not a new method
it was first introduced by Smith (1990 1993)17 Then Gourieacuteroux et al (1993) gave
overall introduction to the methods and extended it in important ways18 Gallant and
McCulloch (2004) transferred the idea of indirect inference and used it for Bayesian
inference in models where likelihood function is intractable19
16 Frejinger E Bierlaire M amp Ben-Akiva M (2009) Sampling of Alternatives for Route Choice Modeling Transportation Research Part B Methodological 43 (10) 984-994 17 Smith A (1990) Three Essays on the Solution and Estimation of Dynamic Macroeconomic Models PhD Dissertation Duke University Smith A (1993) Estimating Nonlinear Time-series Models Using Simulated Vector Autoregressions Journal of Applied Econometrics 8 63-84 18 Gourieacuteroux C Monfort A amp Renault E (1993) Indirect Inference Journal of Applied Econometrics 8 85-118 19 Gallant A amp McCulloch R (2004) On the Determination of General Scientific Models Manuscript Duke University
16
Gourieacuteroux Monfort and Renault (1993) proposed the inference methods based on an
ldquoincorrectrdquo criterion which does not give consistent estimation to parameters of interest
directly20 The argument of the criterion is called the auxiliary parameter which may
have a larger dimension than the parameters of interest in the basic model After the
auxiliary parameters are selected a simulation-based process is carried out to get a
consistent and asymptotically normal estimator of parameters of interest As a simulation-
based method the only requirement for the basic model is that it could be simulated
regardless of formulations of the model So it could be used for estimating models which
are too complex to carry out direct approaches The paper shows how this kind of method
can be applied in fields such as micro-econometrics macro-econometrics and
econometrics of finance
Keane and Smith (2003) proposed a generalized form of the indirect inference method to
be implemented in the discrete choice model context21 Theoretically indirect inference
could deal with estimation of any economic models yet it has some limitations per se that
decrease the estimation efficiency or even make it difficult to implement Problems arise
when we use indirect inference in estimating discrete choice models since the objective
function the metric of distance between the auxiliary models estimated on observed data
and simulated data to be specific is inherently discrete which leaves the gradient-based
optimization methods infeasible Keane and Smith (2003) proposed that the estimation
procedures used for observed data and simulated data can be different22 Instead of the
discrete choice a continuous function of latent utilities including a smoothing parameter
is used as the dependent variable in the auxiliary model When the smoothing parameter
goes to zero the function of latent utilities converges to the discrete choices this way to
guarantee consistency According to the Monte Carlo results the generalized indirect
inference method proposed in this paper yields good estimates in small samples being as
efficient as maximum likelihood estimates in comparison
20 Gourieacuteroux C Monfort A amp Renault E (1993) Indirect Inference 21 Keane M amp Smith A (2003) Generalized Indirect Inference for Discrete Choice Models Manuscript Yale University 22 Keane M amp Smith A (2003) Generalized Indirect Inference for Discrete Choice Models
17
Creel (2009) presented a data mining approach to indirect inference23 which is similar to
the regular indirect inference method yet with certain advantages over it The method is a
simulation-based estimator relying also on an auxiliary model In line with the indirect
inference method an underlying economic model with parameterβ is referenced by an
auxiliary model with parameterθ Certain values of the parameter hβ in underlying
economic model are drawn randomly from a known density simulated data is generated
using Monte Carlo methods to estimate ɶh
θ of auxiliary model which ends up with a set
of tuples ɶ( )hhβ θ Nonparametric methods are used to get the function ɶ( | )E aβ θ = and
the final estimate of β is supposed to be the result of regression function evaluated at the
estimate of θ based on true observations ɶ ɵ( | )Eβ β θ θ= = Creel (2009) also presented a
way of calculating confidence intervals24 Monte Carlo results in dynamic and nonlinear
panel models and vector autoregressions show good performance of the new estimator
23 Creel M (2009) A Data Mining Approach to Indirect Inference Universitat Autonoma de Barcelona Department of Economics and Economic History 24 Creel M (2009) A Data Mining Approach to Indirect Inference
18
3 Methodology
31 Multinomial Logit Model (MNL)
311 Model Description
Route choice modeling is somewhat complicated when we want to capture the attributes
of both the alternative routes and choice maker accurately and reflect the choice making
process in the model Intuitively route choice can be regarded as choosing one specific
route from several alternative routes which coincides with the prerequisites of discrete
choice models Actually a lot of literatures have explored the route choice modeling and
possible improvements based on discrete choice models (see Cascetta et al 1996 Vovsha
and Bekhor 1998 Ben-Akiva and Bierlaire 1999 for more information on development
in route choice models with regard to discrete choice models)25
To understand the frontier development of route choice model we have got to know the
discrete choice models among which multinomial logit model (MNL) is the most widely
used In addition we choose to implement a new method ndash indirect inference in which
MNL is used as it is
Logit model is the most widely used discrete choice model till now due to its excellent
qualities in model specification To be specific the choice probability takes a closed form
which is easy to estimate and interpret (Train 2003)26
The multinomial logit model is a kind of choice model with more than two alternatives in
the choice set We assume that the choice maker makes his or her decision based on the
utility maximization rule (Ben-Akiva amp Lerman 1985)27 With regard to the utility njU
the decision maker n obtains from the thj alternative in the choice set it is made up of
two parts the deterministic part and the stochastic part The deterministic part denoted
25 Cascetta E Nuzzolo A Russo F amp Vitetta A (1996) A Modified Logit Route Choice Model Overcoming Path Overlapping ProblemsSpecification and Some Calibration Results for Interurban Networks Vovsha P amp Bekhor S (1998) Link-nested Logit Model of Route Choice-Overcoming Route Overlapping Problem Transportation Research Record 1645 133-142 Ben-Akiva M amp Bierlaire M (1999) Discrete Choice Methods and Their Applications to Short Term Travel Decisions 26 Train K (2003) Discrete Choice Methods with Simulation Cambridge University Press 27 Ben-Akiva M amp Lerman S (1985) Discrete Choice Analysis Theory and Application to Travel Demand MIT Press
19
by njV contains attributes known by the modelers while the stochastic part denoted by
njε is the attributes affecting peoplersquos the decision which cannot be observed by the
modelers yet are known by the decision makers themselves So the utility function turns
out to be
nj nj njU V jε= + forall (1)
The type of choice model is basically decided by the distribution of the stochastic part
When we assume that njε is independently identically Gumbel distributed the model
becomes a logit model
As stated above the decision follows utility maximization rule which means that the
decision maker n chooses the alternative with the highest utility say the thi alternative
Use as the probability the thi alternative is chosen over the others we have
( max ) ( )
( )
( )
ni ni nj ni njj C
ni ni nj nj
nj ni ni nj
P P U U P U U j i
P V V j i
P V V j i
ε εε ε
isin= = = ge forall ne
= + gt + forall ne
= minus lt minus forall ne (2)
With Equation (2) above and the assumption that njε follows iid Gumbel distribution we
could derive the probability of decision maker n chooses alternativei which is
ni
nj
V
ni V
j
eP
e=sum
(3)
Typically we specify the deterministic part of the utility function in a linear form which
is nj njV xβ= Then the probability becomes
ni
nj
x
ni x
j
eP
e
β
β=sum
(4)
This is the most common form of probability function for multinomial logit models
There are some good properties for this kind of logit probability as discussed by Train
(2009)28 With this form the probability of choosing certain alternative will be between
zero and one inherently which is basically required for probability definition Yet the
28 Train K (2003) Discrete Choice Methods with Simulation
20
value of niP will never drop to zero mathematically which means that all the alternatives
in the choice set are perceived to have chance to be chosen On the other hand if an
alternative is perceived never to be chosen it should not be included in the choice set at
all
The probabilities for all the alternatives in the choice set sums to be one which is easily
illustrated from the analytical properties 1 1 1
( ) 1njni
J J JVV
nii i j
P e e= = =
= =sum sum sum in which J denotes
the number of alternatives in the choice set
The logit probability and the deterministic part of the utility function follow an S-shaped
curve line shown in Figure 1 below
Figure 1 S-shaped relationship between probability and deterministic part of utility
This property gives implications for possible impacts of the deterministic utility of certain
alternative on its chances to be chosen We could see that when an alternative has about
50 probability to be chosen which infers to the steepest part on the curve a small
change in the deterministic part of the utility function could lead to a large change in the
probability the alternative has to be chosen
Apart from the nice properties of logit probability logit models have some disadvantages
as well (Bartels Boztug amp Muumlller 1999)29 One shortcoming is the assumption of
29 Bartels K Boztug Y amp Muumlller M (1999) Testing the Multinomial Logit Model Working paper University Potsdam Germany
21
Gumbel distribution of error terms in the utility function The inherent requirement for
iid property sets restrictions for logit model to be widely used especially in route choice
modeling context Several models have been proposed to overcome this shortcoming in
particular modifications based on MNL to adjust it to route choice practices have been
proposed Another drawback is the assumption of the linear composition for the
deterministic part of utility function Actually this assumption is for ease of following
estimation process since McFadden (1974) demonstrated that under this condition the
probabilities will be universally concave with regard to the coefficientsβ 30 which
improves the performance of numerical estimation Yet there could be nonlinear
compositions in the deterministic part to relax the restriction Under this condition the
universal concavity cannot be guaranteed which may lead to local convergence in the
estimation process
312 Model Estimation
The most commonly used numerical estimation method for multinomial logit models is
the Maximum Likelihood Estimation (MLE) In principle given a set of data and the
underlying probability model the method tries to find coefficients of the probability
model with which produced data has a distribution most likely resembles the distribution
of the observed data
Consider the case that N decision makers with their choice data are obtained Parameters
to be estimated are the coefficients in the utility function denoted byβ We could then
use the MLE to try to get the values of β vector with which the probability that choice
maker choose their observed alternatives is maximized
The probability of choice maker n to choose his or her observed alternative can be
written as
( ) niyni
i
Pprod (5)
in which niy is a dummy with value 1 if choice maker choose alternative i and value 0
otherwise
30 McFadden D (1974) Conditional Logit Analysis of Qualitative Choice Behaviour (P Zarembka Ed) Frontiers in Econometrics 105-142
22
Choice makers choose their alternative independently from each other so the probability
of all sampled choice makers choose their observed alternative is
1
( ) ( ) ni
Ny
nin i
L Pβ=
= prodprod (6)
This is the likelihood function with regard to the parameters to be estimated β in this
case We can take the logarithm of it to get the log-likelihood function
1
( ) lnN
ni nin i
LL y Pβ=
=sumsum (7)
Since we aim at getting the value of β to make the log-likelihood function maximized
we can take the derivative of it with respect to β and set it to zero
( )
0dLL
d
ββ
= (8)
By solving this equation we could get the estimate of β
32 Dijkstrarsquos Algorithm
321 Introduction
A method is needed for generating feasible alternatives and compose the choice set as
well as for deriving simulated observations for each OD pair in the process of indirect
inference As for choice set generation we would like to include certain number of high
ranking shortest paths in the choice set since these paths tend to have more possibility to
be chosen Similar to this the simulated observation is generated as the shortest path
between each OD pair We implement a method for shortest path finding which is the
Dijkstrarsquos Algorithm
Dijkstrarsquos Algorithm is named after the Dutch computer scientist Edsger Dijkstra who
conceived this method in 1956 and got it published in 195931 This is a graph search
algorithm aiming at solving shortest path problem for a graph the edge cost of which is
defined nonnegative The outcome of it is a shortest path tree demonstrating the path with
lowest value with respect to the defined cost
31 Dijkstra E (1959) A note on two problems in connexion with graphs Numerische Mathematik 1 269-271
23
This algorithm deals with single-source problem To be specific given one source node in
the graph the algorithm will give paths with the lowest value with regard to cost from
this source node to every other node in the network Given certain criterion we could use
the algorithm to find shortest path between two specific nodes by setting one node as the
source and the other as the target
After released it is widely used in path searching problems especially in transportation
related practices Routing problem is considered in investigation on traffic assignment
and optimization in logistics Real sized road network could be perceived as a graph with
vertices and edges in which cities can be abstracted as the vertices in the graph and the
roads connecting cities can then be regarded as the edges With the aid of Dijkstrarsquos
Algorithm the shortest path with respect to cost could be found from certain city to the
other cities The outcome is valuable for logistics corporations to work out their region-
wide distribution plans32
322 Algorithm
We connect a ldquodistancerdquo value with all the vertices in the graph indicating its distance
from the source vertex To be accurate the ldquodistancerdquo could be actual length of edges or
the generalized cost on the edges or anything desired The source vertex is defined as the
initial node with a value of zero In the process Dijkstrarsquos Algorithm will assign values
to vertices detected in one loop and update the values in the following loops till a
minimum value is found for each vertex The steps for searching and updating are
presented below
1 Initialize the network and assign the distance values of vertices other than the initial
node as infinity
2 When one vertex is to be detected it is denoted as current node All the vertices that
have been detected and attained the minimum distance values will be marked as detected
and will not be detected in the following loops while the vertices remaining unvisited
will be marked undetected To initialize all the vertices are marked undetected and the
initial node is set as current node
32 Wang H (2011) Logistics Distribution Shortest Path Based on Dijkstra Algorithm Computer and Digital Engineering 3
24
3 For current node all its directly connected adjacent nodes are considered except for
the newly detected vertex Labeled distance values of the neighbor vertices will be
updated if the calculated values from current node are smaller than their current values
For example current node A has a distance value of 4 and one of its neighbors B has a
value of 8 The edge linking A and B has a distance of 2 The newly calculated distance
value for B will be 4+2=6 which is smaller than 8 So the labeled distance value for B
will be updated to 6 indicating that the minimum distance from the source vertex to B till
now is 6 and the path should pass A
4 When all the neighbors of the current node are considered and updated mark the
current node as detected And mark the undetected node with the lowest distance value as
the current node and do the detection in step 3 again
5 When all the vertices in the network are marked detected the algorithm is finished and
we get the minimum distance from the source to all the other vertices The shortest path
from the source to a specific vertex could be found out following the detecting process
As mentioned above the stop criterion could also be modified as we desired If we aim at
finding the shortest path between two vertices at the beginning one vertex should be set
as the initial node and the algorithm could be stopped once the other vertex is marked as
detected
323 Explanatory Example
Here is a simple network to illustrate the mechanism of Dijstrarsquos Algorithm There are
five vertices and six edges with distance values labeled beside We define A as the source
and set it the initial node
Figure 2 A simple network for Dijstrrarsquoa Algorithm explanation
25
Initialization
Initial node A
Detected null
Distance value A=0 B=C=D=E=+infin
Loop 1
Current node A
Adjacent vertices B C
Detected null
Distance value A=0 B=4 C=1 D=E=+infin
Loop 2
Current node C
Adjacent vertices B D
Detected A
Distance value A=0 C=1 B=min 4 C+2 =3 D=C+3=4 E=+infin
Loop 3
Current node B
Adjacent vertices E
Detected A C
Distance value A=0 C=1 B=3 D=4 E=B+3=6
Loop 4
Current node E
Adjacent vertices null
Detected A B C D
Distance value A=0 C=1 B=3 D=4 E=6
If we want to get the shortest path from A to E following the detecting process we could
know that it should be A-C-B-E
26
324 Discussion
Dijkstrarsquos Algorithm has a clear logical structure which makes it easy to understand as
well as to implement in programming Nonetheless this method cannot search directly
from one node towards the other to find the shortest path between the two It works more
like detecting all the adjacent nodes in terms of shortest paths and expands from the
source iteratively until the target node is included and that is when we could figure out
the shortest path between the two specific vertices This reveals the fact that the method
wastes a lot of time in the blind search leaving it inefficient In addition this method is
not able to deal with networks with negative edge values yet this is not a problem in our
research since link cost on our network is defined nonnegative
33 Indirect Inference
331 Introduction
For problems in route choice context choice set size may be way too large to enumerate
all the alternatives Yet estimation based on sampled choice set may introduce biases
which can be corrected in some special cases (see Frejinger Bierlaire amp Ben-Akiva
2009)33 While in cases where estimation models are not based on MNL say multinomial
probit model we could not find corrections for biases caused by sampled choice set
Estimator based on the principle of indirect inference is then introduced to overcome
inconsistency problem34
Indirect inference35 is a simulation-based method for estimating parameters in economic
models by making references to the parameters of interest (Smith 2008) It is motivated
when general statistical estimation method such as Maximum Likelihood is intractable or
as discussed above consistent estimation is required given that only sampled choice set is
available Since in economic analysis we tend to build models which guarantee scientific
logic and inclusion of necessary attributes quite often the models will end up
33 Frejinger E Bierlaire M amp Ben-Akiva M (2009) Sampling of Alternatives for Route Choice Modeling 34 Karlstroumlm A Sundberg M amp Wang Q (2011) Consistently estimating flexible route choice models using an MNL lense 35 Smith A (2008) Indirect Inference In S Durlauf amp L Blume (Eds) The New Palgrave Dictionary of Economics (Second ed) Palgrave Macmillan
27
complicated from statistical estimation point of view This in sequence spurs the wide use
of indirect inference in economic analysis
It is common character that simulation-based methods allows modelers to simulate data
from the economic model of interest given certain perceived values of the parameters to
be estimated Since to generate data is essential and simple the true challenge is how to
estimate coefficients Indirect inference uses an auxiliary model which gives a rich
description of the covariance patterns in the data by including certain variables from the
basic economic model On the other hand the auxiliary model does not need to reflect
accurately the data generating process since it is supposed to be estimated based on the
data derived not to generate data itself The basic function of the auxiliary model is that
it provides a criterion to compare observed data and simulated data from the basic
economics model
We do iterations with the aim of finding the parameters of the basic economic model so
the observed data and the simulated data from the basic model looks almost the same by
the criterion of auxiliary model To be specific the auxiliary model is estimated based on
both observed data and simulated data we choose parameters for the basic model to
make sure that the two estimator of auxiliary model are as close as possible Based on
this idea the auxiliary model should be easy to estimate
332 Definition of the method
We define an economic model with the form of
( ) 12t t ty G x t Tε β= = (9)
in which 1 Tt tx = is a sequence of observed exogenous variables 1 T
t ty = is a sequence of
observed endogenous variables and 1 Tt tε = is a sequence of unobserved random error
terms β is a k -dimensional coefficient vector of the exogenous variables (Smith
2008)36
This model generally describes a relation that ty is dependent ontx with some random
errors Given the distribution of the random errors we could get the probability density
36 Smith A (2008) Indirect Inference
28
function of ty conditional on tx We will not focus on this density and instead this model
is only used for simulating data in indirect inference
In terms of the auxiliary model it could be defined by a probability density function with
the form of
( | )t tf y x θ (10)
in which θ is a p -dimensional coefficient vector and p is supposed to be not smaller
than k since we should capture characteristics of all the parameters in the underlying
economic model In addition the auxiliary model needs not be defined to reproduce the
distribution of ty in the basic model yet it needs to have a convenient analytical format
Based on the observed data we could estimate the parameters in the auxiliary model
using Maximum Likelihood Method
ɵ
1
arg max log ( | )T
t tt
f y xθ
θ θ=
= sum (11)
The estimated coefficient vectorɵθ could be used as an indicator of certain features of the
observed data
On the other hand the auxiliary model can be estimated based on simulated data from the
basic model as well We need to draw a sequence of random error terms 1 m Tt tε = from the
defined distribution in which m denotes the number of simulation with an interval of [1
M ] generally Given a coefficient vectorβ we could generate the values of endogenous
variables ɶ 1 ( )m T
tty β = which are explicitly dependent onβ With the help of Maximum
Likelihood Method we could get
ɶ ɶ
1 1
( ) arg max log ( ( ) | )M T m
ttm t
f y xθ
θ β β θ= =
= sumsum (12)
According to the principle of indirect inference we try to find the values of β to make
ɶ( )θ β as close toɵθ as possible Practically we need a metric to measure the distance
between ɵθ andɶ( )θ β and by minimizing the distance we could find out the estimates of
β in the basic economic model
29
333 Choices of the metrics
As mentioned above we need a metric to measure the distance betweenɵθ andɶ( )θ β
There are three approaches corresponding to the three classical hypothesis tests namely
Wald likelihood ratio (LR) and Lagrange multiplier (LM)37
In the Wald approach we try to minimize a quadratic form in the difference between the
two estimators ofɵθ andɶ( )θ β which is
ɵ ɶ ɵ ɶarg min( ( )) ( ( ))Wald
Wβ
β θ θ β θ θ β= minus minus (13)
in which W is a positive definite ldquoweightingrdquo matrix
In the LR approach a metric is formed based on the likelihood function related to the
auxiliary model which is
ɵ ɶ
1 1
arg min( log ( | ) log ( | ( )))T TLR
t t t tt t
f y x f y xβ
β θ θ β= =
= minussum sum (14)
According to the definition ofɵθ the first part of the objective function before the minus
sign on the right-hand side is always larger than the second part after the minus sign And
the first part is not dependent onβ
To minimize the objective function is equivalent to maximizing the log-likelihood
function withɶ( )θ β that is
ɶ
1
arg max( log ( | ( )))TLR
t tt
f y xβ
β θ β=
= sum (15)
In the LM approach the metric is formed using the derivative of the log-likelihood
function related to the auxiliary model which is
arg min ( ) ( )LM
S VSβ
β β β= (16)
in which
ɶ ɵ
1 1
( ) log ( ( ) | )M T m
ttm t
S f y xβ β θθ= =
part=partsumsum
(17)
and V is a positive definite matrix
37 Smith A (2008) Indirect Inference
30
By using any of the approaches we aim at getting the minimized distance betweenɵθ and
ɶ( )θ β so the value will approach to zero as expected So the hypothesis test of the
minimized value could be used as an indicator of whether the auxiliary model is suitably
specified In other words the minimized value being significantly different from zero
indicates a bad specification of the auxiliary model
In comparison the LM approach has an advantage over the others in computation when
it is relatively time-consuming to estimate the auxiliary model
334 Consistency Interpretation
Suppose the observed sample size T grows large while total number of simulations stays
fixed as M the estimator based on simulated data ɶ( )θ β will converge to a pseudo-true
value denoted as( )h β which is also dependent onβ This is called binding function
which characterized the relationship between the coefficients in the basic model and the
auxiliary model At the same time the estimator based on observed data ɵθ will converge
to a pseudo-true value0θ In case that T grows to a large number the aim of indirect
inference changes to finding β that guarantees0 ( )hθ β= This could explain that indirect
inference gives consistent estimate of the parameters in the basic economic model
In this project the binding function is what we focus on to get the correct estimates
instead of finding certain metrics Detailed methods will be discussed in the following
part
34 Model Specification in the Thesis
341 Basic Route Choice Model
Based on all the methods mentioned in previous sections the specification of models and
methods we use in the thesis will be explained in this section Since we are to estimate
the model based on true observations no model is known beforehand to adjust to the data
we use Several formulations of the model have been tested in the thesis The one
explained here could be seen as an example and all the other trials contain modifications
based on this model The other specifications of model will be explained along with the
results in the result section
31
We start by describing the underlying route choice model of interest38 We need to define
a road network as a representation of a real-size one from which we collected the trip
data The network denoted asN consists of a set of nodes (vertices) v and links (edges)
l Each link has a source node ( )s l and a target node or a destination node( )d l which
together indicate the direction of the link A path from an origin node ov to a destination
node dv could be seen as a sequence of links1 nl lhellip of which 1( ) os l v= 1( ) ( )i id l s l +=
and ( ) dnd l v= So a path can be defined by the index of links which is 1 nl lπ = hellip
A vector of characteristics denoted aslx is associated to each link as well as a strictly
positive cost function( )l lic x ε β in which liε is an individual specific random link cost
with i denoting the individual and β is a vector of coefficients of the link characteristics
left to be estimated In the Indirect Inference context we need an auxiliary model with
easily-estimated analytical form yet there is no such requirement for the basic model
Although not necessary we assume that the cost function has a linear deterministic form
the deterministic part and the random part are additively separable So we have the cost
function as
( ) Tl li l lic x xε β β ε= + (18)
In addition one important assumption is that the link cost is additive which means that
the cost of a path can be attained by the sum of all the link costs along the path This way
we have the cost of a path π as
( ) ( )l lil
C c xπ
π ε βisin
=sum (19)
We focus on the path-based model which means that the individuals choose among all
possible paths As defined above this turns out to be a random utility choice model As
indicated by the standard assumptions of this kind of models choice makers are assumed
to know both the link characteristics and their idiosyncratic random utility liε associated
to each link Since the choice makers maximize their utility this means that they will
choose the path with the lowest generalized cost in this model This way we have the
choice of individual i as
38 Karlstroumlm A Sundberg M amp Wang Q (2011) Consistently estimating flexible route choice models using an MNL lense
32
( )
arg min ( )o di i
iv v
Cπ
π πisinΩ
= (20)
in which oiv denotes the origin point of the trip for individual i and d
iv denotes the
destination ( )o di iv vΩ denotes all possible paths connecting the origin and destination in
the network for individual i which forms the choice set for the individual
When implementing the model we assume that the random utility component liε follows
a truncated normal distribution To be specific liε follows a standard normal distribution
yet with only the positive values retrieved This way we could guarantee that the link
costs are always positive so that additively the path would not have infinite loops With
this feature of the random component we could say that our model is probit-like Based
on this assumption the prerequisite of Dijkstrarsquos Algorithm is satisfied which always
needs positive edge values on the network We can use the Dijkstrarsquos Algorithm to find
the shortest paths iπ as an intermediate step in the implementation Apart from this we
assume that the unobserved cost captured by the random term is proportional to the
length of link To embody this in the cost function we add a fixed scale parameter to the
random term with a form of ( )Length l Lengthx Mean x in which ( )LengthMean x is the average
length of links in the network
We will assume that the data consists of J paths as dependent variables which means
that the dependent variables for the choice model are 1 Ji iy π == In addition the observed
characteristics of links in the network are provided 1 Ll lx x == To be specific we choose
to use two attributes of the links namely the length of the links Lengthx and the dummy
variable indicating the presence of speed bumps on the links SBx The cost function then
is specified as
( ) ( )l li Length Length l SB SB l li Length l Lengthc x x x x Mean xε β β ε= + + sdot (21)
Now the objective is to estimate the parametersβ in the model for which we will make
use of an auxiliary model
33
342 Auxiliary Model
Based on the idea of Indirect Inference we treat the route choice model defined above as
the basic model of interest which might have complex formation and be difficult to
estimate directly Then we need an auxiliary model to form a criterion which takes into
certain aspects of data to focus the analysis The auxiliary model needs not to reflect the
data generating process exactly as in the basic model yet it needs to include attributes of
interest in order for reference and to be easy to estimate We choose to use a logit model
for route choice as the auxiliary model since the logit model has always been a useful
tool for discrete choice analysis thanks to its analytical form and there is software for
estimating logit models which ensures that we can estimate very efficiently
As to the auxiliary model it is chosen to be a logit model for route choice We consider
that each individual i is choosing from a set of alternative routesr Each route r is given
a utility of riU
- Tri r ri r riU V Xε θ ε= + = + (22)
in which θ is the vector of auxiliary parameters which gives inference to the parameters
in the basic model One thing to be mentioned is that as expected the coefficients in the
utility function should have negative signs To make it easier for comparison with the
coefficients in the basic route choice model we assume the sign of θ to be positive per
se and add a negative sign ahead of it to guarantee that the coefficient part is negative as a
whole rX denotes route characteristics and riε is the random utility for each individual
which is assumed to follow an iid (independently identically distributed) Gumbel
distribution following the standard assumption of logit models
Note that as required for the auxiliary model it should be flexible enough to capture the
variability in the data and thus contains no fewer attributes than the basic model39 In
order to infer the parameters in the basic model and in consideration of efficiency we
pick the same attributes of interest in the basic models which are the link length Lengthx
and the speed bump dummy variableSBx So the utility function turns out to be
- -ri Length Length r SB SB r riU x xθ θ ε= + (23)
39 Karlstroumlm A Sundberg M amp Wang Q (2011) Consistently estimating flexible route choice models using an MNL lense
34
The probability of individual i choosing path r given an individual specific choice set
( )iI o d is
( )
ri
si
i
V
ri V
s I o d
eP
eisin
=sum
(24)
Theoretically we allow the individuals to choose from all possible paths between the
origin and destination in the network which intuitively could be infinite and impossible
to enumerate When implementing the model we generate the individual choice set based
on the basic route choice model Through simulation of the basic model we generate
infinite unique shortest paths for all the unique OD pairs by redrawing the random link
cost liε Without loss of generality the number of paths generated would be big enough
with fully consideration of efficiency We name the finite choice set composed by the
shortest paths generated as the pseudo-universal choice set ( )I o d which is a sample of
the infinite universal choice set The individual specific choice sets are generated by
randomly drawing certain number of paths out of the pseudo-universal choice set And
the size of individual specific choice set could be equal to or smaller than that of the
pseudo-universal one
The resulting individual specific choice set ( )iI o d describes a finite subset of all possible
paths connecting the origin oand destinationd for individuali When implementing the
methods the way of generating the choice set ( )iI o d for each individual i is viewed as
part of the auxiliary model
After the auxiliary model is built it could be estimated using a Maximum Likelihood
estimator based on the observed data of individual choices y and attributes variablesx
for individual 1 i N= hellip The estimate of parameters in the auxiliary model is
ɵ arg max ( )L y xθ
θ θ= (25)
in which ( )L y x θ is the log-likelihood function for the auxiliary model
Given the data of the link attributes xand some random draws of structural parameters
mβ 1 m M= hellip we can simulate choice data through the basic route choice model With
M draws of β from some given density we could simulate M sets of data resulting in
35
simulated choicesɶ( )my β Same as before parameters θ in the auxiliary model can be
estimated based on the simulated data as
ɶ ɶ( ) arg max ( ( ) )m m mL y xθ
θ β β θ= (26)
As the process indicated the simulated choice data depends on the structural parameterβ
in the basic route choice model and in sequence the estimates of parameters θ in the
auxiliary model depends on β when estimated based on the simulated data Based on
this theoretically we have a relationship of ( )θ β referred to as the binding function in
indirect inference literatures which we will discuss in detail for implementation of model
in this thesis A metric is then chosen to measure the distance between the observed and
simulated data viewed by the auxiliary model as a way to indirectly infer the values of
parameters β in the basic model To be specific for each draw of the structural parameter
mβ we can get the estimates of ɶ ( )m mθ β based on the simulated data and the distance
between ɶ ( )m mθ β and ɵθ measured by the chosen metric By doing more iteration with the
aim of minimizing the distance we will get the value of mβ which spurs the ɶ ( )m mθ β
closest toɵθ and this mβ is the inferred estimates of the parameter in the basic model
343 Consistency Discussion
The process of indirectly estimating parameters in the basic model is described above yet
we need to know whether the method we provide gives consistent estimation Here are
some discussions explaining the consistency in estimating by which consistency of the
estimator we proposed is illustrated
As proved the multinomial logit model (MNL) can be estimated consistently based on a
subset of alternatives (McFadden 1978)40 We may need to use the classical conditional
maximum likelihood estimator to deal with the problem at the same time the probability
that an individual n chooses an alternative i conditional on the subset of alternatives
denoted asnc becomes the conditional probability
40 McFadden D (1978) Modeling the Choice of Residential Location In A Karlqvist L Lundqvist F Snickars amp J Weibull (Ed) Spatial Interaction Theory and Residential Location (pp 75-96) Amsterdam North-Holland
36
ln ( | )
ln ( | )( | )in n
jn n
n
V q c i
n V q c j
j c
eP i c
e
micro
micro
+
+
isin
=sum
(27)
in which micro is a scale parameter and inV is the deterministic part of the utility There is a
term ln ( | )nq c j for correcting the sampling bias in which ( | )nq c j denotes the probability
of sampling nc given that alternative j is chosen
If all the alternatives in the choice set have the same probability to be chosen into the
subset the estimation on the subset of alternatives is equivalent to that on the full choice
set To be specific in this case ( | )nq c i is equal to ( | )n nq c j j cforall isin so by calculation the
term for sampling bias correction will cancel out in the probability function
In route choice context the alternative paths between an origin and a destination may be
in large amount and it is inefficient to give some very long-distance paths the same
probability as those short and attractive ones This means that we may need the
importance sampling method when generating subsets of alternatives which selects
attractive alternatives with higher probability than unattractive ones And the correction
term does not cancel out in this case Note that if alternative specific constants are
estimated we can get unbiased estimates of all the parameters except the constants even
if the correction term is not included in the utility function (Manski amp Lerman 1977)41
Back to the route choice context we tend to use large number of alternatives even with
subset of the full choice set which means that it is generally impossible to estimate the
constants and thus the correction term is essential To solve this problem Frejinger et al
(2009) developed a sampling approach in the context of route choice42
The discussion above focuses on the usage of MNL for route choice modeling When it
comes to our method the individual specific choice set is generated by randomly drawing
alternatives from the pseudo-universal choice set with the same probability yet there is
bias when generating the pseudo-universal ones since the pseudo-universal choice set is
composed of certain number of shortest paths between two nodes and this generating
process gives some paths higher probability to be included into the choice set So we
41 Manski C amp Lerman S (1977) The Estimation of Choice Probabilities from Choice Based Samples Econometrica 45 (8) 1977-1988 42 Frejinger E Bierlaire M amp Ben-Akiva M (2009) Sampling of Alternatives for Route Choice Modeling
37
actually use importance sampling to get the choice set which may consequently
introduce bias in estimating the parameterθ in the auxiliary model as discussed above
With the idea of indirect inference we consider only the relationship between θ andβ
denoted as( )θ β and use this relation to infer the value ofβ From this point of view
whether θ is estimated with bias or not does not matter since the relation between it and
β could always be captured which is the specific thing we focus on using the method of
indirect inference So we can say that even with biased subset of alternatives we could
still get consistent estimation by using indirect inference
344 Binding Function
As discussed in indirect inference method section when the sample size N increases
which means that we have more observations of choice the estimated parameter in the
auxiliary modelɶ ( )m mθ β will converge to a stable value ( )mθ β which is often referred
to as the binding function
Given that route choice model deals with discrete choices and by using indirect inference
we have a discrete choice model as the auxiliary model as well the estimates of binding
function ( )mθ β will inherit the discontinuous feature due to discrete individual choices
ɶ( )my β Keane and Smith (2003) proposed a solution of using logit-smoothing on the
simulated dependent choice data43 Following this idea we assume a continuous binding
functionɶ( )θ β for simplicity which could be approximated by a linear function locally
within small intervals With the M randomly drawn values of mβ and the corresponding
estimated parameters ɶ ( )m mθ β in the auxiliary model we could perform an Ordinary
Least Square (OLS) regression to estimate the local approximation of binding function
ɶ( ) c Dθ β β= + (28)
in which cdenotes the constant vector and D denotes the OLS parameter matrix44 To be
specific in our case each parameter in the auxiliary model will have a restriction
function with regard to both parameters in the basic model which is
43 Keane M amp Smith A (2003) Generalized Indirect Inference for Discrete Choice Models 44 Karlstroumlm A Sundberg M amp Wang Q (2011) Consistently estimating flexible route choice models using an MNL lense
38
ɶ1 11 12( )Length Length SBc d dθ β β β= + +
(29)
ɶ2 21 22( )SB Length SBc d dθ β β β= + +
(30)
Based on the observed data of choices y and explanatory variables xand the estimated
binding function which indicates the restrictions between ɶθ andβ we could use the
maximum likelihood method to give estimation of the parameters of interest The
likelihood ratio approach to indirect inference is following ideas of Smith (1993)45 and
Keane and Smith (2003)46
ɶ=arg max ( ( ))L y xβ
β θ β (31)
in which β is the estimate of the parameter of interest β in the basic economic model
With the restriction of binding function this is actually an indirectly inferred estimate In
line with the estimating process in auxiliary model ( )L sdot is the likelihood function of the
auxiliary model
Note that the form of binding function is based on an assumption in the result part we
will verify that this assumption is realistic
45 Smith A (1993) Estimating Nonlinear Time-series Models Using Simulated Vector Autoregressions 46 Keane M amp Smith A (2003) Generalized Indirect Inference for Discrete Choice Models
39
4 Data
41 Road Network
The data we use for estimation is based on a GPS data set collected in the Swedish city of
Borlaumlnge Borlaumlnge is located in the middle part of Sweden and has a population of about
47 000 inhabitants
The virtual road network contains 3077 nodes and 7459 unidirectional links (Frejinger amp
Bierlaire 2007)47 of which 3061 nodes and 7288 links are included in the network for
estimation Figure 3 gives a visual illustration of the road network in Borlaumlnge
Figure 3 Illustration of the Borlaumlnge road network
With regard to our research two of the link attributes are included namely link length
and speed bump dummy Link length is in the unit of km and speed bump dummy is an
indication of speed bump existence on the links which has the value 1 when there is a
speed bump on the link and 0 otherwise
Link length
47 Frejinger E amp Bierlaire M (2007) Capturing Correlation with Subnetworks in Route Choice Models
40
Some descriptive statistics of the link length data for the whole network is presented in
Table 1 below
Table 1 Descriptive statistics of link length
Number of links 7288
Minimum 0001
Maximum 7599
Mean 0184487
Median 0102
Variance 0103722
Lexis ratio (varmean) 1016884
Skewness 9871144
To describe the overall character of the link length attribute the histogram is shown in
Figure 4 below
Figure 4 Histogram of link length data
We could see that the link length data is quite clustered most of which lies within the
range of 01km and 06km Nonetheless there are some extreme values far away from the
range indicating extremely long links To display the variation in the relatively clustered
area we draw a histogram zoomed in the interval of (0 1km] shown Figure 5 in below
0
01
02
03
04
05
06
Fre
qu
en
cy
Link length (km)
Histogram
41
Figure 5 Histogram of link length data (zoomed within 1km)
Over 80 of all the links have length shorter than 03 km indicating concentration of
link length data
Speed bump dummy
Speed bump dummy is based on true situation in the network Of all the links 82 links
are equipped with speed bumps which account for a percentage of 113 The following
Figure 6 displays the locations of links with speed bumps
Figure 6 Illustration of links with speed bumps
0005
01015
02025
03035
04045
05
Fre
qu
en
cy
Link length (km)
Histogram(zoom in)
42
42 Observation Data
The GPS data set is collected as a part of the Swedish Intelligent Speed Adaptation (ISA)
study which aims at traffic safety effects of in-car information systems In the study 186
vehicles were equipped with GPS devices and traced within a radius of 25 km from the
center of Borlaumlnge The monitoring lasted for 30 days from 22th June 2000 to 4th March
2002 obtaining 49 667 vehicle days of travel and nearly a quarter of a million trips (for
more information on the GPS data set check Axhausen Schoumlnfelder Wolf Oliveira amp
Samaga 2003 Schoumlnfelder amp Samaga 2003 Schoumlnfelder Axhausen Antille amp Bierlaire
2002)48
The data collection is not originally designed for route choice analysis so the raw data
cannot be used in our research directly Extensive data processing is performed by the
company GeoStats in Atlanta to retrieve new data set available for route choice analysis
which contains 24 vehicles and 16 035 observations The final data set we use is provided
by Emma Frejinger which contains in total 1832 observations corresponding to 1458
observed unique routes made by 24 vehicles and 1409 unique origin-destination pairs
Considering that certain route may have been observed more than once we make a
distinction between observations and unique routes and number of unique routes should
be less than that of observations consistently with the numbers listed above
As indicated by data collection in the ISA study only licensed drivers with access to his
or her only car are recruited to minimize sharing or swapping of cars Minimum socio-
economic data of the drivers is included in data collection so we have no way to
understand driver characteristics from the data set Logically we make an assumption
that there is only one individual per vehicle
In the observation data a route is represented by a series of links and also an origin-
destination pair With relatively intensively distributed link length number of links could
48 Axhausen K Schoumlnfelder S Wolf J Oliveira M amp Samaga U (2003) 80 Weeks of GPS Traces Approaches to Enriching the Trip Information Transportation Research Record 1870 46-54 Schoumlnfelder S amp Samaga U (2003) Where Do You Want to Go Today-More Observations on Daily Mobility Third Swiss Transport Research Conference Ascona Schoumlnfelder S Axhausen K Antille N amp Bierlaire M (2002) Exploring the Potentials of Automatically Collected GPS Data for Travel Behaviour Analysis- A Swedish Data Source In J Moumlltgen amp A Wytzisk (Ed) GI-Technologien fuumlr Verkehr und Logistik number 13 Institut fuumlr Geoinformatik Universitaumlt Muumlnster (pp 155-179) Munster IfGIprints
43
be used to indicate total length of routes Some of the descriptive statistics of link number
is shown in Table 2 below
Table 2 Descriptive statistics of link numbers in observation data set
Number of observations 1832
Minimum 5
Maximum 106
Mean 202877
Median 16
Variance 1871968
Lexis ratio (varmean) 9227126
Skewness 1732597
For further overall inspection of link number distribution in the observation data set the
histogram is shown in Figure 7 below
Figure 7 Histogram of link numbers in observations data set
Seen from the histogram distribution of number of links is relatively dispersed with a
large range interval Judging by the statistics in general the routes observed have about
000
200
400
600
800
1000
1200
1400
1600
5 8
11
14
17
20
23
26
29
32
35
38
41
44
47
50
53
56
59
62
65
68
71
74
77
80
83
86
89
92
95
98
10
1
10
4
10
7
Mo
re
Fre
qu
en
cy
Number of links
Histogram
44
20 links in average Yet the data has a big variance which is reasonable As stated above
there are 1409 unique OD pairs for 1832 observations indicating that for most OD pairs
there is only one observation Spread within the detecting area different OD pairs could
have various numbers of links in between
Following our experiment design only a portion of the data could be used To be specific
routes with number of links fewer than ten would be eliminated when used for estimation
43 Further Exploration of data
Apart from the characters discussed above there are some other attributes in the data set
interesting to be explored Both in link attribute data set and observation data set there is
travel time data which to some extent is parallel with length in indicating distance
between two nodes
In the link attribute data set one attribute is denotes the estimated travel time of links in
unit of hour Some of the descriptive statistics is shown in Table 3 below switching unit
to minute
Table 3 Descriptive statistics of estimated travel time on links
Number of links 7288
Minimum 000186
Maximum 578268
Mean 0281696
Median 018744
Variance 0119337
Lexis ratio (varmean) 0423638
Skewness 5785361
Seen from Table 3 estimated travel time seems to have a more clustered distribution than
link length judging by lexis ratio and skewness Yet this time is roughly estimated not so
qualified as link length to use in estimation since the latter is much easier to measure and
guarantee precision
In the observation data set we have the duration time of the observations in the unit of
minute Some of the descriptive statistics is shown in Table 4 below
45
Table 4 Descriptive statistics of duration of trips
Number of observations 1832
Minimum 007
Maximum 316
Mean 4991195
Median 3925
Variance 1775639
Lexis ratio (varmean) 3557542
Skewness 2174728
Duration of trips can be used as an indication of distance between origin and destination
yet it is roughly measured and strongly affected by traffic condition on the road network
With similar reasons as discussed on estimated travel time on link we use number of
links instead of duration of trips to indicate the distance between OD pairs
46
5 Experiment Design
When doing the simulation-based estimation it is physically divided into two parts for
convenience of operation As discussed in the method section we choose to use a pseudo-
universal choice set which is generated and stored in the first part and ready for use in
the following experiment Then in the second part we do the simulation-based
experiment to carry out indirect inference method for estimating the parameters of
interest in the basic model β to be specific The Figure 8 below illustrates an abstracted
flow of how the estimation is carried out given certain origin-destination pair
Figure 8 Illustration of the flow in the experiment
As shown in the flow chart we get all the unique OD pairs in the trip data For each of
the OD pairs the Dijkstrarsquos algorithm is used to find the shortest paths between them
without duplicates We set the intended number of paths to be 400 as well as time
terminator in case not enough paths could be generated within certain bearable time
47
interval The generated paths form the pseudo-universal choice set of each OD pair
which is stored for future use Note that we abandon some OD pairs with too few paths
in the pseudo-universal choice set Observations containing the kept OD pairs are used
for following estimation which turns out to be 940 of them
For the OD pair in a given observation 200 alternatives are randomly drawn from the
pseudo-universal choice set and the sequential links in the observation itself is read as an
alternative path The 201 paths compose the observed choice set On the other hand a
given value of mβ is drawn from a predefined domainD The shortest path is generated
based on the given mβ as the simulated observation Like in the observed choice set part
200 alternatives are randomly drawn from the pseudo-universal choice set to form the
simulated choice set together with the simulated observation The auxiliary model is
estimated based on the simulated choice set and we could get a set of ɶ( ( ))mm mβ θ β pairs
which will be used to estimate the binding function Based on the binding function and
the observed choice set the parameters in the basic model could be indirectly estimated
The process described above is abstracted with no illustration of iterations Since this is
an experiment based on simulations certain loops of iteration should be carried out to get
statistics of the results
Given observed trip data at first we have no idea of the value of β In the process of
retrieving value ofβ the estimation process is repeated for several stages denoted asS
starting from a rough guess of the domainsD while for each following stage the domain
shrinks Since we tend to use a local OLS regression to approximate the smooth binding
function the draws of smβ need to be around the true value to prevent misspecification of
OLS regression due to the possibly inherent nonlinearity of the binding function The
estimated 0
β is not satisfactory in precision in the first stage yet it could give a hint of
where the true value lies The domain1D is centered on 0
β with smaller interval before
the estimation in the second stage This way +1sD is dependent on sD with smaller
interval As it goes on we will get a more accurate domain and as a result a well specified
OLS regression to approximate the binding function
48
The process of experiment with iterations is described below Suppose that we have the
experiment carried out for K times and the number of observations used isN
for run 1 k K= hellip for true observation 1 i N= hellip
Randomly draw alternatives from the pseudo-universal choice set end Form the observed choice sety for stage 1 s S= hellip
for 1 m M= hellip
Draw ksmβ from the domain ksD
Simulate paths for OD pairs in the used observations with mβ
for simulated observation 1 i N= hellip Randomly draw alternatives from the pseudo-universal choice set end
Form a simulated route choice setɶ( )ksmy β
Estimate ɶ ( )ks ksm mθ β in Equation (26)
end
Estimate ɶ ( )ks
θ β in Equation (28)
Estimate ks
β in Equation (31) end
Center the domain 1k sD + on ks
β and shrink the interval end
As a trial we first do the experiment on a route choice model with one parameter link
length to be specific For simplicity the random term is not scaled as described in the
model specification section which means we attach a truncated normally distributed
random term to the cost function without scaling it with link length After getting the
estimation of Lengthβ we move on to estimating the route choice model with both
parameters as described in the model specification Results under these two formulations
of models are presented separately in the result part
49
6 Results
61 Validation of Binding Function
As discussed in the binding function section we assume the binding function to be
continuous and feasible to be approximated by a linear function locally The assumption
of binding function can be verified based on the ɶ( ( ))mm mβ θ β pairs we attained as
intermediate results To explain this more explicitly we carry out a simple example with
only one parameter in the route choice model Lengthβ to be specific
The cost function is specified as
( )l li Length Length l lic x xε β ε= + (32)
corresponding to which the auxiliary model is
-ri Length Length r riU xθ ε= + (33)
For each run 10 values ofLengthβ are evenly drawn from a given domain By simulating
observations and estimating the auxiliary model 10 corresponding Lengthθ are generated to
form ten ɶ( ( ))mm mβ θ β pairs As assumed the binding functionɶ( )θ β is continuous which
could be approximated by a linear function locally To display the trend of binding
function we choose a relatively large domain for Lengthβ in the beginning [010]D = and
carry out 10 runs which generate 100 points in the beta-theta diagram shown in Figure 9
below
Figure 9 Scatter plots of the 90 beta-theta pairs
y = 12804x + 16264
Rsup2 = 09959
0
2
4
6
8
10
12
14
16
0 2 4 6 8 10
the
ta_
len
gth
beta_length
50
We do OLS regression for the dots and estimate the binding function Intuitively the
smaller the domain is the more accurate is the approximation of the binding function We
shrink the input domain based on the final estimate of Lengthβ from last trial
As it turned out to be we choose an input domain of [1214]D = for Lengthβ and the
binding function is assumed to take the form of
ɶ1 11( )Length Lengthc dθ β β= +
(34)
The result for one run is displayed in Figure 10 below
Figure 10 OLS regression based on the 10 beta-theta points from one run
The estimated binding function based on the 10 points is
ɶ ( ) 17371+10838Length Lengthθ β β= (35)
as indicated by 2 09783R = the function describes the trend of points very well Since
the interval is quite small we could use the estimated function to approximate the
binding function
When it comes to more parameters in the route choice model what we do is simply to
add more elements in the binding function After getting a vector of β and the
corresponding vector ofɶ( )θ β binding functions of each element in vector ɶ( )θ β with
y = 17371x + 10838
Rsup2 = 09783
315
32
325
33
335
34
345
35
355
12 125 13 135 14
the
ta_
len
gth
beta_length
51
regard to all the elements in vector β are estimated One example is shown in the
Equation (29) and Equation (30)
62 Estimation of model with one attribute
The route choice model with one attribute we used is the one described in Section 61
above After several trials by shrinking input interval every time we finally affirm that
the true value Lengthβ of lies in a relatively small interval of [12 14] Based on this
domain 50K = runs are carried out to get statistics of the estimate of Lengthβ As
discussed in the experimental design several stages Smean different trials before final
affirmation of input interval yet for the statistics only one stage is carried out for each
run Within each run 10M = values of input Lengthβ are drawn for estimating binding
function
The estimation statistics of Lengthβ is shown in Table 5 below
Table 5 Statistics of estimation of beta_length
Parameter Lengthβ
Mean 1337353
Standard deviation 0107537
RMSE 0013227
In the table RMSE is the root-mean-square error which is used to measure the distances
between the observed values being estimated and the predicted values by the estimator
The individual differences are called residuals and RMSE is an aggregated measure of
the residuals To be specific
ɵ ɵ ɵ 2( ) ( ) (( ) )RMSE MSE Eθ θ θ θ= = minus (36)
in which ɵθ is the estimator and θ is the parameter to be estimated so the RMSE is the
square root of the mean square error As defined the smaller the value of RMSE is the
better the estimator is
52
Here the RMSE is calculated based on the ten points ɶ( ( ))mm mβ θ β for estimating binding
function so basically it describes the goodness of fit of the estimated binding function
with regard to the points we generated The Equation (36) is specified as
ɶ 2( ( )) (( ( ) ( )) )mm m mRMSE Meanθ β θ β θ β= minus (37)
The value of RMSE displayed in the Table 5 is the mean value of all the RMSE values
for 50 runs Seen from this we have well-estimated binding function for all the 50 runs
on average In terms of the estimates of binding function taking the one in Section 61 as
an example the binding function estimated in the interval of [12 14] in Equation (35)
has a positive constant and a positive coefficient for Lengthβ which indicates that with
larger value of Lengthβ we will get larger value ofɶ Lengthθ and as a result a negative
coefficient for length in the utility function of the logit model This is reasonable for
bigger Lengthβ reveals larger incremental effect on the cost of certain path while lower
ɶ- Lengthθ reveals larger disutility effect on certain path these two effects are in fact
equivalent
By the way the high fitness of binding function is probably due to the relatively small
input interval of Lengthβ after certain trials and shrinkage As the final estimate indicates
Lengthβ falls right into the interval of [12 14] with small standard deviation So we can
say that the estimate is quite good
63 Estimation of model with two attributes
We use the model described in the model specification section to carry out the estimation
Two attributes are used namely length and speed bump dummy Similar to the one
attribute case we carried out several trials and shrinkage to finally determine the
relatively small input intervals forLengthβ and SBβ [05 1] and [0 05] respectively
50K = runs are carried out to get statistics of the estimates of the two parameters Within
each run 10M = values are drawn for inputs Lengthβ and SBβ respectively for estimating
binding function
53
One important thing to mention here is that the inputs are drawn evenly from the domain
yet to guarantee that the values of Lengthβ and SBβ are independent from each other or to
get rid of collinearity49 the domains of two parameters are defined in two dimensions To
explain this more explicitly we choose data of one run as an example The input points of
( Lengthβ SBβ ) are shown in Figure 11 below
Figure 11 Scatter plot of the input values for beta_length and beta_sb
We can see from Figure 11 that the points spread evenly in the domain quadrant Based
on these draws we could estimate the binding function and evaluate the relationship
between parameters in the logit model and Lengthβ and SBβ without worrying about
possible correlation between Lengthβ and SBβ
As discussed before in the binding function we are supposed to find the relationship
between each of the parameters in the logit model and both parameters in the route choice
model Mathematically this binding function should be a surface in the 3D coordinate
system We take the results of one run as an example and thus we have ten sets of Lengthβ
and SBβ along with corresponding ɶ Lengthθ andɶ SBθ
49 A set of points is collinear if they lie on a single straight line or a projective line (for example projective line over any field) and this way the two factors represented by the points are correlated
0
005
01
015
02
025
03
035
04
045
05
05 06 07 08 09 1
be
ta_
sb
beta_length
54
For the first binding function ɶ Lengthθ and ( Lengthβ SBβ ) are plotted in Figure 12 below
And the binding function takes a form as described in Equation (29)
Figure 12 Scatter plot of theta_length with regard to beta_length and beta_sb
By multi-linear regression we can get a surface to approximate the binding function
locally The estimated binding function is displayed in Figure 13 below
Figure 13 Display of the estimated binding function for theta_length
And the first binding function has a formula of
55
ɶ 18234+16933 +00633Length Length SBθ β β= (38)
For the second binding function ɶSBθ and ( Lengthβ SBβ ) are plotted in Figure 14 below
And the binding function takes a form as described in Equation (30)
Figure 14 Scatter plot of theta_sb with regard to beta_length and beta_sb
By multi-linear regression we can get a surface to approximate the binding function
locally The estimated binding function is displayed in Figure 15 below
Figure 15 Display of the estimated binding function for theta_sb
56
And the second binding function has a formula of
ɶ -06698+00371 +17619SB Length SBθ β β= (39)
The t-test of estimated parameters in the binding function is carried out with null
hypothesis of zero Estimates that are significantly different from zero with 95
confidence interval are marked as bold
Table 6 Estimated coefficients of binding function for model with two attributes
Constant Lengthβ SBβ
ɶLengthθ 18234
(43632) 16933
(33481) 00633 (1392)
ɶSBθ -06698
(-7991) 00371 (0366)
17619 (19323)
Seen from the magnitude of coefficients in the binding functions both Lengthβ and SBβ
have positive effect on ɶ Lengthθ andɶ SBθ and in sequence negative effect on the coefficients
in the logit model In addition coefficients of SBβ with regard to ɶ Lengthθ and Lengthβ with
regard to ɶ SBθ are not significantly different from zero so we can say Lengthβ has a more
apparent effect on ɶ Lengthθ than SBβ does while SBβ has a more apparent effect on ɶ SBθ
than Lengthβ does
Based on the estimated binding functions and the true observation data we could get the
estimates of Lengthβ and SBβ as shown in Table 7 below
Table 7 Statistics of estimation of beta_length and beta_sb
Parameter Lengthβ
SBβ
Mean 0761383 0079874
Standard deviation 0068493 0034375
RMSE 0022772 0085113
Seen from the RMSE results the relatively small values indicate that we have well-
estimated binding functions for all the 50 runs on average With regard to the estimates of
parameters in the route choice model both of them fall into the input domain we choose
57
and the standard deviation is quite small So we can say that the estimates are actually
very good
One thing to notice here is that the final estimate of Lengthβ falls approximately in the
middle of the input domain [05 1] while the estimate of SBβ falls closer to the left limit
which might need further shrinkage of input domain and more precise estimate of the
binding function To get rid of this we use the binding function estimate from all the 500
points to give a hint on the reasonability of acceptance of the estimate of SBβ The scatter
plots of theta_sb against beta_sb and beta_length are shown in Figure 16 below
Figure 16 Scatter plots of theta_sb against beta_sb and beta_length
The scatter plots in Figure 16 above are the decompositions of the binding function from
three dimensions to two dimensions Seen from the linear regression in the two plots ɶSBθ
is almost strictly positive proportional to SBβ and hardly effected byLengthβ This means
y = 19132x - 06404
Rsup2 = 0936
-1
-08
-06
-04
-02
0
02
04
06
0 01 02 03 04 05
the
ta_
sb
beta_sb
y = 00123x - 01717
Rsup2 = 4E-05
-1
-08
-06
-04
-02
0
02
04
06
05 06 07 08 09 1
the
ta_
sb
beta_length
58
that by shrinking the input domain ofSBβ we would probably get the same estimate of
binding function since it changes little in current domain And this leads to our
acceptance of the final estimate of SBβ
Given that we have a random cost following a truncated standard normal distribution and
the magnitudes of the estimated parameters are relatively small this would mean that the
randomness of the cost function are relatively large which in sequence leads to relatively
large randomness in individualrsquos choice of route
Another thing to be mentioned is that the magnitude of Lengthβ is smaller than that when
estimated singly Though these two values are not logically comparable with different
formation of random term in the cost function we could still get a hint from the
comparison This difference is probably due to the form of random cost we used which is
( )li Length l Lengthx E xε sdot and the effect of length on the cost is partially captured by this
random term
64 Estimations of other trial formulations of the model
641 Model with exponential form of cost function
During the process of estimation we carried out a lot of other trials in the formulations of
the basic route choice model the cost function to be specific and the auxiliary logit model
As it turned out the there are negative estimates of coefficients in the cost function
which conflicts our anticipation To capture this kind of negative estimation we choose to
use the exponential form of the cost function Without loss of generality the random term
is not scaled by the length of links The cost function is specified as
( ) Length Length l SB SB l lix x
i lic x eβ β εε + += (40)
Two attributes are used namely length and speed bump dummy variable Unlike the form
in Section 63 we allow the parameters Lengthβ and SBβ to have negative input and the
random term liε now follow a standard normal distribution without truncation Since we
take the exponential form of the cost function the cost of links could be kept positive
thus allowing the use of Dijkstrarsquos Algorithm to operate
59
In terms of the auxiliary model since we could have more attributes in the auxiliary
model than the underlying model Instead of using the same attributes as in the cost
function we choose to add an attributes which is number of links in the pathLNx So the
utility function of the logit model is specified as
- - -ri Length Length r SB SB r LN LN r riU x x xθ θ θ ε= + (41)
We still expect the value of θ to be positive and the coefficient of variables with the form
of -θ would be negative
Several trials and shrinkage were carried out for this formulation of our model to finally
determine the relatively small input intervals forLengthβ and SBβ [25 27] and [-05 0]
respectively 15K = runs are carried out to get statistics of the estimates of the two
parameters Within each run 10M = values are drawn for inputs Lengthβ and SBβ
respectively for estimating binding function
To visualize the trend of binding function more clearly we make use all the 150 sets of
vector β and vector θ to estimate the binding function Since we have three variables in
the logit model we have to estimate three binding functions
For the first binding function ɶ Lengthθ and ( Lengthβ SBβ ) are plotted in Figure 17 below
shown along with the estimated binding function
Figure 17 Scatter plot of theta_length against beta_length and beta_sb estimated binding function
The first binding function takes the form of
ɶ 41312+09114 +44845 10Length Length SBθ β βminus= sdot (42)
60
For the second binding function ɶSBθ and ( Lengthβ SBβ ) are plotted in Figure 18 below
shown along with the estimated binding function
Figure 18 Scatter plot of theta_sb against beta_length and beta_sb estimated binding function
The second binding function takes the form of
ɶ 01147 01362 +07119SB Length SBθ β β= minus (43)
For the third binding function ɶ LNθ and ( Lengthβ SBβ ) are plotted in Figure 19 below
shown along with the estimated binding function
Figure 19 Scatter plot of theta_ln against beta_length and beta_sb estimated binding function
The third binding function takes the form of
ɶ 10043 03378 +00068LN Length SBθ β β= minus (44)
The t-test of estimated parameters in the binding function is carried out with null
hypothesis of zero Estimates that are significantly different from zero with 95
confidence interval are marked as bold
61
Table 8 Estimated coefficients of binding functions for model with exponential cost function
Constant Lengthβ SBβ
ɶLengthθ 1312
(2411) 09114 (4360)
4484510-4 (0005)
ɶSBθ 01147
(0425) -01362 (-1314)
07119 (17221)
ɶLNθ 10043
(13767) -03378
(-12051) 00068 (0607)
Same as in the model with two attributes ɶ Lengthθ andɶ SBθ are significantly affected by
Lengthβ and SBβ respectively The negative signs for Lengthβ in the second and third binding
functions draw our attention Since in the second binding function it is not significantly
different from zero we can disregard the effect In the third binding function Lengthβ has
significantly negative effect on ɶ LNθ The larger value of Lengthβ we have the more
influential of path length on cost is With negative effect on ɶ LNθ we can say at the same
time number of links become less influential on the utility This is reasonable since
intuitively if we are sensitive to the path length we wouldnrsquot care too much of having to
switch several more or fewer links based on that path length and number of links are
more or less correlated to each other
Based on the estimated binding functions and the true observation data we could get the
estimates of Lengthβ and SBβ as shown in Table 9 below
Table 9 Statistics of estimation of beta_length and beta_sb in exponential-cost-function model
Parameter Lengthβ
SBβ
Mean 2537672 -045601
Standard deviation 0068377 0133036
We have negative estimate of SBβ which conflicts our assumption that length and
presence of speed bump on the path may increase the cost of traveling through certain
path This is probably due to omission of important attributes in the deterministic part of
the cost function Based on the estimate we are led to think that presence of speed bump
decrease the cost and individuals would prefer to drive on paths with speed bumps Yet
62
this is not true based on our estimation since we are only using two attributes And there
are great chance that some important features are not captured which accidentally are
related with speed bump So the estimate of SBβ is misleading per se in the simple model
as we are using To get more accurate estimate of SBβ we may need to include more
variables in the deterministic part of the cost function
642 Model with estimated scale parameter for random term
Considering the trial with two attributes in Section 63 we add a fixed scale parameter to
the random term to make it proportional to the length of links This appeals to our
assumption yet lays restrictions to the model Apart from this we also try to add an
unfixed scale parameter σ and estimate it along with the other two parameters Lengthβ and
SBβ Note that if we add a scale parameter directly to the random term it wonrsquot work out
as we expect since that way the scale parameter will scale the other two parameters
Lengthβ and SBβ as well as shown below
= ( )Length SBLength Length l SB SB l li Length l SB l lix x x x
β ββ β ε σ σ εσ σ
+ + sdot + + (45)
The right side equation is equivalent to Length Length l SB SB l lix xβ β ε+ + thus making no
difference So we choose to add a new random term including the scale parameter In
addition since we can get good estimate by assuming the random term proportional to
length we will keep this in the newly added random term Now the cost function is
specified as
1 ( ) + ( )l li li Length Length l SB SB l li li Length l Lengthc x x x x Mean xε ε β β ε η σ= + + sdot sdot 2
(46)
liε and liη follow the same truncated normal distribution but are drawn separately so that
they are not equal
In terms of the auxiliary model since now we have three parameters to be estimated in
the underlying model we need one more attribute in the logit model and number of links
in the path LNx is chosen The utility function of the logit model is actually the same as in
Section 641 which is
- - -ri Length Length r SB SB r LN LN r riU x x xθ θ θ ε= + (47)
63
With three parameters in the underlying model it is more reasonable to include
interactions of parameters in the binding function The binding functions take the form of
ɶ
1 2 3
4 5 6 7
( )
Length SB
Length SB Length SB Length SB
c d d d
d d d d
θ β β β σβ β β σ β σ β β σ
= + + +
+ + + + (48)
Since the estimates are not good we did not carry out too many trials to center the input
interval As a result the binding function may be of more interest in this case The chosen
interval is a trial one which is identical [0 3] for Lengthβ SBβ andσ We choose ten sets of
mβ and ɶ ( )m mθ β from one run as an example The values of ɶ ( )m mθ β are plotted against
Lengthβ SBβ andσ respectively The interactions are not shown in the figure yet we have
the estimates of binding function which will give a numerical description of how the
interactions impact theɶ ( )m mθ β
Figure 20 Plots of theta_length against beta_length beta_sb and sigma respectively
y = 09114x + 27818
Rsup2 = 07361
0
1
2
3
4
5
6
0 1 2 3 4
the
ta_
len
gth
beta_length
y = 03568x + 36215
Rsup2 = 00897
0
1
2
3
4
5
6
0 1 2 3 4
the
ta_
len
gth
beta_sb
y = 02572x + 38468
Rsup2 = 00516
0
1
2
3
4
5
6
0 1 2 3
the
ta_
len
gth
sigma
64
Figure 21 Plots of theta_sb against beta_length beta_sb and sigma respectively
y = 02363x + 0835
Rsup2 = 0088
0
05
1
15
2
25
3
0 1 2 3 4
the
ta_
sb
beta_length
y = 06351x + 01759
Rsup2 = 05054
0
05
1
15
2
25
3
0 1 2 3 4
the
ta_
sb
beta_sb
y = -03801x + 17212
Rsup2 = 02001
0
05
1
15
2
25
3
0 1 2 3
the
ta_
len
gth
sigma
y = 00477x + 04521
Rsup2 = 005460
02
04
06
08
1
0 1 2 3 4
the
ta_
ln
beta_length
y = -00553x + 06156
Rsup2 = 00582
0
02
04
06
08
1
0 1 2 3 4
the
ta_
ln
beta_sb
65
Figure 22 Plots of theta_ln against beta_length beta_sb and sigma respectively
As we can see from the three figures above ɶ Lengthθ ɶSBθ and ɶ LNθ are more affected by
Lengthβ SBβ andσ respectively Especially we can see a strong relationship between ɶ LNθ
and σ which assures that number of links can be used to infer the scale parameter in the
underlying model
The estimates of three binding functions are shown in Table 10 below with each row
representing the estimates for one of the three binding function and each column
representing certain variable in the binding function In the parenthesis below each
estimate of the coefficients is the t-test value with the null hypothesis of zero We take the
90 confidence interval and estimates with t-test value larger than 164 are supposed to
be significantly different from zero which are marked as bold
Table 10 Estimates of three binding functions
Constant Lengthβ SBβ σ
Length SBβ β
Lengthβ σ
SBβ σ Length SBβ β σ
ɶLengthθ
1814 (3085)
0861 (2417)
-0089 (-0258)
1038 (2913)
0202 (1030)
-0246 (-1240)
-0056 (-0292)
-0045 (-0412)
ɶSBθ 0284
(1482) -0125
(-1081) 0942
(8371) -0247
(-2127) 0118
(1856) 0070
(1086) -0141
(-2275) -0067
(-1883)
ɶLNθ 0819
(18643) 0015
(0577) -0026
(-0997) -0261
(-9794) 0006
(0419) 0007
(0498) 0024
(1663) -0007
(-0803)
As the constants indicate given no other attributes length and number of links have more
negative effects on the utility than the speed bump dummy does Judging from the
significance of coefficients for the three input parametersɶ Lengthθ ɶSBθ and ɶ LNθ are
significantly affected by Lengthβ SBβ andσ respectively As we can see σ has a negative
y = -02164x + 08218
Rsup2 = 09867
0
02
04
06
08
1
0 1 2 3th
eta
_ln
sigma
66
effect on ɶSBθ andɶ LNθ Since to some extent σ measures the scale of randomness we
could say that the more randomness of the costs on the links have the less influential of
presence of speed bump and number of links become ForɶSBθ it is significantly affected
by some of the interaction terms Notice that SBβ has positive effect onɶSBθ while σ has
effect The interaction terms including both σ and SBβ have negative effect onɶSBθ which
indicates that randomness of cost is more influential than presence of speed bump on the
disutility of speed bump
In terms of the final estimate as stated above the estimates of Lengthβ and SBβ have
negative signs whileσ has positive sign This result conflict our expectation that Lengthβ
and SBβ should have positive signs so we did not carry out more trials and shrinkage The
possible reason for negative estimate is similar to that in the model with exponential form
of cost function Given more attributes in the deterministic part of both the cost function
and utility function in the logit model we might be able to capture the features of the data
better and have the right sign in the final estimates
643 Monte Carlo evidence of model with estimated scale parameter for random
term
Based on the model formulation with estimated scale parameter for random term we also
carried out a Monte Carlo simulation experiment to verify the efficiency of using number
of links in the logti model to infer the scale parameter in the cost function and what we
do is to simulated observations instead of the true ones
We take three arbitrary values for the three parameters in the cost functionLengthβ SBβ and
σ to be 05 And simulated observations are generated based on the given values of
parameters in the cost function Since we know the true values for the parameters the
input domain is centered around the true values to be [04 06] for Lengthβ SBβ andσ
10K = runs are carried out to get statistics of the estimates of the three parameters
Within each run 10M = values are drawn for inputsLengthβ SBβ andσ respectively for
estimating binding function
67
In terms of the binding function by doing regression test we can see that the intersection
terms are unnecessary to be included or even hazardous for good estimate of binding
function so we decide to remove them and keep the binding function as
ɶ1 2 3( ) Length SBc d d dθ β β β σ= + + + (49)
We choose ten sets of mβ and ɶ ( )m mθ β from one run as an example The values of
ɶ ( )m mθ β are plotted againstLengthβ SBβ andσ respectively
Figure 23 Plots of theta_length against beta_length beta_sb and sigma respectively
y = 23826x + 14791
Rsup2 = 05326
15
2
25
3
35
04 05 06
the
ta_
len
gth
beta_length
y = -06434x + 30245
Rsup2 = 0048115
2
25
3
35
04 05 06
the
ta_
len
gth
beta_sb
y = 26255x + 14156
Rsup2 = 07607
15
2
25
3
35
04 05 06
the
ta_
len
gth
sigma
y = -02443x + 04708
Rsup2 = 0034
0
01
02
03
04
05
04 05 06
the
ta_
sb
beta_length
y = 11233x - 02096
Rsup2 = 089020
01
02
03
04
05
04 05 06
the
ta_
sb
beta_sb
68
Figure 24 Plots of theta_sb against beta_length beta_sb and sigma respectively
Figure 25 Plots of theta_ln against beta_length beta_sb and sigma respectively
The figures show similar trend to those in the trial model with estimated scale parameters
which is in line with our expectation
The estimates of three binding functions are shown in Table 11 below with each row
representing the estimates for one of the three binding function and each column
y = -04374x + 056
Rsup2 = 01283
0
01
02
03
04
05
04 05 06
the
ta_
sb
sigma
y = -01144x + 07619
Rsup2 = 01114066
067
068
069
07
071
072
073
074
04 05 06
the
ta_
ln
beta_length
y = 0053x + 06768
Rsup2 = 00296066
067
068
069
07
071
072
073
074
04 05 06
the
ta_
ln
beta_sb
y = -03115x + 08561
Rsup2 = 09717
066
067
068
069
07
071
072
073
074
04 05 06
the
ta_
ln
sigma
69
representing certain variable in the binding function In the parenthesis below each
estimate of the coefficients is the t-test value with the null hypothesis of zero We take the
95 confidence interval and estimates with t-test value larger than 196 are supposed to
be significantly different from zero which are marked as bold
Table 11 Estimates of three binding functions in the Monte Carlo experiment
Constant Lengthβ SBβ σ
ɶLengthθ 0853
(3606) 1009
(3724) -0034
(-0125) 2569
(9482)
ɶSBθ -0062
(-0385) -0104
(-0564) 1208
(6591) -0226
(-1227)
ɶLNθ 0854
(46688) 0013
(0624) -0004
(-0185) -0302
(-14428)
The estimates of binding function have similar characteristics as in the trial model with
estimated scale parameters as well They contain almost the same significant coefficients
and those significant estimates have the same signs as in the trial with true observations
Based on the estimated binding function and the simulated observations given true values
of the three parameters to be 05 the final estimates of Lengthβ SBβ andσ are shown in
Table 12 below
Table 12 Statistics of estimation of beta_length beta_sb and sigma in the Monte Carlo experiment
Parameter Lengthβ
SBβ σ
Mean 0404138359 0458624533 0639191487
Standard deviation 1109279424 0242570421 0377069799
As we can see the estimates of Lengthβ SBβ andσ are quite close to their true values What
is not satisfying is that the estimate of σ is a little large and lies outside the input domain
of [04 06] but is still quite near to this interval In addition the estimate of Lengthβ is
within the input domain yet the variation is large This is understandable since we scale
the random term by length together with the scale parameter and thus the parameter for
length could be influenced by the random term and turns out to have large variations In a
word the result of Monte Carlo experiment verifies that we get use the model
70
formulation with unfixed scale parameter for the random term to get the right estimate of
the true values And number of links is strongly related withσ which means that it is
reasonable and efficient to use it as a reference to σ in the cost function
71
7 Conclusions
This thesis aims at implementing the newly proposed route choice model based on
indirect inference in true observations The model assigns links specific errors for a
network which allows natural correlations among paths and is practical in simulating
observations by means of shortest path searching algorithms like the Dijkstrarsquos Algorithm
used in our experiment To get consistent estimation of this kind of model indirect
inference method is used and a simple model like logit model is used as an auxiliary
model The route choice model and indirect inference estimator has been tested on
synthetic data with simulated observations and proved to be capable of consistently
estimated
Compared to the synthetic experiment some extensions are done in this thesis By
replacing the simulated observations with the true observations the method is tested on
the empirical circumstance to prove that it could be used in solving practical problems
The true observations have more noises than the simulated ones thus more difficulty to
capture their features We know neither the right formulations of models based on the
data nor the values of parameters in the route choice model yet as defined the
parameters should have positive signs As it turned out to be in the experiment with only
length in the model we get the estimates of Lengthβ as 1337 while with two attributes in
the model we get the estimates of Lengthβ and SBβ as 0761 and 00799 respectively The
estimates in both experiments seem reasonable with the right sign In addition seen from
the estimation of the binding function the coefficients in the logit model is negatively
affected by the parameters they infer in the basic route choice model in the two attributes
case one parameter in the logit model is more apparently affected by the parameter it
refers than the other parameter in basic model
In the trial where we include a scale parameter to the random term and estimate it along
with the other parameters in the route choice model a Monte Carlo simulation
experiment is carried out using simulated observations The result shows that it is
efficient to use number of links in the auxiliary model to infer the scale parameter in the
basic rout choice model
72
In other trial formulations of the model we got negative estimates which may probably
be due to missing attributes in the cost function Future work should be done to include
more attributes
Another thing to recommend for future is that we generate the pseudo-universal choice
set as part of the auxiliary model Since the pseudo-universal choice set is partially used
for deciding which ODs and observations to be used in the project it is essential and
should be generated beforehand But from the choice set generation point of view we
could generate individual specific choice set directly instead of random drawing paths
from the pseudo-universal choice set This would increase computational efficiency
73
Bibliography
Axhausen K Schoumlnfelder S Wolf J Oliveira M amp Samaga U (2003) 80 Weeks of
GPS Traces Approaches to Enriching the Trip Information Transportation Research
Record 1870 46-54
Azevedo J Costa M Madeira J amp Martins E (1993) An Algorithm for the Ranking
of Shortest Paths European Journal of Operational Research 69 (1) 97-106
Bartels K Boztug Y amp Muumlller M (1999) Testing the Multinomial Logit Model
Working paper University Potsdam Germany
Bekhor S Ben-Akiva M amp Ramming M (2002) Adaptation of Logit Kernel to Route
Choice Situation Transportation Research Board of the National Academics 1805 78-85
Bekhor S Ben-Akiva M amp Ramming M (2006) Evaluation of Choice Set Generation
Algorithms for Route Choice Models Annals of Operations Research 114 (1) 235-247
Ben-Akiva M amp Bierlaire M (1999) Discrete Choice Methods and Their Applications
to Short Term Travel Decisions In Chapter for the Transport Science Handbook
Preliminary Draft
Ben-Akiva M amp Bierlaire M (2003) Discrete Choice Models with Applications to
Departure Time and Route Choice In Handbook of Transportation Science (second ed)
Kluwer
Ben-Akiva M amp Bolduc D (1996) Multinomial Probit with a Logit Kernel and a
General Parametric Specification of the Covariance Structure Working Paper
Ben-Akiva M amp Lerman S (1985) Discrete Choice Analysis Theory and Application
to Travel Demand MIT Press
Ben-Akiva M Bergman M Daly A amp Ramaswamy R (1984) Modeling Inter Urban
Route Choice Behaviour In J Vollmuller amp R Hamerslag (Ed) the 9th International
Symposium on Transportation and Traffic Theory (pp 299-330) Utrecht Netherlands
VNU Science Press
Cascetta E Nuzzolo A Russo F amp Vitetta A (1996) A Modified Logit Route Choice
Model Overcoming Path Overlapping ProblemsSpecification and Some Calibration
Results for Interurban Networks In J Lesort (Ed) the 13th International Symposium on
Transportation and Traffic Theory Lyon France
74
Creel M (2009) A Data Mining Approach to Indirect Inference Universitat Autonoma
de Barcelona Department of Economics and Economic History
De La Barra T Peacuterez B amp Anez J (1993) Multidimensional Path Search and
Assignment 21st PTRC Summer Meeting (pp 307-319)
Dijkstra E (1959) A note on two problems in connexion with graphs Numerische
Mathematik 1 269-271
Frejinger E amp Bierlaire M (2007) Capturing Correlation with Subnetworks in Route
Choice Models Transportation Research Part B 41 363-378
Frejinger E Bierlaire M amp Ben-Akiva M (2009) Sampling of Alternatives for Route
Choice Modeling Transportation Research Part B Methodological 43 (10) 984-994
Gallant A amp McCulloch R (2004) On the Determination of General Scientific Models
Manuscript Duke University
Gourieacuteroux C Monfort A amp Renault E (1993) Indirect Inference Journal of Applied
Econometrics 8 85-118
Karlstroumlm A Sundberg M amp Wang Q (2011) Consistently estimating flexible route
choice models using an MNL lense International Choice Modeling Conference Leeds
Keane M amp Smith A (2003) Generalized Indirect Inference for Discrete Choice
Models Manuscript Yale University
Manski C amp Lerman S (1977) The Estimation of Choice Probabilities from Choice
Based Samples Econometrica 45 (8) 1977-1988
McFadden D (1974) Conditional Logit Analysis of Qualitative Choice Behaviour (P
Zarembka Ed) Frontiers in Econometrics 105-142
McFadden D (1978) Modeling the Choice of Residential Location In A Karlqvist L
Lundqvist F Snickars amp J Weibull (Ed) Spatial Interaction Theory and Residential
Location (pp 75-96) Amsterdam North-Holland
McFadden D amp Train K (2000) Mixed MNL Models for Discrete Response Journal
of Applied Econometrics
Nerella S amp Bhat C (2004) Numerical Analysis of Effect of Sampling of Alternatives
in Discrete Choice Models Transportation Research Record 1894 11-19
Ramming M (2001) Network Knowledge and Route Choice PhD Thesis Massachusetts
Institute of Technology
75
Schoumlnfelder S amp Samaga U (2003) Where Do You Want to Go Today-More
Observations on Daily Mobility Third Swiss Transport Research Conference Ascona
Schoumlnfelder S Axhausen K Antille N amp Bierlaire M (2002) Exploring the
Potentials of Automatically Collected GPS Data for Travel Behaviour Analysis- A
Swedish Data Source i J Moumlltgen amp A Wytzisk (Red) GI-Technologien fuumlr Verkehr
und Logistik number 13 Institut fuumlr Geoinformatik Universitaumlt Muumlnster (ss 155-179)
Munster IfGIprints
Smith A (1993) Estimating Nonlinear Time-series Models Using Simulated Vector
Autoregressions Journal of Applied Econometrics 8 63-84
Smith A (2008) Indirect Inference In S Durlauf amp L Blume (Eds) The New
Palgrave Dictionary of Economics (Second ed) Palgrave Macmillan
Smith A (1990) Three Essays on the Solution and Estimation of Dynamic
Macroeconomic Models PhD Dissertation Duke University
Train K (2003) Discrete Choice Methods with Simulation Cambridge University Press
Vovsha P amp Bekhor S (1998) Link-nested Logit Model of Route Choice-Overcoming
Route Overlapping Problem Transportation Research Record 1645 133-142
Wang H (2011) Logistics Distribution Shortest Path Based on Dijkstra Algorithm
Computer and Digital Engineering 3
Assigned publication number
TSC-MT 11-016
wwwkthse

5
List of Figures
Figure 1 S-shaped relationship between probability and deterministic part of utility 20
Figure 2 A simple network for Dijstrrarsquoa Algorithm explanation 24
Figure 3 Illustration of the Borlaumlnge road network 39
Figure 4 Histogram of link length data 40
Figure 5 Histogram of link length data (zoomed within 1km) 41
Figure 6 Illustration of links with speed bumps 41
Figure 7 Histogram of link numbers in observations data set 43
Figure 8 Illustration of the flow in the experiment 46
Figure 9 Scatter plots of the 90 beta-theta pairs 49
Figure 10 OLS regression based on the 10 beta-theta points from one run 50
Figure 11 Scatter plot of the input values for beta_length and beta_sb 53
Figure 12 Scatter plot of theta_length with regard to beta_length and beta_sb 54
Figure 13 Display of the estimated binding function for theta_length 54
Figure 14 Scatter plot of theta_sb with regard to beta_length and beta_sb 55
Figure 15 Display of the estimated binding function for theta_sb 55
Figure 16 Scatter plots of theta_sb against beta_sb and beta_length 57
Figure 17 Scatter plot of theta_length against beta_length and beta_sb estimated binding
function 59
Figure 18 Scatter plot of theta_sb against beta_length and beta_sb estimated binding
function 60
Figure 19 Scatter plot of theta_ln against beta_length and beta_sb estimated binding
function 60
Figure 20 Plots of theta_length against beta_length beta_sb and sigma respectively 63
Figure 21 Plots of theta_sb against beta_length beta_sb and sigma respectively 64
Figure 22 Plots of theta_ln against beta_length beta_sb and sigma respectively 65
Figure 23 Plots of theta_length against beta_length beta_sb and sigma respectively 67
Figure 24 Plots of theta_sb against beta_length beta_sb and sigma respectively 68
Figure 25 Plots of theta_ln against beta_length beta_sb and sigma respectively 68
6
List of Tables
Table 1 Descriptive statistics of link length 40
Table 2 Descriptive statistics of link numbers in observation data set 43
Table 3 Descriptive statistics of estimated travel time on links 44
Table 4 Descriptive statistics of duration of trips 45
Table 5 Statistics of estimation of beta_length 51
Table 6 Estimated coefficients of binding function for model with two attributes 56
Table 7 Statistics of estimation of beta_length and beta_sb 56
Table 8 Estimated coefficients of binding functions for model with exponential cost
function 61
Table 9 Statistics of estimation of beta_length and beta_sb in exponential-cost-function
model 61
Table 10 Estimates of three binding functions 65
Table 11 Estimates of three binding functions in the Monte Carlo experiment 69
Table 12 Statistics of estimation of beta_length beta_sb and sigma in the Monte Carlo
experiment 69
7
1 Introduction
11 Motivation
With the development of ITS there is a stronger desire for more accurate and efficient
vehicle orientation systems and devices which relies much on the mechanism of route
choice models In other cases well estimated route choice models reveals travel behavior
of the car drivers which contributes to system-scaled analysis such as design and
appraisal of road pricing system across the road network On the other hand newly
developed GIS techniques provide sufficient route choice data as solid basement for
research on route choice behaviors Both the desire for better developed model and more
available prerequisites stimulate the research on route choice modeling
12 Background
Route choice modeling has been discussed for a long time Given a basement network
composed by a finite number of nodes which are connected by directed links we assume
that individuals travel from an origin node to a destination node in the network Thus the
choice of an individual turns out to be an observed path represented by a sequence of
links considering inherent attributes of links such as length or presence of speed bumps
From this point of view individuals make discrete choices the behavioral mechanism of
which could be seen in two different ways Individuals could either be seen as choosing
links from each junction node or choosing from possible paths connecting the origin node
and the destination one In line with a great body of literatures we focus on the path-
based approaches to develop our model
There are two important issues that need to be considered for this kind of approach
namely the generation of choice set and model formulation to address alternative
correlation due to path overlapping To be specific when we assume that individuals
choose from paths connecting the origin and destination it is infeasible to enumerate the
full-size choice set or universal choice set which includes all possible paths between the
OD pair in a given road network Individuals may not virtually consider the universal
choice set when they make decisions and in practice algorithms implemented to find the
shortest paths avoid the usage of choice set at all such as the Dijkstrarsquos algorithm we
implement in the model Hence we give each individual the right to consider all possible
8
paths It is common practice to generate samples from the universal choice set yet this
may easily introduce biases to the estimation Samples are supposed to be randomly
drawn from the population and good samples can reproduce the features in the population
Since in real-size network it is impossible to know the full-size choice set let alone to
reproduce the features of it We could only draw from certain known paths and this is
more like an importance sampling which gives links different possibilities to the drawn
into paths As a result estimation based on the sampled paths will have biases
The other problem with regard to path-based approaches is the inherent limitation of
multinomial logit model (MNL) which requires no correlation among alternatives This
is practically unrealistic since in the context of route choice modeling paths sharing
certain links are correlated due to unobserved features of the common links Numerous
literatures contribute to improvement in terms of the problem based on logit models
We choose to use an approach with additive link specific errors which belongs to probit-
like models This kind of model is efficient for applications yet it is still not able to be
estimated consistently given a partial choice set So we turn to indirect inference as the
tool to estimate the probit-like model with additive link specific errors All feasible paths
for each individual are technically allowed which means that a universal choice set is
provided for each OD pair to avoid bias caused by sampling from full choice sets The
universal choice set generated here is a so-called pseudo-universal choice set which
contains as many feasible paths as desired to eliminate possible biases but not all paths
since it is practically impossible to get the true universal choice set We choose to use an
MNL model as the auxiliary model which is easy to estimate The estimate of MNL
model is biased based on the choice set we generate as discussed above yet the estimate
of parameters in the basic route choice model will be consistent thanks to the features of
the indirect inference method
13 Objective
A Monte Carlo simulation experiment has been carried out based on synthetic trip data
and real-sized road network to appraise the proposed model (See Karlstroumlm Sundberg amp
9
Wang 2011)1 The basic route choice model includes two attributes namely length and
speed bump dummy while an MNL model is chosen as the auxiliary model with the
same two attributes Simulated trip data given two pseudo-true values for coefficients of
length and speed bump dummy are used as a substitution of the empirical data The
presence of speed bumps is randomly allocated over the network Estimation results and
sensitivity test confirm the efficiency and consistency of the proposed estimator
What needs to be done in the thesis is that true trip data should be implemented as well as
the modification of the network To be specific realistic speed bump distribution is used
to replace the randomly allocated one Without knowing the true values of the
coefficients several iterations need to be carried out to get to know the raw domain of the
values and by shrinking input intervals more accurate estimates will be attained as the
accomplishment of the thesis
14 Scope of the Thesis
Based on the route choice model used in the synthetic experiment extensions are done in
five main aspects First we implement the newly proposed estimator in real world issues
by replacing the simulated observations with the true observations collected in a real
world network Unlike the simulated data which is generated following certain
assumptions the true observations have more noises inside and thus more difficult to
capture their features Second the observations we use contain many OD pairs and not
restricted with one or four of them as in the synthetic experiment this gets rid of the
possibility of bias caused by restricted OD pairs Third since we are implementing the
new method in true observations the formulation of route choice model cost function to
be specific is not known beforehand and correspondingly the formulation of the utility
function in the logit model is not for sure as well We need several trials to get well
defined formulations to capture the features of the data Fourth we have no idea what the
parameters are like based on true observation and thus a raw guess of input domain is
needed at first and centered with shrinkage in later iterations Last but not least in one
trial we included a scale parameter to the random term in the cost function and use
number of links in the auxiliary model to infer it To test the efficiency of this trial a
1 Karlstroumlm A Sundberg M amp Wang Q (2011) Consistently estimating flexible route choice models using an MNL lense International Choice Modeling Conference Leeds
10
Monte Carlo simulation experiment is carried out with some arbitrary pseudo-true values
of the parameters based on which simulated observations are used
On the other hand what is done in the synthetic experiment such as test with simulated
observations for one OD and four ODs sensitivity of estimates with choice set size and
number of observations is not included in this thesis Instead we will identify some
limitations of the model formulation tried in the thesis and make suggestions how the
model can be improved
As follows Section 2 reviews relevant literatures on route choice modeling as well as
indirect inference In Section 3 relevant methods are introduced in detail as backgrounds
afterwards methods and models used in this thesis are illustrated Section 4 gives
description of the empirical data we use for estimating and Section 5 shows the
estimation results of the Monte Carlo simulation-based experiment followed by some
conclusions in Section 6
11
2 Literature Review
Route choice modeling has long been discussed and many efforts have been made to
solve this problem Simple and easy to estimate the multinomial logit model (MNL) is
widely used in choice modeling yet it has certain restrictions to be implemented in route
choice context Due to its inherent property of Independence from Irrelevant Alternatives
(IIA) the multinomial logit model is not easily applicable since routes in the choice set
tend to be correlated with the presence of overlapping paths Cascetta et al (1996)
proposed a correction term called Commonality Factor (CF) in the deterministic part of
the utility function2 And the probability of path i to be chosen from the choice set nC
becomes( )
( )( | )in in
jn jn
n
V CF
n V CF
j C
eP i C
e
micro
micro
minus
minus
isin
=sum
As proposed by Cascetta et al the Commonality
Factor is specified as ln ( )n
ijin CF
j C i j
LCF
L Lγβ
isin
= sum in which ijL is the length of links
common to path i and pathj while iL and jL are the total length of path i and pathj
respectively The parameter γ is left to be estimated or practically constrained to a fixed
value like 1 or 2 The CF term of one path is proportional to the length of overlapping
part with other paths This proposed model is referred to as C-Logit model Bearing some
similarities Ben-Akiva and Bierlaire (1999) proposed the Path Size Logit (PSL) model3
This model is based on a different theoretical basis as the C-Logit The original
formulation of Path Size (PS) comes from the discrete choice theory of aggregate
alternatives Similar to the CF in C-Logit the log of Path Size (PS) is added to the utility
function The probability of path i to be chosen from the choice set nC becomes
( ln )
( ln )( | )in in
jn jn
n
V PS
n V PS
j C
eP i C
e
micro
micro
+
+
isin
=sum
The Path Size is specified as
1
i n
n
ain
a Ciaj
j C j
lPS
LL
LδisinΓ
isin
= sumsum
in
2 Cascetta E Nuzzolo A Russo F amp Vitetta A (1996) A Modified Logit Route Choice Model Overcoming Path Overlapping ProblemsSpecification and Some Calibration Results for Interurban Networks In J Lesort (Ed) the 13th International Symposium on Transportation and Traffic Theory Lyon France 3 Ben-Akiva M amp Bierlaire M (1999) Discrete Choice Methods and Their Applications to Short Term Travel Decisions In Chapter for the Transport Science Handbook Preliminary Draft
12
which iΓ is the set of links in pathi al and iL are the length of link a and pathi
respectively ajδ is the link incidence variable with value of 1 when link abelongs to path
j and zero otherwise And nCL is the shortest path in choice setnC The size of a path has
a maximum value of one when it shares no links with other paths
C-Logit model and PSL model are the most widely used models in practice of route
choice modeling due to their simple forms Since both of them originate from the MNL
model and maintain the basic MNL structure they can be estimated by existing software
designed for logit models Apart from these two types of models there are other recent
efforts in the route choice context
Bekhor Ben-Akiva and Ramming (2002) adapted the Logit Kernel model to apply in a
route choice context4 The Logit Kernel5 model was proposed by combing Gaussian and
Type I Extreme Value error terms by researchers such as Ben-Akiva and Bolduc (1996)
and McFadden and Train (2000) who also referred to it as Mixed Logit6 By making
certain assumptions under route choice context Bekhor Ben-Akiva and Ramming (2002)
proposed a way to apply the model to route choice modeling7 Based on the data from
Boston several kinds of models are estimated including multinomial logit model Path
Size Logit and the newly proposed Logit Kernel model Seen from the estimation results
Logit Kernel has a better overall performance than the other two kinds of models This
result needs to be verified in other data sets since the one used in the paper has a
relatively small size
Frejinger and Bierlaire (2007) proposed an approach to capture correlation among
alternative routes with subnetworks and carried out estimation based on several kinds of
route choice models8 The paper gives an overview of the latest development of route
choice modeling and discusses the Path Size Logit model in detail As part of the
4 Bekhor S Ben-Akiva M amp Ramming M (2002) Adaptation of Logit Kernel to Route Choice Situation Transportation Research Board of the National Academics 1805 78-85 5 Ben-Akiva M amp Bolduc D (1996) Multinomial Probit with a Logit Kernel and a General Parametric Specification of the Covariance Structure Working Paper 6 McFadden D amp Train K (2000) Mixed MNL Models for Discrete Response Journal of Applied Econometrics 7 Bekhor S Ben-Akiva M amp Ramming M (2002) Adaptation of Logit Kernel to Route Choice Situation 8 Frejinger E amp Bierlaire M (2007) Capturing Correlation with Subnetworks in Route Choice Models Transportation Research Part B 41 363-378
13
conclusion a behavioral interpretation of the Path Size in the model is given The
subnetwork is defined so that the alternative routes sharing the same section of it are
seen as correlated This correlation is captured using the Error Component model and
estimation results show that this new approach gives better property than PSL models To
complement the paper uses a real size network and true travel data is collected which is
the same network we are going to use in this thesis project Additionally the paper
displays forecasting results which indicates that models with Path Size component tend
to have bad performance in prediction
Ben-Akiva and Bierlaire (2003) pointed out that under route choice context the
significant correlation among alternatives due to path overlapping and the generation of
choice set are two important issues and main difficulties9
There are some algorithms used in practice for generating choice set for route choice
modeling both deterministic methods and stochastic ones The deterministic methods
tend to give the same set of paths for a given OD pair Some examples are the link
penalty algorithm (De La Barra Peacuterez amp Anez 1993) which increases gradually the
impedance of all the links on the shortest path10 the link elimination algorithm (Azevedo
Costa Madeira amp Martins 1993) which removes links on the shortest path in sequence
to generate new paths11 and the labeled paths (Ben-Akiva Bergman Daly amp
Ramaswamy 1984)12 In terms of the stochastic methods they tend to produce individual
specific choice set One example is the simulation method (Ramming 2001) which
generates alternative paths by drawing link impedances from different distribution
densities13
When it comes to appraisal of the generated choice set some literatures give evaluations
on the efficiency of different sampling algorithms for choice set generation (See Bekhor
9 Ben-Akiva M amp Bierlaire M (2003) Discrete Choice Models with Applications to Departure Time and Route Choice In Handbook of Transportation Science (second ed) Kluwer 10 De La Barra T Peacuterez B amp Anez J (1993) Multidimensional Path Search and Assignment 21st PTRC Summer Meeting (pp 307-319) 11 Azevedo J Costa M Madeira J amp Martins E (1993) An Algorithm for the Ranking of Shortest Paths European Journal of Operational Research 69 (1) 97-106 12 Ben-Akiva M Bergman M Daly A amp Ramaswamy R (1984) Modeling Inter Urban Route Choice Behaviour In J Vollmuller amp R Hamerslag (Ed) the 9th International Symposium on Transportation and Traffic Theory (pp 299-330) Utrecht Netherlands VNU Science Press 13 Ramming M (2001) Network Knowledge and Route Choice PhD Thesis Massachusetts Institute of Technology
14
Ben-Akiva amp Ramming 2006 for example) Apart from this there are some recently
proposed methods for sampling alternatives under route choice context (See Frejinger
Bierlaire amp Ben-Akiva 2009 for example)
Nerella and Bhat (2004) carried out a numerical analysis on the effect of sample size on
the efficiency of the estimation of parameters14 The analysis is done for two kinds of
discrete choice models namely the multinomial logit model for which consistency of
estimation based on subset of alternatives is theoretically proved and non-MNL model
taking mixed multinomial logit model as an example Four evaluation criteria are chosen
namely the ability to recover model parameters ability to estimate overall log-likelihood
function value ability to estimate individual choice probabilities and ability to estimate
aggregate shares of alternatives The results show that the MNL model works well on
small sample size yet certain portion of full choice set need to be kept as a practical
baseline For the non-MNL model small sample size gives poor estimation and increase
of sample size gives obvious increase of estimation quality Certain portion of full choice
set is suggested for practical convenience yet the generalization of sample size portion is
not feasible since difference kinds of models may require different portion to guarantee
accuracy In general for the non-MNL models full choice set is suggested to be used if
feasible and larger sample gives better estimation
Bekhor Ben-Akiva and Ramming (2006) carried out route choice modeling based on a
large-scale urban network including both choice set generation part and route choice
estimation part which compose the process of route choice modeling together15 Given
that previous literatures did not pay too much attention to empirical estimation the paper
used a true observation data set collected in Boston As the first step several choice set
generation algorithms are listed and compared in their efficiency of reproducing the
observed paths on which the evaluation of the algorithms are based The data in Boston
is described in the paper and used in the second step ie model estimation Several route
choice models are presented and estimation results based on different kinds of models are
shown for comparison of the efficiency of the models The Path Size Logit model is
14 Nerella S amp Bhat C (2004) Numerical Analysis of Effect of Sampling of Alternatives in Discrete Choice Models Transportation Research Record 1894 11-19 15 Bekhor S Ben-Akiva M amp Ramming M (2006) Evaluation of Choice Set Generation Algorithms for Route Choice Models Annals of Operations Research 114 (1) 235-247
15
proposed for its property to overcoming the drawbacks of the conventional MNL models
This type of model can be easily estimated using popularized software The main
conclusion is that route choice models could be estimated for large-scale networks based
on the true observation data and prominent computing resources
Frejinger Bierlaire and Ben-Akiva (2009) proposed a paradigm for choice set generation
based on sampling for route choice modeling16 In the context of route choice modeling
the universal choice set which denotes all possible alternatives for a traveler to choose
from is not able to be enumerated So we practically work on a sampled choice set from
the universal one which may easily introduce bias to the final estimate In this paradigm
they focus on unbiased estimation of parameters instead of generating actual choice set
The path generation is seen as an importance sampling approach and a correction of
sampling is added to the path utility Since the following estimation process is based on
the sampled choice set which is treated as the universal one a correction for sampling is
added to the path size attribute in the commonly used path size logit (PSL) model ending
up with the expanded path size Modification in the previous two steps guarantees
unbiased estimation of the parameters Numerical results based on synthetic data are
presented in the paper to reveal that models with a sampling correction in the path utility
are better than those without it The proposed expanded path size logit model provides
unbiased estimation and is better than the original path size models
In this paper we will examine indirect inference Indirect inference is not a new method
it was first introduced by Smith (1990 1993)17 Then Gourieacuteroux et al (1993) gave
overall introduction to the methods and extended it in important ways18 Gallant and
McCulloch (2004) transferred the idea of indirect inference and used it for Bayesian
inference in models where likelihood function is intractable19
16 Frejinger E Bierlaire M amp Ben-Akiva M (2009) Sampling of Alternatives for Route Choice Modeling Transportation Research Part B Methodological 43 (10) 984-994 17 Smith A (1990) Three Essays on the Solution and Estimation of Dynamic Macroeconomic Models PhD Dissertation Duke University Smith A (1993) Estimating Nonlinear Time-series Models Using Simulated Vector Autoregressions Journal of Applied Econometrics 8 63-84 18 Gourieacuteroux C Monfort A amp Renault E (1993) Indirect Inference Journal of Applied Econometrics 8 85-118 19 Gallant A amp McCulloch R (2004) On the Determination of General Scientific Models Manuscript Duke University
16
Gourieacuteroux Monfort and Renault (1993) proposed the inference methods based on an
ldquoincorrectrdquo criterion which does not give consistent estimation to parameters of interest
directly20 The argument of the criterion is called the auxiliary parameter which may
have a larger dimension than the parameters of interest in the basic model After the
auxiliary parameters are selected a simulation-based process is carried out to get a
consistent and asymptotically normal estimator of parameters of interest As a simulation-
based method the only requirement for the basic model is that it could be simulated
regardless of formulations of the model So it could be used for estimating models which
are too complex to carry out direct approaches The paper shows how this kind of method
can be applied in fields such as micro-econometrics macro-econometrics and
econometrics of finance
Keane and Smith (2003) proposed a generalized form of the indirect inference method to
be implemented in the discrete choice model context21 Theoretically indirect inference
could deal with estimation of any economic models yet it has some limitations per se that
decrease the estimation efficiency or even make it difficult to implement Problems arise
when we use indirect inference in estimating discrete choice models since the objective
function the metric of distance between the auxiliary models estimated on observed data
and simulated data to be specific is inherently discrete which leaves the gradient-based
optimization methods infeasible Keane and Smith (2003) proposed that the estimation
procedures used for observed data and simulated data can be different22 Instead of the
discrete choice a continuous function of latent utilities including a smoothing parameter
is used as the dependent variable in the auxiliary model When the smoothing parameter
goes to zero the function of latent utilities converges to the discrete choices this way to
guarantee consistency According to the Monte Carlo results the generalized indirect
inference method proposed in this paper yields good estimates in small samples being as
efficient as maximum likelihood estimates in comparison
20 Gourieacuteroux C Monfort A amp Renault E (1993) Indirect Inference 21 Keane M amp Smith A (2003) Generalized Indirect Inference for Discrete Choice Models Manuscript Yale University 22 Keane M amp Smith A (2003) Generalized Indirect Inference for Discrete Choice Models
17
Creel (2009) presented a data mining approach to indirect inference23 which is similar to
the regular indirect inference method yet with certain advantages over it The method is a
simulation-based estimator relying also on an auxiliary model In line with the indirect
inference method an underlying economic model with parameterβ is referenced by an
auxiliary model with parameterθ Certain values of the parameter hβ in underlying
economic model are drawn randomly from a known density simulated data is generated
using Monte Carlo methods to estimate ɶh
θ of auxiliary model which ends up with a set
of tuples ɶ( )hhβ θ Nonparametric methods are used to get the function ɶ( | )E aβ θ = and
the final estimate of β is supposed to be the result of regression function evaluated at the
estimate of θ based on true observations ɶ ɵ( | )Eβ β θ θ= = Creel (2009) also presented a
way of calculating confidence intervals24 Monte Carlo results in dynamic and nonlinear
panel models and vector autoregressions show good performance of the new estimator
23 Creel M (2009) A Data Mining Approach to Indirect Inference Universitat Autonoma de Barcelona Department of Economics and Economic History 24 Creel M (2009) A Data Mining Approach to Indirect Inference
18
3 Methodology
31 Multinomial Logit Model (MNL)
311 Model Description
Route choice modeling is somewhat complicated when we want to capture the attributes
of both the alternative routes and choice maker accurately and reflect the choice making
process in the model Intuitively route choice can be regarded as choosing one specific
route from several alternative routes which coincides with the prerequisites of discrete
choice models Actually a lot of literatures have explored the route choice modeling and
possible improvements based on discrete choice models (see Cascetta et al 1996 Vovsha
and Bekhor 1998 Ben-Akiva and Bierlaire 1999 for more information on development
in route choice models with regard to discrete choice models)25
To understand the frontier development of route choice model we have got to know the
discrete choice models among which multinomial logit model (MNL) is the most widely
used In addition we choose to implement a new method ndash indirect inference in which
MNL is used as it is
Logit model is the most widely used discrete choice model till now due to its excellent
qualities in model specification To be specific the choice probability takes a closed form
which is easy to estimate and interpret (Train 2003)26
The multinomial logit model is a kind of choice model with more than two alternatives in
the choice set We assume that the choice maker makes his or her decision based on the
utility maximization rule (Ben-Akiva amp Lerman 1985)27 With regard to the utility njU
the decision maker n obtains from the thj alternative in the choice set it is made up of
two parts the deterministic part and the stochastic part The deterministic part denoted
25 Cascetta E Nuzzolo A Russo F amp Vitetta A (1996) A Modified Logit Route Choice Model Overcoming Path Overlapping ProblemsSpecification and Some Calibration Results for Interurban Networks Vovsha P amp Bekhor S (1998) Link-nested Logit Model of Route Choice-Overcoming Route Overlapping Problem Transportation Research Record 1645 133-142 Ben-Akiva M amp Bierlaire M (1999) Discrete Choice Methods and Their Applications to Short Term Travel Decisions 26 Train K (2003) Discrete Choice Methods with Simulation Cambridge University Press 27 Ben-Akiva M amp Lerman S (1985) Discrete Choice Analysis Theory and Application to Travel Demand MIT Press
19
by njV contains attributes known by the modelers while the stochastic part denoted by
njε is the attributes affecting peoplersquos the decision which cannot be observed by the
modelers yet are known by the decision makers themselves So the utility function turns
out to be
nj nj njU V jε= + forall (1)
The type of choice model is basically decided by the distribution of the stochastic part
When we assume that njε is independently identically Gumbel distributed the model
becomes a logit model
As stated above the decision follows utility maximization rule which means that the
decision maker n chooses the alternative with the highest utility say the thi alternative
Use as the probability the thi alternative is chosen over the others we have
( max ) ( )
( )
( )
ni ni nj ni njj C
ni ni nj nj
nj ni ni nj
P P U U P U U j i
P V V j i
P V V j i
ε εε ε
isin= = = ge forall ne
= + gt + forall ne
= minus lt minus forall ne (2)
With Equation (2) above and the assumption that njε follows iid Gumbel distribution we
could derive the probability of decision maker n chooses alternativei which is
ni
nj
V
ni V
j
eP
e=sum
(3)
Typically we specify the deterministic part of the utility function in a linear form which
is nj njV xβ= Then the probability becomes
ni
nj
x
ni x
j
eP
e
β
β=sum
(4)
This is the most common form of probability function for multinomial logit models
There are some good properties for this kind of logit probability as discussed by Train
(2009)28 With this form the probability of choosing certain alternative will be between
zero and one inherently which is basically required for probability definition Yet the
28 Train K (2003) Discrete Choice Methods with Simulation
20
value of niP will never drop to zero mathematically which means that all the alternatives
in the choice set are perceived to have chance to be chosen On the other hand if an
alternative is perceived never to be chosen it should not be included in the choice set at
all
The probabilities for all the alternatives in the choice set sums to be one which is easily
illustrated from the analytical properties 1 1 1
( ) 1njni
J J JVV
nii i j
P e e= = =
= =sum sum sum in which J denotes
the number of alternatives in the choice set
The logit probability and the deterministic part of the utility function follow an S-shaped
curve line shown in Figure 1 below
Figure 1 S-shaped relationship between probability and deterministic part of utility
This property gives implications for possible impacts of the deterministic utility of certain
alternative on its chances to be chosen We could see that when an alternative has about
50 probability to be chosen which infers to the steepest part on the curve a small
change in the deterministic part of the utility function could lead to a large change in the
probability the alternative has to be chosen
Apart from the nice properties of logit probability logit models have some disadvantages
as well (Bartels Boztug amp Muumlller 1999)29 One shortcoming is the assumption of
29 Bartels K Boztug Y amp Muumlller M (1999) Testing the Multinomial Logit Model Working paper University Potsdam Germany
21
Gumbel distribution of error terms in the utility function The inherent requirement for
iid property sets restrictions for logit model to be widely used especially in route choice
modeling context Several models have been proposed to overcome this shortcoming in
particular modifications based on MNL to adjust it to route choice practices have been
proposed Another drawback is the assumption of the linear composition for the
deterministic part of utility function Actually this assumption is for ease of following
estimation process since McFadden (1974) demonstrated that under this condition the
probabilities will be universally concave with regard to the coefficientsβ 30 which
improves the performance of numerical estimation Yet there could be nonlinear
compositions in the deterministic part to relax the restriction Under this condition the
universal concavity cannot be guaranteed which may lead to local convergence in the
estimation process
312 Model Estimation
The most commonly used numerical estimation method for multinomial logit models is
the Maximum Likelihood Estimation (MLE) In principle given a set of data and the
underlying probability model the method tries to find coefficients of the probability
model with which produced data has a distribution most likely resembles the distribution
of the observed data
Consider the case that N decision makers with their choice data are obtained Parameters
to be estimated are the coefficients in the utility function denoted byβ We could then
use the MLE to try to get the values of β vector with which the probability that choice
maker choose their observed alternatives is maximized
The probability of choice maker n to choose his or her observed alternative can be
written as
( ) niyni
i
Pprod (5)
in which niy is a dummy with value 1 if choice maker choose alternative i and value 0
otherwise
30 McFadden D (1974) Conditional Logit Analysis of Qualitative Choice Behaviour (P Zarembka Ed) Frontiers in Econometrics 105-142
22
Choice makers choose their alternative independently from each other so the probability
of all sampled choice makers choose their observed alternative is
1
( ) ( ) ni
Ny
nin i
L Pβ=
= prodprod (6)
This is the likelihood function with regard to the parameters to be estimated β in this
case We can take the logarithm of it to get the log-likelihood function
1
( ) lnN
ni nin i
LL y Pβ=
=sumsum (7)
Since we aim at getting the value of β to make the log-likelihood function maximized
we can take the derivative of it with respect to β and set it to zero
( )
0dLL
d
ββ
= (8)
By solving this equation we could get the estimate of β
32 Dijkstrarsquos Algorithm
321 Introduction
A method is needed for generating feasible alternatives and compose the choice set as
well as for deriving simulated observations for each OD pair in the process of indirect
inference As for choice set generation we would like to include certain number of high
ranking shortest paths in the choice set since these paths tend to have more possibility to
be chosen Similar to this the simulated observation is generated as the shortest path
between each OD pair We implement a method for shortest path finding which is the
Dijkstrarsquos Algorithm
Dijkstrarsquos Algorithm is named after the Dutch computer scientist Edsger Dijkstra who
conceived this method in 1956 and got it published in 195931 This is a graph search
algorithm aiming at solving shortest path problem for a graph the edge cost of which is
defined nonnegative The outcome of it is a shortest path tree demonstrating the path with
lowest value with respect to the defined cost
31 Dijkstra E (1959) A note on two problems in connexion with graphs Numerische Mathematik 1 269-271
23
This algorithm deals with single-source problem To be specific given one source node in
the graph the algorithm will give paths with the lowest value with regard to cost from
this source node to every other node in the network Given certain criterion we could use
the algorithm to find shortest path between two specific nodes by setting one node as the
source and the other as the target
After released it is widely used in path searching problems especially in transportation
related practices Routing problem is considered in investigation on traffic assignment
and optimization in logistics Real sized road network could be perceived as a graph with
vertices and edges in which cities can be abstracted as the vertices in the graph and the
roads connecting cities can then be regarded as the edges With the aid of Dijkstrarsquos
Algorithm the shortest path with respect to cost could be found from certain city to the
other cities The outcome is valuable for logistics corporations to work out their region-
wide distribution plans32
322 Algorithm
We connect a ldquodistancerdquo value with all the vertices in the graph indicating its distance
from the source vertex To be accurate the ldquodistancerdquo could be actual length of edges or
the generalized cost on the edges or anything desired The source vertex is defined as the
initial node with a value of zero In the process Dijkstrarsquos Algorithm will assign values
to vertices detected in one loop and update the values in the following loops till a
minimum value is found for each vertex The steps for searching and updating are
presented below
1 Initialize the network and assign the distance values of vertices other than the initial
node as infinity
2 When one vertex is to be detected it is denoted as current node All the vertices that
have been detected and attained the minimum distance values will be marked as detected
and will not be detected in the following loops while the vertices remaining unvisited
will be marked undetected To initialize all the vertices are marked undetected and the
initial node is set as current node
32 Wang H (2011) Logistics Distribution Shortest Path Based on Dijkstra Algorithm Computer and Digital Engineering 3
24
3 For current node all its directly connected adjacent nodes are considered except for
the newly detected vertex Labeled distance values of the neighbor vertices will be
updated if the calculated values from current node are smaller than their current values
For example current node A has a distance value of 4 and one of its neighbors B has a
value of 8 The edge linking A and B has a distance of 2 The newly calculated distance
value for B will be 4+2=6 which is smaller than 8 So the labeled distance value for B
will be updated to 6 indicating that the minimum distance from the source vertex to B till
now is 6 and the path should pass A
4 When all the neighbors of the current node are considered and updated mark the
current node as detected And mark the undetected node with the lowest distance value as
the current node and do the detection in step 3 again
5 When all the vertices in the network are marked detected the algorithm is finished and
we get the minimum distance from the source to all the other vertices The shortest path
from the source to a specific vertex could be found out following the detecting process
As mentioned above the stop criterion could also be modified as we desired If we aim at
finding the shortest path between two vertices at the beginning one vertex should be set
as the initial node and the algorithm could be stopped once the other vertex is marked as
detected
323 Explanatory Example
Here is a simple network to illustrate the mechanism of Dijstrarsquos Algorithm There are
five vertices and six edges with distance values labeled beside We define A as the source
and set it the initial node
Figure 2 A simple network for Dijstrrarsquoa Algorithm explanation
25
Initialization
Initial node A
Detected null
Distance value A=0 B=C=D=E=+infin
Loop 1
Current node A
Adjacent vertices B C
Detected null
Distance value A=0 B=4 C=1 D=E=+infin
Loop 2
Current node C
Adjacent vertices B D
Detected A
Distance value A=0 C=1 B=min 4 C+2 =3 D=C+3=4 E=+infin
Loop 3
Current node B
Adjacent vertices E
Detected A C
Distance value A=0 C=1 B=3 D=4 E=B+3=6
Loop 4
Current node E
Adjacent vertices null
Detected A B C D
Distance value A=0 C=1 B=3 D=4 E=6
If we want to get the shortest path from A to E following the detecting process we could
know that it should be A-C-B-E
26
324 Discussion
Dijkstrarsquos Algorithm has a clear logical structure which makes it easy to understand as
well as to implement in programming Nonetheless this method cannot search directly
from one node towards the other to find the shortest path between the two It works more
like detecting all the adjacent nodes in terms of shortest paths and expands from the
source iteratively until the target node is included and that is when we could figure out
the shortest path between the two specific vertices This reveals the fact that the method
wastes a lot of time in the blind search leaving it inefficient In addition this method is
not able to deal with networks with negative edge values yet this is not a problem in our
research since link cost on our network is defined nonnegative
33 Indirect Inference
331 Introduction
For problems in route choice context choice set size may be way too large to enumerate
all the alternatives Yet estimation based on sampled choice set may introduce biases
which can be corrected in some special cases (see Frejinger Bierlaire amp Ben-Akiva
2009)33 While in cases where estimation models are not based on MNL say multinomial
probit model we could not find corrections for biases caused by sampled choice set
Estimator based on the principle of indirect inference is then introduced to overcome
inconsistency problem34
Indirect inference35 is a simulation-based method for estimating parameters in economic
models by making references to the parameters of interest (Smith 2008) It is motivated
when general statistical estimation method such as Maximum Likelihood is intractable or
as discussed above consistent estimation is required given that only sampled choice set is
available Since in economic analysis we tend to build models which guarantee scientific
logic and inclusion of necessary attributes quite often the models will end up
33 Frejinger E Bierlaire M amp Ben-Akiva M (2009) Sampling of Alternatives for Route Choice Modeling 34 Karlstroumlm A Sundberg M amp Wang Q (2011) Consistently estimating flexible route choice models using an MNL lense 35 Smith A (2008) Indirect Inference In S Durlauf amp L Blume (Eds) The New Palgrave Dictionary of Economics (Second ed) Palgrave Macmillan
27
complicated from statistical estimation point of view This in sequence spurs the wide use
of indirect inference in economic analysis
It is common character that simulation-based methods allows modelers to simulate data
from the economic model of interest given certain perceived values of the parameters to
be estimated Since to generate data is essential and simple the true challenge is how to
estimate coefficients Indirect inference uses an auxiliary model which gives a rich
description of the covariance patterns in the data by including certain variables from the
basic economic model On the other hand the auxiliary model does not need to reflect
accurately the data generating process since it is supposed to be estimated based on the
data derived not to generate data itself The basic function of the auxiliary model is that
it provides a criterion to compare observed data and simulated data from the basic
economics model
We do iterations with the aim of finding the parameters of the basic economic model so
the observed data and the simulated data from the basic model looks almost the same by
the criterion of auxiliary model To be specific the auxiliary model is estimated based on
both observed data and simulated data we choose parameters for the basic model to
make sure that the two estimator of auxiliary model are as close as possible Based on
this idea the auxiliary model should be easy to estimate
332 Definition of the method
We define an economic model with the form of
( ) 12t t ty G x t Tε β= = (9)
in which 1 Tt tx = is a sequence of observed exogenous variables 1 T
t ty = is a sequence of
observed endogenous variables and 1 Tt tε = is a sequence of unobserved random error
terms β is a k -dimensional coefficient vector of the exogenous variables (Smith
2008)36
This model generally describes a relation that ty is dependent ontx with some random
errors Given the distribution of the random errors we could get the probability density
36 Smith A (2008) Indirect Inference
28
function of ty conditional on tx We will not focus on this density and instead this model
is only used for simulating data in indirect inference
In terms of the auxiliary model it could be defined by a probability density function with
the form of
( | )t tf y x θ (10)
in which θ is a p -dimensional coefficient vector and p is supposed to be not smaller
than k since we should capture characteristics of all the parameters in the underlying
economic model In addition the auxiliary model needs not be defined to reproduce the
distribution of ty in the basic model yet it needs to have a convenient analytical format
Based on the observed data we could estimate the parameters in the auxiliary model
using Maximum Likelihood Method
ɵ
1
arg max log ( | )T
t tt
f y xθ
θ θ=
= sum (11)
The estimated coefficient vectorɵθ could be used as an indicator of certain features of the
observed data
On the other hand the auxiliary model can be estimated based on simulated data from the
basic model as well We need to draw a sequence of random error terms 1 m Tt tε = from the
defined distribution in which m denotes the number of simulation with an interval of [1
M ] generally Given a coefficient vectorβ we could generate the values of endogenous
variables ɶ 1 ( )m T
tty β = which are explicitly dependent onβ With the help of Maximum
Likelihood Method we could get
ɶ ɶ
1 1
( ) arg max log ( ( ) | )M T m
ttm t
f y xθ
θ β β θ= =
= sumsum (12)
According to the principle of indirect inference we try to find the values of β to make
ɶ( )θ β as close toɵθ as possible Practically we need a metric to measure the distance
between ɵθ andɶ( )θ β and by minimizing the distance we could find out the estimates of
β in the basic economic model
29
333 Choices of the metrics
As mentioned above we need a metric to measure the distance betweenɵθ andɶ( )θ β
There are three approaches corresponding to the three classical hypothesis tests namely
Wald likelihood ratio (LR) and Lagrange multiplier (LM)37
In the Wald approach we try to minimize a quadratic form in the difference between the
two estimators ofɵθ andɶ( )θ β which is
ɵ ɶ ɵ ɶarg min( ( )) ( ( ))Wald
Wβ
β θ θ β θ θ β= minus minus (13)
in which W is a positive definite ldquoweightingrdquo matrix
In the LR approach a metric is formed based on the likelihood function related to the
auxiliary model which is
ɵ ɶ
1 1
arg min( log ( | ) log ( | ( )))T TLR
t t t tt t
f y x f y xβ
β θ θ β= =
= minussum sum (14)
According to the definition ofɵθ the first part of the objective function before the minus
sign on the right-hand side is always larger than the second part after the minus sign And
the first part is not dependent onβ
To minimize the objective function is equivalent to maximizing the log-likelihood
function withɶ( )θ β that is
ɶ
1
arg max( log ( | ( )))TLR
t tt
f y xβ
β θ β=
= sum (15)
In the LM approach the metric is formed using the derivative of the log-likelihood
function related to the auxiliary model which is
arg min ( ) ( )LM
S VSβ
β β β= (16)
in which
ɶ ɵ
1 1
( ) log ( ( ) | )M T m
ttm t
S f y xβ β θθ= =
part=partsumsum
(17)
and V is a positive definite matrix
37 Smith A (2008) Indirect Inference
30
By using any of the approaches we aim at getting the minimized distance betweenɵθ and
ɶ( )θ β so the value will approach to zero as expected So the hypothesis test of the
minimized value could be used as an indicator of whether the auxiliary model is suitably
specified In other words the minimized value being significantly different from zero
indicates a bad specification of the auxiliary model
In comparison the LM approach has an advantage over the others in computation when
it is relatively time-consuming to estimate the auxiliary model
334 Consistency Interpretation
Suppose the observed sample size T grows large while total number of simulations stays
fixed as M the estimator based on simulated data ɶ( )θ β will converge to a pseudo-true
value denoted as( )h β which is also dependent onβ This is called binding function
which characterized the relationship between the coefficients in the basic model and the
auxiliary model At the same time the estimator based on observed data ɵθ will converge
to a pseudo-true value0θ In case that T grows to a large number the aim of indirect
inference changes to finding β that guarantees0 ( )hθ β= This could explain that indirect
inference gives consistent estimate of the parameters in the basic economic model
In this project the binding function is what we focus on to get the correct estimates
instead of finding certain metrics Detailed methods will be discussed in the following
part
34 Model Specification in the Thesis
341 Basic Route Choice Model
Based on all the methods mentioned in previous sections the specification of models and
methods we use in the thesis will be explained in this section Since we are to estimate
the model based on true observations no model is known beforehand to adjust to the data
we use Several formulations of the model have been tested in the thesis The one
explained here could be seen as an example and all the other trials contain modifications
based on this model The other specifications of model will be explained along with the
results in the result section
31
We start by describing the underlying route choice model of interest38 We need to define
a road network as a representation of a real-size one from which we collected the trip
data The network denoted asN consists of a set of nodes (vertices) v and links (edges)
l Each link has a source node ( )s l and a target node or a destination node( )d l which
together indicate the direction of the link A path from an origin node ov to a destination
node dv could be seen as a sequence of links1 nl lhellip of which 1( ) os l v= 1( ) ( )i id l s l +=
and ( ) dnd l v= So a path can be defined by the index of links which is 1 nl lπ = hellip
A vector of characteristics denoted aslx is associated to each link as well as a strictly
positive cost function( )l lic x ε β in which liε is an individual specific random link cost
with i denoting the individual and β is a vector of coefficients of the link characteristics
left to be estimated In the Indirect Inference context we need an auxiliary model with
easily-estimated analytical form yet there is no such requirement for the basic model
Although not necessary we assume that the cost function has a linear deterministic form
the deterministic part and the random part are additively separable So we have the cost
function as
( ) Tl li l lic x xε β β ε= + (18)
In addition one important assumption is that the link cost is additive which means that
the cost of a path can be attained by the sum of all the link costs along the path This way
we have the cost of a path π as
( ) ( )l lil
C c xπ
π ε βisin
=sum (19)
We focus on the path-based model which means that the individuals choose among all
possible paths As defined above this turns out to be a random utility choice model As
indicated by the standard assumptions of this kind of models choice makers are assumed
to know both the link characteristics and their idiosyncratic random utility liε associated
to each link Since the choice makers maximize their utility this means that they will
choose the path with the lowest generalized cost in this model This way we have the
choice of individual i as
38 Karlstroumlm A Sundberg M amp Wang Q (2011) Consistently estimating flexible route choice models using an MNL lense
32
( )
arg min ( )o di i
iv v
Cπ
π πisinΩ
= (20)
in which oiv denotes the origin point of the trip for individual i and d
iv denotes the
destination ( )o di iv vΩ denotes all possible paths connecting the origin and destination in
the network for individual i which forms the choice set for the individual
When implementing the model we assume that the random utility component liε follows
a truncated normal distribution To be specific liε follows a standard normal distribution
yet with only the positive values retrieved This way we could guarantee that the link
costs are always positive so that additively the path would not have infinite loops With
this feature of the random component we could say that our model is probit-like Based
on this assumption the prerequisite of Dijkstrarsquos Algorithm is satisfied which always
needs positive edge values on the network We can use the Dijkstrarsquos Algorithm to find
the shortest paths iπ as an intermediate step in the implementation Apart from this we
assume that the unobserved cost captured by the random term is proportional to the
length of link To embody this in the cost function we add a fixed scale parameter to the
random term with a form of ( )Length l Lengthx Mean x in which ( )LengthMean x is the average
length of links in the network
We will assume that the data consists of J paths as dependent variables which means
that the dependent variables for the choice model are 1 Ji iy π == In addition the observed
characteristics of links in the network are provided 1 Ll lx x == To be specific we choose
to use two attributes of the links namely the length of the links Lengthx and the dummy
variable indicating the presence of speed bumps on the links SBx The cost function then
is specified as
( ) ( )l li Length Length l SB SB l li Length l Lengthc x x x x Mean xε β β ε= + + sdot (21)
Now the objective is to estimate the parametersβ in the model for which we will make
use of an auxiliary model
33
342 Auxiliary Model
Based on the idea of Indirect Inference we treat the route choice model defined above as
the basic model of interest which might have complex formation and be difficult to
estimate directly Then we need an auxiliary model to form a criterion which takes into
certain aspects of data to focus the analysis The auxiliary model needs not to reflect the
data generating process exactly as in the basic model yet it needs to include attributes of
interest in order for reference and to be easy to estimate We choose to use a logit model
for route choice as the auxiliary model since the logit model has always been a useful
tool for discrete choice analysis thanks to its analytical form and there is software for
estimating logit models which ensures that we can estimate very efficiently
As to the auxiliary model it is chosen to be a logit model for route choice We consider
that each individual i is choosing from a set of alternative routesr Each route r is given
a utility of riU
- Tri r ri r riU V Xε θ ε= + = + (22)
in which θ is the vector of auxiliary parameters which gives inference to the parameters
in the basic model One thing to be mentioned is that as expected the coefficients in the
utility function should have negative signs To make it easier for comparison with the
coefficients in the basic route choice model we assume the sign of θ to be positive per
se and add a negative sign ahead of it to guarantee that the coefficient part is negative as a
whole rX denotes route characteristics and riε is the random utility for each individual
which is assumed to follow an iid (independently identically distributed) Gumbel
distribution following the standard assumption of logit models
Note that as required for the auxiliary model it should be flexible enough to capture the
variability in the data and thus contains no fewer attributes than the basic model39 In
order to infer the parameters in the basic model and in consideration of efficiency we
pick the same attributes of interest in the basic models which are the link length Lengthx
and the speed bump dummy variableSBx So the utility function turns out to be
- -ri Length Length r SB SB r riU x xθ θ ε= + (23)
39 Karlstroumlm A Sundberg M amp Wang Q (2011) Consistently estimating flexible route choice models using an MNL lense
34
The probability of individual i choosing path r given an individual specific choice set
( )iI o d is
( )
ri
si
i
V
ri V
s I o d
eP
eisin
=sum
(24)
Theoretically we allow the individuals to choose from all possible paths between the
origin and destination in the network which intuitively could be infinite and impossible
to enumerate When implementing the model we generate the individual choice set based
on the basic route choice model Through simulation of the basic model we generate
infinite unique shortest paths for all the unique OD pairs by redrawing the random link
cost liε Without loss of generality the number of paths generated would be big enough
with fully consideration of efficiency We name the finite choice set composed by the
shortest paths generated as the pseudo-universal choice set ( )I o d which is a sample of
the infinite universal choice set The individual specific choice sets are generated by
randomly drawing certain number of paths out of the pseudo-universal choice set And
the size of individual specific choice set could be equal to or smaller than that of the
pseudo-universal one
The resulting individual specific choice set ( )iI o d describes a finite subset of all possible
paths connecting the origin oand destinationd for individuali When implementing the
methods the way of generating the choice set ( )iI o d for each individual i is viewed as
part of the auxiliary model
After the auxiliary model is built it could be estimated using a Maximum Likelihood
estimator based on the observed data of individual choices y and attributes variablesx
for individual 1 i N= hellip The estimate of parameters in the auxiliary model is
ɵ arg max ( )L y xθ
θ θ= (25)
in which ( )L y x θ is the log-likelihood function for the auxiliary model
Given the data of the link attributes xand some random draws of structural parameters
mβ 1 m M= hellip we can simulate choice data through the basic route choice model With
M draws of β from some given density we could simulate M sets of data resulting in
35
simulated choicesɶ( )my β Same as before parameters θ in the auxiliary model can be
estimated based on the simulated data as
ɶ ɶ( ) arg max ( ( ) )m m mL y xθ
θ β β θ= (26)
As the process indicated the simulated choice data depends on the structural parameterβ
in the basic route choice model and in sequence the estimates of parameters θ in the
auxiliary model depends on β when estimated based on the simulated data Based on
this theoretically we have a relationship of ( )θ β referred to as the binding function in
indirect inference literatures which we will discuss in detail for implementation of model
in this thesis A metric is then chosen to measure the distance between the observed and
simulated data viewed by the auxiliary model as a way to indirectly infer the values of
parameters β in the basic model To be specific for each draw of the structural parameter
mβ we can get the estimates of ɶ ( )m mθ β based on the simulated data and the distance
between ɶ ( )m mθ β and ɵθ measured by the chosen metric By doing more iteration with the
aim of minimizing the distance we will get the value of mβ which spurs the ɶ ( )m mθ β
closest toɵθ and this mβ is the inferred estimates of the parameter in the basic model
343 Consistency Discussion
The process of indirectly estimating parameters in the basic model is described above yet
we need to know whether the method we provide gives consistent estimation Here are
some discussions explaining the consistency in estimating by which consistency of the
estimator we proposed is illustrated
As proved the multinomial logit model (MNL) can be estimated consistently based on a
subset of alternatives (McFadden 1978)40 We may need to use the classical conditional
maximum likelihood estimator to deal with the problem at the same time the probability
that an individual n chooses an alternative i conditional on the subset of alternatives
denoted asnc becomes the conditional probability
40 McFadden D (1978) Modeling the Choice of Residential Location In A Karlqvist L Lundqvist F Snickars amp J Weibull (Ed) Spatial Interaction Theory and Residential Location (pp 75-96) Amsterdam North-Holland
36
ln ( | )
ln ( | )( | )in n
jn n
n
V q c i
n V q c j
j c
eP i c
e
micro
micro
+
+
isin
=sum
(27)
in which micro is a scale parameter and inV is the deterministic part of the utility There is a
term ln ( | )nq c j for correcting the sampling bias in which ( | )nq c j denotes the probability
of sampling nc given that alternative j is chosen
If all the alternatives in the choice set have the same probability to be chosen into the
subset the estimation on the subset of alternatives is equivalent to that on the full choice
set To be specific in this case ( | )nq c i is equal to ( | )n nq c j j cforall isin so by calculation the
term for sampling bias correction will cancel out in the probability function
In route choice context the alternative paths between an origin and a destination may be
in large amount and it is inefficient to give some very long-distance paths the same
probability as those short and attractive ones This means that we may need the
importance sampling method when generating subsets of alternatives which selects
attractive alternatives with higher probability than unattractive ones And the correction
term does not cancel out in this case Note that if alternative specific constants are
estimated we can get unbiased estimates of all the parameters except the constants even
if the correction term is not included in the utility function (Manski amp Lerman 1977)41
Back to the route choice context we tend to use large number of alternatives even with
subset of the full choice set which means that it is generally impossible to estimate the
constants and thus the correction term is essential To solve this problem Frejinger et al
(2009) developed a sampling approach in the context of route choice42
The discussion above focuses on the usage of MNL for route choice modeling When it
comes to our method the individual specific choice set is generated by randomly drawing
alternatives from the pseudo-universal choice set with the same probability yet there is
bias when generating the pseudo-universal ones since the pseudo-universal choice set is
composed of certain number of shortest paths between two nodes and this generating
process gives some paths higher probability to be included into the choice set So we
41 Manski C amp Lerman S (1977) The Estimation of Choice Probabilities from Choice Based Samples Econometrica 45 (8) 1977-1988 42 Frejinger E Bierlaire M amp Ben-Akiva M (2009) Sampling of Alternatives for Route Choice Modeling
37
actually use importance sampling to get the choice set which may consequently
introduce bias in estimating the parameterθ in the auxiliary model as discussed above
With the idea of indirect inference we consider only the relationship between θ andβ
denoted as( )θ β and use this relation to infer the value ofβ From this point of view
whether θ is estimated with bias or not does not matter since the relation between it and
β could always be captured which is the specific thing we focus on using the method of
indirect inference So we can say that even with biased subset of alternatives we could
still get consistent estimation by using indirect inference
344 Binding Function
As discussed in indirect inference method section when the sample size N increases
which means that we have more observations of choice the estimated parameter in the
auxiliary modelɶ ( )m mθ β will converge to a stable value ( )mθ β which is often referred
to as the binding function
Given that route choice model deals with discrete choices and by using indirect inference
we have a discrete choice model as the auxiliary model as well the estimates of binding
function ( )mθ β will inherit the discontinuous feature due to discrete individual choices
ɶ( )my β Keane and Smith (2003) proposed a solution of using logit-smoothing on the
simulated dependent choice data43 Following this idea we assume a continuous binding
functionɶ( )θ β for simplicity which could be approximated by a linear function locally
within small intervals With the M randomly drawn values of mβ and the corresponding
estimated parameters ɶ ( )m mθ β in the auxiliary model we could perform an Ordinary
Least Square (OLS) regression to estimate the local approximation of binding function
ɶ( ) c Dθ β β= + (28)
in which cdenotes the constant vector and D denotes the OLS parameter matrix44 To be
specific in our case each parameter in the auxiliary model will have a restriction
function with regard to both parameters in the basic model which is
43 Keane M amp Smith A (2003) Generalized Indirect Inference for Discrete Choice Models 44 Karlstroumlm A Sundberg M amp Wang Q (2011) Consistently estimating flexible route choice models using an MNL lense
38
ɶ1 11 12( )Length Length SBc d dθ β β β= + +
(29)
ɶ2 21 22( )SB Length SBc d dθ β β β= + +
(30)
Based on the observed data of choices y and explanatory variables xand the estimated
binding function which indicates the restrictions between ɶθ andβ we could use the
maximum likelihood method to give estimation of the parameters of interest The
likelihood ratio approach to indirect inference is following ideas of Smith (1993)45 and
Keane and Smith (2003)46
ɶ=arg max ( ( ))L y xβ
β θ β (31)
in which β is the estimate of the parameter of interest β in the basic economic model
With the restriction of binding function this is actually an indirectly inferred estimate In
line with the estimating process in auxiliary model ( )L sdot is the likelihood function of the
auxiliary model
Note that the form of binding function is based on an assumption in the result part we
will verify that this assumption is realistic
45 Smith A (1993) Estimating Nonlinear Time-series Models Using Simulated Vector Autoregressions 46 Keane M amp Smith A (2003) Generalized Indirect Inference for Discrete Choice Models
39
4 Data
41 Road Network
The data we use for estimation is based on a GPS data set collected in the Swedish city of
Borlaumlnge Borlaumlnge is located in the middle part of Sweden and has a population of about
47 000 inhabitants
The virtual road network contains 3077 nodes and 7459 unidirectional links (Frejinger amp
Bierlaire 2007)47 of which 3061 nodes and 7288 links are included in the network for
estimation Figure 3 gives a visual illustration of the road network in Borlaumlnge
Figure 3 Illustration of the Borlaumlnge road network
With regard to our research two of the link attributes are included namely link length
and speed bump dummy Link length is in the unit of km and speed bump dummy is an
indication of speed bump existence on the links which has the value 1 when there is a
speed bump on the link and 0 otherwise
Link length
47 Frejinger E amp Bierlaire M (2007) Capturing Correlation with Subnetworks in Route Choice Models
40
Some descriptive statistics of the link length data for the whole network is presented in
Table 1 below
Table 1 Descriptive statistics of link length
Number of links 7288
Minimum 0001
Maximum 7599
Mean 0184487
Median 0102
Variance 0103722
Lexis ratio (varmean) 1016884
Skewness 9871144
To describe the overall character of the link length attribute the histogram is shown in
Figure 4 below
Figure 4 Histogram of link length data
We could see that the link length data is quite clustered most of which lies within the
range of 01km and 06km Nonetheless there are some extreme values far away from the
range indicating extremely long links To display the variation in the relatively clustered
area we draw a histogram zoomed in the interval of (0 1km] shown Figure 5 in below
0
01
02
03
04
05
06
Fre
qu
en
cy
Link length (km)
Histogram
41
Figure 5 Histogram of link length data (zoomed within 1km)
Over 80 of all the links have length shorter than 03 km indicating concentration of
link length data
Speed bump dummy
Speed bump dummy is based on true situation in the network Of all the links 82 links
are equipped with speed bumps which account for a percentage of 113 The following
Figure 6 displays the locations of links with speed bumps
Figure 6 Illustration of links with speed bumps
0005
01015
02025
03035
04045
05
Fre
qu
en
cy
Link length (km)
Histogram(zoom in)
42
42 Observation Data
The GPS data set is collected as a part of the Swedish Intelligent Speed Adaptation (ISA)
study which aims at traffic safety effects of in-car information systems In the study 186
vehicles were equipped with GPS devices and traced within a radius of 25 km from the
center of Borlaumlnge The monitoring lasted for 30 days from 22th June 2000 to 4th March
2002 obtaining 49 667 vehicle days of travel and nearly a quarter of a million trips (for
more information on the GPS data set check Axhausen Schoumlnfelder Wolf Oliveira amp
Samaga 2003 Schoumlnfelder amp Samaga 2003 Schoumlnfelder Axhausen Antille amp Bierlaire
2002)48
The data collection is not originally designed for route choice analysis so the raw data
cannot be used in our research directly Extensive data processing is performed by the
company GeoStats in Atlanta to retrieve new data set available for route choice analysis
which contains 24 vehicles and 16 035 observations The final data set we use is provided
by Emma Frejinger which contains in total 1832 observations corresponding to 1458
observed unique routes made by 24 vehicles and 1409 unique origin-destination pairs
Considering that certain route may have been observed more than once we make a
distinction between observations and unique routes and number of unique routes should
be less than that of observations consistently with the numbers listed above
As indicated by data collection in the ISA study only licensed drivers with access to his
or her only car are recruited to minimize sharing or swapping of cars Minimum socio-
economic data of the drivers is included in data collection so we have no way to
understand driver characteristics from the data set Logically we make an assumption
that there is only one individual per vehicle
In the observation data a route is represented by a series of links and also an origin-
destination pair With relatively intensively distributed link length number of links could
48 Axhausen K Schoumlnfelder S Wolf J Oliveira M amp Samaga U (2003) 80 Weeks of GPS Traces Approaches to Enriching the Trip Information Transportation Research Record 1870 46-54 Schoumlnfelder S amp Samaga U (2003) Where Do You Want to Go Today-More Observations on Daily Mobility Third Swiss Transport Research Conference Ascona Schoumlnfelder S Axhausen K Antille N amp Bierlaire M (2002) Exploring the Potentials of Automatically Collected GPS Data for Travel Behaviour Analysis- A Swedish Data Source In J Moumlltgen amp A Wytzisk (Ed) GI-Technologien fuumlr Verkehr und Logistik number 13 Institut fuumlr Geoinformatik Universitaumlt Muumlnster (pp 155-179) Munster IfGIprints
43
be used to indicate total length of routes Some of the descriptive statistics of link number
is shown in Table 2 below
Table 2 Descriptive statistics of link numbers in observation data set
Number of observations 1832
Minimum 5
Maximum 106
Mean 202877
Median 16
Variance 1871968
Lexis ratio (varmean) 9227126
Skewness 1732597
For further overall inspection of link number distribution in the observation data set the
histogram is shown in Figure 7 below
Figure 7 Histogram of link numbers in observations data set
Seen from the histogram distribution of number of links is relatively dispersed with a
large range interval Judging by the statistics in general the routes observed have about
000
200
400
600
800
1000
1200
1400
1600
5 8
11
14
17
20
23
26
29
32
35
38
41
44
47
50
53
56
59
62
65
68
71
74
77
80
83
86
89
92
95
98
10
1
10
4
10
7
Mo
re
Fre
qu
en
cy
Number of links
Histogram
44
20 links in average Yet the data has a big variance which is reasonable As stated above
there are 1409 unique OD pairs for 1832 observations indicating that for most OD pairs
there is only one observation Spread within the detecting area different OD pairs could
have various numbers of links in between
Following our experiment design only a portion of the data could be used To be specific
routes with number of links fewer than ten would be eliminated when used for estimation
43 Further Exploration of data
Apart from the characters discussed above there are some other attributes in the data set
interesting to be explored Both in link attribute data set and observation data set there is
travel time data which to some extent is parallel with length in indicating distance
between two nodes
In the link attribute data set one attribute is denotes the estimated travel time of links in
unit of hour Some of the descriptive statistics is shown in Table 3 below switching unit
to minute
Table 3 Descriptive statistics of estimated travel time on links
Number of links 7288
Minimum 000186
Maximum 578268
Mean 0281696
Median 018744
Variance 0119337
Lexis ratio (varmean) 0423638
Skewness 5785361
Seen from Table 3 estimated travel time seems to have a more clustered distribution than
link length judging by lexis ratio and skewness Yet this time is roughly estimated not so
qualified as link length to use in estimation since the latter is much easier to measure and
guarantee precision
In the observation data set we have the duration time of the observations in the unit of
minute Some of the descriptive statistics is shown in Table 4 below
45
Table 4 Descriptive statistics of duration of trips
Number of observations 1832
Minimum 007
Maximum 316
Mean 4991195
Median 3925
Variance 1775639
Lexis ratio (varmean) 3557542
Skewness 2174728
Duration of trips can be used as an indication of distance between origin and destination
yet it is roughly measured and strongly affected by traffic condition on the road network
With similar reasons as discussed on estimated travel time on link we use number of
links instead of duration of trips to indicate the distance between OD pairs
46
5 Experiment Design
When doing the simulation-based estimation it is physically divided into two parts for
convenience of operation As discussed in the method section we choose to use a pseudo-
universal choice set which is generated and stored in the first part and ready for use in
the following experiment Then in the second part we do the simulation-based
experiment to carry out indirect inference method for estimating the parameters of
interest in the basic model β to be specific The Figure 8 below illustrates an abstracted
flow of how the estimation is carried out given certain origin-destination pair
Figure 8 Illustration of the flow in the experiment
As shown in the flow chart we get all the unique OD pairs in the trip data For each of
the OD pairs the Dijkstrarsquos algorithm is used to find the shortest paths between them
without duplicates We set the intended number of paths to be 400 as well as time
terminator in case not enough paths could be generated within certain bearable time
47
interval The generated paths form the pseudo-universal choice set of each OD pair
which is stored for future use Note that we abandon some OD pairs with too few paths
in the pseudo-universal choice set Observations containing the kept OD pairs are used
for following estimation which turns out to be 940 of them
For the OD pair in a given observation 200 alternatives are randomly drawn from the
pseudo-universal choice set and the sequential links in the observation itself is read as an
alternative path The 201 paths compose the observed choice set On the other hand a
given value of mβ is drawn from a predefined domainD The shortest path is generated
based on the given mβ as the simulated observation Like in the observed choice set part
200 alternatives are randomly drawn from the pseudo-universal choice set to form the
simulated choice set together with the simulated observation The auxiliary model is
estimated based on the simulated choice set and we could get a set of ɶ( ( ))mm mβ θ β pairs
which will be used to estimate the binding function Based on the binding function and
the observed choice set the parameters in the basic model could be indirectly estimated
The process described above is abstracted with no illustration of iterations Since this is
an experiment based on simulations certain loops of iteration should be carried out to get
statistics of the results
Given observed trip data at first we have no idea of the value of β In the process of
retrieving value ofβ the estimation process is repeated for several stages denoted asS
starting from a rough guess of the domainsD while for each following stage the domain
shrinks Since we tend to use a local OLS regression to approximate the smooth binding
function the draws of smβ need to be around the true value to prevent misspecification of
OLS regression due to the possibly inherent nonlinearity of the binding function The
estimated 0
β is not satisfactory in precision in the first stage yet it could give a hint of
where the true value lies The domain1D is centered on 0
β with smaller interval before
the estimation in the second stage This way +1sD is dependent on sD with smaller
interval As it goes on we will get a more accurate domain and as a result a well specified
OLS regression to approximate the binding function
48
The process of experiment with iterations is described below Suppose that we have the
experiment carried out for K times and the number of observations used isN
for run 1 k K= hellip for true observation 1 i N= hellip
Randomly draw alternatives from the pseudo-universal choice set end Form the observed choice sety for stage 1 s S= hellip
for 1 m M= hellip
Draw ksmβ from the domain ksD
Simulate paths for OD pairs in the used observations with mβ
for simulated observation 1 i N= hellip Randomly draw alternatives from the pseudo-universal choice set end
Form a simulated route choice setɶ( )ksmy β
Estimate ɶ ( )ks ksm mθ β in Equation (26)
end
Estimate ɶ ( )ks
θ β in Equation (28)
Estimate ks
β in Equation (31) end
Center the domain 1k sD + on ks
β and shrink the interval end
As a trial we first do the experiment on a route choice model with one parameter link
length to be specific For simplicity the random term is not scaled as described in the
model specification section which means we attach a truncated normally distributed
random term to the cost function without scaling it with link length After getting the
estimation of Lengthβ we move on to estimating the route choice model with both
parameters as described in the model specification Results under these two formulations
of models are presented separately in the result part
49
6 Results
61 Validation of Binding Function
As discussed in the binding function section we assume the binding function to be
continuous and feasible to be approximated by a linear function locally The assumption
of binding function can be verified based on the ɶ( ( ))mm mβ θ β pairs we attained as
intermediate results To explain this more explicitly we carry out a simple example with
only one parameter in the route choice model Lengthβ to be specific
The cost function is specified as
( )l li Length Length l lic x xε β ε= + (32)
corresponding to which the auxiliary model is
-ri Length Length r riU xθ ε= + (33)
For each run 10 values ofLengthβ are evenly drawn from a given domain By simulating
observations and estimating the auxiliary model 10 corresponding Lengthθ are generated to
form ten ɶ( ( ))mm mβ θ β pairs As assumed the binding functionɶ( )θ β is continuous which
could be approximated by a linear function locally To display the trend of binding
function we choose a relatively large domain for Lengthβ in the beginning [010]D = and
carry out 10 runs which generate 100 points in the beta-theta diagram shown in Figure 9
below
Figure 9 Scatter plots of the 90 beta-theta pairs
y = 12804x + 16264
Rsup2 = 09959
0
2
4
6
8
10
12
14
16
0 2 4 6 8 10
the
ta_
len
gth
beta_length
50
We do OLS regression for the dots and estimate the binding function Intuitively the
smaller the domain is the more accurate is the approximation of the binding function We
shrink the input domain based on the final estimate of Lengthβ from last trial
As it turned out to be we choose an input domain of [1214]D = for Lengthβ and the
binding function is assumed to take the form of
ɶ1 11( )Length Lengthc dθ β β= +
(34)
The result for one run is displayed in Figure 10 below
Figure 10 OLS regression based on the 10 beta-theta points from one run
The estimated binding function based on the 10 points is
ɶ ( ) 17371+10838Length Lengthθ β β= (35)
as indicated by 2 09783R = the function describes the trend of points very well Since
the interval is quite small we could use the estimated function to approximate the
binding function
When it comes to more parameters in the route choice model what we do is simply to
add more elements in the binding function After getting a vector of β and the
corresponding vector ofɶ( )θ β binding functions of each element in vector ɶ( )θ β with
y = 17371x + 10838
Rsup2 = 09783
315
32
325
33
335
34
345
35
355
12 125 13 135 14
the
ta_
len
gth
beta_length
51
regard to all the elements in vector β are estimated One example is shown in the
Equation (29) and Equation (30)
62 Estimation of model with one attribute
The route choice model with one attribute we used is the one described in Section 61
above After several trials by shrinking input interval every time we finally affirm that
the true value Lengthβ of lies in a relatively small interval of [12 14] Based on this
domain 50K = runs are carried out to get statistics of the estimate of Lengthβ As
discussed in the experimental design several stages Smean different trials before final
affirmation of input interval yet for the statistics only one stage is carried out for each
run Within each run 10M = values of input Lengthβ are drawn for estimating binding
function
The estimation statistics of Lengthβ is shown in Table 5 below
Table 5 Statistics of estimation of beta_length
Parameter Lengthβ
Mean 1337353
Standard deviation 0107537
RMSE 0013227
In the table RMSE is the root-mean-square error which is used to measure the distances
between the observed values being estimated and the predicted values by the estimator
The individual differences are called residuals and RMSE is an aggregated measure of
the residuals To be specific
ɵ ɵ ɵ 2( ) ( ) (( ) )RMSE MSE Eθ θ θ θ= = minus (36)
in which ɵθ is the estimator and θ is the parameter to be estimated so the RMSE is the
square root of the mean square error As defined the smaller the value of RMSE is the
better the estimator is
52
Here the RMSE is calculated based on the ten points ɶ( ( ))mm mβ θ β for estimating binding
function so basically it describes the goodness of fit of the estimated binding function
with regard to the points we generated The Equation (36) is specified as
ɶ 2( ( )) (( ( ) ( )) )mm m mRMSE Meanθ β θ β θ β= minus (37)
The value of RMSE displayed in the Table 5 is the mean value of all the RMSE values
for 50 runs Seen from this we have well-estimated binding function for all the 50 runs
on average In terms of the estimates of binding function taking the one in Section 61 as
an example the binding function estimated in the interval of [12 14] in Equation (35)
has a positive constant and a positive coefficient for Lengthβ which indicates that with
larger value of Lengthβ we will get larger value ofɶ Lengthθ and as a result a negative
coefficient for length in the utility function of the logit model This is reasonable for
bigger Lengthβ reveals larger incremental effect on the cost of certain path while lower
ɶ- Lengthθ reveals larger disutility effect on certain path these two effects are in fact
equivalent
By the way the high fitness of binding function is probably due to the relatively small
input interval of Lengthβ after certain trials and shrinkage As the final estimate indicates
Lengthβ falls right into the interval of [12 14] with small standard deviation So we can
say that the estimate is quite good
63 Estimation of model with two attributes
We use the model described in the model specification section to carry out the estimation
Two attributes are used namely length and speed bump dummy Similar to the one
attribute case we carried out several trials and shrinkage to finally determine the
relatively small input intervals forLengthβ and SBβ [05 1] and [0 05] respectively
50K = runs are carried out to get statistics of the estimates of the two parameters Within
each run 10M = values are drawn for inputs Lengthβ and SBβ respectively for estimating
binding function
53
One important thing to mention here is that the inputs are drawn evenly from the domain
yet to guarantee that the values of Lengthβ and SBβ are independent from each other or to
get rid of collinearity49 the domains of two parameters are defined in two dimensions To
explain this more explicitly we choose data of one run as an example The input points of
( Lengthβ SBβ ) are shown in Figure 11 below
Figure 11 Scatter plot of the input values for beta_length and beta_sb
We can see from Figure 11 that the points spread evenly in the domain quadrant Based
on these draws we could estimate the binding function and evaluate the relationship
between parameters in the logit model and Lengthβ and SBβ without worrying about
possible correlation between Lengthβ and SBβ
As discussed before in the binding function we are supposed to find the relationship
between each of the parameters in the logit model and both parameters in the route choice
model Mathematically this binding function should be a surface in the 3D coordinate
system We take the results of one run as an example and thus we have ten sets of Lengthβ
and SBβ along with corresponding ɶ Lengthθ andɶ SBθ
49 A set of points is collinear if they lie on a single straight line or a projective line (for example projective line over any field) and this way the two factors represented by the points are correlated
0
005
01
015
02
025
03
035
04
045
05
05 06 07 08 09 1
be
ta_
sb
beta_length
54
For the first binding function ɶ Lengthθ and ( Lengthβ SBβ ) are plotted in Figure 12 below
And the binding function takes a form as described in Equation (29)
Figure 12 Scatter plot of theta_length with regard to beta_length and beta_sb
By multi-linear regression we can get a surface to approximate the binding function
locally The estimated binding function is displayed in Figure 13 below
Figure 13 Display of the estimated binding function for theta_length
And the first binding function has a formula of
55
ɶ 18234+16933 +00633Length Length SBθ β β= (38)
For the second binding function ɶSBθ and ( Lengthβ SBβ ) are plotted in Figure 14 below
And the binding function takes a form as described in Equation (30)
Figure 14 Scatter plot of theta_sb with regard to beta_length and beta_sb
By multi-linear regression we can get a surface to approximate the binding function
locally The estimated binding function is displayed in Figure 15 below
Figure 15 Display of the estimated binding function for theta_sb
56
And the second binding function has a formula of
ɶ -06698+00371 +17619SB Length SBθ β β= (39)
The t-test of estimated parameters in the binding function is carried out with null
hypothesis of zero Estimates that are significantly different from zero with 95
confidence interval are marked as bold
Table 6 Estimated coefficients of binding function for model with two attributes
Constant Lengthβ SBβ
ɶLengthθ 18234
(43632) 16933
(33481) 00633 (1392)
ɶSBθ -06698
(-7991) 00371 (0366)
17619 (19323)
Seen from the magnitude of coefficients in the binding functions both Lengthβ and SBβ
have positive effect on ɶ Lengthθ andɶ SBθ and in sequence negative effect on the coefficients
in the logit model In addition coefficients of SBβ with regard to ɶ Lengthθ and Lengthβ with
regard to ɶ SBθ are not significantly different from zero so we can say Lengthβ has a more
apparent effect on ɶ Lengthθ than SBβ does while SBβ has a more apparent effect on ɶ SBθ
than Lengthβ does
Based on the estimated binding functions and the true observation data we could get the
estimates of Lengthβ and SBβ as shown in Table 7 below
Table 7 Statistics of estimation of beta_length and beta_sb
Parameter Lengthβ
SBβ
Mean 0761383 0079874
Standard deviation 0068493 0034375
RMSE 0022772 0085113
Seen from the RMSE results the relatively small values indicate that we have well-
estimated binding functions for all the 50 runs on average With regard to the estimates of
parameters in the route choice model both of them fall into the input domain we choose
57
and the standard deviation is quite small So we can say that the estimates are actually
very good
One thing to notice here is that the final estimate of Lengthβ falls approximately in the
middle of the input domain [05 1] while the estimate of SBβ falls closer to the left limit
which might need further shrinkage of input domain and more precise estimate of the
binding function To get rid of this we use the binding function estimate from all the 500
points to give a hint on the reasonability of acceptance of the estimate of SBβ The scatter
plots of theta_sb against beta_sb and beta_length are shown in Figure 16 below
Figure 16 Scatter plots of theta_sb against beta_sb and beta_length
The scatter plots in Figure 16 above are the decompositions of the binding function from
three dimensions to two dimensions Seen from the linear regression in the two plots ɶSBθ
is almost strictly positive proportional to SBβ and hardly effected byLengthβ This means
y = 19132x - 06404
Rsup2 = 0936
-1
-08
-06
-04
-02
0
02
04
06
0 01 02 03 04 05
the
ta_
sb
beta_sb
y = 00123x - 01717
Rsup2 = 4E-05
-1
-08
-06
-04
-02
0
02
04
06
05 06 07 08 09 1
the
ta_
sb
beta_length
58
that by shrinking the input domain ofSBβ we would probably get the same estimate of
binding function since it changes little in current domain And this leads to our
acceptance of the final estimate of SBβ
Given that we have a random cost following a truncated standard normal distribution and
the magnitudes of the estimated parameters are relatively small this would mean that the
randomness of the cost function are relatively large which in sequence leads to relatively
large randomness in individualrsquos choice of route
Another thing to be mentioned is that the magnitude of Lengthβ is smaller than that when
estimated singly Though these two values are not logically comparable with different
formation of random term in the cost function we could still get a hint from the
comparison This difference is probably due to the form of random cost we used which is
( )li Length l Lengthx E xε sdot and the effect of length on the cost is partially captured by this
random term
64 Estimations of other trial formulations of the model
641 Model with exponential form of cost function
During the process of estimation we carried out a lot of other trials in the formulations of
the basic route choice model the cost function to be specific and the auxiliary logit model
As it turned out the there are negative estimates of coefficients in the cost function
which conflicts our anticipation To capture this kind of negative estimation we choose to
use the exponential form of the cost function Without loss of generality the random term
is not scaled by the length of links The cost function is specified as
( ) Length Length l SB SB l lix x
i lic x eβ β εε + += (40)
Two attributes are used namely length and speed bump dummy variable Unlike the form
in Section 63 we allow the parameters Lengthβ and SBβ to have negative input and the
random term liε now follow a standard normal distribution without truncation Since we
take the exponential form of the cost function the cost of links could be kept positive
thus allowing the use of Dijkstrarsquos Algorithm to operate
59
In terms of the auxiliary model since we could have more attributes in the auxiliary
model than the underlying model Instead of using the same attributes as in the cost
function we choose to add an attributes which is number of links in the pathLNx So the
utility function of the logit model is specified as
- - -ri Length Length r SB SB r LN LN r riU x x xθ θ θ ε= + (41)
We still expect the value of θ to be positive and the coefficient of variables with the form
of -θ would be negative
Several trials and shrinkage were carried out for this formulation of our model to finally
determine the relatively small input intervals forLengthβ and SBβ [25 27] and [-05 0]
respectively 15K = runs are carried out to get statistics of the estimates of the two
parameters Within each run 10M = values are drawn for inputs Lengthβ and SBβ
respectively for estimating binding function
To visualize the trend of binding function more clearly we make use all the 150 sets of
vector β and vector θ to estimate the binding function Since we have three variables in
the logit model we have to estimate three binding functions
For the first binding function ɶ Lengthθ and ( Lengthβ SBβ ) are plotted in Figure 17 below
shown along with the estimated binding function
Figure 17 Scatter plot of theta_length against beta_length and beta_sb estimated binding function
The first binding function takes the form of
ɶ 41312+09114 +44845 10Length Length SBθ β βminus= sdot (42)
60
For the second binding function ɶSBθ and ( Lengthβ SBβ ) are plotted in Figure 18 below
shown along with the estimated binding function
Figure 18 Scatter plot of theta_sb against beta_length and beta_sb estimated binding function
The second binding function takes the form of
ɶ 01147 01362 +07119SB Length SBθ β β= minus (43)
For the third binding function ɶ LNθ and ( Lengthβ SBβ ) are plotted in Figure 19 below
shown along with the estimated binding function
Figure 19 Scatter plot of theta_ln against beta_length and beta_sb estimated binding function
The third binding function takes the form of
ɶ 10043 03378 +00068LN Length SBθ β β= minus (44)
The t-test of estimated parameters in the binding function is carried out with null
hypothesis of zero Estimates that are significantly different from zero with 95
confidence interval are marked as bold
61
Table 8 Estimated coefficients of binding functions for model with exponential cost function
Constant Lengthβ SBβ
ɶLengthθ 1312
(2411) 09114 (4360)
4484510-4 (0005)
ɶSBθ 01147
(0425) -01362 (-1314)
07119 (17221)
ɶLNθ 10043
(13767) -03378
(-12051) 00068 (0607)
Same as in the model with two attributes ɶ Lengthθ andɶ SBθ are significantly affected by
Lengthβ and SBβ respectively The negative signs for Lengthβ in the second and third binding
functions draw our attention Since in the second binding function it is not significantly
different from zero we can disregard the effect In the third binding function Lengthβ has
significantly negative effect on ɶ LNθ The larger value of Lengthβ we have the more
influential of path length on cost is With negative effect on ɶ LNθ we can say at the same
time number of links become less influential on the utility This is reasonable since
intuitively if we are sensitive to the path length we wouldnrsquot care too much of having to
switch several more or fewer links based on that path length and number of links are
more or less correlated to each other
Based on the estimated binding functions and the true observation data we could get the
estimates of Lengthβ and SBβ as shown in Table 9 below
Table 9 Statistics of estimation of beta_length and beta_sb in exponential-cost-function model
Parameter Lengthβ
SBβ
Mean 2537672 -045601
Standard deviation 0068377 0133036
We have negative estimate of SBβ which conflicts our assumption that length and
presence of speed bump on the path may increase the cost of traveling through certain
path This is probably due to omission of important attributes in the deterministic part of
the cost function Based on the estimate we are led to think that presence of speed bump
decrease the cost and individuals would prefer to drive on paths with speed bumps Yet
62
this is not true based on our estimation since we are only using two attributes And there
are great chance that some important features are not captured which accidentally are
related with speed bump So the estimate of SBβ is misleading per se in the simple model
as we are using To get more accurate estimate of SBβ we may need to include more
variables in the deterministic part of the cost function
642 Model with estimated scale parameter for random term
Considering the trial with two attributes in Section 63 we add a fixed scale parameter to
the random term to make it proportional to the length of links This appeals to our
assumption yet lays restrictions to the model Apart from this we also try to add an
unfixed scale parameter σ and estimate it along with the other two parameters Lengthβ and
SBβ Note that if we add a scale parameter directly to the random term it wonrsquot work out
as we expect since that way the scale parameter will scale the other two parameters
Lengthβ and SBβ as well as shown below
= ( )Length SBLength Length l SB SB l li Length l SB l lix x x x
β ββ β ε σ σ εσ σ
+ + sdot + + (45)
The right side equation is equivalent to Length Length l SB SB l lix xβ β ε+ + thus making no
difference So we choose to add a new random term including the scale parameter In
addition since we can get good estimate by assuming the random term proportional to
length we will keep this in the newly added random term Now the cost function is
specified as
1 ( ) + ( )l li li Length Length l SB SB l li li Length l Lengthc x x x x Mean xε ε β β ε η σ= + + sdot sdot 2
(46)
liε and liη follow the same truncated normal distribution but are drawn separately so that
they are not equal
In terms of the auxiliary model since now we have three parameters to be estimated in
the underlying model we need one more attribute in the logit model and number of links
in the path LNx is chosen The utility function of the logit model is actually the same as in
Section 641 which is
- - -ri Length Length r SB SB r LN LN r riU x x xθ θ θ ε= + (47)
63
With three parameters in the underlying model it is more reasonable to include
interactions of parameters in the binding function The binding functions take the form of
ɶ
1 2 3
4 5 6 7
( )
Length SB
Length SB Length SB Length SB
c d d d
d d d d
θ β β β σβ β β σ β σ β β σ
= + + +
+ + + + (48)
Since the estimates are not good we did not carry out too many trials to center the input
interval As a result the binding function may be of more interest in this case The chosen
interval is a trial one which is identical [0 3] for Lengthβ SBβ andσ We choose ten sets of
mβ and ɶ ( )m mθ β from one run as an example The values of ɶ ( )m mθ β are plotted against
Lengthβ SBβ andσ respectively The interactions are not shown in the figure yet we have
the estimates of binding function which will give a numerical description of how the
interactions impact theɶ ( )m mθ β
Figure 20 Plots of theta_length against beta_length beta_sb and sigma respectively
y = 09114x + 27818
Rsup2 = 07361
0
1
2
3
4
5
6
0 1 2 3 4
the
ta_
len
gth
beta_length
y = 03568x + 36215
Rsup2 = 00897
0
1
2
3
4
5
6
0 1 2 3 4
the
ta_
len
gth
beta_sb
y = 02572x + 38468
Rsup2 = 00516
0
1
2
3
4
5
6
0 1 2 3
the
ta_
len
gth
sigma
64
Figure 21 Plots of theta_sb against beta_length beta_sb and sigma respectively
y = 02363x + 0835
Rsup2 = 0088
0
05
1
15
2
25
3
0 1 2 3 4
the
ta_
sb
beta_length
y = 06351x + 01759
Rsup2 = 05054
0
05
1
15
2
25
3
0 1 2 3 4
the
ta_
sb
beta_sb
y = -03801x + 17212
Rsup2 = 02001
0
05
1
15
2
25
3
0 1 2 3
the
ta_
len
gth
sigma
y = 00477x + 04521
Rsup2 = 005460
02
04
06
08
1
0 1 2 3 4
the
ta_
ln
beta_length
y = -00553x + 06156
Rsup2 = 00582
0
02
04
06
08
1
0 1 2 3 4
the
ta_
ln
beta_sb
65
Figure 22 Plots of theta_ln against beta_length beta_sb and sigma respectively
As we can see from the three figures above ɶ Lengthθ ɶSBθ and ɶ LNθ are more affected by
Lengthβ SBβ andσ respectively Especially we can see a strong relationship between ɶ LNθ
and σ which assures that number of links can be used to infer the scale parameter in the
underlying model
The estimates of three binding functions are shown in Table 10 below with each row
representing the estimates for one of the three binding function and each column
representing certain variable in the binding function In the parenthesis below each
estimate of the coefficients is the t-test value with the null hypothesis of zero We take the
90 confidence interval and estimates with t-test value larger than 164 are supposed to
be significantly different from zero which are marked as bold
Table 10 Estimates of three binding functions
Constant Lengthβ SBβ σ
Length SBβ β
Lengthβ σ
SBβ σ Length SBβ β σ
ɶLengthθ
1814 (3085)
0861 (2417)
-0089 (-0258)
1038 (2913)
0202 (1030)
-0246 (-1240)
-0056 (-0292)
-0045 (-0412)
ɶSBθ 0284
(1482) -0125
(-1081) 0942
(8371) -0247
(-2127) 0118
(1856) 0070
(1086) -0141
(-2275) -0067
(-1883)
ɶLNθ 0819
(18643) 0015
(0577) -0026
(-0997) -0261
(-9794) 0006
(0419) 0007
(0498) 0024
(1663) -0007
(-0803)
As the constants indicate given no other attributes length and number of links have more
negative effects on the utility than the speed bump dummy does Judging from the
significance of coefficients for the three input parametersɶ Lengthθ ɶSBθ and ɶ LNθ are
significantly affected by Lengthβ SBβ andσ respectively As we can see σ has a negative
y = -02164x + 08218
Rsup2 = 09867
0
02
04
06
08
1
0 1 2 3th
eta
_ln
sigma
66
effect on ɶSBθ andɶ LNθ Since to some extent σ measures the scale of randomness we
could say that the more randomness of the costs on the links have the less influential of
presence of speed bump and number of links become ForɶSBθ it is significantly affected
by some of the interaction terms Notice that SBβ has positive effect onɶSBθ while σ has
effect The interaction terms including both σ and SBβ have negative effect onɶSBθ which
indicates that randomness of cost is more influential than presence of speed bump on the
disutility of speed bump
In terms of the final estimate as stated above the estimates of Lengthβ and SBβ have
negative signs whileσ has positive sign This result conflict our expectation that Lengthβ
and SBβ should have positive signs so we did not carry out more trials and shrinkage The
possible reason for negative estimate is similar to that in the model with exponential form
of cost function Given more attributes in the deterministic part of both the cost function
and utility function in the logit model we might be able to capture the features of the data
better and have the right sign in the final estimates
643 Monte Carlo evidence of model with estimated scale parameter for random
term
Based on the model formulation with estimated scale parameter for random term we also
carried out a Monte Carlo simulation experiment to verify the efficiency of using number
of links in the logti model to infer the scale parameter in the cost function and what we
do is to simulated observations instead of the true ones
We take three arbitrary values for the three parameters in the cost functionLengthβ SBβ and
σ to be 05 And simulated observations are generated based on the given values of
parameters in the cost function Since we know the true values for the parameters the
input domain is centered around the true values to be [04 06] for Lengthβ SBβ andσ
10K = runs are carried out to get statistics of the estimates of the three parameters
Within each run 10M = values are drawn for inputsLengthβ SBβ andσ respectively for
estimating binding function
67
In terms of the binding function by doing regression test we can see that the intersection
terms are unnecessary to be included or even hazardous for good estimate of binding
function so we decide to remove them and keep the binding function as
ɶ1 2 3( ) Length SBc d d dθ β β β σ= + + + (49)
We choose ten sets of mβ and ɶ ( )m mθ β from one run as an example The values of
ɶ ( )m mθ β are plotted againstLengthβ SBβ andσ respectively
Figure 23 Plots of theta_length against beta_length beta_sb and sigma respectively
y = 23826x + 14791
Rsup2 = 05326
15
2
25
3
35
04 05 06
the
ta_
len
gth
beta_length
y = -06434x + 30245
Rsup2 = 0048115
2
25
3
35
04 05 06
the
ta_
len
gth
beta_sb
y = 26255x + 14156
Rsup2 = 07607
15
2
25
3
35
04 05 06
the
ta_
len
gth
sigma
y = -02443x + 04708
Rsup2 = 0034
0
01
02
03
04
05
04 05 06
the
ta_
sb
beta_length
y = 11233x - 02096
Rsup2 = 089020
01
02
03
04
05
04 05 06
the
ta_
sb
beta_sb
68
Figure 24 Plots of theta_sb against beta_length beta_sb and sigma respectively
Figure 25 Plots of theta_ln against beta_length beta_sb and sigma respectively
The figures show similar trend to those in the trial model with estimated scale parameters
which is in line with our expectation
The estimates of three binding functions are shown in Table 11 below with each row
representing the estimates for one of the three binding function and each column
y = -04374x + 056
Rsup2 = 01283
0
01
02
03
04
05
04 05 06
the
ta_
sb
sigma
y = -01144x + 07619
Rsup2 = 01114066
067
068
069
07
071
072
073
074
04 05 06
the
ta_
ln
beta_length
y = 0053x + 06768
Rsup2 = 00296066
067
068
069
07
071
072
073
074
04 05 06
the
ta_
ln
beta_sb
y = -03115x + 08561
Rsup2 = 09717
066
067
068
069
07
071
072
073
074
04 05 06
the
ta_
ln
sigma
69
representing certain variable in the binding function In the parenthesis below each
estimate of the coefficients is the t-test value with the null hypothesis of zero We take the
95 confidence interval and estimates with t-test value larger than 196 are supposed to
be significantly different from zero which are marked as bold
Table 11 Estimates of three binding functions in the Monte Carlo experiment
Constant Lengthβ SBβ σ
ɶLengthθ 0853
(3606) 1009
(3724) -0034
(-0125) 2569
(9482)
ɶSBθ -0062
(-0385) -0104
(-0564) 1208
(6591) -0226
(-1227)
ɶLNθ 0854
(46688) 0013
(0624) -0004
(-0185) -0302
(-14428)
The estimates of binding function have similar characteristics as in the trial model with
estimated scale parameters as well They contain almost the same significant coefficients
and those significant estimates have the same signs as in the trial with true observations
Based on the estimated binding function and the simulated observations given true values
of the three parameters to be 05 the final estimates of Lengthβ SBβ andσ are shown in
Table 12 below
Table 12 Statistics of estimation of beta_length beta_sb and sigma in the Monte Carlo experiment
Parameter Lengthβ
SBβ σ
Mean 0404138359 0458624533 0639191487
Standard deviation 1109279424 0242570421 0377069799
As we can see the estimates of Lengthβ SBβ andσ are quite close to their true values What
is not satisfying is that the estimate of σ is a little large and lies outside the input domain
of [04 06] but is still quite near to this interval In addition the estimate of Lengthβ is
within the input domain yet the variation is large This is understandable since we scale
the random term by length together with the scale parameter and thus the parameter for
length could be influenced by the random term and turns out to have large variations In a
word the result of Monte Carlo experiment verifies that we get use the model
70
formulation with unfixed scale parameter for the random term to get the right estimate of
the true values And number of links is strongly related withσ which means that it is
reasonable and efficient to use it as a reference to σ in the cost function
71
7 Conclusions
This thesis aims at implementing the newly proposed route choice model based on
indirect inference in true observations The model assigns links specific errors for a
network which allows natural correlations among paths and is practical in simulating
observations by means of shortest path searching algorithms like the Dijkstrarsquos Algorithm
used in our experiment To get consistent estimation of this kind of model indirect
inference method is used and a simple model like logit model is used as an auxiliary
model The route choice model and indirect inference estimator has been tested on
synthetic data with simulated observations and proved to be capable of consistently
estimated
Compared to the synthetic experiment some extensions are done in this thesis By
replacing the simulated observations with the true observations the method is tested on
the empirical circumstance to prove that it could be used in solving practical problems
The true observations have more noises than the simulated ones thus more difficulty to
capture their features We know neither the right formulations of models based on the
data nor the values of parameters in the route choice model yet as defined the
parameters should have positive signs As it turned out to be in the experiment with only
length in the model we get the estimates of Lengthβ as 1337 while with two attributes in
the model we get the estimates of Lengthβ and SBβ as 0761 and 00799 respectively The
estimates in both experiments seem reasonable with the right sign In addition seen from
the estimation of the binding function the coefficients in the logit model is negatively
affected by the parameters they infer in the basic route choice model in the two attributes
case one parameter in the logit model is more apparently affected by the parameter it
refers than the other parameter in basic model
In the trial where we include a scale parameter to the random term and estimate it along
with the other parameters in the route choice model a Monte Carlo simulation
experiment is carried out using simulated observations The result shows that it is
efficient to use number of links in the auxiliary model to infer the scale parameter in the
basic rout choice model
72
In other trial formulations of the model we got negative estimates which may probably
be due to missing attributes in the cost function Future work should be done to include
more attributes
Another thing to recommend for future is that we generate the pseudo-universal choice
set as part of the auxiliary model Since the pseudo-universal choice set is partially used
for deciding which ODs and observations to be used in the project it is essential and
should be generated beforehand But from the choice set generation point of view we
could generate individual specific choice set directly instead of random drawing paths
from the pseudo-universal choice set This would increase computational efficiency
73
Bibliography
Axhausen K Schoumlnfelder S Wolf J Oliveira M amp Samaga U (2003) 80 Weeks of
GPS Traces Approaches to Enriching the Trip Information Transportation Research
Record 1870 46-54
Azevedo J Costa M Madeira J amp Martins E (1993) An Algorithm for the Ranking
of Shortest Paths European Journal of Operational Research 69 (1) 97-106
Bartels K Boztug Y amp Muumlller M (1999) Testing the Multinomial Logit Model
Working paper University Potsdam Germany
Bekhor S Ben-Akiva M amp Ramming M (2002) Adaptation of Logit Kernel to Route
Choice Situation Transportation Research Board of the National Academics 1805 78-85
Bekhor S Ben-Akiva M amp Ramming M (2006) Evaluation of Choice Set Generation
Algorithms for Route Choice Models Annals of Operations Research 114 (1) 235-247
Ben-Akiva M amp Bierlaire M (1999) Discrete Choice Methods and Their Applications
to Short Term Travel Decisions In Chapter for the Transport Science Handbook
Preliminary Draft
Ben-Akiva M amp Bierlaire M (2003) Discrete Choice Models with Applications to
Departure Time and Route Choice In Handbook of Transportation Science (second ed)
Kluwer
Ben-Akiva M amp Bolduc D (1996) Multinomial Probit with a Logit Kernel and a
General Parametric Specification of the Covariance Structure Working Paper
Ben-Akiva M amp Lerman S (1985) Discrete Choice Analysis Theory and Application
to Travel Demand MIT Press
Ben-Akiva M Bergman M Daly A amp Ramaswamy R (1984) Modeling Inter Urban
Route Choice Behaviour In J Vollmuller amp R Hamerslag (Ed) the 9th International
Symposium on Transportation and Traffic Theory (pp 299-330) Utrecht Netherlands
VNU Science Press
Cascetta E Nuzzolo A Russo F amp Vitetta A (1996) A Modified Logit Route Choice
Model Overcoming Path Overlapping ProblemsSpecification and Some Calibration
Results for Interurban Networks In J Lesort (Ed) the 13th International Symposium on
Transportation and Traffic Theory Lyon France
74
Creel M (2009) A Data Mining Approach to Indirect Inference Universitat Autonoma
de Barcelona Department of Economics and Economic History
De La Barra T Peacuterez B amp Anez J (1993) Multidimensional Path Search and
Assignment 21st PTRC Summer Meeting (pp 307-319)
Dijkstra E (1959) A note on two problems in connexion with graphs Numerische
Mathematik 1 269-271
Frejinger E amp Bierlaire M (2007) Capturing Correlation with Subnetworks in Route
Choice Models Transportation Research Part B 41 363-378
Frejinger E Bierlaire M amp Ben-Akiva M (2009) Sampling of Alternatives for Route
Choice Modeling Transportation Research Part B Methodological 43 (10) 984-994
Gallant A amp McCulloch R (2004) On the Determination of General Scientific Models
Manuscript Duke University
Gourieacuteroux C Monfort A amp Renault E (1993) Indirect Inference Journal of Applied
Econometrics 8 85-118
Karlstroumlm A Sundberg M amp Wang Q (2011) Consistently estimating flexible route
choice models using an MNL lense International Choice Modeling Conference Leeds
Keane M amp Smith A (2003) Generalized Indirect Inference for Discrete Choice
Models Manuscript Yale University
Manski C amp Lerman S (1977) The Estimation of Choice Probabilities from Choice
Based Samples Econometrica 45 (8) 1977-1988
McFadden D (1974) Conditional Logit Analysis of Qualitative Choice Behaviour (P
Zarembka Ed) Frontiers in Econometrics 105-142
McFadden D (1978) Modeling the Choice of Residential Location In A Karlqvist L
Lundqvist F Snickars amp J Weibull (Ed) Spatial Interaction Theory and Residential
Location (pp 75-96) Amsterdam North-Holland
McFadden D amp Train K (2000) Mixed MNL Models for Discrete Response Journal
of Applied Econometrics
Nerella S amp Bhat C (2004) Numerical Analysis of Effect of Sampling of Alternatives
in Discrete Choice Models Transportation Research Record 1894 11-19
Ramming M (2001) Network Knowledge and Route Choice PhD Thesis Massachusetts
Institute of Technology
75
Schoumlnfelder S amp Samaga U (2003) Where Do You Want to Go Today-More
Observations on Daily Mobility Third Swiss Transport Research Conference Ascona
Schoumlnfelder S Axhausen K Antille N amp Bierlaire M (2002) Exploring the
Potentials of Automatically Collected GPS Data for Travel Behaviour Analysis- A
Swedish Data Source i J Moumlltgen amp A Wytzisk (Red) GI-Technologien fuumlr Verkehr
und Logistik number 13 Institut fuumlr Geoinformatik Universitaumlt Muumlnster (ss 155-179)
Munster IfGIprints
Smith A (1993) Estimating Nonlinear Time-series Models Using Simulated Vector
Autoregressions Journal of Applied Econometrics 8 63-84
Smith A (2008) Indirect Inference In S Durlauf amp L Blume (Eds) The New
Palgrave Dictionary of Economics (Second ed) Palgrave Macmillan
Smith A (1990) Three Essays on the Solution and Estimation of Dynamic
Macroeconomic Models PhD Dissertation Duke University
Train K (2003) Discrete Choice Methods with Simulation Cambridge University Press
Vovsha P amp Bekhor S (1998) Link-nested Logit Model of Route Choice-Overcoming
Route Overlapping Problem Transportation Research Record 1645 133-142
Wang H (2011) Logistics Distribution Shortest Path Based on Dijkstra Algorithm
Computer and Digital Engineering 3
Assigned publication number
TSC-MT 11-016
wwwkthse

6
List of Tables
Table 1 Descriptive statistics of link length 40
Table 2 Descriptive statistics of link numbers in observation data set 43
Table 3 Descriptive statistics of estimated travel time on links 44
Table 4 Descriptive statistics of duration of trips 45
Table 5 Statistics of estimation of beta_length 51
Table 6 Estimated coefficients of binding function for model with two attributes 56
Table 7 Statistics of estimation of beta_length and beta_sb 56
Table 8 Estimated coefficients of binding functions for model with exponential cost
function 61
Table 9 Statistics of estimation of beta_length and beta_sb in exponential-cost-function
model 61
Table 10 Estimates of three binding functions 65
Table 11 Estimates of three binding functions in the Monte Carlo experiment 69
Table 12 Statistics of estimation of beta_length beta_sb and sigma in the Monte Carlo
experiment 69
7
1 Introduction
11 Motivation
With the development of ITS there is a stronger desire for more accurate and efficient
vehicle orientation systems and devices which relies much on the mechanism of route
choice models In other cases well estimated route choice models reveals travel behavior
of the car drivers which contributes to system-scaled analysis such as design and
appraisal of road pricing system across the road network On the other hand newly
developed GIS techniques provide sufficient route choice data as solid basement for
research on route choice behaviors Both the desire for better developed model and more
available prerequisites stimulate the research on route choice modeling
12 Background
Route choice modeling has been discussed for a long time Given a basement network
composed by a finite number of nodes which are connected by directed links we assume
that individuals travel from an origin node to a destination node in the network Thus the
choice of an individual turns out to be an observed path represented by a sequence of
links considering inherent attributes of links such as length or presence of speed bumps
From this point of view individuals make discrete choices the behavioral mechanism of
which could be seen in two different ways Individuals could either be seen as choosing
links from each junction node or choosing from possible paths connecting the origin node
and the destination one In line with a great body of literatures we focus on the path-
based approaches to develop our model
There are two important issues that need to be considered for this kind of approach
namely the generation of choice set and model formulation to address alternative
correlation due to path overlapping To be specific when we assume that individuals
choose from paths connecting the origin and destination it is infeasible to enumerate the
full-size choice set or universal choice set which includes all possible paths between the
OD pair in a given road network Individuals may not virtually consider the universal
choice set when they make decisions and in practice algorithms implemented to find the
shortest paths avoid the usage of choice set at all such as the Dijkstrarsquos algorithm we
implement in the model Hence we give each individual the right to consider all possible
8
paths It is common practice to generate samples from the universal choice set yet this
may easily introduce biases to the estimation Samples are supposed to be randomly
drawn from the population and good samples can reproduce the features in the population
Since in real-size network it is impossible to know the full-size choice set let alone to
reproduce the features of it We could only draw from certain known paths and this is
more like an importance sampling which gives links different possibilities to the drawn
into paths As a result estimation based on the sampled paths will have biases
The other problem with regard to path-based approaches is the inherent limitation of
multinomial logit model (MNL) which requires no correlation among alternatives This
is practically unrealistic since in the context of route choice modeling paths sharing
certain links are correlated due to unobserved features of the common links Numerous
literatures contribute to improvement in terms of the problem based on logit models
We choose to use an approach with additive link specific errors which belongs to probit-
like models This kind of model is efficient for applications yet it is still not able to be
estimated consistently given a partial choice set So we turn to indirect inference as the
tool to estimate the probit-like model with additive link specific errors All feasible paths
for each individual are technically allowed which means that a universal choice set is
provided for each OD pair to avoid bias caused by sampling from full choice sets The
universal choice set generated here is a so-called pseudo-universal choice set which
contains as many feasible paths as desired to eliminate possible biases but not all paths
since it is practically impossible to get the true universal choice set We choose to use an
MNL model as the auxiliary model which is easy to estimate The estimate of MNL
model is biased based on the choice set we generate as discussed above yet the estimate
of parameters in the basic route choice model will be consistent thanks to the features of
the indirect inference method
13 Objective
A Monte Carlo simulation experiment has been carried out based on synthetic trip data
and real-sized road network to appraise the proposed model (See Karlstroumlm Sundberg amp
9
Wang 2011)1 The basic route choice model includes two attributes namely length and
speed bump dummy while an MNL model is chosen as the auxiliary model with the
same two attributes Simulated trip data given two pseudo-true values for coefficients of
length and speed bump dummy are used as a substitution of the empirical data The
presence of speed bumps is randomly allocated over the network Estimation results and
sensitivity test confirm the efficiency and consistency of the proposed estimator
What needs to be done in the thesis is that true trip data should be implemented as well as
the modification of the network To be specific realistic speed bump distribution is used
to replace the randomly allocated one Without knowing the true values of the
coefficients several iterations need to be carried out to get to know the raw domain of the
values and by shrinking input intervals more accurate estimates will be attained as the
accomplishment of the thesis
14 Scope of the Thesis
Based on the route choice model used in the synthetic experiment extensions are done in
five main aspects First we implement the newly proposed estimator in real world issues
by replacing the simulated observations with the true observations collected in a real
world network Unlike the simulated data which is generated following certain
assumptions the true observations have more noises inside and thus more difficult to
capture their features Second the observations we use contain many OD pairs and not
restricted with one or four of them as in the synthetic experiment this gets rid of the
possibility of bias caused by restricted OD pairs Third since we are implementing the
new method in true observations the formulation of route choice model cost function to
be specific is not known beforehand and correspondingly the formulation of the utility
function in the logit model is not for sure as well We need several trials to get well
defined formulations to capture the features of the data Fourth we have no idea what the
parameters are like based on true observation and thus a raw guess of input domain is
needed at first and centered with shrinkage in later iterations Last but not least in one
trial we included a scale parameter to the random term in the cost function and use
number of links in the auxiliary model to infer it To test the efficiency of this trial a
1 Karlstroumlm A Sundberg M amp Wang Q (2011) Consistently estimating flexible route choice models using an MNL lense International Choice Modeling Conference Leeds
10
Monte Carlo simulation experiment is carried out with some arbitrary pseudo-true values
of the parameters based on which simulated observations are used
On the other hand what is done in the synthetic experiment such as test with simulated
observations for one OD and four ODs sensitivity of estimates with choice set size and
number of observations is not included in this thesis Instead we will identify some
limitations of the model formulation tried in the thesis and make suggestions how the
model can be improved
As follows Section 2 reviews relevant literatures on route choice modeling as well as
indirect inference In Section 3 relevant methods are introduced in detail as backgrounds
afterwards methods and models used in this thesis are illustrated Section 4 gives
description of the empirical data we use for estimating and Section 5 shows the
estimation results of the Monte Carlo simulation-based experiment followed by some
conclusions in Section 6
11
2 Literature Review
Route choice modeling has long been discussed and many efforts have been made to
solve this problem Simple and easy to estimate the multinomial logit model (MNL) is
widely used in choice modeling yet it has certain restrictions to be implemented in route
choice context Due to its inherent property of Independence from Irrelevant Alternatives
(IIA) the multinomial logit model is not easily applicable since routes in the choice set
tend to be correlated with the presence of overlapping paths Cascetta et al (1996)
proposed a correction term called Commonality Factor (CF) in the deterministic part of
the utility function2 And the probability of path i to be chosen from the choice set nC
becomes( )
( )( | )in in
jn jn
n
V CF
n V CF
j C
eP i C
e
micro
micro
minus
minus
isin
=sum
As proposed by Cascetta et al the Commonality
Factor is specified as ln ( )n
ijin CF
j C i j
LCF
L Lγβ
isin
= sum in which ijL is the length of links
common to path i and pathj while iL and jL are the total length of path i and pathj
respectively The parameter γ is left to be estimated or practically constrained to a fixed
value like 1 or 2 The CF term of one path is proportional to the length of overlapping
part with other paths This proposed model is referred to as C-Logit model Bearing some
similarities Ben-Akiva and Bierlaire (1999) proposed the Path Size Logit (PSL) model3
This model is based on a different theoretical basis as the C-Logit The original
formulation of Path Size (PS) comes from the discrete choice theory of aggregate
alternatives Similar to the CF in C-Logit the log of Path Size (PS) is added to the utility
function The probability of path i to be chosen from the choice set nC becomes
( ln )
( ln )( | )in in
jn jn
n
V PS
n V PS
j C
eP i C
e
micro
micro
+
+
isin
=sum
The Path Size is specified as
1
i n
n
ain
a Ciaj
j C j
lPS
LL
LδisinΓ
isin
= sumsum
in
2 Cascetta E Nuzzolo A Russo F amp Vitetta A (1996) A Modified Logit Route Choice Model Overcoming Path Overlapping ProblemsSpecification and Some Calibration Results for Interurban Networks In J Lesort (Ed) the 13th International Symposium on Transportation and Traffic Theory Lyon France 3 Ben-Akiva M amp Bierlaire M (1999) Discrete Choice Methods and Their Applications to Short Term Travel Decisions In Chapter for the Transport Science Handbook Preliminary Draft
12
which iΓ is the set of links in pathi al and iL are the length of link a and pathi
respectively ajδ is the link incidence variable with value of 1 when link abelongs to path
j and zero otherwise And nCL is the shortest path in choice setnC The size of a path has
a maximum value of one when it shares no links with other paths
C-Logit model and PSL model are the most widely used models in practice of route
choice modeling due to their simple forms Since both of them originate from the MNL
model and maintain the basic MNL structure they can be estimated by existing software
designed for logit models Apart from these two types of models there are other recent
efforts in the route choice context
Bekhor Ben-Akiva and Ramming (2002) adapted the Logit Kernel model to apply in a
route choice context4 The Logit Kernel5 model was proposed by combing Gaussian and
Type I Extreme Value error terms by researchers such as Ben-Akiva and Bolduc (1996)
and McFadden and Train (2000) who also referred to it as Mixed Logit6 By making
certain assumptions under route choice context Bekhor Ben-Akiva and Ramming (2002)
proposed a way to apply the model to route choice modeling7 Based on the data from
Boston several kinds of models are estimated including multinomial logit model Path
Size Logit and the newly proposed Logit Kernel model Seen from the estimation results
Logit Kernel has a better overall performance than the other two kinds of models This
result needs to be verified in other data sets since the one used in the paper has a
relatively small size
Frejinger and Bierlaire (2007) proposed an approach to capture correlation among
alternative routes with subnetworks and carried out estimation based on several kinds of
route choice models8 The paper gives an overview of the latest development of route
choice modeling and discusses the Path Size Logit model in detail As part of the
4 Bekhor S Ben-Akiva M amp Ramming M (2002) Adaptation of Logit Kernel to Route Choice Situation Transportation Research Board of the National Academics 1805 78-85 5 Ben-Akiva M amp Bolduc D (1996) Multinomial Probit with a Logit Kernel and a General Parametric Specification of the Covariance Structure Working Paper 6 McFadden D amp Train K (2000) Mixed MNL Models for Discrete Response Journal of Applied Econometrics 7 Bekhor S Ben-Akiva M amp Ramming M (2002) Adaptation of Logit Kernel to Route Choice Situation 8 Frejinger E amp Bierlaire M (2007) Capturing Correlation with Subnetworks in Route Choice Models Transportation Research Part B 41 363-378
13
conclusion a behavioral interpretation of the Path Size in the model is given The
subnetwork is defined so that the alternative routes sharing the same section of it are
seen as correlated This correlation is captured using the Error Component model and
estimation results show that this new approach gives better property than PSL models To
complement the paper uses a real size network and true travel data is collected which is
the same network we are going to use in this thesis project Additionally the paper
displays forecasting results which indicates that models with Path Size component tend
to have bad performance in prediction
Ben-Akiva and Bierlaire (2003) pointed out that under route choice context the
significant correlation among alternatives due to path overlapping and the generation of
choice set are two important issues and main difficulties9
There are some algorithms used in practice for generating choice set for route choice
modeling both deterministic methods and stochastic ones The deterministic methods
tend to give the same set of paths for a given OD pair Some examples are the link
penalty algorithm (De La Barra Peacuterez amp Anez 1993) which increases gradually the
impedance of all the links on the shortest path10 the link elimination algorithm (Azevedo
Costa Madeira amp Martins 1993) which removes links on the shortest path in sequence
to generate new paths11 and the labeled paths (Ben-Akiva Bergman Daly amp
Ramaswamy 1984)12 In terms of the stochastic methods they tend to produce individual
specific choice set One example is the simulation method (Ramming 2001) which
generates alternative paths by drawing link impedances from different distribution
densities13
When it comes to appraisal of the generated choice set some literatures give evaluations
on the efficiency of different sampling algorithms for choice set generation (See Bekhor
9 Ben-Akiva M amp Bierlaire M (2003) Discrete Choice Models with Applications to Departure Time and Route Choice In Handbook of Transportation Science (second ed) Kluwer 10 De La Barra T Peacuterez B amp Anez J (1993) Multidimensional Path Search and Assignment 21st PTRC Summer Meeting (pp 307-319) 11 Azevedo J Costa M Madeira J amp Martins E (1993) An Algorithm for the Ranking of Shortest Paths European Journal of Operational Research 69 (1) 97-106 12 Ben-Akiva M Bergman M Daly A amp Ramaswamy R (1984) Modeling Inter Urban Route Choice Behaviour In J Vollmuller amp R Hamerslag (Ed) the 9th International Symposium on Transportation and Traffic Theory (pp 299-330) Utrecht Netherlands VNU Science Press 13 Ramming M (2001) Network Knowledge and Route Choice PhD Thesis Massachusetts Institute of Technology
14
Ben-Akiva amp Ramming 2006 for example) Apart from this there are some recently
proposed methods for sampling alternatives under route choice context (See Frejinger
Bierlaire amp Ben-Akiva 2009 for example)
Nerella and Bhat (2004) carried out a numerical analysis on the effect of sample size on
the efficiency of the estimation of parameters14 The analysis is done for two kinds of
discrete choice models namely the multinomial logit model for which consistency of
estimation based on subset of alternatives is theoretically proved and non-MNL model
taking mixed multinomial logit model as an example Four evaluation criteria are chosen
namely the ability to recover model parameters ability to estimate overall log-likelihood
function value ability to estimate individual choice probabilities and ability to estimate
aggregate shares of alternatives The results show that the MNL model works well on
small sample size yet certain portion of full choice set need to be kept as a practical
baseline For the non-MNL model small sample size gives poor estimation and increase
of sample size gives obvious increase of estimation quality Certain portion of full choice
set is suggested for practical convenience yet the generalization of sample size portion is
not feasible since difference kinds of models may require different portion to guarantee
accuracy In general for the non-MNL models full choice set is suggested to be used if
feasible and larger sample gives better estimation
Bekhor Ben-Akiva and Ramming (2006) carried out route choice modeling based on a
large-scale urban network including both choice set generation part and route choice
estimation part which compose the process of route choice modeling together15 Given
that previous literatures did not pay too much attention to empirical estimation the paper
used a true observation data set collected in Boston As the first step several choice set
generation algorithms are listed and compared in their efficiency of reproducing the
observed paths on which the evaluation of the algorithms are based The data in Boston
is described in the paper and used in the second step ie model estimation Several route
choice models are presented and estimation results based on different kinds of models are
shown for comparison of the efficiency of the models The Path Size Logit model is
14 Nerella S amp Bhat C (2004) Numerical Analysis of Effect of Sampling of Alternatives in Discrete Choice Models Transportation Research Record 1894 11-19 15 Bekhor S Ben-Akiva M amp Ramming M (2006) Evaluation of Choice Set Generation Algorithms for Route Choice Models Annals of Operations Research 114 (1) 235-247
15
proposed for its property to overcoming the drawbacks of the conventional MNL models
This type of model can be easily estimated using popularized software The main
conclusion is that route choice models could be estimated for large-scale networks based
on the true observation data and prominent computing resources
Frejinger Bierlaire and Ben-Akiva (2009) proposed a paradigm for choice set generation
based on sampling for route choice modeling16 In the context of route choice modeling
the universal choice set which denotes all possible alternatives for a traveler to choose
from is not able to be enumerated So we practically work on a sampled choice set from
the universal one which may easily introduce bias to the final estimate In this paradigm
they focus on unbiased estimation of parameters instead of generating actual choice set
The path generation is seen as an importance sampling approach and a correction of
sampling is added to the path utility Since the following estimation process is based on
the sampled choice set which is treated as the universal one a correction for sampling is
added to the path size attribute in the commonly used path size logit (PSL) model ending
up with the expanded path size Modification in the previous two steps guarantees
unbiased estimation of the parameters Numerical results based on synthetic data are
presented in the paper to reveal that models with a sampling correction in the path utility
are better than those without it The proposed expanded path size logit model provides
unbiased estimation and is better than the original path size models
In this paper we will examine indirect inference Indirect inference is not a new method
it was first introduced by Smith (1990 1993)17 Then Gourieacuteroux et al (1993) gave
overall introduction to the methods and extended it in important ways18 Gallant and
McCulloch (2004) transferred the idea of indirect inference and used it for Bayesian
inference in models where likelihood function is intractable19
16 Frejinger E Bierlaire M amp Ben-Akiva M (2009) Sampling of Alternatives for Route Choice Modeling Transportation Research Part B Methodological 43 (10) 984-994 17 Smith A (1990) Three Essays on the Solution and Estimation of Dynamic Macroeconomic Models PhD Dissertation Duke University Smith A (1993) Estimating Nonlinear Time-series Models Using Simulated Vector Autoregressions Journal of Applied Econometrics 8 63-84 18 Gourieacuteroux C Monfort A amp Renault E (1993) Indirect Inference Journal of Applied Econometrics 8 85-118 19 Gallant A amp McCulloch R (2004) On the Determination of General Scientific Models Manuscript Duke University
16
Gourieacuteroux Monfort and Renault (1993) proposed the inference methods based on an
ldquoincorrectrdquo criterion which does not give consistent estimation to parameters of interest
directly20 The argument of the criterion is called the auxiliary parameter which may
have a larger dimension than the parameters of interest in the basic model After the
auxiliary parameters are selected a simulation-based process is carried out to get a
consistent and asymptotically normal estimator of parameters of interest As a simulation-
based method the only requirement for the basic model is that it could be simulated
regardless of formulations of the model So it could be used for estimating models which
are too complex to carry out direct approaches The paper shows how this kind of method
can be applied in fields such as micro-econometrics macro-econometrics and
econometrics of finance
Keane and Smith (2003) proposed a generalized form of the indirect inference method to
be implemented in the discrete choice model context21 Theoretically indirect inference
could deal with estimation of any economic models yet it has some limitations per se that
decrease the estimation efficiency or even make it difficult to implement Problems arise
when we use indirect inference in estimating discrete choice models since the objective
function the metric of distance between the auxiliary models estimated on observed data
and simulated data to be specific is inherently discrete which leaves the gradient-based
optimization methods infeasible Keane and Smith (2003) proposed that the estimation
procedures used for observed data and simulated data can be different22 Instead of the
discrete choice a continuous function of latent utilities including a smoothing parameter
is used as the dependent variable in the auxiliary model When the smoothing parameter
goes to zero the function of latent utilities converges to the discrete choices this way to
guarantee consistency According to the Monte Carlo results the generalized indirect
inference method proposed in this paper yields good estimates in small samples being as
efficient as maximum likelihood estimates in comparison
20 Gourieacuteroux C Monfort A amp Renault E (1993) Indirect Inference 21 Keane M amp Smith A (2003) Generalized Indirect Inference for Discrete Choice Models Manuscript Yale University 22 Keane M amp Smith A (2003) Generalized Indirect Inference for Discrete Choice Models
17
Creel (2009) presented a data mining approach to indirect inference23 which is similar to
the regular indirect inference method yet with certain advantages over it The method is a
simulation-based estimator relying also on an auxiliary model In line with the indirect
inference method an underlying economic model with parameterβ is referenced by an
auxiliary model with parameterθ Certain values of the parameter hβ in underlying
economic model are drawn randomly from a known density simulated data is generated
using Monte Carlo methods to estimate ɶh
θ of auxiliary model which ends up with a set
of tuples ɶ( )hhβ θ Nonparametric methods are used to get the function ɶ( | )E aβ θ = and
the final estimate of β is supposed to be the result of regression function evaluated at the
estimate of θ based on true observations ɶ ɵ( | )Eβ β θ θ= = Creel (2009) also presented a
way of calculating confidence intervals24 Monte Carlo results in dynamic and nonlinear
panel models and vector autoregressions show good performance of the new estimator
23 Creel M (2009) A Data Mining Approach to Indirect Inference Universitat Autonoma de Barcelona Department of Economics and Economic History 24 Creel M (2009) A Data Mining Approach to Indirect Inference
18
3 Methodology
31 Multinomial Logit Model (MNL)
311 Model Description
Route choice modeling is somewhat complicated when we want to capture the attributes
of both the alternative routes and choice maker accurately and reflect the choice making
process in the model Intuitively route choice can be regarded as choosing one specific
route from several alternative routes which coincides with the prerequisites of discrete
choice models Actually a lot of literatures have explored the route choice modeling and
possible improvements based on discrete choice models (see Cascetta et al 1996 Vovsha
and Bekhor 1998 Ben-Akiva and Bierlaire 1999 for more information on development
in route choice models with regard to discrete choice models)25
To understand the frontier development of route choice model we have got to know the
discrete choice models among which multinomial logit model (MNL) is the most widely
used In addition we choose to implement a new method ndash indirect inference in which
MNL is used as it is
Logit model is the most widely used discrete choice model till now due to its excellent
qualities in model specification To be specific the choice probability takes a closed form
which is easy to estimate and interpret (Train 2003)26
The multinomial logit model is a kind of choice model with more than two alternatives in
the choice set We assume that the choice maker makes his or her decision based on the
utility maximization rule (Ben-Akiva amp Lerman 1985)27 With regard to the utility njU
the decision maker n obtains from the thj alternative in the choice set it is made up of
two parts the deterministic part and the stochastic part The deterministic part denoted
25 Cascetta E Nuzzolo A Russo F amp Vitetta A (1996) A Modified Logit Route Choice Model Overcoming Path Overlapping ProblemsSpecification and Some Calibration Results for Interurban Networks Vovsha P amp Bekhor S (1998) Link-nested Logit Model of Route Choice-Overcoming Route Overlapping Problem Transportation Research Record 1645 133-142 Ben-Akiva M amp Bierlaire M (1999) Discrete Choice Methods and Their Applications to Short Term Travel Decisions 26 Train K (2003) Discrete Choice Methods with Simulation Cambridge University Press 27 Ben-Akiva M amp Lerman S (1985) Discrete Choice Analysis Theory and Application to Travel Demand MIT Press
19
by njV contains attributes known by the modelers while the stochastic part denoted by
njε is the attributes affecting peoplersquos the decision which cannot be observed by the
modelers yet are known by the decision makers themselves So the utility function turns
out to be
nj nj njU V jε= + forall (1)
The type of choice model is basically decided by the distribution of the stochastic part
When we assume that njε is independently identically Gumbel distributed the model
becomes a logit model
As stated above the decision follows utility maximization rule which means that the
decision maker n chooses the alternative with the highest utility say the thi alternative
Use as the probability the thi alternative is chosen over the others we have
( max ) ( )
( )
( )
ni ni nj ni njj C
ni ni nj nj
nj ni ni nj
P P U U P U U j i
P V V j i
P V V j i
ε εε ε
isin= = = ge forall ne
= + gt + forall ne
= minus lt minus forall ne (2)
With Equation (2) above and the assumption that njε follows iid Gumbel distribution we
could derive the probability of decision maker n chooses alternativei which is
ni
nj
V
ni V
j
eP
e=sum
(3)
Typically we specify the deterministic part of the utility function in a linear form which
is nj njV xβ= Then the probability becomes
ni
nj
x
ni x
j
eP
e
β
β=sum
(4)
This is the most common form of probability function for multinomial logit models
There are some good properties for this kind of logit probability as discussed by Train
(2009)28 With this form the probability of choosing certain alternative will be between
zero and one inherently which is basically required for probability definition Yet the
28 Train K (2003) Discrete Choice Methods with Simulation
20
value of niP will never drop to zero mathematically which means that all the alternatives
in the choice set are perceived to have chance to be chosen On the other hand if an
alternative is perceived never to be chosen it should not be included in the choice set at
all
The probabilities for all the alternatives in the choice set sums to be one which is easily
illustrated from the analytical properties 1 1 1
( ) 1njni
J J JVV
nii i j
P e e= = =
= =sum sum sum in which J denotes
the number of alternatives in the choice set
The logit probability and the deterministic part of the utility function follow an S-shaped
curve line shown in Figure 1 below
Figure 1 S-shaped relationship between probability and deterministic part of utility
This property gives implications for possible impacts of the deterministic utility of certain
alternative on its chances to be chosen We could see that when an alternative has about
50 probability to be chosen which infers to the steepest part on the curve a small
change in the deterministic part of the utility function could lead to a large change in the
probability the alternative has to be chosen
Apart from the nice properties of logit probability logit models have some disadvantages
as well (Bartels Boztug amp Muumlller 1999)29 One shortcoming is the assumption of
29 Bartels K Boztug Y amp Muumlller M (1999) Testing the Multinomial Logit Model Working paper University Potsdam Germany
21
Gumbel distribution of error terms in the utility function The inherent requirement for
iid property sets restrictions for logit model to be widely used especially in route choice
modeling context Several models have been proposed to overcome this shortcoming in
particular modifications based on MNL to adjust it to route choice practices have been
proposed Another drawback is the assumption of the linear composition for the
deterministic part of utility function Actually this assumption is for ease of following
estimation process since McFadden (1974) demonstrated that under this condition the
probabilities will be universally concave with regard to the coefficientsβ 30 which
improves the performance of numerical estimation Yet there could be nonlinear
compositions in the deterministic part to relax the restriction Under this condition the
universal concavity cannot be guaranteed which may lead to local convergence in the
estimation process
312 Model Estimation
The most commonly used numerical estimation method for multinomial logit models is
the Maximum Likelihood Estimation (MLE) In principle given a set of data and the
underlying probability model the method tries to find coefficients of the probability
model with which produced data has a distribution most likely resembles the distribution
of the observed data
Consider the case that N decision makers with their choice data are obtained Parameters
to be estimated are the coefficients in the utility function denoted byβ We could then
use the MLE to try to get the values of β vector with which the probability that choice
maker choose their observed alternatives is maximized
The probability of choice maker n to choose his or her observed alternative can be
written as
( ) niyni
i
Pprod (5)
in which niy is a dummy with value 1 if choice maker choose alternative i and value 0
otherwise
30 McFadden D (1974) Conditional Logit Analysis of Qualitative Choice Behaviour (P Zarembka Ed) Frontiers in Econometrics 105-142
22
Choice makers choose their alternative independently from each other so the probability
of all sampled choice makers choose their observed alternative is
1
( ) ( ) ni
Ny
nin i
L Pβ=
= prodprod (6)
This is the likelihood function with regard to the parameters to be estimated β in this
case We can take the logarithm of it to get the log-likelihood function
1
( ) lnN
ni nin i
LL y Pβ=
=sumsum (7)
Since we aim at getting the value of β to make the log-likelihood function maximized
we can take the derivative of it with respect to β and set it to zero
( )
0dLL
d
ββ
= (8)
By solving this equation we could get the estimate of β
32 Dijkstrarsquos Algorithm
321 Introduction
A method is needed for generating feasible alternatives and compose the choice set as
well as for deriving simulated observations for each OD pair in the process of indirect
inference As for choice set generation we would like to include certain number of high
ranking shortest paths in the choice set since these paths tend to have more possibility to
be chosen Similar to this the simulated observation is generated as the shortest path
between each OD pair We implement a method for shortest path finding which is the
Dijkstrarsquos Algorithm
Dijkstrarsquos Algorithm is named after the Dutch computer scientist Edsger Dijkstra who
conceived this method in 1956 and got it published in 195931 This is a graph search
algorithm aiming at solving shortest path problem for a graph the edge cost of which is
defined nonnegative The outcome of it is a shortest path tree demonstrating the path with
lowest value with respect to the defined cost
31 Dijkstra E (1959) A note on two problems in connexion with graphs Numerische Mathematik 1 269-271
23
This algorithm deals with single-source problem To be specific given one source node in
the graph the algorithm will give paths with the lowest value with regard to cost from
this source node to every other node in the network Given certain criterion we could use
the algorithm to find shortest path between two specific nodes by setting one node as the
source and the other as the target
After released it is widely used in path searching problems especially in transportation
related practices Routing problem is considered in investigation on traffic assignment
and optimization in logistics Real sized road network could be perceived as a graph with
vertices and edges in which cities can be abstracted as the vertices in the graph and the
roads connecting cities can then be regarded as the edges With the aid of Dijkstrarsquos
Algorithm the shortest path with respect to cost could be found from certain city to the
other cities The outcome is valuable for logistics corporations to work out their region-
wide distribution plans32
322 Algorithm
We connect a ldquodistancerdquo value with all the vertices in the graph indicating its distance
from the source vertex To be accurate the ldquodistancerdquo could be actual length of edges or
the generalized cost on the edges or anything desired The source vertex is defined as the
initial node with a value of zero In the process Dijkstrarsquos Algorithm will assign values
to vertices detected in one loop and update the values in the following loops till a
minimum value is found for each vertex The steps for searching and updating are
presented below
1 Initialize the network and assign the distance values of vertices other than the initial
node as infinity
2 When one vertex is to be detected it is denoted as current node All the vertices that
have been detected and attained the minimum distance values will be marked as detected
and will not be detected in the following loops while the vertices remaining unvisited
will be marked undetected To initialize all the vertices are marked undetected and the
initial node is set as current node
32 Wang H (2011) Logistics Distribution Shortest Path Based on Dijkstra Algorithm Computer and Digital Engineering 3
24
3 For current node all its directly connected adjacent nodes are considered except for
the newly detected vertex Labeled distance values of the neighbor vertices will be
updated if the calculated values from current node are smaller than their current values
For example current node A has a distance value of 4 and one of its neighbors B has a
value of 8 The edge linking A and B has a distance of 2 The newly calculated distance
value for B will be 4+2=6 which is smaller than 8 So the labeled distance value for B
will be updated to 6 indicating that the minimum distance from the source vertex to B till
now is 6 and the path should pass A
4 When all the neighbors of the current node are considered and updated mark the
current node as detected And mark the undetected node with the lowest distance value as
the current node and do the detection in step 3 again
5 When all the vertices in the network are marked detected the algorithm is finished and
we get the minimum distance from the source to all the other vertices The shortest path
from the source to a specific vertex could be found out following the detecting process
As mentioned above the stop criterion could also be modified as we desired If we aim at
finding the shortest path between two vertices at the beginning one vertex should be set
as the initial node and the algorithm could be stopped once the other vertex is marked as
detected
323 Explanatory Example
Here is a simple network to illustrate the mechanism of Dijstrarsquos Algorithm There are
five vertices and six edges with distance values labeled beside We define A as the source
and set it the initial node
Figure 2 A simple network for Dijstrrarsquoa Algorithm explanation
25
Initialization
Initial node A
Detected null
Distance value A=0 B=C=D=E=+infin
Loop 1
Current node A
Adjacent vertices B C
Detected null
Distance value A=0 B=4 C=1 D=E=+infin
Loop 2
Current node C
Adjacent vertices B D
Detected A
Distance value A=0 C=1 B=min 4 C+2 =3 D=C+3=4 E=+infin
Loop 3
Current node B
Adjacent vertices E
Detected A C
Distance value A=0 C=1 B=3 D=4 E=B+3=6
Loop 4
Current node E
Adjacent vertices null
Detected A B C D
Distance value A=0 C=1 B=3 D=4 E=6
If we want to get the shortest path from A to E following the detecting process we could
know that it should be A-C-B-E
26
324 Discussion
Dijkstrarsquos Algorithm has a clear logical structure which makes it easy to understand as
well as to implement in programming Nonetheless this method cannot search directly
from one node towards the other to find the shortest path between the two It works more
like detecting all the adjacent nodes in terms of shortest paths and expands from the
source iteratively until the target node is included and that is when we could figure out
the shortest path between the two specific vertices This reveals the fact that the method
wastes a lot of time in the blind search leaving it inefficient In addition this method is
not able to deal with networks with negative edge values yet this is not a problem in our
research since link cost on our network is defined nonnegative
33 Indirect Inference
331 Introduction
For problems in route choice context choice set size may be way too large to enumerate
all the alternatives Yet estimation based on sampled choice set may introduce biases
which can be corrected in some special cases (see Frejinger Bierlaire amp Ben-Akiva
2009)33 While in cases where estimation models are not based on MNL say multinomial
probit model we could not find corrections for biases caused by sampled choice set
Estimator based on the principle of indirect inference is then introduced to overcome
inconsistency problem34
Indirect inference35 is a simulation-based method for estimating parameters in economic
models by making references to the parameters of interest (Smith 2008) It is motivated
when general statistical estimation method such as Maximum Likelihood is intractable or
as discussed above consistent estimation is required given that only sampled choice set is
available Since in economic analysis we tend to build models which guarantee scientific
logic and inclusion of necessary attributes quite often the models will end up
33 Frejinger E Bierlaire M amp Ben-Akiva M (2009) Sampling of Alternatives for Route Choice Modeling 34 Karlstroumlm A Sundberg M amp Wang Q (2011) Consistently estimating flexible route choice models using an MNL lense 35 Smith A (2008) Indirect Inference In S Durlauf amp L Blume (Eds) The New Palgrave Dictionary of Economics (Second ed) Palgrave Macmillan
27
complicated from statistical estimation point of view This in sequence spurs the wide use
of indirect inference in economic analysis
It is common character that simulation-based methods allows modelers to simulate data
from the economic model of interest given certain perceived values of the parameters to
be estimated Since to generate data is essential and simple the true challenge is how to
estimate coefficients Indirect inference uses an auxiliary model which gives a rich
description of the covariance patterns in the data by including certain variables from the
basic economic model On the other hand the auxiliary model does not need to reflect
accurately the data generating process since it is supposed to be estimated based on the
data derived not to generate data itself The basic function of the auxiliary model is that
it provides a criterion to compare observed data and simulated data from the basic
economics model
We do iterations with the aim of finding the parameters of the basic economic model so
the observed data and the simulated data from the basic model looks almost the same by
the criterion of auxiliary model To be specific the auxiliary model is estimated based on
both observed data and simulated data we choose parameters for the basic model to
make sure that the two estimator of auxiliary model are as close as possible Based on
this idea the auxiliary model should be easy to estimate
332 Definition of the method
We define an economic model with the form of
( ) 12t t ty G x t Tε β= = (9)
in which 1 Tt tx = is a sequence of observed exogenous variables 1 T
t ty = is a sequence of
observed endogenous variables and 1 Tt tε = is a sequence of unobserved random error
terms β is a k -dimensional coefficient vector of the exogenous variables (Smith
2008)36
This model generally describes a relation that ty is dependent ontx with some random
errors Given the distribution of the random errors we could get the probability density
36 Smith A (2008) Indirect Inference
28
function of ty conditional on tx We will not focus on this density and instead this model
is only used for simulating data in indirect inference
In terms of the auxiliary model it could be defined by a probability density function with
the form of
( | )t tf y x θ (10)
in which θ is a p -dimensional coefficient vector and p is supposed to be not smaller
than k since we should capture characteristics of all the parameters in the underlying
economic model In addition the auxiliary model needs not be defined to reproduce the
distribution of ty in the basic model yet it needs to have a convenient analytical format
Based on the observed data we could estimate the parameters in the auxiliary model
using Maximum Likelihood Method
ɵ
1
arg max log ( | )T
t tt
f y xθ
θ θ=
= sum (11)
The estimated coefficient vectorɵθ could be used as an indicator of certain features of the
observed data
On the other hand the auxiliary model can be estimated based on simulated data from the
basic model as well We need to draw a sequence of random error terms 1 m Tt tε = from the
defined distribution in which m denotes the number of simulation with an interval of [1
M ] generally Given a coefficient vectorβ we could generate the values of endogenous
variables ɶ 1 ( )m T
tty β = which are explicitly dependent onβ With the help of Maximum
Likelihood Method we could get
ɶ ɶ
1 1
( ) arg max log ( ( ) | )M T m
ttm t
f y xθ
θ β β θ= =
= sumsum (12)
According to the principle of indirect inference we try to find the values of β to make
ɶ( )θ β as close toɵθ as possible Practically we need a metric to measure the distance
between ɵθ andɶ( )θ β and by minimizing the distance we could find out the estimates of
β in the basic economic model
29
333 Choices of the metrics
As mentioned above we need a metric to measure the distance betweenɵθ andɶ( )θ β
There are three approaches corresponding to the three classical hypothesis tests namely
Wald likelihood ratio (LR) and Lagrange multiplier (LM)37
In the Wald approach we try to minimize a quadratic form in the difference between the
two estimators ofɵθ andɶ( )θ β which is
ɵ ɶ ɵ ɶarg min( ( )) ( ( ))Wald
Wβ
β θ θ β θ θ β= minus minus (13)
in which W is a positive definite ldquoweightingrdquo matrix
In the LR approach a metric is formed based on the likelihood function related to the
auxiliary model which is
ɵ ɶ
1 1
arg min( log ( | ) log ( | ( )))T TLR
t t t tt t
f y x f y xβ
β θ θ β= =
= minussum sum (14)
According to the definition ofɵθ the first part of the objective function before the minus
sign on the right-hand side is always larger than the second part after the minus sign And
the first part is not dependent onβ
To minimize the objective function is equivalent to maximizing the log-likelihood
function withɶ( )θ β that is
ɶ
1
arg max( log ( | ( )))TLR
t tt
f y xβ
β θ β=
= sum (15)
In the LM approach the metric is formed using the derivative of the log-likelihood
function related to the auxiliary model which is
arg min ( ) ( )LM
S VSβ
β β β= (16)
in which
ɶ ɵ
1 1
( ) log ( ( ) | )M T m
ttm t
S f y xβ β θθ= =
part=partsumsum
(17)
and V is a positive definite matrix
37 Smith A (2008) Indirect Inference
30
By using any of the approaches we aim at getting the minimized distance betweenɵθ and
ɶ( )θ β so the value will approach to zero as expected So the hypothesis test of the
minimized value could be used as an indicator of whether the auxiliary model is suitably
specified In other words the minimized value being significantly different from zero
indicates a bad specification of the auxiliary model
In comparison the LM approach has an advantage over the others in computation when
it is relatively time-consuming to estimate the auxiliary model
334 Consistency Interpretation
Suppose the observed sample size T grows large while total number of simulations stays
fixed as M the estimator based on simulated data ɶ( )θ β will converge to a pseudo-true
value denoted as( )h β which is also dependent onβ This is called binding function
which characterized the relationship between the coefficients in the basic model and the
auxiliary model At the same time the estimator based on observed data ɵθ will converge
to a pseudo-true value0θ In case that T grows to a large number the aim of indirect
inference changes to finding β that guarantees0 ( )hθ β= This could explain that indirect
inference gives consistent estimate of the parameters in the basic economic model
In this project the binding function is what we focus on to get the correct estimates
instead of finding certain metrics Detailed methods will be discussed in the following
part
34 Model Specification in the Thesis
341 Basic Route Choice Model
Based on all the methods mentioned in previous sections the specification of models and
methods we use in the thesis will be explained in this section Since we are to estimate
the model based on true observations no model is known beforehand to adjust to the data
we use Several formulations of the model have been tested in the thesis The one
explained here could be seen as an example and all the other trials contain modifications
based on this model The other specifications of model will be explained along with the
results in the result section
31
We start by describing the underlying route choice model of interest38 We need to define
a road network as a representation of a real-size one from which we collected the trip
data The network denoted asN consists of a set of nodes (vertices) v and links (edges)
l Each link has a source node ( )s l and a target node or a destination node( )d l which
together indicate the direction of the link A path from an origin node ov to a destination
node dv could be seen as a sequence of links1 nl lhellip of which 1( ) os l v= 1( ) ( )i id l s l +=
and ( ) dnd l v= So a path can be defined by the index of links which is 1 nl lπ = hellip
A vector of characteristics denoted aslx is associated to each link as well as a strictly
positive cost function( )l lic x ε β in which liε is an individual specific random link cost
with i denoting the individual and β is a vector of coefficients of the link characteristics
left to be estimated In the Indirect Inference context we need an auxiliary model with
easily-estimated analytical form yet there is no such requirement for the basic model
Although not necessary we assume that the cost function has a linear deterministic form
the deterministic part and the random part are additively separable So we have the cost
function as
( ) Tl li l lic x xε β β ε= + (18)
In addition one important assumption is that the link cost is additive which means that
the cost of a path can be attained by the sum of all the link costs along the path This way
we have the cost of a path π as
( ) ( )l lil
C c xπ
π ε βisin
=sum (19)
We focus on the path-based model which means that the individuals choose among all
possible paths As defined above this turns out to be a random utility choice model As
indicated by the standard assumptions of this kind of models choice makers are assumed
to know both the link characteristics and their idiosyncratic random utility liε associated
to each link Since the choice makers maximize their utility this means that they will
choose the path with the lowest generalized cost in this model This way we have the
choice of individual i as
38 Karlstroumlm A Sundberg M amp Wang Q (2011) Consistently estimating flexible route choice models using an MNL lense
32
( )
arg min ( )o di i
iv v
Cπ
π πisinΩ
= (20)
in which oiv denotes the origin point of the trip for individual i and d
iv denotes the
destination ( )o di iv vΩ denotes all possible paths connecting the origin and destination in
the network for individual i which forms the choice set for the individual
When implementing the model we assume that the random utility component liε follows
a truncated normal distribution To be specific liε follows a standard normal distribution
yet with only the positive values retrieved This way we could guarantee that the link
costs are always positive so that additively the path would not have infinite loops With
this feature of the random component we could say that our model is probit-like Based
on this assumption the prerequisite of Dijkstrarsquos Algorithm is satisfied which always
needs positive edge values on the network We can use the Dijkstrarsquos Algorithm to find
the shortest paths iπ as an intermediate step in the implementation Apart from this we
assume that the unobserved cost captured by the random term is proportional to the
length of link To embody this in the cost function we add a fixed scale parameter to the
random term with a form of ( )Length l Lengthx Mean x in which ( )LengthMean x is the average
length of links in the network
We will assume that the data consists of J paths as dependent variables which means
that the dependent variables for the choice model are 1 Ji iy π == In addition the observed
characteristics of links in the network are provided 1 Ll lx x == To be specific we choose
to use two attributes of the links namely the length of the links Lengthx and the dummy
variable indicating the presence of speed bumps on the links SBx The cost function then
is specified as
( ) ( )l li Length Length l SB SB l li Length l Lengthc x x x x Mean xε β β ε= + + sdot (21)
Now the objective is to estimate the parametersβ in the model for which we will make
use of an auxiliary model
33
342 Auxiliary Model
Based on the idea of Indirect Inference we treat the route choice model defined above as
the basic model of interest which might have complex formation and be difficult to
estimate directly Then we need an auxiliary model to form a criterion which takes into
certain aspects of data to focus the analysis The auxiliary model needs not to reflect the
data generating process exactly as in the basic model yet it needs to include attributes of
interest in order for reference and to be easy to estimate We choose to use a logit model
for route choice as the auxiliary model since the logit model has always been a useful
tool for discrete choice analysis thanks to its analytical form and there is software for
estimating logit models which ensures that we can estimate very efficiently
As to the auxiliary model it is chosen to be a logit model for route choice We consider
that each individual i is choosing from a set of alternative routesr Each route r is given
a utility of riU
- Tri r ri r riU V Xε θ ε= + = + (22)
in which θ is the vector of auxiliary parameters which gives inference to the parameters
in the basic model One thing to be mentioned is that as expected the coefficients in the
utility function should have negative signs To make it easier for comparison with the
coefficients in the basic route choice model we assume the sign of θ to be positive per
se and add a negative sign ahead of it to guarantee that the coefficient part is negative as a
whole rX denotes route characteristics and riε is the random utility for each individual
which is assumed to follow an iid (independently identically distributed) Gumbel
distribution following the standard assumption of logit models
Note that as required for the auxiliary model it should be flexible enough to capture the
variability in the data and thus contains no fewer attributes than the basic model39 In
order to infer the parameters in the basic model and in consideration of efficiency we
pick the same attributes of interest in the basic models which are the link length Lengthx
and the speed bump dummy variableSBx So the utility function turns out to be
- -ri Length Length r SB SB r riU x xθ θ ε= + (23)
39 Karlstroumlm A Sundberg M amp Wang Q (2011) Consistently estimating flexible route choice models using an MNL lense
34
The probability of individual i choosing path r given an individual specific choice set
( )iI o d is
( )
ri
si
i
V
ri V
s I o d
eP
eisin
=sum
(24)
Theoretically we allow the individuals to choose from all possible paths between the
origin and destination in the network which intuitively could be infinite and impossible
to enumerate When implementing the model we generate the individual choice set based
on the basic route choice model Through simulation of the basic model we generate
infinite unique shortest paths for all the unique OD pairs by redrawing the random link
cost liε Without loss of generality the number of paths generated would be big enough
with fully consideration of efficiency We name the finite choice set composed by the
shortest paths generated as the pseudo-universal choice set ( )I o d which is a sample of
the infinite universal choice set The individual specific choice sets are generated by
randomly drawing certain number of paths out of the pseudo-universal choice set And
the size of individual specific choice set could be equal to or smaller than that of the
pseudo-universal one
The resulting individual specific choice set ( )iI o d describes a finite subset of all possible
paths connecting the origin oand destinationd for individuali When implementing the
methods the way of generating the choice set ( )iI o d for each individual i is viewed as
part of the auxiliary model
After the auxiliary model is built it could be estimated using a Maximum Likelihood
estimator based on the observed data of individual choices y and attributes variablesx
for individual 1 i N= hellip The estimate of parameters in the auxiliary model is
ɵ arg max ( )L y xθ
θ θ= (25)
in which ( )L y x θ is the log-likelihood function for the auxiliary model
Given the data of the link attributes xand some random draws of structural parameters
mβ 1 m M= hellip we can simulate choice data through the basic route choice model With
M draws of β from some given density we could simulate M sets of data resulting in
35
simulated choicesɶ( )my β Same as before parameters θ in the auxiliary model can be
estimated based on the simulated data as
ɶ ɶ( ) arg max ( ( ) )m m mL y xθ
θ β β θ= (26)
As the process indicated the simulated choice data depends on the structural parameterβ
in the basic route choice model and in sequence the estimates of parameters θ in the
auxiliary model depends on β when estimated based on the simulated data Based on
this theoretically we have a relationship of ( )θ β referred to as the binding function in
indirect inference literatures which we will discuss in detail for implementation of model
in this thesis A metric is then chosen to measure the distance between the observed and
simulated data viewed by the auxiliary model as a way to indirectly infer the values of
parameters β in the basic model To be specific for each draw of the structural parameter
mβ we can get the estimates of ɶ ( )m mθ β based on the simulated data and the distance
between ɶ ( )m mθ β and ɵθ measured by the chosen metric By doing more iteration with the
aim of minimizing the distance we will get the value of mβ which spurs the ɶ ( )m mθ β
closest toɵθ and this mβ is the inferred estimates of the parameter in the basic model
343 Consistency Discussion
The process of indirectly estimating parameters in the basic model is described above yet
we need to know whether the method we provide gives consistent estimation Here are
some discussions explaining the consistency in estimating by which consistency of the
estimator we proposed is illustrated
As proved the multinomial logit model (MNL) can be estimated consistently based on a
subset of alternatives (McFadden 1978)40 We may need to use the classical conditional
maximum likelihood estimator to deal with the problem at the same time the probability
that an individual n chooses an alternative i conditional on the subset of alternatives
denoted asnc becomes the conditional probability
40 McFadden D (1978) Modeling the Choice of Residential Location In A Karlqvist L Lundqvist F Snickars amp J Weibull (Ed) Spatial Interaction Theory and Residential Location (pp 75-96) Amsterdam North-Holland
36
ln ( | )
ln ( | )( | )in n
jn n
n
V q c i
n V q c j
j c
eP i c
e
micro
micro
+
+
isin
=sum
(27)
in which micro is a scale parameter and inV is the deterministic part of the utility There is a
term ln ( | )nq c j for correcting the sampling bias in which ( | )nq c j denotes the probability
of sampling nc given that alternative j is chosen
If all the alternatives in the choice set have the same probability to be chosen into the
subset the estimation on the subset of alternatives is equivalent to that on the full choice
set To be specific in this case ( | )nq c i is equal to ( | )n nq c j j cforall isin so by calculation the
term for sampling bias correction will cancel out in the probability function
In route choice context the alternative paths between an origin and a destination may be
in large amount and it is inefficient to give some very long-distance paths the same
probability as those short and attractive ones This means that we may need the
importance sampling method when generating subsets of alternatives which selects
attractive alternatives with higher probability than unattractive ones And the correction
term does not cancel out in this case Note that if alternative specific constants are
estimated we can get unbiased estimates of all the parameters except the constants even
if the correction term is not included in the utility function (Manski amp Lerman 1977)41
Back to the route choice context we tend to use large number of alternatives even with
subset of the full choice set which means that it is generally impossible to estimate the
constants and thus the correction term is essential To solve this problem Frejinger et al
(2009) developed a sampling approach in the context of route choice42
The discussion above focuses on the usage of MNL for route choice modeling When it
comes to our method the individual specific choice set is generated by randomly drawing
alternatives from the pseudo-universal choice set with the same probability yet there is
bias when generating the pseudo-universal ones since the pseudo-universal choice set is
composed of certain number of shortest paths between two nodes and this generating
process gives some paths higher probability to be included into the choice set So we
41 Manski C amp Lerman S (1977) The Estimation of Choice Probabilities from Choice Based Samples Econometrica 45 (8) 1977-1988 42 Frejinger E Bierlaire M amp Ben-Akiva M (2009) Sampling of Alternatives for Route Choice Modeling
37
actually use importance sampling to get the choice set which may consequently
introduce bias in estimating the parameterθ in the auxiliary model as discussed above
With the idea of indirect inference we consider only the relationship between θ andβ
denoted as( )θ β and use this relation to infer the value ofβ From this point of view
whether θ is estimated with bias or not does not matter since the relation between it and
β could always be captured which is the specific thing we focus on using the method of
indirect inference So we can say that even with biased subset of alternatives we could
still get consistent estimation by using indirect inference
344 Binding Function
As discussed in indirect inference method section when the sample size N increases
which means that we have more observations of choice the estimated parameter in the
auxiliary modelɶ ( )m mθ β will converge to a stable value ( )mθ β which is often referred
to as the binding function
Given that route choice model deals with discrete choices and by using indirect inference
we have a discrete choice model as the auxiliary model as well the estimates of binding
function ( )mθ β will inherit the discontinuous feature due to discrete individual choices
ɶ( )my β Keane and Smith (2003) proposed a solution of using logit-smoothing on the
simulated dependent choice data43 Following this idea we assume a continuous binding
functionɶ( )θ β for simplicity which could be approximated by a linear function locally
within small intervals With the M randomly drawn values of mβ and the corresponding
estimated parameters ɶ ( )m mθ β in the auxiliary model we could perform an Ordinary
Least Square (OLS) regression to estimate the local approximation of binding function
ɶ( ) c Dθ β β= + (28)
in which cdenotes the constant vector and D denotes the OLS parameter matrix44 To be
specific in our case each parameter in the auxiliary model will have a restriction
function with regard to both parameters in the basic model which is
43 Keane M amp Smith A (2003) Generalized Indirect Inference for Discrete Choice Models 44 Karlstroumlm A Sundberg M amp Wang Q (2011) Consistently estimating flexible route choice models using an MNL lense
38
ɶ1 11 12( )Length Length SBc d dθ β β β= + +
(29)
ɶ2 21 22( )SB Length SBc d dθ β β β= + +
(30)
Based on the observed data of choices y and explanatory variables xand the estimated
binding function which indicates the restrictions between ɶθ andβ we could use the
maximum likelihood method to give estimation of the parameters of interest The
likelihood ratio approach to indirect inference is following ideas of Smith (1993)45 and
Keane and Smith (2003)46
ɶ=arg max ( ( ))L y xβ
β θ β (31)
in which β is the estimate of the parameter of interest β in the basic economic model
With the restriction of binding function this is actually an indirectly inferred estimate In
line with the estimating process in auxiliary model ( )L sdot is the likelihood function of the
auxiliary model
Note that the form of binding function is based on an assumption in the result part we
will verify that this assumption is realistic
45 Smith A (1993) Estimating Nonlinear Time-series Models Using Simulated Vector Autoregressions 46 Keane M amp Smith A (2003) Generalized Indirect Inference for Discrete Choice Models
39
4 Data
41 Road Network
The data we use for estimation is based on a GPS data set collected in the Swedish city of
Borlaumlnge Borlaumlnge is located in the middle part of Sweden and has a population of about
47 000 inhabitants
The virtual road network contains 3077 nodes and 7459 unidirectional links (Frejinger amp
Bierlaire 2007)47 of which 3061 nodes and 7288 links are included in the network for
estimation Figure 3 gives a visual illustration of the road network in Borlaumlnge
Figure 3 Illustration of the Borlaumlnge road network
With regard to our research two of the link attributes are included namely link length
and speed bump dummy Link length is in the unit of km and speed bump dummy is an
indication of speed bump existence on the links which has the value 1 when there is a
speed bump on the link and 0 otherwise
Link length
47 Frejinger E amp Bierlaire M (2007) Capturing Correlation with Subnetworks in Route Choice Models
40
Some descriptive statistics of the link length data for the whole network is presented in
Table 1 below
Table 1 Descriptive statistics of link length
Number of links 7288
Minimum 0001
Maximum 7599
Mean 0184487
Median 0102
Variance 0103722
Lexis ratio (varmean) 1016884
Skewness 9871144
To describe the overall character of the link length attribute the histogram is shown in
Figure 4 below
Figure 4 Histogram of link length data
We could see that the link length data is quite clustered most of which lies within the
range of 01km and 06km Nonetheless there are some extreme values far away from the
range indicating extremely long links To display the variation in the relatively clustered
area we draw a histogram zoomed in the interval of (0 1km] shown Figure 5 in below
0
01
02
03
04
05
06
Fre
qu
en
cy
Link length (km)
Histogram
41
Figure 5 Histogram of link length data (zoomed within 1km)
Over 80 of all the links have length shorter than 03 km indicating concentration of
link length data
Speed bump dummy
Speed bump dummy is based on true situation in the network Of all the links 82 links
are equipped with speed bumps which account for a percentage of 113 The following
Figure 6 displays the locations of links with speed bumps
Figure 6 Illustration of links with speed bumps
0005
01015
02025
03035
04045
05
Fre
qu
en
cy
Link length (km)
Histogram(zoom in)
42
42 Observation Data
The GPS data set is collected as a part of the Swedish Intelligent Speed Adaptation (ISA)
study which aims at traffic safety effects of in-car information systems In the study 186
vehicles were equipped with GPS devices and traced within a radius of 25 km from the
center of Borlaumlnge The monitoring lasted for 30 days from 22th June 2000 to 4th March
2002 obtaining 49 667 vehicle days of travel and nearly a quarter of a million trips (for
more information on the GPS data set check Axhausen Schoumlnfelder Wolf Oliveira amp
Samaga 2003 Schoumlnfelder amp Samaga 2003 Schoumlnfelder Axhausen Antille amp Bierlaire
2002)48
The data collection is not originally designed for route choice analysis so the raw data
cannot be used in our research directly Extensive data processing is performed by the
company GeoStats in Atlanta to retrieve new data set available for route choice analysis
which contains 24 vehicles and 16 035 observations The final data set we use is provided
by Emma Frejinger which contains in total 1832 observations corresponding to 1458
observed unique routes made by 24 vehicles and 1409 unique origin-destination pairs
Considering that certain route may have been observed more than once we make a
distinction between observations and unique routes and number of unique routes should
be less than that of observations consistently with the numbers listed above
As indicated by data collection in the ISA study only licensed drivers with access to his
or her only car are recruited to minimize sharing or swapping of cars Minimum socio-
economic data of the drivers is included in data collection so we have no way to
understand driver characteristics from the data set Logically we make an assumption
that there is only one individual per vehicle
In the observation data a route is represented by a series of links and also an origin-
destination pair With relatively intensively distributed link length number of links could
48 Axhausen K Schoumlnfelder S Wolf J Oliveira M amp Samaga U (2003) 80 Weeks of GPS Traces Approaches to Enriching the Trip Information Transportation Research Record 1870 46-54 Schoumlnfelder S amp Samaga U (2003) Where Do You Want to Go Today-More Observations on Daily Mobility Third Swiss Transport Research Conference Ascona Schoumlnfelder S Axhausen K Antille N amp Bierlaire M (2002) Exploring the Potentials of Automatically Collected GPS Data for Travel Behaviour Analysis- A Swedish Data Source In J Moumlltgen amp A Wytzisk (Ed) GI-Technologien fuumlr Verkehr und Logistik number 13 Institut fuumlr Geoinformatik Universitaumlt Muumlnster (pp 155-179) Munster IfGIprints
43
be used to indicate total length of routes Some of the descriptive statistics of link number
is shown in Table 2 below
Table 2 Descriptive statistics of link numbers in observation data set
Number of observations 1832
Minimum 5
Maximum 106
Mean 202877
Median 16
Variance 1871968
Lexis ratio (varmean) 9227126
Skewness 1732597
For further overall inspection of link number distribution in the observation data set the
histogram is shown in Figure 7 below
Figure 7 Histogram of link numbers in observations data set
Seen from the histogram distribution of number of links is relatively dispersed with a
large range interval Judging by the statistics in general the routes observed have about
000
200
400
600
800
1000
1200
1400
1600
5 8
11
14
17
20
23
26
29
32
35
38
41
44
47
50
53
56
59
62
65
68
71
74
77
80
83
86
89
92
95
98
10
1
10
4
10
7
Mo
re
Fre
qu
en
cy
Number of links
Histogram
44
20 links in average Yet the data has a big variance which is reasonable As stated above
there are 1409 unique OD pairs for 1832 observations indicating that for most OD pairs
there is only one observation Spread within the detecting area different OD pairs could
have various numbers of links in between
Following our experiment design only a portion of the data could be used To be specific
routes with number of links fewer than ten would be eliminated when used for estimation
43 Further Exploration of data
Apart from the characters discussed above there are some other attributes in the data set
interesting to be explored Both in link attribute data set and observation data set there is
travel time data which to some extent is parallel with length in indicating distance
between two nodes
In the link attribute data set one attribute is denotes the estimated travel time of links in
unit of hour Some of the descriptive statistics is shown in Table 3 below switching unit
to minute
Table 3 Descriptive statistics of estimated travel time on links
Number of links 7288
Minimum 000186
Maximum 578268
Mean 0281696
Median 018744
Variance 0119337
Lexis ratio (varmean) 0423638
Skewness 5785361
Seen from Table 3 estimated travel time seems to have a more clustered distribution than
link length judging by lexis ratio and skewness Yet this time is roughly estimated not so
qualified as link length to use in estimation since the latter is much easier to measure and
guarantee precision
In the observation data set we have the duration time of the observations in the unit of
minute Some of the descriptive statistics is shown in Table 4 below
45
Table 4 Descriptive statistics of duration of trips
Number of observations 1832
Minimum 007
Maximum 316
Mean 4991195
Median 3925
Variance 1775639
Lexis ratio (varmean) 3557542
Skewness 2174728
Duration of trips can be used as an indication of distance between origin and destination
yet it is roughly measured and strongly affected by traffic condition on the road network
With similar reasons as discussed on estimated travel time on link we use number of
links instead of duration of trips to indicate the distance between OD pairs
46
5 Experiment Design
When doing the simulation-based estimation it is physically divided into two parts for
convenience of operation As discussed in the method section we choose to use a pseudo-
universal choice set which is generated and stored in the first part and ready for use in
the following experiment Then in the second part we do the simulation-based
experiment to carry out indirect inference method for estimating the parameters of
interest in the basic model β to be specific The Figure 8 below illustrates an abstracted
flow of how the estimation is carried out given certain origin-destination pair
Figure 8 Illustration of the flow in the experiment
As shown in the flow chart we get all the unique OD pairs in the trip data For each of
the OD pairs the Dijkstrarsquos algorithm is used to find the shortest paths between them
without duplicates We set the intended number of paths to be 400 as well as time
terminator in case not enough paths could be generated within certain bearable time
47
interval The generated paths form the pseudo-universal choice set of each OD pair
which is stored for future use Note that we abandon some OD pairs with too few paths
in the pseudo-universal choice set Observations containing the kept OD pairs are used
for following estimation which turns out to be 940 of them
For the OD pair in a given observation 200 alternatives are randomly drawn from the
pseudo-universal choice set and the sequential links in the observation itself is read as an
alternative path The 201 paths compose the observed choice set On the other hand a
given value of mβ is drawn from a predefined domainD The shortest path is generated
based on the given mβ as the simulated observation Like in the observed choice set part
200 alternatives are randomly drawn from the pseudo-universal choice set to form the
simulated choice set together with the simulated observation The auxiliary model is
estimated based on the simulated choice set and we could get a set of ɶ( ( ))mm mβ θ β pairs
which will be used to estimate the binding function Based on the binding function and
the observed choice set the parameters in the basic model could be indirectly estimated
The process described above is abstracted with no illustration of iterations Since this is
an experiment based on simulations certain loops of iteration should be carried out to get
statistics of the results
Given observed trip data at first we have no idea of the value of β In the process of
retrieving value ofβ the estimation process is repeated for several stages denoted asS
starting from a rough guess of the domainsD while for each following stage the domain
shrinks Since we tend to use a local OLS regression to approximate the smooth binding
function the draws of smβ need to be around the true value to prevent misspecification of
OLS regression due to the possibly inherent nonlinearity of the binding function The
estimated 0
β is not satisfactory in precision in the first stage yet it could give a hint of
where the true value lies The domain1D is centered on 0
β with smaller interval before
the estimation in the second stage This way +1sD is dependent on sD with smaller
interval As it goes on we will get a more accurate domain and as a result a well specified
OLS regression to approximate the binding function
48
The process of experiment with iterations is described below Suppose that we have the
experiment carried out for K times and the number of observations used isN
for run 1 k K= hellip for true observation 1 i N= hellip
Randomly draw alternatives from the pseudo-universal choice set end Form the observed choice sety for stage 1 s S= hellip
for 1 m M= hellip
Draw ksmβ from the domain ksD
Simulate paths for OD pairs in the used observations with mβ
for simulated observation 1 i N= hellip Randomly draw alternatives from the pseudo-universal choice set end
Form a simulated route choice setɶ( )ksmy β
Estimate ɶ ( )ks ksm mθ β in Equation (26)
end
Estimate ɶ ( )ks
θ β in Equation (28)
Estimate ks
β in Equation (31) end
Center the domain 1k sD + on ks
β and shrink the interval end
As a trial we first do the experiment on a route choice model with one parameter link
length to be specific For simplicity the random term is not scaled as described in the
model specification section which means we attach a truncated normally distributed
random term to the cost function without scaling it with link length After getting the
estimation of Lengthβ we move on to estimating the route choice model with both
parameters as described in the model specification Results under these two formulations
of models are presented separately in the result part
49
6 Results
61 Validation of Binding Function
As discussed in the binding function section we assume the binding function to be
continuous and feasible to be approximated by a linear function locally The assumption
of binding function can be verified based on the ɶ( ( ))mm mβ θ β pairs we attained as
intermediate results To explain this more explicitly we carry out a simple example with
only one parameter in the route choice model Lengthβ to be specific
The cost function is specified as
( )l li Length Length l lic x xε β ε= + (32)
corresponding to which the auxiliary model is
-ri Length Length r riU xθ ε= + (33)
For each run 10 values ofLengthβ are evenly drawn from a given domain By simulating
observations and estimating the auxiliary model 10 corresponding Lengthθ are generated to
form ten ɶ( ( ))mm mβ θ β pairs As assumed the binding functionɶ( )θ β is continuous which
could be approximated by a linear function locally To display the trend of binding
function we choose a relatively large domain for Lengthβ in the beginning [010]D = and
carry out 10 runs which generate 100 points in the beta-theta diagram shown in Figure 9
below
Figure 9 Scatter plots of the 90 beta-theta pairs
y = 12804x + 16264
Rsup2 = 09959
0
2
4
6
8
10
12
14
16
0 2 4 6 8 10
the
ta_
len
gth
beta_length
50
We do OLS regression for the dots and estimate the binding function Intuitively the
smaller the domain is the more accurate is the approximation of the binding function We
shrink the input domain based on the final estimate of Lengthβ from last trial
As it turned out to be we choose an input domain of [1214]D = for Lengthβ and the
binding function is assumed to take the form of
ɶ1 11( )Length Lengthc dθ β β= +
(34)
The result for one run is displayed in Figure 10 below
Figure 10 OLS regression based on the 10 beta-theta points from one run
The estimated binding function based on the 10 points is
ɶ ( ) 17371+10838Length Lengthθ β β= (35)
as indicated by 2 09783R = the function describes the trend of points very well Since
the interval is quite small we could use the estimated function to approximate the
binding function
When it comes to more parameters in the route choice model what we do is simply to
add more elements in the binding function After getting a vector of β and the
corresponding vector ofɶ( )θ β binding functions of each element in vector ɶ( )θ β with
y = 17371x + 10838
Rsup2 = 09783
315
32
325
33
335
34
345
35
355
12 125 13 135 14
the
ta_
len
gth
beta_length
51
regard to all the elements in vector β are estimated One example is shown in the
Equation (29) and Equation (30)
62 Estimation of model with one attribute
The route choice model with one attribute we used is the one described in Section 61
above After several trials by shrinking input interval every time we finally affirm that
the true value Lengthβ of lies in a relatively small interval of [12 14] Based on this
domain 50K = runs are carried out to get statistics of the estimate of Lengthβ As
discussed in the experimental design several stages Smean different trials before final
affirmation of input interval yet for the statistics only one stage is carried out for each
run Within each run 10M = values of input Lengthβ are drawn for estimating binding
function
The estimation statistics of Lengthβ is shown in Table 5 below
Table 5 Statistics of estimation of beta_length
Parameter Lengthβ
Mean 1337353
Standard deviation 0107537
RMSE 0013227
In the table RMSE is the root-mean-square error which is used to measure the distances
between the observed values being estimated and the predicted values by the estimator
The individual differences are called residuals and RMSE is an aggregated measure of
the residuals To be specific
ɵ ɵ ɵ 2( ) ( ) (( ) )RMSE MSE Eθ θ θ θ= = minus (36)
in which ɵθ is the estimator and θ is the parameter to be estimated so the RMSE is the
square root of the mean square error As defined the smaller the value of RMSE is the
better the estimator is
52
Here the RMSE is calculated based on the ten points ɶ( ( ))mm mβ θ β for estimating binding
function so basically it describes the goodness of fit of the estimated binding function
with regard to the points we generated The Equation (36) is specified as
ɶ 2( ( )) (( ( ) ( )) )mm m mRMSE Meanθ β θ β θ β= minus (37)
The value of RMSE displayed in the Table 5 is the mean value of all the RMSE values
for 50 runs Seen from this we have well-estimated binding function for all the 50 runs
on average In terms of the estimates of binding function taking the one in Section 61 as
an example the binding function estimated in the interval of [12 14] in Equation (35)
has a positive constant and a positive coefficient for Lengthβ which indicates that with
larger value of Lengthβ we will get larger value ofɶ Lengthθ and as a result a negative
coefficient for length in the utility function of the logit model This is reasonable for
bigger Lengthβ reveals larger incremental effect on the cost of certain path while lower
ɶ- Lengthθ reveals larger disutility effect on certain path these two effects are in fact
equivalent
By the way the high fitness of binding function is probably due to the relatively small
input interval of Lengthβ after certain trials and shrinkage As the final estimate indicates
Lengthβ falls right into the interval of [12 14] with small standard deviation So we can
say that the estimate is quite good
63 Estimation of model with two attributes
We use the model described in the model specification section to carry out the estimation
Two attributes are used namely length and speed bump dummy Similar to the one
attribute case we carried out several trials and shrinkage to finally determine the
relatively small input intervals forLengthβ and SBβ [05 1] and [0 05] respectively
50K = runs are carried out to get statistics of the estimates of the two parameters Within
each run 10M = values are drawn for inputs Lengthβ and SBβ respectively for estimating
binding function
53
One important thing to mention here is that the inputs are drawn evenly from the domain
yet to guarantee that the values of Lengthβ and SBβ are independent from each other or to
get rid of collinearity49 the domains of two parameters are defined in two dimensions To
explain this more explicitly we choose data of one run as an example The input points of
( Lengthβ SBβ ) are shown in Figure 11 below
Figure 11 Scatter plot of the input values for beta_length and beta_sb
We can see from Figure 11 that the points spread evenly in the domain quadrant Based
on these draws we could estimate the binding function and evaluate the relationship
between parameters in the logit model and Lengthβ and SBβ without worrying about
possible correlation between Lengthβ and SBβ
As discussed before in the binding function we are supposed to find the relationship
between each of the parameters in the logit model and both parameters in the route choice
model Mathematically this binding function should be a surface in the 3D coordinate
system We take the results of one run as an example and thus we have ten sets of Lengthβ
and SBβ along with corresponding ɶ Lengthθ andɶ SBθ
49 A set of points is collinear if they lie on a single straight line or a projective line (for example projective line over any field) and this way the two factors represented by the points are correlated
0
005
01
015
02
025
03
035
04
045
05
05 06 07 08 09 1
be
ta_
sb
beta_length
54
For the first binding function ɶ Lengthθ and ( Lengthβ SBβ ) are plotted in Figure 12 below
And the binding function takes a form as described in Equation (29)
Figure 12 Scatter plot of theta_length with regard to beta_length and beta_sb
By multi-linear regression we can get a surface to approximate the binding function
locally The estimated binding function is displayed in Figure 13 below
Figure 13 Display of the estimated binding function for theta_length
And the first binding function has a formula of
55
ɶ 18234+16933 +00633Length Length SBθ β β= (38)
For the second binding function ɶSBθ and ( Lengthβ SBβ ) are plotted in Figure 14 below
And the binding function takes a form as described in Equation (30)
Figure 14 Scatter plot of theta_sb with regard to beta_length and beta_sb
By multi-linear regression we can get a surface to approximate the binding function
locally The estimated binding function is displayed in Figure 15 below
Figure 15 Display of the estimated binding function for theta_sb
56
And the second binding function has a formula of
ɶ -06698+00371 +17619SB Length SBθ β β= (39)
The t-test of estimated parameters in the binding function is carried out with null
hypothesis of zero Estimates that are significantly different from zero with 95
confidence interval are marked as bold
Table 6 Estimated coefficients of binding function for model with two attributes
Constant Lengthβ SBβ
ɶLengthθ 18234
(43632) 16933
(33481) 00633 (1392)
ɶSBθ -06698
(-7991) 00371 (0366)
17619 (19323)
Seen from the magnitude of coefficients in the binding functions both Lengthβ and SBβ
have positive effect on ɶ Lengthθ andɶ SBθ and in sequence negative effect on the coefficients
in the logit model In addition coefficients of SBβ with regard to ɶ Lengthθ and Lengthβ with
regard to ɶ SBθ are not significantly different from zero so we can say Lengthβ has a more
apparent effect on ɶ Lengthθ than SBβ does while SBβ has a more apparent effect on ɶ SBθ
than Lengthβ does
Based on the estimated binding functions and the true observation data we could get the
estimates of Lengthβ and SBβ as shown in Table 7 below
Table 7 Statistics of estimation of beta_length and beta_sb
Parameter Lengthβ
SBβ
Mean 0761383 0079874
Standard deviation 0068493 0034375
RMSE 0022772 0085113
Seen from the RMSE results the relatively small values indicate that we have well-
estimated binding functions for all the 50 runs on average With regard to the estimates of
parameters in the route choice model both of them fall into the input domain we choose
57
and the standard deviation is quite small So we can say that the estimates are actually
very good
One thing to notice here is that the final estimate of Lengthβ falls approximately in the
middle of the input domain [05 1] while the estimate of SBβ falls closer to the left limit
which might need further shrinkage of input domain and more precise estimate of the
binding function To get rid of this we use the binding function estimate from all the 500
points to give a hint on the reasonability of acceptance of the estimate of SBβ The scatter
plots of theta_sb against beta_sb and beta_length are shown in Figure 16 below
Figure 16 Scatter plots of theta_sb against beta_sb and beta_length
The scatter plots in Figure 16 above are the decompositions of the binding function from
three dimensions to two dimensions Seen from the linear regression in the two plots ɶSBθ
is almost strictly positive proportional to SBβ and hardly effected byLengthβ This means
y = 19132x - 06404
Rsup2 = 0936
-1
-08
-06
-04
-02
0
02
04
06
0 01 02 03 04 05
the
ta_
sb
beta_sb
y = 00123x - 01717
Rsup2 = 4E-05
-1
-08
-06
-04
-02
0
02
04
06
05 06 07 08 09 1
the
ta_
sb
beta_length
58
that by shrinking the input domain ofSBβ we would probably get the same estimate of
binding function since it changes little in current domain And this leads to our
acceptance of the final estimate of SBβ
Given that we have a random cost following a truncated standard normal distribution and
the magnitudes of the estimated parameters are relatively small this would mean that the
randomness of the cost function are relatively large which in sequence leads to relatively
large randomness in individualrsquos choice of route
Another thing to be mentioned is that the magnitude of Lengthβ is smaller than that when
estimated singly Though these two values are not logically comparable with different
formation of random term in the cost function we could still get a hint from the
comparison This difference is probably due to the form of random cost we used which is
( )li Length l Lengthx E xε sdot and the effect of length on the cost is partially captured by this
random term
64 Estimations of other trial formulations of the model
641 Model with exponential form of cost function
During the process of estimation we carried out a lot of other trials in the formulations of
the basic route choice model the cost function to be specific and the auxiliary logit model
As it turned out the there are negative estimates of coefficients in the cost function
which conflicts our anticipation To capture this kind of negative estimation we choose to
use the exponential form of the cost function Without loss of generality the random term
is not scaled by the length of links The cost function is specified as
( ) Length Length l SB SB l lix x
i lic x eβ β εε + += (40)
Two attributes are used namely length and speed bump dummy variable Unlike the form
in Section 63 we allow the parameters Lengthβ and SBβ to have negative input and the
random term liε now follow a standard normal distribution without truncation Since we
take the exponential form of the cost function the cost of links could be kept positive
thus allowing the use of Dijkstrarsquos Algorithm to operate
59
In terms of the auxiliary model since we could have more attributes in the auxiliary
model than the underlying model Instead of using the same attributes as in the cost
function we choose to add an attributes which is number of links in the pathLNx So the
utility function of the logit model is specified as
- - -ri Length Length r SB SB r LN LN r riU x x xθ θ θ ε= + (41)
We still expect the value of θ to be positive and the coefficient of variables with the form
of -θ would be negative
Several trials and shrinkage were carried out for this formulation of our model to finally
determine the relatively small input intervals forLengthβ and SBβ [25 27] and [-05 0]
respectively 15K = runs are carried out to get statistics of the estimates of the two
parameters Within each run 10M = values are drawn for inputs Lengthβ and SBβ
respectively for estimating binding function
To visualize the trend of binding function more clearly we make use all the 150 sets of
vector β and vector θ to estimate the binding function Since we have three variables in
the logit model we have to estimate three binding functions
For the first binding function ɶ Lengthθ and ( Lengthβ SBβ ) are plotted in Figure 17 below
shown along with the estimated binding function
Figure 17 Scatter plot of theta_length against beta_length and beta_sb estimated binding function
The first binding function takes the form of
ɶ 41312+09114 +44845 10Length Length SBθ β βminus= sdot (42)
60
For the second binding function ɶSBθ and ( Lengthβ SBβ ) are plotted in Figure 18 below
shown along with the estimated binding function
Figure 18 Scatter plot of theta_sb against beta_length and beta_sb estimated binding function
The second binding function takes the form of
ɶ 01147 01362 +07119SB Length SBθ β β= minus (43)
For the third binding function ɶ LNθ and ( Lengthβ SBβ ) are plotted in Figure 19 below
shown along with the estimated binding function
Figure 19 Scatter plot of theta_ln against beta_length and beta_sb estimated binding function
The third binding function takes the form of
ɶ 10043 03378 +00068LN Length SBθ β β= minus (44)
The t-test of estimated parameters in the binding function is carried out with null
hypothesis of zero Estimates that are significantly different from zero with 95
confidence interval are marked as bold
61
Table 8 Estimated coefficients of binding functions for model with exponential cost function
Constant Lengthβ SBβ
ɶLengthθ 1312
(2411) 09114 (4360)
4484510-4 (0005)
ɶSBθ 01147
(0425) -01362 (-1314)
07119 (17221)
ɶLNθ 10043
(13767) -03378
(-12051) 00068 (0607)
Same as in the model with two attributes ɶ Lengthθ andɶ SBθ are significantly affected by
Lengthβ and SBβ respectively The negative signs for Lengthβ in the second and third binding
functions draw our attention Since in the second binding function it is not significantly
different from zero we can disregard the effect In the third binding function Lengthβ has
significantly negative effect on ɶ LNθ The larger value of Lengthβ we have the more
influential of path length on cost is With negative effect on ɶ LNθ we can say at the same
time number of links become less influential on the utility This is reasonable since
intuitively if we are sensitive to the path length we wouldnrsquot care too much of having to
switch several more or fewer links based on that path length and number of links are
more or less correlated to each other
Based on the estimated binding functions and the true observation data we could get the
estimates of Lengthβ and SBβ as shown in Table 9 below
Table 9 Statistics of estimation of beta_length and beta_sb in exponential-cost-function model
Parameter Lengthβ
SBβ
Mean 2537672 -045601
Standard deviation 0068377 0133036
We have negative estimate of SBβ which conflicts our assumption that length and
presence of speed bump on the path may increase the cost of traveling through certain
path This is probably due to omission of important attributes in the deterministic part of
the cost function Based on the estimate we are led to think that presence of speed bump
decrease the cost and individuals would prefer to drive on paths with speed bumps Yet
62
this is not true based on our estimation since we are only using two attributes And there
are great chance that some important features are not captured which accidentally are
related with speed bump So the estimate of SBβ is misleading per se in the simple model
as we are using To get more accurate estimate of SBβ we may need to include more
variables in the deterministic part of the cost function
642 Model with estimated scale parameter for random term
Considering the trial with two attributes in Section 63 we add a fixed scale parameter to
the random term to make it proportional to the length of links This appeals to our
assumption yet lays restrictions to the model Apart from this we also try to add an
unfixed scale parameter σ and estimate it along with the other two parameters Lengthβ and
SBβ Note that if we add a scale parameter directly to the random term it wonrsquot work out
as we expect since that way the scale parameter will scale the other two parameters
Lengthβ and SBβ as well as shown below
= ( )Length SBLength Length l SB SB l li Length l SB l lix x x x
β ββ β ε σ σ εσ σ
+ + sdot + + (45)
The right side equation is equivalent to Length Length l SB SB l lix xβ β ε+ + thus making no
difference So we choose to add a new random term including the scale parameter In
addition since we can get good estimate by assuming the random term proportional to
length we will keep this in the newly added random term Now the cost function is
specified as
1 ( ) + ( )l li li Length Length l SB SB l li li Length l Lengthc x x x x Mean xε ε β β ε η σ= + + sdot sdot 2
(46)
liε and liη follow the same truncated normal distribution but are drawn separately so that
they are not equal
In terms of the auxiliary model since now we have three parameters to be estimated in
the underlying model we need one more attribute in the logit model and number of links
in the path LNx is chosen The utility function of the logit model is actually the same as in
Section 641 which is
- - -ri Length Length r SB SB r LN LN r riU x x xθ θ θ ε= + (47)
63
With three parameters in the underlying model it is more reasonable to include
interactions of parameters in the binding function The binding functions take the form of
ɶ
1 2 3
4 5 6 7
( )
Length SB
Length SB Length SB Length SB
c d d d
d d d d
θ β β β σβ β β σ β σ β β σ
= + + +
+ + + + (48)
Since the estimates are not good we did not carry out too many trials to center the input
interval As a result the binding function may be of more interest in this case The chosen
interval is a trial one which is identical [0 3] for Lengthβ SBβ andσ We choose ten sets of
mβ and ɶ ( )m mθ β from one run as an example The values of ɶ ( )m mθ β are plotted against
Lengthβ SBβ andσ respectively The interactions are not shown in the figure yet we have
the estimates of binding function which will give a numerical description of how the
interactions impact theɶ ( )m mθ β
Figure 20 Plots of theta_length against beta_length beta_sb and sigma respectively
y = 09114x + 27818
Rsup2 = 07361
0
1
2
3
4
5
6
0 1 2 3 4
the
ta_
len
gth
beta_length
y = 03568x + 36215
Rsup2 = 00897
0
1
2
3
4
5
6
0 1 2 3 4
the
ta_
len
gth
beta_sb
y = 02572x + 38468
Rsup2 = 00516
0
1
2
3
4
5
6
0 1 2 3
the
ta_
len
gth
sigma
64
Figure 21 Plots of theta_sb against beta_length beta_sb and sigma respectively
y = 02363x + 0835
Rsup2 = 0088
0
05
1
15
2
25
3
0 1 2 3 4
the
ta_
sb
beta_length
y = 06351x + 01759
Rsup2 = 05054
0
05
1
15
2
25
3
0 1 2 3 4
the
ta_
sb
beta_sb
y = -03801x + 17212
Rsup2 = 02001
0
05
1
15
2
25
3
0 1 2 3
the
ta_
len
gth
sigma
y = 00477x + 04521
Rsup2 = 005460
02
04
06
08
1
0 1 2 3 4
the
ta_
ln
beta_length
y = -00553x + 06156
Rsup2 = 00582
0
02
04
06
08
1
0 1 2 3 4
the
ta_
ln
beta_sb
65
Figure 22 Plots of theta_ln against beta_length beta_sb and sigma respectively
As we can see from the three figures above ɶ Lengthθ ɶSBθ and ɶ LNθ are more affected by
Lengthβ SBβ andσ respectively Especially we can see a strong relationship between ɶ LNθ
and σ which assures that number of links can be used to infer the scale parameter in the
underlying model
The estimates of three binding functions are shown in Table 10 below with each row
representing the estimates for one of the three binding function and each column
representing certain variable in the binding function In the parenthesis below each
estimate of the coefficients is the t-test value with the null hypothesis of zero We take the
90 confidence interval and estimates with t-test value larger than 164 are supposed to
be significantly different from zero which are marked as bold
Table 10 Estimates of three binding functions
Constant Lengthβ SBβ σ
Length SBβ β
Lengthβ σ
SBβ σ Length SBβ β σ
ɶLengthθ
1814 (3085)
0861 (2417)
-0089 (-0258)
1038 (2913)
0202 (1030)
-0246 (-1240)
-0056 (-0292)
-0045 (-0412)
ɶSBθ 0284
(1482) -0125
(-1081) 0942
(8371) -0247
(-2127) 0118
(1856) 0070
(1086) -0141
(-2275) -0067
(-1883)
ɶLNθ 0819
(18643) 0015
(0577) -0026
(-0997) -0261
(-9794) 0006
(0419) 0007
(0498) 0024
(1663) -0007
(-0803)
As the constants indicate given no other attributes length and number of links have more
negative effects on the utility than the speed bump dummy does Judging from the
significance of coefficients for the three input parametersɶ Lengthθ ɶSBθ and ɶ LNθ are
significantly affected by Lengthβ SBβ andσ respectively As we can see σ has a negative
y = -02164x + 08218
Rsup2 = 09867
0
02
04
06
08
1
0 1 2 3th
eta
_ln
sigma
66
effect on ɶSBθ andɶ LNθ Since to some extent σ measures the scale of randomness we
could say that the more randomness of the costs on the links have the less influential of
presence of speed bump and number of links become ForɶSBθ it is significantly affected
by some of the interaction terms Notice that SBβ has positive effect onɶSBθ while σ has
effect The interaction terms including both σ and SBβ have negative effect onɶSBθ which
indicates that randomness of cost is more influential than presence of speed bump on the
disutility of speed bump
In terms of the final estimate as stated above the estimates of Lengthβ and SBβ have
negative signs whileσ has positive sign This result conflict our expectation that Lengthβ
and SBβ should have positive signs so we did not carry out more trials and shrinkage The
possible reason for negative estimate is similar to that in the model with exponential form
of cost function Given more attributes in the deterministic part of both the cost function
and utility function in the logit model we might be able to capture the features of the data
better and have the right sign in the final estimates
643 Monte Carlo evidence of model with estimated scale parameter for random
term
Based on the model formulation with estimated scale parameter for random term we also
carried out a Monte Carlo simulation experiment to verify the efficiency of using number
of links in the logti model to infer the scale parameter in the cost function and what we
do is to simulated observations instead of the true ones
We take three arbitrary values for the three parameters in the cost functionLengthβ SBβ and
σ to be 05 And simulated observations are generated based on the given values of
parameters in the cost function Since we know the true values for the parameters the
input domain is centered around the true values to be [04 06] for Lengthβ SBβ andσ
10K = runs are carried out to get statistics of the estimates of the three parameters
Within each run 10M = values are drawn for inputsLengthβ SBβ andσ respectively for
estimating binding function
67
In terms of the binding function by doing regression test we can see that the intersection
terms are unnecessary to be included or even hazardous for good estimate of binding
function so we decide to remove them and keep the binding function as
ɶ1 2 3( ) Length SBc d d dθ β β β σ= + + + (49)
We choose ten sets of mβ and ɶ ( )m mθ β from one run as an example The values of
ɶ ( )m mθ β are plotted againstLengthβ SBβ andσ respectively
Figure 23 Plots of theta_length against beta_length beta_sb and sigma respectively
y = 23826x + 14791
Rsup2 = 05326
15
2
25
3
35
04 05 06
the
ta_
len
gth
beta_length
y = -06434x + 30245
Rsup2 = 0048115
2
25
3
35
04 05 06
the
ta_
len
gth
beta_sb
y = 26255x + 14156
Rsup2 = 07607
15
2
25
3
35
04 05 06
the
ta_
len
gth
sigma
y = -02443x + 04708
Rsup2 = 0034
0
01
02
03
04
05
04 05 06
the
ta_
sb
beta_length
y = 11233x - 02096
Rsup2 = 089020
01
02
03
04
05
04 05 06
the
ta_
sb
beta_sb
68
Figure 24 Plots of theta_sb against beta_length beta_sb and sigma respectively
Figure 25 Plots of theta_ln against beta_length beta_sb and sigma respectively
The figures show similar trend to those in the trial model with estimated scale parameters
which is in line with our expectation
The estimates of three binding functions are shown in Table 11 below with each row
representing the estimates for one of the three binding function and each column
y = -04374x + 056
Rsup2 = 01283
0
01
02
03
04
05
04 05 06
the
ta_
sb
sigma
y = -01144x + 07619
Rsup2 = 01114066
067
068
069
07
071
072
073
074
04 05 06
the
ta_
ln
beta_length
y = 0053x + 06768
Rsup2 = 00296066
067
068
069
07
071
072
073
074
04 05 06
the
ta_
ln
beta_sb
y = -03115x + 08561
Rsup2 = 09717
066
067
068
069
07
071
072
073
074
04 05 06
the
ta_
ln
sigma
69
representing certain variable in the binding function In the parenthesis below each
estimate of the coefficients is the t-test value with the null hypothesis of zero We take the
95 confidence interval and estimates with t-test value larger than 196 are supposed to
be significantly different from zero which are marked as bold
Table 11 Estimates of three binding functions in the Monte Carlo experiment
Constant Lengthβ SBβ σ
ɶLengthθ 0853
(3606) 1009
(3724) -0034
(-0125) 2569
(9482)
ɶSBθ -0062
(-0385) -0104
(-0564) 1208
(6591) -0226
(-1227)
ɶLNθ 0854
(46688) 0013
(0624) -0004
(-0185) -0302
(-14428)
The estimates of binding function have similar characteristics as in the trial model with
estimated scale parameters as well They contain almost the same significant coefficients
and those significant estimates have the same signs as in the trial with true observations
Based on the estimated binding function and the simulated observations given true values
of the three parameters to be 05 the final estimates of Lengthβ SBβ andσ are shown in
Table 12 below
Table 12 Statistics of estimation of beta_length beta_sb and sigma in the Monte Carlo experiment
Parameter Lengthβ
SBβ σ
Mean 0404138359 0458624533 0639191487
Standard deviation 1109279424 0242570421 0377069799
As we can see the estimates of Lengthβ SBβ andσ are quite close to their true values What
is not satisfying is that the estimate of σ is a little large and lies outside the input domain
of [04 06] but is still quite near to this interval In addition the estimate of Lengthβ is
within the input domain yet the variation is large This is understandable since we scale
the random term by length together with the scale parameter and thus the parameter for
length could be influenced by the random term and turns out to have large variations In a
word the result of Monte Carlo experiment verifies that we get use the model
70
formulation with unfixed scale parameter for the random term to get the right estimate of
the true values And number of links is strongly related withσ which means that it is
reasonable and efficient to use it as a reference to σ in the cost function
71
7 Conclusions
This thesis aims at implementing the newly proposed route choice model based on
indirect inference in true observations The model assigns links specific errors for a
network which allows natural correlations among paths and is practical in simulating
observations by means of shortest path searching algorithms like the Dijkstrarsquos Algorithm
used in our experiment To get consistent estimation of this kind of model indirect
inference method is used and a simple model like logit model is used as an auxiliary
model The route choice model and indirect inference estimator has been tested on
synthetic data with simulated observations and proved to be capable of consistently
estimated
Compared to the synthetic experiment some extensions are done in this thesis By
replacing the simulated observations with the true observations the method is tested on
the empirical circumstance to prove that it could be used in solving practical problems
The true observations have more noises than the simulated ones thus more difficulty to
capture their features We know neither the right formulations of models based on the
data nor the values of parameters in the route choice model yet as defined the
parameters should have positive signs As it turned out to be in the experiment with only
length in the model we get the estimates of Lengthβ as 1337 while with two attributes in
the model we get the estimates of Lengthβ and SBβ as 0761 and 00799 respectively The
estimates in both experiments seem reasonable with the right sign In addition seen from
the estimation of the binding function the coefficients in the logit model is negatively
affected by the parameters they infer in the basic route choice model in the two attributes
case one parameter in the logit model is more apparently affected by the parameter it
refers than the other parameter in basic model
In the trial where we include a scale parameter to the random term and estimate it along
with the other parameters in the route choice model a Monte Carlo simulation
experiment is carried out using simulated observations The result shows that it is
efficient to use number of links in the auxiliary model to infer the scale parameter in the
basic rout choice model
72
In other trial formulations of the model we got negative estimates which may probably
be due to missing attributes in the cost function Future work should be done to include
more attributes
Another thing to recommend for future is that we generate the pseudo-universal choice
set as part of the auxiliary model Since the pseudo-universal choice set is partially used
for deciding which ODs and observations to be used in the project it is essential and
should be generated beforehand But from the choice set generation point of view we
could generate individual specific choice set directly instead of random drawing paths
from the pseudo-universal choice set This would increase computational efficiency
73
Bibliography
Axhausen K Schoumlnfelder S Wolf J Oliveira M amp Samaga U (2003) 80 Weeks of
GPS Traces Approaches to Enriching the Trip Information Transportation Research
Record 1870 46-54
Azevedo J Costa M Madeira J amp Martins E (1993) An Algorithm for the Ranking
of Shortest Paths European Journal of Operational Research 69 (1) 97-106
Bartels K Boztug Y amp Muumlller M (1999) Testing the Multinomial Logit Model
Working paper University Potsdam Germany
Bekhor S Ben-Akiva M amp Ramming M (2002) Adaptation of Logit Kernel to Route
Choice Situation Transportation Research Board of the National Academics 1805 78-85
Bekhor S Ben-Akiva M amp Ramming M (2006) Evaluation of Choice Set Generation
Algorithms for Route Choice Models Annals of Operations Research 114 (1) 235-247
Ben-Akiva M amp Bierlaire M (1999) Discrete Choice Methods and Their Applications
to Short Term Travel Decisions In Chapter for the Transport Science Handbook
Preliminary Draft
Ben-Akiva M amp Bierlaire M (2003) Discrete Choice Models with Applications to
Departure Time and Route Choice In Handbook of Transportation Science (second ed)
Kluwer
Ben-Akiva M amp Bolduc D (1996) Multinomial Probit with a Logit Kernel and a
General Parametric Specification of the Covariance Structure Working Paper
Ben-Akiva M amp Lerman S (1985) Discrete Choice Analysis Theory and Application
to Travel Demand MIT Press
Ben-Akiva M Bergman M Daly A amp Ramaswamy R (1984) Modeling Inter Urban
Route Choice Behaviour In J Vollmuller amp R Hamerslag (Ed) the 9th International
Symposium on Transportation and Traffic Theory (pp 299-330) Utrecht Netherlands
VNU Science Press
Cascetta E Nuzzolo A Russo F amp Vitetta A (1996) A Modified Logit Route Choice
Model Overcoming Path Overlapping ProblemsSpecification and Some Calibration
Results for Interurban Networks In J Lesort (Ed) the 13th International Symposium on
Transportation and Traffic Theory Lyon France
74
Creel M (2009) A Data Mining Approach to Indirect Inference Universitat Autonoma
de Barcelona Department of Economics and Economic History
De La Barra T Peacuterez B amp Anez J (1993) Multidimensional Path Search and
Assignment 21st PTRC Summer Meeting (pp 307-319)
Dijkstra E (1959) A note on two problems in connexion with graphs Numerische
Mathematik 1 269-271
Frejinger E amp Bierlaire M (2007) Capturing Correlation with Subnetworks in Route
Choice Models Transportation Research Part B 41 363-378
Frejinger E Bierlaire M amp Ben-Akiva M (2009) Sampling of Alternatives for Route
Choice Modeling Transportation Research Part B Methodological 43 (10) 984-994
Gallant A amp McCulloch R (2004) On the Determination of General Scientific Models
Manuscript Duke University
Gourieacuteroux C Monfort A amp Renault E (1993) Indirect Inference Journal of Applied
Econometrics 8 85-118
Karlstroumlm A Sundberg M amp Wang Q (2011) Consistently estimating flexible route
choice models using an MNL lense International Choice Modeling Conference Leeds
Keane M amp Smith A (2003) Generalized Indirect Inference for Discrete Choice
Models Manuscript Yale University
Manski C amp Lerman S (1977) The Estimation of Choice Probabilities from Choice
Based Samples Econometrica 45 (8) 1977-1988
McFadden D (1974) Conditional Logit Analysis of Qualitative Choice Behaviour (P
Zarembka Ed) Frontiers in Econometrics 105-142
McFadden D (1978) Modeling the Choice of Residential Location In A Karlqvist L
Lundqvist F Snickars amp J Weibull (Ed) Spatial Interaction Theory and Residential
Location (pp 75-96) Amsterdam North-Holland
McFadden D amp Train K (2000) Mixed MNL Models for Discrete Response Journal
of Applied Econometrics
Nerella S amp Bhat C (2004) Numerical Analysis of Effect of Sampling of Alternatives
in Discrete Choice Models Transportation Research Record 1894 11-19
Ramming M (2001) Network Knowledge and Route Choice PhD Thesis Massachusetts
Institute of Technology
75
Schoumlnfelder S amp Samaga U (2003) Where Do You Want to Go Today-More
Observations on Daily Mobility Third Swiss Transport Research Conference Ascona
Schoumlnfelder S Axhausen K Antille N amp Bierlaire M (2002) Exploring the
Potentials of Automatically Collected GPS Data for Travel Behaviour Analysis- A
Swedish Data Source i J Moumlltgen amp A Wytzisk (Red) GI-Technologien fuumlr Verkehr
und Logistik number 13 Institut fuumlr Geoinformatik Universitaumlt Muumlnster (ss 155-179)
Munster IfGIprints
Smith A (1993) Estimating Nonlinear Time-series Models Using Simulated Vector
Autoregressions Journal of Applied Econometrics 8 63-84
Smith A (2008) Indirect Inference In S Durlauf amp L Blume (Eds) The New
Palgrave Dictionary of Economics (Second ed) Palgrave Macmillan
Smith A (1990) Three Essays on the Solution and Estimation of Dynamic
Macroeconomic Models PhD Dissertation Duke University
Train K (2003) Discrete Choice Methods with Simulation Cambridge University Press
Vovsha P amp Bekhor S (1998) Link-nested Logit Model of Route Choice-Overcoming
Route Overlapping Problem Transportation Research Record 1645 133-142
Wang H (2011) Logistics Distribution Shortest Path Based on Dijkstra Algorithm
Computer and Digital Engineering 3
Assigned publication number
TSC-MT 11-016
wwwkthse

7
1 Introduction
11 Motivation
With the development of ITS there is a stronger desire for more accurate and efficient
vehicle orientation systems and devices which relies much on the mechanism of route
choice models In other cases well estimated route choice models reveals travel behavior
of the car drivers which contributes to system-scaled analysis such as design and
appraisal of road pricing system across the road network On the other hand newly
developed GIS techniques provide sufficient route choice data as solid basement for
research on route choice behaviors Both the desire for better developed model and more
available prerequisites stimulate the research on route choice modeling
12 Background
Route choice modeling has been discussed for a long time Given a basement network
composed by a finite number of nodes which are connected by directed links we assume
that individuals travel from an origin node to a destination node in the network Thus the
choice of an individual turns out to be an observed path represented by a sequence of
links considering inherent attributes of links such as length or presence of speed bumps
From this point of view individuals make discrete choices the behavioral mechanism of
which could be seen in two different ways Individuals could either be seen as choosing
links from each junction node or choosing from possible paths connecting the origin node
and the destination one In line with a great body of literatures we focus on the path-
based approaches to develop our model
There are two important issues that need to be considered for this kind of approach
namely the generation of choice set and model formulation to address alternative
correlation due to path overlapping To be specific when we assume that individuals
choose from paths connecting the origin and destination it is infeasible to enumerate the
full-size choice set or universal choice set which includes all possible paths between the
OD pair in a given road network Individuals may not virtually consider the universal
choice set when they make decisions and in practice algorithms implemented to find the
shortest paths avoid the usage of choice set at all such as the Dijkstrarsquos algorithm we
implement in the model Hence we give each individual the right to consider all possible
8
paths It is common practice to generate samples from the universal choice set yet this
may easily introduce biases to the estimation Samples are supposed to be randomly
drawn from the population and good samples can reproduce the features in the population
Since in real-size network it is impossible to know the full-size choice set let alone to
reproduce the features of it We could only draw from certain known paths and this is
more like an importance sampling which gives links different possibilities to the drawn
into paths As a result estimation based on the sampled paths will have biases
The other problem with regard to path-based approaches is the inherent limitation of
multinomial logit model (MNL) which requires no correlation among alternatives This
is practically unrealistic since in the context of route choice modeling paths sharing
certain links are correlated due to unobserved features of the common links Numerous
literatures contribute to improvement in terms of the problem based on logit models
We choose to use an approach with additive link specific errors which belongs to probit-
like models This kind of model is efficient for applications yet it is still not able to be
estimated consistently given a partial choice set So we turn to indirect inference as the
tool to estimate the probit-like model with additive link specific errors All feasible paths
for each individual are technically allowed which means that a universal choice set is
provided for each OD pair to avoid bias caused by sampling from full choice sets The
universal choice set generated here is a so-called pseudo-universal choice set which
contains as many feasible paths as desired to eliminate possible biases but not all paths
since it is practically impossible to get the true universal choice set We choose to use an
MNL model as the auxiliary model which is easy to estimate The estimate of MNL
model is biased based on the choice set we generate as discussed above yet the estimate
of parameters in the basic route choice model will be consistent thanks to the features of
the indirect inference method
13 Objective
A Monte Carlo simulation experiment has been carried out based on synthetic trip data
and real-sized road network to appraise the proposed model (See Karlstroumlm Sundberg amp
9
Wang 2011)1 The basic route choice model includes two attributes namely length and
speed bump dummy while an MNL model is chosen as the auxiliary model with the
same two attributes Simulated trip data given two pseudo-true values for coefficients of
length and speed bump dummy are used as a substitution of the empirical data The
presence of speed bumps is randomly allocated over the network Estimation results and
sensitivity test confirm the efficiency and consistency of the proposed estimator
What needs to be done in the thesis is that true trip data should be implemented as well as
the modification of the network To be specific realistic speed bump distribution is used
to replace the randomly allocated one Without knowing the true values of the
coefficients several iterations need to be carried out to get to know the raw domain of the
values and by shrinking input intervals more accurate estimates will be attained as the
accomplishment of the thesis
14 Scope of the Thesis
Based on the route choice model used in the synthetic experiment extensions are done in
five main aspects First we implement the newly proposed estimator in real world issues
by replacing the simulated observations with the true observations collected in a real
world network Unlike the simulated data which is generated following certain
assumptions the true observations have more noises inside and thus more difficult to
capture their features Second the observations we use contain many OD pairs and not
restricted with one or four of them as in the synthetic experiment this gets rid of the
possibility of bias caused by restricted OD pairs Third since we are implementing the
new method in true observations the formulation of route choice model cost function to
be specific is not known beforehand and correspondingly the formulation of the utility
function in the logit model is not for sure as well We need several trials to get well
defined formulations to capture the features of the data Fourth we have no idea what the
parameters are like based on true observation and thus a raw guess of input domain is
needed at first and centered with shrinkage in later iterations Last but not least in one
trial we included a scale parameter to the random term in the cost function and use
number of links in the auxiliary model to infer it To test the efficiency of this trial a
1 Karlstroumlm A Sundberg M amp Wang Q (2011) Consistently estimating flexible route choice models using an MNL lense International Choice Modeling Conference Leeds
10
Monte Carlo simulation experiment is carried out with some arbitrary pseudo-true values
of the parameters based on which simulated observations are used
On the other hand what is done in the synthetic experiment such as test with simulated
observations for one OD and four ODs sensitivity of estimates with choice set size and
number of observations is not included in this thesis Instead we will identify some
limitations of the model formulation tried in the thesis and make suggestions how the
model can be improved
As follows Section 2 reviews relevant literatures on route choice modeling as well as
indirect inference In Section 3 relevant methods are introduced in detail as backgrounds
afterwards methods and models used in this thesis are illustrated Section 4 gives
description of the empirical data we use for estimating and Section 5 shows the
estimation results of the Monte Carlo simulation-based experiment followed by some
conclusions in Section 6
11
2 Literature Review
Route choice modeling has long been discussed and many efforts have been made to
solve this problem Simple and easy to estimate the multinomial logit model (MNL) is
widely used in choice modeling yet it has certain restrictions to be implemented in route
choice context Due to its inherent property of Independence from Irrelevant Alternatives
(IIA) the multinomial logit model is not easily applicable since routes in the choice set
tend to be correlated with the presence of overlapping paths Cascetta et al (1996)
proposed a correction term called Commonality Factor (CF) in the deterministic part of
the utility function2 And the probability of path i to be chosen from the choice set nC
becomes( )
( )( | )in in
jn jn
n
V CF
n V CF
j C
eP i C
e
micro
micro
minus
minus
isin
=sum
As proposed by Cascetta et al the Commonality
Factor is specified as ln ( )n
ijin CF
j C i j
LCF
L Lγβ
isin
= sum in which ijL is the length of links
common to path i and pathj while iL and jL are the total length of path i and pathj
respectively The parameter γ is left to be estimated or practically constrained to a fixed
value like 1 or 2 The CF term of one path is proportional to the length of overlapping
part with other paths This proposed model is referred to as C-Logit model Bearing some
similarities Ben-Akiva and Bierlaire (1999) proposed the Path Size Logit (PSL) model3
This model is based on a different theoretical basis as the C-Logit The original
formulation of Path Size (PS) comes from the discrete choice theory of aggregate
alternatives Similar to the CF in C-Logit the log of Path Size (PS) is added to the utility
function The probability of path i to be chosen from the choice set nC becomes
( ln )
( ln )( | )in in
jn jn
n
V PS
n V PS
j C
eP i C
e
micro
micro
+
+
isin
=sum
The Path Size is specified as
1
i n
n
ain
a Ciaj
j C j
lPS
LL
LδisinΓ
isin
= sumsum
in
2 Cascetta E Nuzzolo A Russo F amp Vitetta A (1996) A Modified Logit Route Choice Model Overcoming Path Overlapping ProblemsSpecification and Some Calibration Results for Interurban Networks In J Lesort (Ed) the 13th International Symposium on Transportation and Traffic Theory Lyon France 3 Ben-Akiva M amp Bierlaire M (1999) Discrete Choice Methods and Their Applications to Short Term Travel Decisions In Chapter for the Transport Science Handbook Preliminary Draft
12
which iΓ is the set of links in pathi al and iL are the length of link a and pathi
respectively ajδ is the link incidence variable with value of 1 when link abelongs to path
j and zero otherwise And nCL is the shortest path in choice setnC The size of a path has
a maximum value of one when it shares no links with other paths
C-Logit model and PSL model are the most widely used models in practice of route
choice modeling due to their simple forms Since both of them originate from the MNL
model and maintain the basic MNL structure they can be estimated by existing software
designed for logit models Apart from these two types of models there are other recent
efforts in the route choice context
Bekhor Ben-Akiva and Ramming (2002) adapted the Logit Kernel model to apply in a
route choice context4 The Logit Kernel5 model was proposed by combing Gaussian and
Type I Extreme Value error terms by researchers such as Ben-Akiva and Bolduc (1996)
and McFadden and Train (2000) who also referred to it as Mixed Logit6 By making
certain assumptions under route choice context Bekhor Ben-Akiva and Ramming (2002)
proposed a way to apply the model to route choice modeling7 Based on the data from
Boston several kinds of models are estimated including multinomial logit model Path
Size Logit and the newly proposed Logit Kernel model Seen from the estimation results
Logit Kernel has a better overall performance than the other two kinds of models This
result needs to be verified in other data sets since the one used in the paper has a
relatively small size
Frejinger and Bierlaire (2007) proposed an approach to capture correlation among
alternative routes with subnetworks and carried out estimation based on several kinds of
route choice models8 The paper gives an overview of the latest development of route
choice modeling and discusses the Path Size Logit model in detail As part of the
4 Bekhor S Ben-Akiva M amp Ramming M (2002) Adaptation of Logit Kernel to Route Choice Situation Transportation Research Board of the National Academics 1805 78-85 5 Ben-Akiva M amp Bolduc D (1996) Multinomial Probit with a Logit Kernel and a General Parametric Specification of the Covariance Structure Working Paper 6 McFadden D amp Train K (2000) Mixed MNL Models for Discrete Response Journal of Applied Econometrics 7 Bekhor S Ben-Akiva M amp Ramming M (2002) Adaptation of Logit Kernel to Route Choice Situation 8 Frejinger E amp Bierlaire M (2007) Capturing Correlation with Subnetworks in Route Choice Models Transportation Research Part B 41 363-378
13
conclusion a behavioral interpretation of the Path Size in the model is given The
subnetwork is defined so that the alternative routes sharing the same section of it are
seen as correlated This correlation is captured using the Error Component model and
estimation results show that this new approach gives better property than PSL models To
complement the paper uses a real size network and true travel data is collected which is
the same network we are going to use in this thesis project Additionally the paper
displays forecasting results which indicates that models with Path Size component tend
to have bad performance in prediction
Ben-Akiva and Bierlaire (2003) pointed out that under route choice context the
significant correlation among alternatives due to path overlapping and the generation of
choice set are two important issues and main difficulties9
There are some algorithms used in practice for generating choice set for route choice
modeling both deterministic methods and stochastic ones The deterministic methods
tend to give the same set of paths for a given OD pair Some examples are the link
penalty algorithm (De La Barra Peacuterez amp Anez 1993) which increases gradually the
impedance of all the links on the shortest path10 the link elimination algorithm (Azevedo
Costa Madeira amp Martins 1993) which removes links on the shortest path in sequence
to generate new paths11 and the labeled paths (Ben-Akiva Bergman Daly amp
Ramaswamy 1984)12 In terms of the stochastic methods they tend to produce individual
specific choice set One example is the simulation method (Ramming 2001) which
generates alternative paths by drawing link impedances from different distribution
densities13
When it comes to appraisal of the generated choice set some literatures give evaluations
on the efficiency of different sampling algorithms for choice set generation (See Bekhor
9 Ben-Akiva M amp Bierlaire M (2003) Discrete Choice Models with Applications to Departure Time and Route Choice In Handbook of Transportation Science (second ed) Kluwer 10 De La Barra T Peacuterez B amp Anez J (1993) Multidimensional Path Search and Assignment 21st PTRC Summer Meeting (pp 307-319) 11 Azevedo J Costa M Madeira J amp Martins E (1993) An Algorithm for the Ranking of Shortest Paths European Journal of Operational Research 69 (1) 97-106 12 Ben-Akiva M Bergman M Daly A amp Ramaswamy R (1984) Modeling Inter Urban Route Choice Behaviour In J Vollmuller amp R Hamerslag (Ed) the 9th International Symposium on Transportation and Traffic Theory (pp 299-330) Utrecht Netherlands VNU Science Press 13 Ramming M (2001) Network Knowledge and Route Choice PhD Thesis Massachusetts Institute of Technology
14
Ben-Akiva amp Ramming 2006 for example) Apart from this there are some recently
proposed methods for sampling alternatives under route choice context (See Frejinger
Bierlaire amp Ben-Akiva 2009 for example)
Nerella and Bhat (2004) carried out a numerical analysis on the effect of sample size on
the efficiency of the estimation of parameters14 The analysis is done for two kinds of
discrete choice models namely the multinomial logit model for which consistency of
estimation based on subset of alternatives is theoretically proved and non-MNL model
taking mixed multinomial logit model as an example Four evaluation criteria are chosen
namely the ability to recover model parameters ability to estimate overall log-likelihood
function value ability to estimate individual choice probabilities and ability to estimate
aggregate shares of alternatives The results show that the MNL model works well on
small sample size yet certain portion of full choice set need to be kept as a practical
baseline For the non-MNL model small sample size gives poor estimation and increase
of sample size gives obvious increase of estimation quality Certain portion of full choice
set is suggested for practical convenience yet the generalization of sample size portion is
not feasible since difference kinds of models may require different portion to guarantee
accuracy In general for the non-MNL models full choice set is suggested to be used if
feasible and larger sample gives better estimation
Bekhor Ben-Akiva and Ramming (2006) carried out route choice modeling based on a
large-scale urban network including both choice set generation part and route choice
estimation part which compose the process of route choice modeling together15 Given
that previous literatures did not pay too much attention to empirical estimation the paper
used a true observation data set collected in Boston As the first step several choice set
generation algorithms are listed and compared in their efficiency of reproducing the
observed paths on which the evaluation of the algorithms are based The data in Boston
is described in the paper and used in the second step ie model estimation Several route
choice models are presented and estimation results based on different kinds of models are
shown for comparison of the efficiency of the models The Path Size Logit model is
14 Nerella S amp Bhat C (2004) Numerical Analysis of Effect of Sampling of Alternatives in Discrete Choice Models Transportation Research Record 1894 11-19 15 Bekhor S Ben-Akiva M amp Ramming M (2006) Evaluation of Choice Set Generation Algorithms for Route Choice Models Annals of Operations Research 114 (1) 235-247
15
proposed for its property to overcoming the drawbacks of the conventional MNL models
This type of model can be easily estimated using popularized software The main
conclusion is that route choice models could be estimated for large-scale networks based
on the true observation data and prominent computing resources
Frejinger Bierlaire and Ben-Akiva (2009) proposed a paradigm for choice set generation
based on sampling for route choice modeling16 In the context of route choice modeling
the universal choice set which denotes all possible alternatives for a traveler to choose
from is not able to be enumerated So we practically work on a sampled choice set from
the universal one which may easily introduce bias to the final estimate In this paradigm
they focus on unbiased estimation of parameters instead of generating actual choice set
The path generation is seen as an importance sampling approach and a correction of
sampling is added to the path utility Since the following estimation process is based on
the sampled choice set which is treated as the universal one a correction for sampling is
added to the path size attribute in the commonly used path size logit (PSL) model ending
up with the expanded path size Modification in the previous two steps guarantees
unbiased estimation of the parameters Numerical results based on synthetic data are
presented in the paper to reveal that models with a sampling correction in the path utility
are better than those without it The proposed expanded path size logit model provides
unbiased estimation and is better than the original path size models
In this paper we will examine indirect inference Indirect inference is not a new method
it was first introduced by Smith (1990 1993)17 Then Gourieacuteroux et al (1993) gave
overall introduction to the methods and extended it in important ways18 Gallant and
McCulloch (2004) transferred the idea of indirect inference and used it for Bayesian
inference in models where likelihood function is intractable19
16 Frejinger E Bierlaire M amp Ben-Akiva M (2009) Sampling of Alternatives for Route Choice Modeling Transportation Research Part B Methodological 43 (10) 984-994 17 Smith A (1990) Three Essays on the Solution and Estimation of Dynamic Macroeconomic Models PhD Dissertation Duke University Smith A (1993) Estimating Nonlinear Time-series Models Using Simulated Vector Autoregressions Journal of Applied Econometrics 8 63-84 18 Gourieacuteroux C Monfort A amp Renault E (1993) Indirect Inference Journal of Applied Econometrics 8 85-118 19 Gallant A amp McCulloch R (2004) On the Determination of General Scientific Models Manuscript Duke University
16
Gourieacuteroux Monfort and Renault (1993) proposed the inference methods based on an
ldquoincorrectrdquo criterion which does not give consistent estimation to parameters of interest
directly20 The argument of the criterion is called the auxiliary parameter which may
have a larger dimension than the parameters of interest in the basic model After the
auxiliary parameters are selected a simulation-based process is carried out to get a
consistent and asymptotically normal estimator of parameters of interest As a simulation-
based method the only requirement for the basic model is that it could be simulated
regardless of formulations of the model So it could be used for estimating models which
are too complex to carry out direct approaches The paper shows how this kind of method
can be applied in fields such as micro-econometrics macro-econometrics and
econometrics of finance
Keane and Smith (2003) proposed a generalized form of the indirect inference method to
be implemented in the discrete choice model context21 Theoretically indirect inference
could deal with estimation of any economic models yet it has some limitations per se that
decrease the estimation efficiency or even make it difficult to implement Problems arise
when we use indirect inference in estimating discrete choice models since the objective
function the metric of distance between the auxiliary models estimated on observed data
and simulated data to be specific is inherently discrete which leaves the gradient-based
optimization methods infeasible Keane and Smith (2003) proposed that the estimation
procedures used for observed data and simulated data can be different22 Instead of the
discrete choice a continuous function of latent utilities including a smoothing parameter
is used as the dependent variable in the auxiliary model When the smoothing parameter
goes to zero the function of latent utilities converges to the discrete choices this way to
guarantee consistency According to the Monte Carlo results the generalized indirect
inference method proposed in this paper yields good estimates in small samples being as
efficient as maximum likelihood estimates in comparison
20 Gourieacuteroux C Monfort A amp Renault E (1993) Indirect Inference 21 Keane M amp Smith A (2003) Generalized Indirect Inference for Discrete Choice Models Manuscript Yale University 22 Keane M amp Smith A (2003) Generalized Indirect Inference for Discrete Choice Models
17
Creel (2009) presented a data mining approach to indirect inference23 which is similar to
the regular indirect inference method yet with certain advantages over it The method is a
simulation-based estimator relying also on an auxiliary model In line with the indirect
inference method an underlying economic model with parameterβ is referenced by an
auxiliary model with parameterθ Certain values of the parameter hβ in underlying
economic model are drawn randomly from a known density simulated data is generated
using Monte Carlo methods to estimate ɶh
θ of auxiliary model which ends up with a set
of tuples ɶ( )hhβ θ Nonparametric methods are used to get the function ɶ( | )E aβ θ = and
the final estimate of β is supposed to be the result of regression function evaluated at the
estimate of θ based on true observations ɶ ɵ( | )Eβ β θ θ= = Creel (2009) also presented a
way of calculating confidence intervals24 Monte Carlo results in dynamic and nonlinear
panel models and vector autoregressions show good performance of the new estimator
23 Creel M (2009) A Data Mining Approach to Indirect Inference Universitat Autonoma de Barcelona Department of Economics and Economic History 24 Creel M (2009) A Data Mining Approach to Indirect Inference
18
3 Methodology
31 Multinomial Logit Model (MNL)
311 Model Description
Route choice modeling is somewhat complicated when we want to capture the attributes
of both the alternative routes and choice maker accurately and reflect the choice making
process in the model Intuitively route choice can be regarded as choosing one specific
route from several alternative routes which coincides with the prerequisites of discrete
choice models Actually a lot of literatures have explored the route choice modeling and
possible improvements based on discrete choice models (see Cascetta et al 1996 Vovsha
and Bekhor 1998 Ben-Akiva and Bierlaire 1999 for more information on development
in route choice models with regard to discrete choice models)25
To understand the frontier development of route choice model we have got to know the
discrete choice models among which multinomial logit model (MNL) is the most widely
used In addition we choose to implement a new method ndash indirect inference in which
MNL is used as it is
Logit model is the most widely used discrete choice model till now due to its excellent
qualities in model specification To be specific the choice probability takes a closed form
which is easy to estimate and interpret (Train 2003)26
The multinomial logit model is a kind of choice model with more than two alternatives in
the choice set We assume that the choice maker makes his or her decision based on the
utility maximization rule (Ben-Akiva amp Lerman 1985)27 With regard to the utility njU
the decision maker n obtains from the thj alternative in the choice set it is made up of
two parts the deterministic part and the stochastic part The deterministic part denoted
25 Cascetta E Nuzzolo A Russo F amp Vitetta A (1996) A Modified Logit Route Choice Model Overcoming Path Overlapping ProblemsSpecification and Some Calibration Results for Interurban Networks Vovsha P amp Bekhor S (1998) Link-nested Logit Model of Route Choice-Overcoming Route Overlapping Problem Transportation Research Record 1645 133-142 Ben-Akiva M amp Bierlaire M (1999) Discrete Choice Methods and Their Applications to Short Term Travel Decisions 26 Train K (2003) Discrete Choice Methods with Simulation Cambridge University Press 27 Ben-Akiva M amp Lerman S (1985) Discrete Choice Analysis Theory and Application to Travel Demand MIT Press
19
by njV contains attributes known by the modelers while the stochastic part denoted by
njε is the attributes affecting peoplersquos the decision which cannot be observed by the
modelers yet are known by the decision makers themselves So the utility function turns
out to be
nj nj njU V jε= + forall (1)
The type of choice model is basically decided by the distribution of the stochastic part
When we assume that njε is independently identically Gumbel distributed the model
becomes a logit model
As stated above the decision follows utility maximization rule which means that the
decision maker n chooses the alternative with the highest utility say the thi alternative
Use as the probability the thi alternative is chosen over the others we have
( max ) ( )
( )
( )
ni ni nj ni njj C
ni ni nj nj
nj ni ni nj
P P U U P U U j i
P V V j i
P V V j i
ε εε ε
isin= = = ge forall ne
= + gt + forall ne
= minus lt minus forall ne (2)
With Equation (2) above and the assumption that njε follows iid Gumbel distribution we
could derive the probability of decision maker n chooses alternativei which is
ni
nj
V
ni V
j
eP
e=sum
(3)
Typically we specify the deterministic part of the utility function in a linear form which
is nj njV xβ= Then the probability becomes
ni
nj
x
ni x
j
eP
e
β
β=sum
(4)
This is the most common form of probability function for multinomial logit models
There are some good properties for this kind of logit probability as discussed by Train
(2009)28 With this form the probability of choosing certain alternative will be between
zero and one inherently which is basically required for probability definition Yet the
28 Train K (2003) Discrete Choice Methods with Simulation
20
value of niP will never drop to zero mathematically which means that all the alternatives
in the choice set are perceived to have chance to be chosen On the other hand if an
alternative is perceived never to be chosen it should not be included in the choice set at
all
The probabilities for all the alternatives in the choice set sums to be one which is easily
illustrated from the analytical properties 1 1 1
( ) 1njni
J J JVV
nii i j
P e e= = =
= =sum sum sum in which J denotes
the number of alternatives in the choice set
The logit probability and the deterministic part of the utility function follow an S-shaped
curve line shown in Figure 1 below
Figure 1 S-shaped relationship between probability and deterministic part of utility
This property gives implications for possible impacts of the deterministic utility of certain
alternative on its chances to be chosen We could see that when an alternative has about
50 probability to be chosen which infers to the steepest part on the curve a small
change in the deterministic part of the utility function could lead to a large change in the
probability the alternative has to be chosen
Apart from the nice properties of logit probability logit models have some disadvantages
as well (Bartels Boztug amp Muumlller 1999)29 One shortcoming is the assumption of
29 Bartels K Boztug Y amp Muumlller M (1999) Testing the Multinomial Logit Model Working paper University Potsdam Germany
21
Gumbel distribution of error terms in the utility function The inherent requirement for
iid property sets restrictions for logit model to be widely used especially in route choice
modeling context Several models have been proposed to overcome this shortcoming in
particular modifications based on MNL to adjust it to route choice practices have been
proposed Another drawback is the assumption of the linear composition for the
deterministic part of utility function Actually this assumption is for ease of following
estimation process since McFadden (1974) demonstrated that under this condition the
probabilities will be universally concave with regard to the coefficientsβ 30 which
improves the performance of numerical estimation Yet there could be nonlinear
compositions in the deterministic part to relax the restriction Under this condition the
universal concavity cannot be guaranteed which may lead to local convergence in the
estimation process
312 Model Estimation
The most commonly used numerical estimation method for multinomial logit models is
the Maximum Likelihood Estimation (MLE) In principle given a set of data and the
underlying probability model the method tries to find coefficients of the probability
model with which produced data has a distribution most likely resembles the distribution
of the observed data
Consider the case that N decision makers with their choice data are obtained Parameters
to be estimated are the coefficients in the utility function denoted byβ We could then
use the MLE to try to get the values of β vector with which the probability that choice
maker choose their observed alternatives is maximized
The probability of choice maker n to choose his or her observed alternative can be
written as
( ) niyni
i
Pprod (5)
in which niy is a dummy with value 1 if choice maker choose alternative i and value 0
otherwise
30 McFadden D (1974) Conditional Logit Analysis of Qualitative Choice Behaviour (P Zarembka Ed) Frontiers in Econometrics 105-142
22
Choice makers choose their alternative independently from each other so the probability
of all sampled choice makers choose their observed alternative is
1
( ) ( ) ni
Ny
nin i
L Pβ=
= prodprod (6)
This is the likelihood function with regard to the parameters to be estimated β in this
case We can take the logarithm of it to get the log-likelihood function
1
( ) lnN
ni nin i
LL y Pβ=
=sumsum (7)
Since we aim at getting the value of β to make the log-likelihood function maximized
we can take the derivative of it with respect to β and set it to zero
( )
0dLL
d
ββ
= (8)
By solving this equation we could get the estimate of β
32 Dijkstrarsquos Algorithm
321 Introduction
A method is needed for generating feasible alternatives and compose the choice set as
well as for deriving simulated observations for each OD pair in the process of indirect
inference As for choice set generation we would like to include certain number of high
ranking shortest paths in the choice set since these paths tend to have more possibility to
be chosen Similar to this the simulated observation is generated as the shortest path
between each OD pair We implement a method for shortest path finding which is the
Dijkstrarsquos Algorithm
Dijkstrarsquos Algorithm is named after the Dutch computer scientist Edsger Dijkstra who
conceived this method in 1956 and got it published in 195931 This is a graph search
algorithm aiming at solving shortest path problem for a graph the edge cost of which is
defined nonnegative The outcome of it is a shortest path tree demonstrating the path with
lowest value with respect to the defined cost
31 Dijkstra E (1959) A note on two problems in connexion with graphs Numerische Mathematik 1 269-271
23
This algorithm deals with single-source problem To be specific given one source node in
the graph the algorithm will give paths with the lowest value with regard to cost from
this source node to every other node in the network Given certain criterion we could use
the algorithm to find shortest path between two specific nodes by setting one node as the
source and the other as the target
After released it is widely used in path searching problems especially in transportation
related practices Routing problem is considered in investigation on traffic assignment
and optimization in logistics Real sized road network could be perceived as a graph with
vertices and edges in which cities can be abstracted as the vertices in the graph and the
roads connecting cities can then be regarded as the edges With the aid of Dijkstrarsquos
Algorithm the shortest path with respect to cost could be found from certain city to the
other cities The outcome is valuable for logistics corporations to work out their region-
wide distribution plans32
322 Algorithm
We connect a ldquodistancerdquo value with all the vertices in the graph indicating its distance
from the source vertex To be accurate the ldquodistancerdquo could be actual length of edges or
the generalized cost on the edges or anything desired The source vertex is defined as the
initial node with a value of zero In the process Dijkstrarsquos Algorithm will assign values
to vertices detected in one loop and update the values in the following loops till a
minimum value is found for each vertex The steps for searching and updating are
presented below
1 Initialize the network and assign the distance values of vertices other than the initial
node as infinity
2 When one vertex is to be detected it is denoted as current node All the vertices that
have been detected and attained the minimum distance values will be marked as detected
and will not be detected in the following loops while the vertices remaining unvisited
will be marked undetected To initialize all the vertices are marked undetected and the
initial node is set as current node
32 Wang H (2011) Logistics Distribution Shortest Path Based on Dijkstra Algorithm Computer and Digital Engineering 3
24
3 For current node all its directly connected adjacent nodes are considered except for
the newly detected vertex Labeled distance values of the neighbor vertices will be
updated if the calculated values from current node are smaller than their current values
For example current node A has a distance value of 4 and one of its neighbors B has a
value of 8 The edge linking A and B has a distance of 2 The newly calculated distance
value for B will be 4+2=6 which is smaller than 8 So the labeled distance value for B
will be updated to 6 indicating that the minimum distance from the source vertex to B till
now is 6 and the path should pass A
4 When all the neighbors of the current node are considered and updated mark the
current node as detected And mark the undetected node with the lowest distance value as
the current node and do the detection in step 3 again
5 When all the vertices in the network are marked detected the algorithm is finished and
we get the minimum distance from the source to all the other vertices The shortest path
from the source to a specific vertex could be found out following the detecting process
As mentioned above the stop criterion could also be modified as we desired If we aim at
finding the shortest path between two vertices at the beginning one vertex should be set
as the initial node and the algorithm could be stopped once the other vertex is marked as
detected
323 Explanatory Example
Here is a simple network to illustrate the mechanism of Dijstrarsquos Algorithm There are
five vertices and six edges with distance values labeled beside We define A as the source
and set it the initial node
Figure 2 A simple network for Dijstrrarsquoa Algorithm explanation
25
Initialization
Initial node A
Detected null
Distance value A=0 B=C=D=E=+infin
Loop 1
Current node A
Adjacent vertices B C
Detected null
Distance value A=0 B=4 C=1 D=E=+infin
Loop 2
Current node C
Adjacent vertices B D
Detected A
Distance value A=0 C=1 B=min 4 C+2 =3 D=C+3=4 E=+infin
Loop 3
Current node B
Adjacent vertices E
Detected A C
Distance value A=0 C=1 B=3 D=4 E=B+3=6
Loop 4
Current node E
Adjacent vertices null
Detected A B C D
Distance value A=0 C=1 B=3 D=4 E=6
If we want to get the shortest path from A to E following the detecting process we could
know that it should be A-C-B-E
26
324 Discussion
Dijkstrarsquos Algorithm has a clear logical structure which makes it easy to understand as
well as to implement in programming Nonetheless this method cannot search directly
from one node towards the other to find the shortest path between the two It works more
like detecting all the adjacent nodes in terms of shortest paths and expands from the
source iteratively until the target node is included and that is when we could figure out
the shortest path between the two specific vertices This reveals the fact that the method
wastes a lot of time in the blind search leaving it inefficient In addition this method is
not able to deal with networks with negative edge values yet this is not a problem in our
research since link cost on our network is defined nonnegative
33 Indirect Inference
331 Introduction
For problems in route choice context choice set size may be way too large to enumerate
all the alternatives Yet estimation based on sampled choice set may introduce biases
which can be corrected in some special cases (see Frejinger Bierlaire amp Ben-Akiva
2009)33 While in cases where estimation models are not based on MNL say multinomial
probit model we could not find corrections for biases caused by sampled choice set
Estimator based on the principle of indirect inference is then introduced to overcome
inconsistency problem34
Indirect inference35 is a simulation-based method for estimating parameters in economic
models by making references to the parameters of interest (Smith 2008) It is motivated
when general statistical estimation method such as Maximum Likelihood is intractable or
as discussed above consistent estimation is required given that only sampled choice set is
available Since in economic analysis we tend to build models which guarantee scientific
logic and inclusion of necessary attributes quite often the models will end up
33 Frejinger E Bierlaire M amp Ben-Akiva M (2009) Sampling of Alternatives for Route Choice Modeling 34 Karlstroumlm A Sundberg M amp Wang Q (2011) Consistently estimating flexible route choice models using an MNL lense 35 Smith A (2008) Indirect Inference In S Durlauf amp L Blume (Eds) The New Palgrave Dictionary of Economics (Second ed) Palgrave Macmillan
27
complicated from statistical estimation point of view This in sequence spurs the wide use
of indirect inference in economic analysis
It is common character that simulation-based methods allows modelers to simulate data
from the economic model of interest given certain perceived values of the parameters to
be estimated Since to generate data is essential and simple the true challenge is how to
estimate coefficients Indirect inference uses an auxiliary model which gives a rich
description of the covariance patterns in the data by including certain variables from the
basic economic model On the other hand the auxiliary model does not need to reflect
accurately the data generating process since it is supposed to be estimated based on the
data derived not to generate data itself The basic function of the auxiliary model is that
it provides a criterion to compare observed data and simulated data from the basic
economics model
We do iterations with the aim of finding the parameters of the basic economic model so
the observed data and the simulated data from the basic model looks almost the same by
the criterion of auxiliary model To be specific the auxiliary model is estimated based on
both observed data and simulated data we choose parameters for the basic model to
make sure that the two estimator of auxiliary model are as close as possible Based on
this idea the auxiliary model should be easy to estimate
332 Definition of the method
We define an economic model with the form of
( ) 12t t ty G x t Tε β= = (9)
in which 1 Tt tx = is a sequence of observed exogenous variables 1 T
t ty = is a sequence of
observed endogenous variables and 1 Tt tε = is a sequence of unobserved random error
terms β is a k -dimensional coefficient vector of the exogenous variables (Smith
2008)36
This model generally describes a relation that ty is dependent ontx with some random
errors Given the distribution of the random errors we could get the probability density
36 Smith A (2008) Indirect Inference
28
function of ty conditional on tx We will not focus on this density and instead this model
is only used for simulating data in indirect inference
In terms of the auxiliary model it could be defined by a probability density function with
the form of
( | )t tf y x θ (10)
in which θ is a p -dimensional coefficient vector and p is supposed to be not smaller
than k since we should capture characteristics of all the parameters in the underlying
economic model In addition the auxiliary model needs not be defined to reproduce the
distribution of ty in the basic model yet it needs to have a convenient analytical format
Based on the observed data we could estimate the parameters in the auxiliary model
using Maximum Likelihood Method
ɵ
1
arg max log ( | )T
t tt
f y xθ
θ θ=
= sum (11)
The estimated coefficient vectorɵθ could be used as an indicator of certain features of the
observed data
On the other hand the auxiliary model can be estimated based on simulated data from the
basic model as well We need to draw a sequence of random error terms 1 m Tt tε = from the
defined distribution in which m denotes the number of simulation with an interval of [1
M ] generally Given a coefficient vectorβ we could generate the values of endogenous
variables ɶ 1 ( )m T
tty β = which are explicitly dependent onβ With the help of Maximum
Likelihood Method we could get
ɶ ɶ
1 1
( ) arg max log ( ( ) | )M T m
ttm t
f y xθ
θ β β θ= =
= sumsum (12)
According to the principle of indirect inference we try to find the values of β to make
ɶ( )θ β as close toɵθ as possible Practically we need a metric to measure the distance
between ɵθ andɶ( )θ β and by minimizing the distance we could find out the estimates of
β in the basic economic model
29
333 Choices of the metrics
As mentioned above we need a metric to measure the distance betweenɵθ andɶ( )θ β
There are three approaches corresponding to the three classical hypothesis tests namely
Wald likelihood ratio (LR) and Lagrange multiplier (LM)37
In the Wald approach we try to minimize a quadratic form in the difference between the
two estimators ofɵθ andɶ( )θ β which is
ɵ ɶ ɵ ɶarg min( ( )) ( ( ))Wald
Wβ
β θ θ β θ θ β= minus minus (13)
in which W is a positive definite ldquoweightingrdquo matrix
In the LR approach a metric is formed based on the likelihood function related to the
auxiliary model which is
ɵ ɶ
1 1
arg min( log ( | ) log ( | ( )))T TLR
t t t tt t
f y x f y xβ
β θ θ β= =
= minussum sum (14)
According to the definition ofɵθ the first part of the objective function before the minus
sign on the right-hand side is always larger than the second part after the minus sign And
the first part is not dependent onβ
To minimize the objective function is equivalent to maximizing the log-likelihood
function withɶ( )θ β that is
ɶ
1
arg max( log ( | ( )))TLR
t tt
f y xβ
β θ β=
= sum (15)
In the LM approach the metric is formed using the derivative of the log-likelihood
function related to the auxiliary model which is
arg min ( ) ( )LM
S VSβ
β β β= (16)
in which
ɶ ɵ
1 1
( ) log ( ( ) | )M T m
ttm t
S f y xβ β θθ= =
part=partsumsum
(17)
and V is a positive definite matrix
37 Smith A (2008) Indirect Inference
30
By using any of the approaches we aim at getting the minimized distance betweenɵθ and
ɶ( )θ β so the value will approach to zero as expected So the hypothesis test of the
minimized value could be used as an indicator of whether the auxiliary model is suitably
specified In other words the minimized value being significantly different from zero
indicates a bad specification of the auxiliary model
In comparison the LM approach has an advantage over the others in computation when
it is relatively time-consuming to estimate the auxiliary model
334 Consistency Interpretation
Suppose the observed sample size T grows large while total number of simulations stays
fixed as M the estimator based on simulated data ɶ( )θ β will converge to a pseudo-true
value denoted as( )h β which is also dependent onβ This is called binding function
which characterized the relationship between the coefficients in the basic model and the
auxiliary model At the same time the estimator based on observed data ɵθ will converge
to a pseudo-true value0θ In case that T grows to a large number the aim of indirect
inference changes to finding β that guarantees0 ( )hθ β= This could explain that indirect
inference gives consistent estimate of the parameters in the basic economic model
In this project the binding function is what we focus on to get the correct estimates
instead of finding certain metrics Detailed methods will be discussed in the following
part
34 Model Specification in the Thesis
341 Basic Route Choice Model
Based on all the methods mentioned in previous sections the specification of models and
methods we use in the thesis will be explained in this section Since we are to estimate
the model based on true observations no model is known beforehand to adjust to the data
we use Several formulations of the model have been tested in the thesis The one
explained here could be seen as an example and all the other trials contain modifications
based on this model The other specifications of model will be explained along with the
results in the result section
31
We start by describing the underlying route choice model of interest38 We need to define
a road network as a representation of a real-size one from which we collected the trip
data The network denoted asN consists of a set of nodes (vertices) v and links (edges)
l Each link has a source node ( )s l and a target node or a destination node( )d l which
together indicate the direction of the link A path from an origin node ov to a destination
node dv could be seen as a sequence of links1 nl lhellip of which 1( ) os l v= 1( ) ( )i id l s l +=
and ( ) dnd l v= So a path can be defined by the index of links which is 1 nl lπ = hellip
A vector of characteristics denoted aslx is associated to each link as well as a strictly
positive cost function( )l lic x ε β in which liε is an individual specific random link cost
with i denoting the individual and β is a vector of coefficients of the link characteristics
left to be estimated In the Indirect Inference context we need an auxiliary model with
easily-estimated analytical form yet there is no such requirement for the basic model
Although not necessary we assume that the cost function has a linear deterministic form
the deterministic part and the random part are additively separable So we have the cost
function as
( ) Tl li l lic x xε β β ε= + (18)
In addition one important assumption is that the link cost is additive which means that
the cost of a path can be attained by the sum of all the link costs along the path This way
we have the cost of a path π as
( ) ( )l lil
C c xπ
π ε βisin
=sum (19)
We focus on the path-based model which means that the individuals choose among all
possible paths As defined above this turns out to be a random utility choice model As
indicated by the standard assumptions of this kind of models choice makers are assumed
to know both the link characteristics and their idiosyncratic random utility liε associated
to each link Since the choice makers maximize their utility this means that they will
choose the path with the lowest generalized cost in this model This way we have the
choice of individual i as
38 Karlstroumlm A Sundberg M amp Wang Q (2011) Consistently estimating flexible route choice models using an MNL lense
32
( )
arg min ( )o di i
iv v
Cπ
π πisinΩ
= (20)
in which oiv denotes the origin point of the trip for individual i and d
iv denotes the
destination ( )o di iv vΩ denotes all possible paths connecting the origin and destination in
the network for individual i which forms the choice set for the individual
When implementing the model we assume that the random utility component liε follows
a truncated normal distribution To be specific liε follows a standard normal distribution
yet with only the positive values retrieved This way we could guarantee that the link
costs are always positive so that additively the path would not have infinite loops With
this feature of the random component we could say that our model is probit-like Based
on this assumption the prerequisite of Dijkstrarsquos Algorithm is satisfied which always
needs positive edge values on the network We can use the Dijkstrarsquos Algorithm to find
the shortest paths iπ as an intermediate step in the implementation Apart from this we
assume that the unobserved cost captured by the random term is proportional to the
length of link To embody this in the cost function we add a fixed scale parameter to the
random term with a form of ( )Length l Lengthx Mean x in which ( )LengthMean x is the average
length of links in the network
We will assume that the data consists of J paths as dependent variables which means
that the dependent variables for the choice model are 1 Ji iy π == In addition the observed
characteristics of links in the network are provided 1 Ll lx x == To be specific we choose
to use two attributes of the links namely the length of the links Lengthx and the dummy
variable indicating the presence of speed bumps on the links SBx The cost function then
is specified as
( ) ( )l li Length Length l SB SB l li Length l Lengthc x x x x Mean xε β β ε= + + sdot (21)
Now the objective is to estimate the parametersβ in the model for which we will make
use of an auxiliary model
33
342 Auxiliary Model
Based on the idea of Indirect Inference we treat the route choice model defined above as
the basic model of interest which might have complex formation and be difficult to
estimate directly Then we need an auxiliary model to form a criterion which takes into
certain aspects of data to focus the analysis The auxiliary model needs not to reflect the
data generating process exactly as in the basic model yet it needs to include attributes of
interest in order for reference and to be easy to estimate We choose to use a logit model
for route choice as the auxiliary model since the logit model has always been a useful
tool for discrete choice analysis thanks to its analytical form and there is software for
estimating logit models which ensures that we can estimate very efficiently
As to the auxiliary model it is chosen to be a logit model for route choice We consider
that each individual i is choosing from a set of alternative routesr Each route r is given
a utility of riU
- Tri r ri r riU V Xε θ ε= + = + (22)
in which θ is the vector of auxiliary parameters which gives inference to the parameters
in the basic model One thing to be mentioned is that as expected the coefficients in the
utility function should have negative signs To make it easier for comparison with the
coefficients in the basic route choice model we assume the sign of θ to be positive per
se and add a negative sign ahead of it to guarantee that the coefficient part is negative as a
whole rX denotes route characteristics and riε is the random utility for each individual
which is assumed to follow an iid (independently identically distributed) Gumbel
distribution following the standard assumption of logit models
Note that as required for the auxiliary model it should be flexible enough to capture the
variability in the data and thus contains no fewer attributes than the basic model39 In
order to infer the parameters in the basic model and in consideration of efficiency we
pick the same attributes of interest in the basic models which are the link length Lengthx
and the speed bump dummy variableSBx So the utility function turns out to be
- -ri Length Length r SB SB r riU x xθ θ ε= + (23)
39 Karlstroumlm A Sundberg M amp Wang Q (2011) Consistently estimating flexible route choice models using an MNL lense
34
The probability of individual i choosing path r given an individual specific choice set
( )iI o d is
( )
ri
si
i
V
ri V
s I o d
eP
eisin
=sum
(24)
Theoretically we allow the individuals to choose from all possible paths between the
origin and destination in the network which intuitively could be infinite and impossible
to enumerate When implementing the model we generate the individual choice set based
on the basic route choice model Through simulation of the basic model we generate
infinite unique shortest paths for all the unique OD pairs by redrawing the random link
cost liε Without loss of generality the number of paths generated would be big enough
with fully consideration of efficiency We name the finite choice set composed by the
shortest paths generated as the pseudo-universal choice set ( )I o d which is a sample of
the infinite universal choice set The individual specific choice sets are generated by
randomly drawing certain number of paths out of the pseudo-universal choice set And
the size of individual specific choice set could be equal to or smaller than that of the
pseudo-universal one
The resulting individual specific choice set ( )iI o d describes a finite subset of all possible
paths connecting the origin oand destinationd for individuali When implementing the
methods the way of generating the choice set ( )iI o d for each individual i is viewed as
part of the auxiliary model
After the auxiliary model is built it could be estimated using a Maximum Likelihood
estimator based on the observed data of individual choices y and attributes variablesx
for individual 1 i N= hellip The estimate of parameters in the auxiliary model is
ɵ arg max ( )L y xθ
θ θ= (25)
in which ( )L y x θ is the log-likelihood function for the auxiliary model
Given the data of the link attributes xand some random draws of structural parameters
mβ 1 m M= hellip we can simulate choice data through the basic route choice model With
M draws of β from some given density we could simulate M sets of data resulting in
35
simulated choicesɶ( )my β Same as before parameters θ in the auxiliary model can be
estimated based on the simulated data as
ɶ ɶ( ) arg max ( ( ) )m m mL y xθ
θ β β θ= (26)
As the process indicated the simulated choice data depends on the structural parameterβ
in the basic route choice model and in sequence the estimates of parameters θ in the
auxiliary model depends on β when estimated based on the simulated data Based on
this theoretically we have a relationship of ( )θ β referred to as the binding function in
indirect inference literatures which we will discuss in detail for implementation of model
in this thesis A metric is then chosen to measure the distance between the observed and
simulated data viewed by the auxiliary model as a way to indirectly infer the values of
parameters β in the basic model To be specific for each draw of the structural parameter
mβ we can get the estimates of ɶ ( )m mθ β based on the simulated data and the distance
between ɶ ( )m mθ β and ɵθ measured by the chosen metric By doing more iteration with the
aim of minimizing the distance we will get the value of mβ which spurs the ɶ ( )m mθ β
closest toɵθ and this mβ is the inferred estimates of the parameter in the basic model
343 Consistency Discussion
The process of indirectly estimating parameters in the basic model is described above yet
we need to know whether the method we provide gives consistent estimation Here are
some discussions explaining the consistency in estimating by which consistency of the
estimator we proposed is illustrated
As proved the multinomial logit model (MNL) can be estimated consistently based on a
subset of alternatives (McFadden 1978)40 We may need to use the classical conditional
maximum likelihood estimator to deal with the problem at the same time the probability
that an individual n chooses an alternative i conditional on the subset of alternatives
denoted asnc becomes the conditional probability
40 McFadden D (1978) Modeling the Choice of Residential Location In A Karlqvist L Lundqvist F Snickars amp J Weibull (Ed) Spatial Interaction Theory and Residential Location (pp 75-96) Amsterdam North-Holland
36
ln ( | )
ln ( | )( | )in n
jn n
n
V q c i
n V q c j
j c
eP i c
e
micro
micro
+
+
isin
=sum
(27)
in which micro is a scale parameter and inV is the deterministic part of the utility There is a
term ln ( | )nq c j for correcting the sampling bias in which ( | )nq c j denotes the probability
of sampling nc given that alternative j is chosen
If all the alternatives in the choice set have the same probability to be chosen into the
subset the estimation on the subset of alternatives is equivalent to that on the full choice
set To be specific in this case ( | )nq c i is equal to ( | )n nq c j j cforall isin so by calculation the
term for sampling bias correction will cancel out in the probability function
In route choice context the alternative paths between an origin and a destination may be
in large amount and it is inefficient to give some very long-distance paths the same
probability as those short and attractive ones This means that we may need the
importance sampling method when generating subsets of alternatives which selects
attractive alternatives with higher probability than unattractive ones And the correction
term does not cancel out in this case Note that if alternative specific constants are
estimated we can get unbiased estimates of all the parameters except the constants even
if the correction term is not included in the utility function (Manski amp Lerman 1977)41
Back to the route choice context we tend to use large number of alternatives even with
subset of the full choice set which means that it is generally impossible to estimate the
constants and thus the correction term is essential To solve this problem Frejinger et al
(2009) developed a sampling approach in the context of route choice42
The discussion above focuses on the usage of MNL for route choice modeling When it
comes to our method the individual specific choice set is generated by randomly drawing
alternatives from the pseudo-universal choice set with the same probability yet there is
bias when generating the pseudo-universal ones since the pseudo-universal choice set is
composed of certain number of shortest paths between two nodes and this generating
process gives some paths higher probability to be included into the choice set So we
41 Manski C amp Lerman S (1977) The Estimation of Choice Probabilities from Choice Based Samples Econometrica 45 (8) 1977-1988 42 Frejinger E Bierlaire M amp Ben-Akiva M (2009) Sampling of Alternatives for Route Choice Modeling
37
actually use importance sampling to get the choice set which may consequently
introduce bias in estimating the parameterθ in the auxiliary model as discussed above
With the idea of indirect inference we consider only the relationship between θ andβ
denoted as( )θ β and use this relation to infer the value ofβ From this point of view
whether θ is estimated with bias or not does not matter since the relation between it and
β could always be captured which is the specific thing we focus on using the method of
indirect inference So we can say that even with biased subset of alternatives we could
still get consistent estimation by using indirect inference
344 Binding Function
As discussed in indirect inference method section when the sample size N increases
which means that we have more observations of choice the estimated parameter in the
auxiliary modelɶ ( )m mθ β will converge to a stable value ( )mθ β which is often referred
to as the binding function
Given that route choice model deals with discrete choices and by using indirect inference
we have a discrete choice model as the auxiliary model as well the estimates of binding
function ( )mθ β will inherit the discontinuous feature due to discrete individual choices
ɶ( )my β Keane and Smith (2003) proposed a solution of using logit-smoothing on the
simulated dependent choice data43 Following this idea we assume a continuous binding
functionɶ( )θ β for simplicity which could be approximated by a linear function locally
within small intervals With the M randomly drawn values of mβ and the corresponding
estimated parameters ɶ ( )m mθ β in the auxiliary model we could perform an Ordinary
Least Square (OLS) regression to estimate the local approximation of binding function
ɶ( ) c Dθ β β= + (28)
in which cdenotes the constant vector and D denotes the OLS parameter matrix44 To be
specific in our case each parameter in the auxiliary model will have a restriction
function with regard to both parameters in the basic model which is
43 Keane M amp Smith A (2003) Generalized Indirect Inference for Discrete Choice Models 44 Karlstroumlm A Sundberg M amp Wang Q (2011) Consistently estimating flexible route choice models using an MNL lense
38
ɶ1 11 12( )Length Length SBc d dθ β β β= + +
(29)
ɶ2 21 22( )SB Length SBc d dθ β β β= + +
(30)
Based on the observed data of choices y and explanatory variables xand the estimated
binding function which indicates the restrictions between ɶθ andβ we could use the
maximum likelihood method to give estimation of the parameters of interest The
likelihood ratio approach to indirect inference is following ideas of Smith (1993)45 and
Keane and Smith (2003)46
ɶ=arg max ( ( ))L y xβ
β θ β (31)
in which β is the estimate of the parameter of interest β in the basic economic model
With the restriction of binding function this is actually an indirectly inferred estimate In
line with the estimating process in auxiliary model ( )L sdot is the likelihood function of the
auxiliary model
Note that the form of binding function is based on an assumption in the result part we
will verify that this assumption is realistic
45 Smith A (1993) Estimating Nonlinear Time-series Models Using Simulated Vector Autoregressions 46 Keane M amp Smith A (2003) Generalized Indirect Inference for Discrete Choice Models
39
4 Data
41 Road Network
The data we use for estimation is based on a GPS data set collected in the Swedish city of
Borlaumlnge Borlaumlnge is located in the middle part of Sweden and has a population of about
47 000 inhabitants
The virtual road network contains 3077 nodes and 7459 unidirectional links (Frejinger amp
Bierlaire 2007)47 of which 3061 nodes and 7288 links are included in the network for
estimation Figure 3 gives a visual illustration of the road network in Borlaumlnge
Figure 3 Illustration of the Borlaumlnge road network
With regard to our research two of the link attributes are included namely link length
and speed bump dummy Link length is in the unit of km and speed bump dummy is an
indication of speed bump existence on the links which has the value 1 when there is a
speed bump on the link and 0 otherwise
Link length
47 Frejinger E amp Bierlaire M (2007) Capturing Correlation with Subnetworks in Route Choice Models
40
Some descriptive statistics of the link length data for the whole network is presented in
Table 1 below
Table 1 Descriptive statistics of link length
Number of links 7288
Minimum 0001
Maximum 7599
Mean 0184487
Median 0102
Variance 0103722
Lexis ratio (varmean) 1016884
Skewness 9871144
To describe the overall character of the link length attribute the histogram is shown in
Figure 4 below
Figure 4 Histogram of link length data
We could see that the link length data is quite clustered most of which lies within the
range of 01km and 06km Nonetheless there are some extreme values far away from the
range indicating extremely long links To display the variation in the relatively clustered
area we draw a histogram zoomed in the interval of (0 1km] shown Figure 5 in below
0
01
02
03
04
05
06
Fre
qu
en
cy
Link length (km)
Histogram
41
Figure 5 Histogram of link length data (zoomed within 1km)
Over 80 of all the links have length shorter than 03 km indicating concentration of
link length data
Speed bump dummy
Speed bump dummy is based on true situation in the network Of all the links 82 links
are equipped with speed bumps which account for a percentage of 113 The following
Figure 6 displays the locations of links with speed bumps
Figure 6 Illustration of links with speed bumps
0005
01015
02025
03035
04045
05
Fre
qu
en
cy
Link length (km)
Histogram(zoom in)
42
42 Observation Data
The GPS data set is collected as a part of the Swedish Intelligent Speed Adaptation (ISA)
study which aims at traffic safety effects of in-car information systems In the study 186
vehicles were equipped with GPS devices and traced within a radius of 25 km from the
center of Borlaumlnge The monitoring lasted for 30 days from 22th June 2000 to 4th March
2002 obtaining 49 667 vehicle days of travel and nearly a quarter of a million trips (for
more information on the GPS data set check Axhausen Schoumlnfelder Wolf Oliveira amp
Samaga 2003 Schoumlnfelder amp Samaga 2003 Schoumlnfelder Axhausen Antille amp Bierlaire
2002)48
The data collection is not originally designed for route choice analysis so the raw data
cannot be used in our research directly Extensive data processing is performed by the
company GeoStats in Atlanta to retrieve new data set available for route choice analysis
which contains 24 vehicles and 16 035 observations The final data set we use is provided
by Emma Frejinger which contains in total 1832 observations corresponding to 1458
observed unique routes made by 24 vehicles and 1409 unique origin-destination pairs
Considering that certain route may have been observed more than once we make a
distinction between observations and unique routes and number of unique routes should
be less than that of observations consistently with the numbers listed above
As indicated by data collection in the ISA study only licensed drivers with access to his
or her only car are recruited to minimize sharing or swapping of cars Minimum socio-
economic data of the drivers is included in data collection so we have no way to
understand driver characteristics from the data set Logically we make an assumption
that there is only one individual per vehicle
In the observation data a route is represented by a series of links and also an origin-
destination pair With relatively intensively distributed link length number of links could
48 Axhausen K Schoumlnfelder S Wolf J Oliveira M amp Samaga U (2003) 80 Weeks of GPS Traces Approaches to Enriching the Trip Information Transportation Research Record 1870 46-54 Schoumlnfelder S amp Samaga U (2003) Where Do You Want to Go Today-More Observations on Daily Mobility Third Swiss Transport Research Conference Ascona Schoumlnfelder S Axhausen K Antille N amp Bierlaire M (2002) Exploring the Potentials of Automatically Collected GPS Data for Travel Behaviour Analysis- A Swedish Data Source In J Moumlltgen amp A Wytzisk (Ed) GI-Technologien fuumlr Verkehr und Logistik number 13 Institut fuumlr Geoinformatik Universitaumlt Muumlnster (pp 155-179) Munster IfGIprints
43
be used to indicate total length of routes Some of the descriptive statistics of link number
is shown in Table 2 below
Table 2 Descriptive statistics of link numbers in observation data set
Number of observations 1832
Minimum 5
Maximum 106
Mean 202877
Median 16
Variance 1871968
Lexis ratio (varmean) 9227126
Skewness 1732597
For further overall inspection of link number distribution in the observation data set the
histogram is shown in Figure 7 below
Figure 7 Histogram of link numbers in observations data set
Seen from the histogram distribution of number of links is relatively dispersed with a
large range interval Judging by the statistics in general the routes observed have about
000
200
400
600
800
1000
1200
1400
1600
5 8
11
14
17
20
23
26
29
32
35
38
41
44
47
50
53
56
59
62
65
68
71
74
77
80
83
86
89
92
95
98
10
1
10
4
10
7
Mo
re
Fre
qu
en
cy
Number of links
Histogram
44
20 links in average Yet the data has a big variance which is reasonable As stated above
there are 1409 unique OD pairs for 1832 observations indicating that for most OD pairs
there is only one observation Spread within the detecting area different OD pairs could
have various numbers of links in between
Following our experiment design only a portion of the data could be used To be specific
routes with number of links fewer than ten would be eliminated when used for estimation
43 Further Exploration of data
Apart from the characters discussed above there are some other attributes in the data set
interesting to be explored Both in link attribute data set and observation data set there is
travel time data which to some extent is parallel with length in indicating distance
between two nodes
In the link attribute data set one attribute is denotes the estimated travel time of links in
unit of hour Some of the descriptive statistics is shown in Table 3 below switching unit
to minute
Table 3 Descriptive statistics of estimated travel time on links
Number of links 7288
Minimum 000186
Maximum 578268
Mean 0281696
Median 018744
Variance 0119337
Lexis ratio (varmean) 0423638
Skewness 5785361
Seen from Table 3 estimated travel time seems to have a more clustered distribution than
link length judging by lexis ratio and skewness Yet this time is roughly estimated not so
qualified as link length to use in estimation since the latter is much easier to measure and
guarantee precision
In the observation data set we have the duration time of the observations in the unit of
minute Some of the descriptive statistics is shown in Table 4 below
45
Table 4 Descriptive statistics of duration of trips
Number of observations 1832
Minimum 007
Maximum 316
Mean 4991195
Median 3925
Variance 1775639
Lexis ratio (varmean) 3557542
Skewness 2174728
Duration of trips can be used as an indication of distance between origin and destination
yet it is roughly measured and strongly affected by traffic condition on the road network
With similar reasons as discussed on estimated travel time on link we use number of
links instead of duration of trips to indicate the distance between OD pairs
46
5 Experiment Design
When doing the simulation-based estimation it is physically divided into two parts for
convenience of operation As discussed in the method section we choose to use a pseudo-
universal choice set which is generated and stored in the first part and ready for use in
the following experiment Then in the second part we do the simulation-based
experiment to carry out indirect inference method for estimating the parameters of
interest in the basic model β to be specific The Figure 8 below illustrates an abstracted
flow of how the estimation is carried out given certain origin-destination pair
Figure 8 Illustration of the flow in the experiment
As shown in the flow chart we get all the unique OD pairs in the trip data For each of
the OD pairs the Dijkstrarsquos algorithm is used to find the shortest paths between them
without duplicates We set the intended number of paths to be 400 as well as time
terminator in case not enough paths could be generated within certain bearable time
47
interval The generated paths form the pseudo-universal choice set of each OD pair
which is stored for future use Note that we abandon some OD pairs with too few paths
in the pseudo-universal choice set Observations containing the kept OD pairs are used
for following estimation which turns out to be 940 of them
For the OD pair in a given observation 200 alternatives are randomly drawn from the
pseudo-universal choice set and the sequential links in the observation itself is read as an
alternative path The 201 paths compose the observed choice set On the other hand a
given value of mβ is drawn from a predefined domainD The shortest path is generated
based on the given mβ as the simulated observation Like in the observed choice set part
200 alternatives are randomly drawn from the pseudo-universal choice set to form the
simulated choice set together with the simulated observation The auxiliary model is
estimated based on the simulated choice set and we could get a set of ɶ( ( ))mm mβ θ β pairs
which will be used to estimate the binding function Based on the binding function and
the observed choice set the parameters in the basic model could be indirectly estimated
The process described above is abstracted with no illustration of iterations Since this is
an experiment based on simulations certain loops of iteration should be carried out to get
statistics of the results
Given observed trip data at first we have no idea of the value of β In the process of
retrieving value ofβ the estimation process is repeated for several stages denoted asS
starting from a rough guess of the domainsD while for each following stage the domain
shrinks Since we tend to use a local OLS regression to approximate the smooth binding
function the draws of smβ need to be around the true value to prevent misspecification of
OLS regression due to the possibly inherent nonlinearity of the binding function The
estimated 0
β is not satisfactory in precision in the first stage yet it could give a hint of
where the true value lies The domain1D is centered on 0
β with smaller interval before
the estimation in the second stage This way +1sD is dependent on sD with smaller
interval As it goes on we will get a more accurate domain and as a result a well specified
OLS regression to approximate the binding function
48
The process of experiment with iterations is described below Suppose that we have the
experiment carried out for K times and the number of observations used isN
for run 1 k K= hellip for true observation 1 i N= hellip
Randomly draw alternatives from the pseudo-universal choice set end Form the observed choice sety for stage 1 s S= hellip
for 1 m M= hellip
Draw ksmβ from the domain ksD
Simulate paths for OD pairs in the used observations with mβ
for simulated observation 1 i N= hellip Randomly draw alternatives from the pseudo-universal choice set end
Form a simulated route choice setɶ( )ksmy β
Estimate ɶ ( )ks ksm mθ β in Equation (26)
end
Estimate ɶ ( )ks
θ β in Equation (28)
Estimate ks
β in Equation (31) end
Center the domain 1k sD + on ks
β and shrink the interval end
As a trial we first do the experiment on a route choice model with one parameter link
length to be specific For simplicity the random term is not scaled as described in the
model specification section which means we attach a truncated normally distributed
random term to the cost function without scaling it with link length After getting the
estimation of Lengthβ we move on to estimating the route choice model with both
parameters as described in the model specification Results under these two formulations
of models are presented separately in the result part
49
6 Results
61 Validation of Binding Function
As discussed in the binding function section we assume the binding function to be
continuous and feasible to be approximated by a linear function locally The assumption
of binding function can be verified based on the ɶ( ( ))mm mβ θ β pairs we attained as
intermediate results To explain this more explicitly we carry out a simple example with
only one parameter in the route choice model Lengthβ to be specific
The cost function is specified as
( )l li Length Length l lic x xε β ε= + (32)
corresponding to which the auxiliary model is
-ri Length Length r riU xθ ε= + (33)
For each run 10 values ofLengthβ are evenly drawn from a given domain By simulating
observations and estimating the auxiliary model 10 corresponding Lengthθ are generated to
form ten ɶ( ( ))mm mβ θ β pairs As assumed the binding functionɶ( )θ β is continuous which
could be approximated by a linear function locally To display the trend of binding
function we choose a relatively large domain for Lengthβ in the beginning [010]D = and
carry out 10 runs which generate 100 points in the beta-theta diagram shown in Figure 9
below
Figure 9 Scatter plots of the 90 beta-theta pairs
y = 12804x + 16264
Rsup2 = 09959
0
2
4
6
8
10
12
14
16
0 2 4 6 8 10
the
ta_
len
gth
beta_length
50
We do OLS regression for the dots and estimate the binding function Intuitively the
smaller the domain is the more accurate is the approximation of the binding function We
shrink the input domain based on the final estimate of Lengthβ from last trial
As it turned out to be we choose an input domain of [1214]D = for Lengthβ and the
binding function is assumed to take the form of
ɶ1 11( )Length Lengthc dθ β β= +
(34)
The result for one run is displayed in Figure 10 below
Figure 10 OLS regression based on the 10 beta-theta points from one run
The estimated binding function based on the 10 points is
ɶ ( ) 17371+10838Length Lengthθ β β= (35)
as indicated by 2 09783R = the function describes the trend of points very well Since
the interval is quite small we could use the estimated function to approximate the
binding function
When it comes to more parameters in the route choice model what we do is simply to
add more elements in the binding function After getting a vector of β and the
corresponding vector ofɶ( )θ β binding functions of each element in vector ɶ( )θ β with
y = 17371x + 10838
Rsup2 = 09783
315
32
325
33
335
34
345
35
355
12 125 13 135 14
the
ta_
len
gth
beta_length
51
regard to all the elements in vector β are estimated One example is shown in the
Equation (29) and Equation (30)
62 Estimation of model with one attribute
The route choice model with one attribute we used is the one described in Section 61
above After several trials by shrinking input interval every time we finally affirm that
the true value Lengthβ of lies in a relatively small interval of [12 14] Based on this
domain 50K = runs are carried out to get statistics of the estimate of Lengthβ As
discussed in the experimental design several stages Smean different trials before final
affirmation of input interval yet for the statistics only one stage is carried out for each
run Within each run 10M = values of input Lengthβ are drawn for estimating binding
function
The estimation statistics of Lengthβ is shown in Table 5 below
Table 5 Statistics of estimation of beta_length
Parameter Lengthβ
Mean 1337353
Standard deviation 0107537
RMSE 0013227
In the table RMSE is the root-mean-square error which is used to measure the distances
between the observed values being estimated and the predicted values by the estimator
The individual differences are called residuals and RMSE is an aggregated measure of
the residuals To be specific
ɵ ɵ ɵ 2( ) ( ) (( ) )RMSE MSE Eθ θ θ θ= = minus (36)
in which ɵθ is the estimator and θ is the parameter to be estimated so the RMSE is the
square root of the mean square error As defined the smaller the value of RMSE is the
better the estimator is
52
Here the RMSE is calculated based on the ten points ɶ( ( ))mm mβ θ β for estimating binding
function so basically it describes the goodness of fit of the estimated binding function
with regard to the points we generated The Equation (36) is specified as
ɶ 2( ( )) (( ( ) ( )) )mm m mRMSE Meanθ β θ β θ β= minus (37)
The value of RMSE displayed in the Table 5 is the mean value of all the RMSE values
for 50 runs Seen from this we have well-estimated binding function for all the 50 runs
on average In terms of the estimates of binding function taking the one in Section 61 as
an example the binding function estimated in the interval of [12 14] in Equation (35)
has a positive constant and a positive coefficient for Lengthβ which indicates that with
larger value of Lengthβ we will get larger value ofɶ Lengthθ and as a result a negative
coefficient for length in the utility function of the logit model This is reasonable for
bigger Lengthβ reveals larger incremental effect on the cost of certain path while lower
ɶ- Lengthθ reveals larger disutility effect on certain path these two effects are in fact
equivalent
By the way the high fitness of binding function is probably due to the relatively small
input interval of Lengthβ after certain trials and shrinkage As the final estimate indicates
Lengthβ falls right into the interval of [12 14] with small standard deviation So we can
say that the estimate is quite good
63 Estimation of model with two attributes
We use the model described in the model specification section to carry out the estimation
Two attributes are used namely length and speed bump dummy Similar to the one
attribute case we carried out several trials and shrinkage to finally determine the
relatively small input intervals forLengthβ and SBβ [05 1] and [0 05] respectively
50K = runs are carried out to get statistics of the estimates of the two parameters Within
each run 10M = values are drawn for inputs Lengthβ and SBβ respectively for estimating
binding function
53
One important thing to mention here is that the inputs are drawn evenly from the domain
yet to guarantee that the values of Lengthβ and SBβ are independent from each other or to
get rid of collinearity49 the domains of two parameters are defined in two dimensions To
explain this more explicitly we choose data of one run as an example The input points of
( Lengthβ SBβ ) are shown in Figure 11 below
Figure 11 Scatter plot of the input values for beta_length and beta_sb
We can see from Figure 11 that the points spread evenly in the domain quadrant Based
on these draws we could estimate the binding function and evaluate the relationship
between parameters in the logit model and Lengthβ and SBβ without worrying about
possible correlation between Lengthβ and SBβ
As discussed before in the binding function we are supposed to find the relationship
between each of the parameters in the logit model and both parameters in the route choice
model Mathematically this binding function should be a surface in the 3D coordinate
system We take the results of one run as an example and thus we have ten sets of Lengthβ
and SBβ along with corresponding ɶ Lengthθ andɶ SBθ
49 A set of points is collinear if they lie on a single straight line or a projective line (for example projective line over any field) and this way the two factors represented by the points are correlated
0
005
01
015
02
025
03
035
04
045
05
05 06 07 08 09 1
be
ta_
sb
beta_length
54
For the first binding function ɶ Lengthθ and ( Lengthβ SBβ ) are plotted in Figure 12 below
And the binding function takes a form as described in Equation (29)
Figure 12 Scatter plot of theta_length with regard to beta_length and beta_sb
By multi-linear regression we can get a surface to approximate the binding function
locally The estimated binding function is displayed in Figure 13 below
Figure 13 Display of the estimated binding function for theta_length
And the first binding function has a formula of
55
ɶ 18234+16933 +00633Length Length SBθ β β= (38)
For the second binding function ɶSBθ and ( Lengthβ SBβ ) are plotted in Figure 14 below
And the binding function takes a form as described in Equation (30)
Figure 14 Scatter plot of theta_sb with regard to beta_length and beta_sb
By multi-linear regression we can get a surface to approximate the binding function
locally The estimated binding function is displayed in Figure 15 below
Figure 15 Display of the estimated binding function for theta_sb
56
And the second binding function has a formula of
ɶ -06698+00371 +17619SB Length SBθ β β= (39)
The t-test of estimated parameters in the binding function is carried out with null
hypothesis of zero Estimates that are significantly different from zero with 95
confidence interval are marked as bold
Table 6 Estimated coefficients of binding function for model with two attributes
Constant Lengthβ SBβ
ɶLengthθ 18234
(43632) 16933
(33481) 00633 (1392)
ɶSBθ -06698
(-7991) 00371 (0366)
17619 (19323)
Seen from the magnitude of coefficients in the binding functions both Lengthβ and SBβ
have positive effect on ɶ Lengthθ andɶ SBθ and in sequence negative effect on the coefficients
in the logit model In addition coefficients of SBβ with regard to ɶ Lengthθ and Lengthβ with
regard to ɶ SBθ are not significantly different from zero so we can say Lengthβ has a more
apparent effect on ɶ Lengthθ than SBβ does while SBβ has a more apparent effect on ɶ SBθ
than Lengthβ does
Based on the estimated binding functions and the true observation data we could get the
estimates of Lengthβ and SBβ as shown in Table 7 below
Table 7 Statistics of estimation of beta_length and beta_sb
Parameter Lengthβ
SBβ
Mean 0761383 0079874
Standard deviation 0068493 0034375
RMSE 0022772 0085113
Seen from the RMSE results the relatively small values indicate that we have well-
estimated binding functions for all the 50 runs on average With regard to the estimates of
parameters in the route choice model both of them fall into the input domain we choose
57
and the standard deviation is quite small So we can say that the estimates are actually
very good
One thing to notice here is that the final estimate of Lengthβ falls approximately in the
middle of the input domain [05 1] while the estimate of SBβ falls closer to the left limit
which might need further shrinkage of input domain and more precise estimate of the
binding function To get rid of this we use the binding function estimate from all the 500
points to give a hint on the reasonability of acceptance of the estimate of SBβ The scatter
plots of theta_sb against beta_sb and beta_length are shown in Figure 16 below
Figure 16 Scatter plots of theta_sb against beta_sb and beta_length
The scatter plots in Figure 16 above are the decompositions of the binding function from
three dimensions to two dimensions Seen from the linear regression in the two plots ɶSBθ
is almost strictly positive proportional to SBβ and hardly effected byLengthβ This means
y = 19132x - 06404
Rsup2 = 0936
-1
-08
-06
-04
-02
0
02
04
06
0 01 02 03 04 05
the
ta_
sb
beta_sb
y = 00123x - 01717
Rsup2 = 4E-05
-1
-08
-06
-04
-02
0
02
04
06
05 06 07 08 09 1
the
ta_
sb
beta_length
58
that by shrinking the input domain ofSBβ we would probably get the same estimate of
binding function since it changes little in current domain And this leads to our
acceptance of the final estimate of SBβ
Given that we have a random cost following a truncated standard normal distribution and
the magnitudes of the estimated parameters are relatively small this would mean that the
randomness of the cost function are relatively large which in sequence leads to relatively
large randomness in individualrsquos choice of route
Another thing to be mentioned is that the magnitude of Lengthβ is smaller than that when
estimated singly Though these two values are not logically comparable with different
formation of random term in the cost function we could still get a hint from the
comparison This difference is probably due to the form of random cost we used which is
( )li Length l Lengthx E xε sdot and the effect of length on the cost is partially captured by this
random term
64 Estimations of other trial formulations of the model
641 Model with exponential form of cost function
During the process of estimation we carried out a lot of other trials in the formulations of
the basic route choice model the cost function to be specific and the auxiliary logit model
As it turned out the there are negative estimates of coefficients in the cost function
which conflicts our anticipation To capture this kind of negative estimation we choose to
use the exponential form of the cost function Without loss of generality the random term
is not scaled by the length of links The cost function is specified as
( ) Length Length l SB SB l lix x
i lic x eβ β εε + += (40)
Two attributes are used namely length and speed bump dummy variable Unlike the form
in Section 63 we allow the parameters Lengthβ and SBβ to have negative input and the
random term liε now follow a standard normal distribution without truncation Since we
take the exponential form of the cost function the cost of links could be kept positive
thus allowing the use of Dijkstrarsquos Algorithm to operate
59
In terms of the auxiliary model since we could have more attributes in the auxiliary
model than the underlying model Instead of using the same attributes as in the cost
function we choose to add an attributes which is number of links in the pathLNx So the
utility function of the logit model is specified as
- - -ri Length Length r SB SB r LN LN r riU x x xθ θ θ ε= + (41)
We still expect the value of θ to be positive and the coefficient of variables with the form
of -θ would be negative
Several trials and shrinkage were carried out for this formulation of our model to finally
determine the relatively small input intervals forLengthβ and SBβ [25 27] and [-05 0]
respectively 15K = runs are carried out to get statistics of the estimates of the two
parameters Within each run 10M = values are drawn for inputs Lengthβ and SBβ
respectively for estimating binding function
To visualize the trend of binding function more clearly we make use all the 150 sets of
vector β and vector θ to estimate the binding function Since we have three variables in
the logit model we have to estimate three binding functions
For the first binding function ɶ Lengthθ and ( Lengthβ SBβ ) are plotted in Figure 17 below
shown along with the estimated binding function
Figure 17 Scatter plot of theta_length against beta_length and beta_sb estimated binding function
The first binding function takes the form of
ɶ 41312+09114 +44845 10Length Length SBθ β βminus= sdot (42)
60
For the second binding function ɶSBθ and ( Lengthβ SBβ ) are plotted in Figure 18 below
shown along with the estimated binding function
Figure 18 Scatter plot of theta_sb against beta_length and beta_sb estimated binding function
The second binding function takes the form of
ɶ 01147 01362 +07119SB Length SBθ β β= minus (43)
For the third binding function ɶ LNθ and ( Lengthβ SBβ ) are plotted in Figure 19 below
shown along with the estimated binding function
Figure 19 Scatter plot of theta_ln against beta_length and beta_sb estimated binding function
The third binding function takes the form of
ɶ 10043 03378 +00068LN Length SBθ β β= minus (44)
The t-test of estimated parameters in the binding function is carried out with null
hypothesis of zero Estimates that are significantly different from zero with 95
confidence interval are marked as bold
61
Table 8 Estimated coefficients of binding functions for model with exponential cost function
Constant Lengthβ SBβ
ɶLengthθ 1312
(2411) 09114 (4360)
4484510-4 (0005)
ɶSBθ 01147
(0425) -01362 (-1314)
07119 (17221)
ɶLNθ 10043
(13767) -03378
(-12051) 00068 (0607)
Same as in the model with two attributes ɶ Lengthθ andɶ SBθ are significantly affected by
Lengthβ and SBβ respectively The negative signs for Lengthβ in the second and third binding
functions draw our attention Since in the second binding function it is not significantly
different from zero we can disregard the effect In the third binding function Lengthβ has
significantly negative effect on ɶ LNθ The larger value of Lengthβ we have the more
influential of path length on cost is With negative effect on ɶ LNθ we can say at the same
time number of links become less influential on the utility This is reasonable since
intuitively if we are sensitive to the path length we wouldnrsquot care too much of having to
switch several more or fewer links based on that path length and number of links are
more or less correlated to each other
Based on the estimated binding functions and the true observation data we could get the
estimates of Lengthβ and SBβ as shown in Table 9 below
Table 9 Statistics of estimation of beta_length and beta_sb in exponential-cost-function model
Parameter Lengthβ
SBβ
Mean 2537672 -045601
Standard deviation 0068377 0133036
We have negative estimate of SBβ which conflicts our assumption that length and
presence of speed bump on the path may increase the cost of traveling through certain
path This is probably due to omission of important attributes in the deterministic part of
the cost function Based on the estimate we are led to think that presence of speed bump
decrease the cost and individuals would prefer to drive on paths with speed bumps Yet
62
this is not true based on our estimation since we are only using two attributes And there
are great chance that some important features are not captured which accidentally are
related with speed bump So the estimate of SBβ is misleading per se in the simple model
as we are using To get more accurate estimate of SBβ we may need to include more
variables in the deterministic part of the cost function
642 Model with estimated scale parameter for random term
Considering the trial with two attributes in Section 63 we add a fixed scale parameter to
the random term to make it proportional to the length of links This appeals to our
assumption yet lays restrictions to the model Apart from this we also try to add an
unfixed scale parameter σ and estimate it along with the other two parameters Lengthβ and
SBβ Note that if we add a scale parameter directly to the random term it wonrsquot work out
as we expect since that way the scale parameter will scale the other two parameters
Lengthβ and SBβ as well as shown below
= ( )Length SBLength Length l SB SB l li Length l SB l lix x x x
β ββ β ε σ σ εσ σ
+ + sdot + + (45)
The right side equation is equivalent to Length Length l SB SB l lix xβ β ε+ + thus making no
difference So we choose to add a new random term including the scale parameter In
addition since we can get good estimate by assuming the random term proportional to
length we will keep this in the newly added random term Now the cost function is
specified as
1 ( ) + ( )l li li Length Length l SB SB l li li Length l Lengthc x x x x Mean xε ε β β ε η σ= + + sdot sdot 2
(46)
liε and liη follow the same truncated normal distribution but are drawn separately so that
they are not equal
In terms of the auxiliary model since now we have three parameters to be estimated in
the underlying model we need one more attribute in the logit model and number of links
in the path LNx is chosen The utility function of the logit model is actually the same as in
Section 641 which is
- - -ri Length Length r SB SB r LN LN r riU x x xθ θ θ ε= + (47)
63
With three parameters in the underlying model it is more reasonable to include
interactions of parameters in the binding function The binding functions take the form of
ɶ
1 2 3
4 5 6 7
( )
Length SB
Length SB Length SB Length SB
c d d d
d d d d
θ β β β σβ β β σ β σ β β σ
= + + +
+ + + + (48)
Since the estimates are not good we did not carry out too many trials to center the input
interval As a result the binding function may be of more interest in this case The chosen
interval is a trial one which is identical [0 3] for Lengthβ SBβ andσ We choose ten sets of
mβ and ɶ ( )m mθ β from one run as an example The values of ɶ ( )m mθ β are plotted against
Lengthβ SBβ andσ respectively The interactions are not shown in the figure yet we have
the estimates of binding function which will give a numerical description of how the
interactions impact theɶ ( )m mθ β
Figure 20 Plots of theta_length against beta_length beta_sb and sigma respectively
y = 09114x + 27818
Rsup2 = 07361
0
1
2
3
4
5
6
0 1 2 3 4
the
ta_
len
gth
beta_length
y = 03568x + 36215
Rsup2 = 00897
0
1
2
3
4
5
6
0 1 2 3 4
the
ta_
len
gth
beta_sb
y = 02572x + 38468
Rsup2 = 00516
0
1
2
3
4
5
6
0 1 2 3
the
ta_
len
gth
sigma
64
Figure 21 Plots of theta_sb against beta_length beta_sb and sigma respectively
y = 02363x + 0835
Rsup2 = 0088
0
05
1
15
2
25
3
0 1 2 3 4
the
ta_
sb
beta_length
y = 06351x + 01759
Rsup2 = 05054
0
05
1
15
2
25
3
0 1 2 3 4
the
ta_
sb
beta_sb
y = -03801x + 17212
Rsup2 = 02001
0
05
1
15
2
25
3
0 1 2 3
the
ta_
len
gth
sigma
y = 00477x + 04521
Rsup2 = 005460
02
04
06
08
1
0 1 2 3 4
the
ta_
ln
beta_length
y = -00553x + 06156
Rsup2 = 00582
0
02
04
06
08
1
0 1 2 3 4
the
ta_
ln
beta_sb
65
Figure 22 Plots of theta_ln against beta_length beta_sb and sigma respectively
As we can see from the three figures above ɶ Lengthθ ɶSBθ and ɶ LNθ are more affected by
Lengthβ SBβ andσ respectively Especially we can see a strong relationship between ɶ LNθ
and σ which assures that number of links can be used to infer the scale parameter in the
underlying model
The estimates of three binding functions are shown in Table 10 below with each row
representing the estimates for one of the three binding function and each column
representing certain variable in the binding function In the parenthesis below each
estimate of the coefficients is the t-test value with the null hypothesis of zero We take the
90 confidence interval and estimates with t-test value larger than 164 are supposed to
be significantly different from zero which are marked as bold
Table 10 Estimates of three binding functions
Constant Lengthβ SBβ σ
Length SBβ β
Lengthβ σ
SBβ σ Length SBβ β σ
ɶLengthθ
1814 (3085)
0861 (2417)
-0089 (-0258)
1038 (2913)
0202 (1030)
-0246 (-1240)
-0056 (-0292)
-0045 (-0412)
ɶSBθ 0284
(1482) -0125
(-1081) 0942
(8371) -0247
(-2127) 0118
(1856) 0070
(1086) -0141
(-2275) -0067
(-1883)
ɶLNθ 0819
(18643) 0015
(0577) -0026
(-0997) -0261
(-9794) 0006
(0419) 0007
(0498) 0024
(1663) -0007
(-0803)
As the constants indicate given no other attributes length and number of links have more
negative effects on the utility than the speed bump dummy does Judging from the
significance of coefficients for the three input parametersɶ Lengthθ ɶSBθ and ɶ LNθ are
significantly affected by Lengthβ SBβ andσ respectively As we can see σ has a negative
y = -02164x + 08218
Rsup2 = 09867
0
02
04
06
08
1
0 1 2 3th
eta
_ln
sigma
66
effect on ɶSBθ andɶ LNθ Since to some extent σ measures the scale of randomness we
could say that the more randomness of the costs on the links have the less influential of
presence of speed bump and number of links become ForɶSBθ it is significantly affected
by some of the interaction terms Notice that SBβ has positive effect onɶSBθ while σ has
effect The interaction terms including both σ and SBβ have negative effect onɶSBθ which
indicates that randomness of cost is more influential than presence of speed bump on the
disutility of speed bump
In terms of the final estimate as stated above the estimates of Lengthβ and SBβ have
negative signs whileσ has positive sign This result conflict our expectation that Lengthβ
and SBβ should have positive signs so we did not carry out more trials and shrinkage The
possible reason for negative estimate is similar to that in the model with exponential form
of cost function Given more attributes in the deterministic part of both the cost function
and utility function in the logit model we might be able to capture the features of the data
better and have the right sign in the final estimates
643 Monte Carlo evidence of model with estimated scale parameter for random
term
Based on the model formulation with estimated scale parameter for random term we also
carried out a Monte Carlo simulation experiment to verify the efficiency of using number
of links in the logti model to infer the scale parameter in the cost function and what we
do is to simulated observations instead of the true ones
We take three arbitrary values for the three parameters in the cost functionLengthβ SBβ and
σ to be 05 And simulated observations are generated based on the given values of
parameters in the cost function Since we know the true values for the parameters the
input domain is centered around the true values to be [04 06] for Lengthβ SBβ andσ
10K = runs are carried out to get statistics of the estimates of the three parameters
Within each run 10M = values are drawn for inputsLengthβ SBβ andσ respectively for
estimating binding function
67
In terms of the binding function by doing regression test we can see that the intersection
terms are unnecessary to be included or even hazardous for good estimate of binding
function so we decide to remove them and keep the binding function as
ɶ1 2 3( ) Length SBc d d dθ β β β σ= + + + (49)
We choose ten sets of mβ and ɶ ( )m mθ β from one run as an example The values of
ɶ ( )m mθ β are plotted againstLengthβ SBβ andσ respectively
Figure 23 Plots of theta_length against beta_length beta_sb and sigma respectively
y = 23826x + 14791
Rsup2 = 05326
15
2
25
3
35
04 05 06
the
ta_
len
gth
beta_length
y = -06434x + 30245
Rsup2 = 0048115
2
25
3
35
04 05 06
the
ta_
len
gth
beta_sb
y = 26255x + 14156
Rsup2 = 07607
15
2
25
3
35
04 05 06
the
ta_
len
gth
sigma
y = -02443x + 04708
Rsup2 = 0034
0
01
02
03
04
05
04 05 06
the
ta_
sb
beta_length
y = 11233x - 02096
Rsup2 = 089020
01
02
03
04
05
04 05 06
the
ta_
sb
beta_sb
68
Figure 24 Plots of theta_sb against beta_length beta_sb and sigma respectively
Figure 25 Plots of theta_ln against beta_length beta_sb and sigma respectively
The figures show similar trend to those in the trial model with estimated scale parameters
which is in line with our expectation
The estimates of three binding functions are shown in Table 11 below with each row
representing the estimates for one of the three binding function and each column
y = -04374x + 056
Rsup2 = 01283
0
01
02
03
04
05
04 05 06
the
ta_
sb
sigma
y = -01144x + 07619
Rsup2 = 01114066
067
068
069
07
071
072
073
074
04 05 06
the
ta_
ln
beta_length
y = 0053x + 06768
Rsup2 = 00296066
067
068
069
07
071
072
073
074
04 05 06
the
ta_
ln
beta_sb
y = -03115x + 08561
Rsup2 = 09717
066
067
068
069
07
071
072
073
074
04 05 06
the
ta_
ln
sigma
69
representing certain variable in the binding function In the parenthesis below each
estimate of the coefficients is the t-test value with the null hypothesis of zero We take the
95 confidence interval and estimates with t-test value larger than 196 are supposed to
be significantly different from zero which are marked as bold
Table 11 Estimates of three binding functions in the Monte Carlo experiment
Constant Lengthβ SBβ σ
ɶLengthθ 0853
(3606) 1009
(3724) -0034
(-0125) 2569
(9482)
ɶSBθ -0062
(-0385) -0104
(-0564) 1208
(6591) -0226
(-1227)
ɶLNθ 0854
(46688) 0013
(0624) -0004
(-0185) -0302
(-14428)
The estimates of binding function have similar characteristics as in the trial model with
estimated scale parameters as well They contain almost the same significant coefficients
and those significant estimates have the same signs as in the trial with true observations
Based on the estimated binding function and the simulated observations given true values
of the three parameters to be 05 the final estimates of Lengthβ SBβ andσ are shown in
Table 12 below
Table 12 Statistics of estimation of beta_length beta_sb and sigma in the Monte Carlo experiment
Parameter Lengthβ
SBβ σ
Mean 0404138359 0458624533 0639191487
Standard deviation 1109279424 0242570421 0377069799
As we can see the estimates of Lengthβ SBβ andσ are quite close to their true values What
is not satisfying is that the estimate of σ is a little large and lies outside the input domain
of [04 06] but is still quite near to this interval In addition the estimate of Lengthβ is
within the input domain yet the variation is large This is understandable since we scale
the random term by length together with the scale parameter and thus the parameter for
length could be influenced by the random term and turns out to have large variations In a
word the result of Monte Carlo experiment verifies that we get use the model
70
formulation with unfixed scale parameter for the random term to get the right estimate of
the true values And number of links is strongly related withσ which means that it is
reasonable and efficient to use it as a reference to σ in the cost function
71
7 Conclusions
This thesis aims at implementing the newly proposed route choice model based on
indirect inference in true observations The model assigns links specific errors for a
network which allows natural correlations among paths and is practical in simulating
observations by means of shortest path searching algorithms like the Dijkstrarsquos Algorithm
used in our experiment To get consistent estimation of this kind of model indirect
inference method is used and a simple model like logit model is used as an auxiliary
model The route choice model and indirect inference estimator has been tested on
synthetic data with simulated observations and proved to be capable of consistently
estimated
Compared to the synthetic experiment some extensions are done in this thesis By
replacing the simulated observations with the true observations the method is tested on
the empirical circumstance to prove that it could be used in solving practical problems
The true observations have more noises than the simulated ones thus more difficulty to
capture their features We know neither the right formulations of models based on the
data nor the values of parameters in the route choice model yet as defined the
parameters should have positive signs As it turned out to be in the experiment with only
length in the model we get the estimates of Lengthβ as 1337 while with two attributes in
the model we get the estimates of Lengthβ and SBβ as 0761 and 00799 respectively The
estimates in both experiments seem reasonable with the right sign In addition seen from
the estimation of the binding function the coefficients in the logit model is negatively
affected by the parameters they infer in the basic route choice model in the two attributes
case one parameter in the logit model is more apparently affected by the parameter it
refers than the other parameter in basic model
In the trial where we include a scale parameter to the random term and estimate it along
with the other parameters in the route choice model a Monte Carlo simulation
experiment is carried out using simulated observations The result shows that it is
efficient to use number of links in the auxiliary model to infer the scale parameter in the
basic rout choice model
72
In other trial formulations of the model we got negative estimates which may probably
be due to missing attributes in the cost function Future work should be done to include
more attributes
Another thing to recommend for future is that we generate the pseudo-universal choice
set as part of the auxiliary model Since the pseudo-universal choice set is partially used
for deciding which ODs and observations to be used in the project it is essential and
should be generated beforehand But from the choice set generation point of view we
could generate individual specific choice set directly instead of random drawing paths
from the pseudo-universal choice set This would increase computational efficiency
73
Bibliography
Axhausen K Schoumlnfelder S Wolf J Oliveira M amp Samaga U (2003) 80 Weeks of
GPS Traces Approaches to Enriching the Trip Information Transportation Research
Record 1870 46-54
Azevedo J Costa M Madeira J amp Martins E (1993) An Algorithm for the Ranking
of Shortest Paths European Journal of Operational Research 69 (1) 97-106
Bartels K Boztug Y amp Muumlller M (1999) Testing the Multinomial Logit Model
Working paper University Potsdam Germany
Bekhor S Ben-Akiva M amp Ramming M (2002) Adaptation of Logit Kernel to Route
Choice Situation Transportation Research Board of the National Academics 1805 78-85
Bekhor S Ben-Akiva M amp Ramming M (2006) Evaluation of Choice Set Generation
Algorithms for Route Choice Models Annals of Operations Research 114 (1) 235-247
Ben-Akiva M amp Bierlaire M (1999) Discrete Choice Methods and Their Applications
to Short Term Travel Decisions In Chapter for the Transport Science Handbook
Preliminary Draft
Ben-Akiva M amp Bierlaire M (2003) Discrete Choice Models with Applications to
Departure Time and Route Choice In Handbook of Transportation Science (second ed)
Kluwer
Ben-Akiva M amp Bolduc D (1996) Multinomial Probit with a Logit Kernel and a
General Parametric Specification of the Covariance Structure Working Paper
Ben-Akiva M amp Lerman S (1985) Discrete Choice Analysis Theory and Application
to Travel Demand MIT Press
Ben-Akiva M Bergman M Daly A amp Ramaswamy R (1984) Modeling Inter Urban
Route Choice Behaviour In J Vollmuller amp R Hamerslag (Ed) the 9th International
Symposium on Transportation and Traffic Theory (pp 299-330) Utrecht Netherlands
VNU Science Press
Cascetta E Nuzzolo A Russo F amp Vitetta A (1996) A Modified Logit Route Choice
Model Overcoming Path Overlapping ProblemsSpecification and Some Calibration
Results for Interurban Networks In J Lesort (Ed) the 13th International Symposium on
Transportation and Traffic Theory Lyon France
74
Creel M (2009) A Data Mining Approach to Indirect Inference Universitat Autonoma
de Barcelona Department of Economics and Economic History
De La Barra T Peacuterez B amp Anez J (1993) Multidimensional Path Search and
Assignment 21st PTRC Summer Meeting (pp 307-319)
Dijkstra E (1959) A note on two problems in connexion with graphs Numerische
Mathematik 1 269-271
Frejinger E amp Bierlaire M (2007) Capturing Correlation with Subnetworks in Route
Choice Models Transportation Research Part B 41 363-378
Frejinger E Bierlaire M amp Ben-Akiva M (2009) Sampling of Alternatives for Route
Choice Modeling Transportation Research Part B Methodological 43 (10) 984-994
Gallant A amp McCulloch R (2004) On the Determination of General Scientific Models
Manuscript Duke University
Gourieacuteroux C Monfort A amp Renault E (1993) Indirect Inference Journal of Applied
Econometrics 8 85-118
Karlstroumlm A Sundberg M amp Wang Q (2011) Consistently estimating flexible route
choice models using an MNL lense International Choice Modeling Conference Leeds
Keane M amp Smith A (2003) Generalized Indirect Inference for Discrete Choice
Models Manuscript Yale University
Manski C amp Lerman S (1977) The Estimation of Choice Probabilities from Choice
Based Samples Econometrica 45 (8) 1977-1988
McFadden D (1974) Conditional Logit Analysis of Qualitative Choice Behaviour (P
Zarembka Ed) Frontiers in Econometrics 105-142
McFadden D (1978) Modeling the Choice of Residential Location In A Karlqvist L
Lundqvist F Snickars amp J Weibull (Ed) Spatial Interaction Theory and Residential
Location (pp 75-96) Amsterdam North-Holland
McFadden D amp Train K (2000) Mixed MNL Models for Discrete Response Journal
of Applied Econometrics
Nerella S amp Bhat C (2004) Numerical Analysis of Effect of Sampling of Alternatives
in Discrete Choice Models Transportation Research Record 1894 11-19
Ramming M (2001) Network Knowledge and Route Choice PhD Thesis Massachusetts
Institute of Technology
75
Schoumlnfelder S amp Samaga U (2003) Where Do You Want to Go Today-More
Observations on Daily Mobility Third Swiss Transport Research Conference Ascona
Schoumlnfelder S Axhausen K Antille N amp Bierlaire M (2002) Exploring the
Potentials of Automatically Collected GPS Data for Travel Behaviour Analysis- A
Swedish Data Source i J Moumlltgen amp A Wytzisk (Red) GI-Technologien fuumlr Verkehr
und Logistik number 13 Institut fuumlr Geoinformatik Universitaumlt Muumlnster (ss 155-179)
Munster IfGIprints
Smith A (1993) Estimating Nonlinear Time-series Models Using Simulated Vector
Autoregressions Journal of Applied Econometrics 8 63-84
Smith A (2008) Indirect Inference In S Durlauf amp L Blume (Eds) The New
Palgrave Dictionary of Economics (Second ed) Palgrave Macmillan
Smith A (1990) Three Essays on the Solution and Estimation of Dynamic
Macroeconomic Models PhD Dissertation Duke University
Train K (2003) Discrete Choice Methods with Simulation Cambridge University Press
Vovsha P amp Bekhor S (1998) Link-nested Logit Model of Route Choice-Overcoming
Route Overlapping Problem Transportation Research Record 1645 133-142
Wang H (2011) Logistics Distribution Shortest Path Based on Dijkstra Algorithm
Computer and Digital Engineering 3
Assigned publication number
TSC-MT 11-016
wwwkthse

8
paths It is common practice to generate samples from the universal choice set yet this
may easily introduce biases to the estimation Samples are supposed to be randomly
drawn from the population and good samples can reproduce the features in the population
Since in real-size network it is impossible to know the full-size choice set let alone to
reproduce the features of it We could only draw from certain known paths and this is
more like an importance sampling which gives links different possibilities to the drawn
into paths As a result estimation based on the sampled paths will have biases
The other problem with regard to path-based approaches is the inherent limitation of
multinomial logit model (MNL) which requires no correlation among alternatives This
is practically unrealistic since in the context of route choice modeling paths sharing
certain links are correlated due to unobserved features of the common links Numerous
literatures contribute to improvement in terms of the problem based on logit models
We choose to use an approach with additive link specific errors which belongs to probit-
like models This kind of model is efficient for applications yet it is still not able to be
estimated consistently given a partial choice set So we turn to indirect inference as the
tool to estimate the probit-like model with additive link specific errors All feasible paths
for each individual are technically allowed which means that a universal choice set is
provided for each OD pair to avoid bias caused by sampling from full choice sets The
universal choice set generated here is a so-called pseudo-universal choice set which
contains as many feasible paths as desired to eliminate possible biases but not all paths
since it is practically impossible to get the true universal choice set We choose to use an
MNL model as the auxiliary model which is easy to estimate The estimate of MNL
model is biased based on the choice set we generate as discussed above yet the estimate
of parameters in the basic route choice model will be consistent thanks to the features of
the indirect inference method
13 Objective
A Monte Carlo simulation experiment has been carried out based on synthetic trip data
and real-sized road network to appraise the proposed model (See Karlstroumlm Sundberg amp
9
Wang 2011)1 The basic route choice model includes two attributes namely length and
speed bump dummy while an MNL model is chosen as the auxiliary model with the
same two attributes Simulated trip data given two pseudo-true values for coefficients of
length and speed bump dummy are used as a substitution of the empirical data The
presence of speed bumps is randomly allocated over the network Estimation results and
sensitivity test confirm the efficiency and consistency of the proposed estimator
What needs to be done in the thesis is that true trip data should be implemented as well as
the modification of the network To be specific realistic speed bump distribution is used
to replace the randomly allocated one Without knowing the true values of the
coefficients several iterations need to be carried out to get to know the raw domain of the
values and by shrinking input intervals more accurate estimates will be attained as the
accomplishment of the thesis
14 Scope of the Thesis
Based on the route choice model used in the synthetic experiment extensions are done in
five main aspects First we implement the newly proposed estimator in real world issues
by replacing the simulated observations with the true observations collected in a real
world network Unlike the simulated data which is generated following certain
assumptions the true observations have more noises inside and thus more difficult to
capture their features Second the observations we use contain many OD pairs and not
restricted with one or four of them as in the synthetic experiment this gets rid of the
possibility of bias caused by restricted OD pairs Third since we are implementing the
new method in true observations the formulation of route choice model cost function to
be specific is not known beforehand and correspondingly the formulation of the utility
function in the logit model is not for sure as well We need several trials to get well
defined formulations to capture the features of the data Fourth we have no idea what the
parameters are like based on true observation and thus a raw guess of input domain is
needed at first and centered with shrinkage in later iterations Last but not least in one
trial we included a scale parameter to the random term in the cost function and use
number of links in the auxiliary model to infer it To test the efficiency of this trial a
1 Karlstroumlm A Sundberg M amp Wang Q (2011) Consistently estimating flexible route choice models using an MNL lense International Choice Modeling Conference Leeds
10
Monte Carlo simulation experiment is carried out with some arbitrary pseudo-true values
of the parameters based on which simulated observations are used
On the other hand what is done in the synthetic experiment such as test with simulated
observations for one OD and four ODs sensitivity of estimates with choice set size and
number of observations is not included in this thesis Instead we will identify some
limitations of the model formulation tried in the thesis and make suggestions how the
model can be improved
As follows Section 2 reviews relevant literatures on route choice modeling as well as
indirect inference In Section 3 relevant methods are introduced in detail as backgrounds
afterwards methods and models used in this thesis are illustrated Section 4 gives
description of the empirical data we use for estimating and Section 5 shows the
estimation results of the Monte Carlo simulation-based experiment followed by some
conclusions in Section 6
11
2 Literature Review
Route choice modeling has long been discussed and many efforts have been made to
solve this problem Simple and easy to estimate the multinomial logit model (MNL) is
widely used in choice modeling yet it has certain restrictions to be implemented in route
choice context Due to its inherent property of Independence from Irrelevant Alternatives
(IIA) the multinomial logit model is not easily applicable since routes in the choice set
tend to be correlated with the presence of overlapping paths Cascetta et al (1996)
proposed a correction term called Commonality Factor (CF) in the deterministic part of
the utility function2 And the probability of path i to be chosen from the choice set nC
becomes( )
( )( | )in in
jn jn
n
V CF
n V CF
j C
eP i C
e
micro
micro
minus
minus
isin
=sum
As proposed by Cascetta et al the Commonality
Factor is specified as ln ( )n
ijin CF
j C i j
LCF
L Lγβ
isin
= sum in which ijL is the length of links
common to path i and pathj while iL and jL are the total length of path i and pathj
respectively The parameter γ is left to be estimated or practically constrained to a fixed
value like 1 or 2 The CF term of one path is proportional to the length of overlapping
part with other paths This proposed model is referred to as C-Logit model Bearing some
similarities Ben-Akiva and Bierlaire (1999) proposed the Path Size Logit (PSL) model3
This model is based on a different theoretical basis as the C-Logit The original
formulation of Path Size (PS) comes from the discrete choice theory of aggregate
alternatives Similar to the CF in C-Logit the log of Path Size (PS) is added to the utility
function The probability of path i to be chosen from the choice set nC becomes
( ln )
( ln )( | )in in
jn jn
n
V PS
n V PS
j C
eP i C
e
micro
micro
+
+
isin
=sum
The Path Size is specified as
1
i n
n
ain
a Ciaj
j C j
lPS
LL
LδisinΓ
isin
= sumsum
in
2 Cascetta E Nuzzolo A Russo F amp Vitetta A (1996) A Modified Logit Route Choice Model Overcoming Path Overlapping ProblemsSpecification and Some Calibration Results for Interurban Networks In J Lesort (Ed) the 13th International Symposium on Transportation and Traffic Theory Lyon France 3 Ben-Akiva M amp Bierlaire M (1999) Discrete Choice Methods and Their Applications to Short Term Travel Decisions In Chapter for the Transport Science Handbook Preliminary Draft
12
which iΓ is the set of links in pathi al and iL are the length of link a and pathi
respectively ajδ is the link incidence variable with value of 1 when link abelongs to path
j and zero otherwise And nCL is the shortest path in choice setnC The size of a path has
a maximum value of one when it shares no links with other paths
C-Logit model and PSL model are the most widely used models in practice of route
choice modeling due to their simple forms Since both of them originate from the MNL
model and maintain the basic MNL structure they can be estimated by existing software
designed for logit models Apart from these two types of models there are other recent
efforts in the route choice context
Bekhor Ben-Akiva and Ramming (2002) adapted the Logit Kernel model to apply in a
route choice context4 The Logit Kernel5 model was proposed by combing Gaussian and
Type I Extreme Value error terms by researchers such as Ben-Akiva and Bolduc (1996)
and McFadden and Train (2000) who also referred to it as Mixed Logit6 By making
certain assumptions under route choice context Bekhor Ben-Akiva and Ramming (2002)
proposed a way to apply the model to route choice modeling7 Based on the data from
Boston several kinds of models are estimated including multinomial logit model Path
Size Logit and the newly proposed Logit Kernel model Seen from the estimation results
Logit Kernel has a better overall performance than the other two kinds of models This
result needs to be verified in other data sets since the one used in the paper has a
relatively small size
Frejinger and Bierlaire (2007) proposed an approach to capture correlation among
alternative routes with subnetworks and carried out estimation based on several kinds of
route choice models8 The paper gives an overview of the latest development of route
choice modeling and discusses the Path Size Logit model in detail As part of the
4 Bekhor S Ben-Akiva M amp Ramming M (2002) Adaptation of Logit Kernel to Route Choice Situation Transportation Research Board of the National Academics 1805 78-85 5 Ben-Akiva M amp Bolduc D (1996) Multinomial Probit with a Logit Kernel and a General Parametric Specification of the Covariance Structure Working Paper 6 McFadden D amp Train K (2000) Mixed MNL Models for Discrete Response Journal of Applied Econometrics 7 Bekhor S Ben-Akiva M amp Ramming M (2002) Adaptation of Logit Kernel to Route Choice Situation 8 Frejinger E amp Bierlaire M (2007) Capturing Correlation with Subnetworks in Route Choice Models Transportation Research Part B 41 363-378
13
conclusion a behavioral interpretation of the Path Size in the model is given The
subnetwork is defined so that the alternative routes sharing the same section of it are
seen as correlated This correlation is captured using the Error Component model and
estimation results show that this new approach gives better property than PSL models To
complement the paper uses a real size network and true travel data is collected which is
the same network we are going to use in this thesis project Additionally the paper
displays forecasting results which indicates that models with Path Size component tend
to have bad performance in prediction
Ben-Akiva and Bierlaire (2003) pointed out that under route choice context the
significant correlation among alternatives due to path overlapping and the generation of
choice set are two important issues and main difficulties9
There are some algorithms used in practice for generating choice set for route choice
modeling both deterministic methods and stochastic ones The deterministic methods
tend to give the same set of paths for a given OD pair Some examples are the link
penalty algorithm (De La Barra Peacuterez amp Anez 1993) which increases gradually the
impedance of all the links on the shortest path10 the link elimination algorithm (Azevedo
Costa Madeira amp Martins 1993) which removes links on the shortest path in sequence
to generate new paths11 and the labeled paths (Ben-Akiva Bergman Daly amp
Ramaswamy 1984)12 In terms of the stochastic methods they tend to produce individual
specific choice set One example is the simulation method (Ramming 2001) which
generates alternative paths by drawing link impedances from different distribution
densities13
When it comes to appraisal of the generated choice set some literatures give evaluations
on the efficiency of different sampling algorithms for choice set generation (See Bekhor
9 Ben-Akiva M amp Bierlaire M (2003) Discrete Choice Models with Applications to Departure Time and Route Choice In Handbook of Transportation Science (second ed) Kluwer 10 De La Barra T Peacuterez B amp Anez J (1993) Multidimensional Path Search and Assignment 21st PTRC Summer Meeting (pp 307-319) 11 Azevedo J Costa M Madeira J amp Martins E (1993) An Algorithm for the Ranking of Shortest Paths European Journal of Operational Research 69 (1) 97-106 12 Ben-Akiva M Bergman M Daly A amp Ramaswamy R (1984) Modeling Inter Urban Route Choice Behaviour In J Vollmuller amp R Hamerslag (Ed) the 9th International Symposium on Transportation and Traffic Theory (pp 299-330) Utrecht Netherlands VNU Science Press 13 Ramming M (2001) Network Knowledge and Route Choice PhD Thesis Massachusetts Institute of Technology
14
Ben-Akiva amp Ramming 2006 for example) Apart from this there are some recently
proposed methods for sampling alternatives under route choice context (See Frejinger
Bierlaire amp Ben-Akiva 2009 for example)
Nerella and Bhat (2004) carried out a numerical analysis on the effect of sample size on
the efficiency of the estimation of parameters14 The analysis is done for two kinds of
discrete choice models namely the multinomial logit model for which consistency of
estimation based on subset of alternatives is theoretically proved and non-MNL model
taking mixed multinomial logit model as an example Four evaluation criteria are chosen
namely the ability to recover model parameters ability to estimate overall log-likelihood
function value ability to estimate individual choice probabilities and ability to estimate
aggregate shares of alternatives The results show that the MNL model works well on
small sample size yet certain portion of full choice set need to be kept as a practical
baseline For the non-MNL model small sample size gives poor estimation and increase
of sample size gives obvious increase of estimation quality Certain portion of full choice
set is suggested for practical convenience yet the generalization of sample size portion is
not feasible since difference kinds of models may require different portion to guarantee
accuracy In general for the non-MNL models full choice set is suggested to be used if
feasible and larger sample gives better estimation
Bekhor Ben-Akiva and Ramming (2006) carried out route choice modeling based on a
large-scale urban network including both choice set generation part and route choice
estimation part which compose the process of route choice modeling together15 Given
that previous literatures did not pay too much attention to empirical estimation the paper
used a true observation data set collected in Boston As the first step several choice set
generation algorithms are listed and compared in their efficiency of reproducing the
observed paths on which the evaluation of the algorithms are based The data in Boston
is described in the paper and used in the second step ie model estimation Several route
choice models are presented and estimation results based on different kinds of models are
shown for comparison of the efficiency of the models The Path Size Logit model is
14 Nerella S amp Bhat C (2004) Numerical Analysis of Effect of Sampling of Alternatives in Discrete Choice Models Transportation Research Record 1894 11-19 15 Bekhor S Ben-Akiva M amp Ramming M (2006) Evaluation of Choice Set Generation Algorithms for Route Choice Models Annals of Operations Research 114 (1) 235-247
15
proposed for its property to overcoming the drawbacks of the conventional MNL models
This type of model can be easily estimated using popularized software The main
conclusion is that route choice models could be estimated for large-scale networks based
on the true observation data and prominent computing resources
Frejinger Bierlaire and Ben-Akiva (2009) proposed a paradigm for choice set generation
based on sampling for route choice modeling16 In the context of route choice modeling
the universal choice set which denotes all possible alternatives for a traveler to choose
from is not able to be enumerated So we practically work on a sampled choice set from
the universal one which may easily introduce bias to the final estimate In this paradigm
they focus on unbiased estimation of parameters instead of generating actual choice set
The path generation is seen as an importance sampling approach and a correction of
sampling is added to the path utility Since the following estimation process is based on
the sampled choice set which is treated as the universal one a correction for sampling is
added to the path size attribute in the commonly used path size logit (PSL) model ending
up with the expanded path size Modification in the previous two steps guarantees
unbiased estimation of the parameters Numerical results based on synthetic data are
presented in the paper to reveal that models with a sampling correction in the path utility
are better than those without it The proposed expanded path size logit model provides
unbiased estimation and is better than the original path size models
In this paper we will examine indirect inference Indirect inference is not a new method
it was first introduced by Smith (1990 1993)17 Then Gourieacuteroux et al (1993) gave
overall introduction to the methods and extended it in important ways18 Gallant and
McCulloch (2004) transferred the idea of indirect inference and used it for Bayesian
inference in models where likelihood function is intractable19
16 Frejinger E Bierlaire M amp Ben-Akiva M (2009) Sampling of Alternatives for Route Choice Modeling Transportation Research Part B Methodological 43 (10) 984-994 17 Smith A (1990) Three Essays on the Solution and Estimation of Dynamic Macroeconomic Models PhD Dissertation Duke University Smith A (1993) Estimating Nonlinear Time-series Models Using Simulated Vector Autoregressions Journal of Applied Econometrics 8 63-84 18 Gourieacuteroux C Monfort A amp Renault E (1993) Indirect Inference Journal of Applied Econometrics 8 85-118 19 Gallant A amp McCulloch R (2004) On the Determination of General Scientific Models Manuscript Duke University
16
Gourieacuteroux Monfort and Renault (1993) proposed the inference methods based on an
ldquoincorrectrdquo criterion which does not give consistent estimation to parameters of interest
directly20 The argument of the criterion is called the auxiliary parameter which may
have a larger dimension than the parameters of interest in the basic model After the
auxiliary parameters are selected a simulation-based process is carried out to get a
consistent and asymptotically normal estimator of parameters of interest As a simulation-
based method the only requirement for the basic model is that it could be simulated
regardless of formulations of the model So it could be used for estimating models which
are too complex to carry out direct approaches The paper shows how this kind of method
can be applied in fields such as micro-econometrics macro-econometrics and
econometrics of finance
Keane and Smith (2003) proposed a generalized form of the indirect inference method to
be implemented in the discrete choice model context21 Theoretically indirect inference
could deal with estimation of any economic models yet it has some limitations per se that
decrease the estimation efficiency or even make it difficult to implement Problems arise
when we use indirect inference in estimating discrete choice models since the objective
function the metric of distance between the auxiliary models estimated on observed data
and simulated data to be specific is inherently discrete which leaves the gradient-based
optimization methods infeasible Keane and Smith (2003) proposed that the estimation
procedures used for observed data and simulated data can be different22 Instead of the
discrete choice a continuous function of latent utilities including a smoothing parameter
is used as the dependent variable in the auxiliary model When the smoothing parameter
goes to zero the function of latent utilities converges to the discrete choices this way to
guarantee consistency According to the Monte Carlo results the generalized indirect
inference method proposed in this paper yields good estimates in small samples being as
efficient as maximum likelihood estimates in comparison
20 Gourieacuteroux C Monfort A amp Renault E (1993) Indirect Inference 21 Keane M amp Smith A (2003) Generalized Indirect Inference for Discrete Choice Models Manuscript Yale University 22 Keane M amp Smith A (2003) Generalized Indirect Inference for Discrete Choice Models
17
Creel (2009) presented a data mining approach to indirect inference23 which is similar to
the regular indirect inference method yet with certain advantages over it The method is a
simulation-based estimator relying also on an auxiliary model In line with the indirect
inference method an underlying economic model with parameterβ is referenced by an
auxiliary model with parameterθ Certain values of the parameter hβ in underlying
economic model are drawn randomly from a known density simulated data is generated
using Monte Carlo methods to estimate ɶh
θ of auxiliary model which ends up with a set
of tuples ɶ( )hhβ θ Nonparametric methods are used to get the function ɶ( | )E aβ θ = and
the final estimate of β is supposed to be the result of regression function evaluated at the
estimate of θ based on true observations ɶ ɵ( | )Eβ β θ θ= = Creel (2009) also presented a
way of calculating confidence intervals24 Monte Carlo results in dynamic and nonlinear
panel models and vector autoregressions show good performance of the new estimator
23 Creel M (2009) A Data Mining Approach to Indirect Inference Universitat Autonoma de Barcelona Department of Economics and Economic History 24 Creel M (2009) A Data Mining Approach to Indirect Inference
18
3 Methodology
31 Multinomial Logit Model (MNL)
311 Model Description
Route choice modeling is somewhat complicated when we want to capture the attributes
of both the alternative routes and choice maker accurately and reflect the choice making
process in the model Intuitively route choice can be regarded as choosing one specific
route from several alternative routes which coincides with the prerequisites of discrete
choice models Actually a lot of literatures have explored the route choice modeling and
possible improvements based on discrete choice models (see Cascetta et al 1996 Vovsha
and Bekhor 1998 Ben-Akiva and Bierlaire 1999 for more information on development
in route choice models with regard to discrete choice models)25
To understand the frontier development of route choice model we have got to know the
discrete choice models among which multinomial logit model (MNL) is the most widely
used In addition we choose to implement a new method ndash indirect inference in which
MNL is used as it is
Logit model is the most widely used discrete choice model till now due to its excellent
qualities in model specification To be specific the choice probability takes a closed form
which is easy to estimate and interpret (Train 2003)26
The multinomial logit model is a kind of choice model with more than two alternatives in
the choice set We assume that the choice maker makes his or her decision based on the
utility maximization rule (Ben-Akiva amp Lerman 1985)27 With regard to the utility njU
the decision maker n obtains from the thj alternative in the choice set it is made up of
two parts the deterministic part and the stochastic part The deterministic part denoted
25 Cascetta E Nuzzolo A Russo F amp Vitetta A (1996) A Modified Logit Route Choice Model Overcoming Path Overlapping ProblemsSpecification and Some Calibration Results for Interurban Networks Vovsha P amp Bekhor S (1998) Link-nested Logit Model of Route Choice-Overcoming Route Overlapping Problem Transportation Research Record 1645 133-142 Ben-Akiva M amp Bierlaire M (1999) Discrete Choice Methods and Their Applications to Short Term Travel Decisions 26 Train K (2003) Discrete Choice Methods with Simulation Cambridge University Press 27 Ben-Akiva M amp Lerman S (1985) Discrete Choice Analysis Theory and Application to Travel Demand MIT Press
19
by njV contains attributes known by the modelers while the stochastic part denoted by
njε is the attributes affecting peoplersquos the decision which cannot be observed by the
modelers yet are known by the decision makers themselves So the utility function turns
out to be
nj nj njU V jε= + forall (1)
The type of choice model is basically decided by the distribution of the stochastic part
When we assume that njε is independently identically Gumbel distributed the model
becomes a logit model
As stated above the decision follows utility maximization rule which means that the
decision maker n chooses the alternative with the highest utility say the thi alternative
Use as the probability the thi alternative is chosen over the others we have
( max ) ( )
( )
( )
ni ni nj ni njj C
ni ni nj nj
nj ni ni nj
P P U U P U U j i
P V V j i
P V V j i
ε εε ε
isin= = = ge forall ne
= + gt + forall ne
= minus lt minus forall ne (2)
With Equation (2) above and the assumption that njε follows iid Gumbel distribution we
could derive the probability of decision maker n chooses alternativei which is
ni
nj
V
ni V
j
eP
e=sum
(3)
Typically we specify the deterministic part of the utility function in a linear form which
is nj njV xβ= Then the probability becomes
ni
nj
x
ni x
j
eP
e
β
β=sum
(4)
This is the most common form of probability function for multinomial logit models
There are some good properties for this kind of logit probability as discussed by Train
(2009)28 With this form the probability of choosing certain alternative will be between
zero and one inherently which is basically required for probability definition Yet the
28 Train K (2003) Discrete Choice Methods with Simulation
20
value of niP will never drop to zero mathematically which means that all the alternatives
in the choice set are perceived to have chance to be chosen On the other hand if an
alternative is perceived never to be chosen it should not be included in the choice set at
all
The probabilities for all the alternatives in the choice set sums to be one which is easily
illustrated from the analytical properties 1 1 1
( ) 1njni
J J JVV
nii i j
P e e= = =
= =sum sum sum in which J denotes
the number of alternatives in the choice set
The logit probability and the deterministic part of the utility function follow an S-shaped
curve line shown in Figure 1 below
Figure 1 S-shaped relationship between probability and deterministic part of utility
This property gives implications for possible impacts of the deterministic utility of certain
alternative on its chances to be chosen We could see that when an alternative has about
50 probability to be chosen which infers to the steepest part on the curve a small
change in the deterministic part of the utility function could lead to a large change in the
probability the alternative has to be chosen
Apart from the nice properties of logit probability logit models have some disadvantages
as well (Bartels Boztug amp Muumlller 1999)29 One shortcoming is the assumption of
29 Bartels K Boztug Y amp Muumlller M (1999) Testing the Multinomial Logit Model Working paper University Potsdam Germany
21
Gumbel distribution of error terms in the utility function The inherent requirement for
iid property sets restrictions for logit model to be widely used especially in route choice
modeling context Several models have been proposed to overcome this shortcoming in
particular modifications based on MNL to adjust it to route choice practices have been
proposed Another drawback is the assumption of the linear composition for the
deterministic part of utility function Actually this assumption is for ease of following
estimation process since McFadden (1974) demonstrated that under this condition the
probabilities will be universally concave with regard to the coefficientsβ 30 which
improves the performance of numerical estimation Yet there could be nonlinear
compositions in the deterministic part to relax the restriction Under this condition the
universal concavity cannot be guaranteed which may lead to local convergence in the
estimation process
312 Model Estimation
The most commonly used numerical estimation method for multinomial logit models is
the Maximum Likelihood Estimation (MLE) In principle given a set of data and the
underlying probability model the method tries to find coefficients of the probability
model with which produced data has a distribution most likely resembles the distribution
of the observed data
Consider the case that N decision makers with their choice data are obtained Parameters
to be estimated are the coefficients in the utility function denoted byβ We could then
use the MLE to try to get the values of β vector with which the probability that choice
maker choose their observed alternatives is maximized
The probability of choice maker n to choose his or her observed alternative can be
written as
( ) niyni
i
Pprod (5)
in which niy is a dummy with value 1 if choice maker choose alternative i and value 0
otherwise
30 McFadden D (1974) Conditional Logit Analysis of Qualitative Choice Behaviour (P Zarembka Ed) Frontiers in Econometrics 105-142
22
Choice makers choose their alternative independently from each other so the probability
of all sampled choice makers choose their observed alternative is
1
( ) ( ) ni
Ny
nin i
L Pβ=
= prodprod (6)
This is the likelihood function with regard to the parameters to be estimated β in this
case We can take the logarithm of it to get the log-likelihood function
1
( ) lnN
ni nin i
LL y Pβ=
=sumsum (7)
Since we aim at getting the value of β to make the log-likelihood function maximized
we can take the derivative of it with respect to β and set it to zero
( )
0dLL
d
ββ
= (8)
By solving this equation we could get the estimate of β
32 Dijkstrarsquos Algorithm
321 Introduction
A method is needed for generating feasible alternatives and compose the choice set as
well as for deriving simulated observations for each OD pair in the process of indirect
inference As for choice set generation we would like to include certain number of high
ranking shortest paths in the choice set since these paths tend to have more possibility to
be chosen Similar to this the simulated observation is generated as the shortest path
between each OD pair We implement a method for shortest path finding which is the
Dijkstrarsquos Algorithm
Dijkstrarsquos Algorithm is named after the Dutch computer scientist Edsger Dijkstra who
conceived this method in 1956 and got it published in 195931 This is a graph search
algorithm aiming at solving shortest path problem for a graph the edge cost of which is
defined nonnegative The outcome of it is a shortest path tree demonstrating the path with
lowest value with respect to the defined cost
31 Dijkstra E (1959) A note on two problems in connexion with graphs Numerische Mathematik 1 269-271
23
This algorithm deals with single-source problem To be specific given one source node in
the graph the algorithm will give paths with the lowest value with regard to cost from
this source node to every other node in the network Given certain criterion we could use
the algorithm to find shortest path between two specific nodes by setting one node as the
source and the other as the target
After released it is widely used in path searching problems especially in transportation
related practices Routing problem is considered in investigation on traffic assignment
and optimization in logistics Real sized road network could be perceived as a graph with
vertices and edges in which cities can be abstracted as the vertices in the graph and the
roads connecting cities can then be regarded as the edges With the aid of Dijkstrarsquos
Algorithm the shortest path with respect to cost could be found from certain city to the
other cities The outcome is valuable for logistics corporations to work out their region-
wide distribution plans32
322 Algorithm
We connect a ldquodistancerdquo value with all the vertices in the graph indicating its distance
from the source vertex To be accurate the ldquodistancerdquo could be actual length of edges or
the generalized cost on the edges or anything desired The source vertex is defined as the
initial node with a value of zero In the process Dijkstrarsquos Algorithm will assign values
to vertices detected in one loop and update the values in the following loops till a
minimum value is found for each vertex The steps for searching and updating are
presented below
1 Initialize the network and assign the distance values of vertices other than the initial
node as infinity
2 When one vertex is to be detected it is denoted as current node All the vertices that
have been detected and attained the minimum distance values will be marked as detected
and will not be detected in the following loops while the vertices remaining unvisited
will be marked undetected To initialize all the vertices are marked undetected and the
initial node is set as current node
32 Wang H (2011) Logistics Distribution Shortest Path Based on Dijkstra Algorithm Computer and Digital Engineering 3
24
3 For current node all its directly connected adjacent nodes are considered except for
the newly detected vertex Labeled distance values of the neighbor vertices will be
updated if the calculated values from current node are smaller than their current values
For example current node A has a distance value of 4 and one of its neighbors B has a
value of 8 The edge linking A and B has a distance of 2 The newly calculated distance
value for B will be 4+2=6 which is smaller than 8 So the labeled distance value for B
will be updated to 6 indicating that the minimum distance from the source vertex to B till
now is 6 and the path should pass A
4 When all the neighbors of the current node are considered and updated mark the
current node as detected And mark the undetected node with the lowest distance value as
the current node and do the detection in step 3 again
5 When all the vertices in the network are marked detected the algorithm is finished and
we get the minimum distance from the source to all the other vertices The shortest path
from the source to a specific vertex could be found out following the detecting process
As mentioned above the stop criterion could also be modified as we desired If we aim at
finding the shortest path between two vertices at the beginning one vertex should be set
as the initial node and the algorithm could be stopped once the other vertex is marked as
detected
323 Explanatory Example
Here is a simple network to illustrate the mechanism of Dijstrarsquos Algorithm There are
five vertices and six edges with distance values labeled beside We define A as the source
and set it the initial node
Figure 2 A simple network for Dijstrrarsquoa Algorithm explanation
25
Initialization
Initial node A
Detected null
Distance value A=0 B=C=D=E=+infin
Loop 1
Current node A
Adjacent vertices B C
Detected null
Distance value A=0 B=4 C=1 D=E=+infin
Loop 2
Current node C
Adjacent vertices B D
Detected A
Distance value A=0 C=1 B=min 4 C+2 =3 D=C+3=4 E=+infin
Loop 3
Current node B
Adjacent vertices E
Detected A C
Distance value A=0 C=1 B=3 D=4 E=B+3=6
Loop 4
Current node E
Adjacent vertices null
Detected A B C D
Distance value A=0 C=1 B=3 D=4 E=6
If we want to get the shortest path from A to E following the detecting process we could
know that it should be A-C-B-E
26
324 Discussion
Dijkstrarsquos Algorithm has a clear logical structure which makes it easy to understand as
well as to implement in programming Nonetheless this method cannot search directly
from one node towards the other to find the shortest path between the two It works more
like detecting all the adjacent nodes in terms of shortest paths and expands from the
source iteratively until the target node is included and that is when we could figure out
the shortest path between the two specific vertices This reveals the fact that the method
wastes a lot of time in the blind search leaving it inefficient In addition this method is
not able to deal with networks with negative edge values yet this is not a problem in our
research since link cost on our network is defined nonnegative
33 Indirect Inference
331 Introduction
For problems in route choice context choice set size may be way too large to enumerate
all the alternatives Yet estimation based on sampled choice set may introduce biases
which can be corrected in some special cases (see Frejinger Bierlaire amp Ben-Akiva
2009)33 While in cases where estimation models are not based on MNL say multinomial
probit model we could not find corrections for biases caused by sampled choice set
Estimator based on the principle of indirect inference is then introduced to overcome
inconsistency problem34
Indirect inference35 is a simulation-based method for estimating parameters in economic
models by making references to the parameters of interest (Smith 2008) It is motivated
when general statistical estimation method such as Maximum Likelihood is intractable or
as discussed above consistent estimation is required given that only sampled choice set is
available Since in economic analysis we tend to build models which guarantee scientific
logic and inclusion of necessary attributes quite often the models will end up
33 Frejinger E Bierlaire M amp Ben-Akiva M (2009) Sampling of Alternatives for Route Choice Modeling 34 Karlstroumlm A Sundberg M amp Wang Q (2011) Consistently estimating flexible route choice models using an MNL lense 35 Smith A (2008) Indirect Inference In S Durlauf amp L Blume (Eds) The New Palgrave Dictionary of Economics (Second ed) Palgrave Macmillan
27
complicated from statistical estimation point of view This in sequence spurs the wide use
of indirect inference in economic analysis
It is common character that simulation-based methods allows modelers to simulate data
from the economic model of interest given certain perceived values of the parameters to
be estimated Since to generate data is essential and simple the true challenge is how to
estimate coefficients Indirect inference uses an auxiliary model which gives a rich
description of the covariance patterns in the data by including certain variables from the
basic economic model On the other hand the auxiliary model does not need to reflect
accurately the data generating process since it is supposed to be estimated based on the
data derived not to generate data itself The basic function of the auxiliary model is that
it provides a criterion to compare observed data and simulated data from the basic
economics model
We do iterations with the aim of finding the parameters of the basic economic model so
the observed data and the simulated data from the basic model looks almost the same by
the criterion of auxiliary model To be specific the auxiliary model is estimated based on
both observed data and simulated data we choose parameters for the basic model to
make sure that the two estimator of auxiliary model are as close as possible Based on
this idea the auxiliary model should be easy to estimate
332 Definition of the method
We define an economic model with the form of
( ) 12t t ty G x t Tε β= = (9)
in which 1 Tt tx = is a sequence of observed exogenous variables 1 T
t ty = is a sequence of
observed endogenous variables and 1 Tt tε = is a sequence of unobserved random error
terms β is a k -dimensional coefficient vector of the exogenous variables (Smith
2008)36
This model generally describes a relation that ty is dependent ontx with some random
errors Given the distribution of the random errors we could get the probability density
36 Smith A (2008) Indirect Inference
28
function of ty conditional on tx We will not focus on this density and instead this model
is only used for simulating data in indirect inference
In terms of the auxiliary model it could be defined by a probability density function with
the form of
( | )t tf y x θ (10)
in which θ is a p -dimensional coefficient vector and p is supposed to be not smaller
than k since we should capture characteristics of all the parameters in the underlying
economic model In addition the auxiliary model needs not be defined to reproduce the
distribution of ty in the basic model yet it needs to have a convenient analytical format
Based on the observed data we could estimate the parameters in the auxiliary model
using Maximum Likelihood Method
ɵ
1
arg max log ( | )T
t tt
f y xθ
θ θ=
= sum (11)
The estimated coefficient vectorɵθ could be used as an indicator of certain features of the
observed data
On the other hand the auxiliary model can be estimated based on simulated data from the
basic model as well We need to draw a sequence of random error terms 1 m Tt tε = from the
defined distribution in which m denotes the number of simulation with an interval of [1
M ] generally Given a coefficient vectorβ we could generate the values of endogenous
variables ɶ 1 ( )m T
tty β = which are explicitly dependent onβ With the help of Maximum
Likelihood Method we could get
ɶ ɶ
1 1
( ) arg max log ( ( ) | )M T m
ttm t
f y xθ
θ β β θ= =
= sumsum (12)
According to the principle of indirect inference we try to find the values of β to make
ɶ( )θ β as close toɵθ as possible Practically we need a metric to measure the distance
between ɵθ andɶ( )θ β and by minimizing the distance we could find out the estimates of
β in the basic economic model
29
333 Choices of the metrics
As mentioned above we need a metric to measure the distance betweenɵθ andɶ( )θ β
There are three approaches corresponding to the three classical hypothesis tests namely
Wald likelihood ratio (LR) and Lagrange multiplier (LM)37
In the Wald approach we try to minimize a quadratic form in the difference between the
two estimators ofɵθ andɶ( )θ β which is
ɵ ɶ ɵ ɶarg min( ( )) ( ( ))Wald
Wβ
β θ θ β θ θ β= minus minus (13)
in which W is a positive definite ldquoweightingrdquo matrix
In the LR approach a metric is formed based on the likelihood function related to the
auxiliary model which is
ɵ ɶ
1 1
arg min( log ( | ) log ( | ( )))T TLR
t t t tt t
f y x f y xβ
β θ θ β= =
= minussum sum (14)
According to the definition ofɵθ the first part of the objective function before the minus
sign on the right-hand side is always larger than the second part after the minus sign And
the first part is not dependent onβ
To minimize the objective function is equivalent to maximizing the log-likelihood
function withɶ( )θ β that is
ɶ
1
arg max( log ( | ( )))TLR
t tt
f y xβ
β θ β=
= sum (15)
In the LM approach the metric is formed using the derivative of the log-likelihood
function related to the auxiliary model which is
arg min ( ) ( )LM
S VSβ
β β β= (16)
in which
ɶ ɵ
1 1
( ) log ( ( ) | )M T m
ttm t
S f y xβ β θθ= =
part=partsumsum
(17)
and V is a positive definite matrix
37 Smith A (2008) Indirect Inference
30
By using any of the approaches we aim at getting the minimized distance betweenɵθ and
ɶ( )θ β so the value will approach to zero as expected So the hypothesis test of the
minimized value could be used as an indicator of whether the auxiliary model is suitably
specified In other words the minimized value being significantly different from zero
indicates a bad specification of the auxiliary model
In comparison the LM approach has an advantage over the others in computation when
it is relatively time-consuming to estimate the auxiliary model
334 Consistency Interpretation
Suppose the observed sample size T grows large while total number of simulations stays
fixed as M the estimator based on simulated data ɶ( )θ β will converge to a pseudo-true
value denoted as( )h β which is also dependent onβ This is called binding function
which characterized the relationship between the coefficients in the basic model and the
auxiliary model At the same time the estimator based on observed data ɵθ will converge
to a pseudo-true value0θ In case that T grows to a large number the aim of indirect
inference changes to finding β that guarantees0 ( )hθ β= This could explain that indirect
inference gives consistent estimate of the parameters in the basic economic model
In this project the binding function is what we focus on to get the correct estimates
instead of finding certain metrics Detailed methods will be discussed in the following
part
34 Model Specification in the Thesis
341 Basic Route Choice Model
Based on all the methods mentioned in previous sections the specification of models and
methods we use in the thesis will be explained in this section Since we are to estimate
the model based on true observations no model is known beforehand to adjust to the data
we use Several formulations of the model have been tested in the thesis The one
explained here could be seen as an example and all the other trials contain modifications
based on this model The other specifications of model will be explained along with the
results in the result section
31
We start by describing the underlying route choice model of interest38 We need to define
a road network as a representation of a real-size one from which we collected the trip
data The network denoted asN consists of a set of nodes (vertices) v and links (edges)
l Each link has a source node ( )s l and a target node or a destination node( )d l which
together indicate the direction of the link A path from an origin node ov to a destination
node dv could be seen as a sequence of links1 nl lhellip of which 1( ) os l v= 1( ) ( )i id l s l +=
and ( ) dnd l v= So a path can be defined by the index of links which is 1 nl lπ = hellip
A vector of characteristics denoted aslx is associated to each link as well as a strictly
positive cost function( )l lic x ε β in which liε is an individual specific random link cost
with i denoting the individual and β is a vector of coefficients of the link characteristics
left to be estimated In the Indirect Inference context we need an auxiliary model with
easily-estimated analytical form yet there is no such requirement for the basic model
Although not necessary we assume that the cost function has a linear deterministic form
the deterministic part and the random part are additively separable So we have the cost
function as
( ) Tl li l lic x xε β β ε= + (18)
In addition one important assumption is that the link cost is additive which means that
the cost of a path can be attained by the sum of all the link costs along the path This way
we have the cost of a path π as
( ) ( )l lil
C c xπ
π ε βisin
=sum (19)
We focus on the path-based model which means that the individuals choose among all
possible paths As defined above this turns out to be a random utility choice model As
indicated by the standard assumptions of this kind of models choice makers are assumed
to know both the link characteristics and their idiosyncratic random utility liε associated
to each link Since the choice makers maximize their utility this means that they will
choose the path with the lowest generalized cost in this model This way we have the
choice of individual i as
38 Karlstroumlm A Sundberg M amp Wang Q (2011) Consistently estimating flexible route choice models using an MNL lense
32
( )
arg min ( )o di i
iv v
Cπ
π πisinΩ
= (20)
in which oiv denotes the origin point of the trip for individual i and d
iv denotes the
destination ( )o di iv vΩ denotes all possible paths connecting the origin and destination in
the network for individual i which forms the choice set for the individual
When implementing the model we assume that the random utility component liε follows
a truncated normal distribution To be specific liε follows a standard normal distribution
yet with only the positive values retrieved This way we could guarantee that the link
costs are always positive so that additively the path would not have infinite loops With
this feature of the random component we could say that our model is probit-like Based
on this assumption the prerequisite of Dijkstrarsquos Algorithm is satisfied which always
needs positive edge values on the network We can use the Dijkstrarsquos Algorithm to find
the shortest paths iπ as an intermediate step in the implementation Apart from this we
assume that the unobserved cost captured by the random term is proportional to the
length of link To embody this in the cost function we add a fixed scale parameter to the
random term with a form of ( )Length l Lengthx Mean x in which ( )LengthMean x is the average
length of links in the network
We will assume that the data consists of J paths as dependent variables which means
that the dependent variables for the choice model are 1 Ji iy π == In addition the observed
characteristics of links in the network are provided 1 Ll lx x == To be specific we choose
to use two attributes of the links namely the length of the links Lengthx and the dummy
variable indicating the presence of speed bumps on the links SBx The cost function then
is specified as
( ) ( )l li Length Length l SB SB l li Length l Lengthc x x x x Mean xε β β ε= + + sdot (21)
Now the objective is to estimate the parametersβ in the model for which we will make
use of an auxiliary model
33
342 Auxiliary Model
Based on the idea of Indirect Inference we treat the route choice model defined above as
the basic model of interest which might have complex formation and be difficult to
estimate directly Then we need an auxiliary model to form a criterion which takes into
certain aspects of data to focus the analysis The auxiliary model needs not to reflect the
data generating process exactly as in the basic model yet it needs to include attributes of
interest in order for reference and to be easy to estimate We choose to use a logit model
for route choice as the auxiliary model since the logit model has always been a useful
tool for discrete choice analysis thanks to its analytical form and there is software for
estimating logit models which ensures that we can estimate very efficiently
As to the auxiliary model it is chosen to be a logit model for route choice We consider
that each individual i is choosing from a set of alternative routesr Each route r is given
a utility of riU
- Tri r ri r riU V Xε θ ε= + = + (22)
in which θ is the vector of auxiliary parameters which gives inference to the parameters
in the basic model One thing to be mentioned is that as expected the coefficients in the
utility function should have negative signs To make it easier for comparison with the
coefficients in the basic route choice model we assume the sign of θ to be positive per
se and add a negative sign ahead of it to guarantee that the coefficient part is negative as a
whole rX denotes route characteristics and riε is the random utility for each individual
which is assumed to follow an iid (independently identically distributed) Gumbel
distribution following the standard assumption of logit models
Note that as required for the auxiliary model it should be flexible enough to capture the
variability in the data and thus contains no fewer attributes than the basic model39 In
order to infer the parameters in the basic model and in consideration of efficiency we
pick the same attributes of interest in the basic models which are the link length Lengthx
and the speed bump dummy variableSBx So the utility function turns out to be
- -ri Length Length r SB SB r riU x xθ θ ε= + (23)
39 Karlstroumlm A Sundberg M amp Wang Q (2011) Consistently estimating flexible route choice models using an MNL lense
34
The probability of individual i choosing path r given an individual specific choice set
( )iI o d is
( )
ri
si
i
V
ri V
s I o d
eP
eisin
=sum
(24)
Theoretically we allow the individuals to choose from all possible paths between the
origin and destination in the network which intuitively could be infinite and impossible
to enumerate When implementing the model we generate the individual choice set based
on the basic route choice model Through simulation of the basic model we generate
infinite unique shortest paths for all the unique OD pairs by redrawing the random link
cost liε Without loss of generality the number of paths generated would be big enough
with fully consideration of efficiency We name the finite choice set composed by the
shortest paths generated as the pseudo-universal choice set ( )I o d which is a sample of
the infinite universal choice set The individual specific choice sets are generated by
randomly drawing certain number of paths out of the pseudo-universal choice set And
the size of individual specific choice set could be equal to or smaller than that of the
pseudo-universal one
The resulting individual specific choice set ( )iI o d describes a finite subset of all possible
paths connecting the origin oand destinationd for individuali When implementing the
methods the way of generating the choice set ( )iI o d for each individual i is viewed as
part of the auxiliary model
After the auxiliary model is built it could be estimated using a Maximum Likelihood
estimator based on the observed data of individual choices y and attributes variablesx
for individual 1 i N= hellip The estimate of parameters in the auxiliary model is
ɵ arg max ( )L y xθ
θ θ= (25)
in which ( )L y x θ is the log-likelihood function for the auxiliary model
Given the data of the link attributes xand some random draws of structural parameters
mβ 1 m M= hellip we can simulate choice data through the basic route choice model With
M draws of β from some given density we could simulate M sets of data resulting in
35
simulated choicesɶ( )my β Same as before parameters θ in the auxiliary model can be
estimated based on the simulated data as
ɶ ɶ( ) arg max ( ( ) )m m mL y xθ
θ β β θ= (26)
As the process indicated the simulated choice data depends on the structural parameterβ
in the basic route choice model and in sequence the estimates of parameters θ in the
auxiliary model depends on β when estimated based on the simulated data Based on
this theoretically we have a relationship of ( )θ β referred to as the binding function in
indirect inference literatures which we will discuss in detail for implementation of model
in this thesis A metric is then chosen to measure the distance between the observed and
simulated data viewed by the auxiliary model as a way to indirectly infer the values of
parameters β in the basic model To be specific for each draw of the structural parameter
mβ we can get the estimates of ɶ ( )m mθ β based on the simulated data and the distance
between ɶ ( )m mθ β and ɵθ measured by the chosen metric By doing more iteration with the
aim of minimizing the distance we will get the value of mβ which spurs the ɶ ( )m mθ β
closest toɵθ and this mβ is the inferred estimates of the parameter in the basic model
343 Consistency Discussion
The process of indirectly estimating parameters in the basic model is described above yet
we need to know whether the method we provide gives consistent estimation Here are
some discussions explaining the consistency in estimating by which consistency of the
estimator we proposed is illustrated
As proved the multinomial logit model (MNL) can be estimated consistently based on a
subset of alternatives (McFadden 1978)40 We may need to use the classical conditional
maximum likelihood estimator to deal with the problem at the same time the probability
that an individual n chooses an alternative i conditional on the subset of alternatives
denoted asnc becomes the conditional probability
40 McFadden D (1978) Modeling the Choice of Residential Location In A Karlqvist L Lundqvist F Snickars amp J Weibull (Ed) Spatial Interaction Theory and Residential Location (pp 75-96) Amsterdam North-Holland
36
ln ( | )
ln ( | )( | )in n
jn n
n
V q c i
n V q c j
j c
eP i c
e
micro
micro
+
+
isin
=sum
(27)
in which micro is a scale parameter and inV is the deterministic part of the utility There is a
term ln ( | )nq c j for correcting the sampling bias in which ( | )nq c j denotes the probability
of sampling nc given that alternative j is chosen
If all the alternatives in the choice set have the same probability to be chosen into the
subset the estimation on the subset of alternatives is equivalent to that on the full choice
set To be specific in this case ( | )nq c i is equal to ( | )n nq c j j cforall isin so by calculation the
term for sampling bias correction will cancel out in the probability function
In route choice context the alternative paths between an origin and a destination may be
in large amount and it is inefficient to give some very long-distance paths the same
probability as those short and attractive ones This means that we may need the
importance sampling method when generating subsets of alternatives which selects
attractive alternatives with higher probability than unattractive ones And the correction
term does not cancel out in this case Note that if alternative specific constants are
estimated we can get unbiased estimates of all the parameters except the constants even
if the correction term is not included in the utility function (Manski amp Lerman 1977)41
Back to the route choice context we tend to use large number of alternatives even with
subset of the full choice set which means that it is generally impossible to estimate the
constants and thus the correction term is essential To solve this problem Frejinger et al
(2009) developed a sampling approach in the context of route choice42
The discussion above focuses on the usage of MNL for route choice modeling When it
comes to our method the individual specific choice set is generated by randomly drawing
alternatives from the pseudo-universal choice set with the same probability yet there is
bias when generating the pseudo-universal ones since the pseudo-universal choice set is
composed of certain number of shortest paths between two nodes and this generating
process gives some paths higher probability to be included into the choice set So we
41 Manski C amp Lerman S (1977) The Estimation of Choice Probabilities from Choice Based Samples Econometrica 45 (8) 1977-1988 42 Frejinger E Bierlaire M amp Ben-Akiva M (2009) Sampling of Alternatives for Route Choice Modeling
37
actually use importance sampling to get the choice set which may consequently
introduce bias in estimating the parameterθ in the auxiliary model as discussed above
With the idea of indirect inference we consider only the relationship between θ andβ
denoted as( )θ β and use this relation to infer the value ofβ From this point of view
whether θ is estimated with bias or not does not matter since the relation between it and
β could always be captured which is the specific thing we focus on using the method of
indirect inference So we can say that even with biased subset of alternatives we could
still get consistent estimation by using indirect inference
344 Binding Function
As discussed in indirect inference method section when the sample size N increases
which means that we have more observations of choice the estimated parameter in the
auxiliary modelɶ ( )m mθ β will converge to a stable value ( )mθ β which is often referred
to as the binding function
Given that route choice model deals with discrete choices and by using indirect inference
we have a discrete choice model as the auxiliary model as well the estimates of binding
function ( )mθ β will inherit the discontinuous feature due to discrete individual choices
ɶ( )my β Keane and Smith (2003) proposed a solution of using logit-smoothing on the
simulated dependent choice data43 Following this idea we assume a continuous binding
functionɶ( )θ β for simplicity which could be approximated by a linear function locally
within small intervals With the M randomly drawn values of mβ and the corresponding
estimated parameters ɶ ( )m mθ β in the auxiliary model we could perform an Ordinary
Least Square (OLS) regression to estimate the local approximation of binding function
ɶ( ) c Dθ β β= + (28)
in which cdenotes the constant vector and D denotes the OLS parameter matrix44 To be
specific in our case each parameter in the auxiliary model will have a restriction
function with regard to both parameters in the basic model which is
43 Keane M amp Smith A (2003) Generalized Indirect Inference for Discrete Choice Models 44 Karlstroumlm A Sundberg M amp Wang Q (2011) Consistently estimating flexible route choice models using an MNL lense
38
ɶ1 11 12( )Length Length SBc d dθ β β β= + +
(29)
ɶ2 21 22( )SB Length SBc d dθ β β β= + +
(30)
Based on the observed data of choices y and explanatory variables xand the estimated
binding function which indicates the restrictions between ɶθ andβ we could use the
maximum likelihood method to give estimation of the parameters of interest The
likelihood ratio approach to indirect inference is following ideas of Smith (1993)45 and
Keane and Smith (2003)46
ɶ=arg max ( ( ))L y xβ
β θ β (31)
in which β is the estimate of the parameter of interest β in the basic economic model
With the restriction of binding function this is actually an indirectly inferred estimate In
line with the estimating process in auxiliary model ( )L sdot is the likelihood function of the
auxiliary model
Note that the form of binding function is based on an assumption in the result part we
will verify that this assumption is realistic
45 Smith A (1993) Estimating Nonlinear Time-series Models Using Simulated Vector Autoregressions 46 Keane M amp Smith A (2003) Generalized Indirect Inference for Discrete Choice Models
39
4 Data
41 Road Network
The data we use for estimation is based on a GPS data set collected in the Swedish city of
Borlaumlnge Borlaumlnge is located in the middle part of Sweden and has a population of about
47 000 inhabitants
The virtual road network contains 3077 nodes and 7459 unidirectional links (Frejinger amp
Bierlaire 2007)47 of which 3061 nodes and 7288 links are included in the network for
estimation Figure 3 gives a visual illustration of the road network in Borlaumlnge
Figure 3 Illustration of the Borlaumlnge road network
With regard to our research two of the link attributes are included namely link length
and speed bump dummy Link length is in the unit of km and speed bump dummy is an
indication of speed bump existence on the links which has the value 1 when there is a
speed bump on the link and 0 otherwise
Link length
47 Frejinger E amp Bierlaire M (2007) Capturing Correlation with Subnetworks in Route Choice Models
40
Some descriptive statistics of the link length data for the whole network is presented in
Table 1 below
Table 1 Descriptive statistics of link length
Number of links 7288
Minimum 0001
Maximum 7599
Mean 0184487
Median 0102
Variance 0103722
Lexis ratio (varmean) 1016884
Skewness 9871144
To describe the overall character of the link length attribute the histogram is shown in
Figure 4 below
Figure 4 Histogram of link length data
We could see that the link length data is quite clustered most of which lies within the
range of 01km and 06km Nonetheless there are some extreme values far away from the
range indicating extremely long links To display the variation in the relatively clustered
area we draw a histogram zoomed in the interval of (0 1km] shown Figure 5 in below
0
01
02
03
04
05
06
Fre
qu
en
cy
Link length (km)
Histogram
41
Figure 5 Histogram of link length data (zoomed within 1km)
Over 80 of all the links have length shorter than 03 km indicating concentration of
link length data
Speed bump dummy
Speed bump dummy is based on true situation in the network Of all the links 82 links
are equipped with speed bumps which account for a percentage of 113 The following
Figure 6 displays the locations of links with speed bumps
Figure 6 Illustration of links with speed bumps
0005
01015
02025
03035
04045
05
Fre
qu
en
cy
Link length (km)
Histogram(zoom in)
42
42 Observation Data
The GPS data set is collected as a part of the Swedish Intelligent Speed Adaptation (ISA)
study which aims at traffic safety effects of in-car information systems In the study 186
vehicles were equipped with GPS devices and traced within a radius of 25 km from the
center of Borlaumlnge The monitoring lasted for 30 days from 22th June 2000 to 4th March
2002 obtaining 49 667 vehicle days of travel and nearly a quarter of a million trips (for
more information on the GPS data set check Axhausen Schoumlnfelder Wolf Oliveira amp
Samaga 2003 Schoumlnfelder amp Samaga 2003 Schoumlnfelder Axhausen Antille amp Bierlaire
2002)48
The data collection is not originally designed for route choice analysis so the raw data
cannot be used in our research directly Extensive data processing is performed by the
company GeoStats in Atlanta to retrieve new data set available for route choice analysis
which contains 24 vehicles and 16 035 observations The final data set we use is provided
by Emma Frejinger which contains in total 1832 observations corresponding to 1458
observed unique routes made by 24 vehicles and 1409 unique origin-destination pairs
Considering that certain route may have been observed more than once we make a
distinction between observations and unique routes and number of unique routes should
be less than that of observations consistently with the numbers listed above
As indicated by data collection in the ISA study only licensed drivers with access to his
or her only car are recruited to minimize sharing or swapping of cars Minimum socio-
economic data of the drivers is included in data collection so we have no way to
understand driver characteristics from the data set Logically we make an assumption
that there is only one individual per vehicle
In the observation data a route is represented by a series of links and also an origin-
destination pair With relatively intensively distributed link length number of links could
48 Axhausen K Schoumlnfelder S Wolf J Oliveira M amp Samaga U (2003) 80 Weeks of GPS Traces Approaches to Enriching the Trip Information Transportation Research Record 1870 46-54 Schoumlnfelder S amp Samaga U (2003) Where Do You Want to Go Today-More Observations on Daily Mobility Third Swiss Transport Research Conference Ascona Schoumlnfelder S Axhausen K Antille N amp Bierlaire M (2002) Exploring the Potentials of Automatically Collected GPS Data for Travel Behaviour Analysis- A Swedish Data Source In J Moumlltgen amp A Wytzisk (Ed) GI-Technologien fuumlr Verkehr und Logistik number 13 Institut fuumlr Geoinformatik Universitaumlt Muumlnster (pp 155-179) Munster IfGIprints
43
be used to indicate total length of routes Some of the descriptive statistics of link number
is shown in Table 2 below
Table 2 Descriptive statistics of link numbers in observation data set
Number of observations 1832
Minimum 5
Maximum 106
Mean 202877
Median 16
Variance 1871968
Lexis ratio (varmean) 9227126
Skewness 1732597
For further overall inspection of link number distribution in the observation data set the
histogram is shown in Figure 7 below
Figure 7 Histogram of link numbers in observations data set
Seen from the histogram distribution of number of links is relatively dispersed with a
large range interval Judging by the statistics in general the routes observed have about
000
200
400
600
800
1000
1200
1400
1600
5 8
11
14
17
20
23
26
29
32
35
38
41
44
47
50
53
56
59
62
65
68
71
74
77
80
83
86
89
92
95
98
10
1
10
4
10
7
Mo
re
Fre
qu
en
cy
Number of links
Histogram
44
20 links in average Yet the data has a big variance which is reasonable As stated above
there are 1409 unique OD pairs for 1832 observations indicating that for most OD pairs
there is only one observation Spread within the detecting area different OD pairs could
have various numbers of links in between
Following our experiment design only a portion of the data could be used To be specific
routes with number of links fewer than ten would be eliminated when used for estimation
43 Further Exploration of data
Apart from the characters discussed above there are some other attributes in the data set
interesting to be explored Both in link attribute data set and observation data set there is
travel time data which to some extent is parallel with length in indicating distance
between two nodes
In the link attribute data set one attribute is denotes the estimated travel time of links in
unit of hour Some of the descriptive statistics is shown in Table 3 below switching unit
to minute
Table 3 Descriptive statistics of estimated travel time on links
Number of links 7288
Minimum 000186
Maximum 578268
Mean 0281696
Median 018744
Variance 0119337
Lexis ratio (varmean) 0423638
Skewness 5785361
Seen from Table 3 estimated travel time seems to have a more clustered distribution than
link length judging by lexis ratio and skewness Yet this time is roughly estimated not so
qualified as link length to use in estimation since the latter is much easier to measure and
guarantee precision
In the observation data set we have the duration time of the observations in the unit of
minute Some of the descriptive statistics is shown in Table 4 below
45
Table 4 Descriptive statistics of duration of trips
Number of observations 1832
Minimum 007
Maximum 316
Mean 4991195
Median 3925
Variance 1775639
Lexis ratio (varmean) 3557542
Skewness 2174728
Duration of trips can be used as an indication of distance between origin and destination
yet it is roughly measured and strongly affected by traffic condition on the road network
With similar reasons as discussed on estimated travel time on link we use number of
links instead of duration of trips to indicate the distance between OD pairs
46
5 Experiment Design
When doing the simulation-based estimation it is physically divided into two parts for
convenience of operation As discussed in the method section we choose to use a pseudo-
universal choice set which is generated and stored in the first part and ready for use in
the following experiment Then in the second part we do the simulation-based
experiment to carry out indirect inference method for estimating the parameters of
interest in the basic model β to be specific The Figure 8 below illustrates an abstracted
flow of how the estimation is carried out given certain origin-destination pair
Figure 8 Illustration of the flow in the experiment
As shown in the flow chart we get all the unique OD pairs in the trip data For each of
the OD pairs the Dijkstrarsquos algorithm is used to find the shortest paths between them
without duplicates We set the intended number of paths to be 400 as well as time
terminator in case not enough paths could be generated within certain bearable time
47
interval The generated paths form the pseudo-universal choice set of each OD pair
which is stored for future use Note that we abandon some OD pairs with too few paths
in the pseudo-universal choice set Observations containing the kept OD pairs are used
for following estimation which turns out to be 940 of them
For the OD pair in a given observation 200 alternatives are randomly drawn from the
pseudo-universal choice set and the sequential links in the observation itself is read as an
alternative path The 201 paths compose the observed choice set On the other hand a
given value of mβ is drawn from a predefined domainD The shortest path is generated
based on the given mβ as the simulated observation Like in the observed choice set part
200 alternatives are randomly drawn from the pseudo-universal choice set to form the
simulated choice set together with the simulated observation The auxiliary model is
estimated based on the simulated choice set and we could get a set of ɶ( ( ))mm mβ θ β pairs
which will be used to estimate the binding function Based on the binding function and
the observed choice set the parameters in the basic model could be indirectly estimated
The process described above is abstracted with no illustration of iterations Since this is
an experiment based on simulations certain loops of iteration should be carried out to get
statistics of the results
Given observed trip data at first we have no idea of the value of β In the process of
retrieving value ofβ the estimation process is repeated for several stages denoted asS
starting from a rough guess of the domainsD while for each following stage the domain
shrinks Since we tend to use a local OLS regression to approximate the smooth binding
function the draws of smβ need to be around the true value to prevent misspecification of
OLS regression due to the possibly inherent nonlinearity of the binding function The
estimated 0
β is not satisfactory in precision in the first stage yet it could give a hint of
where the true value lies The domain1D is centered on 0
β with smaller interval before
the estimation in the second stage This way +1sD is dependent on sD with smaller
interval As it goes on we will get a more accurate domain and as a result a well specified
OLS regression to approximate the binding function
48
The process of experiment with iterations is described below Suppose that we have the
experiment carried out for K times and the number of observations used isN
for run 1 k K= hellip for true observation 1 i N= hellip
Randomly draw alternatives from the pseudo-universal choice set end Form the observed choice sety for stage 1 s S= hellip
for 1 m M= hellip
Draw ksmβ from the domain ksD
Simulate paths for OD pairs in the used observations with mβ
for simulated observation 1 i N= hellip Randomly draw alternatives from the pseudo-universal choice set end
Form a simulated route choice setɶ( )ksmy β
Estimate ɶ ( )ks ksm mθ β in Equation (26)
end
Estimate ɶ ( )ks
θ β in Equation (28)
Estimate ks
β in Equation (31) end
Center the domain 1k sD + on ks
β and shrink the interval end
As a trial we first do the experiment on a route choice model with one parameter link
length to be specific For simplicity the random term is not scaled as described in the
model specification section which means we attach a truncated normally distributed
random term to the cost function without scaling it with link length After getting the
estimation of Lengthβ we move on to estimating the route choice model with both
parameters as described in the model specification Results under these two formulations
of models are presented separately in the result part
49
6 Results
61 Validation of Binding Function
As discussed in the binding function section we assume the binding function to be
continuous and feasible to be approximated by a linear function locally The assumption
of binding function can be verified based on the ɶ( ( ))mm mβ θ β pairs we attained as
intermediate results To explain this more explicitly we carry out a simple example with
only one parameter in the route choice model Lengthβ to be specific
The cost function is specified as
( )l li Length Length l lic x xε β ε= + (32)
corresponding to which the auxiliary model is
-ri Length Length r riU xθ ε= + (33)
For each run 10 values ofLengthβ are evenly drawn from a given domain By simulating
observations and estimating the auxiliary model 10 corresponding Lengthθ are generated to
form ten ɶ( ( ))mm mβ θ β pairs As assumed the binding functionɶ( )θ β is continuous which
could be approximated by a linear function locally To display the trend of binding
function we choose a relatively large domain for Lengthβ in the beginning [010]D = and
carry out 10 runs which generate 100 points in the beta-theta diagram shown in Figure 9
below
Figure 9 Scatter plots of the 90 beta-theta pairs
y = 12804x + 16264
Rsup2 = 09959
0
2
4
6
8
10
12
14
16
0 2 4 6 8 10
the
ta_
len
gth
beta_length
50
We do OLS regression for the dots and estimate the binding function Intuitively the
smaller the domain is the more accurate is the approximation of the binding function We
shrink the input domain based on the final estimate of Lengthβ from last trial
As it turned out to be we choose an input domain of [1214]D = for Lengthβ and the
binding function is assumed to take the form of
ɶ1 11( )Length Lengthc dθ β β= +
(34)
The result for one run is displayed in Figure 10 below
Figure 10 OLS regression based on the 10 beta-theta points from one run
The estimated binding function based on the 10 points is
ɶ ( ) 17371+10838Length Lengthθ β β= (35)
as indicated by 2 09783R = the function describes the trend of points very well Since
the interval is quite small we could use the estimated function to approximate the
binding function
When it comes to more parameters in the route choice model what we do is simply to
add more elements in the binding function After getting a vector of β and the
corresponding vector ofɶ( )θ β binding functions of each element in vector ɶ( )θ β with
y = 17371x + 10838
Rsup2 = 09783
315
32
325
33
335
34
345
35
355
12 125 13 135 14
the
ta_
len
gth
beta_length
51
regard to all the elements in vector β are estimated One example is shown in the
Equation (29) and Equation (30)
62 Estimation of model with one attribute
The route choice model with one attribute we used is the one described in Section 61
above After several trials by shrinking input interval every time we finally affirm that
the true value Lengthβ of lies in a relatively small interval of [12 14] Based on this
domain 50K = runs are carried out to get statistics of the estimate of Lengthβ As
discussed in the experimental design several stages Smean different trials before final
affirmation of input interval yet for the statistics only one stage is carried out for each
run Within each run 10M = values of input Lengthβ are drawn for estimating binding
function
The estimation statistics of Lengthβ is shown in Table 5 below
Table 5 Statistics of estimation of beta_length
Parameter Lengthβ
Mean 1337353
Standard deviation 0107537
RMSE 0013227
In the table RMSE is the root-mean-square error which is used to measure the distances
between the observed values being estimated and the predicted values by the estimator
The individual differences are called residuals and RMSE is an aggregated measure of
the residuals To be specific
ɵ ɵ ɵ 2( ) ( ) (( ) )RMSE MSE Eθ θ θ θ= = minus (36)
in which ɵθ is the estimator and θ is the parameter to be estimated so the RMSE is the
square root of the mean square error As defined the smaller the value of RMSE is the
better the estimator is
52
Here the RMSE is calculated based on the ten points ɶ( ( ))mm mβ θ β for estimating binding
function so basically it describes the goodness of fit of the estimated binding function
with regard to the points we generated The Equation (36) is specified as
ɶ 2( ( )) (( ( ) ( )) )mm m mRMSE Meanθ β θ β θ β= minus (37)
The value of RMSE displayed in the Table 5 is the mean value of all the RMSE values
for 50 runs Seen from this we have well-estimated binding function for all the 50 runs
on average In terms of the estimates of binding function taking the one in Section 61 as
an example the binding function estimated in the interval of [12 14] in Equation (35)
has a positive constant and a positive coefficient for Lengthβ which indicates that with
larger value of Lengthβ we will get larger value ofɶ Lengthθ and as a result a negative
coefficient for length in the utility function of the logit model This is reasonable for
bigger Lengthβ reveals larger incremental effect on the cost of certain path while lower
ɶ- Lengthθ reveals larger disutility effect on certain path these two effects are in fact
equivalent
By the way the high fitness of binding function is probably due to the relatively small
input interval of Lengthβ after certain trials and shrinkage As the final estimate indicates
Lengthβ falls right into the interval of [12 14] with small standard deviation So we can
say that the estimate is quite good
63 Estimation of model with two attributes
We use the model described in the model specification section to carry out the estimation
Two attributes are used namely length and speed bump dummy Similar to the one
attribute case we carried out several trials and shrinkage to finally determine the
relatively small input intervals forLengthβ and SBβ [05 1] and [0 05] respectively
50K = runs are carried out to get statistics of the estimates of the two parameters Within
each run 10M = values are drawn for inputs Lengthβ and SBβ respectively for estimating
binding function
53
One important thing to mention here is that the inputs are drawn evenly from the domain
yet to guarantee that the values of Lengthβ and SBβ are independent from each other or to
get rid of collinearity49 the domains of two parameters are defined in two dimensions To
explain this more explicitly we choose data of one run as an example The input points of
( Lengthβ SBβ ) are shown in Figure 11 below
Figure 11 Scatter plot of the input values for beta_length and beta_sb
We can see from Figure 11 that the points spread evenly in the domain quadrant Based
on these draws we could estimate the binding function and evaluate the relationship
between parameters in the logit model and Lengthβ and SBβ without worrying about
possible correlation between Lengthβ and SBβ
As discussed before in the binding function we are supposed to find the relationship
between each of the parameters in the logit model and both parameters in the route choice
model Mathematically this binding function should be a surface in the 3D coordinate
system We take the results of one run as an example and thus we have ten sets of Lengthβ
and SBβ along with corresponding ɶ Lengthθ andɶ SBθ
49 A set of points is collinear if they lie on a single straight line or a projective line (for example projective line over any field) and this way the two factors represented by the points are correlated
0
005
01
015
02
025
03
035
04
045
05
05 06 07 08 09 1
be
ta_
sb
beta_length
54
For the first binding function ɶ Lengthθ and ( Lengthβ SBβ ) are plotted in Figure 12 below
And the binding function takes a form as described in Equation (29)
Figure 12 Scatter plot of theta_length with regard to beta_length and beta_sb
By multi-linear regression we can get a surface to approximate the binding function
locally The estimated binding function is displayed in Figure 13 below
Figure 13 Display of the estimated binding function for theta_length
And the first binding function has a formula of
55
ɶ 18234+16933 +00633Length Length SBθ β β= (38)
For the second binding function ɶSBθ and ( Lengthβ SBβ ) are plotted in Figure 14 below
And the binding function takes a form as described in Equation (30)
Figure 14 Scatter plot of theta_sb with regard to beta_length and beta_sb
By multi-linear regression we can get a surface to approximate the binding function
locally The estimated binding function is displayed in Figure 15 below
Figure 15 Display of the estimated binding function for theta_sb
56
And the second binding function has a formula of
ɶ -06698+00371 +17619SB Length SBθ β β= (39)
The t-test of estimated parameters in the binding function is carried out with null
hypothesis of zero Estimates that are significantly different from zero with 95
confidence interval are marked as bold
Table 6 Estimated coefficients of binding function for model with two attributes
Constant Lengthβ SBβ
ɶLengthθ 18234
(43632) 16933
(33481) 00633 (1392)
ɶSBθ -06698
(-7991) 00371 (0366)
17619 (19323)
Seen from the magnitude of coefficients in the binding functions both Lengthβ and SBβ
have positive effect on ɶ Lengthθ andɶ SBθ and in sequence negative effect on the coefficients
in the logit model In addition coefficients of SBβ with regard to ɶ Lengthθ and Lengthβ with
regard to ɶ SBθ are not significantly different from zero so we can say Lengthβ has a more
apparent effect on ɶ Lengthθ than SBβ does while SBβ has a more apparent effect on ɶ SBθ
than Lengthβ does
Based on the estimated binding functions and the true observation data we could get the
estimates of Lengthβ and SBβ as shown in Table 7 below
Table 7 Statistics of estimation of beta_length and beta_sb
Parameter Lengthβ
SBβ
Mean 0761383 0079874
Standard deviation 0068493 0034375
RMSE 0022772 0085113
Seen from the RMSE results the relatively small values indicate that we have well-
estimated binding functions for all the 50 runs on average With regard to the estimates of
parameters in the route choice model both of them fall into the input domain we choose
57
and the standard deviation is quite small So we can say that the estimates are actually
very good
One thing to notice here is that the final estimate of Lengthβ falls approximately in the
middle of the input domain [05 1] while the estimate of SBβ falls closer to the left limit
which might need further shrinkage of input domain and more precise estimate of the
binding function To get rid of this we use the binding function estimate from all the 500
points to give a hint on the reasonability of acceptance of the estimate of SBβ The scatter
plots of theta_sb against beta_sb and beta_length are shown in Figure 16 below
Figure 16 Scatter plots of theta_sb against beta_sb and beta_length
The scatter plots in Figure 16 above are the decompositions of the binding function from
three dimensions to two dimensions Seen from the linear regression in the two plots ɶSBθ
is almost strictly positive proportional to SBβ and hardly effected byLengthβ This means
y = 19132x - 06404
Rsup2 = 0936
-1
-08
-06
-04
-02
0
02
04
06
0 01 02 03 04 05
the
ta_
sb
beta_sb
y = 00123x - 01717
Rsup2 = 4E-05
-1
-08
-06
-04
-02
0
02
04
06
05 06 07 08 09 1
the
ta_
sb
beta_length
58
that by shrinking the input domain ofSBβ we would probably get the same estimate of
binding function since it changes little in current domain And this leads to our
acceptance of the final estimate of SBβ
Given that we have a random cost following a truncated standard normal distribution and
the magnitudes of the estimated parameters are relatively small this would mean that the
randomness of the cost function are relatively large which in sequence leads to relatively
large randomness in individualrsquos choice of route
Another thing to be mentioned is that the magnitude of Lengthβ is smaller than that when
estimated singly Though these two values are not logically comparable with different
formation of random term in the cost function we could still get a hint from the
comparison This difference is probably due to the form of random cost we used which is
( )li Length l Lengthx E xε sdot and the effect of length on the cost is partially captured by this
random term
64 Estimations of other trial formulations of the model
641 Model with exponential form of cost function
During the process of estimation we carried out a lot of other trials in the formulations of
the basic route choice model the cost function to be specific and the auxiliary logit model
As it turned out the there are negative estimates of coefficients in the cost function
which conflicts our anticipation To capture this kind of negative estimation we choose to
use the exponential form of the cost function Without loss of generality the random term
is not scaled by the length of links The cost function is specified as
( ) Length Length l SB SB l lix x
i lic x eβ β εε + += (40)
Two attributes are used namely length and speed bump dummy variable Unlike the form
in Section 63 we allow the parameters Lengthβ and SBβ to have negative input and the
random term liε now follow a standard normal distribution without truncation Since we
take the exponential form of the cost function the cost of links could be kept positive
thus allowing the use of Dijkstrarsquos Algorithm to operate
59
In terms of the auxiliary model since we could have more attributes in the auxiliary
model than the underlying model Instead of using the same attributes as in the cost
function we choose to add an attributes which is number of links in the pathLNx So the
utility function of the logit model is specified as
- - -ri Length Length r SB SB r LN LN r riU x x xθ θ θ ε= + (41)
We still expect the value of θ to be positive and the coefficient of variables with the form
of -θ would be negative
Several trials and shrinkage were carried out for this formulation of our model to finally
determine the relatively small input intervals forLengthβ and SBβ [25 27] and [-05 0]
respectively 15K = runs are carried out to get statistics of the estimates of the two
parameters Within each run 10M = values are drawn for inputs Lengthβ and SBβ
respectively for estimating binding function
To visualize the trend of binding function more clearly we make use all the 150 sets of
vector β and vector θ to estimate the binding function Since we have three variables in
the logit model we have to estimate three binding functions
For the first binding function ɶ Lengthθ and ( Lengthβ SBβ ) are plotted in Figure 17 below
shown along with the estimated binding function
Figure 17 Scatter plot of theta_length against beta_length and beta_sb estimated binding function
The first binding function takes the form of
ɶ 41312+09114 +44845 10Length Length SBθ β βminus= sdot (42)
60
For the second binding function ɶSBθ and ( Lengthβ SBβ ) are plotted in Figure 18 below
shown along with the estimated binding function
Figure 18 Scatter plot of theta_sb against beta_length and beta_sb estimated binding function
The second binding function takes the form of
ɶ 01147 01362 +07119SB Length SBθ β β= minus (43)
For the third binding function ɶ LNθ and ( Lengthβ SBβ ) are plotted in Figure 19 below
shown along with the estimated binding function
Figure 19 Scatter plot of theta_ln against beta_length and beta_sb estimated binding function
The third binding function takes the form of
ɶ 10043 03378 +00068LN Length SBθ β β= minus (44)
The t-test of estimated parameters in the binding function is carried out with null
hypothesis of zero Estimates that are significantly different from zero with 95
confidence interval are marked as bold
61
Table 8 Estimated coefficients of binding functions for model with exponential cost function
Constant Lengthβ SBβ
ɶLengthθ 1312
(2411) 09114 (4360)
4484510-4 (0005)
ɶSBθ 01147
(0425) -01362 (-1314)
07119 (17221)
ɶLNθ 10043
(13767) -03378
(-12051) 00068 (0607)
Same as in the model with two attributes ɶ Lengthθ andɶ SBθ are significantly affected by
Lengthβ and SBβ respectively The negative signs for Lengthβ in the second and third binding
functions draw our attention Since in the second binding function it is not significantly
different from zero we can disregard the effect In the third binding function Lengthβ has
significantly negative effect on ɶ LNθ The larger value of Lengthβ we have the more
influential of path length on cost is With negative effect on ɶ LNθ we can say at the same
time number of links become less influential on the utility This is reasonable since
intuitively if we are sensitive to the path length we wouldnrsquot care too much of having to
switch several more or fewer links based on that path length and number of links are
more or less correlated to each other
Based on the estimated binding functions and the true observation data we could get the
estimates of Lengthβ and SBβ as shown in Table 9 below
Table 9 Statistics of estimation of beta_length and beta_sb in exponential-cost-function model
Parameter Lengthβ
SBβ
Mean 2537672 -045601
Standard deviation 0068377 0133036
We have negative estimate of SBβ which conflicts our assumption that length and
presence of speed bump on the path may increase the cost of traveling through certain
path This is probably due to omission of important attributes in the deterministic part of
the cost function Based on the estimate we are led to think that presence of speed bump
decrease the cost and individuals would prefer to drive on paths with speed bumps Yet
62
this is not true based on our estimation since we are only using two attributes And there
are great chance that some important features are not captured which accidentally are
related with speed bump So the estimate of SBβ is misleading per se in the simple model
as we are using To get more accurate estimate of SBβ we may need to include more
variables in the deterministic part of the cost function
642 Model with estimated scale parameter for random term
Considering the trial with two attributes in Section 63 we add a fixed scale parameter to
the random term to make it proportional to the length of links This appeals to our
assumption yet lays restrictions to the model Apart from this we also try to add an
unfixed scale parameter σ and estimate it along with the other two parameters Lengthβ and
SBβ Note that if we add a scale parameter directly to the random term it wonrsquot work out
as we expect since that way the scale parameter will scale the other two parameters
Lengthβ and SBβ as well as shown below
= ( )Length SBLength Length l SB SB l li Length l SB l lix x x x
β ββ β ε σ σ εσ σ
+ + sdot + + (45)
The right side equation is equivalent to Length Length l SB SB l lix xβ β ε+ + thus making no
difference So we choose to add a new random term including the scale parameter In
addition since we can get good estimate by assuming the random term proportional to
length we will keep this in the newly added random term Now the cost function is
specified as
1 ( ) + ( )l li li Length Length l SB SB l li li Length l Lengthc x x x x Mean xε ε β β ε η σ= + + sdot sdot 2
(46)
liε and liη follow the same truncated normal distribution but are drawn separately so that
they are not equal
In terms of the auxiliary model since now we have three parameters to be estimated in
the underlying model we need one more attribute in the logit model and number of links
in the path LNx is chosen The utility function of the logit model is actually the same as in
Section 641 which is
- - -ri Length Length r SB SB r LN LN r riU x x xθ θ θ ε= + (47)
63
With three parameters in the underlying model it is more reasonable to include
interactions of parameters in the binding function The binding functions take the form of
ɶ
1 2 3
4 5 6 7
( )
Length SB
Length SB Length SB Length SB
c d d d
d d d d
θ β β β σβ β β σ β σ β β σ
= + + +
+ + + + (48)
Since the estimates are not good we did not carry out too many trials to center the input
interval As a result the binding function may be of more interest in this case The chosen
interval is a trial one which is identical [0 3] for Lengthβ SBβ andσ We choose ten sets of
mβ and ɶ ( )m mθ β from one run as an example The values of ɶ ( )m mθ β are plotted against
Lengthβ SBβ andσ respectively The interactions are not shown in the figure yet we have
the estimates of binding function which will give a numerical description of how the
interactions impact theɶ ( )m mθ β
Figure 20 Plots of theta_length against beta_length beta_sb and sigma respectively
y = 09114x + 27818
Rsup2 = 07361
0
1
2
3
4
5
6
0 1 2 3 4
the
ta_
len
gth
beta_length
y = 03568x + 36215
Rsup2 = 00897
0
1
2
3
4
5
6
0 1 2 3 4
the
ta_
len
gth
beta_sb
y = 02572x + 38468
Rsup2 = 00516
0
1
2
3
4
5
6
0 1 2 3
the
ta_
len
gth
sigma
64
Figure 21 Plots of theta_sb against beta_length beta_sb and sigma respectively
y = 02363x + 0835
Rsup2 = 0088
0
05
1
15
2
25
3
0 1 2 3 4
the
ta_
sb
beta_length
y = 06351x + 01759
Rsup2 = 05054
0
05
1
15
2
25
3
0 1 2 3 4
the
ta_
sb
beta_sb
y = -03801x + 17212
Rsup2 = 02001
0
05
1
15
2
25
3
0 1 2 3
the
ta_
len
gth
sigma
y = 00477x + 04521
Rsup2 = 005460
02
04
06
08
1
0 1 2 3 4
the
ta_
ln
beta_length
y = -00553x + 06156
Rsup2 = 00582
0
02
04
06
08
1
0 1 2 3 4
the
ta_
ln
beta_sb
65
Figure 22 Plots of theta_ln against beta_length beta_sb and sigma respectively
As we can see from the three figures above ɶ Lengthθ ɶSBθ and ɶ LNθ are more affected by
Lengthβ SBβ andσ respectively Especially we can see a strong relationship between ɶ LNθ
and σ which assures that number of links can be used to infer the scale parameter in the
underlying model
The estimates of three binding functions are shown in Table 10 below with each row
representing the estimates for one of the three binding function and each column
representing certain variable in the binding function In the parenthesis below each
estimate of the coefficients is the t-test value with the null hypothesis of zero We take the
90 confidence interval and estimates with t-test value larger than 164 are supposed to
be significantly different from zero which are marked as bold
Table 10 Estimates of three binding functions
Constant Lengthβ SBβ σ
Length SBβ β
Lengthβ σ
SBβ σ Length SBβ β σ
ɶLengthθ
1814 (3085)
0861 (2417)
-0089 (-0258)
1038 (2913)
0202 (1030)
-0246 (-1240)
-0056 (-0292)
-0045 (-0412)
ɶSBθ 0284
(1482) -0125
(-1081) 0942
(8371) -0247
(-2127) 0118
(1856) 0070
(1086) -0141
(-2275) -0067
(-1883)
ɶLNθ 0819
(18643) 0015
(0577) -0026
(-0997) -0261
(-9794) 0006
(0419) 0007
(0498) 0024
(1663) -0007
(-0803)
As the constants indicate given no other attributes length and number of links have more
negative effects on the utility than the speed bump dummy does Judging from the
significance of coefficients for the three input parametersɶ Lengthθ ɶSBθ and ɶ LNθ are
significantly affected by Lengthβ SBβ andσ respectively As we can see σ has a negative
y = -02164x + 08218
Rsup2 = 09867
0
02
04
06
08
1
0 1 2 3th
eta
_ln
sigma
66
effect on ɶSBθ andɶ LNθ Since to some extent σ measures the scale of randomness we
could say that the more randomness of the costs on the links have the less influential of
presence of speed bump and number of links become ForɶSBθ it is significantly affected
by some of the interaction terms Notice that SBβ has positive effect onɶSBθ while σ has
effect The interaction terms including both σ and SBβ have negative effect onɶSBθ which
indicates that randomness of cost is more influential than presence of speed bump on the
disutility of speed bump
In terms of the final estimate as stated above the estimates of Lengthβ and SBβ have
negative signs whileσ has positive sign This result conflict our expectation that Lengthβ
and SBβ should have positive signs so we did not carry out more trials and shrinkage The
possible reason for negative estimate is similar to that in the model with exponential form
of cost function Given more attributes in the deterministic part of both the cost function
and utility function in the logit model we might be able to capture the features of the data
better and have the right sign in the final estimates
643 Monte Carlo evidence of model with estimated scale parameter for random
term
Based on the model formulation with estimated scale parameter for random term we also
carried out a Monte Carlo simulation experiment to verify the efficiency of using number
of links in the logti model to infer the scale parameter in the cost function and what we
do is to simulated observations instead of the true ones
We take three arbitrary values for the three parameters in the cost functionLengthβ SBβ and
σ to be 05 And simulated observations are generated based on the given values of
parameters in the cost function Since we know the true values for the parameters the
input domain is centered around the true values to be [04 06] for Lengthβ SBβ andσ
10K = runs are carried out to get statistics of the estimates of the three parameters
Within each run 10M = values are drawn for inputsLengthβ SBβ andσ respectively for
estimating binding function
67
In terms of the binding function by doing regression test we can see that the intersection
terms are unnecessary to be included or even hazardous for good estimate of binding
function so we decide to remove them and keep the binding function as
ɶ1 2 3( ) Length SBc d d dθ β β β σ= + + + (49)
We choose ten sets of mβ and ɶ ( )m mθ β from one run as an example The values of
ɶ ( )m mθ β are plotted againstLengthβ SBβ andσ respectively
Figure 23 Plots of theta_length against beta_length beta_sb and sigma respectively
y = 23826x + 14791
Rsup2 = 05326
15
2
25
3
35
04 05 06
the
ta_
len
gth
beta_length
y = -06434x + 30245
Rsup2 = 0048115
2
25
3
35
04 05 06
the
ta_
len
gth
beta_sb
y = 26255x + 14156
Rsup2 = 07607
15
2
25
3
35
04 05 06
the
ta_
len
gth
sigma
y = -02443x + 04708
Rsup2 = 0034
0
01
02
03
04
05
04 05 06
the
ta_
sb
beta_length
y = 11233x - 02096
Rsup2 = 089020
01
02
03
04
05
04 05 06
the
ta_
sb
beta_sb
68
Figure 24 Plots of theta_sb against beta_length beta_sb and sigma respectively
Figure 25 Plots of theta_ln against beta_length beta_sb and sigma respectively
The figures show similar trend to those in the trial model with estimated scale parameters
which is in line with our expectation
The estimates of three binding functions are shown in Table 11 below with each row
representing the estimates for one of the three binding function and each column
y = -04374x + 056
Rsup2 = 01283
0
01
02
03
04
05
04 05 06
the
ta_
sb
sigma
y = -01144x + 07619
Rsup2 = 01114066
067
068
069
07
071
072
073
074
04 05 06
the
ta_
ln
beta_length
y = 0053x + 06768
Rsup2 = 00296066
067
068
069
07
071
072
073
074
04 05 06
the
ta_
ln
beta_sb
y = -03115x + 08561
Rsup2 = 09717
066
067
068
069
07
071
072
073
074
04 05 06
the
ta_
ln
sigma
69
representing certain variable in the binding function In the parenthesis below each
estimate of the coefficients is the t-test value with the null hypothesis of zero We take the
95 confidence interval and estimates with t-test value larger than 196 are supposed to
be significantly different from zero which are marked as bold
Table 11 Estimates of three binding functions in the Monte Carlo experiment
Constant Lengthβ SBβ σ
ɶLengthθ 0853
(3606) 1009
(3724) -0034
(-0125) 2569
(9482)
ɶSBθ -0062
(-0385) -0104
(-0564) 1208
(6591) -0226
(-1227)
ɶLNθ 0854
(46688) 0013
(0624) -0004
(-0185) -0302
(-14428)
The estimates of binding function have similar characteristics as in the trial model with
estimated scale parameters as well They contain almost the same significant coefficients
and those significant estimates have the same signs as in the trial with true observations
Based on the estimated binding function and the simulated observations given true values
of the three parameters to be 05 the final estimates of Lengthβ SBβ andσ are shown in
Table 12 below
Table 12 Statistics of estimation of beta_length beta_sb and sigma in the Monte Carlo experiment
Parameter Lengthβ
SBβ σ
Mean 0404138359 0458624533 0639191487
Standard deviation 1109279424 0242570421 0377069799
As we can see the estimates of Lengthβ SBβ andσ are quite close to their true values What
is not satisfying is that the estimate of σ is a little large and lies outside the input domain
of [04 06] but is still quite near to this interval In addition the estimate of Lengthβ is
within the input domain yet the variation is large This is understandable since we scale
the random term by length together with the scale parameter and thus the parameter for
length could be influenced by the random term and turns out to have large variations In a
word the result of Monte Carlo experiment verifies that we get use the model
70
formulation with unfixed scale parameter for the random term to get the right estimate of
the true values And number of links is strongly related withσ which means that it is
reasonable and efficient to use it as a reference to σ in the cost function
71
7 Conclusions
This thesis aims at implementing the newly proposed route choice model based on
indirect inference in true observations The model assigns links specific errors for a
network which allows natural correlations among paths and is practical in simulating
observations by means of shortest path searching algorithms like the Dijkstrarsquos Algorithm
used in our experiment To get consistent estimation of this kind of model indirect
inference method is used and a simple model like logit model is used as an auxiliary
model The route choice model and indirect inference estimator has been tested on
synthetic data with simulated observations and proved to be capable of consistently
estimated
Compared to the synthetic experiment some extensions are done in this thesis By
replacing the simulated observations with the true observations the method is tested on
the empirical circumstance to prove that it could be used in solving practical problems
The true observations have more noises than the simulated ones thus more difficulty to
capture their features We know neither the right formulations of models based on the
data nor the values of parameters in the route choice model yet as defined the
parameters should have positive signs As it turned out to be in the experiment with only
length in the model we get the estimates of Lengthβ as 1337 while with two attributes in
the model we get the estimates of Lengthβ and SBβ as 0761 and 00799 respectively The
estimates in both experiments seem reasonable with the right sign In addition seen from
the estimation of the binding function the coefficients in the logit model is negatively
affected by the parameters they infer in the basic route choice model in the two attributes
case one parameter in the logit model is more apparently affected by the parameter it
refers than the other parameter in basic model
In the trial where we include a scale parameter to the random term and estimate it along
with the other parameters in the route choice model a Monte Carlo simulation
experiment is carried out using simulated observations The result shows that it is
efficient to use number of links in the auxiliary model to infer the scale parameter in the
basic rout choice model
72
In other trial formulations of the model we got negative estimates which may probably
be due to missing attributes in the cost function Future work should be done to include
more attributes
Another thing to recommend for future is that we generate the pseudo-universal choice
set as part of the auxiliary model Since the pseudo-universal choice set is partially used
for deciding which ODs and observations to be used in the project it is essential and
should be generated beforehand But from the choice set generation point of view we
could generate individual specific choice set directly instead of random drawing paths
from the pseudo-universal choice set This would increase computational efficiency
73
Bibliography
Axhausen K Schoumlnfelder S Wolf J Oliveira M amp Samaga U (2003) 80 Weeks of
GPS Traces Approaches to Enriching the Trip Information Transportation Research
Record 1870 46-54
Azevedo J Costa M Madeira J amp Martins E (1993) An Algorithm for the Ranking
of Shortest Paths European Journal of Operational Research 69 (1) 97-106
Bartels K Boztug Y amp Muumlller M (1999) Testing the Multinomial Logit Model
Working paper University Potsdam Germany
Bekhor S Ben-Akiva M amp Ramming M (2002) Adaptation of Logit Kernel to Route
Choice Situation Transportation Research Board of the National Academics 1805 78-85
Bekhor S Ben-Akiva M amp Ramming M (2006) Evaluation of Choice Set Generation
Algorithms for Route Choice Models Annals of Operations Research 114 (1) 235-247
Ben-Akiva M amp Bierlaire M (1999) Discrete Choice Methods and Their Applications
to Short Term Travel Decisions In Chapter for the Transport Science Handbook
Preliminary Draft
Ben-Akiva M amp Bierlaire M (2003) Discrete Choice Models with Applications to
Departure Time and Route Choice In Handbook of Transportation Science (second ed)
Kluwer
Ben-Akiva M amp Bolduc D (1996) Multinomial Probit with a Logit Kernel and a
General Parametric Specification of the Covariance Structure Working Paper
Ben-Akiva M amp Lerman S (1985) Discrete Choice Analysis Theory and Application
to Travel Demand MIT Press
Ben-Akiva M Bergman M Daly A amp Ramaswamy R (1984) Modeling Inter Urban
Route Choice Behaviour In J Vollmuller amp R Hamerslag (Ed) the 9th International
Symposium on Transportation and Traffic Theory (pp 299-330) Utrecht Netherlands
VNU Science Press
Cascetta E Nuzzolo A Russo F amp Vitetta A (1996) A Modified Logit Route Choice
Model Overcoming Path Overlapping ProblemsSpecification and Some Calibration
Results for Interurban Networks In J Lesort (Ed) the 13th International Symposium on
Transportation and Traffic Theory Lyon France
74
Creel M (2009) A Data Mining Approach to Indirect Inference Universitat Autonoma
de Barcelona Department of Economics and Economic History
De La Barra T Peacuterez B amp Anez J (1993) Multidimensional Path Search and
Assignment 21st PTRC Summer Meeting (pp 307-319)
Dijkstra E (1959) A note on two problems in connexion with graphs Numerische
Mathematik 1 269-271
Frejinger E amp Bierlaire M (2007) Capturing Correlation with Subnetworks in Route
Choice Models Transportation Research Part B 41 363-378
Frejinger E Bierlaire M amp Ben-Akiva M (2009) Sampling of Alternatives for Route
Choice Modeling Transportation Research Part B Methodological 43 (10) 984-994
Gallant A amp McCulloch R (2004) On the Determination of General Scientific Models
Manuscript Duke University
Gourieacuteroux C Monfort A amp Renault E (1993) Indirect Inference Journal of Applied
Econometrics 8 85-118
Karlstroumlm A Sundberg M amp Wang Q (2011) Consistently estimating flexible route
choice models using an MNL lense International Choice Modeling Conference Leeds
Keane M amp Smith A (2003) Generalized Indirect Inference for Discrete Choice
Models Manuscript Yale University
Manski C amp Lerman S (1977) The Estimation of Choice Probabilities from Choice
Based Samples Econometrica 45 (8) 1977-1988
McFadden D (1974) Conditional Logit Analysis of Qualitative Choice Behaviour (P
Zarembka Ed) Frontiers in Econometrics 105-142
McFadden D (1978) Modeling the Choice of Residential Location In A Karlqvist L
Lundqvist F Snickars amp J Weibull (Ed) Spatial Interaction Theory and Residential
Location (pp 75-96) Amsterdam North-Holland
McFadden D amp Train K (2000) Mixed MNL Models for Discrete Response Journal
of Applied Econometrics
Nerella S amp Bhat C (2004) Numerical Analysis of Effect of Sampling of Alternatives
in Discrete Choice Models Transportation Research Record 1894 11-19
Ramming M (2001) Network Knowledge and Route Choice PhD Thesis Massachusetts
Institute of Technology
75
Schoumlnfelder S amp Samaga U (2003) Where Do You Want to Go Today-More
Observations on Daily Mobility Third Swiss Transport Research Conference Ascona
Schoumlnfelder S Axhausen K Antille N amp Bierlaire M (2002) Exploring the
Potentials of Automatically Collected GPS Data for Travel Behaviour Analysis- A
Swedish Data Source i J Moumlltgen amp A Wytzisk (Red) GI-Technologien fuumlr Verkehr
und Logistik number 13 Institut fuumlr Geoinformatik Universitaumlt Muumlnster (ss 155-179)
Munster IfGIprints
Smith A (1993) Estimating Nonlinear Time-series Models Using Simulated Vector
Autoregressions Journal of Applied Econometrics 8 63-84
Smith A (2008) Indirect Inference In S Durlauf amp L Blume (Eds) The New
Palgrave Dictionary of Economics (Second ed) Palgrave Macmillan
Smith A (1990) Three Essays on the Solution and Estimation of Dynamic
Macroeconomic Models PhD Dissertation Duke University
Train K (2003) Discrete Choice Methods with Simulation Cambridge University Press
Vovsha P amp Bekhor S (1998) Link-nested Logit Model of Route Choice-Overcoming
Route Overlapping Problem Transportation Research Record 1645 133-142
Wang H (2011) Logistics Distribution Shortest Path Based on Dijkstra Algorithm
Computer and Digital Engineering 3
Assigned publication number
TSC-MT 11-016
wwwkthse

10
Monte Carlo simulation experiment is carried out with some arbitrary pseudo-true values
of the parameters based on which simulated observations are used
On the other hand what is done in the synthetic experiment such as test with simulated
observations for one OD and four ODs sensitivity of estimates with choice set size and
number of observations is not included in this thesis Instead we will identify some
limitations of the model formulation tried in the thesis and make suggestions how the
model can be improved
As follows Section 2 reviews relevant literatures on route choice modeling as well as
indirect inference In Section 3 relevant methods are introduced in detail as backgrounds
afterwards methods and models used in this thesis are illustrated Section 4 gives
description of the empirical data we use for estimating and Section 5 shows the
estimation results of the Monte Carlo simulation-based experiment followed by some
conclusions in Section 6
11
2 Literature Review
Route choice modeling has long been discussed and many efforts have been made to
solve this problem Simple and easy to estimate the multinomial logit model (MNL) is
widely used in choice modeling yet it has certain restrictions to be implemented in route
choice context Due to its inherent property of Independence from Irrelevant Alternatives
(IIA) the multinomial logit model is not easily applicable since routes in the choice set
tend to be correlated with the presence of overlapping paths Cascetta et al (1996)
proposed a correction term called Commonality Factor (CF) in the deterministic part of
the utility function2 And the probability of path i to be chosen from the choice set nC
becomes( )
( )( | )in in
jn jn
n
V CF
n V CF
j C
eP i C
e
micro
micro
minus
minus
isin
=sum
As proposed by Cascetta et al the Commonality
Factor is specified as ln ( )n
ijin CF
j C i j
LCF
L Lγβ
isin
= sum in which ijL is the length of links
common to path i and pathj while iL and jL are the total length of path i and pathj
respectively The parameter γ is left to be estimated or practically constrained to a fixed
value like 1 or 2 The CF term of one path is proportional to the length of overlapping
part with other paths This proposed model is referred to as C-Logit model Bearing some
similarities Ben-Akiva and Bierlaire (1999) proposed the Path Size Logit (PSL) model3
This model is based on a different theoretical basis as the C-Logit The original
formulation of Path Size (PS) comes from the discrete choice theory of aggregate
alternatives Similar to the CF in C-Logit the log of Path Size (PS) is added to the utility
function The probability of path i to be chosen from the choice set nC becomes
( ln )
( ln )( | )in in
jn jn
n
V PS
n V PS
j C
eP i C
e
micro
micro
+
+
isin
=sum
The Path Size is specified as
1
i n
n
ain
a Ciaj
j C j
lPS
LL
LδisinΓ
isin
= sumsum
in
2 Cascetta E Nuzzolo A Russo F amp Vitetta A (1996) A Modified Logit Route Choice Model Overcoming Path Overlapping ProblemsSpecification and Some Calibration Results for Interurban Networks In J Lesort (Ed) the 13th International Symposium on Transportation and Traffic Theory Lyon France 3 Ben-Akiva M amp Bierlaire M (1999) Discrete Choice Methods and Their Applications to Short Term Travel Decisions In Chapter for the Transport Science Handbook Preliminary Draft
12
which iΓ is the set of links in pathi al and iL are the length of link a and pathi
respectively ajδ is the link incidence variable with value of 1 when link abelongs to path
j and zero otherwise And nCL is the shortest path in choice setnC The size of a path has
a maximum value of one when it shares no links with other paths
C-Logit model and PSL model are the most widely used models in practice of route
choice modeling due to their simple forms Since both of them originate from the MNL
model and maintain the basic MNL structure they can be estimated by existing software
designed for logit models Apart from these two types of models there are other recent
efforts in the route choice context
Bekhor Ben-Akiva and Ramming (2002) adapted the Logit Kernel model to apply in a
route choice context4 The Logit Kernel5 model was proposed by combing Gaussian and
Type I Extreme Value error terms by researchers such as Ben-Akiva and Bolduc (1996)
and McFadden and Train (2000) who also referred to it as Mixed Logit6 By making
certain assumptions under route choice context Bekhor Ben-Akiva and Ramming (2002)
proposed a way to apply the model to route choice modeling7 Based on the data from
Boston several kinds of models are estimated including multinomial logit model Path
Size Logit and the newly proposed Logit Kernel model Seen from the estimation results
Logit Kernel has a better overall performance than the other two kinds of models This
result needs to be verified in other data sets since the one used in the paper has a
relatively small size
Frejinger and Bierlaire (2007) proposed an approach to capture correlation among
alternative routes with subnetworks and carried out estimation based on several kinds of
route choice models8 The paper gives an overview of the latest development of route
choice modeling and discusses the Path Size Logit model in detail As part of the
4 Bekhor S Ben-Akiva M amp Ramming M (2002) Adaptation of Logit Kernel to Route Choice Situation Transportation Research Board of the National Academics 1805 78-85 5 Ben-Akiva M amp Bolduc D (1996) Multinomial Probit with a Logit Kernel and a General Parametric Specification of the Covariance Structure Working Paper 6 McFadden D amp Train K (2000) Mixed MNL Models for Discrete Response Journal of Applied Econometrics 7 Bekhor S Ben-Akiva M amp Ramming M (2002) Adaptation of Logit Kernel to Route Choice Situation 8 Frejinger E amp Bierlaire M (2007) Capturing Correlation with Subnetworks in Route Choice Models Transportation Research Part B 41 363-378
13
conclusion a behavioral interpretation of the Path Size in the model is given The
subnetwork is defined so that the alternative routes sharing the same section of it are
seen as correlated This correlation is captured using the Error Component model and
estimation results show that this new approach gives better property than PSL models To
complement the paper uses a real size network and true travel data is collected which is
the same network we are going to use in this thesis project Additionally the paper
displays forecasting results which indicates that models with Path Size component tend
to have bad performance in prediction
Ben-Akiva and Bierlaire (2003) pointed out that under route choice context the
significant correlation among alternatives due to path overlapping and the generation of
choice set are two important issues and main difficulties9
There are some algorithms used in practice for generating choice set for route choice
modeling both deterministic methods and stochastic ones The deterministic methods
tend to give the same set of paths for a given OD pair Some examples are the link
penalty algorithm (De La Barra Peacuterez amp Anez 1993) which increases gradually the
impedance of all the links on the shortest path10 the link elimination algorithm (Azevedo
Costa Madeira amp Martins 1993) which removes links on the shortest path in sequence
to generate new paths11 and the labeled paths (Ben-Akiva Bergman Daly amp
Ramaswamy 1984)12 In terms of the stochastic methods they tend to produce individual
specific choice set One example is the simulation method (Ramming 2001) which
generates alternative paths by drawing link impedances from different distribution
densities13
When it comes to appraisal of the generated choice set some literatures give evaluations
on the efficiency of different sampling algorithms for choice set generation (See Bekhor
9 Ben-Akiva M amp Bierlaire M (2003) Discrete Choice Models with Applications to Departure Time and Route Choice In Handbook of Transportation Science (second ed) Kluwer 10 De La Barra T Peacuterez B amp Anez J (1993) Multidimensional Path Search and Assignment 21st PTRC Summer Meeting (pp 307-319) 11 Azevedo J Costa M Madeira J amp Martins E (1993) An Algorithm for the Ranking of Shortest Paths European Journal of Operational Research 69 (1) 97-106 12 Ben-Akiva M Bergman M Daly A amp Ramaswamy R (1984) Modeling Inter Urban Route Choice Behaviour In J Vollmuller amp R Hamerslag (Ed) the 9th International Symposium on Transportation and Traffic Theory (pp 299-330) Utrecht Netherlands VNU Science Press 13 Ramming M (2001) Network Knowledge and Route Choice PhD Thesis Massachusetts Institute of Technology
14
Ben-Akiva amp Ramming 2006 for example) Apart from this there are some recently
proposed methods for sampling alternatives under route choice context (See Frejinger
Bierlaire amp Ben-Akiva 2009 for example)
Nerella and Bhat (2004) carried out a numerical analysis on the effect of sample size on
the efficiency of the estimation of parameters14 The analysis is done for two kinds of
discrete choice models namely the multinomial logit model for which consistency of
estimation based on subset of alternatives is theoretically proved and non-MNL model
taking mixed multinomial logit model as an example Four evaluation criteria are chosen
namely the ability to recover model parameters ability to estimate overall log-likelihood
function value ability to estimate individual choice probabilities and ability to estimate
aggregate shares of alternatives The results show that the MNL model works well on
small sample size yet certain portion of full choice set need to be kept as a practical
baseline For the non-MNL model small sample size gives poor estimation and increase
of sample size gives obvious increase of estimation quality Certain portion of full choice
set is suggested for practical convenience yet the generalization of sample size portion is
not feasible since difference kinds of models may require different portion to guarantee
accuracy In general for the non-MNL models full choice set is suggested to be used if
feasible and larger sample gives better estimation
Bekhor Ben-Akiva and Ramming (2006) carried out route choice modeling based on a
large-scale urban network including both choice set generation part and route choice
estimation part which compose the process of route choice modeling together15 Given
that previous literatures did not pay too much attention to empirical estimation the paper
used a true observation data set collected in Boston As the first step several choice set
generation algorithms are listed and compared in their efficiency of reproducing the
observed paths on which the evaluation of the algorithms are based The data in Boston
is described in the paper and used in the second step ie model estimation Several route
choice models are presented and estimation results based on different kinds of models are
shown for comparison of the efficiency of the models The Path Size Logit model is
14 Nerella S amp Bhat C (2004) Numerical Analysis of Effect of Sampling of Alternatives in Discrete Choice Models Transportation Research Record 1894 11-19 15 Bekhor S Ben-Akiva M amp Ramming M (2006) Evaluation of Choice Set Generation Algorithms for Route Choice Models Annals of Operations Research 114 (1) 235-247
15
proposed for its property to overcoming the drawbacks of the conventional MNL models
This type of model can be easily estimated using popularized software The main
conclusion is that route choice models could be estimated for large-scale networks based
on the true observation data and prominent computing resources
Frejinger Bierlaire and Ben-Akiva (2009) proposed a paradigm for choice set generation
based on sampling for route choice modeling16 In the context of route choice modeling
the universal choice set which denotes all possible alternatives for a traveler to choose
from is not able to be enumerated So we practically work on a sampled choice set from
the universal one which may easily introduce bias to the final estimate In this paradigm
they focus on unbiased estimation of parameters instead of generating actual choice set
The path generation is seen as an importance sampling approach and a correction of
sampling is added to the path utility Since the following estimation process is based on
the sampled choice set which is treated as the universal one a correction for sampling is
added to the path size attribute in the commonly used path size logit (PSL) model ending
up with the expanded path size Modification in the previous two steps guarantees
unbiased estimation of the parameters Numerical results based on synthetic data are
presented in the paper to reveal that models with a sampling correction in the path utility
are better than those without it The proposed expanded path size logit model provides
unbiased estimation and is better than the original path size models
In this paper we will examine indirect inference Indirect inference is not a new method
it was first introduced by Smith (1990 1993)17 Then Gourieacuteroux et al (1993) gave
overall introduction to the methods and extended it in important ways18 Gallant and
McCulloch (2004) transferred the idea of indirect inference and used it for Bayesian
inference in models where likelihood function is intractable19
16 Frejinger E Bierlaire M amp Ben-Akiva M (2009) Sampling of Alternatives for Route Choice Modeling Transportation Research Part B Methodological 43 (10) 984-994 17 Smith A (1990) Three Essays on the Solution and Estimation of Dynamic Macroeconomic Models PhD Dissertation Duke University Smith A (1993) Estimating Nonlinear Time-series Models Using Simulated Vector Autoregressions Journal of Applied Econometrics 8 63-84 18 Gourieacuteroux C Monfort A amp Renault E (1993) Indirect Inference Journal of Applied Econometrics 8 85-118 19 Gallant A amp McCulloch R (2004) On the Determination of General Scientific Models Manuscript Duke University
16
Gourieacuteroux Monfort and Renault (1993) proposed the inference methods based on an
ldquoincorrectrdquo criterion which does not give consistent estimation to parameters of interest
directly20 The argument of the criterion is called the auxiliary parameter which may
have a larger dimension than the parameters of interest in the basic model After the
auxiliary parameters are selected a simulation-based process is carried out to get a
consistent and asymptotically normal estimator of parameters of interest As a simulation-
based method the only requirement for the basic model is that it could be simulated
regardless of formulations of the model So it could be used for estimating models which
are too complex to carry out direct approaches The paper shows how this kind of method
can be applied in fields such as micro-econometrics macro-econometrics and
econometrics of finance
Keane and Smith (2003) proposed a generalized form of the indirect inference method to
be implemented in the discrete choice model context21 Theoretically indirect inference
could deal with estimation of any economic models yet it has some limitations per se that
decrease the estimation efficiency or even make it difficult to implement Problems arise
when we use indirect inference in estimating discrete choice models since the objective
function the metric of distance between the auxiliary models estimated on observed data
and simulated data to be specific is inherently discrete which leaves the gradient-based
optimization methods infeasible Keane and Smith (2003) proposed that the estimation
procedures used for observed data and simulated data can be different22 Instead of the
discrete choice a continuous function of latent utilities including a smoothing parameter
is used as the dependent variable in the auxiliary model When the smoothing parameter
goes to zero the function of latent utilities converges to the discrete choices this way to
guarantee consistency According to the Monte Carlo results the generalized indirect
inference method proposed in this paper yields good estimates in small samples being as
efficient as maximum likelihood estimates in comparison
20 Gourieacuteroux C Monfort A amp Renault E (1993) Indirect Inference 21 Keane M amp Smith A (2003) Generalized Indirect Inference for Discrete Choice Models Manuscript Yale University 22 Keane M amp Smith A (2003) Generalized Indirect Inference for Discrete Choice Models
17
Creel (2009) presented a data mining approach to indirect inference23 which is similar to
the regular indirect inference method yet with certain advantages over it The method is a
simulation-based estimator relying also on an auxiliary model In line with the indirect
inference method an underlying economic model with parameterβ is referenced by an
auxiliary model with parameterθ Certain values of the parameter hβ in underlying
economic model are drawn randomly from a known density simulated data is generated
using Monte Carlo methods to estimate ɶh
θ of auxiliary model which ends up with a set
of tuples ɶ( )hhβ θ Nonparametric methods are used to get the function ɶ( | )E aβ θ = and
the final estimate of β is supposed to be the result of regression function evaluated at the
estimate of θ based on true observations ɶ ɵ( | )Eβ β θ θ= = Creel (2009) also presented a
way of calculating confidence intervals24 Monte Carlo results in dynamic and nonlinear
panel models and vector autoregressions show good performance of the new estimator
23 Creel M (2009) A Data Mining Approach to Indirect Inference Universitat Autonoma de Barcelona Department of Economics and Economic History 24 Creel M (2009) A Data Mining Approach to Indirect Inference
18
3 Methodology
31 Multinomial Logit Model (MNL)
311 Model Description
Route choice modeling is somewhat complicated when we want to capture the attributes
of both the alternative routes and choice maker accurately and reflect the choice making
process in the model Intuitively route choice can be regarded as choosing one specific
route from several alternative routes which coincides with the prerequisites of discrete
choice models Actually a lot of literatures have explored the route choice modeling and
possible improvements based on discrete choice models (see Cascetta et al 1996 Vovsha
and Bekhor 1998 Ben-Akiva and Bierlaire 1999 for more information on development
in route choice models with regard to discrete choice models)25
To understand the frontier development of route choice model we have got to know the
discrete choice models among which multinomial logit model (MNL) is the most widely
used In addition we choose to implement a new method ndash indirect inference in which
MNL is used as it is
Logit model is the most widely used discrete choice model till now due to its excellent
qualities in model specification To be specific the choice probability takes a closed form
which is easy to estimate and interpret (Train 2003)26
The multinomial logit model is a kind of choice model with more than two alternatives in
the choice set We assume that the choice maker makes his or her decision based on the
utility maximization rule (Ben-Akiva amp Lerman 1985)27 With regard to the utility njU
the decision maker n obtains from the thj alternative in the choice set it is made up of
two parts the deterministic part and the stochastic part The deterministic part denoted
25 Cascetta E Nuzzolo A Russo F amp Vitetta A (1996) A Modified Logit Route Choice Model Overcoming Path Overlapping ProblemsSpecification and Some Calibration Results for Interurban Networks Vovsha P amp Bekhor S (1998) Link-nested Logit Model of Route Choice-Overcoming Route Overlapping Problem Transportation Research Record 1645 133-142 Ben-Akiva M amp Bierlaire M (1999) Discrete Choice Methods and Their Applications to Short Term Travel Decisions 26 Train K (2003) Discrete Choice Methods with Simulation Cambridge University Press 27 Ben-Akiva M amp Lerman S (1985) Discrete Choice Analysis Theory and Application to Travel Demand MIT Press
19
by njV contains attributes known by the modelers while the stochastic part denoted by
njε is the attributes affecting peoplersquos the decision which cannot be observed by the
modelers yet are known by the decision makers themselves So the utility function turns
out to be
nj nj njU V jε= + forall (1)
The type of choice model is basically decided by the distribution of the stochastic part
When we assume that njε is independently identically Gumbel distributed the model
becomes a logit model
As stated above the decision follows utility maximization rule which means that the
decision maker n chooses the alternative with the highest utility say the thi alternative
Use as the probability the thi alternative is chosen over the others we have
( max ) ( )
( )
( )
ni ni nj ni njj C
ni ni nj nj
nj ni ni nj
P P U U P U U j i
P V V j i
P V V j i
ε εε ε
isin= = = ge forall ne
= + gt + forall ne
= minus lt minus forall ne (2)
With Equation (2) above and the assumption that njε follows iid Gumbel distribution we
could derive the probability of decision maker n chooses alternativei which is
ni
nj
V
ni V
j
eP
e=sum
(3)
Typically we specify the deterministic part of the utility function in a linear form which
is nj njV xβ= Then the probability becomes
ni
nj
x
ni x
j
eP
e
β
β=sum
(4)
This is the most common form of probability function for multinomial logit models
There are some good properties for this kind of logit probability as discussed by Train
(2009)28 With this form the probability of choosing certain alternative will be between
zero and one inherently which is basically required for probability definition Yet the
28 Train K (2003) Discrete Choice Methods with Simulation
20
value of niP will never drop to zero mathematically which means that all the alternatives
in the choice set are perceived to have chance to be chosen On the other hand if an
alternative is perceived never to be chosen it should not be included in the choice set at
all
The probabilities for all the alternatives in the choice set sums to be one which is easily
illustrated from the analytical properties 1 1 1
( ) 1njni
J J JVV
nii i j
P e e= = =
= =sum sum sum in which J denotes
the number of alternatives in the choice set
The logit probability and the deterministic part of the utility function follow an S-shaped
curve line shown in Figure 1 below
Figure 1 S-shaped relationship between probability and deterministic part of utility
This property gives implications for possible impacts of the deterministic utility of certain
alternative on its chances to be chosen We could see that when an alternative has about
50 probability to be chosen which infers to the steepest part on the curve a small
change in the deterministic part of the utility function could lead to a large change in the
probability the alternative has to be chosen
Apart from the nice properties of logit probability logit models have some disadvantages
as well (Bartels Boztug amp Muumlller 1999)29 One shortcoming is the assumption of
29 Bartels K Boztug Y amp Muumlller M (1999) Testing the Multinomial Logit Model Working paper University Potsdam Germany
21
Gumbel distribution of error terms in the utility function The inherent requirement for
iid property sets restrictions for logit model to be widely used especially in route choice
modeling context Several models have been proposed to overcome this shortcoming in
particular modifications based on MNL to adjust it to route choice practices have been
proposed Another drawback is the assumption of the linear composition for the
deterministic part of utility function Actually this assumption is for ease of following
estimation process since McFadden (1974) demonstrated that under this condition the
probabilities will be universally concave with regard to the coefficientsβ 30 which
improves the performance of numerical estimation Yet there could be nonlinear
compositions in the deterministic part to relax the restriction Under this condition the
universal concavity cannot be guaranteed which may lead to local convergence in the
estimation process
312 Model Estimation
The most commonly used numerical estimation method for multinomial logit models is
the Maximum Likelihood Estimation (MLE) In principle given a set of data and the
underlying probability model the method tries to find coefficients of the probability
model with which produced data has a distribution most likely resembles the distribution
of the observed data
Consider the case that N decision makers with their choice data are obtained Parameters
to be estimated are the coefficients in the utility function denoted byβ We could then
use the MLE to try to get the values of β vector with which the probability that choice
maker choose their observed alternatives is maximized
The probability of choice maker n to choose his or her observed alternative can be
written as
( ) niyni
i
Pprod (5)
in which niy is a dummy with value 1 if choice maker choose alternative i and value 0
otherwise
30 McFadden D (1974) Conditional Logit Analysis of Qualitative Choice Behaviour (P Zarembka Ed) Frontiers in Econometrics 105-142
22
Choice makers choose their alternative independently from each other so the probability
of all sampled choice makers choose their observed alternative is
1
( ) ( ) ni
Ny
nin i
L Pβ=
= prodprod (6)
This is the likelihood function with regard to the parameters to be estimated β in this
case We can take the logarithm of it to get the log-likelihood function
1
( ) lnN
ni nin i
LL y Pβ=
=sumsum (7)
Since we aim at getting the value of β to make the log-likelihood function maximized
we can take the derivative of it with respect to β and set it to zero
( )
0dLL
d
ββ
= (8)
By solving this equation we could get the estimate of β
32 Dijkstrarsquos Algorithm
321 Introduction
A method is needed for generating feasible alternatives and compose the choice set as
well as for deriving simulated observations for each OD pair in the process of indirect
inference As for choice set generation we would like to include certain number of high
ranking shortest paths in the choice set since these paths tend to have more possibility to
be chosen Similar to this the simulated observation is generated as the shortest path
between each OD pair We implement a method for shortest path finding which is the
Dijkstrarsquos Algorithm
Dijkstrarsquos Algorithm is named after the Dutch computer scientist Edsger Dijkstra who
conceived this method in 1956 and got it published in 195931 This is a graph search
algorithm aiming at solving shortest path problem for a graph the edge cost of which is
defined nonnegative The outcome of it is a shortest path tree demonstrating the path with
lowest value with respect to the defined cost
31 Dijkstra E (1959) A note on two problems in connexion with graphs Numerische Mathematik 1 269-271
23
This algorithm deals with single-source problem To be specific given one source node in
the graph the algorithm will give paths with the lowest value with regard to cost from
this source node to every other node in the network Given certain criterion we could use
the algorithm to find shortest path between two specific nodes by setting one node as the
source and the other as the target
After released it is widely used in path searching problems especially in transportation
related practices Routing problem is considered in investigation on traffic assignment
and optimization in logistics Real sized road network could be perceived as a graph with
vertices and edges in which cities can be abstracted as the vertices in the graph and the
roads connecting cities can then be regarded as the edges With the aid of Dijkstrarsquos
Algorithm the shortest path with respect to cost could be found from certain city to the
other cities The outcome is valuable for logistics corporations to work out their region-
wide distribution plans32
322 Algorithm
We connect a ldquodistancerdquo value with all the vertices in the graph indicating its distance
from the source vertex To be accurate the ldquodistancerdquo could be actual length of edges or
the generalized cost on the edges or anything desired The source vertex is defined as the
initial node with a value of zero In the process Dijkstrarsquos Algorithm will assign values
to vertices detected in one loop and update the values in the following loops till a
minimum value is found for each vertex The steps for searching and updating are
presented below
1 Initialize the network and assign the distance values of vertices other than the initial
node as infinity
2 When one vertex is to be detected it is denoted as current node All the vertices that
have been detected and attained the minimum distance values will be marked as detected
and will not be detected in the following loops while the vertices remaining unvisited
will be marked undetected To initialize all the vertices are marked undetected and the
initial node is set as current node
32 Wang H (2011) Logistics Distribution Shortest Path Based on Dijkstra Algorithm Computer and Digital Engineering 3
24
3 For current node all its directly connected adjacent nodes are considered except for
the newly detected vertex Labeled distance values of the neighbor vertices will be
updated if the calculated values from current node are smaller than their current values
For example current node A has a distance value of 4 and one of its neighbors B has a
value of 8 The edge linking A and B has a distance of 2 The newly calculated distance
value for B will be 4+2=6 which is smaller than 8 So the labeled distance value for B
will be updated to 6 indicating that the minimum distance from the source vertex to B till
now is 6 and the path should pass A
4 When all the neighbors of the current node are considered and updated mark the
current node as detected And mark the undetected node with the lowest distance value as
the current node and do the detection in step 3 again
5 When all the vertices in the network are marked detected the algorithm is finished and
we get the minimum distance from the source to all the other vertices The shortest path
from the source to a specific vertex could be found out following the detecting process
As mentioned above the stop criterion could also be modified as we desired If we aim at
finding the shortest path between two vertices at the beginning one vertex should be set
as the initial node and the algorithm could be stopped once the other vertex is marked as
detected
323 Explanatory Example
Here is a simple network to illustrate the mechanism of Dijstrarsquos Algorithm There are
five vertices and six edges with distance values labeled beside We define A as the source
and set it the initial node
Figure 2 A simple network for Dijstrrarsquoa Algorithm explanation
25
Initialization
Initial node A
Detected null
Distance value A=0 B=C=D=E=+infin
Loop 1
Current node A
Adjacent vertices B C
Detected null
Distance value A=0 B=4 C=1 D=E=+infin
Loop 2
Current node C
Adjacent vertices B D
Detected A
Distance value A=0 C=1 B=min 4 C+2 =3 D=C+3=4 E=+infin
Loop 3
Current node B
Adjacent vertices E
Detected A C
Distance value A=0 C=1 B=3 D=4 E=B+3=6
Loop 4
Current node E
Adjacent vertices null
Detected A B C D
Distance value A=0 C=1 B=3 D=4 E=6
If we want to get the shortest path from A to E following the detecting process we could
know that it should be A-C-B-E
26
324 Discussion
Dijkstrarsquos Algorithm has a clear logical structure which makes it easy to understand as
well as to implement in programming Nonetheless this method cannot search directly
from one node towards the other to find the shortest path between the two It works more
like detecting all the adjacent nodes in terms of shortest paths and expands from the
source iteratively until the target node is included and that is when we could figure out
the shortest path between the two specific vertices This reveals the fact that the method
wastes a lot of time in the blind search leaving it inefficient In addition this method is
not able to deal with networks with negative edge values yet this is not a problem in our
research since link cost on our network is defined nonnegative
33 Indirect Inference
331 Introduction
For problems in route choice context choice set size may be way too large to enumerate
all the alternatives Yet estimation based on sampled choice set may introduce biases
which can be corrected in some special cases (see Frejinger Bierlaire amp Ben-Akiva
2009)33 While in cases where estimation models are not based on MNL say multinomial
probit model we could not find corrections for biases caused by sampled choice set
Estimator based on the principle of indirect inference is then introduced to overcome
inconsistency problem34
Indirect inference35 is a simulation-based method for estimating parameters in economic
models by making references to the parameters of interest (Smith 2008) It is motivated
when general statistical estimation method such as Maximum Likelihood is intractable or
as discussed above consistent estimation is required given that only sampled choice set is
available Since in economic analysis we tend to build models which guarantee scientific
logic and inclusion of necessary attributes quite often the models will end up
33 Frejinger E Bierlaire M amp Ben-Akiva M (2009) Sampling of Alternatives for Route Choice Modeling 34 Karlstroumlm A Sundberg M amp Wang Q (2011) Consistently estimating flexible route choice models using an MNL lense 35 Smith A (2008) Indirect Inference In S Durlauf amp L Blume (Eds) The New Palgrave Dictionary of Economics (Second ed) Palgrave Macmillan
27
complicated from statistical estimation point of view This in sequence spurs the wide use
of indirect inference in economic analysis
It is common character that simulation-based methods allows modelers to simulate data
from the economic model of interest given certain perceived values of the parameters to
be estimated Since to generate data is essential and simple the true challenge is how to
estimate coefficients Indirect inference uses an auxiliary model which gives a rich
description of the covariance patterns in the data by including certain variables from the
basic economic model On the other hand the auxiliary model does not need to reflect
accurately the data generating process since it is supposed to be estimated based on the
data derived not to generate data itself The basic function of the auxiliary model is that
it provides a criterion to compare observed data and simulated data from the basic
economics model
We do iterations with the aim of finding the parameters of the basic economic model so
the observed data and the simulated data from the basic model looks almost the same by
the criterion of auxiliary model To be specific the auxiliary model is estimated based on
both observed data and simulated data we choose parameters for the basic model to
make sure that the two estimator of auxiliary model are as close as possible Based on
this idea the auxiliary model should be easy to estimate
332 Definition of the method
We define an economic model with the form of
( ) 12t t ty G x t Tε β= = (9)
in which 1 Tt tx = is a sequence of observed exogenous variables 1 T
t ty = is a sequence of
observed endogenous variables and 1 Tt tε = is a sequence of unobserved random error
terms β is a k -dimensional coefficient vector of the exogenous variables (Smith
2008)36
This model generally describes a relation that ty is dependent ontx with some random
errors Given the distribution of the random errors we could get the probability density
36 Smith A (2008) Indirect Inference
28
function of ty conditional on tx We will not focus on this density and instead this model
is only used for simulating data in indirect inference
In terms of the auxiliary model it could be defined by a probability density function with
the form of
( | )t tf y x θ (10)
in which θ is a p -dimensional coefficient vector and p is supposed to be not smaller
than k since we should capture characteristics of all the parameters in the underlying
economic model In addition the auxiliary model needs not be defined to reproduce the
distribution of ty in the basic model yet it needs to have a convenient analytical format
Based on the observed data we could estimate the parameters in the auxiliary model
using Maximum Likelihood Method
ɵ
1
arg max log ( | )T
t tt
f y xθ
θ θ=
= sum (11)
The estimated coefficient vectorɵθ could be used as an indicator of certain features of the
observed data
On the other hand the auxiliary model can be estimated based on simulated data from the
basic model as well We need to draw a sequence of random error terms 1 m Tt tε = from the
defined distribution in which m denotes the number of simulation with an interval of [1
M ] generally Given a coefficient vectorβ we could generate the values of endogenous
variables ɶ 1 ( )m T
tty β = which are explicitly dependent onβ With the help of Maximum
Likelihood Method we could get
ɶ ɶ
1 1
( ) arg max log ( ( ) | )M T m
ttm t
f y xθ
θ β β θ= =
= sumsum (12)
According to the principle of indirect inference we try to find the values of β to make
ɶ( )θ β as close toɵθ as possible Practically we need a metric to measure the distance
between ɵθ andɶ( )θ β and by minimizing the distance we could find out the estimates of
β in the basic economic model
29
333 Choices of the metrics
As mentioned above we need a metric to measure the distance betweenɵθ andɶ( )θ β
There are three approaches corresponding to the three classical hypothesis tests namely
Wald likelihood ratio (LR) and Lagrange multiplier (LM)37
In the Wald approach we try to minimize a quadratic form in the difference between the
two estimators ofɵθ andɶ( )θ β which is
ɵ ɶ ɵ ɶarg min( ( )) ( ( ))Wald
Wβ
β θ θ β θ θ β= minus minus (13)
in which W is a positive definite ldquoweightingrdquo matrix
In the LR approach a metric is formed based on the likelihood function related to the
auxiliary model which is
ɵ ɶ
1 1
arg min( log ( | ) log ( | ( )))T TLR
t t t tt t
f y x f y xβ
β θ θ β= =
= minussum sum (14)
According to the definition ofɵθ the first part of the objective function before the minus
sign on the right-hand side is always larger than the second part after the minus sign And
the first part is not dependent onβ
To minimize the objective function is equivalent to maximizing the log-likelihood
function withɶ( )θ β that is
ɶ
1
arg max( log ( | ( )))TLR
t tt
f y xβ
β θ β=
= sum (15)
In the LM approach the metric is formed using the derivative of the log-likelihood
function related to the auxiliary model which is
arg min ( ) ( )LM
S VSβ
β β β= (16)
in which
ɶ ɵ
1 1
( ) log ( ( ) | )M T m
ttm t
S f y xβ β θθ= =
part=partsumsum
(17)
and V is a positive definite matrix
37 Smith A (2008) Indirect Inference
30
By using any of the approaches we aim at getting the minimized distance betweenɵθ and
ɶ( )θ β so the value will approach to zero as expected So the hypothesis test of the
minimized value could be used as an indicator of whether the auxiliary model is suitably
specified In other words the minimized value being significantly different from zero
indicates a bad specification of the auxiliary model
In comparison the LM approach has an advantage over the others in computation when
it is relatively time-consuming to estimate the auxiliary model
334 Consistency Interpretation
Suppose the observed sample size T grows large while total number of simulations stays
fixed as M the estimator based on simulated data ɶ( )θ β will converge to a pseudo-true
value denoted as( )h β which is also dependent onβ This is called binding function
which characterized the relationship between the coefficients in the basic model and the
auxiliary model At the same time the estimator based on observed data ɵθ will converge
to a pseudo-true value0θ In case that T grows to a large number the aim of indirect
inference changes to finding β that guarantees0 ( )hθ β= This could explain that indirect
inference gives consistent estimate of the parameters in the basic economic model
In this project the binding function is what we focus on to get the correct estimates
instead of finding certain metrics Detailed methods will be discussed in the following
part
34 Model Specification in the Thesis
341 Basic Route Choice Model
Based on all the methods mentioned in previous sections the specification of models and
methods we use in the thesis will be explained in this section Since we are to estimate
the model based on true observations no model is known beforehand to adjust to the data
we use Several formulations of the model have been tested in the thesis The one
explained here could be seen as an example and all the other trials contain modifications
based on this model The other specifications of model will be explained along with the
results in the result section
31
We start by describing the underlying route choice model of interest38 We need to define
a road network as a representation of a real-size one from which we collected the trip
data The network denoted asN consists of a set of nodes (vertices) v and links (edges)
l Each link has a source node ( )s l and a target node or a destination node( )d l which
together indicate the direction of the link A path from an origin node ov to a destination
node dv could be seen as a sequence of links1 nl lhellip of which 1( ) os l v= 1( ) ( )i id l s l +=
and ( ) dnd l v= So a path can be defined by the index of links which is 1 nl lπ = hellip
A vector of characteristics denoted aslx is associated to each link as well as a strictly
positive cost function( )l lic x ε β in which liε is an individual specific random link cost
with i denoting the individual and β is a vector of coefficients of the link characteristics
left to be estimated In the Indirect Inference context we need an auxiliary model with
easily-estimated analytical form yet there is no such requirement for the basic model
Although not necessary we assume that the cost function has a linear deterministic form
the deterministic part and the random part are additively separable So we have the cost
function as
( ) Tl li l lic x xε β β ε= + (18)
In addition one important assumption is that the link cost is additive which means that
the cost of a path can be attained by the sum of all the link costs along the path This way
we have the cost of a path π as
( ) ( )l lil
C c xπ
π ε βisin
=sum (19)
We focus on the path-based model which means that the individuals choose among all
possible paths As defined above this turns out to be a random utility choice model As
indicated by the standard assumptions of this kind of models choice makers are assumed
to know both the link characteristics and their idiosyncratic random utility liε associated
to each link Since the choice makers maximize their utility this means that they will
choose the path with the lowest generalized cost in this model This way we have the
choice of individual i as
38 Karlstroumlm A Sundberg M amp Wang Q (2011) Consistently estimating flexible route choice models using an MNL lense
32
( )
arg min ( )o di i
iv v
Cπ
π πisinΩ
= (20)
in which oiv denotes the origin point of the trip for individual i and d
iv denotes the
destination ( )o di iv vΩ denotes all possible paths connecting the origin and destination in
the network for individual i which forms the choice set for the individual
When implementing the model we assume that the random utility component liε follows
a truncated normal distribution To be specific liε follows a standard normal distribution
yet with only the positive values retrieved This way we could guarantee that the link
costs are always positive so that additively the path would not have infinite loops With
this feature of the random component we could say that our model is probit-like Based
on this assumption the prerequisite of Dijkstrarsquos Algorithm is satisfied which always
needs positive edge values on the network We can use the Dijkstrarsquos Algorithm to find
the shortest paths iπ as an intermediate step in the implementation Apart from this we
assume that the unobserved cost captured by the random term is proportional to the
length of link To embody this in the cost function we add a fixed scale parameter to the
random term with a form of ( )Length l Lengthx Mean x in which ( )LengthMean x is the average
length of links in the network
We will assume that the data consists of J paths as dependent variables which means
that the dependent variables for the choice model are 1 Ji iy π == In addition the observed
characteristics of links in the network are provided 1 Ll lx x == To be specific we choose
to use two attributes of the links namely the length of the links Lengthx and the dummy
variable indicating the presence of speed bumps on the links SBx The cost function then
is specified as
( ) ( )l li Length Length l SB SB l li Length l Lengthc x x x x Mean xε β β ε= + + sdot (21)
Now the objective is to estimate the parametersβ in the model for which we will make
use of an auxiliary model
33
342 Auxiliary Model
Based on the idea of Indirect Inference we treat the route choice model defined above as
the basic model of interest which might have complex formation and be difficult to
estimate directly Then we need an auxiliary model to form a criterion which takes into
certain aspects of data to focus the analysis The auxiliary model needs not to reflect the
data generating process exactly as in the basic model yet it needs to include attributes of
interest in order for reference and to be easy to estimate We choose to use a logit model
for route choice as the auxiliary model since the logit model has always been a useful
tool for discrete choice analysis thanks to its analytical form and there is software for
estimating logit models which ensures that we can estimate very efficiently
As to the auxiliary model it is chosen to be a logit model for route choice We consider
that each individual i is choosing from a set of alternative routesr Each route r is given
a utility of riU
- Tri r ri r riU V Xε θ ε= + = + (22)
in which θ is the vector of auxiliary parameters which gives inference to the parameters
in the basic model One thing to be mentioned is that as expected the coefficients in the
utility function should have negative signs To make it easier for comparison with the
coefficients in the basic route choice model we assume the sign of θ to be positive per
se and add a negative sign ahead of it to guarantee that the coefficient part is negative as a
whole rX denotes route characteristics and riε is the random utility for each individual
which is assumed to follow an iid (independently identically distributed) Gumbel
distribution following the standard assumption of logit models
Note that as required for the auxiliary model it should be flexible enough to capture the
variability in the data and thus contains no fewer attributes than the basic model39 In
order to infer the parameters in the basic model and in consideration of efficiency we
pick the same attributes of interest in the basic models which are the link length Lengthx
and the speed bump dummy variableSBx So the utility function turns out to be
- -ri Length Length r SB SB r riU x xθ θ ε= + (23)
39 Karlstroumlm A Sundberg M amp Wang Q (2011) Consistently estimating flexible route choice models using an MNL lense
34
The probability of individual i choosing path r given an individual specific choice set
( )iI o d is
( )
ri
si
i
V
ri V
s I o d
eP
eisin
=sum
(24)
Theoretically we allow the individuals to choose from all possible paths between the
origin and destination in the network which intuitively could be infinite and impossible
to enumerate When implementing the model we generate the individual choice set based
on the basic route choice model Through simulation of the basic model we generate
infinite unique shortest paths for all the unique OD pairs by redrawing the random link
cost liε Without loss of generality the number of paths generated would be big enough
with fully consideration of efficiency We name the finite choice set composed by the
shortest paths generated as the pseudo-universal choice set ( )I o d which is a sample of
the infinite universal choice set The individual specific choice sets are generated by
randomly drawing certain number of paths out of the pseudo-universal choice set And
the size of individual specific choice set could be equal to or smaller than that of the
pseudo-universal one
The resulting individual specific choice set ( )iI o d describes a finite subset of all possible
paths connecting the origin oand destinationd for individuali When implementing the
methods the way of generating the choice set ( )iI o d for each individual i is viewed as
part of the auxiliary model
After the auxiliary model is built it could be estimated using a Maximum Likelihood
estimator based on the observed data of individual choices y and attributes variablesx
for individual 1 i N= hellip The estimate of parameters in the auxiliary model is
ɵ arg max ( )L y xθ
θ θ= (25)
in which ( )L y x θ is the log-likelihood function for the auxiliary model
Given the data of the link attributes xand some random draws of structural parameters
mβ 1 m M= hellip we can simulate choice data through the basic route choice model With
M draws of β from some given density we could simulate M sets of data resulting in
35
simulated choicesɶ( )my β Same as before parameters θ in the auxiliary model can be
estimated based on the simulated data as
ɶ ɶ( ) arg max ( ( ) )m m mL y xθ
θ β β θ= (26)
As the process indicated the simulated choice data depends on the structural parameterβ
in the basic route choice model and in sequence the estimates of parameters θ in the
auxiliary model depends on β when estimated based on the simulated data Based on
this theoretically we have a relationship of ( )θ β referred to as the binding function in
indirect inference literatures which we will discuss in detail for implementation of model
in this thesis A metric is then chosen to measure the distance between the observed and
simulated data viewed by the auxiliary model as a way to indirectly infer the values of
parameters β in the basic model To be specific for each draw of the structural parameter
mβ we can get the estimates of ɶ ( )m mθ β based on the simulated data and the distance
between ɶ ( )m mθ β and ɵθ measured by the chosen metric By doing more iteration with the
aim of minimizing the distance we will get the value of mβ which spurs the ɶ ( )m mθ β
closest toɵθ and this mβ is the inferred estimates of the parameter in the basic model
343 Consistency Discussion
The process of indirectly estimating parameters in the basic model is described above yet
we need to know whether the method we provide gives consistent estimation Here are
some discussions explaining the consistency in estimating by which consistency of the
estimator we proposed is illustrated
As proved the multinomial logit model (MNL) can be estimated consistently based on a
subset of alternatives (McFadden 1978)40 We may need to use the classical conditional
maximum likelihood estimator to deal with the problem at the same time the probability
that an individual n chooses an alternative i conditional on the subset of alternatives
denoted asnc becomes the conditional probability
40 McFadden D (1978) Modeling the Choice of Residential Location In A Karlqvist L Lundqvist F Snickars amp J Weibull (Ed) Spatial Interaction Theory and Residential Location (pp 75-96) Amsterdam North-Holland
36
ln ( | )
ln ( | )( | )in n
jn n
n
V q c i
n V q c j
j c
eP i c
e
micro
micro
+
+
isin
=sum
(27)
in which micro is a scale parameter and inV is the deterministic part of the utility There is a
term ln ( | )nq c j for correcting the sampling bias in which ( | )nq c j denotes the probability
of sampling nc given that alternative j is chosen
If all the alternatives in the choice set have the same probability to be chosen into the
subset the estimation on the subset of alternatives is equivalent to that on the full choice
set To be specific in this case ( | )nq c i is equal to ( | )n nq c j j cforall isin so by calculation the
term for sampling bias correction will cancel out in the probability function
In route choice context the alternative paths between an origin and a destination may be
in large amount and it is inefficient to give some very long-distance paths the same
probability as those short and attractive ones This means that we may need the
importance sampling method when generating subsets of alternatives which selects
attractive alternatives with higher probability than unattractive ones And the correction
term does not cancel out in this case Note that if alternative specific constants are
estimated we can get unbiased estimates of all the parameters except the constants even
if the correction term is not included in the utility function (Manski amp Lerman 1977)41
Back to the route choice context we tend to use large number of alternatives even with
subset of the full choice set which means that it is generally impossible to estimate the
constants and thus the correction term is essential To solve this problem Frejinger et al
(2009) developed a sampling approach in the context of route choice42
The discussion above focuses on the usage of MNL for route choice modeling When it
comes to our method the individual specific choice set is generated by randomly drawing
alternatives from the pseudo-universal choice set with the same probability yet there is
bias when generating the pseudo-universal ones since the pseudo-universal choice set is
composed of certain number of shortest paths between two nodes and this generating
process gives some paths higher probability to be included into the choice set So we
41 Manski C amp Lerman S (1977) The Estimation of Choice Probabilities from Choice Based Samples Econometrica 45 (8) 1977-1988 42 Frejinger E Bierlaire M amp Ben-Akiva M (2009) Sampling of Alternatives for Route Choice Modeling
37
actually use importance sampling to get the choice set which may consequently
introduce bias in estimating the parameterθ in the auxiliary model as discussed above
With the idea of indirect inference we consider only the relationship between θ andβ
denoted as( )θ β and use this relation to infer the value ofβ From this point of view
whether θ is estimated with bias or not does not matter since the relation between it and
β could always be captured which is the specific thing we focus on using the method of
indirect inference So we can say that even with biased subset of alternatives we could
still get consistent estimation by using indirect inference
344 Binding Function
As discussed in indirect inference method section when the sample size N increases
which means that we have more observations of choice the estimated parameter in the
auxiliary modelɶ ( )m mθ β will converge to a stable value ( )mθ β which is often referred
to as the binding function
Given that route choice model deals with discrete choices and by using indirect inference
we have a discrete choice model as the auxiliary model as well the estimates of binding
function ( )mθ β will inherit the discontinuous feature due to discrete individual choices
ɶ( )my β Keane and Smith (2003) proposed a solution of using logit-smoothing on the
simulated dependent choice data43 Following this idea we assume a continuous binding
functionɶ( )θ β for simplicity which could be approximated by a linear function locally
within small intervals With the M randomly drawn values of mβ and the corresponding
estimated parameters ɶ ( )m mθ β in the auxiliary model we could perform an Ordinary
Least Square (OLS) regression to estimate the local approximation of binding function
ɶ( ) c Dθ β β= + (28)
in which cdenotes the constant vector and D denotes the OLS parameter matrix44 To be
specific in our case each parameter in the auxiliary model will have a restriction
function with regard to both parameters in the basic model which is
43 Keane M amp Smith A (2003) Generalized Indirect Inference for Discrete Choice Models 44 Karlstroumlm A Sundberg M amp Wang Q (2011) Consistently estimating flexible route choice models using an MNL lense
38
ɶ1 11 12( )Length Length SBc d dθ β β β= + +
(29)
ɶ2 21 22( )SB Length SBc d dθ β β β= + +
(30)
Based on the observed data of choices y and explanatory variables xand the estimated
binding function which indicates the restrictions between ɶθ andβ we could use the
maximum likelihood method to give estimation of the parameters of interest The
likelihood ratio approach to indirect inference is following ideas of Smith (1993)45 and
Keane and Smith (2003)46
ɶ=arg max ( ( ))L y xβ
β θ β (31)
in which β is the estimate of the parameter of interest β in the basic economic model
With the restriction of binding function this is actually an indirectly inferred estimate In
line with the estimating process in auxiliary model ( )L sdot is the likelihood function of the
auxiliary model
Note that the form of binding function is based on an assumption in the result part we
will verify that this assumption is realistic
45 Smith A (1993) Estimating Nonlinear Time-series Models Using Simulated Vector Autoregressions 46 Keane M amp Smith A (2003) Generalized Indirect Inference for Discrete Choice Models
39
4 Data
41 Road Network
The data we use for estimation is based on a GPS data set collected in the Swedish city of
Borlaumlnge Borlaumlnge is located in the middle part of Sweden and has a population of about
47 000 inhabitants
The virtual road network contains 3077 nodes and 7459 unidirectional links (Frejinger amp
Bierlaire 2007)47 of which 3061 nodes and 7288 links are included in the network for
estimation Figure 3 gives a visual illustration of the road network in Borlaumlnge
Figure 3 Illustration of the Borlaumlnge road network
With regard to our research two of the link attributes are included namely link length
and speed bump dummy Link length is in the unit of km and speed bump dummy is an
indication of speed bump existence on the links which has the value 1 when there is a
speed bump on the link and 0 otherwise
Link length
47 Frejinger E amp Bierlaire M (2007) Capturing Correlation with Subnetworks in Route Choice Models
40
Some descriptive statistics of the link length data for the whole network is presented in
Table 1 below
Table 1 Descriptive statistics of link length
Number of links 7288
Minimum 0001
Maximum 7599
Mean 0184487
Median 0102
Variance 0103722
Lexis ratio (varmean) 1016884
Skewness 9871144
To describe the overall character of the link length attribute the histogram is shown in
Figure 4 below
Figure 4 Histogram of link length data
We could see that the link length data is quite clustered most of which lies within the
range of 01km and 06km Nonetheless there are some extreme values far away from the
range indicating extremely long links To display the variation in the relatively clustered
area we draw a histogram zoomed in the interval of (0 1km] shown Figure 5 in below
0
01
02
03
04
05
06
Fre
qu
en
cy
Link length (km)
Histogram
41
Figure 5 Histogram of link length data (zoomed within 1km)
Over 80 of all the links have length shorter than 03 km indicating concentration of
link length data
Speed bump dummy
Speed bump dummy is based on true situation in the network Of all the links 82 links
are equipped with speed bumps which account for a percentage of 113 The following
Figure 6 displays the locations of links with speed bumps
Figure 6 Illustration of links with speed bumps
0005
01015
02025
03035
04045
05
Fre
qu
en
cy
Link length (km)
Histogram(zoom in)
42
42 Observation Data
The GPS data set is collected as a part of the Swedish Intelligent Speed Adaptation (ISA)
study which aims at traffic safety effects of in-car information systems In the study 186
vehicles were equipped with GPS devices and traced within a radius of 25 km from the
center of Borlaumlnge The monitoring lasted for 30 days from 22th June 2000 to 4th March
2002 obtaining 49 667 vehicle days of travel and nearly a quarter of a million trips (for
more information on the GPS data set check Axhausen Schoumlnfelder Wolf Oliveira amp
Samaga 2003 Schoumlnfelder amp Samaga 2003 Schoumlnfelder Axhausen Antille amp Bierlaire
2002)48
The data collection is not originally designed for route choice analysis so the raw data
cannot be used in our research directly Extensive data processing is performed by the
company GeoStats in Atlanta to retrieve new data set available for route choice analysis
which contains 24 vehicles and 16 035 observations The final data set we use is provided
by Emma Frejinger which contains in total 1832 observations corresponding to 1458
observed unique routes made by 24 vehicles and 1409 unique origin-destination pairs
Considering that certain route may have been observed more than once we make a
distinction between observations and unique routes and number of unique routes should
be less than that of observations consistently with the numbers listed above
As indicated by data collection in the ISA study only licensed drivers with access to his
or her only car are recruited to minimize sharing or swapping of cars Minimum socio-
economic data of the drivers is included in data collection so we have no way to
understand driver characteristics from the data set Logically we make an assumption
that there is only one individual per vehicle
In the observation data a route is represented by a series of links and also an origin-
destination pair With relatively intensively distributed link length number of links could
48 Axhausen K Schoumlnfelder S Wolf J Oliveira M amp Samaga U (2003) 80 Weeks of GPS Traces Approaches to Enriching the Trip Information Transportation Research Record 1870 46-54 Schoumlnfelder S amp Samaga U (2003) Where Do You Want to Go Today-More Observations on Daily Mobility Third Swiss Transport Research Conference Ascona Schoumlnfelder S Axhausen K Antille N amp Bierlaire M (2002) Exploring the Potentials of Automatically Collected GPS Data for Travel Behaviour Analysis- A Swedish Data Source In J Moumlltgen amp A Wytzisk (Ed) GI-Technologien fuumlr Verkehr und Logistik number 13 Institut fuumlr Geoinformatik Universitaumlt Muumlnster (pp 155-179) Munster IfGIprints
43
be used to indicate total length of routes Some of the descriptive statistics of link number
is shown in Table 2 below
Table 2 Descriptive statistics of link numbers in observation data set
Number of observations 1832
Minimum 5
Maximum 106
Mean 202877
Median 16
Variance 1871968
Lexis ratio (varmean) 9227126
Skewness 1732597
For further overall inspection of link number distribution in the observation data set the
histogram is shown in Figure 7 below
Figure 7 Histogram of link numbers in observations data set
Seen from the histogram distribution of number of links is relatively dispersed with a
large range interval Judging by the statistics in general the routes observed have about
000
200
400
600
800
1000
1200
1400
1600
5 8
11
14
17
20
23
26
29
32
35
38
41
44
47
50
53
56
59
62
65
68
71
74
77
80
83
86
89
92
95
98
10
1
10
4
10
7
Mo
re
Fre
qu
en
cy
Number of links
Histogram
44
20 links in average Yet the data has a big variance which is reasonable As stated above
there are 1409 unique OD pairs for 1832 observations indicating that for most OD pairs
there is only one observation Spread within the detecting area different OD pairs could
have various numbers of links in between
Following our experiment design only a portion of the data could be used To be specific
routes with number of links fewer than ten would be eliminated when used for estimation
43 Further Exploration of data
Apart from the characters discussed above there are some other attributes in the data set
interesting to be explored Both in link attribute data set and observation data set there is
travel time data which to some extent is parallel with length in indicating distance
between two nodes
In the link attribute data set one attribute is denotes the estimated travel time of links in
unit of hour Some of the descriptive statistics is shown in Table 3 below switching unit
to minute
Table 3 Descriptive statistics of estimated travel time on links
Number of links 7288
Minimum 000186
Maximum 578268
Mean 0281696
Median 018744
Variance 0119337
Lexis ratio (varmean) 0423638
Skewness 5785361
Seen from Table 3 estimated travel time seems to have a more clustered distribution than
link length judging by lexis ratio and skewness Yet this time is roughly estimated not so
qualified as link length to use in estimation since the latter is much easier to measure and
guarantee precision
In the observation data set we have the duration time of the observations in the unit of
minute Some of the descriptive statistics is shown in Table 4 below
45
Table 4 Descriptive statistics of duration of trips
Number of observations 1832
Minimum 007
Maximum 316
Mean 4991195
Median 3925
Variance 1775639
Lexis ratio (varmean) 3557542
Skewness 2174728
Duration of trips can be used as an indication of distance between origin and destination
yet it is roughly measured and strongly affected by traffic condition on the road network
With similar reasons as discussed on estimated travel time on link we use number of
links instead of duration of trips to indicate the distance between OD pairs
46
5 Experiment Design
When doing the simulation-based estimation it is physically divided into two parts for
convenience of operation As discussed in the method section we choose to use a pseudo-
universal choice set which is generated and stored in the first part and ready for use in
the following experiment Then in the second part we do the simulation-based
experiment to carry out indirect inference method for estimating the parameters of
interest in the basic model β to be specific The Figure 8 below illustrates an abstracted
flow of how the estimation is carried out given certain origin-destination pair
Figure 8 Illustration of the flow in the experiment
As shown in the flow chart we get all the unique OD pairs in the trip data For each of
the OD pairs the Dijkstrarsquos algorithm is used to find the shortest paths between them
without duplicates We set the intended number of paths to be 400 as well as time
terminator in case not enough paths could be generated within certain bearable time
47
interval The generated paths form the pseudo-universal choice set of each OD pair
which is stored for future use Note that we abandon some OD pairs with too few paths
in the pseudo-universal choice set Observations containing the kept OD pairs are used
for following estimation which turns out to be 940 of them
For the OD pair in a given observation 200 alternatives are randomly drawn from the
pseudo-universal choice set and the sequential links in the observation itself is read as an
alternative path The 201 paths compose the observed choice set On the other hand a
given value of mβ is drawn from a predefined domainD The shortest path is generated
based on the given mβ as the simulated observation Like in the observed choice set part
200 alternatives are randomly drawn from the pseudo-universal choice set to form the
simulated choice set together with the simulated observation The auxiliary model is
estimated based on the simulated choice set and we could get a set of ɶ( ( ))mm mβ θ β pairs
which will be used to estimate the binding function Based on the binding function and
the observed choice set the parameters in the basic model could be indirectly estimated
The process described above is abstracted with no illustration of iterations Since this is
an experiment based on simulations certain loops of iteration should be carried out to get
statistics of the results
Given observed trip data at first we have no idea of the value of β In the process of
retrieving value ofβ the estimation process is repeated for several stages denoted asS
starting from a rough guess of the domainsD while for each following stage the domain
shrinks Since we tend to use a local OLS regression to approximate the smooth binding
function the draws of smβ need to be around the true value to prevent misspecification of
OLS regression due to the possibly inherent nonlinearity of the binding function The
estimated 0
β is not satisfactory in precision in the first stage yet it could give a hint of
where the true value lies The domain1D is centered on 0
β with smaller interval before
the estimation in the second stage This way +1sD is dependent on sD with smaller
interval As it goes on we will get a more accurate domain and as a result a well specified
OLS regression to approximate the binding function
48
The process of experiment with iterations is described below Suppose that we have the
experiment carried out for K times and the number of observations used isN
for run 1 k K= hellip for true observation 1 i N= hellip
Randomly draw alternatives from the pseudo-universal choice set end Form the observed choice sety for stage 1 s S= hellip
for 1 m M= hellip
Draw ksmβ from the domain ksD
Simulate paths for OD pairs in the used observations with mβ
for simulated observation 1 i N= hellip Randomly draw alternatives from the pseudo-universal choice set end
Form a simulated route choice setɶ( )ksmy β
Estimate ɶ ( )ks ksm mθ β in Equation (26)
end
Estimate ɶ ( )ks
θ β in Equation (28)
Estimate ks
β in Equation (31) end
Center the domain 1k sD + on ks
β and shrink the interval end
As a trial we first do the experiment on a route choice model with one parameter link
length to be specific For simplicity the random term is not scaled as described in the
model specification section which means we attach a truncated normally distributed
random term to the cost function without scaling it with link length After getting the
estimation of Lengthβ we move on to estimating the route choice model with both
parameters as described in the model specification Results under these two formulations
of models are presented separately in the result part
49
6 Results
61 Validation of Binding Function
As discussed in the binding function section we assume the binding function to be
continuous and feasible to be approximated by a linear function locally The assumption
of binding function can be verified based on the ɶ( ( ))mm mβ θ β pairs we attained as
intermediate results To explain this more explicitly we carry out a simple example with
only one parameter in the route choice model Lengthβ to be specific
The cost function is specified as
( )l li Length Length l lic x xε β ε= + (32)
corresponding to which the auxiliary model is
-ri Length Length r riU xθ ε= + (33)
For each run 10 values ofLengthβ are evenly drawn from a given domain By simulating
observations and estimating the auxiliary model 10 corresponding Lengthθ are generated to
form ten ɶ( ( ))mm mβ θ β pairs As assumed the binding functionɶ( )θ β is continuous which
could be approximated by a linear function locally To display the trend of binding
function we choose a relatively large domain for Lengthβ in the beginning [010]D = and
carry out 10 runs which generate 100 points in the beta-theta diagram shown in Figure 9
below
Figure 9 Scatter plots of the 90 beta-theta pairs
y = 12804x + 16264
Rsup2 = 09959
0
2
4
6
8
10
12
14
16
0 2 4 6 8 10
the
ta_
len
gth
beta_length
50
We do OLS regression for the dots and estimate the binding function Intuitively the
smaller the domain is the more accurate is the approximation of the binding function We
shrink the input domain based on the final estimate of Lengthβ from last trial
As it turned out to be we choose an input domain of [1214]D = for Lengthβ and the
binding function is assumed to take the form of
ɶ1 11( )Length Lengthc dθ β β= +
(34)
The result for one run is displayed in Figure 10 below
Figure 10 OLS regression based on the 10 beta-theta points from one run
The estimated binding function based on the 10 points is
ɶ ( ) 17371+10838Length Lengthθ β β= (35)
as indicated by 2 09783R = the function describes the trend of points very well Since
the interval is quite small we could use the estimated function to approximate the
binding function
When it comes to more parameters in the route choice model what we do is simply to
add more elements in the binding function After getting a vector of β and the
corresponding vector ofɶ( )θ β binding functions of each element in vector ɶ( )θ β with
y = 17371x + 10838
Rsup2 = 09783
315
32
325
33
335
34
345
35
355
12 125 13 135 14
the
ta_
len
gth
beta_length
51
regard to all the elements in vector β are estimated One example is shown in the
Equation (29) and Equation (30)
62 Estimation of model with one attribute
The route choice model with one attribute we used is the one described in Section 61
above After several trials by shrinking input interval every time we finally affirm that
the true value Lengthβ of lies in a relatively small interval of [12 14] Based on this
domain 50K = runs are carried out to get statistics of the estimate of Lengthβ As
discussed in the experimental design several stages Smean different trials before final
affirmation of input interval yet for the statistics only one stage is carried out for each
run Within each run 10M = values of input Lengthβ are drawn for estimating binding
function
The estimation statistics of Lengthβ is shown in Table 5 below
Table 5 Statistics of estimation of beta_length
Parameter Lengthβ
Mean 1337353
Standard deviation 0107537
RMSE 0013227
In the table RMSE is the root-mean-square error which is used to measure the distances
between the observed values being estimated and the predicted values by the estimator
The individual differences are called residuals and RMSE is an aggregated measure of
the residuals To be specific
ɵ ɵ ɵ 2( ) ( ) (( ) )RMSE MSE Eθ θ θ θ= = minus (36)
in which ɵθ is the estimator and θ is the parameter to be estimated so the RMSE is the
square root of the mean square error As defined the smaller the value of RMSE is the
better the estimator is
52
Here the RMSE is calculated based on the ten points ɶ( ( ))mm mβ θ β for estimating binding
function so basically it describes the goodness of fit of the estimated binding function
with regard to the points we generated The Equation (36) is specified as
ɶ 2( ( )) (( ( ) ( )) )mm m mRMSE Meanθ β θ β θ β= minus (37)
The value of RMSE displayed in the Table 5 is the mean value of all the RMSE values
for 50 runs Seen from this we have well-estimated binding function for all the 50 runs
on average In terms of the estimates of binding function taking the one in Section 61 as
an example the binding function estimated in the interval of [12 14] in Equation (35)
has a positive constant and a positive coefficient for Lengthβ which indicates that with
larger value of Lengthβ we will get larger value ofɶ Lengthθ and as a result a negative
coefficient for length in the utility function of the logit model This is reasonable for
bigger Lengthβ reveals larger incremental effect on the cost of certain path while lower
ɶ- Lengthθ reveals larger disutility effect on certain path these two effects are in fact
equivalent
By the way the high fitness of binding function is probably due to the relatively small
input interval of Lengthβ after certain trials and shrinkage As the final estimate indicates
Lengthβ falls right into the interval of [12 14] with small standard deviation So we can
say that the estimate is quite good
63 Estimation of model with two attributes
We use the model described in the model specification section to carry out the estimation
Two attributes are used namely length and speed bump dummy Similar to the one
attribute case we carried out several trials and shrinkage to finally determine the
relatively small input intervals forLengthβ and SBβ [05 1] and [0 05] respectively
50K = runs are carried out to get statistics of the estimates of the two parameters Within
each run 10M = values are drawn for inputs Lengthβ and SBβ respectively for estimating
binding function
53
One important thing to mention here is that the inputs are drawn evenly from the domain
yet to guarantee that the values of Lengthβ and SBβ are independent from each other or to
get rid of collinearity49 the domains of two parameters are defined in two dimensions To
explain this more explicitly we choose data of one run as an example The input points of
( Lengthβ SBβ ) are shown in Figure 11 below
Figure 11 Scatter plot of the input values for beta_length and beta_sb
We can see from Figure 11 that the points spread evenly in the domain quadrant Based
on these draws we could estimate the binding function and evaluate the relationship
between parameters in the logit model and Lengthβ and SBβ without worrying about
possible correlation between Lengthβ and SBβ
As discussed before in the binding function we are supposed to find the relationship
between each of the parameters in the logit model and both parameters in the route choice
model Mathematically this binding function should be a surface in the 3D coordinate
system We take the results of one run as an example and thus we have ten sets of Lengthβ
and SBβ along with corresponding ɶ Lengthθ andɶ SBθ
49 A set of points is collinear if they lie on a single straight line or a projective line (for example projective line over any field) and this way the two factors represented by the points are correlated
0
005
01
015
02
025
03
035
04
045
05
05 06 07 08 09 1
be
ta_
sb
beta_length
54
For the first binding function ɶ Lengthθ and ( Lengthβ SBβ ) are plotted in Figure 12 below
And the binding function takes a form as described in Equation (29)
Figure 12 Scatter plot of theta_length with regard to beta_length and beta_sb
By multi-linear regression we can get a surface to approximate the binding function
locally The estimated binding function is displayed in Figure 13 below
Figure 13 Display of the estimated binding function for theta_length
And the first binding function has a formula of
55
ɶ 18234+16933 +00633Length Length SBθ β β= (38)
For the second binding function ɶSBθ and ( Lengthβ SBβ ) are plotted in Figure 14 below
And the binding function takes a form as described in Equation (30)
Figure 14 Scatter plot of theta_sb with regard to beta_length and beta_sb
By multi-linear regression we can get a surface to approximate the binding function
locally The estimated binding function is displayed in Figure 15 below
Figure 15 Display of the estimated binding function for theta_sb
56
And the second binding function has a formula of
ɶ -06698+00371 +17619SB Length SBθ β β= (39)
The t-test of estimated parameters in the binding function is carried out with null
hypothesis of zero Estimates that are significantly different from zero with 95
confidence interval are marked as bold
Table 6 Estimated coefficients of binding function for model with two attributes
Constant Lengthβ SBβ
ɶLengthθ 18234
(43632) 16933
(33481) 00633 (1392)
ɶSBθ -06698
(-7991) 00371 (0366)
17619 (19323)
Seen from the magnitude of coefficients in the binding functions both Lengthβ and SBβ
have positive effect on ɶ Lengthθ andɶ SBθ and in sequence negative effect on the coefficients
in the logit model In addition coefficients of SBβ with regard to ɶ Lengthθ and Lengthβ with
regard to ɶ SBθ are not significantly different from zero so we can say Lengthβ has a more
apparent effect on ɶ Lengthθ than SBβ does while SBβ has a more apparent effect on ɶ SBθ
than Lengthβ does
Based on the estimated binding functions and the true observation data we could get the
estimates of Lengthβ and SBβ as shown in Table 7 below
Table 7 Statistics of estimation of beta_length and beta_sb
Parameter Lengthβ
SBβ
Mean 0761383 0079874
Standard deviation 0068493 0034375
RMSE 0022772 0085113
Seen from the RMSE results the relatively small values indicate that we have well-
estimated binding functions for all the 50 runs on average With regard to the estimates of
parameters in the route choice model both of them fall into the input domain we choose
57
and the standard deviation is quite small So we can say that the estimates are actually
very good
One thing to notice here is that the final estimate of Lengthβ falls approximately in the
middle of the input domain [05 1] while the estimate of SBβ falls closer to the left limit
which might need further shrinkage of input domain and more precise estimate of the
binding function To get rid of this we use the binding function estimate from all the 500
points to give a hint on the reasonability of acceptance of the estimate of SBβ The scatter
plots of theta_sb against beta_sb and beta_length are shown in Figure 16 below
Figure 16 Scatter plots of theta_sb against beta_sb and beta_length
The scatter plots in Figure 16 above are the decompositions of the binding function from
three dimensions to two dimensions Seen from the linear regression in the two plots ɶSBθ
is almost strictly positive proportional to SBβ and hardly effected byLengthβ This means
y = 19132x - 06404
Rsup2 = 0936
-1
-08
-06
-04
-02
0
02
04
06
0 01 02 03 04 05
the
ta_
sb
beta_sb
y = 00123x - 01717
Rsup2 = 4E-05
-1
-08
-06
-04
-02
0
02
04
06
05 06 07 08 09 1
the
ta_
sb
beta_length
58
that by shrinking the input domain ofSBβ we would probably get the same estimate of
binding function since it changes little in current domain And this leads to our
acceptance of the final estimate of SBβ
Given that we have a random cost following a truncated standard normal distribution and
the magnitudes of the estimated parameters are relatively small this would mean that the
randomness of the cost function are relatively large which in sequence leads to relatively
large randomness in individualrsquos choice of route
Another thing to be mentioned is that the magnitude of Lengthβ is smaller than that when
estimated singly Though these two values are not logically comparable with different
formation of random term in the cost function we could still get a hint from the
comparison This difference is probably due to the form of random cost we used which is
( )li Length l Lengthx E xε sdot and the effect of length on the cost is partially captured by this
random term
64 Estimations of other trial formulations of the model
641 Model with exponential form of cost function
During the process of estimation we carried out a lot of other trials in the formulations of
the basic route choice model the cost function to be specific and the auxiliary logit model
As it turned out the there are negative estimates of coefficients in the cost function
which conflicts our anticipation To capture this kind of negative estimation we choose to
use the exponential form of the cost function Without loss of generality the random term
is not scaled by the length of links The cost function is specified as
( ) Length Length l SB SB l lix x
i lic x eβ β εε + += (40)
Two attributes are used namely length and speed bump dummy variable Unlike the form
in Section 63 we allow the parameters Lengthβ and SBβ to have negative input and the
random term liε now follow a standard normal distribution without truncation Since we
take the exponential form of the cost function the cost of links could be kept positive
thus allowing the use of Dijkstrarsquos Algorithm to operate
59
In terms of the auxiliary model since we could have more attributes in the auxiliary
model than the underlying model Instead of using the same attributes as in the cost
function we choose to add an attributes which is number of links in the pathLNx So the
utility function of the logit model is specified as
- - -ri Length Length r SB SB r LN LN r riU x x xθ θ θ ε= + (41)
We still expect the value of θ to be positive and the coefficient of variables with the form
of -θ would be negative
Several trials and shrinkage were carried out for this formulation of our model to finally
determine the relatively small input intervals forLengthβ and SBβ [25 27] and [-05 0]
respectively 15K = runs are carried out to get statistics of the estimates of the two
parameters Within each run 10M = values are drawn for inputs Lengthβ and SBβ
respectively for estimating binding function
To visualize the trend of binding function more clearly we make use all the 150 sets of
vector β and vector θ to estimate the binding function Since we have three variables in
the logit model we have to estimate three binding functions
For the first binding function ɶ Lengthθ and ( Lengthβ SBβ ) are plotted in Figure 17 below
shown along with the estimated binding function
Figure 17 Scatter plot of theta_length against beta_length and beta_sb estimated binding function
The first binding function takes the form of
ɶ 41312+09114 +44845 10Length Length SBθ β βminus= sdot (42)
60
For the second binding function ɶSBθ and ( Lengthβ SBβ ) are plotted in Figure 18 below
shown along with the estimated binding function
Figure 18 Scatter plot of theta_sb against beta_length and beta_sb estimated binding function
The second binding function takes the form of
ɶ 01147 01362 +07119SB Length SBθ β β= minus (43)
For the third binding function ɶ LNθ and ( Lengthβ SBβ ) are plotted in Figure 19 below
shown along with the estimated binding function
Figure 19 Scatter plot of theta_ln against beta_length and beta_sb estimated binding function
The third binding function takes the form of
ɶ 10043 03378 +00068LN Length SBθ β β= minus (44)
The t-test of estimated parameters in the binding function is carried out with null
hypothesis of zero Estimates that are significantly different from zero with 95
confidence interval are marked as bold
61
Table 8 Estimated coefficients of binding functions for model with exponential cost function
Constant Lengthβ SBβ
ɶLengthθ 1312
(2411) 09114 (4360)
4484510-4 (0005)
ɶSBθ 01147
(0425) -01362 (-1314)
07119 (17221)
ɶLNθ 10043
(13767) -03378
(-12051) 00068 (0607)
Same as in the model with two attributes ɶ Lengthθ andɶ SBθ are significantly affected by
Lengthβ and SBβ respectively The negative signs for Lengthβ in the second and third binding
functions draw our attention Since in the second binding function it is not significantly
different from zero we can disregard the effect In the third binding function Lengthβ has
significantly negative effect on ɶ LNθ The larger value of Lengthβ we have the more
influential of path length on cost is With negative effect on ɶ LNθ we can say at the same
time number of links become less influential on the utility This is reasonable since
intuitively if we are sensitive to the path length we wouldnrsquot care too much of having to
switch several more or fewer links based on that path length and number of links are
more or less correlated to each other
Based on the estimated binding functions and the true observation data we could get the
estimates of Lengthβ and SBβ as shown in Table 9 below
Table 9 Statistics of estimation of beta_length and beta_sb in exponential-cost-function model
Parameter Lengthβ
SBβ
Mean 2537672 -045601
Standard deviation 0068377 0133036
We have negative estimate of SBβ which conflicts our assumption that length and
presence of speed bump on the path may increase the cost of traveling through certain
path This is probably due to omission of important attributes in the deterministic part of
the cost function Based on the estimate we are led to think that presence of speed bump
decrease the cost and individuals would prefer to drive on paths with speed bumps Yet
62
this is not true based on our estimation since we are only using two attributes And there
are great chance that some important features are not captured which accidentally are
related with speed bump So the estimate of SBβ is misleading per se in the simple model
as we are using To get more accurate estimate of SBβ we may need to include more
variables in the deterministic part of the cost function
642 Model with estimated scale parameter for random term
Considering the trial with two attributes in Section 63 we add a fixed scale parameter to
the random term to make it proportional to the length of links This appeals to our
assumption yet lays restrictions to the model Apart from this we also try to add an
unfixed scale parameter σ and estimate it along with the other two parameters Lengthβ and
SBβ Note that if we add a scale parameter directly to the random term it wonrsquot work out
as we expect since that way the scale parameter will scale the other two parameters
Lengthβ and SBβ as well as shown below
= ( )Length SBLength Length l SB SB l li Length l SB l lix x x x
β ββ β ε σ σ εσ σ
+ + sdot + + (45)
The right side equation is equivalent to Length Length l SB SB l lix xβ β ε+ + thus making no
difference So we choose to add a new random term including the scale parameter In
addition since we can get good estimate by assuming the random term proportional to
length we will keep this in the newly added random term Now the cost function is
specified as
1 ( ) + ( )l li li Length Length l SB SB l li li Length l Lengthc x x x x Mean xε ε β β ε η σ= + + sdot sdot 2
(46)
liε and liη follow the same truncated normal distribution but are drawn separately so that
they are not equal
In terms of the auxiliary model since now we have three parameters to be estimated in
the underlying model we need one more attribute in the logit model and number of links
in the path LNx is chosen The utility function of the logit model is actually the same as in
Section 641 which is
- - -ri Length Length r SB SB r LN LN r riU x x xθ θ θ ε= + (47)
63
With three parameters in the underlying model it is more reasonable to include
interactions of parameters in the binding function The binding functions take the form of
ɶ
1 2 3
4 5 6 7
( )
Length SB
Length SB Length SB Length SB
c d d d
d d d d
θ β β β σβ β β σ β σ β β σ
= + + +
+ + + + (48)
Since the estimates are not good we did not carry out too many trials to center the input
interval As a result the binding function may be of more interest in this case The chosen
interval is a trial one which is identical [0 3] for Lengthβ SBβ andσ We choose ten sets of
mβ and ɶ ( )m mθ β from one run as an example The values of ɶ ( )m mθ β are plotted against
Lengthβ SBβ andσ respectively The interactions are not shown in the figure yet we have
the estimates of binding function which will give a numerical description of how the
interactions impact theɶ ( )m mθ β
Figure 20 Plots of theta_length against beta_length beta_sb and sigma respectively
y = 09114x + 27818
Rsup2 = 07361
0
1
2
3
4
5
6
0 1 2 3 4
the
ta_
len
gth
beta_length
y = 03568x + 36215
Rsup2 = 00897
0
1
2
3
4
5
6
0 1 2 3 4
the
ta_
len
gth
beta_sb
y = 02572x + 38468
Rsup2 = 00516
0
1
2
3
4
5
6
0 1 2 3
the
ta_
len
gth
sigma
64
Figure 21 Plots of theta_sb against beta_length beta_sb and sigma respectively
y = 02363x + 0835
Rsup2 = 0088
0
05
1
15
2
25
3
0 1 2 3 4
the
ta_
sb
beta_length
y = 06351x + 01759
Rsup2 = 05054
0
05
1
15
2
25
3
0 1 2 3 4
the
ta_
sb
beta_sb
y = -03801x + 17212
Rsup2 = 02001
0
05
1
15
2
25
3
0 1 2 3
the
ta_
len
gth
sigma
y = 00477x + 04521
Rsup2 = 005460
02
04
06
08
1
0 1 2 3 4
the
ta_
ln
beta_length
y = -00553x + 06156
Rsup2 = 00582
0
02
04
06
08
1
0 1 2 3 4
the
ta_
ln
beta_sb
65
Figure 22 Plots of theta_ln against beta_length beta_sb and sigma respectively
As we can see from the three figures above ɶ Lengthθ ɶSBθ and ɶ LNθ are more affected by
Lengthβ SBβ andσ respectively Especially we can see a strong relationship between ɶ LNθ
and σ which assures that number of links can be used to infer the scale parameter in the
underlying model
The estimates of three binding functions are shown in Table 10 below with each row
representing the estimates for one of the three binding function and each column
representing certain variable in the binding function In the parenthesis below each
estimate of the coefficients is the t-test value with the null hypothesis of zero We take the
90 confidence interval and estimates with t-test value larger than 164 are supposed to
be significantly different from zero which are marked as bold
Table 10 Estimates of three binding functions
Constant Lengthβ SBβ σ
Length SBβ β
Lengthβ σ
SBβ σ Length SBβ β σ
ɶLengthθ
1814 (3085)
0861 (2417)
-0089 (-0258)
1038 (2913)
0202 (1030)
-0246 (-1240)
-0056 (-0292)
-0045 (-0412)
ɶSBθ 0284
(1482) -0125
(-1081) 0942
(8371) -0247
(-2127) 0118
(1856) 0070
(1086) -0141
(-2275) -0067
(-1883)
ɶLNθ 0819
(18643) 0015
(0577) -0026
(-0997) -0261
(-9794) 0006
(0419) 0007
(0498) 0024
(1663) -0007
(-0803)
As the constants indicate given no other attributes length and number of links have more
negative effects on the utility than the speed bump dummy does Judging from the
significance of coefficients for the three input parametersɶ Lengthθ ɶSBθ and ɶ LNθ are
significantly affected by Lengthβ SBβ andσ respectively As we can see σ has a negative
y = -02164x + 08218
Rsup2 = 09867
0
02
04
06
08
1
0 1 2 3th
eta
_ln
sigma
66
effect on ɶSBθ andɶ LNθ Since to some extent σ measures the scale of randomness we
could say that the more randomness of the costs on the links have the less influential of
presence of speed bump and number of links become ForɶSBθ it is significantly affected
by some of the interaction terms Notice that SBβ has positive effect onɶSBθ while σ has
effect The interaction terms including both σ and SBβ have negative effect onɶSBθ which
indicates that randomness of cost is more influential than presence of speed bump on the
disutility of speed bump
In terms of the final estimate as stated above the estimates of Lengthβ and SBβ have
negative signs whileσ has positive sign This result conflict our expectation that Lengthβ
and SBβ should have positive signs so we did not carry out more trials and shrinkage The
possible reason for negative estimate is similar to that in the model with exponential form
of cost function Given more attributes in the deterministic part of both the cost function
and utility function in the logit model we might be able to capture the features of the data
better and have the right sign in the final estimates
643 Monte Carlo evidence of model with estimated scale parameter for random
term
Based on the model formulation with estimated scale parameter for random term we also
carried out a Monte Carlo simulation experiment to verify the efficiency of using number
of links in the logti model to infer the scale parameter in the cost function and what we
do is to simulated observations instead of the true ones
We take three arbitrary values for the three parameters in the cost functionLengthβ SBβ and
σ to be 05 And simulated observations are generated based on the given values of
parameters in the cost function Since we know the true values for the parameters the
input domain is centered around the true values to be [04 06] for Lengthβ SBβ andσ
10K = runs are carried out to get statistics of the estimates of the three parameters
Within each run 10M = values are drawn for inputsLengthβ SBβ andσ respectively for
estimating binding function
67
In terms of the binding function by doing regression test we can see that the intersection
terms are unnecessary to be included or even hazardous for good estimate of binding
function so we decide to remove them and keep the binding function as
ɶ1 2 3( ) Length SBc d d dθ β β β σ= + + + (49)
We choose ten sets of mβ and ɶ ( )m mθ β from one run as an example The values of
ɶ ( )m mθ β are plotted againstLengthβ SBβ andσ respectively
Figure 23 Plots of theta_length against beta_length beta_sb and sigma respectively
y = 23826x + 14791
Rsup2 = 05326
15
2
25
3
35
04 05 06
the
ta_
len
gth
beta_length
y = -06434x + 30245
Rsup2 = 0048115
2
25
3
35
04 05 06
the
ta_
len
gth
beta_sb
y = 26255x + 14156
Rsup2 = 07607
15
2
25
3
35
04 05 06
the
ta_
len
gth
sigma
y = -02443x + 04708
Rsup2 = 0034
0
01
02
03
04
05
04 05 06
the
ta_
sb
beta_length
y = 11233x - 02096
Rsup2 = 089020
01
02
03
04
05
04 05 06
the
ta_
sb
beta_sb
68
Figure 24 Plots of theta_sb against beta_length beta_sb and sigma respectively
Figure 25 Plots of theta_ln against beta_length beta_sb and sigma respectively
The figures show similar trend to those in the trial model with estimated scale parameters
which is in line with our expectation
The estimates of three binding functions are shown in Table 11 below with each row
representing the estimates for one of the three binding function and each column
y = -04374x + 056
Rsup2 = 01283
0
01
02
03
04
05
04 05 06
the
ta_
sb
sigma
y = -01144x + 07619
Rsup2 = 01114066
067
068
069
07
071
072
073
074
04 05 06
the
ta_
ln
beta_length
y = 0053x + 06768
Rsup2 = 00296066
067
068
069
07
071
072
073
074
04 05 06
the
ta_
ln
beta_sb
y = -03115x + 08561
Rsup2 = 09717
066
067
068
069
07
071
072
073
074
04 05 06
the
ta_
ln
sigma
69
representing certain variable in the binding function In the parenthesis below each
estimate of the coefficients is the t-test value with the null hypothesis of zero We take the
95 confidence interval and estimates with t-test value larger than 196 are supposed to
be significantly different from zero which are marked as bold
Table 11 Estimates of three binding functions in the Monte Carlo experiment
Constant Lengthβ SBβ σ
ɶLengthθ 0853
(3606) 1009
(3724) -0034
(-0125) 2569
(9482)
ɶSBθ -0062
(-0385) -0104
(-0564) 1208
(6591) -0226
(-1227)
ɶLNθ 0854
(46688) 0013
(0624) -0004
(-0185) -0302
(-14428)
The estimates of binding function have similar characteristics as in the trial model with
estimated scale parameters as well They contain almost the same significant coefficients
and those significant estimates have the same signs as in the trial with true observations
Based on the estimated binding function and the simulated observations given true values
of the three parameters to be 05 the final estimates of Lengthβ SBβ andσ are shown in
Table 12 below
Table 12 Statistics of estimation of beta_length beta_sb and sigma in the Monte Carlo experiment
Parameter Lengthβ
SBβ σ
Mean 0404138359 0458624533 0639191487
Standard deviation 1109279424 0242570421 0377069799
As we can see the estimates of Lengthβ SBβ andσ are quite close to their true values What
is not satisfying is that the estimate of σ is a little large and lies outside the input domain
of [04 06] but is still quite near to this interval In addition the estimate of Lengthβ is
within the input domain yet the variation is large This is understandable since we scale
the random term by length together with the scale parameter and thus the parameter for
length could be influenced by the random term and turns out to have large variations In a
word the result of Monte Carlo experiment verifies that we get use the model
70
formulation with unfixed scale parameter for the random term to get the right estimate of
the true values And number of links is strongly related withσ which means that it is
reasonable and efficient to use it as a reference to σ in the cost function
71
7 Conclusions
This thesis aims at implementing the newly proposed route choice model based on
indirect inference in true observations The model assigns links specific errors for a
network which allows natural correlations among paths and is practical in simulating
observations by means of shortest path searching algorithms like the Dijkstrarsquos Algorithm
used in our experiment To get consistent estimation of this kind of model indirect
inference method is used and a simple model like logit model is used as an auxiliary
model The route choice model and indirect inference estimator has been tested on
synthetic data with simulated observations and proved to be capable of consistently
estimated
Compared to the synthetic experiment some extensions are done in this thesis By
replacing the simulated observations with the true observations the method is tested on
the empirical circumstance to prove that it could be used in solving practical problems
The true observations have more noises than the simulated ones thus more difficulty to
capture their features We know neither the right formulations of models based on the
data nor the values of parameters in the route choice model yet as defined the
parameters should have positive signs As it turned out to be in the experiment with only
length in the model we get the estimates of Lengthβ as 1337 while with two attributes in
the model we get the estimates of Lengthβ and SBβ as 0761 and 00799 respectively The
estimates in both experiments seem reasonable with the right sign In addition seen from
the estimation of the binding function the coefficients in the logit model is negatively
affected by the parameters they infer in the basic route choice model in the two attributes
case one parameter in the logit model is more apparently affected by the parameter it
refers than the other parameter in basic model
In the trial where we include a scale parameter to the random term and estimate it along
with the other parameters in the route choice model a Monte Carlo simulation
experiment is carried out using simulated observations The result shows that it is
efficient to use number of links in the auxiliary model to infer the scale parameter in the
basic rout choice model
72
In other trial formulations of the model we got negative estimates which may probably
be due to missing attributes in the cost function Future work should be done to include
more attributes
Another thing to recommend for future is that we generate the pseudo-universal choice
set as part of the auxiliary model Since the pseudo-universal choice set is partially used
for deciding which ODs and observations to be used in the project it is essential and
should be generated beforehand But from the choice set generation point of view we
could generate individual specific choice set directly instead of random drawing paths
from the pseudo-universal choice set This would increase computational efficiency
73
Bibliography
Axhausen K Schoumlnfelder S Wolf J Oliveira M amp Samaga U (2003) 80 Weeks of
GPS Traces Approaches to Enriching the Trip Information Transportation Research
Record 1870 46-54
Azevedo J Costa M Madeira J amp Martins E (1993) An Algorithm for the Ranking
of Shortest Paths European Journal of Operational Research 69 (1) 97-106
Bartels K Boztug Y amp Muumlller M (1999) Testing the Multinomial Logit Model
Working paper University Potsdam Germany
Bekhor S Ben-Akiva M amp Ramming M (2002) Adaptation of Logit Kernel to Route
Choice Situation Transportation Research Board of the National Academics 1805 78-85
Bekhor S Ben-Akiva M amp Ramming M (2006) Evaluation of Choice Set Generation
Algorithms for Route Choice Models Annals of Operations Research 114 (1) 235-247
Ben-Akiva M amp Bierlaire M (1999) Discrete Choice Methods and Their Applications
to Short Term Travel Decisions In Chapter for the Transport Science Handbook
Preliminary Draft
Ben-Akiva M amp Bierlaire M (2003) Discrete Choice Models with Applications to
Departure Time and Route Choice In Handbook of Transportation Science (second ed)
Kluwer
Ben-Akiva M amp Bolduc D (1996) Multinomial Probit with a Logit Kernel and a
General Parametric Specification of the Covariance Structure Working Paper
Ben-Akiva M amp Lerman S (1985) Discrete Choice Analysis Theory and Application
to Travel Demand MIT Press
Ben-Akiva M Bergman M Daly A amp Ramaswamy R (1984) Modeling Inter Urban
Route Choice Behaviour In J Vollmuller amp R Hamerslag (Ed) the 9th International
Symposium on Transportation and Traffic Theory (pp 299-330) Utrecht Netherlands
VNU Science Press
Cascetta E Nuzzolo A Russo F amp Vitetta A (1996) A Modified Logit Route Choice
Model Overcoming Path Overlapping ProblemsSpecification and Some Calibration
Results for Interurban Networks In J Lesort (Ed) the 13th International Symposium on
Transportation and Traffic Theory Lyon France
74
Creel M (2009) A Data Mining Approach to Indirect Inference Universitat Autonoma
de Barcelona Department of Economics and Economic History
De La Barra T Peacuterez B amp Anez J (1993) Multidimensional Path Search and
Assignment 21st PTRC Summer Meeting (pp 307-319)
Dijkstra E (1959) A note on two problems in connexion with graphs Numerische
Mathematik 1 269-271
Frejinger E amp Bierlaire M (2007) Capturing Correlation with Subnetworks in Route
Choice Models Transportation Research Part B 41 363-378
Frejinger E Bierlaire M amp Ben-Akiva M (2009) Sampling of Alternatives for Route
Choice Modeling Transportation Research Part B Methodological 43 (10) 984-994
Gallant A amp McCulloch R (2004) On the Determination of General Scientific Models
Manuscript Duke University
Gourieacuteroux C Monfort A amp Renault E (1993) Indirect Inference Journal of Applied
Econometrics 8 85-118
Karlstroumlm A Sundberg M amp Wang Q (2011) Consistently estimating flexible route
choice models using an MNL lense International Choice Modeling Conference Leeds
Keane M amp Smith A (2003) Generalized Indirect Inference for Discrete Choice
Models Manuscript Yale University
Manski C amp Lerman S (1977) The Estimation of Choice Probabilities from Choice
Based Samples Econometrica 45 (8) 1977-1988
McFadden D (1974) Conditional Logit Analysis of Qualitative Choice Behaviour (P
Zarembka Ed) Frontiers in Econometrics 105-142
McFadden D (1978) Modeling the Choice of Residential Location In A Karlqvist L
Lundqvist F Snickars amp J Weibull (Ed) Spatial Interaction Theory and Residential
Location (pp 75-96) Amsterdam North-Holland
McFadden D amp Train K (2000) Mixed MNL Models for Discrete Response Journal
of Applied Econometrics
Nerella S amp Bhat C (2004) Numerical Analysis of Effect of Sampling of Alternatives
in Discrete Choice Models Transportation Research Record 1894 11-19
Ramming M (2001) Network Knowledge and Route Choice PhD Thesis Massachusetts
Institute of Technology
75
Schoumlnfelder S amp Samaga U (2003) Where Do You Want to Go Today-More
Observations on Daily Mobility Third Swiss Transport Research Conference Ascona
Schoumlnfelder S Axhausen K Antille N amp Bierlaire M (2002) Exploring the
Potentials of Automatically Collected GPS Data for Travel Behaviour Analysis- A
Swedish Data Source i J Moumlltgen amp A Wytzisk (Red) GI-Technologien fuumlr Verkehr
und Logistik number 13 Institut fuumlr Geoinformatik Universitaumlt Muumlnster (ss 155-179)
Munster IfGIprints
Smith A (1993) Estimating Nonlinear Time-series Models Using Simulated Vector
Autoregressions Journal of Applied Econometrics 8 63-84
Smith A (2008) Indirect Inference In S Durlauf amp L Blume (Eds) The New
Palgrave Dictionary of Economics (Second ed) Palgrave Macmillan
Smith A (1990) Three Essays on the Solution and Estimation of Dynamic
Macroeconomic Models PhD Dissertation Duke University
Train K (2003) Discrete Choice Methods with Simulation Cambridge University Press
Vovsha P amp Bekhor S (1998) Link-nested Logit Model of Route Choice-Overcoming
Route Overlapping Problem Transportation Research Record 1645 133-142
Wang H (2011) Logistics Distribution Shortest Path Based on Dijkstra Algorithm
Computer and Digital Engineering 3
Assigned publication number
TSC-MT 11-016
wwwkthse

11
2 Literature Review
Route choice modeling has long been discussed and many efforts have been made to
solve this problem Simple and easy to estimate the multinomial logit model (MNL) is
widely used in choice modeling yet it has certain restrictions to be implemented in route
choice context Due to its inherent property of Independence from Irrelevant Alternatives
(IIA) the multinomial logit model is not easily applicable since routes in the choice set
tend to be correlated with the presence of overlapping paths Cascetta et al (1996)
proposed a correction term called Commonality Factor (CF) in the deterministic part of
the utility function2 And the probability of path i to be chosen from the choice set nC
becomes( )
( )( | )in in
jn jn
n
V CF
n V CF
j C
eP i C
e
micro
micro
minus
minus
isin
=sum
As proposed by Cascetta et al the Commonality
Factor is specified as ln ( )n
ijin CF
j C i j
LCF
L Lγβ
isin
= sum in which ijL is the length of links
common to path i and pathj while iL and jL are the total length of path i and pathj
respectively The parameter γ is left to be estimated or practically constrained to a fixed
value like 1 or 2 The CF term of one path is proportional to the length of overlapping
part with other paths This proposed model is referred to as C-Logit model Bearing some
similarities Ben-Akiva and Bierlaire (1999) proposed the Path Size Logit (PSL) model3
This model is based on a different theoretical basis as the C-Logit The original
formulation of Path Size (PS) comes from the discrete choice theory of aggregate
alternatives Similar to the CF in C-Logit the log of Path Size (PS) is added to the utility
function The probability of path i to be chosen from the choice set nC becomes
( ln )
( ln )( | )in in
jn jn
n
V PS
n V PS
j C
eP i C
e
micro
micro
+
+
isin
=sum
The Path Size is specified as
1
i n
n
ain
a Ciaj
j C j
lPS
LL
LδisinΓ
isin
= sumsum
in
2 Cascetta E Nuzzolo A Russo F amp Vitetta A (1996) A Modified Logit Route Choice Model Overcoming Path Overlapping ProblemsSpecification and Some Calibration Results for Interurban Networks In J Lesort (Ed) the 13th International Symposium on Transportation and Traffic Theory Lyon France 3 Ben-Akiva M amp Bierlaire M (1999) Discrete Choice Methods and Their Applications to Short Term Travel Decisions In Chapter for the Transport Science Handbook Preliminary Draft
12
which iΓ is the set of links in pathi al and iL are the length of link a and pathi
respectively ajδ is the link incidence variable with value of 1 when link abelongs to path
j and zero otherwise And nCL is the shortest path in choice setnC The size of a path has
a maximum value of one when it shares no links with other paths
C-Logit model and PSL model are the most widely used models in practice of route
choice modeling due to their simple forms Since both of them originate from the MNL
model and maintain the basic MNL structure they can be estimated by existing software
designed for logit models Apart from these two types of models there are other recent
efforts in the route choice context
Bekhor Ben-Akiva and Ramming (2002) adapted the Logit Kernel model to apply in a
route choice context4 The Logit Kernel5 model was proposed by combing Gaussian and
Type I Extreme Value error terms by researchers such as Ben-Akiva and Bolduc (1996)
and McFadden and Train (2000) who also referred to it as Mixed Logit6 By making
certain assumptions under route choice context Bekhor Ben-Akiva and Ramming (2002)
proposed a way to apply the model to route choice modeling7 Based on the data from
Boston several kinds of models are estimated including multinomial logit model Path
Size Logit and the newly proposed Logit Kernel model Seen from the estimation results
Logit Kernel has a better overall performance than the other two kinds of models This
result needs to be verified in other data sets since the one used in the paper has a
relatively small size
Frejinger and Bierlaire (2007) proposed an approach to capture correlation among
alternative routes with subnetworks and carried out estimation based on several kinds of
route choice models8 The paper gives an overview of the latest development of route
choice modeling and discusses the Path Size Logit model in detail As part of the
4 Bekhor S Ben-Akiva M amp Ramming M (2002) Adaptation of Logit Kernel to Route Choice Situation Transportation Research Board of the National Academics 1805 78-85 5 Ben-Akiva M amp Bolduc D (1996) Multinomial Probit with a Logit Kernel and a General Parametric Specification of the Covariance Structure Working Paper 6 McFadden D amp Train K (2000) Mixed MNL Models for Discrete Response Journal of Applied Econometrics 7 Bekhor S Ben-Akiva M amp Ramming M (2002) Adaptation of Logit Kernel to Route Choice Situation 8 Frejinger E amp Bierlaire M (2007) Capturing Correlation with Subnetworks in Route Choice Models Transportation Research Part B 41 363-378
13
conclusion a behavioral interpretation of the Path Size in the model is given The
subnetwork is defined so that the alternative routes sharing the same section of it are
seen as correlated This correlation is captured using the Error Component model and
estimation results show that this new approach gives better property than PSL models To
complement the paper uses a real size network and true travel data is collected which is
the same network we are going to use in this thesis project Additionally the paper
displays forecasting results which indicates that models with Path Size component tend
to have bad performance in prediction
Ben-Akiva and Bierlaire (2003) pointed out that under route choice context the
significant correlation among alternatives due to path overlapping and the generation of
choice set are two important issues and main difficulties9
There are some algorithms used in practice for generating choice set for route choice
modeling both deterministic methods and stochastic ones The deterministic methods
tend to give the same set of paths for a given OD pair Some examples are the link
penalty algorithm (De La Barra Peacuterez amp Anez 1993) which increases gradually the
impedance of all the links on the shortest path10 the link elimination algorithm (Azevedo
Costa Madeira amp Martins 1993) which removes links on the shortest path in sequence
to generate new paths11 and the labeled paths (Ben-Akiva Bergman Daly amp
Ramaswamy 1984)12 In terms of the stochastic methods they tend to produce individual
specific choice set One example is the simulation method (Ramming 2001) which
generates alternative paths by drawing link impedances from different distribution
densities13
When it comes to appraisal of the generated choice set some literatures give evaluations
on the efficiency of different sampling algorithms for choice set generation (See Bekhor
9 Ben-Akiva M amp Bierlaire M (2003) Discrete Choice Models with Applications to Departure Time and Route Choice In Handbook of Transportation Science (second ed) Kluwer 10 De La Barra T Peacuterez B amp Anez J (1993) Multidimensional Path Search and Assignment 21st PTRC Summer Meeting (pp 307-319) 11 Azevedo J Costa M Madeira J amp Martins E (1993) An Algorithm for the Ranking of Shortest Paths European Journal of Operational Research 69 (1) 97-106 12 Ben-Akiva M Bergman M Daly A amp Ramaswamy R (1984) Modeling Inter Urban Route Choice Behaviour In J Vollmuller amp R Hamerslag (Ed) the 9th International Symposium on Transportation and Traffic Theory (pp 299-330) Utrecht Netherlands VNU Science Press 13 Ramming M (2001) Network Knowledge and Route Choice PhD Thesis Massachusetts Institute of Technology
14
Ben-Akiva amp Ramming 2006 for example) Apart from this there are some recently
proposed methods for sampling alternatives under route choice context (See Frejinger
Bierlaire amp Ben-Akiva 2009 for example)
Nerella and Bhat (2004) carried out a numerical analysis on the effect of sample size on
the efficiency of the estimation of parameters14 The analysis is done for two kinds of
discrete choice models namely the multinomial logit model for which consistency of
estimation based on subset of alternatives is theoretically proved and non-MNL model
taking mixed multinomial logit model as an example Four evaluation criteria are chosen
namely the ability to recover model parameters ability to estimate overall log-likelihood
function value ability to estimate individual choice probabilities and ability to estimate
aggregate shares of alternatives The results show that the MNL model works well on
small sample size yet certain portion of full choice set need to be kept as a practical
baseline For the non-MNL model small sample size gives poor estimation and increase
of sample size gives obvious increase of estimation quality Certain portion of full choice
set is suggested for practical convenience yet the generalization of sample size portion is
not feasible since difference kinds of models may require different portion to guarantee
accuracy In general for the non-MNL models full choice set is suggested to be used if
feasible and larger sample gives better estimation
Bekhor Ben-Akiva and Ramming (2006) carried out route choice modeling based on a
large-scale urban network including both choice set generation part and route choice
estimation part which compose the process of route choice modeling together15 Given
that previous literatures did not pay too much attention to empirical estimation the paper
used a true observation data set collected in Boston As the first step several choice set
generation algorithms are listed and compared in their efficiency of reproducing the
observed paths on which the evaluation of the algorithms are based The data in Boston
is described in the paper and used in the second step ie model estimation Several route
choice models are presented and estimation results based on different kinds of models are
shown for comparison of the efficiency of the models The Path Size Logit model is
14 Nerella S amp Bhat C (2004) Numerical Analysis of Effect of Sampling of Alternatives in Discrete Choice Models Transportation Research Record 1894 11-19 15 Bekhor S Ben-Akiva M amp Ramming M (2006) Evaluation of Choice Set Generation Algorithms for Route Choice Models Annals of Operations Research 114 (1) 235-247
15
proposed for its property to overcoming the drawbacks of the conventional MNL models
This type of model can be easily estimated using popularized software The main
conclusion is that route choice models could be estimated for large-scale networks based
on the true observation data and prominent computing resources
Frejinger Bierlaire and Ben-Akiva (2009) proposed a paradigm for choice set generation
based on sampling for route choice modeling16 In the context of route choice modeling
the universal choice set which denotes all possible alternatives for a traveler to choose
from is not able to be enumerated So we practically work on a sampled choice set from
the universal one which may easily introduce bias to the final estimate In this paradigm
they focus on unbiased estimation of parameters instead of generating actual choice set
The path generation is seen as an importance sampling approach and a correction of
sampling is added to the path utility Since the following estimation process is based on
the sampled choice set which is treated as the universal one a correction for sampling is
added to the path size attribute in the commonly used path size logit (PSL) model ending
up with the expanded path size Modification in the previous two steps guarantees
unbiased estimation of the parameters Numerical results based on synthetic data are
presented in the paper to reveal that models with a sampling correction in the path utility
are better than those without it The proposed expanded path size logit model provides
unbiased estimation and is better than the original path size models
In this paper we will examine indirect inference Indirect inference is not a new method
it was first introduced by Smith (1990 1993)17 Then Gourieacuteroux et al (1993) gave
overall introduction to the methods and extended it in important ways18 Gallant and
McCulloch (2004) transferred the idea of indirect inference and used it for Bayesian
inference in models where likelihood function is intractable19
16 Frejinger E Bierlaire M amp Ben-Akiva M (2009) Sampling of Alternatives for Route Choice Modeling Transportation Research Part B Methodological 43 (10) 984-994 17 Smith A (1990) Three Essays on the Solution and Estimation of Dynamic Macroeconomic Models PhD Dissertation Duke University Smith A (1993) Estimating Nonlinear Time-series Models Using Simulated Vector Autoregressions Journal of Applied Econometrics 8 63-84 18 Gourieacuteroux C Monfort A amp Renault E (1993) Indirect Inference Journal of Applied Econometrics 8 85-118 19 Gallant A amp McCulloch R (2004) On the Determination of General Scientific Models Manuscript Duke University
16
Gourieacuteroux Monfort and Renault (1993) proposed the inference methods based on an
ldquoincorrectrdquo criterion which does not give consistent estimation to parameters of interest
directly20 The argument of the criterion is called the auxiliary parameter which may
have a larger dimension than the parameters of interest in the basic model After the
auxiliary parameters are selected a simulation-based process is carried out to get a
consistent and asymptotically normal estimator of parameters of interest As a simulation-
based method the only requirement for the basic model is that it could be simulated
regardless of formulations of the model So it could be used for estimating models which
are too complex to carry out direct approaches The paper shows how this kind of method
can be applied in fields such as micro-econometrics macro-econometrics and
econometrics of finance
Keane and Smith (2003) proposed a generalized form of the indirect inference method to
be implemented in the discrete choice model context21 Theoretically indirect inference
could deal with estimation of any economic models yet it has some limitations per se that
decrease the estimation efficiency or even make it difficult to implement Problems arise
when we use indirect inference in estimating discrete choice models since the objective
function the metric of distance between the auxiliary models estimated on observed data
and simulated data to be specific is inherently discrete which leaves the gradient-based
optimization methods infeasible Keane and Smith (2003) proposed that the estimation
procedures used for observed data and simulated data can be different22 Instead of the
discrete choice a continuous function of latent utilities including a smoothing parameter
is used as the dependent variable in the auxiliary model When the smoothing parameter
goes to zero the function of latent utilities converges to the discrete choices this way to
guarantee consistency According to the Monte Carlo results the generalized indirect
inference method proposed in this paper yields good estimates in small samples being as
efficient as maximum likelihood estimates in comparison
20 Gourieacuteroux C Monfort A amp Renault E (1993) Indirect Inference 21 Keane M amp Smith A (2003) Generalized Indirect Inference for Discrete Choice Models Manuscript Yale University 22 Keane M amp Smith A (2003) Generalized Indirect Inference for Discrete Choice Models
17
Creel (2009) presented a data mining approach to indirect inference23 which is similar to
the regular indirect inference method yet with certain advantages over it The method is a
simulation-based estimator relying also on an auxiliary model In line with the indirect
inference method an underlying economic model with parameterβ is referenced by an
auxiliary model with parameterθ Certain values of the parameter hβ in underlying
economic model are drawn randomly from a known density simulated data is generated
using Monte Carlo methods to estimate ɶh
θ of auxiliary model which ends up with a set
of tuples ɶ( )hhβ θ Nonparametric methods are used to get the function ɶ( | )E aβ θ = and
the final estimate of β is supposed to be the result of regression function evaluated at the
estimate of θ based on true observations ɶ ɵ( | )Eβ β θ θ= = Creel (2009) also presented a
way of calculating confidence intervals24 Monte Carlo results in dynamic and nonlinear
panel models and vector autoregressions show good performance of the new estimator
23 Creel M (2009) A Data Mining Approach to Indirect Inference Universitat Autonoma de Barcelona Department of Economics and Economic History 24 Creel M (2009) A Data Mining Approach to Indirect Inference
18
3 Methodology
31 Multinomial Logit Model (MNL)
311 Model Description
Route choice modeling is somewhat complicated when we want to capture the attributes
of both the alternative routes and choice maker accurately and reflect the choice making
process in the model Intuitively route choice can be regarded as choosing one specific
route from several alternative routes which coincides with the prerequisites of discrete
choice models Actually a lot of literatures have explored the route choice modeling and
possible improvements based on discrete choice models (see Cascetta et al 1996 Vovsha
and Bekhor 1998 Ben-Akiva and Bierlaire 1999 for more information on development
in route choice models with regard to discrete choice models)25
To understand the frontier development of route choice model we have got to know the
discrete choice models among which multinomial logit model (MNL) is the most widely
used In addition we choose to implement a new method ndash indirect inference in which
MNL is used as it is
Logit model is the most widely used discrete choice model till now due to its excellent
qualities in model specification To be specific the choice probability takes a closed form
which is easy to estimate and interpret (Train 2003)26
The multinomial logit model is a kind of choice model with more than two alternatives in
the choice set We assume that the choice maker makes his or her decision based on the
utility maximization rule (Ben-Akiva amp Lerman 1985)27 With regard to the utility njU
the decision maker n obtains from the thj alternative in the choice set it is made up of
two parts the deterministic part and the stochastic part The deterministic part denoted
25 Cascetta E Nuzzolo A Russo F amp Vitetta A (1996) A Modified Logit Route Choice Model Overcoming Path Overlapping ProblemsSpecification and Some Calibration Results for Interurban Networks Vovsha P amp Bekhor S (1998) Link-nested Logit Model of Route Choice-Overcoming Route Overlapping Problem Transportation Research Record 1645 133-142 Ben-Akiva M amp Bierlaire M (1999) Discrete Choice Methods and Their Applications to Short Term Travel Decisions 26 Train K (2003) Discrete Choice Methods with Simulation Cambridge University Press 27 Ben-Akiva M amp Lerman S (1985) Discrete Choice Analysis Theory and Application to Travel Demand MIT Press
19
by njV contains attributes known by the modelers while the stochastic part denoted by
njε is the attributes affecting peoplersquos the decision which cannot be observed by the
modelers yet are known by the decision makers themselves So the utility function turns
out to be
nj nj njU V jε= + forall (1)
The type of choice model is basically decided by the distribution of the stochastic part
When we assume that njε is independently identically Gumbel distributed the model
becomes a logit model
As stated above the decision follows utility maximization rule which means that the
decision maker n chooses the alternative with the highest utility say the thi alternative
Use as the probability the thi alternative is chosen over the others we have
( max ) ( )
( )
( )
ni ni nj ni njj C
ni ni nj nj
nj ni ni nj
P P U U P U U j i
P V V j i
P V V j i
ε εε ε
isin= = = ge forall ne
= + gt + forall ne
= minus lt minus forall ne (2)
With Equation (2) above and the assumption that njε follows iid Gumbel distribution we
could derive the probability of decision maker n chooses alternativei which is
ni
nj
V
ni V
j
eP
e=sum
(3)
Typically we specify the deterministic part of the utility function in a linear form which
is nj njV xβ= Then the probability becomes
ni
nj
x
ni x
j
eP
e
β
β=sum
(4)
This is the most common form of probability function for multinomial logit models
There are some good properties for this kind of logit probability as discussed by Train
(2009)28 With this form the probability of choosing certain alternative will be between
zero and one inherently which is basically required for probability definition Yet the
28 Train K (2003) Discrete Choice Methods with Simulation
20
value of niP will never drop to zero mathematically which means that all the alternatives
in the choice set are perceived to have chance to be chosen On the other hand if an
alternative is perceived never to be chosen it should not be included in the choice set at
all
The probabilities for all the alternatives in the choice set sums to be one which is easily
illustrated from the analytical properties 1 1 1
( ) 1njni
J J JVV
nii i j
P e e= = =
= =sum sum sum in which J denotes
the number of alternatives in the choice set
The logit probability and the deterministic part of the utility function follow an S-shaped
curve line shown in Figure 1 below
Figure 1 S-shaped relationship between probability and deterministic part of utility
This property gives implications for possible impacts of the deterministic utility of certain
alternative on its chances to be chosen We could see that when an alternative has about
50 probability to be chosen which infers to the steepest part on the curve a small
change in the deterministic part of the utility function could lead to a large change in the
probability the alternative has to be chosen
Apart from the nice properties of logit probability logit models have some disadvantages
as well (Bartels Boztug amp Muumlller 1999)29 One shortcoming is the assumption of
29 Bartels K Boztug Y amp Muumlller M (1999) Testing the Multinomial Logit Model Working paper University Potsdam Germany
21
Gumbel distribution of error terms in the utility function The inherent requirement for
iid property sets restrictions for logit model to be widely used especially in route choice
modeling context Several models have been proposed to overcome this shortcoming in
particular modifications based on MNL to adjust it to route choice practices have been
proposed Another drawback is the assumption of the linear composition for the
deterministic part of utility function Actually this assumption is for ease of following
estimation process since McFadden (1974) demonstrated that under this condition the
probabilities will be universally concave with regard to the coefficientsβ 30 which
improves the performance of numerical estimation Yet there could be nonlinear
compositions in the deterministic part to relax the restriction Under this condition the
universal concavity cannot be guaranteed which may lead to local convergence in the
estimation process
312 Model Estimation
The most commonly used numerical estimation method for multinomial logit models is
the Maximum Likelihood Estimation (MLE) In principle given a set of data and the
underlying probability model the method tries to find coefficients of the probability
model with which produced data has a distribution most likely resembles the distribution
of the observed data
Consider the case that N decision makers with their choice data are obtained Parameters
to be estimated are the coefficients in the utility function denoted byβ We could then
use the MLE to try to get the values of β vector with which the probability that choice
maker choose their observed alternatives is maximized
The probability of choice maker n to choose his or her observed alternative can be
written as
( ) niyni
i
Pprod (5)
in which niy is a dummy with value 1 if choice maker choose alternative i and value 0
otherwise
30 McFadden D (1974) Conditional Logit Analysis of Qualitative Choice Behaviour (P Zarembka Ed) Frontiers in Econometrics 105-142
22
Choice makers choose their alternative independently from each other so the probability
of all sampled choice makers choose their observed alternative is
1
( ) ( ) ni
Ny
nin i
L Pβ=
= prodprod (6)
This is the likelihood function with regard to the parameters to be estimated β in this
case We can take the logarithm of it to get the log-likelihood function
1
( ) lnN
ni nin i
LL y Pβ=
=sumsum (7)
Since we aim at getting the value of β to make the log-likelihood function maximized
we can take the derivative of it with respect to β and set it to zero
( )
0dLL
d
ββ
= (8)
By solving this equation we could get the estimate of β
32 Dijkstrarsquos Algorithm
321 Introduction
A method is needed for generating feasible alternatives and compose the choice set as
well as for deriving simulated observations for each OD pair in the process of indirect
inference As for choice set generation we would like to include certain number of high
ranking shortest paths in the choice set since these paths tend to have more possibility to
be chosen Similar to this the simulated observation is generated as the shortest path
between each OD pair We implement a method for shortest path finding which is the
Dijkstrarsquos Algorithm
Dijkstrarsquos Algorithm is named after the Dutch computer scientist Edsger Dijkstra who
conceived this method in 1956 and got it published in 195931 This is a graph search
algorithm aiming at solving shortest path problem for a graph the edge cost of which is
defined nonnegative The outcome of it is a shortest path tree demonstrating the path with
lowest value with respect to the defined cost
31 Dijkstra E (1959) A note on two problems in connexion with graphs Numerische Mathematik 1 269-271
23
This algorithm deals with single-source problem To be specific given one source node in
the graph the algorithm will give paths with the lowest value with regard to cost from
this source node to every other node in the network Given certain criterion we could use
the algorithm to find shortest path between two specific nodes by setting one node as the
source and the other as the target
After released it is widely used in path searching problems especially in transportation
related practices Routing problem is considered in investigation on traffic assignment
and optimization in logistics Real sized road network could be perceived as a graph with
vertices and edges in which cities can be abstracted as the vertices in the graph and the
roads connecting cities can then be regarded as the edges With the aid of Dijkstrarsquos
Algorithm the shortest path with respect to cost could be found from certain city to the
other cities The outcome is valuable for logistics corporations to work out their region-
wide distribution plans32
322 Algorithm
We connect a ldquodistancerdquo value with all the vertices in the graph indicating its distance
from the source vertex To be accurate the ldquodistancerdquo could be actual length of edges or
the generalized cost on the edges or anything desired The source vertex is defined as the
initial node with a value of zero In the process Dijkstrarsquos Algorithm will assign values
to vertices detected in one loop and update the values in the following loops till a
minimum value is found for each vertex The steps for searching and updating are
presented below
1 Initialize the network and assign the distance values of vertices other than the initial
node as infinity
2 When one vertex is to be detected it is denoted as current node All the vertices that
have been detected and attained the minimum distance values will be marked as detected
and will not be detected in the following loops while the vertices remaining unvisited
will be marked undetected To initialize all the vertices are marked undetected and the
initial node is set as current node
32 Wang H (2011) Logistics Distribution Shortest Path Based on Dijkstra Algorithm Computer and Digital Engineering 3
24
3 For current node all its directly connected adjacent nodes are considered except for
the newly detected vertex Labeled distance values of the neighbor vertices will be
updated if the calculated values from current node are smaller than their current values
For example current node A has a distance value of 4 and one of its neighbors B has a
value of 8 The edge linking A and B has a distance of 2 The newly calculated distance
value for B will be 4+2=6 which is smaller than 8 So the labeled distance value for B
will be updated to 6 indicating that the minimum distance from the source vertex to B till
now is 6 and the path should pass A
4 When all the neighbors of the current node are considered and updated mark the
current node as detected And mark the undetected node with the lowest distance value as
the current node and do the detection in step 3 again
5 When all the vertices in the network are marked detected the algorithm is finished and
we get the minimum distance from the source to all the other vertices The shortest path
from the source to a specific vertex could be found out following the detecting process
As mentioned above the stop criterion could also be modified as we desired If we aim at
finding the shortest path between two vertices at the beginning one vertex should be set
as the initial node and the algorithm could be stopped once the other vertex is marked as
detected
323 Explanatory Example
Here is a simple network to illustrate the mechanism of Dijstrarsquos Algorithm There are
five vertices and six edges with distance values labeled beside We define A as the source
and set it the initial node
Figure 2 A simple network for Dijstrrarsquoa Algorithm explanation
25
Initialization
Initial node A
Detected null
Distance value A=0 B=C=D=E=+infin
Loop 1
Current node A
Adjacent vertices B C
Detected null
Distance value A=0 B=4 C=1 D=E=+infin
Loop 2
Current node C
Adjacent vertices B D
Detected A
Distance value A=0 C=1 B=min 4 C+2 =3 D=C+3=4 E=+infin
Loop 3
Current node B
Adjacent vertices E
Detected A C
Distance value A=0 C=1 B=3 D=4 E=B+3=6
Loop 4
Current node E
Adjacent vertices null
Detected A B C D
Distance value A=0 C=1 B=3 D=4 E=6
If we want to get the shortest path from A to E following the detecting process we could
know that it should be A-C-B-E
26
324 Discussion
Dijkstrarsquos Algorithm has a clear logical structure which makes it easy to understand as
well as to implement in programming Nonetheless this method cannot search directly
from one node towards the other to find the shortest path between the two It works more
like detecting all the adjacent nodes in terms of shortest paths and expands from the
source iteratively until the target node is included and that is when we could figure out
the shortest path between the two specific vertices This reveals the fact that the method
wastes a lot of time in the blind search leaving it inefficient In addition this method is
not able to deal with networks with negative edge values yet this is not a problem in our
research since link cost on our network is defined nonnegative
33 Indirect Inference
331 Introduction
For problems in route choice context choice set size may be way too large to enumerate
all the alternatives Yet estimation based on sampled choice set may introduce biases
which can be corrected in some special cases (see Frejinger Bierlaire amp Ben-Akiva
2009)33 While in cases where estimation models are not based on MNL say multinomial
probit model we could not find corrections for biases caused by sampled choice set
Estimator based on the principle of indirect inference is then introduced to overcome
inconsistency problem34
Indirect inference35 is a simulation-based method for estimating parameters in economic
models by making references to the parameters of interest (Smith 2008) It is motivated
when general statistical estimation method such as Maximum Likelihood is intractable or
as discussed above consistent estimation is required given that only sampled choice set is
available Since in economic analysis we tend to build models which guarantee scientific
logic and inclusion of necessary attributes quite often the models will end up
33 Frejinger E Bierlaire M amp Ben-Akiva M (2009) Sampling of Alternatives for Route Choice Modeling 34 Karlstroumlm A Sundberg M amp Wang Q (2011) Consistently estimating flexible route choice models using an MNL lense 35 Smith A (2008) Indirect Inference In S Durlauf amp L Blume (Eds) The New Palgrave Dictionary of Economics (Second ed) Palgrave Macmillan
27
complicated from statistical estimation point of view This in sequence spurs the wide use
of indirect inference in economic analysis
It is common character that simulation-based methods allows modelers to simulate data
from the economic model of interest given certain perceived values of the parameters to
be estimated Since to generate data is essential and simple the true challenge is how to
estimate coefficients Indirect inference uses an auxiliary model which gives a rich
description of the covariance patterns in the data by including certain variables from the
basic economic model On the other hand the auxiliary model does not need to reflect
accurately the data generating process since it is supposed to be estimated based on the
data derived not to generate data itself The basic function of the auxiliary model is that
it provides a criterion to compare observed data and simulated data from the basic
economics model
We do iterations with the aim of finding the parameters of the basic economic model so
the observed data and the simulated data from the basic model looks almost the same by
the criterion of auxiliary model To be specific the auxiliary model is estimated based on
both observed data and simulated data we choose parameters for the basic model to
make sure that the two estimator of auxiliary model are as close as possible Based on
this idea the auxiliary model should be easy to estimate
332 Definition of the method
We define an economic model with the form of
( ) 12t t ty G x t Tε β= = (9)
in which 1 Tt tx = is a sequence of observed exogenous variables 1 T
t ty = is a sequence of
observed endogenous variables and 1 Tt tε = is a sequence of unobserved random error
terms β is a k -dimensional coefficient vector of the exogenous variables (Smith
2008)36
This model generally describes a relation that ty is dependent ontx with some random
errors Given the distribution of the random errors we could get the probability density
36 Smith A (2008) Indirect Inference
28
function of ty conditional on tx We will not focus on this density and instead this model
is only used for simulating data in indirect inference
In terms of the auxiliary model it could be defined by a probability density function with
the form of
( | )t tf y x θ (10)
in which θ is a p -dimensional coefficient vector and p is supposed to be not smaller
than k since we should capture characteristics of all the parameters in the underlying
economic model In addition the auxiliary model needs not be defined to reproduce the
distribution of ty in the basic model yet it needs to have a convenient analytical format
Based on the observed data we could estimate the parameters in the auxiliary model
using Maximum Likelihood Method
ɵ
1
arg max log ( | )T
t tt
f y xθ
θ θ=
= sum (11)
The estimated coefficient vectorɵθ could be used as an indicator of certain features of the
observed data
On the other hand the auxiliary model can be estimated based on simulated data from the
basic model as well We need to draw a sequence of random error terms 1 m Tt tε = from the
defined distribution in which m denotes the number of simulation with an interval of [1
M ] generally Given a coefficient vectorβ we could generate the values of endogenous
variables ɶ 1 ( )m T
tty β = which are explicitly dependent onβ With the help of Maximum
Likelihood Method we could get
ɶ ɶ
1 1
( ) arg max log ( ( ) | )M T m
ttm t
f y xθ
θ β β θ= =
= sumsum (12)
According to the principle of indirect inference we try to find the values of β to make
ɶ( )θ β as close toɵθ as possible Practically we need a metric to measure the distance
between ɵθ andɶ( )θ β and by minimizing the distance we could find out the estimates of
β in the basic economic model
29
333 Choices of the metrics
As mentioned above we need a metric to measure the distance betweenɵθ andɶ( )θ β
There are three approaches corresponding to the three classical hypothesis tests namely
Wald likelihood ratio (LR) and Lagrange multiplier (LM)37
In the Wald approach we try to minimize a quadratic form in the difference between the
two estimators ofɵθ andɶ( )θ β which is
ɵ ɶ ɵ ɶarg min( ( )) ( ( ))Wald
Wβ
β θ θ β θ θ β= minus minus (13)
in which W is a positive definite ldquoweightingrdquo matrix
In the LR approach a metric is formed based on the likelihood function related to the
auxiliary model which is
ɵ ɶ
1 1
arg min( log ( | ) log ( | ( )))T TLR
t t t tt t
f y x f y xβ
β θ θ β= =
= minussum sum (14)
According to the definition ofɵθ the first part of the objective function before the minus
sign on the right-hand side is always larger than the second part after the minus sign And
the first part is not dependent onβ
To minimize the objective function is equivalent to maximizing the log-likelihood
function withɶ( )θ β that is
ɶ
1
arg max( log ( | ( )))TLR
t tt
f y xβ
β θ β=
= sum (15)
In the LM approach the metric is formed using the derivative of the log-likelihood
function related to the auxiliary model which is
arg min ( ) ( )LM
S VSβ
β β β= (16)
in which
ɶ ɵ
1 1
( ) log ( ( ) | )M T m
ttm t
S f y xβ β θθ= =
part=partsumsum
(17)
and V is a positive definite matrix
37 Smith A (2008) Indirect Inference
30
By using any of the approaches we aim at getting the minimized distance betweenɵθ and
ɶ( )θ β so the value will approach to zero as expected So the hypothesis test of the
minimized value could be used as an indicator of whether the auxiliary model is suitably
specified In other words the minimized value being significantly different from zero
indicates a bad specification of the auxiliary model
In comparison the LM approach has an advantage over the others in computation when
it is relatively time-consuming to estimate the auxiliary model
334 Consistency Interpretation
Suppose the observed sample size T grows large while total number of simulations stays
fixed as M the estimator based on simulated data ɶ( )θ β will converge to a pseudo-true
value denoted as( )h β which is also dependent onβ This is called binding function
which characterized the relationship between the coefficients in the basic model and the
auxiliary model At the same time the estimator based on observed data ɵθ will converge
to a pseudo-true value0θ In case that T grows to a large number the aim of indirect
inference changes to finding β that guarantees0 ( )hθ β= This could explain that indirect
inference gives consistent estimate of the parameters in the basic economic model
In this project the binding function is what we focus on to get the correct estimates
instead of finding certain metrics Detailed methods will be discussed in the following
part
34 Model Specification in the Thesis
341 Basic Route Choice Model
Based on all the methods mentioned in previous sections the specification of models and
methods we use in the thesis will be explained in this section Since we are to estimate
the model based on true observations no model is known beforehand to adjust to the data
we use Several formulations of the model have been tested in the thesis The one
explained here could be seen as an example and all the other trials contain modifications
based on this model The other specifications of model will be explained along with the
results in the result section
31
We start by describing the underlying route choice model of interest38 We need to define
a road network as a representation of a real-size one from which we collected the trip
data The network denoted asN consists of a set of nodes (vertices) v and links (edges)
l Each link has a source node ( )s l and a target node or a destination node( )d l which
together indicate the direction of the link A path from an origin node ov to a destination
node dv could be seen as a sequence of links1 nl lhellip of which 1( ) os l v= 1( ) ( )i id l s l +=
and ( ) dnd l v= So a path can be defined by the index of links which is 1 nl lπ = hellip
A vector of characteristics denoted aslx is associated to each link as well as a strictly
positive cost function( )l lic x ε β in which liε is an individual specific random link cost
with i denoting the individual and β is a vector of coefficients of the link characteristics
left to be estimated In the Indirect Inference context we need an auxiliary model with
easily-estimated analytical form yet there is no such requirement for the basic model
Although not necessary we assume that the cost function has a linear deterministic form
the deterministic part and the random part are additively separable So we have the cost
function as
( ) Tl li l lic x xε β β ε= + (18)
In addition one important assumption is that the link cost is additive which means that
the cost of a path can be attained by the sum of all the link costs along the path This way
we have the cost of a path π as
( ) ( )l lil
C c xπ
π ε βisin
=sum (19)
We focus on the path-based model which means that the individuals choose among all
possible paths As defined above this turns out to be a random utility choice model As
indicated by the standard assumptions of this kind of models choice makers are assumed
to know both the link characteristics and their idiosyncratic random utility liε associated
to each link Since the choice makers maximize their utility this means that they will
choose the path with the lowest generalized cost in this model This way we have the
choice of individual i as
38 Karlstroumlm A Sundberg M amp Wang Q (2011) Consistently estimating flexible route choice models using an MNL lense
32
( )
arg min ( )o di i
iv v
Cπ
π πisinΩ
= (20)
in which oiv denotes the origin point of the trip for individual i and d
iv denotes the
destination ( )o di iv vΩ denotes all possible paths connecting the origin and destination in
the network for individual i which forms the choice set for the individual
When implementing the model we assume that the random utility component liε follows
a truncated normal distribution To be specific liε follows a standard normal distribution
yet with only the positive values retrieved This way we could guarantee that the link
costs are always positive so that additively the path would not have infinite loops With
this feature of the random component we could say that our model is probit-like Based
on this assumption the prerequisite of Dijkstrarsquos Algorithm is satisfied which always
needs positive edge values on the network We can use the Dijkstrarsquos Algorithm to find
the shortest paths iπ as an intermediate step in the implementation Apart from this we
assume that the unobserved cost captured by the random term is proportional to the
length of link To embody this in the cost function we add a fixed scale parameter to the
random term with a form of ( )Length l Lengthx Mean x in which ( )LengthMean x is the average
length of links in the network
We will assume that the data consists of J paths as dependent variables which means
that the dependent variables for the choice model are 1 Ji iy π == In addition the observed
characteristics of links in the network are provided 1 Ll lx x == To be specific we choose
to use two attributes of the links namely the length of the links Lengthx and the dummy
variable indicating the presence of speed bumps on the links SBx The cost function then
is specified as
( ) ( )l li Length Length l SB SB l li Length l Lengthc x x x x Mean xε β β ε= + + sdot (21)
Now the objective is to estimate the parametersβ in the model for which we will make
use of an auxiliary model
33
342 Auxiliary Model
Based on the idea of Indirect Inference we treat the route choice model defined above as
the basic model of interest which might have complex formation and be difficult to
estimate directly Then we need an auxiliary model to form a criterion which takes into
certain aspects of data to focus the analysis The auxiliary model needs not to reflect the
data generating process exactly as in the basic model yet it needs to include attributes of
interest in order for reference and to be easy to estimate We choose to use a logit model
for route choice as the auxiliary model since the logit model has always been a useful
tool for discrete choice analysis thanks to its analytical form and there is software for
estimating logit models which ensures that we can estimate very efficiently
As to the auxiliary model it is chosen to be a logit model for route choice We consider
that each individual i is choosing from a set of alternative routesr Each route r is given
a utility of riU
- Tri r ri r riU V Xε θ ε= + = + (22)
in which θ is the vector of auxiliary parameters which gives inference to the parameters
in the basic model One thing to be mentioned is that as expected the coefficients in the
utility function should have negative signs To make it easier for comparison with the
coefficients in the basic route choice model we assume the sign of θ to be positive per
se and add a negative sign ahead of it to guarantee that the coefficient part is negative as a
whole rX denotes route characteristics and riε is the random utility for each individual
which is assumed to follow an iid (independently identically distributed) Gumbel
distribution following the standard assumption of logit models
Note that as required for the auxiliary model it should be flexible enough to capture the
variability in the data and thus contains no fewer attributes than the basic model39 In
order to infer the parameters in the basic model and in consideration of efficiency we
pick the same attributes of interest in the basic models which are the link length Lengthx
and the speed bump dummy variableSBx So the utility function turns out to be
- -ri Length Length r SB SB r riU x xθ θ ε= + (23)
39 Karlstroumlm A Sundberg M amp Wang Q (2011) Consistently estimating flexible route choice models using an MNL lense
34
The probability of individual i choosing path r given an individual specific choice set
( )iI o d is
( )
ri
si
i
V
ri V
s I o d
eP
eisin
=sum
(24)
Theoretically we allow the individuals to choose from all possible paths between the
origin and destination in the network which intuitively could be infinite and impossible
to enumerate When implementing the model we generate the individual choice set based
on the basic route choice model Through simulation of the basic model we generate
infinite unique shortest paths for all the unique OD pairs by redrawing the random link
cost liε Without loss of generality the number of paths generated would be big enough
with fully consideration of efficiency We name the finite choice set composed by the
shortest paths generated as the pseudo-universal choice set ( )I o d which is a sample of
the infinite universal choice set The individual specific choice sets are generated by
randomly drawing certain number of paths out of the pseudo-universal choice set And
the size of individual specific choice set could be equal to or smaller than that of the
pseudo-universal one
The resulting individual specific choice set ( )iI o d describes a finite subset of all possible
paths connecting the origin oand destinationd for individuali When implementing the
methods the way of generating the choice set ( )iI o d for each individual i is viewed as
part of the auxiliary model
After the auxiliary model is built it could be estimated using a Maximum Likelihood
estimator based on the observed data of individual choices y and attributes variablesx
for individual 1 i N= hellip The estimate of parameters in the auxiliary model is
ɵ arg max ( )L y xθ
θ θ= (25)
in which ( )L y x θ is the log-likelihood function for the auxiliary model
Given the data of the link attributes xand some random draws of structural parameters
mβ 1 m M= hellip we can simulate choice data through the basic route choice model With
M draws of β from some given density we could simulate M sets of data resulting in
35
simulated choicesɶ( )my β Same as before parameters θ in the auxiliary model can be
estimated based on the simulated data as
ɶ ɶ( ) arg max ( ( ) )m m mL y xθ
θ β β θ= (26)
As the process indicated the simulated choice data depends on the structural parameterβ
in the basic route choice model and in sequence the estimates of parameters θ in the
auxiliary model depends on β when estimated based on the simulated data Based on
this theoretically we have a relationship of ( )θ β referred to as the binding function in
indirect inference literatures which we will discuss in detail for implementation of model
in this thesis A metric is then chosen to measure the distance between the observed and
simulated data viewed by the auxiliary model as a way to indirectly infer the values of
parameters β in the basic model To be specific for each draw of the structural parameter
mβ we can get the estimates of ɶ ( )m mθ β based on the simulated data and the distance
between ɶ ( )m mθ β and ɵθ measured by the chosen metric By doing more iteration with the
aim of minimizing the distance we will get the value of mβ which spurs the ɶ ( )m mθ β
closest toɵθ and this mβ is the inferred estimates of the parameter in the basic model
343 Consistency Discussion
The process of indirectly estimating parameters in the basic model is described above yet
we need to know whether the method we provide gives consistent estimation Here are
some discussions explaining the consistency in estimating by which consistency of the
estimator we proposed is illustrated
As proved the multinomial logit model (MNL) can be estimated consistently based on a
subset of alternatives (McFadden 1978)40 We may need to use the classical conditional
maximum likelihood estimator to deal with the problem at the same time the probability
that an individual n chooses an alternative i conditional on the subset of alternatives
denoted asnc becomes the conditional probability
40 McFadden D (1978) Modeling the Choice of Residential Location In A Karlqvist L Lundqvist F Snickars amp J Weibull (Ed) Spatial Interaction Theory and Residential Location (pp 75-96) Amsterdam North-Holland
36
ln ( | )
ln ( | )( | )in n
jn n
n
V q c i
n V q c j
j c
eP i c
e
micro
micro
+
+
isin
=sum
(27)
in which micro is a scale parameter and inV is the deterministic part of the utility There is a
term ln ( | )nq c j for correcting the sampling bias in which ( | )nq c j denotes the probability
of sampling nc given that alternative j is chosen
If all the alternatives in the choice set have the same probability to be chosen into the
subset the estimation on the subset of alternatives is equivalent to that on the full choice
set To be specific in this case ( | )nq c i is equal to ( | )n nq c j j cforall isin so by calculation the
term for sampling bias correction will cancel out in the probability function
In route choice context the alternative paths between an origin and a destination may be
in large amount and it is inefficient to give some very long-distance paths the same
probability as those short and attractive ones This means that we may need the
importance sampling method when generating subsets of alternatives which selects
attractive alternatives with higher probability than unattractive ones And the correction
term does not cancel out in this case Note that if alternative specific constants are
estimated we can get unbiased estimates of all the parameters except the constants even
if the correction term is not included in the utility function (Manski amp Lerman 1977)41
Back to the route choice context we tend to use large number of alternatives even with
subset of the full choice set which means that it is generally impossible to estimate the
constants and thus the correction term is essential To solve this problem Frejinger et al
(2009) developed a sampling approach in the context of route choice42
The discussion above focuses on the usage of MNL for route choice modeling When it
comes to our method the individual specific choice set is generated by randomly drawing
alternatives from the pseudo-universal choice set with the same probability yet there is
bias when generating the pseudo-universal ones since the pseudo-universal choice set is
composed of certain number of shortest paths between two nodes and this generating
process gives some paths higher probability to be included into the choice set So we
41 Manski C amp Lerman S (1977) The Estimation of Choice Probabilities from Choice Based Samples Econometrica 45 (8) 1977-1988 42 Frejinger E Bierlaire M amp Ben-Akiva M (2009) Sampling of Alternatives for Route Choice Modeling
37
actually use importance sampling to get the choice set which may consequently
introduce bias in estimating the parameterθ in the auxiliary model as discussed above
With the idea of indirect inference we consider only the relationship between θ andβ
denoted as( )θ β and use this relation to infer the value ofβ From this point of view
whether θ is estimated with bias or not does not matter since the relation between it and
β could always be captured which is the specific thing we focus on using the method of
indirect inference So we can say that even with biased subset of alternatives we could
still get consistent estimation by using indirect inference
344 Binding Function
As discussed in indirect inference method section when the sample size N increases
which means that we have more observations of choice the estimated parameter in the
auxiliary modelɶ ( )m mθ β will converge to a stable value ( )mθ β which is often referred
to as the binding function
Given that route choice model deals with discrete choices and by using indirect inference
we have a discrete choice model as the auxiliary model as well the estimates of binding
function ( )mθ β will inherit the discontinuous feature due to discrete individual choices
ɶ( )my β Keane and Smith (2003) proposed a solution of using logit-smoothing on the
simulated dependent choice data43 Following this idea we assume a continuous binding
functionɶ( )θ β for simplicity which could be approximated by a linear function locally
within small intervals With the M randomly drawn values of mβ and the corresponding
estimated parameters ɶ ( )m mθ β in the auxiliary model we could perform an Ordinary
Least Square (OLS) regression to estimate the local approximation of binding function
ɶ( ) c Dθ β β= + (28)
in which cdenotes the constant vector and D denotes the OLS parameter matrix44 To be
specific in our case each parameter in the auxiliary model will have a restriction
function with regard to both parameters in the basic model which is
43 Keane M amp Smith A (2003) Generalized Indirect Inference for Discrete Choice Models 44 Karlstroumlm A Sundberg M amp Wang Q (2011) Consistently estimating flexible route choice models using an MNL lense
38
ɶ1 11 12( )Length Length SBc d dθ β β β= + +
(29)
ɶ2 21 22( )SB Length SBc d dθ β β β= + +
(30)
Based on the observed data of choices y and explanatory variables xand the estimated
binding function which indicates the restrictions between ɶθ andβ we could use the
maximum likelihood method to give estimation of the parameters of interest The
likelihood ratio approach to indirect inference is following ideas of Smith (1993)45 and
Keane and Smith (2003)46
ɶ=arg max ( ( ))L y xβ
β θ β (31)
in which β is the estimate of the parameter of interest β in the basic economic model
With the restriction of binding function this is actually an indirectly inferred estimate In
line with the estimating process in auxiliary model ( )L sdot is the likelihood function of the
auxiliary model
Note that the form of binding function is based on an assumption in the result part we
will verify that this assumption is realistic
45 Smith A (1993) Estimating Nonlinear Time-series Models Using Simulated Vector Autoregressions 46 Keane M amp Smith A (2003) Generalized Indirect Inference for Discrete Choice Models
39
4 Data
41 Road Network
The data we use for estimation is based on a GPS data set collected in the Swedish city of
Borlaumlnge Borlaumlnge is located in the middle part of Sweden and has a population of about
47 000 inhabitants
The virtual road network contains 3077 nodes and 7459 unidirectional links (Frejinger amp
Bierlaire 2007)47 of which 3061 nodes and 7288 links are included in the network for
estimation Figure 3 gives a visual illustration of the road network in Borlaumlnge
Figure 3 Illustration of the Borlaumlnge road network
With regard to our research two of the link attributes are included namely link length
and speed bump dummy Link length is in the unit of km and speed bump dummy is an
indication of speed bump existence on the links which has the value 1 when there is a
speed bump on the link and 0 otherwise
Link length
47 Frejinger E amp Bierlaire M (2007) Capturing Correlation with Subnetworks in Route Choice Models
40
Some descriptive statistics of the link length data for the whole network is presented in
Table 1 below
Table 1 Descriptive statistics of link length
Number of links 7288
Minimum 0001
Maximum 7599
Mean 0184487
Median 0102
Variance 0103722
Lexis ratio (varmean) 1016884
Skewness 9871144
To describe the overall character of the link length attribute the histogram is shown in
Figure 4 below
Figure 4 Histogram of link length data
We could see that the link length data is quite clustered most of which lies within the
range of 01km and 06km Nonetheless there are some extreme values far away from the
range indicating extremely long links To display the variation in the relatively clustered
area we draw a histogram zoomed in the interval of (0 1km] shown Figure 5 in below
0
01
02
03
04
05
06
Fre
qu
en
cy
Link length (km)
Histogram
41
Figure 5 Histogram of link length data (zoomed within 1km)
Over 80 of all the links have length shorter than 03 km indicating concentration of
link length data
Speed bump dummy
Speed bump dummy is based on true situation in the network Of all the links 82 links
are equipped with speed bumps which account for a percentage of 113 The following
Figure 6 displays the locations of links with speed bumps
Figure 6 Illustration of links with speed bumps
0005
01015
02025
03035
04045
05
Fre
qu
en
cy
Link length (km)
Histogram(zoom in)
42
42 Observation Data
The GPS data set is collected as a part of the Swedish Intelligent Speed Adaptation (ISA)
study which aims at traffic safety effects of in-car information systems In the study 186
vehicles were equipped with GPS devices and traced within a radius of 25 km from the
center of Borlaumlnge The monitoring lasted for 30 days from 22th June 2000 to 4th March
2002 obtaining 49 667 vehicle days of travel and nearly a quarter of a million trips (for
more information on the GPS data set check Axhausen Schoumlnfelder Wolf Oliveira amp
Samaga 2003 Schoumlnfelder amp Samaga 2003 Schoumlnfelder Axhausen Antille amp Bierlaire
2002)48
The data collection is not originally designed for route choice analysis so the raw data
cannot be used in our research directly Extensive data processing is performed by the
company GeoStats in Atlanta to retrieve new data set available for route choice analysis
which contains 24 vehicles and 16 035 observations The final data set we use is provided
by Emma Frejinger which contains in total 1832 observations corresponding to 1458
observed unique routes made by 24 vehicles and 1409 unique origin-destination pairs
Considering that certain route may have been observed more than once we make a
distinction between observations and unique routes and number of unique routes should
be less than that of observations consistently with the numbers listed above
As indicated by data collection in the ISA study only licensed drivers with access to his
or her only car are recruited to minimize sharing or swapping of cars Minimum socio-
economic data of the drivers is included in data collection so we have no way to
understand driver characteristics from the data set Logically we make an assumption
that there is only one individual per vehicle
In the observation data a route is represented by a series of links and also an origin-
destination pair With relatively intensively distributed link length number of links could
48 Axhausen K Schoumlnfelder S Wolf J Oliveira M amp Samaga U (2003) 80 Weeks of GPS Traces Approaches to Enriching the Trip Information Transportation Research Record 1870 46-54 Schoumlnfelder S amp Samaga U (2003) Where Do You Want to Go Today-More Observations on Daily Mobility Third Swiss Transport Research Conference Ascona Schoumlnfelder S Axhausen K Antille N amp Bierlaire M (2002) Exploring the Potentials of Automatically Collected GPS Data for Travel Behaviour Analysis- A Swedish Data Source In J Moumlltgen amp A Wytzisk (Ed) GI-Technologien fuumlr Verkehr und Logistik number 13 Institut fuumlr Geoinformatik Universitaumlt Muumlnster (pp 155-179) Munster IfGIprints
43
be used to indicate total length of routes Some of the descriptive statistics of link number
is shown in Table 2 below
Table 2 Descriptive statistics of link numbers in observation data set
Number of observations 1832
Minimum 5
Maximum 106
Mean 202877
Median 16
Variance 1871968
Lexis ratio (varmean) 9227126
Skewness 1732597
For further overall inspection of link number distribution in the observation data set the
histogram is shown in Figure 7 below
Figure 7 Histogram of link numbers in observations data set
Seen from the histogram distribution of number of links is relatively dispersed with a
large range interval Judging by the statistics in general the routes observed have about
000
200
400
600
800
1000
1200
1400
1600
5 8
11
14
17
20
23
26
29
32
35
38
41
44
47
50
53
56
59
62
65
68
71
74
77
80
83
86
89
92
95
98
10
1
10
4
10
7
Mo
re
Fre
qu
en
cy
Number of links
Histogram
44
20 links in average Yet the data has a big variance which is reasonable As stated above
there are 1409 unique OD pairs for 1832 observations indicating that for most OD pairs
there is only one observation Spread within the detecting area different OD pairs could
have various numbers of links in between
Following our experiment design only a portion of the data could be used To be specific
routes with number of links fewer than ten would be eliminated when used for estimation
43 Further Exploration of data
Apart from the characters discussed above there are some other attributes in the data set
interesting to be explored Both in link attribute data set and observation data set there is
travel time data which to some extent is parallel with length in indicating distance
between two nodes
In the link attribute data set one attribute is denotes the estimated travel time of links in
unit of hour Some of the descriptive statistics is shown in Table 3 below switching unit
to minute
Table 3 Descriptive statistics of estimated travel time on links
Number of links 7288
Minimum 000186
Maximum 578268
Mean 0281696
Median 018744
Variance 0119337
Lexis ratio (varmean) 0423638
Skewness 5785361
Seen from Table 3 estimated travel time seems to have a more clustered distribution than
link length judging by lexis ratio and skewness Yet this time is roughly estimated not so
qualified as link length to use in estimation since the latter is much easier to measure and
guarantee precision
In the observation data set we have the duration time of the observations in the unit of
minute Some of the descriptive statistics is shown in Table 4 below
45
Table 4 Descriptive statistics of duration of trips
Number of observations 1832
Minimum 007
Maximum 316
Mean 4991195
Median 3925
Variance 1775639
Lexis ratio (varmean) 3557542
Skewness 2174728
Duration of trips can be used as an indication of distance between origin and destination
yet it is roughly measured and strongly affected by traffic condition on the road network
With similar reasons as discussed on estimated travel time on link we use number of
links instead of duration of trips to indicate the distance between OD pairs
46
5 Experiment Design
When doing the simulation-based estimation it is physically divided into two parts for
convenience of operation As discussed in the method section we choose to use a pseudo-
universal choice set which is generated and stored in the first part and ready for use in
the following experiment Then in the second part we do the simulation-based
experiment to carry out indirect inference method for estimating the parameters of
interest in the basic model β to be specific The Figure 8 below illustrates an abstracted
flow of how the estimation is carried out given certain origin-destination pair
Figure 8 Illustration of the flow in the experiment
As shown in the flow chart we get all the unique OD pairs in the trip data For each of
the OD pairs the Dijkstrarsquos algorithm is used to find the shortest paths between them
without duplicates We set the intended number of paths to be 400 as well as time
terminator in case not enough paths could be generated within certain bearable time
47
interval The generated paths form the pseudo-universal choice set of each OD pair
which is stored for future use Note that we abandon some OD pairs with too few paths
in the pseudo-universal choice set Observations containing the kept OD pairs are used
for following estimation which turns out to be 940 of them
For the OD pair in a given observation 200 alternatives are randomly drawn from the
pseudo-universal choice set and the sequential links in the observation itself is read as an
alternative path The 201 paths compose the observed choice set On the other hand a
given value of mβ is drawn from a predefined domainD The shortest path is generated
based on the given mβ as the simulated observation Like in the observed choice set part
200 alternatives are randomly drawn from the pseudo-universal choice set to form the
simulated choice set together with the simulated observation The auxiliary model is
estimated based on the simulated choice set and we could get a set of ɶ( ( ))mm mβ θ β pairs
which will be used to estimate the binding function Based on the binding function and
the observed choice set the parameters in the basic model could be indirectly estimated
The process described above is abstracted with no illustration of iterations Since this is
an experiment based on simulations certain loops of iteration should be carried out to get
statistics of the results
Given observed trip data at first we have no idea of the value of β In the process of
retrieving value ofβ the estimation process is repeated for several stages denoted asS
starting from a rough guess of the domainsD while for each following stage the domain
shrinks Since we tend to use a local OLS regression to approximate the smooth binding
function the draws of smβ need to be around the true value to prevent misspecification of
OLS regression due to the possibly inherent nonlinearity of the binding function The
estimated 0
β is not satisfactory in precision in the first stage yet it could give a hint of
where the true value lies The domain1D is centered on 0
β with smaller interval before
the estimation in the second stage This way +1sD is dependent on sD with smaller
interval As it goes on we will get a more accurate domain and as a result a well specified
OLS regression to approximate the binding function
48
The process of experiment with iterations is described below Suppose that we have the
experiment carried out for K times and the number of observations used isN
for run 1 k K= hellip for true observation 1 i N= hellip
Randomly draw alternatives from the pseudo-universal choice set end Form the observed choice sety for stage 1 s S= hellip
for 1 m M= hellip
Draw ksmβ from the domain ksD
Simulate paths for OD pairs in the used observations with mβ
for simulated observation 1 i N= hellip Randomly draw alternatives from the pseudo-universal choice set end
Form a simulated route choice setɶ( )ksmy β
Estimate ɶ ( )ks ksm mθ β in Equation (26)
end
Estimate ɶ ( )ks
θ β in Equation (28)
Estimate ks
β in Equation (31) end
Center the domain 1k sD + on ks
β and shrink the interval end
As a trial we first do the experiment on a route choice model with one parameter link
length to be specific For simplicity the random term is not scaled as described in the
model specification section which means we attach a truncated normally distributed
random term to the cost function without scaling it with link length After getting the
estimation of Lengthβ we move on to estimating the route choice model with both
parameters as described in the model specification Results under these two formulations
of models are presented separately in the result part
49
6 Results
61 Validation of Binding Function
As discussed in the binding function section we assume the binding function to be
continuous and feasible to be approximated by a linear function locally The assumption
of binding function can be verified based on the ɶ( ( ))mm mβ θ β pairs we attained as
intermediate results To explain this more explicitly we carry out a simple example with
only one parameter in the route choice model Lengthβ to be specific
The cost function is specified as
( )l li Length Length l lic x xε β ε= + (32)
corresponding to which the auxiliary model is
-ri Length Length r riU xθ ε= + (33)
For each run 10 values ofLengthβ are evenly drawn from a given domain By simulating
observations and estimating the auxiliary model 10 corresponding Lengthθ are generated to
form ten ɶ( ( ))mm mβ θ β pairs As assumed the binding functionɶ( )θ β is continuous which
could be approximated by a linear function locally To display the trend of binding
function we choose a relatively large domain for Lengthβ in the beginning [010]D = and
carry out 10 runs which generate 100 points in the beta-theta diagram shown in Figure 9
below
Figure 9 Scatter plots of the 90 beta-theta pairs
y = 12804x + 16264
Rsup2 = 09959
0
2
4
6
8
10
12
14
16
0 2 4 6 8 10
the
ta_
len
gth
beta_length
50
We do OLS regression for the dots and estimate the binding function Intuitively the
smaller the domain is the more accurate is the approximation of the binding function We
shrink the input domain based on the final estimate of Lengthβ from last trial
As it turned out to be we choose an input domain of [1214]D = for Lengthβ and the
binding function is assumed to take the form of
ɶ1 11( )Length Lengthc dθ β β= +
(34)
The result for one run is displayed in Figure 10 below
Figure 10 OLS regression based on the 10 beta-theta points from one run
The estimated binding function based on the 10 points is
ɶ ( ) 17371+10838Length Lengthθ β β= (35)
as indicated by 2 09783R = the function describes the trend of points very well Since
the interval is quite small we could use the estimated function to approximate the
binding function
When it comes to more parameters in the route choice model what we do is simply to
add more elements in the binding function After getting a vector of β and the
corresponding vector ofɶ( )θ β binding functions of each element in vector ɶ( )θ β with
y = 17371x + 10838
Rsup2 = 09783
315
32
325
33
335
34
345
35
355
12 125 13 135 14
the
ta_
len
gth
beta_length
51
regard to all the elements in vector β are estimated One example is shown in the
Equation (29) and Equation (30)
62 Estimation of model with one attribute
The route choice model with one attribute we used is the one described in Section 61
above After several trials by shrinking input interval every time we finally affirm that
the true value Lengthβ of lies in a relatively small interval of [12 14] Based on this
domain 50K = runs are carried out to get statistics of the estimate of Lengthβ As
discussed in the experimental design several stages Smean different trials before final
affirmation of input interval yet for the statistics only one stage is carried out for each
run Within each run 10M = values of input Lengthβ are drawn for estimating binding
function
The estimation statistics of Lengthβ is shown in Table 5 below
Table 5 Statistics of estimation of beta_length
Parameter Lengthβ
Mean 1337353
Standard deviation 0107537
RMSE 0013227
In the table RMSE is the root-mean-square error which is used to measure the distances
between the observed values being estimated and the predicted values by the estimator
The individual differences are called residuals and RMSE is an aggregated measure of
the residuals To be specific
ɵ ɵ ɵ 2( ) ( ) (( ) )RMSE MSE Eθ θ θ θ= = minus (36)
in which ɵθ is the estimator and θ is the parameter to be estimated so the RMSE is the
square root of the mean square error As defined the smaller the value of RMSE is the
better the estimator is
52
Here the RMSE is calculated based on the ten points ɶ( ( ))mm mβ θ β for estimating binding
function so basically it describes the goodness of fit of the estimated binding function
with regard to the points we generated The Equation (36) is specified as
ɶ 2( ( )) (( ( ) ( )) )mm m mRMSE Meanθ β θ β θ β= minus (37)
The value of RMSE displayed in the Table 5 is the mean value of all the RMSE values
for 50 runs Seen from this we have well-estimated binding function for all the 50 runs
on average In terms of the estimates of binding function taking the one in Section 61 as
an example the binding function estimated in the interval of [12 14] in Equation (35)
has a positive constant and a positive coefficient for Lengthβ which indicates that with
larger value of Lengthβ we will get larger value ofɶ Lengthθ and as a result a negative
coefficient for length in the utility function of the logit model This is reasonable for
bigger Lengthβ reveals larger incremental effect on the cost of certain path while lower
ɶ- Lengthθ reveals larger disutility effect on certain path these two effects are in fact
equivalent
By the way the high fitness of binding function is probably due to the relatively small
input interval of Lengthβ after certain trials and shrinkage As the final estimate indicates
Lengthβ falls right into the interval of [12 14] with small standard deviation So we can
say that the estimate is quite good
63 Estimation of model with two attributes
We use the model described in the model specification section to carry out the estimation
Two attributes are used namely length and speed bump dummy Similar to the one
attribute case we carried out several trials and shrinkage to finally determine the
relatively small input intervals forLengthβ and SBβ [05 1] and [0 05] respectively
50K = runs are carried out to get statistics of the estimates of the two parameters Within
each run 10M = values are drawn for inputs Lengthβ and SBβ respectively for estimating
binding function
53
One important thing to mention here is that the inputs are drawn evenly from the domain
yet to guarantee that the values of Lengthβ and SBβ are independent from each other or to
get rid of collinearity49 the domains of two parameters are defined in two dimensions To
explain this more explicitly we choose data of one run as an example The input points of
( Lengthβ SBβ ) are shown in Figure 11 below
Figure 11 Scatter plot of the input values for beta_length and beta_sb
We can see from Figure 11 that the points spread evenly in the domain quadrant Based
on these draws we could estimate the binding function and evaluate the relationship
between parameters in the logit model and Lengthβ and SBβ without worrying about
possible correlation between Lengthβ and SBβ
As discussed before in the binding function we are supposed to find the relationship
between each of the parameters in the logit model and both parameters in the route choice
model Mathematically this binding function should be a surface in the 3D coordinate
system We take the results of one run as an example and thus we have ten sets of Lengthβ
and SBβ along with corresponding ɶ Lengthθ andɶ SBθ
49 A set of points is collinear if they lie on a single straight line or a projective line (for example projective line over any field) and this way the two factors represented by the points are correlated
0
005
01
015
02
025
03
035
04
045
05
05 06 07 08 09 1
be
ta_
sb
beta_length
54
For the first binding function ɶ Lengthθ and ( Lengthβ SBβ ) are plotted in Figure 12 below
And the binding function takes a form as described in Equation (29)
Figure 12 Scatter plot of theta_length with regard to beta_length and beta_sb
By multi-linear regression we can get a surface to approximate the binding function
locally The estimated binding function is displayed in Figure 13 below
Figure 13 Display of the estimated binding function for theta_length
And the first binding function has a formula of
55
ɶ 18234+16933 +00633Length Length SBθ β β= (38)
For the second binding function ɶSBθ and ( Lengthβ SBβ ) are plotted in Figure 14 below
And the binding function takes a form as described in Equation (30)
Figure 14 Scatter plot of theta_sb with regard to beta_length and beta_sb
By multi-linear regression we can get a surface to approximate the binding function
locally The estimated binding function is displayed in Figure 15 below
Figure 15 Display of the estimated binding function for theta_sb
56
And the second binding function has a formula of
ɶ -06698+00371 +17619SB Length SBθ β β= (39)
The t-test of estimated parameters in the binding function is carried out with null
hypothesis of zero Estimates that are significantly different from zero with 95
confidence interval are marked as bold
Table 6 Estimated coefficients of binding function for model with two attributes
Constant Lengthβ SBβ
ɶLengthθ 18234
(43632) 16933
(33481) 00633 (1392)
ɶSBθ -06698
(-7991) 00371 (0366)
17619 (19323)
Seen from the magnitude of coefficients in the binding functions both Lengthβ and SBβ
have positive effect on ɶ Lengthθ andɶ SBθ and in sequence negative effect on the coefficients
in the logit model In addition coefficients of SBβ with regard to ɶ Lengthθ and Lengthβ with
regard to ɶ SBθ are not significantly different from zero so we can say Lengthβ has a more
apparent effect on ɶ Lengthθ than SBβ does while SBβ has a more apparent effect on ɶ SBθ
than Lengthβ does
Based on the estimated binding functions and the true observation data we could get the
estimates of Lengthβ and SBβ as shown in Table 7 below
Table 7 Statistics of estimation of beta_length and beta_sb
Parameter Lengthβ
SBβ
Mean 0761383 0079874
Standard deviation 0068493 0034375
RMSE 0022772 0085113
Seen from the RMSE results the relatively small values indicate that we have well-
estimated binding functions for all the 50 runs on average With regard to the estimates of
parameters in the route choice model both of them fall into the input domain we choose
57
and the standard deviation is quite small So we can say that the estimates are actually
very good
One thing to notice here is that the final estimate of Lengthβ falls approximately in the
middle of the input domain [05 1] while the estimate of SBβ falls closer to the left limit
which might need further shrinkage of input domain and more precise estimate of the
binding function To get rid of this we use the binding function estimate from all the 500
points to give a hint on the reasonability of acceptance of the estimate of SBβ The scatter
plots of theta_sb against beta_sb and beta_length are shown in Figure 16 below
Figure 16 Scatter plots of theta_sb against beta_sb and beta_length
The scatter plots in Figure 16 above are the decompositions of the binding function from
three dimensions to two dimensions Seen from the linear regression in the two plots ɶSBθ
is almost strictly positive proportional to SBβ and hardly effected byLengthβ This means
y = 19132x - 06404
Rsup2 = 0936
-1
-08
-06
-04
-02
0
02
04
06
0 01 02 03 04 05
the
ta_
sb
beta_sb
y = 00123x - 01717
Rsup2 = 4E-05
-1
-08
-06
-04
-02
0
02
04
06
05 06 07 08 09 1
the
ta_
sb
beta_length
58
that by shrinking the input domain ofSBβ we would probably get the same estimate of
binding function since it changes little in current domain And this leads to our
acceptance of the final estimate of SBβ
Given that we have a random cost following a truncated standard normal distribution and
the magnitudes of the estimated parameters are relatively small this would mean that the
randomness of the cost function are relatively large which in sequence leads to relatively
large randomness in individualrsquos choice of route
Another thing to be mentioned is that the magnitude of Lengthβ is smaller than that when
estimated singly Though these two values are not logically comparable with different
formation of random term in the cost function we could still get a hint from the
comparison This difference is probably due to the form of random cost we used which is
( )li Length l Lengthx E xε sdot and the effect of length on the cost is partially captured by this
random term
64 Estimations of other trial formulations of the model
641 Model with exponential form of cost function
During the process of estimation we carried out a lot of other trials in the formulations of
the basic route choice model the cost function to be specific and the auxiliary logit model
As it turned out the there are negative estimates of coefficients in the cost function
which conflicts our anticipation To capture this kind of negative estimation we choose to
use the exponential form of the cost function Without loss of generality the random term
is not scaled by the length of links The cost function is specified as
( ) Length Length l SB SB l lix x
i lic x eβ β εε + += (40)
Two attributes are used namely length and speed bump dummy variable Unlike the form
in Section 63 we allow the parameters Lengthβ and SBβ to have negative input and the
random term liε now follow a standard normal distribution without truncation Since we
take the exponential form of the cost function the cost of links could be kept positive
thus allowing the use of Dijkstrarsquos Algorithm to operate
59
In terms of the auxiliary model since we could have more attributes in the auxiliary
model than the underlying model Instead of using the same attributes as in the cost
function we choose to add an attributes which is number of links in the pathLNx So the
utility function of the logit model is specified as
- - -ri Length Length r SB SB r LN LN r riU x x xθ θ θ ε= + (41)
We still expect the value of θ to be positive and the coefficient of variables with the form
of -θ would be negative
Several trials and shrinkage were carried out for this formulation of our model to finally
determine the relatively small input intervals forLengthβ and SBβ [25 27] and [-05 0]
respectively 15K = runs are carried out to get statistics of the estimates of the two
parameters Within each run 10M = values are drawn for inputs Lengthβ and SBβ
respectively for estimating binding function
To visualize the trend of binding function more clearly we make use all the 150 sets of
vector β and vector θ to estimate the binding function Since we have three variables in
the logit model we have to estimate three binding functions
For the first binding function ɶ Lengthθ and ( Lengthβ SBβ ) are plotted in Figure 17 below
shown along with the estimated binding function
Figure 17 Scatter plot of theta_length against beta_length and beta_sb estimated binding function
The first binding function takes the form of
ɶ 41312+09114 +44845 10Length Length SBθ β βminus= sdot (42)
60
For the second binding function ɶSBθ and ( Lengthβ SBβ ) are plotted in Figure 18 below
shown along with the estimated binding function
Figure 18 Scatter plot of theta_sb against beta_length and beta_sb estimated binding function
The second binding function takes the form of
ɶ 01147 01362 +07119SB Length SBθ β β= minus (43)
For the third binding function ɶ LNθ and ( Lengthβ SBβ ) are plotted in Figure 19 below
shown along with the estimated binding function
Figure 19 Scatter plot of theta_ln against beta_length and beta_sb estimated binding function
The third binding function takes the form of
ɶ 10043 03378 +00068LN Length SBθ β β= minus (44)
The t-test of estimated parameters in the binding function is carried out with null
hypothesis of zero Estimates that are significantly different from zero with 95
confidence interval are marked as bold
61
Table 8 Estimated coefficients of binding functions for model with exponential cost function
Constant Lengthβ SBβ
ɶLengthθ 1312
(2411) 09114 (4360)
4484510-4 (0005)
ɶSBθ 01147
(0425) -01362 (-1314)
07119 (17221)
ɶLNθ 10043
(13767) -03378
(-12051) 00068 (0607)
Same as in the model with two attributes ɶ Lengthθ andɶ SBθ are significantly affected by
Lengthβ and SBβ respectively The negative signs for Lengthβ in the second and third binding
functions draw our attention Since in the second binding function it is not significantly
different from zero we can disregard the effect In the third binding function Lengthβ has
significantly negative effect on ɶ LNθ The larger value of Lengthβ we have the more
influential of path length on cost is With negative effect on ɶ LNθ we can say at the same
time number of links become less influential on the utility This is reasonable since
intuitively if we are sensitive to the path length we wouldnrsquot care too much of having to
switch several more or fewer links based on that path length and number of links are
more or less correlated to each other
Based on the estimated binding functions and the true observation data we could get the
estimates of Lengthβ and SBβ as shown in Table 9 below
Table 9 Statistics of estimation of beta_length and beta_sb in exponential-cost-function model
Parameter Lengthβ
SBβ
Mean 2537672 -045601
Standard deviation 0068377 0133036
We have negative estimate of SBβ which conflicts our assumption that length and
presence of speed bump on the path may increase the cost of traveling through certain
path This is probably due to omission of important attributes in the deterministic part of
the cost function Based on the estimate we are led to think that presence of speed bump
decrease the cost and individuals would prefer to drive on paths with speed bumps Yet
62
this is not true based on our estimation since we are only using two attributes And there
are great chance that some important features are not captured which accidentally are
related with speed bump So the estimate of SBβ is misleading per se in the simple model
as we are using To get more accurate estimate of SBβ we may need to include more
variables in the deterministic part of the cost function
642 Model with estimated scale parameter for random term
Considering the trial with two attributes in Section 63 we add a fixed scale parameter to
the random term to make it proportional to the length of links This appeals to our
assumption yet lays restrictions to the model Apart from this we also try to add an
unfixed scale parameter σ and estimate it along with the other two parameters Lengthβ and
SBβ Note that if we add a scale parameter directly to the random term it wonrsquot work out
as we expect since that way the scale parameter will scale the other two parameters
Lengthβ and SBβ as well as shown below
= ( )Length SBLength Length l SB SB l li Length l SB l lix x x x
β ββ β ε σ σ εσ σ
+ + sdot + + (45)
The right side equation is equivalent to Length Length l SB SB l lix xβ β ε+ + thus making no
difference So we choose to add a new random term including the scale parameter In
addition since we can get good estimate by assuming the random term proportional to
length we will keep this in the newly added random term Now the cost function is
specified as
1 ( ) + ( )l li li Length Length l SB SB l li li Length l Lengthc x x x x Mean xε ε β β ε η σ= + + sdot sdot 2
(46)
liε and liη follow the same truncated normal distribution but are drawn separately so that
they are not equal
In terms of the auxiliary model since now we have three parameters to be estimated in
the underlying model we need one more attribute in the logit model and number of links
in the path LNx is chosen The utility function of the logit model is actually the same as in
Section 641 which is
- - -ri Length Length r SB SB r LN LN r riU x x xθ θ θ ε= + (47)
63
With three parameters in the underlying model it is more reasonable to include
interactions of parameters in the binding function The binding functions take the form of
ɶ
1 2 3
4 5 6 7
( )
Length SB
Length SB Length SB Length SB
c d d d
d d d d
θ β β β σβ β β σ β σ β β σ
= + + +
+ + + + (48)
Since the estimates are not good we did not carry out too many trials to center the input
interval As a result the binding function may be of more interest in this case The chosen
interval is a trial one which is identical [0 3] for Lengthβ SBβ andσ We choose ten sets of
mβ and ɶ ( )m mθ β from one run as an example The values of ɶ ( )m mθ β are plotted against
Lengthβ SBβ andσ respectively The interactions are not shown in the figure yet we have
the estimates of binding function which will give a numerical description of how the
interactions impact theɶ ( )m mθ β
Figure 20 Plots of theta_length against beta_length beta_sb and sigma respectively
y = 09114x + 27818
Rsup2 = 07361
0
1
2
3
4
5
6
0 1 2 3 4
the
ta_
len
gth
beta_length
y = 03568x + 36215
Rsup2 = 00897
0
1
2
3
4
5
6
0 1 2 3 4
the
ta_
len
gth
beta_sb
y = 02572x + 38468
Rsup2 = 00516
0
1
2
3
4
5
6
0 1 2 3
the
ta_
len
gth
sigma
64
Figure 21 Plots of theta_sb against beta_length beta_sb and sigma respectively
y = 02363x + 0835
Rsup2 = 0088
0
05
1
15
2
25
3
0 1 2 3 4
the
ta_
sb
beta_length
y = 06351x + 01759
Rsup2 = 05054
0
05
1
15
2
25
3
0 1 2 3 4
the
ta_
sb
beta_sb
y = -03801x + 17212
Rsup2 = 02001
0
05
1
15
2
25
3
0 1 2 3
the
ta_
len
gth
sigma
y = 00477x + 04521
Rsup2 = 005460
02
04
06
08
1
0 1 2 3 4
the
ta_
ln
beta_length
y = -00553x + 06156
Rsup2 = 00582
0
02
04
06
08
1
0 1 2 3 4
the
ta_
ln
beta_sb
65
Figure 22 Plots of theta_ln against beta_length beta_sb and sigma respectively
As we can see from the three figures above ɶ Lengthθ ɶSBθ and ɶ LNθ are more affected by
Lengthβ SBβ andσ respectively Especially we can see a strong relationship between ɶ LNθ
and σ which assures that number of links can be used to infer the scale parameter in the
underlying model
The estimates of three binding functions are shown in Table 10 below with each row
representing the estimates for one of the three binding function and each column
representing certain variable in the binding function In the parenthesis below each
estimate of the coefficients is the t-test value with the null hypothesis of zero We take the
90 confidence interval and estimates with t-test value larger than 164 are supposed to
be significantly different from zero which are marked as bold
Table 10 Estimates of three binding functions
Constant Lengthβ SBβ σ
Length SBβ β
Lengthβ σ
SBβ σ Length SBβ β σ
ɶLengthθ
1814 (3085)
0861 (2417)
-0089 (-0258)
1038 (2913)
0202 (1030)
-0246 (-1240)
-0056 (-0292)
-0045 (-0412)
ɶSBθ 0284
(1482) -0125
(-1081) 0942
(8371) -0247
(-2127) 0118
(1856) 0070
(1086) -0141
(-2275) -0067
(-1883)
ɶLNθ 0819
(18643) 0015
(0577) -0026
(-0997) -0261
(-9794) 0006
(0419) 0007
(0498) 0024
(1663) -0007
(-0803)
As the constants indicate given no other attributes length and number of links have more
negative effects on the utility than the speed bump dummy does Judging from the
significance of coefficients for the three input parametersɶ Lengthθ ɶSBθ and ɶ LNθ are
significantly affected by Lengthβ SBβ andσ respectively As we can see σ has a negative
y = -02164x + 08218
Rsup2 = 09867
0
02
04
06
08
1
0 1 2 3th
eta
_ln
sigma
66
effect on ɶSBθ andɶ LNθ Since to some extent σ measures the scale of randomness we
could say that the more randomness of the costs on the links have the less influential of
presence of speed bump and number of links become ForɶSBθ it is significantly affected
by some of the interaction terms Notice that SBβ has positive effect onɶSBθ while σ has
effect The interaction terms including both σ and SBβ have negative effect onɶSBθ which
indicates that randomness of cost is more influential than presence of speed bump on the
disutility of speed bump
In terms of the final estimate as stated above the estimates of Lengthβ and SBβ have
negative signs whileσ has positive sign This result conflict our expectation that Lengthβ
and SBβ should have positive signs so we did not carry out more trials and shrinkage The
possible reason for negative estimate is similar to that in the model with exponential form
of cost function Given more attributes in the deterministic part of both the cost function
and utility function in the logit model we might be able to capture the features of the data
better and have the right sign in the final estimates
643 Monte Carlo evidence of model with estimated scale parameter for random
term
Based on the model formulation with estimated scale parameter for random term we also
carried out a Monte Carlo simulation experiment to verify the efficiency of using number
of links in the logti model to infer the scale parameter in the cost function and what we
do is to simulated observations instead of the true ones
We take three arbitrary values for the three parameters in the cost functionLengthβ SBβ and
σ to be 05 And simulated observations are generated based on the given values of
parameters in the cost function Since we know the true values for the parameters the
input domain is centered around the true values to be [04 06] for Lengthβ SBβ andσ
10K = runs are carried out to get statistics of the estimates of the three parameters
Within each run 10M = values are drawn for inputsLengthβ SBβ andσ respectively for
estimating binding function
67
In terms of the binding function by doing regression test we can see that the intersection
terms are unnecessary to be included or even hazardous for good estimate of binding
function so we decide to remove them and keep the binding function as
ɶ1 2 3( ) Length SBc d d dθ β β β σ= + + + (49)
We choose ten sets of mβ and ɶ ( )m mθ β from one run as an example The values of
ɶ ( )m mθ β are plotted againstLengthβ SBβ andσ respectively
Figure 23 Plots of theta_length against beta_length beta_sb and sigma respectively
y = 23826x + 14791
Rsup2 = 05326
15
2
25
3
35
04 05 06
the
ta_
len
gth
beta_length
y = -06434x + 30245
Rsup2 = 0048115
2
25
3
35
04 05 06
the
ta_
len
gth
beta_sb
y = 26255x + 14156
Rsup2 = 07607
15
2
25
3
35
04 05 06
the
ta_
len
gth
sigma
y = -02443x + 04708
Rsup2 = 0034
0
01
02
03
04
05
04 05 06
the
ta_
sb
beta_length
y = 11233x - 02096
Rsup2 = 089020
01
02
03
04
05
04 05 06
the
ta_
sb
beta_sb
68
Figure 24 Plots of theta_sb against beta_length beta_sb and sigma respectively
Figure 25 Plots of theta_ln against beta_length beta_sb and sigma respectively
The figures show similar trend to those in the trial model with estimated scale parameters
which is in line with our expectation
The estimates of three binding functions are shown in Table 11 below with each row
representing the estimates for one of the three binding function and each column
y = -04374x + 056
Rsup2 = 01283
0
01
02
03
04
05
04 05 06
the
ta_
sb
sigma
y = -01144x + 07619
Rsup2 = 01114066
067
068
069
07
071
072
073
074
04 05 06
the
ta_
ln
beta_length
y = 0053x + 06768
Rsup2 = 00296066
067
068
069
07
071
072
073
074
04 05 06
the
ta_
ln
beta_sb
y = -03115x + 08561
Rsup2 = 09717
066
067
068
069
07
071
072
073
074
04 05 06
the
ta_
ln
sigma
69
representing certain variable in the binding function In the parenthesis below each
estimate of the coefficients is the t-test value with the null hypothesis of zero We take the
95 confidence interval and estimates with t-test value larger than 196 are supposed to
be significantly different from zero which are marked as bold
Table 11 Estimates of three binding functions in the Monte Carlo experiment
Constant Lengthβ SBβ σ
ɶLengthθ 0853
(3606) 1009
(3724) -0034
(-0125) 2569
(9482)
ɶSBθ -0062
(-0385) -0104
(-0564) 1208
(6591) -0226
(-1227)
ɶLNθ 0854
(46688) 0013
(0624) -0004
(-0185) -0302
(-14428)
The estimates of binding function have similar characteristics as in the trial model with
estimated scale parameters as well They contain almost the same significant coefficients
and those significant estimates have the same signs as in the trial with true observations
Based on the estimated binding function and the simulated observations given true values
of the three parameters to be 05 the final estimates of Lengthβ SBβ andσ are shown in
Table 12 below
Table 12 Statistics of estimation of beta_length beta_sb and sigma in the Monte Carlo experiment
Parameter Lengthβ
SBβ σ
Mean 0404138359 0458624533 0639191487
Standard deviation 1109279424 0242570421 0377069799
As we can see the estimates of Lengthβ SBβ andσ are quite close to their true values What
is not satisfying is that the estimate of σ is a little large and lies outside the input domain
of [04 06] but is still quite near to this interval In addition the estimate of Lengthβ is
within the input domain yet the variation is large This is understandable since we scale
the random term by length together with the scale parameter and thus the parameter for
length could be influenced by the random term and turns out to have large variations In a
word the result of Monte Carlo experiment verifies that we get use the model
70
formulation with unfixed scale parameter for the random term to get the right estimate of
the true values And number of links is strongly related withσ which means that it is
reasonable and efficient to use it as a reference to σ in the cost function
71
7 Conclusions
This thesis aims at implementing the newly proposed route choice model based on
indirect inference in true observations The model assigns links specific errors for a
network which allows natural correlations among paths and is practical in simulating
observations by means of shortest path searching algorithms like the Dijkstrarsquos Algorithm
used in our experiment To get consistent estimation of this kind of model indirect
inference method is used and a simple model like logit model is used as an auxiliary
model The route choice model and indirect inference estimator has been tested on
synthetic data with simulated observations and proved to be capable of consistently
estimated
Compared to the synthetic experiment some extensions are done in this thesis By
replacing the simulated observations with the true observations the method is tested on
the empirical circumstance to prove that it could be used in solving practical problems
The true observations have more noises than the simulated ones thus more difficulty to
capture their features We know neither the right formulations of models based on the
data nor the values of parameters in the route choice model yet as defined the
parameters should have positive signs As it turned out to be in the experiment with only
length in the model we get the estimates of Lengthβ as 1337 while with two attributes in
the model we get the estimates of Lengthβ and SBβ as 0761 and 00799 respectively The
estimates in both experiments seem reasonable with the right sign In addition seen from
the estimation of the binding function the coefficients in the logit model is negatively
affected by the parameters they infer in the basic route choice model in the two attributes
case one parameter in the logit model is more apparently affected by the parameter it
refers than the other parameter in basic model
In the trial where we include a scale parameter to the random term and estimate it along
with the other parameters in the route choice model a Monte Carlo simulation
experiment is carried out using simulated observations The result shows that it is
efficient to use number of links in the auxiliary model to infer the scale parameter in the
basic rout choice model
72
In other trial formulations of the model we got negative estimates which may probably
be due to missing attributes in the cost function Future work should be done to include
more attributes
Another thing to recommend for future is that we generate the pseudo-universal choice
set as part of the auxiliary model Since the pseudo-universal choice set is partially used
for deciding which ODs and observations to be used in the project it is essential and
should be generated beforehand But from the choice set generation point of view we
could generate individual specific choice set directly instead of random drawing paths
from the pseudo-universal choice set This would increase computational efficiency
73
Bibliography
Axhausen K Schoumlnfelder S Wolf J Oliveira M amp Samaga U (2003) 80 Weeks of
GPS Traces Approaches to Enriching the Trip Information Transportation Research
Record 1870 46-54
Azevedo J Costa M Madeira J amp Martins E (1993) An Algorithm for the Ranking
of Shortest Paths European Journal of Operational Research 69 (1) 97-106
Bartels K Boztug Y amp Muumlller M (1999) Testing the Multinomial Logit Model
Working paper University Potsdam Germany
Bekhor S Ben-Akiva M amp Ramming M (2002) Adaptation of Logit Kernel to Route
Choice Situation Transportation Research Board of the National Academics 1805 78-85
Bekhor S Ben-Akiva M amp Ramming M (2006) Evaluation of Choice Set Generation
Algorithms for Route Choice Models Annals of Operations Research 114 (1) 235-247
Ben-Akiva M amp Bierlaire M (1999) Discrete Choice Methods and Their Applications
to Short Term Travel Decisions In Chapter for the Transport Science Handbook
Preliminary Draft
Ben-Akiva M amp Bierlaire M (2003) Discrete Choice Models with Applications to
Departure Time and Route Choice In Handbook of Transportation Science (second ed)
Kluwer
Ben-Akiva M amp Bolduc D (1996) Multinomial Probit with a Logit Kernel and a
General Parametric Specification of the Covariance Structure Working Paper
Ben-Akiva M amp Lerman S (1985) Discrete Choice Analysis Theory and Application
to Travel Demand MIT Press
Ben-Akiva M Bergman M Daly A amp Ramaswamy R (1984) Modeling Inter Urban
Route Choice Behaviour In J Vollmuller amp R Hamerslag (Ed) the 9th International
Symposium on Transportation and Traffic Theory (pp 299-330) Utrecht Netherlands
VNU Science Press
Cascetta E Nuzzolo A Russo F amp Vitetta A (1996) A Modified Logit Route Choice
Model Overcoming Path Overlapping ProblemsSpecification and Some Calibration
Results for Interurban Networks In J Lesort (Ed) the 13th International Symposium on
Transportation and Traffic Theory Lyon France
74
Creel M (2009) A Data Mining Approach to Indirect Inference Universitat Autonoma
de Barcelona Department of Economics and Economic History
De La Barra T Peacuterez B amp Anez J (1993) Multidimensional Path Search and
Assignment 21st PTRC Summer Meeting (pp 307-319)
Dijkstra E (1959) A note on two problems in connexion with graphs Numerische
Mathematik 1 269-271
Frejinger E amp Bierlaire M (2007) Capturing Correlation with Subnetworks in Route
Choice Models Transportation Research Part B 41 363-378
Frejinger E Bierlaire M amp Ben-Akiva M (2009) Sampling of Alternatives for Route
Choice Modeling Transportation Research Part B Methodological 43 (10) 984-994
Gallant A amp McCulloch R (2004) On the Determination of General Scientific Models
Manuscript Duke University
Gourieacuteroux C Monfort A amp Renault E (1993) Indirect Inference Journal of Applied
Econometrics 8 85-118
Karlstroumlm A Sundberg M amp Wang Q (2011) Consistently estimating flexible route
choice models using an MNL lense International Choice Modeling Conference Leeds
Keane M amp Smith A (2003) Generalized Indirect Inference for Discrete Choice
Models Manuscript Yale University
Manski C amp Lerman S (1977) The Estimation of Choice Probabilities from Choice
Based Samples Econometrica 45 (8) 1977-1988
McFadden D (1974) Conditional Logit Analysis of Qualitative Choice Behaviour (P
Zarembka Ed) Frontiers in Econometrics 105-142
McFadden D (1978) Modeling the Choice of Residential Location In A Karlqvist L
Lundqvist F Snickars amp J Weibull (Ed) Spatial Interaction Theory and Residential
Location (pp 75-96) Amsterdam North-Holland
McFadden D amp Train K (2000) Mixed MNL Models for Discrete Response Journal
of Applied Econometrics
Nerella S amp Bhat C (2004) Numerical Analysis of Effect of Sampling of Alternatives
in Discrete Choice Models Transportation Research Record 1894 11-19
Ramming M (2001) Network Knowledge and Route Choice PhD Thesis Massachusetts
Institute of Technology
75
Schoumlnfelder S amp Samaga U (2003) Where Do You Want to Go Today-More
Observations on Daily Mobility Third Swiss Transport Research Conference Ascona
Schoumlnfelder S Axhausen K Antille N amp Bierlaire M (2002) Exploring the
Potentials of Automatically Collected GPS Data for Travel Behaviour Analysis- A
Swedish Data Source i J Moumlltgen amp A Wytzisk (Red) GI-Technologien fuumlr Verkehr
und Logistik number 13 Institut fuumlr Geoinformatik Universitaumlt Muumlnster (ss 155-179)
Munster IfGIprints
Smith A (1993) Estimating Nonlinear Time-series Models Using Simulated Vector
Autoregressions Journal of Applied Econometrics 8 63-84
Smith A (2008) Indirect Inference In S Durlauf amp L Blume (Eds) The New
Palgrave Dictionary of Economics (Second ed) Palgrave Macmillan
Smith A (1990) Three Essays on the Solution and Estimation of Dynamic
Macroeconomic Models PhD Dissertation Duke University
Train K (2003) Discrete Choice Methods with Simulation Cambridge University Press
Vovsha P amp Bekhor S (1998) Link-nested Logit Model of Route Choice-Overcoming
Route Overlapping Problem Transportation Research Record 1645 133-142
Wang H (2011) Logistics Distribution Shortest Path Based on Dijkstra Algorithm
Computer and Digital Engineering 3
Assigned publication number
TSC-MT 11-016
wwwkthse

12
which iΓ is the set of links in pathi al and iL are the length of link a and pathi
respectively ajδ is the link incidence variable with value of 1 when link abelongs to path
j and zero otherwise And nCL is the shortest path in choice setnC The size of a path has
a maximum value of one when it shares no links with other paths
C-Logit model and PSL model are the most widely used models in practice of route
choice modeling due to their simple forms Since both of them originate from the MNL
model and maintain the basic MNL structure they can be estimated by existing software
designed for logit models Apart from these two types of models there are other recent
efforts in the route choice context
Bekhor Ben-Akiva and Ramming (2002) adapted the Logit Kernel model to apply in a
route choice context4 The Logit Kernel5 model was proposed by combing Gaussian and
Type I Extreme Value error terms by researchers such as Ben-Akiva and Bolduc (1996)
and McFadden and Train (2000) who also referred to it as Mixed Logit6 By making
certain assumptions under route choice context Bekhor Ben-Akiva and Ramming (2002)
proposed a way to apply the model to route choice modeling7 Based on the data from
Boston several kinds of models are estimated including multinomial logit model Path
Size Logit and the newly proposed Logit Kernel model Seen from the estimation results
Logit Kernel has a better overall performance than the other two kinds of models This
result needs to be verified in other data sets since the one used in the paper has a
relatively small size
Frejinger and Bierlaire (2007) proposed an approach to capture correlation among
alternative routes with subnetworks and carried out estimation based on several kinds of
route choice models8 The paper gives an overview of the latest development of route
choice modeling and discusses the Path Size Logit model in detail As part of the
4 Bekhor S Ben-Akiva M amp Ramming M (2002) Adaptation of Logit Kernel to Route Choice Situation Transportation Research Board of the National Academics 1805 78-85 5 Ben-Akiva M amp Bolduc D (1996) Multinomial Probit with a Logit Kernel and a General Parametric Specification of the Covariance Structure Working Paper 6 McFadden D amp Train K (2000) Mixed MNL Models for Discrete Response Journal of Applied Econometrics 7 Bekhor S Ben-Akiva M amp Ramming M (2002) Adaptation of Logit Kernel to Route Choice Situation 8 Frejinger E amp Bierlaire M (2007) Capturing Correlation with Subnetworks in Route Choice Models Transportation Research Part B 41 363-378
13
conclusion a behavioral interpretation of the Path Size in the model is given The
subnetwork is defined so that the alternative routes sharing the same section of it are
seen as correlated This correlation is captured using the Error Component model and
estimation results show that this new approach gives better property than PSL models To
complement the paper uses a real size network and true travel data is collected which is
the same network we are going to use in this thesis project Additionally the paper
displays forecasting results which indicates that models with Path Size component tend
to have bad performance in prediction
Ben-Akiva and Bierlaire (2003) pointed out that under route choice context the
significant correlation among alternatives due to path overlapping and the generation of
choice set are two important issues and main difficulties9
There are some algorithms used in practice for generating choice set for route choice
modeling both deterministic methods and stochastic ones The deterministic methods
tend to give the same set of paths for a given OD pair Some examples are the link
penalty algorithm (De La Barra Peacuterez amp Anez 1993) which increases gradually the
impedance of all the links on the shortest path10 the link elimination algorithm (Azevedo
Costa Madeira amp Martins 1993) which removes links on the shortest path in sequence
to generate new paths11 and the labeled paths (Ben-Akiva Bergman Daly amp
Ramaswamy 1984)12 In terms of the stochastic methods they tend to produce individual
specific choice set One example is the simulation method (Ramming 2001) which
generates alternative paths by drawing link impedances from different distribution
densities13
When it comes to appraisal of the generated choice set some literatures give evaluations
on the efficiency of different sampling algorithms for choice set generation (See Bekhor
9 Ben-Akiva M amp Bierlaire M (2003) Discrete Choice Models with Applications to Departure Time and Route Choice In Handbook of Transportation Science (second ed) Kluwer 10 De La Barra T Peacuterez B amp Anez J (1993) Multidimensional Path Search and Assignment 21st PTRC Summer Meeting (pp 307-319) 11 Azevedo J Costa M Madeira J amp Martins E (1993) An Algorithm for the Ranking of Shortest Paths European Journal of Operational Research 69 (1) 97-106 12 Ben-Akiva M Bergman M Daly A amp Ramaswamy R (1984) Modeling Inter Urban Route Choice Behaviour In J Vollmuller amp R Hamerslag (Ed) the 9th International Symposium on Transportation and Traffic Theory (pp 299-330) Utrecht Netherlands VNU Science Press 13 Ramming M (2001) Network Knowledge and Route Choice PhD Thesis Massachusetts Institute of Technology
14
Ben-Akiva amp Ramming 2006 for example) Apart from this there are some recently
proposed methods for sampling alternatives under route choice context (See Frejinger
Bierlaire amp Ben-Akiva 2009 for example)
Nerella and Bhat (2004) carried out a numerical analysis on the effect of sample size on
the efficiency of the estimation of parameters14 The analysis is done for two kinds of
discrete choice models namely the multinomial logit model for which consistency of
estimation based on subset of alternatives is theoretically proved and non-MNL model
taking mixed multinomial logit model as an example Four evaluation criteria are chosen
namely the ability to recover model parameters ability to estimate overall log-likelihood
function value ability to estimate individual choice probabilities and ability to estimate
aggregate shares of alternatives The results show that the MNL model works well on
small sample size yet certain portion of full choice set need to be kept as a practical
baseline For the non-MNL model small sample size gives poor estimation and increase
of sample size gives obvious increase of estimation quality Certain portion of full choice
set is suggested for practical convenience yet the generalization of sample size portion is
not feasible since difference kinds of models may require different portion to guarantee
accuracy In general for the non-MNL models full choice set is suggested to be used if
feasible and larger sample gives better estimation
Bekhor Ben-Akiva and Ramming (2006) carried out route choice modeling based on a
large-scale urban network including both choice set generation part and route choice
estimation part which compose the process of route choice modeling together15 Given
that previous literatures did not pay too much attention to empirical estimation the paper
used a true observation data set collected in Boston As the first step several choice set
generation algorithms are listed and compared in their efficiency of reproducing the
observed paths on which the evaluation of the algorithms are based The data in Boston
is described in the paper and used in the second step ie model estimation Several route
choice models are presented and estimation results based on different kinds of models are
shown for comparison of the efficiency of the models The Path Size Logit model is
14 Nerella S amp Bhat C (2004) Numerical Analysis of Effect of Sampling of Alternatives in Discrete Choice Models Transportation Research Record 1894 11-19 15 Bekhor S Ben-Akiva M amp Ramming M (2006) Evaluation of Choice Set Generation Algorithms for Route Choice Models Annals of Operations Research 114 (1) 235-247
15
proposed for its property to overcoming the drawbacks of the conventional MNL models
This type of model can be easily estimated using popularized software The main
conclusion is that route choice models could be estimated for large-scale networks based
on the true observation data and prominent computing resources
Frejinger Bierlaire and Ben-Akiva (2009) proposed a paradigm for choice set generation
based on sampling for route choice modeling16 In the context of route choice modeling
the universal choice set which denotes all possible alternatives for a traveler to choose
from is not able to be enumerated So we practically work on a sampled choice set from
the universal one which may easily introduce bias to the final estimate In this paradigm
they focus on unbiased estimation of parameters instead of generating actual choice set
The path generation is seen as an importance sampling approach and a correction of
sampling is added to the path utility Since the following estimation process is based on
the sampled choice set which is treated as the universal one a correction for sampling is
added to the path size attribute in the commonly used path size logit (PSL) model ending
up with the expanded path size Modification in the previous two steps guarantees
unbiased estimation of the parameters Numerical results based on synthetic data are
presented in the paper to reveal that models with a sampling correction in the path utility
are better than those without it The proposed expanded path size logit model provides
unbiased estimation and is better than the original path size models
In this paper we will examine indirect inference Indirect inference is not a new method
it was first introduced by Smith (1990 1993)17 Then Gourieacuteroux et al (1993) gave
overall introduction to the methods and extended it in important ways18 Gallant and
McCulloch (2004) transferred the idea of indirect inference and used it for Bayesian
inference in models where likelihood function is intractable19
16 Frejinger E Bierlaire M amp Ben-Akiva M (2009) Sampling of Alternatives for Route Choice Modeling Transportation Research Part B Methodological 43 (10) 984-994 17 Smith A (1990) Three Essays on the Solution and Estimation of Dynamic Macroeconomic Models PhD Dissertation Duke University Smith A (1993) Estimating Nonlinear Time-series Models Using Simulated Vector Autoregressions Journal of Applied Econometrics 8 63-84 18 Gourieacuteroux C Monfort A amp Renault E (1993) Indirect Inference Journal of Applied Econometrics 8 85-118 19 Gallant A amp McCulloch R (2004) On the Determination of General Scientific Models Manuscript Duke University
16
Gourieacuteroux Monfort and Renault (1993) proposed the inference methods based on an
ldquoincorrectrdquo criterion which does not give consistent estimation to parameters of interest
directly20 The argument of the criterion is called the auxiliary parameter which may
have a larger dimension than the parameters of interest in the basic model After the
auxiliary parameters are selected a simulation-based process is carried out to get a
consistent and asymptotically normal estimator of parameters of interest As a simulation-
based method the only requirement for the basic model is that it could be simulated
regardless of formulations of the model So it could be used for estimating models which
are too complex to carry out direct approaches The paper shows how this kind of method
can be applied in fields such as micro-econometrics macro-econometrics and
econometrics of finance
Keane and Smith (2003) proposed a generalized form of the indirect inference method to
be implemented in the discrete choice model context21 Theoretically indirect inference
could deal with estimation of any economic models yet it has some limitations per se that
decrease the estimation efficiency or even make it difficult to implement Problems arise
when we use indirect inference in estimating discrete choice models since the objective
function the metric of distance between the auxiliary models estimated on observed data
and simulated data to be specific is inherently discrete which leaves the gradient-based
optimization methods infeasible Keane and Smith (2003) proposed that the estimation
procedures used for observed data and simulated data can be different22 Instead of the
discrete choice a continuous function of latent utilities including a smoothing parameter
is used as the dependent variable in the auxiliary model When the smoothing parameter
goes to zero the function of latent utilities converges to the discrete choices this way to
guarantee consistency According to the Monte Carlo results the generalized indirect
inference method proposed in this paper yields good estimates in small samples being as
efficient as maximum likelihood estimates in comparison
20 Gourieacuteroux C Monfort A amp Renault E (1993) Indirect Inference 21 Keane M amp Smith A (2003) Generalized Indirect Inference for Discrete Choice Models Manuscript Yale University 22 Keane M amp Smith A (2003) Generalized Indirect Inference for Discrete Choice Models
17
Creel (2009) presented a data mining approach to indirect inference23 which is similar to
the regular indirect inference method yet with certain advantages over it The method is a
simulation-based estimator relying also on an auxiliary model In line with the indirect
inference method an underlying economic model with parameterβ is referenced by an
auxiliary model with parameterθ Certain values of the parameter hβ in underlying
economic model are drawn randomly from a known density simulated data is generated
using Monte Carlo methods to estimate ɶh
θ of auxiliary model which ends up with a set
of tuples ɶ( )hhβ θ Nonparametric methods are used to get the function ɶ( | )E aβ θ = and
the final estimate of β is supposed to be the result of regression function evaluated at the
estimate of θ based on true observations ɶ ɵ( | )Eβ β θ θ= = Creel (2009) also presented a
way of calculating confidence intervals24 Monte Carlo results in dynamic and nonlinear
panel models and vector autoregressions show good performance of the new estimator
23 Creel M (2009) A Data Mining Approach to Indirect Inference Universitat Autonoma de Barcelona Department of Economics and Economic History 24 Creel M (2009) A Data Mining Approach to Indirect Inference
18
3 Methodology
31 Multinomial Logit Model (MNL)
311 Model Description
Route choice modeling is somewhat complicated when we want to capture the attributes
of both the alternative routes and choice maker accurately and reflect the choice making
process in the model Intuitively route choice can be regarded as choosing one specific
route from several alternative routes which coincides with the prerequisites of discrete
choice models Actually a lot of literatures have explored the route choice modeling and
possible improvements based on discrete choice models (see Cascetta et al 1996 Vovsha
and Bekhor 1998 Ben-Akiva and Bierlaire 1999 for more information on development
in route choice models with regard to discrete choice models)25
To understand the frontier development of route choice model we have got to know the
discrete choice models among which multinomial logit model (MNL) is the most widely
used In addition we choose to implement a new method ndash indirect inference in which
MNL is used as it is
Logit model is the most widely used discrete choice model till now due to its excellent
qualities in model specification To be specific the choice probability takes a closed form
which is easy to estimate and interpret (Train 2003)26
The multinomial logit model is a kind of choice model with more than two alternatives in
the choice set We assume that the choice maker makes his or her decision based on the
utility maximization rule (Ben-Akiva amp Lerman 1985)27 With regard to the utility njU
the decision maker n obtains from the thj alternative in the choice set it is made up of
two parts the deterministic part and the stochastic part The deterministic part denoted
25 Cascetta E Nuzzolo A Russo F amp Vitetta A (1996) A Modified Logit Route Choice Model Overcoming Path Overlapping ProblemsSpecification and Some Calibration Results for Interurban Networks Vovsha P amp Bekhor S (1998) Link-nested Logit Model of Route Choice-Overcoming Route Overlapping Problem Transportation Research Record 1645 133-142 Ben-Akiva M amp Bierlaire M (1999) Discrete Choice Methods and Their Applications to Short Term Travel Decisions 26 Train K (2003) Discrete Choice Methods with Simulation Cambridge University Press 27 Ben-Akiva M amp Lerman S (1985) Discrete Choice Analysis Theory and Application to Travel Demand MIT Press
19
by njV contains attributes known by the modelers while the stochastic part denoted by
njε is the attributes affecting peoplersquos the decision which cannot be observed by the
modelers yet are known by the decision makers themselves So the utility function turns
out to be
nj nj njU V jε= + forall (1)
The type of choice model is basically decided by the distribution of the stochastic part
When we assume that njε is independently identically Gumbel distributed the model
becomes a logit model
As stated above the decision follows utility maximization rule which means that the
decision maker n chooses the alternative with the highest utility say the thi alternative
Use as the probability the thi alternative is chosen over the others we have
( max ) ( )
( )
( )
ni ni nj ni njj C
ni ni nj nj
nj ni ni nj
P P U U P U U j i
P V V j i
P V V j i
ε εε ε
isin= = = ge forall ne
= + gt + forall ne
= minus lt minus forall ne (2)
With Equation (2) above and the assumption that njε follows iid Gumbel distribution we
could derive the probability of decision maker n chooses alternativei which is
ni
nj
V
ni V
j
eP
e=sum
(3)
Typically we specify the deterministic part of the utility function in a linear form which
is nj njV xβ= Then the probability becomes
ni
nj
x
ni x
j
eP
e
β
β=sum
(4)
This is the most common form of probability function for multinomial logit models
There are some good properties for this kind of logit probability as discussed by Train
(2009)28 With this form the probability of choosing certain alternative will be between
zero and one inherently which is basically required for probability definition Yet the
28 Train K (2003) Discrete Choice Methods with Simulation
20
value of niP will never drop to zero mathematically which means that all the alternatives
in the choice set are perceived to have chance to be chosen On the other hand if an
alternative is perceived never to be chosen it should not be included in the choice set at
all
The probabilities for all the alternatives in the choice set sums to be one which is easily
illustrated from the analytical properties 1 1 1
( ) 1njni
J J JVV
nii i j
P e e= = =
= =sum sum sum in which J denotes
the number of alternatives in the choice set
The logit probability and the deterministic part of the utility function follow an S-shaped
curve line shown in Figure 1 below
Figure 1 S-shaped relationship between probability and deterministic part of utility
This property gives implications for possible impacts of the deterministic utility of certain
alternative on its chances to be chosen We could see that when an alternative has about
50 probability to be chosen which infers to the steepest part on the curve a small
change in the deterministic part of the utility function could lead to a large change in the
probability the alternative has to be chosen
Apart from the nice properties of logit probability logit models have some disadvantages
as well (Bartels Boztug amp Muumlller 1999)29 One shortcoming is the assumption of
29 Bartels K Boztug Y amp Muumlller M (1999) Testing the Multinomial Logit Model Working paper University Potsdam Germany
21
Gumbel distribution of error terms in the utility function The inherent requirement for
iid property sets restrictions for logit model to be widely used especially in route choice
modeling context Several models have been proposed to overcome this shortcoming in
particular modifications based on MNL to adjust it to route choice practices have been
proposed Another drawback is the assumption of the linear composition for the
deterministic part of utility function Actually this assumption is for ease of following
estimation process since McFadden (1974) demonstrated that under this condition the
probabilities will be universally concave with regard to the coefficientsβ 30 which
improves the performance of numerical estimation Yet there could be nonlinear
compositions in the deterministic part to relax the restriction Under this condition the
universal concavity cannot be guaranteed which may lead to local convergence in the
estimation process
312 Model Estimation
The most commonly used numerical estimation method for multinomial logit models is
the Maximum Likelihood Estimation (MLE) In principle given a set of data and the
underlying probability model the method tries to find coefficients of the probability
model with which produced data has a distribution most likely resembles the distribution
of the observed data
Consider the case that N decision makers with their choice data are obtained Parameters
to be estimated are the coefficients in the utility function denoted byβ We could then
use the MLE to try to get the values of β vector with which the probability that choice
maker choose their observed alternatives is maximized
The probability of choice maker n to choose his or her observed alternative can be
written as
( ) niyni
i
Pprod (5)
in which niy is a dummy with value 1 if choice maker choose alternative i and value 0
otherwise
30 McFadden D (1974) Conditional Logit Analysis of Qualitative Choice Behaviour (P Zarembka Ed) Frontiers in Econometrics 105-142
22
Choice makers choose their alternative independently from each other so the probability
of all sampled choice makers choose their observed alternative is
1
( ) ( ) ni
Ny
nin i
L Pβ=
= prodprod (6)
This is the likelihood function with regard to the parameters to be estimated β in this
case We can take the logarithm of it to get the log-likelihood function
1
( ) lnN
ni nin i
LL y Pβ=
=sumsum (7)
Since we aim at getting the value of β to make the log-likelihood function maximized
we can take the derivative of it with respect to β and set it to zero
( )
0dLL
d
ββ
= (8)
By solving this equation we could get the estimate of β
32 Dijkstrarsquos Algorithm
321 Introduction
A method is needed for generating feasible alternatives and compose the choice set as
well as for deriving simulated observations for each OD pair in the process of indirect
inference As for choice set generation we would like to include certain number of high
ranking shortest paths in the choice set since these paths tend to have more possibility to
be chosen Similar to this the simulated observation is generated as the shortest path
between each OD pair We implement a method for shortest path finding which is the
Dijkstrarsquos Algorithm
Dijkstrarsquos Algorithm is named after the Dutch computer scientist Edsger Dijkstra who
conceived this method in 1956 and got it published in 195931 This is a graph search
algorithm aiming at solving shortest path problem for a graph the edge cost of which is
defined nonnegative The outcome of it is a shortest path tree demonstrating the path with
lowest value with respect to the defined cost
31 Dijkstra E (1959) A note on two problems in connexion with graphs Numerische Mathematik 1 269-271
23
This algorithm deals with single-source problem To be specific given one source node in
the graph the algorithm will give paths with the lowest value with regard to cost from
this source node to every other node in the network Given certain criterion we could use
the algorithm to find shortest path between two specific nodes by setting one node as the
source and the other as the target
After released it is widely used in path searching problems especially in transportation
related practices Routing problem is considered in investigation on traffic assignment
and optimization in logistics Real sized road network could be perceived as a graph with
vertices and edges in which cities can be abstracted as the vertices in the graph and the
roads connecting cities can then be regarded as the edges With the aid of Dijkstrarsquos
Algorithm the shortest path with respect to cost could be found from certain city to the
other cities The outcome is valuable for logistics corporations to work out their region-
wide distribution plans32
322 Algorithm
We connect a ldquodistancerdquo value with all the vertices in the graph indicating its distance
from the source vertex To be accurate the ldquodistancerdquo could be actual length of edges or
the generalized cost on the edges or anything desired The source vertex is defined as the
initial node with a value of zero In the process Dijkstrarsquos Algorithm will assign values
to vertices detected in one loop and update the values in the following loops till a
minimum value is found for each vertex The steps for searching and updating are
presented below
1 Initialize the network and assign the distance values of vertices other than the initial
node as infinity
2 When one vertex is to be detected it is denoted as current node All the vertices that
have been detected and attained the minimum distance values will be marked as detected
and will not be detected in the following loops while the vertices remaining unvisited
will be marked undetected To initialize all the vertices are marked undetected and the
initial node is set as current node
32 Wang H (2011) Logistics Distribution Shortest Path Based on Dijkstra Algorithm Computer and Digital Engineering 3
24
3 For current node all its directly connected adjacent nodes are considered except for
the newly detected vertex Labeled distance values of the neighbor vertices will be
updated if the calculated values from current node are smaller than their current values
For example current node A has a distance value of 4 and one of its neighbors B has a
value of 8 The edge linking A and B has a distance of 2 The newly calculated distance
value for B will be 4+2=6 which is smaller than 8 So the labeled distance value for B
will be updated to 6 indicating that the minimum distance from the source vertex to B till
now is 6 and the path should pass A
4 When all the neighbors of the current node are considered and updated mark the
current node as detected And mark the undetected node with the lowest distance value as
the current node and do the detection in step 3 again
5 When all the vertices in the network are marked detected the algorithm is finished and
we get the minimum distance from the source to all the other vertices The shortest path
from the source to a specific vertex could be found out following the detecting process
As mentioned above the stop criterion could also be modified as we desired If we aim at
finding the shortest path between two vertices at the beginning one vertex should be set
as the initial node and the algorithm could be stopped once the other vertex is marked as
detected
323 Explanatory Example
Here is a simple network to illustrate the mechanism of Dijstrarsquos Algorithm There are
five vertices and six edges with distance values labeled beside We define A as the source
and set it the initial node
Figure 2 A simple network for Dijstrrarsquoa Algorithm explanation
25
Initialization
Initial node A
Detected null
Distance value A=0 B=C=D=E=+infin
Loop 1
Current node A
Adjacent vertices B C
Detected null
Distance value A=0 B=4 C=1 D=E=+infin
Loop 2
Current node C
Adjacent vertices B D
Detected A
Distance value A=0 C=1 B=min 4 C+2 =3 D=C+3=4 E=+infin
Loop 3
Current node B
Adjacent vertices E
Detected A C
Distance value A=0 C=1 B=3 D=4 E=B+3=6
Loop 4
Current node E
Adjacent vertices null
Detected A B C D
Distance value A=0 C=1 B=3 D=4 E=6
If we want to get the shortest path from A to E following the detecting process we could
know that it should be A-C-B-E
26
324 Discussion
Dijkstrarsquos Algorithm has a clear logical structure which makes it easy to understand as
well as to implement in programming Nonetheless this method cannot search directly
from one node towards the other to find the shortest path between the two It works more
like detecting all the adjacent nodes in terms of shortest paths and expands from the
source iteratively until the target node is included and that is when we could figure out
the shortest path between the two specific vertices This reveals the fact that the method
wastes a lot of time in the blind search leaving it inefficient In addition this method is
not able to deal with networks with negative edge values yet this is not a problem in our
research since link cost on our network is defined nonnegative
33 Indirect Inference
331 Introduction
For problems in route choice context choice set size may be way too large to enumerate
all the alternatives Yet estimation based on sampled choice set may introduce biases
which can be corrected in some special cases (see Frejinger Bierlaire amp Ben-Akiva
2009)33 While in cases where estimation models are not based on MNL say multinomial
probit model we could not find corrections for biases caused by sampled choice set
Estimator based on the principle of indirect inference is then introduced to overcome
inconsistency problem34
Indirect inference35 is a simulation-based method for estimating parameters in economic
models by making references to the parameters of interest (Smith 2008) It is motivated
when general statistical estimation method such as Maximum Likelihood is intractable or
as discussed above consistent estimation is required given that only sampled choice set is
available Since in economic analysis we tend to build models which guarantee scientific
logic and inclusion of necessary attributes quite often the models will end up
33 Frejinger E Bierlaire M amp Ben-Akiva M (2009) Sampling of Alternatives for Route Choice Modeling 34 Karlstroumlm A Sundberg M amp Wang Q (2011) Consistently estimating flexible route choice models using an MNL lense 35 Smith A (2008) Indirect Inference In S Durlauf amp L Blume (Eds) The New Palgrave Dictionary of Economics (Second ed) Palgrave Macmillan
27
complicated from statistical estimation point of view This in sequence spurs the wide use
of indirect inference in economic analysis
It is common character that simulation-based methods allows modelers to simulate data
from the economic model of interest given certain perceived values of the parameters to
be estimated Since to generate data is essential and simple the true challenge is how to
estimate coefficients Indirect inference uses an auxiliary model which gives a rich
description of the covariance patterns in the data by including certain variables from the
basic economic model On the other hand the auxiliary model does not need to reflect
accurately the data generating process since it is supposed to be estimated based on the
data derived not to generate data itself The basic function of the auxiliary model is that
it provides a criterion to compare observed data and simulated data from the basic
economics model
We do iterations with the aim of finding the parameters of the basic economic model so
the observed data and the simulated data from the basic model looks almost the same by
the criterion of auxiliary model To be specific the auxiliary model is estimated based on
both observed data and simulated data we choose parameters for the basic model to
make sure that the two estimator of auxiliary model are as close as possible Based on
this idea the auxiliary model should be easy to estimate
332 Definition of the method
We define an economic model with the form of
( ) 12t t ty G x t Tε β= = (9)
in which 1 Tt tx = is a sequence of observed exogenous variables 1 T
t ty = is a sequence of
observed endogenous variables and 1 Tt tε = is a sequence of unobserved random error
terms β is a k -dimensional coefficient vector of the exogenous variables (Smith
2008)36
This model generally describes a relation that ty is dependent ontx with some random
errors Given the distribution of the random errors we could get the probability density
36 Smith A (2008) Indirect Inference
28
function of ty conditional on tx We will not focus on this density and instead this model
is only used for simulating data in indirect inference
In terms of the auxiliary model it could be defined by a probability density function with
the form of
( | )t tf y x θ (10)
in which θ is a p -dimensional coefficient vector and p is supposed to be not smaller
than k since we should capture characteristics of all the parameters in the underlying
economic model In addition the auxiliary model needs not be defined to reproduce the
distribution of ty in the basic model yet it needs to have a convenient analytical format
Based on the observed data we could estimate the parameters in the auxiliary model
using Maximum Likelihood Method
ɵ
1
arg max log ( | )T
t tt
f y xθ
θ θ=
= sum (11)
The estimated coefficient vectorɵθ could be used as an indicator of certain features of the
observed data
On the other hand the auxiliary model can be estimated based on simulated data from the
basic model as well We need to draw a sequence of random error terms 1 m Tt tε = from the
defined distribution in which m denotes the number of simulation with an interval of [1
M ] generally Given a coefficient vectorβ we could generate the values of endogenous
variables ɶ 1 ( )m T
tty β = which are explicitly dependent onβ With the help of Maximum
Likelihood Method we could get
ɶ ɶ
1 1
( ) arg max log ( ( ) | )M T m
ttm t
f y xθ
θ β β θ= =
= sumsum (12)
According to the principle of indirect inference we try to find the values of β to make
ɶ( )θ β as close toɵθ as possible Practically we need a metric to measure the distance
between ɵθ andɶ( )θ β and by minimizing the distance we could find out the estimates of
β in the basic economic model
29
333 Choices of the metrics
As mentioned above we need a metric to measure the distance betweenɵθ andɶ( )θ β
There are three approaches corresponding to the three classical hypothesis tests namely
Wald likelihood ratio (LR) and Lagrange multiplier (LM)37
In the Wald approach we try to minimize a quadratic form in the difference between the
two estimators ofɵθ andɶ( )θ β which is
ɵ ɶ ɵ ɶarg min( ( )) ( ( ))Wald
Wβ
β θ θ β θ θ β= minus minus (13)
in which W is a positive definite ldquoweightingrdquo matrix
In the LR approach a metric is formed based on the likelihood function related to the
auxiliary model which is
ɵ ɶ
1 1
arg min( log ( | ) log ( | ( )))T TLR
t t t tt t
f y x f y xβ
β θ θ β= =
= minussum sum (14)
According to the definition ofɵθ the first part of the objective function before the minus
sign on the right-hand side is always larger than the second part after the minus sign And
the first part is not dependent onβ
To minimize the objective function is equivalent to maximizing the log-likelihood
function withɶ( )θ β that is
ɶ
1
arg max( log ( | ( )))TLR
t tt
f y xβ
β θ β=
= sum (15)
In the LM approach the metric is formed using the derivative of the log-likelihood
function related to the auxiliary model which is
arg min ( ) ( )LM
S VSβ
β β β= (16)
in which
ɶ ɵ
1 1
( ) log ( ( ) | )M T m
ttm t
S f y xβ β θθ= =
part=partsumsum
(17)
and V is a positive definite matrix
37 Smith A (2008) Indirect Inference
30
By using any of the approaches we aim at getting the minimized distance betweenɵθ and
ɶ( )θ β so the value will approach to zero as expected So the hypothesis test of the
minimized value could be used as an indicator of whether the auxiliary model is suitably
specified In other words the minimized value being significantly different from zero
indicates a bad specification of the auxiliary model
In comparison the LM approach has an advantage over the others in computation when
it is relatively time-consuming to estimate the auxiliary model
334 Consistency Interpretation
Suppose the observed sample size T grows large while total number of simulations stays
fixed as M the estimator based on simulated data ɶ( )θ β will converge to a pseudo-true
value denoted as( )h β which is also dependent onβ This is called binding function
which characterized the relationship between the coefficients in the basic model and the
auxiliary model At the same time the estimator based on observed data ɵθ will converge
to a pseudo-true value0θ In case that T grows to a large number the aim of indirect
inference changes to finding β that guarantees0 ( )hθ β= This could explain that indirect
inference gives consistent estimate of the parameters in the basic economic model
In this project the binding function is what we focus on to get the correct estimates
instead of finding certain metrics Detailed methods will be discussed in the following
part
34 Model Specification in the Thesis
341 Basic Route Choice Model
Based on all the methods mentioned in previous sections the specification of models and
methods we use in the thesis will be explained in this section Since we are to estimate
the model based on true observations no model is known beforehand to adjust to the data
we use Several formulations of the model have been tested in the thesis The one
explained here could be seen as an example and all the other trials contain modifications
based on this model The other specifications of model will be explained along with the
results in the result section
31
We start by describing the underlying route choice model of interest38 We need to define
a road network as a representation of a real-size one from which we collected the trip
data The network denoted asN consists of a set of nodes (vertices) v and links (edges)
l Each link has a source node ( )s l and a target node or a destination node( )d l which
together indicate the direction of the link A path from an origin node ov to a destination
node dv could be seen as a sequence of links1 nl lhellip of which 1( ) os l v= 1( ) ( )i id l s l +=
and ( ) dnd l v= So a path can be defined by the index of links which is 1 nl lπ = hellip
A vector of characteristics denoted aslx is associated to each link as well as a strictly
positive cost function( )l lic x ε β in which liε is an individual specific random link cost
with i denoting the individual and β is a vector of coefficients of the link characteristics
left to be estimated In the Indirect Inference context we need an auxiliary model with
easily-estimated analytical form yet there is no such requirement for the basic model
Although not necessary we assume that the cost function has a linear deterministic form
the deterministic part and the random part are additively separable So we have the cost
function as
( ) Tl li l lic x xε β β ε= + (18)
In addition one important assumption is that the link cost is additive which means that
the cost of a path can be attained by the sum of all the link costs along the path This way
we have the cost of a path π as
( ) ( )l lil
C c xπ
π ε βisin
=sum (19)
We focus on the path-based model which means that the individuals choose among all
possible paths As defined above this turns out to be a random utility choice model As
indicated by the standard assumptions of this kind of models choice makers are assumed
to know both the link characteristics and their idiosyncratic random utility liε associated
to each link Since the choice makers maximize their utility this means that they will
choose the path with the lowest generalized cost in this model This way we have the
choice of individual i as
38 Karlstroumlm A Sundberg M amp Wang Q (2011) Consistently estimating flexible route choice models using an MNL lense
32
( )
arg min ( )o di i
iv v
Cπ
π πisinΩ
= (20)
in which oiv denotes the origin point of the trip for individual i and d
iv denotes the
destination ( )o di iv vΩ denotes all possible paths connecting the origin and destination in
the network for individual i which forms the choice set for the individual
When implementing the model we assume that the random utility component liε follows
a truncated normal distribution To be specific liε follows a standard normal distribution
yet with only the positive values retrieved This way we could guarantee that the link
costs are always positive so that additively the path would not have infinite loops With
this feature of the random component we could say that our model is probit-like Based
on this assumption the prerequisite of Dijkstrarsquos Algorithm is satisfied which always
needs positive edge values on the network We can use the Dijkstrarsquos Algorithm to find
the shortest paths iπ as an intermediate step in the implementation Apart from this we
assume that the unobserved cost captured by the random term is proportional to the
length of link To embody this in the cost function we add a fixed scale parameter to the
random term with a form of ( )Length l Lengthx Mean x in which ( )LengthMean x is the average
length of links in the network
We will assume that the data consists of J paths as dependent variables which means
that the dependent variables for the choice model are 1 Ji iy π == In addition the observed
characteristics of links in the network are provided 1 Ll lx x == To be specific we choose
to use two attributes of the links namely the length of the links Lengthx and the dummy
variable indicating the presence of speed bumps on the links SBx The cost function then
is specified as
( ) ( )l li Length Length l SB SB l li Length l Lengthc x x x x Mean xε β β ε= + + sdot (21)
Now the objective is to estimate the parametersβ in the model for which we will make
use of an auxiliary model
33
342 Auxiliary Model
Based on the idea of Indirect Inference we treat the route choice model defined above as
the basic model of interest which might have complex formation and be difficult to
estimate directly Then we need an auxiliary model to form a criterion which takes into
certain aspects of data to focus the analysis The auxiliary model needs not to reflect the
data generating process exactly as in the basic model yet it needs to include attributes of
interest in order for reference and to be easy to estimate We choose to use a logit model
for route choice as the auxiliary model since the logit model has always been a useful
tool for discrete choice analysis thanks to its analytical form and there is software for
estimating logit models which ensures that we can estimate very efficiently
As to the auxiliary model it is chosen to be a logit model for route choice We consider
that each individual i is choosing from a set of alternative routesr Each route r is given
a utility of riU
- Tri r ri r riU V Xε θ ε= + = + (22)
in which θ is the vector of auxiliary parameters which gives inference to the parameters
in the basic model One thing to be mentioned is that as expected the coefficients in the
utility function should have negative signs To make it easier for comparison with the
coefficients in the basic route choice model we assume the sign of θ to be positive per
se and add a negative sign ahead of it to guarantee that the coefficient part is negative as a
whole rX denotes route characteristics and riε is the random utility for each individual
which is assumed to follow an iid (independently identically distributed) Gumbel
distribution following the standard assumption of logit models
Note that as required for the auxiliary model it should be flexible enough to capture the
variability in the data and thus contains no fewer attributes than the basic model39 In
order to infer the parameters in the basic model and in consideration of efficiency we
pick the same attributes of interest in the basic models which are the link length Lengthx
and the speed bump dummy variableSBx So the utility function turns out to be
- -ri Length Length r SB SB r riU x xθ θ ε= + (23)
39 Karlstroumlm A Sundberg M amp Wang Q (2011) Consistently estimating flexible route choice models using an MNL lense
34
The probability of individual i choosing path r given an individual specific choice set
( )iI o d is
( )
ri
si
i
V
ri V
s I o d
eP
eisin
=sum
(24)
Theoretically we allow the individuals to choose from all possible paths between the
origin and destination in the network which intuitively could be infinite and impossible
to enumerate When implementing the model we generate the individual choice set based
on the basic route choice model Through simulation of the basic model we generate
infinite unique shortest paths for all the unique OD pairs by redrawing the random link
cost liε Without loss of generality the number of paths generated would be big enough
with fully consideration of efficiency We name the finite choice set composed by the
shortest paths generated as the pseudo-universal choice set ( )I o d which is a sample of
the infinite universal choice set The individual specific choice sets are generated by
randomly drawing certain number of paths out of the pseudo-universal choice set And
the size of individual specific choice set could be equal to or smaller than that of the
pseudo-universal one
The resulting individual specific choice set ( )iI o d describes a finite subset of all possible
paths connecting the origin oand destinationd for individuali When implementing the
methods the way of generating the choice set ( )iI o d for each individual i is viewed as
part of the auxiliary model
After the auxiliary model is built it could be estimated using a Maximum Likelihood
estimator based on the observed data of individual choices y and attributes variablesx
for individual 1 i N= hellip The estimate of parameters in the auxiliary model is
ɵ arg max ( )L y xθ
θ θ= (25)
in which ( )L y x θ is the log-likelihood function for the auxiliary model
Given the data of the link attributes xand some random draws of structural parameters
mβ 1 m M= hellip we can simulate choice data through the basic route choice model With
M draws of β from some given density we could simulate M sets of data resulting in
35
simulated choicesɶ( )my β Same as before parameters θ in the auxiliary model can be
estimated based on the simulated data as
ɶ ɶ( ) arg max ( ( ) )m m mL y xθ
θ β β θ= (26)
As the process indicated the simulated choice data depends on the structural parameterβ
in the basic route choice model and in sequence the estimates of parameters θ in the
auxiliary model depends on β when estimated based on the simulated data Based on
this theoretically we have a relationship of ( )θ β referred to as the binding function in
indirect inference literatures which we will discuss in detail for implementation of model
in this thesis A metric is then chosen to measure the distance between the observed and
simulated data viewed by the auxiliary model as a way to indirectly infer the values of
parameters β in the basic model To be specific for each draw of the structural parameter
mβ we can get the estimates of ɶ ( )m mθ β based on the simulated data and the distance
between ɶ ( )m mθ β and ɵθ measured by the chosen metric By doing more iteration with the
aim of minimizing the distance we will get the value of mβ which spurs the ɶ ( )m mθ β
closest toɵθ and this mβ is the inferred estimates of the parameter in the basic model
343 Consistency Discussion
The process of indirectly estimating parameters in the basic model is described above yet
we need to know whether the method we provide gives consistent estimation Here are
some discussions explaining the consistency in estimating by which consistency of the
estimator we proposed is illustrated
As proved the multinomial logit model (MNL) can be estimated consistently based on a
subset of alternatives (McFadden 1978)40 We may need to use the classical conditional
maximum likelihood estimator to deal with the problem at the same time the probability
that an individual n chooses an alternative i conditional on the subset of alternatives
denoted asnc becomes the conditional probability
40 McFadden D (1978) Modeling the Choice of Residential Location In A Karlqvist L Lundqvist F Snickars amp J Weibull (Ed) Spatial Interaction Theory and Residential Location (pp 75-96) Amsterdam North-Holland
36
ln ( | )
ln ( | )( | )in n
jn n
n
V q c i
n V q c j
j c
eP i c
e
micro
micro
+
+
isin
=sum
(27)
in which micro is a scale parameter and inV is the deterministic part of the utility There is a
term ln ( | )nq c j for correcting the sampling bias in which ( | )nq c j denotes the probability
of sampling nc given that alternative j is chosen
If all the alternatives in the choice set have the same probability to be chosen into the
subset the estimation on the subset of alternatives is equivalent to that on the full choice
set To be specific in this case ( | )nq c i is equal to ( | )n nq c j j cforall isin so by calculation the
term for sampling bias correction will cancel out in the probability function
In route choice context the alternative paths between an origin and a destination may be
in large amount and it is inefficient to give some very long-distance paths the same
probability as those short and attractive ones This means that we may need the
importance sampling method when generating subsets of alternatives which selects
attractive alternatives with higher probability than unattractive ones And the correction
term does not cancel out in this case Note that if alternative specific constants are
estimated we can get unbiased estimates of all the parameters except the constants even
if the correction term is not included in the utility function (Manski amp Lerman 1977)41
Back to the route choice context we tend to use large number of alternatives even with
subset of the full choice set which means that it is generally impossible to estimate the
constants and thus the correction term is essential To solve this problem Frejinger et al
(2009) developed a sampling approach in the context of route choice42
The discussion above focuses on the usage of MNL for route choice modeling When it
comes to our method the individual specific choice set is generated by randomly drawing
alternatives from the pseudo-universal choice set with the same probability yet there is
bias when generating the pseudo-universal ones since the pseudo-universal choice set is
composed of certain number of shortest paths between two nodes and this generating
process gives some paths higher probability to be included into the choice set So we
41 Manski C amp Lerman S (1977) The Estimation of Choice Probabilities from Choice Based Samples Econometrica 45 (8) 1977-1988 42 Frejinger E Bierlaire M amp Ben-Akiva M (2009) Sampling of Alternatives for Route Choice Modeling
37
actually use importance sampling to get the choice set which may consequently
introduce bias in estimating the parameterθ in the auxiliary model as discussed above
With the idea of indirect inference we consider only the relationship between θ andβ
denoted as( )θ β and use this relation to infer the value ofβ From this point of view
whether θ is estimated with bias or not does not matter since the relation between it and
β could always be captured which is the specific thing we focus on using the method of
indirect inference So we can say that even with biased subset of alternatives we could
still get consistent estimation by using indirect inference
344 Binding Function
As discussed in indirect inference method section when the sample size N increases
which means that we have more observations of choice the estimated parameter in the
auxiliary modelɶ ( )m mθ β will converge to a stable value ( )mθ β which is often referred
to as the binding function
Given that route choice model deals with discrete choices and by using indirect inference
we have a discrete choice model as the auxiliary model as well the estimates of binding
function ( )mθ β will inherit the discontinuous feature due to discrete individual choices
ɶ( )my β Keane and Smith (2003) proposed a solution of using logit-smoothing on the
simulated dependent choice data43 Following this idea we assume a continuous binding
functionɶ( )θ β for simplicity which could be approximated by a linear function locally
within small intervals With the M randomly drawn values of mβ and the corresponding
estimated parameters ɶ ( )m mθ β in the auxiliary model we could perform an Ordinary
Least Square (OLS) regression to estimate the local approximation of binding function
ɶ( ) c Dθ β β= + (28)
in which cdenotes the constant vector and D denotes the OLS parameter matrix44 To be
specific in our case each parameter in the auxiliary model will have a restriction
function with regard to both parameters in the basic model which is
43 Keane M amp Smith A (2003) Generalized Indirect Inference for Discrete Choice Models 44 Karlstroumlm A Sundberg M amp Wang Q (2011) Consistently estimating flexible route choice models using an MNL lense
38
ɶ1 11 12( )Length Length SBc d dθ β β β= + +
(29)
ɶ2 21 22( )SB Length SBc d dθ β β β= + +
(30)
Based on the observed data of choices y and explanatory variables xand the estimated
binding function which indicates the restrictions between ɶθ andβ we could use the
maximum likelihood method to give estimation of the parameters of interest The
likelihood ratio approach to indirect inference is following ideas of Smith (1993)45 and
Keane and Smith (2003)46
ɶ=arg max ( ( ))L y xβ
β θ β (31)
in which β is the estimate of the parameter of interest β in the basic economic model
With the restriction of binding function this is actually an indirectly inferred estimate In
line with the estimating process in auxiliary model ( )L sdot is the likelihood function of the
auxiliary model
Note that the form of binding function is based on an assumption in the result part we
will verify that this assumption is realistic
45 Smith A (1993) Estimating Nonlinear Time-series Models Using Simulated Vector Autoregressions 46 Keane M amp Smith A (2003) Generalized Indirect Inference for Discrete Choice Models
39
4 Data
41 Road Network
The data we use for estimation is based on a GPS data set collected in the Swedish city of
Borlaumlnge Borlaumlnge is located in the middle part of Sweden and has a population of about
47 000 inhabitants
The virtual road network contains 3077 nodes and 7459 unidirectional links (Frejinger amp
Bierlaire 2007)47 of which 3061 nodes and 7288 links are included in the network for
estimation Figure 3 gives a visual illustration of the road network in Borlaumlnge
Figure 3 Illustration of the Borlaumlnge road network
With regard to our research two of the link attributes are included namely link length
and speed bump dummy Link length is in the unit of km and speed bump dummy is an
indication of speed bump existence on the links which has the value 1 when there is a
speed bump on the link and 0 otherwise
Link length
47 Frejinger E amp Bierlaire M (2007) Capturing Correlation with Subnetworks in Route Choice Models
40
Some descriptive statistics of the link length data for the whole network is presented in
Table 1 below
Table 1 Descriptive statistics of link length
Number of links 7288
Minimum 0001
Maximum 7599
Mean 0184487
Median 0102
Variance 0103722
Lexis ratio (varmean) 1016884
Skewness 9871144
To describe the overall character of the link length attribute the histogram is shown in
Figure 4 below
Figure 4 Histogram of link length data
We could see that the link length data is quite clustered most of which lies within the
range of 01km and 06km Nonetheless there are some extreme values far away from the
range indicating extremely long links To display the variation in the relatively clustered
area we draw a histogram zoomed in the interval of (0 1km] shown Figure 5 in below
0
01
02
03
04
05
06
Fre
qu
en
cy
Link length (km)
Histogram
41
Figure 5 Histogram of link length data (zoomed within 1km)
Over 80 of all the links have length shorter than 03 km indicating concentration of
link length data
Speed bump dummy
Speed bump dummy is based on true situation in the network Of all the links 82 links
are equipped with speed bumps which account for a percentage of 113 The following
Figure 6 displays the locations of links with speed bumps
Figure 6 Illustration of links with speed bumps
0005
01015
02025
03035
04045
05
Fre
qu
en
cy
Link length (km)
Histogram(zoom in)
42
42 Observation Data
The GPS data set is collected as a part of the Swedish Intelligent Speed Adaptation (ISA)
study which aims at traffic safety effects of in-car information systems In the study 186
vehicles were equipped with GPS devices and traced within a radius of 25 km from the
center of Borlaumlnge The monitoring lasted for 30 days from 22th June 2000 to 4th March
2002 obtaining 49 667 vehicle days of travel and nearly a quarter of a million trips (for
more information on the GPS data set check Axhausen Schoumlnfelder Wolf Oliveira amp
Samaga 2003 Schoumlnfelder amp Samaga 2003 Schoumlnfelder Axhausen Antille amp Bierlaire
2002)48
The data collection is not originally designed for route choice analysis so the raw data
cannot be used in our research directly Extensive data processing is performed by the
company GeoStats in Atlanta to retrieve new data set available for route choice analysis
which contains 24 vehicles and 16 035 observations The final data set we use is provided
by Emma Frejinger which contains in total 1832 observations corresponding to 1458
observed unique routes made by 24 vehicles and 1409 unique origin-destination pairs
Considering that certain route may have been observed more than once we make a
distinction between observations and unique routes and number of unique routes should
be less than that of observations consistently with the numbers listed above
As indicated by data collection in the ISA study only licensed drivers with access to his
or her only car are recruited to minimize sharing or swapping of cars Minimum socio-
economic data of the drivers is included in data collection so we have no way to
understand driver characteristics from the data set Logically we make an assumption
that there is only one individual per vehicle
In the observation data a route is represented by a series of links and also an origin-
destination pair With relatively intensively distributed link length number of links could
48 Axhausen K Schoumlnfelder S Wolf J Oliveira M amp Samaga U (2003) 80 Weeks of GPS Traces Approaches to Enriching the Trip Information Transportation Research Record 1870 46-54 Schoumlnfelder S amp Samaga U (2003) Where Do You Want to Go Today-More Observations on Daily Mobility Third Swiss Transport Research Conference Ascona Schoumlnfelder S Axhausen K Antille N amp Bierlaire M (2002) Exploring the Potentials of Automatically Collected GPS Data for Travel Behaviour Analysis- A Swedish Data Source In J Moumlltgen amp A Wytzisk (Ed) GI-Technologien fuumlr Verkehr und Logistik number 13 Institut fuumlr Geoinformatik Universitaumlt Muumlnster (pp 155-179) Munster IfGIprints
43
be used to indicate total length of routes Some of the descriptive statistics of link number
is shown in Table 2 below
Table 2 Descriptive statistics of link numbers in observation data set
Number of observations 1832
Minimum 5
Maximum 106
Mean 202877
Median 16
Variance 1871968
Lexis ratio (varmean) 9227126
Skewness 1732597
For further overall inspection of link number distribution in the observation data set the
histogram is shown in Figure 7 below
Figure 7 Histogram of link numbers in observations data set
Seen from the histogram distribution of number of links is relatively dispersed with a
large range interval Judging by the statistics in general the routes observed have about
000
200
400
600
800
1000
1200
1400
1600
5 8
11
14
17
20
23
26
29
32
35
38
41
44
47
50
53
56
59
62
65
68
71
74
77
80
83
86
89
92
95
98
10
1
10
4
10
7
Mo
re
Fre
qu
en
cy
Number of links
Histogram
44
20 links in average Yet the data has a big variance which is reasonable As stated above
there are 1409 unique OD pairs for 1832 observations indicating that for most OD pairs
there is only one observation Spread within the detecting area different OD pairs could
have various numbers of links in between
Following our experiment design only a portion of the data could be used To be specific
routes with number of links fewer than ten would be eliminated when used for estimation
43 Further Exploration of data
Apart from the characters discussed above there are some other attributes in the data set
interesting to be explored Both in link attribute data set and observation data set there is
travel time data which to some extent is parallel with length in indicating distance
between two nodes
In the link attribute data set one attribute is denotes the estimated travel time of links in
unit of hour Some of the descriptive statistics is shown in Table 3 below switching unit
to minute
Table 3 Descriptive statistics of estimated travel time on links
Number of links 7288
Minimum 000186
Maximum 578268
Mean 0281696
Median 018744
Variance 0119337
Lexis ratio (varmean) 0423638
Skewness 5785361
Seen from Table 3 estimated travel time seems to have a more clustered distribution than
link length judging by lexis ratio and skewness Yet this time is roughly estimated not so
qualified as link length to use in estimation since the latter is much easier to measure and
guarantee precision
In the observation data set we have the duration time of the observations in the unit of
minute Some of the descriptive statistics is shown in Table 4 below
45
Table 4 Descriptive statistics of duration of trips
Number of observations 1832
Minimum 007
Maximum 316
Mean 4991195
Median 3925
Variance 1775639
Lexis ratio (varmean) 3557542
Skewness 2174728
Duration of trips can be used as an indication of distance between origin and destination
yet it is roughly measured and strongly affected by traffic condition on the road network
With similar reasons as discussed on estimated travel time on link we use number of
links instead of duration of trips to indicate the distance between OD pairs
46
5 Experiment Design
When doing the simulation-based estimation it is physically divided into two parts for
convenience of operation As discussed in the method section we choose to use a pseudo-
universal choice set which is generated and stored in the first part and ready for use in
the following experiment Then in the second part we do the simulation-based
experiment to carry out indirect inference method for estimating the parameters of
interest in the basic model β to be specific The Figure 8 below illustrates an abstracted
flow of how the estimation is carried out given certain origin-destination pair
Figure 8 Illustration of the flow in the experiment
As shown in the flow chart we get all the unique OD pairs in the trip data For each of
the OD pairs the Dijkstrarsquos algorithm is used to find the shortest paths between them
without duplicates We set the intended number of paths to be 400 as well as time
terminator in case not enough paths could be generated within certain bearable time
47
interval The generated paths form the pseudo-universal choice set of each OD pair
which is stored for future use Note that we abandon some OD pairs with too few paths
in the pseudo-universal choice set Observations containing the kept OD pairs are used
for following estimation which turns out to be 940 of them
For the OD pair in a given observation 200 alternatives are randomly drawn from the
pseudo-universal choice set and the sequential links in the observation itself is read as an
alternative path The 201 paths compose the observed choice set On the other hand a
given value of mβ is drawn from a predefined domainD The shortest path is generated
based on the given mβ as the simulated observation Like in the observed choice set part
200 alternatives are randomly drawn from the pseudo-universal choice set to form the
simulated choice set together with the simulated observation The auxiliary model is
estimated based on the simulated choice set and we could get a set of ɶ( ( ))mm mβ θ β pairs
which will be used to estimate the binding function Based on the binding function and
the observed choice set the parameters in the basic model could be indirectly estimated
The process described above is abstracted with no illustration of iterations Since this is
an experiment based on simulations certain loops of iteration should be carried out to get
statistics of the results
Given observed trip data at first we have no idea of the value of β In the process of
retrieving value ofβ the estimation process is repeated for several stages denoted asS
starting from a rough guess of the domainsD while for each following stage the domain
shrinks Since we tend to use a local OLS regression to approximate the smooth binding
function the draws of smβ need to be around the true value to prevent misspecification of
OLS regression due to the possibly inherent nonlinearity of the binding function The
estimated 0
β is not satisfactory in precision in the first stage yet it could give a hint of
where the true value lies The domain1D is centered on 0
β with smaller interval before
the estimation in the second stage This way +1sD is dependent on sD with smaller
interval As it goes on we will get a more accurate domain and as a result a well specified
OLS regression to approximate the binding function
48
The process of experiment with iterations is described below Suppose that we have the
experiment carried out for K times and the number of observations used isN
for run 1 k K= hellip for true observation 1 i N= hellip
Randomly draw alternatives from the pseudo-universal choice set end Form the observed choice sety for stage 1 s S= hellip
for 1 m M= hellip
Draw ksmβ from the domain ksD
Simulate paths for OD pairs in the used observations with mβ
for simulated observation 1 i N= hellip Randomly draw alternatives from the pseudo-universal choice set end
Form a simulated route choice setɶ( )ksmy β
Estimate ɶ ( )ks ksm mθ β in Equation (26)
end
Estimate ɶ ( )ks
θ β in Equation (28)
Estimate ks
β in Equation (31) end
Center the domain 1k sD + on ks
β and shrink the interval end
As a trial we first do the experiment on a route choice model with one parameter link
length to be specific For simplicity the random term is not scaled as described in the
model specification section which means we attach a truncated normally distributed
random term to the cost function without scaling it with link length After getting the
estimation of Lengthβ we move on to estimating the route choice model with both
parameters as described in the model specification Results under these two formulations
of models are presented separately in the result part
49
6 Results
61 Validation of Binding Function
As discussed in the binding function section we assume the binding function to be
continuous and feasible to be approximated by a linear function locally The assumption
of binding function can be verified based on the ɶ( ( ))mm mβ θ β pairs we attained as
intermediate results To explain this more explicitly we carry out a simple example with
only one parameter in the route choice model Lengthβ to be specific
The cost function is specified as
( )l li Length Length l lic x xε β ε= + (32)
corresponding to which the auxiliary model is
-ri Length Length r riU xθ ε= + (33)
For each run 10 values ofLengthβ are evenly drawn from a given domain By simulating
observations and estimating the auxiliary model 10 corresponding Lengthθ are generated to
form ten ɶ( ( ))mm mβ θ β pairs As assumed the binding functionɶ( )θ β is continuous which
could be approximated by a linear function locally To display the trend of binding
function we choose a relatively large domain for Lengthβ in the beginning [010]D = and
carry out 10 runs which generate 100 points in the beta-theta diagram shown in Figure 9
below
Figure 9 Scatter plots of the 90 beta-theta pairs
y = 12804x + 16264
Rsup2 = 09959
0
2
4
6
8
10
12
14
16
0 2 4 6 8 10
the
ta_
len
gth
beta_length
50
We do OLS regression for the dots and estimate the binding function Intuitively the
smaller the domain is the more accurate is the approximation of the binding function We
shrink the input domain based on the final estimate of Lengthβ from last trial
As it turned out to be we choose an input domain of [1214]D = for Lengthβ and the
binding function is assumed to take the form of
ɶ1 11( )Length Lengthc dθ β β= +
(34)
The result for one run is displayed in Figure 10 below
Figure 10 OLS regression based on the 10 beta-theta points from one run
The estimated binding function based on the 10 points is
ɶ ( ) 17371+10838Length Lengthθ β β= (35)
as indicated by 2 09783R = the function describes the trend of points very well Since
the interval is quite small we could use the estimated function to approximate the
binding function
When it comes to more parameters in the route choice model what we do is simply to
add more elements in the binding function After getting a vector of β and the
corresponding vector ofɶ( )θ β binding functions of each element in vector ɶ( )θ β with
y = 17371x + 10838
Rsup2 = 09783
315
32
325
33
335
34
345
35
355
12 125 13 135 14
the
ta_
len
gth
beta_length
51
regard to all the elements in vector β are estimated One example is shown in the
Equation (29) and Equation (30)
62 Estimation of model with one attribute
The route choice model with one attribute we used is the one described in Section 61
above After several trials by shrinking input interval every time we finally affirm that
the true value Lengthβ of lies in a relatively small interval of [12 14] Based on this
domain 50K = runs are carried out to get statistics of the estimate of Lengthβ As
discussed in the experimental design several stages Smean different trials before final
affirmation of input interval yet for the statistics only one stage is carried out for each
run Within each run 10M = values of input Lengthβ are drawn for estimating binding
function
The estimation statistics of Lengthβ is shown in Table 5 below
Table 5 Statistics of estimation of beta_length
Parameter Lengthβ
Mean 1337353
Standard deviation 0107537
RMSE 0013227
In the table RMSE is the root-mean-square error which is used to measure the distances
between the observed values being estimated and the predicted values by the estimator
The individual differences are called residuals and RMSE is an aggregated measure of
the residuals To be specific
ɵ ɵ ɵ 2( ) ( ) (( ) )RMSE MSE Eθ θ θ θ= = minus (36)
in which ɵθ is the estimator and θ is the parameter to be estimated so the RMSE is the
square root of the mean square error As defined the smaller the value of RMSE is the
better the estimator is
52
Here the RMSE is calculated based on the ten points ɶ( ( ))mm mβ θ β for estimating binding
function so basically it describes the goodness of fit of the estimated binding function
with regard to the points we generated The Equation (36) is specified as
ɶ 2( ( )) (( ( ) ( )) )mm m mRMSE Meanθ β θ β θ β= minus (37)
The value of RMSE displayed in the Table 5 is the mean value of all the RMSE values
for 50 runs Seen from this we have well-estimated binding function for all the 50 runs
on average In terms of the estimates of binding function taking the one in Section 61 as
an example the binding function estimated in the interval of [12 14] in Equation (35)
has a positive constant and a positive coefficient for Lengthβ which indicates that with
larger value of Lengthβ we will get larger value ofɶ Lengthθ and as a result a negative
coefficient for length in the utility function of the logit model This is reasonable for
bigger Lengthβ reveals larger incremental effect on the cost of certain path while lower
ɶ- Lengthθ reveals larger disutility effect on certain path these two effects are in fact
equivalent
By the way the high fitness of binding function is probably due to the relatively small
input interval of Lengthβ after certain trials and shrinkage As the final estimate indicates
Lengthβ falls right into the interval of [12 14] with small standard deviation So we can
say that the estimate is quite good
63 Estimation of model with two attributes
We use the model described in the model specification section to carry out the estimation
Two attributes are used namely length and speed bump dummy Similar to the one
attribute case we carried out several trials and shrinkage to finally determine the
relatively small input intervals forLengthβ and SBβ [05 1] and [0 05] respectively
50K = runs are carried out to get statistics of the estimates of the two parameters Within
each run 10M = values are drawn for inputs Lengthβ and SBβ respectively for estimating
binding function
53
One important thing to mention here is that the inputs are drawn evenly from the domain
yet to guarantee that the values of Lengthβ and SBβ are independent from each other or to
get rid of collinearity49 the domains of two parameters are defined in two dimensions To
explain this more explicitly we choose data of one run as an example The input points of
( Lengthβ SBβ ) are shown in Figure 11 below
Figure 11 Scatter plot of the input values for beta_length and beta_sb
We can see from Figure 11 that the points spread evenly in the domain quadrant Based
on these draws we could estimate the binding function and evaluate the relationship
between parameters in the logit model and Lengthβ and SBβ without worrying about
possible correlation between Lengthβ and SBβ
As discussed before in the binding function we are supposed to find the relationship
between each of the parameters in the logit model and both parameters in the route choice
model Mathematically this binding function should be a surface in the 3D coordinate
system We take the results of one run as an example and thus we have ten sets of Lengthβ
and SBβ along with corresponding ɶ Lengthθ andɶ SBθ
49 A set of points is collinear if they lie on a single straight line or a projective line (for example projective line over any field) and this way the two factors represented by the points are correlated
0
005
01
015
02
025
03
035
04
045
05
05 06 07 08 09 1
be
ta_
sb
beta_length
54
For the first binding function ɶ Lengthθ and ( Lengthβ SBβ ) are plotted in Figure 12 below
And the binding function takes a form as described in Equation (29)
Figure 12 Scatter plot of theta_length with regard to beta_length and beta_sb
By multi-linear regression we can get a surface to approximate the binding function
locally The estimated binding function is displayed in Figure 13 below
Figure 13 Display of the estimated binding function for theta_length
And the first binding function has a formula of
55
ɶ 18234+16933 +00633Length Length SBθ β β= (38)
For the second binding function ɶSBθ and ( Lengthβ SBβ ) are plotted in Figure 14 below
And the binding function takes a form as described in Equation (30)
Figure 14 Scatter plot of theta_sb with regard to beta_length and beta_sb
By multi-linear regression we can get a surface to approximate the binding function
locally The estimated binding function is displayed in Figure 15 below
Figure 15 Display of the estimated binding function for theta_sb
56
And the second binding function has a formula of
ɶ -06698+00371 +17619SB Length SBθ β β= (39)
The t-test of estimated parameters in the binding function is carried out with null
hypothesis of zero Estimates that are significantly different from zero with 95
confidence interval are marked as bold
Table 6 Estimated coefficients of binding function for model with two attributes
Constant Lengthβ SBβ
ɶLengthθ 18234
(43632) 16933
(33481) 00633 (1392)
ɶSBθ -06698
(-7991) 00371 (0366)
17619 (19323)
Seen from the magnitude of coefficients in the binding functions both Lengthβ and SBβ
have positive effect on ɶ Lengthθ andɶ SBθ and in sequence negative effect on the coefficients
in the logit model In addition coefficients of SBβ with regard to ɶ Lengthθ and Lengthβ with
regard to ɶ SBθ are not significantly different from zero so we can say Lengthβ has a more
apparent effect on ɶ Lengthθ than SBβ does while SBβ has a more apparent effect on ɶ SBθ
than Lengthβ does
Based on the estimated binding functions and the true observation data we could get the
estimates of Lengthβ and SBβ as shown in Table 7 below
Table 7 Statistics of estimation of beta_length and beta_sb
Parameter Lengthβ
SBβ
Mean 0761383 0079874
Standard deviation 0068493 0034375
RMSE 0022772 0085113
Seen from the RMSE results the relatively small values indicate that we have well-
estimated binding functions for all the 50 runs on average With regard to the estimates of
parameters in the route choice model both of them fall into the input domain we choose
57
and the standard deviation is quite small So we can say that the estimates are actually
very good
One thing to notice here is that the final estimate of Lengthβ falls approximately in the
middle of the input domain [05 1] while the estimate of SBβ falls closer to the left limit
which might need further shrinkage of input domain and more precise estimate of the
binding function To get rid of this we use the binding function estimate from all the 500
points to give a hint on the reasonability of acceptance of the estimate of SBβ The scatter
plots of theta_sb against beta_sb and beta_length are shown in Figure 16 below
Figure 16 Scatter plots of theta_sb against beta_sb and beta_length
The scatter plots in Figure 16 above are the decompositions of the binding function from
three dimensions to two dimensions Seen from the linear regression in the two plots ɶSBθ
is almost strictly positive proportional to SBβ and hardly effected byLengthβ This means
y = 19132x - 06404
Rsup2 = 0936
-1
-08
-06
-04
-02
0
02
04
06
0 01 02 03 04 05
the
ta_
sb
beta_sb
y = 00123x - 01717
Rsup2 = 4E-05
-1
-08
-06
-04
-02
0
02
04
06
05 06 07 08 09 1
the
ta_
sb
beta_length
58
that by shrinking the input domain ofSBβ we would probably get the same estimate of
binding function since it changes little in current domain And this leads to our
acceptance of the final estimate of SBβ
Given that we have a random cost following a truncated standard normal distribution and
the magnitudes of the estimated parameters are relatively small this would mean that the
randomness of the cost function are relatively large which in sequence leads to relatively
large randomness in individualrsquos choice of route
Another thing to be mentioned is that the magnitude of Lengthβ is smaller than that when
estimated singly Though these two values are not logically comparable with different
formation of random term in the cost function we could still get a hint from the
comparison This difference is probably due to the form of random cost we used which is
( )li Length l Lengthx E xε sdot and the effect of length on the cost is partially captured by this
random term
64 Estimations of other trial formulations of the model
641 Model with exponential form of cost function
During the process of estimation we carried out a lot of other trials in the formulations of
the basic route choice model the cost function to be specific and the auxiliary logit model
As it turned out the there are negative estimates of coefficients in the cost function
which conflicts our anticipation To capture this kind of negative estimation we choose to
use the exponential form of the cost function Without loss of generality the random term
is not scaled by the length of links The cost function is specified as
( ) Length Length l SB SB l lix x
i lic x eβ β εε + += (40)
Two attributes are used namely length and speed bump dummy variable Unlike the form
in Section 63 we allow the parameters Lengthβ and SBβ to have negative input and the
random term liε now follow a standard normal distribution without truncation Since we
take the exponential form of the cost function the cost of links could be kept positive
thus allowing the use of Dijkstrarsquos Algorithm to operate
59
In terms of the auxiliary model since we could have more attributes in the auxiliary
model than the underlying model Instead of using the same attributes as in the cost
function we choose to add an attributes which is number of links in the pathLNx So the
utility function of the logit model is specified as
- - -ri Length Length r SB SB r LN LN r riU x x xθ θ θ ε= + (41)
We still expect the value of θ to be positive and the coefficient of variables with the form
of -θ would be negative
Several trials and shrinkage were carried out for this formulation of our model to finally
determine the relatively small input intervals forLengthβ and SBβ [25 27] and [-05 0]
respectively 15K = runs are carried out to get statistics of the estimates of the two
parameters Within each run 10M = values are drawn for inputs Lengthβ and SBβ
respectively for estimating binding function
To visualize the trend of binding function more clearly we make use all the 150 sets of
vector β and vector θ to estimate the binding function Since we have three variables in
the logit model we have to estimate three binding functions
For the first binding function ɶ Lengthθ and ( Lengthβ SBβ ) are plotted in Figure 17 below
shown along with the estimated binding function
Figure 17 Scatter plot of theta_length against beta_length and beta_sb estimated binding function
The first binding function takes the form of
ɶ 41312+09114 +44845 10Length Length SBθ β βminus= sdot (42)
60
For the second binding function ɶSBθ and ( Lengthβ SBβ ) are plotted in Figure 18 below
shown along with the estimated binding function
Figure 18 Scatter plot of theta_sb against beta_length and beta_sb estimated binding function
The second binding function takes the form of
ɶ 01147 01362 +07119SB Length SBθ β β= minus (43)
For the third binding function ɶ LNθ and ( Lengthβ SBβ ) are plotted in Figure 19 below
shown along with the estimated binding function
Figure 19 Scatter plot of theta_ln against beta_length and beta_sb estimated binding function
The third binding function takes the form of
ɶ 10043 03378 +00068LN Length SBθ β β= minus (44)
The t-test of estimated parameters in the binding function is carried out with null
hypothesis of zero Estimates that are significantly different from zero with 95
confidence interval are marked as bold
61
Table 8 Estimated coefficients of binding functions for model with exponential cost function
Constant Lengthβ SBβ
ɶLengthθ 1312
(2411) 09114 (4360)
4484510-4 (0005)
ɶSBθ 01147
(0425) -01362 (-1314)
07119 (17221)
ɶLNθ 10043
(13767) -03378
(-12051) 00068 (0607)
Same as in the model with two attributes ɶ Lengthθ andɶ SBθ are significantly affected by
Lengthβ and SBβ respectively The negative signs for Lengthβ in the second and third binding
functions draw our attention Since in the second binding function it is not significantly
different from zero we can disregard the effect In the third binding function Lengthβ has
significantly negative effect on ɶ LNθ The larger value of Lengthβ we have the more
influential of path length on cost is With negative effect on ɶ LNθ we can say at the same
time number of links become less influential on the utility This is reasonable since
intuitively if we are sensitive to the path length we wouldnrsquot care too much of having to
switch several more or fewer links based on that path length and number of links are
more or less correlated to each other
Based on the estimated binding functions and the true observation data we could get the
estimates of Lengthβ and SBβ as shown in Table 9 below
Table 9 Statistics of estimation of beta_length and beta_sb in exponential-cost-function model
Parameter Lengthβ
SBβ
Mean 2537672 -045601
Standard deviation 0068377 0133036
We have negative estimate of SBβ which conflicts our assumption that length and
presence of speed bump on the path may increase the cost of traveling through certain
path This is probably due to omission of important attributes in the deterministic part of
the cost function Based on the estimate we are led to think that presence of speed bump
decrease the cost and individuals would prefer to drive on paths with speed bumps Yet
62
this is not true based on our estimation since we are only using two attributes And there
are great chance that some important features are not captured which accidentally are
related with speed bump So the estimate of SBβ is misleading per se in the simple model
as we are using To get more accurate estimate of SBβ we may need to include more
variables in the deterministic part of the cost function
642 Model with estimated scale parameter for random term
Considering the trial with two attributes in Section 63 we add a fixed scale parameter to
the random term to make it proportional to the length of links This appeals to our
assumption yet lays restrictions to the model Apart from this we also try to add an
unfixed scale parameter σ and estimate it along with the other two parameters Lengthβ and
SBβ Note that if we add a scale parameter directly to the random term it wonrsquot work out
as we expect since that way the scale parameter will scale the other two parameters
Lengthβ and SBβ as well as shown below
= ( )Length SBLength Length l SB SB l li Length l SB l lix x x x
β ββ β ε σ σ εσ σ
+ + sdot + + (45)
The right side equation is equivalent to Length Length l SB SB l lix xβ β ε+ + thus making no
difference So we choose to add a new random term including the scale parameter In
addition since we can get good estimate by assuming the random term proportional to
length we will keep this in the newly added random term Now the cost function is
specified as
1 ( ) + ( )l li li Length Length l SB SB l li li Length l Lengthc x x x x Mean xε ε β β ε η σ= + + sdot sdot 2
(46)
liε and liη follow the same truncated normal distribution but are drawn separately so that
they are not equal
In terms of the auxiliary model since now we have three parameters to be estimated in
the underlying model we need one more attribute in the logit model and number of links
in the path LNx is chosen The utility function of the logit model is actually the same as in
Section 641 which is
- - -ri Length Length r SB SB r LN LN r riU x x xθ θ θ ε= + (47)
63
With three parameters in the underlying model it is more reasonable to include
interactions of parameters in the binding function The binding functions take the form of
ɶ
1 2 3
4 5 6 7
( )
Length SB
Length SB Length SB Length SB
c d d d
d d d d
θ β β β σβ β β σ β σ β β σ
= + + +
+ + + + (48)
Since the estimates are not good we did not carry out too many trials to center the input
interval As a result the binding function may be of more interest in this case The chosen
interval is a trial one which is identical [0 3] for Lengthβ SBβ andσ We choose ten sets of
mβ and ɶ ( )m mθ β from one run as an example The values of ɶ ( )m mθ β are plotted against
Lengthβ SBβ andσ respectively The interactions are not shown in the figure yet we have
the estimates of binding function which will give a numerical description of how the
interactions impact theɶ ( )m mθ β
Figure 20 Plots of theta_length against beta_length beta_sb and sigma respectively
y = 09114x + 27818
Rsup2 = 07361
0
1
2
3
4
5
6
0 1 2 3 4
the
ta_
len
gth
beta_length
y = 03568x + 36215
Rsup2 = 00897
0
1
2
3
4
5
6
0 1 2 3 4
the
ta_
len
gth
beta_sb
y = 02572x + 38468
Rsup2 = 00516
0
1
2
3
4
5
6
0 1 2 3
the
ta_
len
gth
sigma
64
Figure 21 Plots of theta_sb against beta_length beta_sb and sigma respectively
y = 02363x + 0835
Rsup2 = 0088
0
05
1
15
2
25
3
0 1 2 3 4
the
ta_
sb
beta_length
y = 06351x + 01759
Rsup2 = 05054
0
05
1
15
2
25
3
0 1 2 3 4
the
ta_
sb
beta_sb
y = -03801x + 17212
Rsup2 = 02001
0
05
1
15
2
25
3
0 1 2 3
the
ta_
len
gth
sigma
y = 00477x + 04521
Rsup2 = 005460
02
04
06
08
1
0 1 2 3 4
the
ta_
ln
beta_length
y = -00553x + 06156
Rsup2 = 00582
0
02
04
06
08
1
0 1 2 3 4
the
ta_
ln
beta_sb
65
Figure 22 Plots of theta_ln against beta_length beta_sb and sigma respectively
As we can see from the three figures above ɶ Lengthθ ɶSBθ and ɶ LNθ are more affected by
Lengthβ SBβ andσ respectively Especially we can see a strong relationship between ɶ LNθ
and σ which assures that number of links can be used to infer the scale parameter in the
underlying model
The estimates of three binding functions are shown in Table 10 below with each row
representing the estimates for one of the three binding function and each column
representing certain variable in the binding function In the parenthesis below each
estimate of the coefficients is the t-test value with the null hypothesis of zero We take the
90 confidence interval and estimates with t-test value larger than 164 are supposed to
be significantly different from zero which are marked as bold
Table 10 Estimates of three binding functions
Constant Lengthβ SBβ σ
Length SBβ β
Lengthβ σ
SBβ σ Length SBβ β σ
ɶLengthθ
1814 (3085)
0861 (2417)
-0089 (-0258)
1038 (2913)
0202 (1030)
-0246 (-1240)
-0056 (-0292)
-0045 (-0412)
ɶSBθ 0284
(1482) -0125
(-1081) 0942
(8371) -0247
(-2127) 0118
(1856) 0070
(1086) -0141
(-2275) -0067
(-1883)
ɶLNθ 0819
(18643) 0015
(0577) -0026
(-0997) -0261
(-9794) 0006
(0419) 0007
(0498) 0024
(1663) -0007
(-0803)
As the constants indicate given no other attributes length and number of links have more
negative effects on the utility than the speed bump dummy does Judging from the
significance of coefficients for the three input parametersɶ Lengthθ ɶSBθ and ɶ LNθ are
significantly affected by Lengthβ SBβ andσ respectively As we can see σ has a negative
y = -02164x + 08218
Rsup2 = 09867
0
02
04
06
08
1
0 1 2 3th
eta
_ln
sigma
66
effect on ɶSBθ andɶ LNθ Since to some extent σ measures the scale of randomness we
could say that the more randomness of the costs on the links have the less influential of
presence of speed bump and number of links become ForɶSBθ it is significantly affected
by some of the interaction terms Notice that SBβ has positive effect onɶSBθ while σ has
effect The interaction terms including both σ and SBβ have negative effect onɶSBθ which
indicates that randomness of cost is more influential than presence of speed bump on the
disutility of speed bump
In terms of the final estimate as stated above the estimates of Lengthβ and SBβ have
negative signs whileσ has positive sign This result conflict our expectation that Lengthβ
and SBβ should have positive signs so we did not carry out more trials and shrinkage The
possible reason for negative estimate is similar to that in the model with exponential form
of cost function Given more attributes in the deterministic part of both the cost function
and utility function in the logit model we might be able to capture the features of the data
better and have the right sign in the final estimates
643 Monte Carlo evidence of model with estimated scale parameter for random
term
Based on the model formulation with estimated scale parameter for random term we also
carried out a Monte Carlo simulation experiment to verify the efficiency of using number
of links in the logti model to infer the scale parameter in the cost function and what we
do is to simulated observations instead of the true ones
We take three arbitrary values for the three parameters in the cost functionLengthβ SBβ and
σ to be 05 And simulated observations are generated based on the given values of
parameters in the cost function Since we know the true values for the parameters the
input domain is centered around the true values to be [04 06] for Lengthβ SBβ andσ
10K = runs are carried out to get statistics of the estimates of the three parameters
Within each run 10M = values are drawn for inputsLengthβ SBβ andσ respectively for
estimating binding function
67
In terms of the binding function by doing regression test we can see that the intersection
terms are unnecessary to be included or even hazardous for good estimate of binding
function so we decide to remove them and keep the binding function as
ɶ1 2 3( ) Length SBc d d dθ β β β σ= + + + (49)
We choose ten sets of mβ and ɶ ( )m mθ β from one run as an example The values of
ɶ ( )m mθ β are plotted againstLengthβ SBβ andσ respectively
Figure 23 Plots of theta_length against beta_length beta_sb and sigma respectively
y = 23826x + 14791
Rsup2 = 05326
15
2
25
3
35
04 05 06
the
ta_
len
gth
beta_length
y = -06434x + 30245
Rsup2 = 0048115
2
25
3
35
04 05 06
the
ta_
len
gth
beta_sb
y = 26255x + 14156
Rsup2 = 07607
15
2
25
3
35
04 05 06
the
ta_
len
gth
sigma
y = -02443x + 04708
Rsup2 = 0034
0
01
02
03
04
05
04 05 06
the
ta_
sb
beta_length
y = 11233x - 02096
Rsup2 = 089020
01
02
03
04
05
04 05 06
the
ta_
sb
beta_sb
68
Figure 24 Plots of theta_sb against beta_length beta_sb and sigma respectively
Figure 25 Plots of theta_ln against beta_length beta_sb and sigma respectively
The figures show similar trend to those in the trial model with estimated scale parameters
which is in line with our expectation
The estimates of three binding functions are shown in Table 11 below with each row
representing the estimates for one of the three binding function and each column
y = -04374x + 056
Rsup2 = 01283
0
01
02
03
04
05
04 05 06
the
ta_
sb
sigma
y = -01144x + 07619
Rsup2 = 01114066
067
068
069
07
071
072
073
074
04 05 06
the
ta_
ln
beta_length
y = 0053x + 06768
Rsup2 = 00296066
067
068
069
07
071
072
073
074
04 05 06
the
ta_
ln
beta_sb
y = -03115x + 08561
Rsup2 = 09717
066
067
068
069
07
071
072
073
074
04 05 06
the
ta_
ln
sigma
69
representing certain variable in the binding function In the parenthesis below each
estimate of the coefficients is the t-test value with the null hypothesis of zero We take the
95 confidence interval and estimates with t-test value larger than 196 are supposed to
be significantly different from zero which are marked as bold
Table 11 Estimates of three binding functions in the Monte Carlo experiment
Constant Lengthβ SBβ σ
ɶLengthθ 0853
(3606) 1009
(3724) -0034
(-0125) 2569
(9482)
ɶSBθ -0062
(-0385) -0104
(-0564) 1208
(6591) -0226
(-1227)
ɶLNθ 0854
(46688) 0013
(0624) -0004
(-0185) -0302
(-14428)
The estimates of binding function have similar characteristics as in the trial model with
estimated scale parameters as well They contain almost the same significant coefficients
and those significant estimates have the same signs as in the trial with true observations
Based on the estimated binding function and the simulated observations given true values
of the three parameters to be 05 the final estimates of Lengthβ SBβ andσ are shown in
Table 12 below
Table 12 Statistics of estimation of beta_length beta_sb and sigma in the Monte Carlo experiment
Parameter Lengthβ
SBβ σ
Mean 0404138359 0458624533 0639191487
Standard deviation 1109279424 0242570421 0377069799
As we can see the estimates of Lengthβ SBβ andσ are quite close to their true values What
is not satisfying is that the estimate of σ is a little large and lies outside the input domain
of [04 06] but is still quite near to this interval In addition the estimate of Lengthβ is
within the input domain yet the variation is large This is understandable since we scale
the random term by length together with the scale parameter and thus the parameter for
length could be influenced by the random term and turns out to have large variations In a
word the result of Monte Carlo experiment verifies that we get use the model
70
formulation with unfixed scale parameter for the random term to get the right estimate of
the true values And number of links is strongly related withσ which means that it is
reasonable and efficient to use it as a reference to σ in the cost function
71
7 Conclusions
This thesis aims at implementing the newly proposed route choice model based on
indirect inference in true observations The model assigns links specific errors for a
network which allows natural correlations among paths and is practical in simulating
observations by means of shortest path searching algorithms like the Dijkstrarsquos Algorithm
used in our experiment To get consistent estimation of this kind of model indirect
inference method is used and a simple model like logit model is used as an auxiliary
model The route choice model and indirect inference estimator has been tested on
synthetic data with simulated observations and proved to be capable of consistently
estimated
Compared to the synthetic experiment some extensions are done in this thesis By
replacing the simulated observations with the true observations the method is tested on
the empirical circumstance to prove that it could be used in solving practical problems
The true observations have more noises than the simulated ones thus more difficulty to
capture their features We know neither the right formulations of models based on the
data nor the values of parameters in the route choice model yet as defined the
parameters should have positive signs As it turned out to be in the experiment with only
length in the model we get the estimates of Lengthβ as 1337 while with two attributes in
the model we get the estimates of Lengthβ and SBβ as 0761 and 00799 respectively The
estimates in both experiments seem reasonable with the right sign In addition seen from
the estimation of the binding function the coefficients in the logit model is negatively
affected by the parameters they infer in the basic route choice model in the two attributes
case one parameter in the logit model is more apparently affected by the parameter it
refers than the other parameter in basic model
In the trial where we include a scale parameter to the random term and estimate it along
with the other parameters in the route choice model a Monte Carlo simulation
experiment is carried out using simulated observations The result shows that it is
efficient to use number of links in the auxiliary model to infer the scale parameter in the
basic rout choice model
72
In other trial formulations of the model we got negative estimates which may probably
be due to missing attributes in the cost function Future work should be done to include
more attributes
Another thing to recommend for future is that we generate the pseudo-universal choice
set as part of the auxiliary model Since the pseudo-universal choice set is partially used
for deciding which ODs and observations to be used in the project it is essential and
should be generated beforehand But from the choice set generation point of view we
could generate individual specific choice set directly instead of random drawing paths
from the pseudo-universal choice set This would increase computational efficiency
73
Bibliography
Axhausen K Schoumlnfelder S Wolf J Oliveira M amp Samaga U (2003) 80 Weeks of
GPS Traces Approaches to Enriching the Trip Information Transportation Research
Record 1870 46-54
Azevedo J Costa M Madeira J amp Martins E (1993) An Algorithm for the Ranking
of Shortest Paths European Journal of Operational Research 69 (1) 97-106
Bartels K Boztug Y amp Muumlller M (1999) Testing the Multinomial Logit Model
Working paper University Potsdam Germany
Bekhor S Ben-Akiva M amp Ramming M (2002) Adaptation of Logit Kernel to Route
Choice Situation Transportation Research Board of the National Academics 1805 78-85
Bekhor S Ben-Akiva M amp Ramming M (2006) Evaluation of Choice Set Generation
Algorithms for Route Choice Models Annals of Operations Research 114 (1) 235-247
Ben-Akiva M amp Bierlaire M (1999) Discrete Choice Methods and Their Applications
to Short Term Travel Decisions In Chapter for the Transport Science Handbook
Preliminary Draft
Ben-Akiva M amp Bierlaire M (2003) Discrete Choice Models with Applications to
Departure Time and Route Choice In Handbook of Transportation Science (second ed)
Kluwer
Ben-Akiva M amp Bolduc D (1996) Multinomial Probit with a Logit Kernel and a
General Parametric Specification of the Covariance Structure Working Paper
Ben-Akiva M amp Lerman S (1985) Discrete Choice Analysis Theory and Application
to Travel Demand MIT Press
Ben-Akiva M Bergman M Daly A amp Ramaswamy R (1984) Modeling Inter Urban
Route Choice Behaviour In J Vollmuller amp R Hamerslag (Ed) the 9th International
Symposium on Transportation and Traffic Theory (pp 299-330) Utrecht Netherlands
VNU Science Press
Cascetta E Nuzzolo A Russo F amp Vitetta A (1996) A Modified Logit Route Choice
Model Overcoming Path Overlapping ProblemsSpecification and Some Calibration
Results for Interurban Networks In J Lesort (Ed) the 13th International Symposium on
Transportation and Traffic Theory Lyon France
74
Creel M (2009) A Data Mining Approach to Indirect Inference Universitat Autonoma
de Barcelona Department of Economics and Economic History
De La Barra T Peacuterez B amp Anez J (1993) Multidimensional Path Search and
Assignment 21st PTRC Summer Meeting (pp 307-319)
Dijkstra E (1959) A note on two problems in connexion with graphs Numerische
Mathematik 1 269-271
Frejinger E amp Bierlaire M (2007) Capturing Correlation with Subnetworks in Route
Choice Models Transportation Research Part B 41 363-378
Frejinger E Bierlaire M amp Ben-Akiva M (2009) Sampling of Alternatives for Route
Choice Modeling Transportation Research Part B Methodological 43 (10) 984-994
Gallant A amp McCulloch R (2004) On the Determination of General Scientific Models
Manuscript Duke University
Gourieacuteroux C Monfort A amp Renault E (1993) Indirect Inference Journal of Applied
Econometrics 8 85-118
Karlstroumlm A Sundberg M amp Wang Q (2011) Consistently estimating flexible route
choice models using an MNL lense International Choice Modeling Conference Leeds
Keane M amp Smith A (2003) Generalized Indirect Inference for Discrete Choice
Models Manuscript Yale University
Manski C amp Lerman S (1977) The Estimation of Choice Probabilities from Choice
Based Samples Econometrica 45 (8) 1977-1988
McFadden D (1974) Conditional Logit Analysis of Qualitative Choice Behaviour (P
Zarembka Ed) Frontiers in Econometrics 105-142
McFadden D (1978) Modeling the Choice of Residential Location In A Karlqvist L
Lundqvist F Snickars amp J Weibull (Ed) Spatial Interaction Theory and Residential
Location (pp 75-96) Amsterdam North-Holland
McFadden D amp Train K (2000) Mixed MNL Models for Discrete Response Journal
of Applied Econometrics
Nerella S amp Bhat C (2004) Numerical Analysis of Effect of Sampling of Alternatives
in Discrete Choice Models Transportation Research Record 1894 11-19
Ramming M (2001) Network Knowledge and Route Choice PhD Thesis Massachusetts
Institute of Technology
75
Schoumlnfelder S amp Samaga U (2003) Where Do You Want to Go Today-More
Observations on Daily Mobility Third Swiss Transport Research Conference Ascona
Schoumlnfelder S Axhausen K Antille N amp Bierlaire M (2002) Exploring the
Potentials of Automatically Collected GPS Data for Travel Behaviour Analysis- A
Swedish Data Source i J Moumlltgen amp A Wytzisk (Red) GI-Technologien fuumlr Verkehr
und Logistik number 13 Institut fuumlr Geoinformatik Universitaumlt Muumlnster (ss 155-179)
Munster IfGIprints
Smith A (1993) Estimating Nonlinear Time-series Models Using Simulated Vector
Autoregressions Journal of Applied Econometrics 8 63-84
Smith A (2008) Indirect Inference In S Durlauf amp L Blume (Eds) The New
Palgrave Dictionary of Economics (Second ed) Palgrave Macmillan
Smith A (1990) Three Essays on the Solution and Estimation of Dynamic
Macroeconomic Models PhD Dissertation Duke University
Train K (2003) Discrete Choice Methods with Simulation Cambridge University Press
Vovsha P amp Bekhor S (1998) Link-nested Logit Model of Route Choice-Overcoming
Route Overlapping Problem Transportation Research Record 1645 133-142
Wang H (2011) Logistics Distribution Shortest Path Based on Dijkstra Algorithm
Computer and Digital Engineering 3
Assigned publication number
TSC-MT 11-016
wwwkthse

14
Ben-Akiva amp Ramming 2006 for example) Apart from this there are some recently
proposed methods for sampling alternatives under route choice context (See Frejinger
Bierlaire amp Ben-Akiva 2009 for example)
Nerella and Bhat (2004) carried out a numerical analysis on the effect of sample size on
the efficiency of the estimation of parameters14 The analysis is done for two kinds of
discrete choice models namely the multinomial logit model for which consistency of
estimation based on subset of alternatives is theoretically proved and non-MNL model
taking mixed multinomial logit model as an example Four evaluation criteria are chosen
namely the ability to recover model parameters ability to estimate overall log-likelihood
function value ability to estimate individual choice probabilities and ability to estimate
aggregate shares of alternatives The results show that the MNL model works well on
small sample size yet certain portion of full choice set need to be kept as a practical
baseline For the non-MNL model small sample size gives poor estimation and increase
of sample size gives obvious increase of estimation quality Certain portion of full choice
set is suggested for practical convenience yet the generalization of sample size portion is
not feasible since difference kinds of models may require different portion to guarantee
accuracy In general for the non-MNL models full choice set is suggested to be used if
feasible and larger sample gives better estimation
Bekhor Ben-Akiva and Ramming (2006) carried out route choice modeling based on a
large-scale urban network including both choice set generation part and route choice
estimation part which compose the process of route choice modeling together15 Given
that previous literatures did not pay too much attention to empirical estimation the paper
used a true observation data set collected in Boston As the first step several choice set
generation algorithms are listed and compared in their efficiency of reproducing the
observed paths on which the evaluation of the algorithms are based The data in Boston
is described in the paper and used in the second step ie model estimation Several route
choice models are presented and estimation results based on different kinds of models are
shown for comparison of the efficiency of the models The Path Size Logit model is
14 Nerella S amp Bhat C (2004) Numerical Analysis of Effect of Sampling of Alternatives in Discrete Choice Models Transportation Research Record 1894 11-19 15 Bekhor S Ben-Akiva M amp Ramming M (2006) Evaluation of Choice Set Generation Algorithms for Route Choice Models Annals of Operations Research 114 (1) 235-247
15
proposed for its property to overcoming the drawbacks of the conventional MNL models
This type of model can be easily estimated using popularized software The main
conclusion is that route choice models could be estimated for large-scale networks based
on the true observation data and prominent computing resources
Frejinger Bierlaire and Ben-Akiva (2009) proposed a paradigm for choice set generation
based on sampling for route choice modeling16 In the context of route choice modeling
the universal choice set which denotes all possible alternatives for a traveler to choose
from is not able to be enumerated So we practically work on a sampled choice set from
the universal one which may easily introduce bias to the final estimate In this paradigm
they focus on unbiased estimation of parameters instead of generating actual choice set
The path generation is seen as an importance sampling approach and a correction of
sampling is added to the path utility Since the following estimation process is based on
the sampled choice set which is treated as the universal one a correction for sampling is
added to the path size attribute in the commonly used path size logit (PSL) model ending
up with the expanded path size Modification in the previous two steps guarantees
unbiased estimation of the parameters Numerical results based on synthetic data are
presented in the paper to reveal that models with a sampling correction in the path utility
are better than those without it The proposed expanded path size logit model provides
unbiased estimation and is better than the original path size models
In this paper we will examine indirect inference Indirect inference is not a new method
it was first introduced by Smith (1990 1993)17 Then Gourieacuteroux et al (1993) gave
overall introduction to the methods and extended it in important ways18 Gallant and
McCulloch (2004) transferred the idea of indirect inference and used it for Bayesian
inference in models where likelihood function is intractable19
16 Frejinger E Bierlaire M amp Ben-Akiva M (2009) Sampling of Alternatives for Route Choice Modeling Transportation Research Part B Methodological 43 (10) 984-994 17 Smith A (1990) Three Essays on the Solution and Estimation of Dynamic Macroeconomic Models PhD Dissertation Duke University Smith A (1993) Estimating Nonlinear Time-series Models Using Simulated Vector Autoregressions Journal of Applied Econometrics 8 63-84 18 Gourieacuteroux C Monfort A amp Renault E (1993) Indirect Inference Journal of Applied Econometrics 8 85-118 19 Gallant A amp McCulloch R (2004) On the Determination of General Scientific Models Manuscript Duke University
16
Gourieacuteroux Monfort and Renault (1993) proposed the inference methods based on an
ldquoincorrectrdquo criterion which does not give consistent estimation to parameters of interest
directly20 The argument of the criterion is called the auxiliary parameter which may
have a larger dimension than the parameters of interest in the basic model After the
auxiliary parameters are selected a simulation-based process is carried out to get a
consistent and asymptotically normal estimator of parameters of interest As a simulation-
based method the only requirement for the basic model is that it could be simulated
regardless of formulations of the model So it could be used for estimating models which
are too complex to carry out direct approaches The paper shows how this kind of method
can be applied in fields such as micro-econometrics macro-econometrics and
econometrics of finance
Keane and Smith (2003) proposed a generalized form of the indirect inference method to
be implemented in the discrete choice model context21 Theoretically indirect inference
could deal with estimation of any economic models yet it has some limitations per se that
decrease the estimation efficiency or even make it difficult to implement Problems arise
when we use indirect inference in estimating discrete choice models since the objective
function the metric of distance between the auxiliary models estimated on observed data
and simulated data to be specific is inherently discrete which leaves the gradient-based
optimization methods infeasible Keane and Smith (2003) proposed that the estimation
procedures used for observed data and simulated data can be different22 Instead of the
discrete choice a continuous function of latent utilities including a smoothing parameter
is used as the dependent variable in the auxiliary model When the smoothing parameter
goes to zero the function of latent utilities converges to the discrete choices this way to
guarantee consistency According to the Monte Carlo results the generalized indirect
inference method proposed in this paper yields good estimates in small samples being as
efficient as maximum likelihood estimates in comparison
20 Gourieacuteroux C Monfort A amp Renault E (1993) Indirect Inference 21 Keane M amp Smith A (2003) Generalized Indirect Inference for Discrete Choice Models Manuscript Yale University 22 Keane M amp Smith A (2003) Generalized Indirect Inference for Discrete Choice Models
17
Creel (2009) presented a data mining approach to indirect inference23 which is similar to
the regular indirect inference method yet with certain advantages over it The method is a
simulation-based estimator relying also on an auxiliary model In line with the indirect
inference method an underlying economic model with parameterβ is referenced by an
auxiliary model with parameterθ Certain values of the parameter hβ in underlying
economic model are drawn randomly from a known density simulated data is generated
using Monte Carlo methods to estimate ɶh
θ of auxiliary model which ends up with a set
of tuples ɶ( )hhβ θ Nonparametric methods are used to get the function ɶ( | )E aβ θ = and
the final estimate of β is supposed to be the result of regression function evaluated at the
estimate of θ based on true observations ɶ ɵ( | )Eβ β θ θ= = Creel (2009) also presented a
way of calculating confidence intervals24 Monte Carlo results in dynamic and nonlinear
panel models and vector autoregressions show good performance of the new estimator
23 Creel M (2009) A Data Mining Approach to Indirect Inference Universitat Autonoma de Barcelona Department of Economics and Economic History 24 Creel M (2009) A Data Mining Approach to Indirect Inference
18
3 Methodology
31 Multinomial Logit Model (MNL)
311 Model Description
Route choice modeling is somewhat complicated when we want to capture the attributes
of both the alternative routes and choice maker accurately and reflect the choice making
process in the model Intuitively route choice can be regarded as choosing one specific
route from several alternative routes which coincides with the prerequisites of discrete
choice models Actually a lot of literatures have explored the route choice modeling and
possible improvements based on discrete choice models (see Cascetta et al 1996 Vovsha
and Bekhor 1998 Ben-Akiva and Bierlaire 1999 for more information on development
in route choice models with regard to discrete choice models)25
To understand the frontier development of route choice model we have got to know the
discrete choice models among which multinomial logit model (MNL) is the most widely
used In addition we choose to implement a new method ndash indirect inference in which
MNL is used as it is
Logit model is the most widely used discrete choice model till now due to its excellent
qualities in model specification To be specific the choice probability takes a closed form
which is easy to estimate and interpret (Train 2003)26
The multinomial logit model is a kind of choice model with more than two alternatives in
the choice set We assume that the choice maker makes his or her decision based on the
utility maximization rule (Ben-Akiva amp Lerman 1985)27 With regard to the utility njU
the decision maker n obtains from the thj alternative in the choice set it is made up of
two parts the deterministic part and the stochastic part The deterministic part denoted
25 Cascetta E Nuzzolo A Russo F amp Vitetta A (1996) A Modified Logit Route Choice Model Overcoming Path Overlapping ProblemsSpecification and Some Calibration Results for Interurban Networks Vovsha P amp Bekhor S (1998) Link-nested Logit Model of Route Choice-Overcoming Route Overlapping Problem Transportation Research Record 1645 133-142 Ben-Akiva M amp Bierlaire M (1999) Discrete Choice Methods and Their Applications to Short Term Travel Decisions 26 Train K (2003) Discrete Choice Methods with Simulation Cambridge University Press 27 Ben-Akiva M amp Lerman S (1985) Discrete Choice Analysis Theory and Application to Travel Demand MIT Press
19
by njV contains attributes known by the modelers while the stochastic part denoted by
njε is the attributes affecting peoplersquos the decision which cannot be observed by the
modelers yet are known by the decision makers themselves So the utility function turns
out to be
nj nj njU V jε= + forall (1)
The type of choice model is basically decided by the distribution of the stochastic part
When we assume that njε is independently identically Gumbel distributed the model
becomes a logit model
As stated above the decision follows utility maximization rule which means that the
decision maker n chooses the alternative with the highest utility say the thi alternative
Use as the probability the thi alternative is chosen over the others we have
( max ) ( )
( )
( )
ni ni nj ni njj C
ni ni nj nj
nj ni ni nj
P P U U P U U j i
P V V j i
P V V j i
ε εε ε
isin= = = ge forall ne
= + gt + forall ne
= minus lt minus forall ne (2)
With Equation (2) above and the assumption that njε follows iid Gumbel distribution we
could derive the probability of decision maker n chooses alternativei which is
ni
nj
V
ni V
j
eP
e=sum
(3)
Typically we specify the deterministic part of the utility function in a linear form which
is nj njV xβ= Then the probability becomes
ni
nj
x
ni x
j
eP
e
β
β=sum
(4)
This is the most common form of probability function for multinomial logit models
There are some good properties for this kind of logit probability as discussed by Train
(2009)28 With this form the probability of choosing certain alternative will be between
zero and one inherently which is basically required for probability definition Yet the
28 Train K (2003) Discrete Choice Methods with Simulation
20
value of niP will never drop to zero mathematically which means that all the alternatives
in the choice set are perceived to have chance to be chosen On the other hand if an
alternative is perceived never to be chosen it should not be included in the choice set at
all
The probabilities for all the alternatives in the choice set sums to be one which is easily
illustrated from the analytical properties 1 1 1
( ) 1njni
J J JVV
nii i j
P e e= = =
= =sum sum sum in which J denotes
the number of alternatives in the choice set
The logit probability and the deterministic part of the utility function follow an S-shaped
curve line shown in Figure 1 below
Figure 1 S-shaped relationship between probability and deterministic part of utility
This property gives implications for possible impacts of the deterministic utility of certain
alternative on its chances to be chosen We could see that when an alternative has about
50 probability to be chosen which infers to the steepest part on the curve a small
change in the deterministic part of the utility function could lead to a large change in the
probability the alternative has to be chosen
Apart from the nice properties of logit probability logit models have some disadvantages
as well (Bartels Boztug amp Muumlller 1999)29 One shortcoming is the assumption of
29 Bartels K Boztug Y amp Muumlller M (1999) Testing the Multinomial Logit Model Working paper University Potsdam Germany
21
Gumbel distribution of error terms in the utility function The inherent requirement for
iid property sets restrictions for logit model to be widely used especially in route choice
modeling context Several models have been proposed to overcome this shortcoming in
particular modifications based on MNL to adjust it to route choice practices have been
proposed Another drawback is the assumption of the linear composition for the
deterministic part of utility function Actually this assumption is for ease of following
estimation process since McFadden (1974) demonstrated that under this condition the
probabilities will be universally concave with regard to the coefficientsβ 30 which
improves the performance of numerical estimation Yet there could be nonlinear
compositions in the deterministic part to relax the restriction Under this condition the
universal concavity cannot be guaranteed which may lead to local convergence in the
estimation process
312 Model Estimation
The most commonly used numerical estimation method for multinomial logit models is
the Maximum Likelihood Estimation (MLE) In principle given a set of data and the
underlying probability model the method tries to find coefficients of the probability
model with which produced data has a distribution most likely resembles the distribution
of the observed data
Consider the case that N decision makers with their choice data are obtained Parameters
to be estimated are the coefficients in the utility function denoted byβ We could then
use the MLE to try to get the values of β vector with which the probability that choice
maker choose their observed alternatives is maximized
The probability of choice maker n to choose his or her observed alternative can be
written as
( ) niyni
i
Pprod (5)
in which niy is a dummy with value 1 if choice maker choose alternative i and value 0
otherwise
30 McFadden D (1974) Conditional Logit Analysis of Qualitative Choice Behaviour (P Zarembka Ed) Frontiers in Econometrics 105-142
22
Choice makers choose their alternative independently from each other so the probability
of all sampled choice makers choose their observed alternative is
1
( ) ( ) ni
Ny
nin i
L Pβ=
= prodprod (6)
This is the likelihood function with regard to the parameters to be estimated β in this
case We can take the logarithm of it to get the log-likelihood function
1
( ) lnN
ni nin i
LL y Pβ=
=sumsum (7)
Since we aim at getting the value of β to make the log-likelihood function maximized
we can take the derivative of it with respect to β and set it to zero
( )
0dLL
d
ββ
= (8)
By solving this equation we could get the estimate of β
32 Dijkstrarsquos Algorithm
321 Introduction
A method is needed for generating feasible alternatives and compose the choice set as
well as for deriving simulated observations for each OD pair in the process of indirect
inference As for choice set generation we would like to include certain number of high
ranking shortest paths in the choice set since these paths tend to have more possibility to
be chosen Similar to this the simulated observation is generated as the shortest path
between each OD pair We implement a method for shortest path finding which is the
Dijkstrarsquos Algorithm
Dijkstrarsquos Algorithm is named after the Dutch computer scientist Edsger Dijkstra who
conceived this method in 1956 and got it published in 195931 This is a graph search
algorithm aiming at solving shortest path problem for a graph the edge cost of which is
defined nonnegative The outcome of it is a shortest path tree demonstrating the path with
lowest value with respect to the defined cost
31 Dijkstra E (1959) A note on two problems in connexion with graphs Numerische Mathematik 1 269-271
23
This algorithm deals with single-source problem To be specific given one source node in
the graph the algorithm will give paths with the lowest value with regard to cost from
this source node to every other node in the network Given certain criterion we could use
the algorithm to find shortest path between two specific nodes by setting one node as the
source and the other as the target
After released it is widely used in path searching problems especially in transportation
related practices Routing problem is considered in investigation on traffic assignment
and optimization in logistics Real sized road network could be perceived as a graph with
vertices and edges in which cities can be abstracted as the vertices in the graph and the
roads connecting cities can then be regarded as the edges With the aid of Dijkstrarsquos
Algorithm the shortest path with respect to cost could be found from certain city to the
other cities The outcome is valuable for logistics corporations to work out their region-
wide distribution plans32
322 Algorithm
We connect a ldquodistancerdquo value with all the vertices in the graph indicating its distance
from the source vertex To be accurate the ldquodistancerdquo could be actual length of edges or
the generalized cost on the edges or anything desired The source vertex is defined as the
initial node with a value of zero In the process Dijkstrarsquos Algorithm will assign values
to vertices detected in one loop and update the values in the following loops till a
minimum value is found for each vertex The steps for searching and updating are
presented below
1 Initialize the network and assign the distance values of vertices other than the initial
node as infinity
2 When one vertex is to be detected it is denoted as current node All the vertices that
have been detected and attained the minimum distance values will be marked as detected
and will not be detected in the following loops while the vertices remaining unvisited
will be marked undetected To initialize all the vertices are marked undetected and the
initial node is set as current node
32 Wang H (2011) Logistics Distribution Shortest Path Based on Dijkstra Algorithm Computer and Digital Engineering 3
24
3 For current node all its directly connected adjacent nodes are considered except for
the newly detected vertex Labeled distance values of the neighbor vertices will be
updated if the calculated values from current node are smaller than their current values
For example current node A has a distance value of 4 and one of its neighbors B has a
value of 8 The edge linking A and B has a distance of 2 The newly calculated distance
value for B will be 4+2=6 which is smaller than 8 So the labeled distance value for B
will be updated to 6 indicating that the minimum distance from the source vertex to B till
now is 6 and the path should pass A
4 When all the neighbors of the current node are considered and updated mark the
current node as detected And mark the undetected node with the lowest distance value as
the current node and do the detection in step 3 again
5 When all the vertices in the network are marked detected the algorithm is finished and
we get the minimum distance from the source to all the other vertices The shortest path
from the source to a specific vertex could be found out following the detecting process
As mentioned above the stop criterion could also be modified as we desired If we aim at
finding the shortest path between two vertices at the beginning one vertex should be set
as the initial node and the algorithm could be stopped once the other vertex is marked as
detected
323 Explanatory Example
Here is a simple network to illustrate the mechanism of Dijstrarsquos Algorithm There are
five vertices and six edges with distance values labeled beside We define A as the source
and set it the initial node
Figure 2 A simple network for Dijstrrarsquoa Algorithm explanation
25
Initialization
Initial node A
Detected null
Distance value A=0 B=C=D=E=+infin
Loop 1
Current node A
Adjacent vertices B C
Detected null
Distance value A=0 B=4 C=1 D=E=+infin
Loop 2
Current node C
Adjacent vertices B D
Detected A
Distance value A=0 C=1 B=min 4 C+2 =3 D=C+3=4 E=+infin
Loop 3
Current node B
Adjacent vertices E
Detected A C
Distance value A=0 C=1 B=3 D=4 E=B+3=6
Loop 4
Current node E
Adjacent vertices null
Detected A B C D
Distance value A=0 C=1 B=3 D=4 E=6
If we want to get the shortest path from A to E following the detecting process we could
know that it should be A-C-B-E
26
324 Discussion
Dijkstrarsquos Algorithm has a clear logical structure which makes it easy to understand as
well as to implement in programming Nonetheless this method cannot search directly
from one node towards the other to find the shortest path between the two It works more
like detecting all the adjacent nodes in terms of shortest paths and expands from the
source iteratively until the target node is included and that is when we could figure out
the shortest path between the two specific vertices This reveals the fact that the method
wastes a lot of time in the blind search leaving it inefficient In addition this method is
not able to deal with networks with negative edge values yet this is not a problem in our
research since link cost on our network is defined nonnegative
33 Indirect Inference
331 Introduction
For problems in route choice context choice set size may be way too large to enumerate
all the alternatives Yet estimation based on sampled choice set may introduce biases
which can be corrected in some special cases (see Frejinger Bierlaire amp Ben-Akiva
2009)33 While in cases where estimation models are not based on MNL say multinomial
probit model we could not find corrections for biases caused by sampled choice set
Estimator based on the principle of indirect inference is then introduced to overcome
inconsistency problem34
Indirect inference35 is a simulation-based method for estimating parameters in economic
models by making references to the parameters of interest (Smith 2008) It is motivated
when general statistical estimation method such as Maximum Likelihood is intractable or
as discussed above consistent estimation is required given that only sampled choice set is
available Since in economic analysis we tend to build models which guarantee scientific
logic and inclusion of necessary attributes quite often the models will end up
33 Frejinger E Bierlaire M amp Ben-Akiva M (2009) Sampling of Alternatives for Route Choice Modeling 34 Karlstroumlm A Sundberg M amp Wang Q (2011) Consistently estimating flexible route choice models using an MNL lense 35 Smith A (2008) Indirect Inference In S Durlauf amp L Blume (Eds) The New Palgrave Dictionary of Economics (Second ed) Palgrave Macmillan
27
complicated from statistical estimation point of view This in sequence spurs the wide use
of indirect inference in economic analysis
It is common character that simulation-based methods allows modelers to simulate data
from the economic model of interest given certain perceived values of the parameters to
be estimated Since to generate data is essential and simple the true challenge is how to
estimate coefficients Indirect inference uses an auxiliary model which gives a rich
description of the covariance patterns in the data by including certain variables from the
basic economic model On the other hand the auxiliary model does not need to reflect
accurately the data generating process since it is supposed to be estimated based on the
data derived not to generate data itself The basic function of the auxiliary model is that
it provides a criterion to compare observed data and simulated data from the basic
economics model
We do iterations with the aim of finding the parameters of the basic economic model so
the observed data and the simulated data from the basic model looks almost the same by
the criterion of auxiliary model To be specific the auxiliary model is estimated based on
both observed data and simulated data we choose parameters for the basic model to
make sure that the two estimator of auxiliary model are as close as possible Based on
this idea the auxiliary model should be easy to estimate
332 Definition of the method
We define an economic model with the form of
( ) 12t t ty G x t Tε β= = (9)
in which 1 Tt tx = is a sequence of observed exogenous variables 1 T
t ty = is a sequence of
observed endogenous variables and 1 Tt tε = is a sequence of unobserved random error
terms β is a k -dimensional coefficient vector of the exogenous variables (Smith
2008)36
This model generally describes a relation that ty is dependent ontx with some random
errors Given the distribution of the random errors we could get the probability density
36 Smith A (2008) Indirect Inference
28
function of ty conditional on tx We will not focus on this density and instead this model
is only used for simulating data in indirect inference
In terms of the auxiliary model it could be defined by a probability density function with
the form of
( | )t tf y x θ (10)
in which θ is a p -dimensional coefficient vector and p is supposed to be not smaller
than k since we should capture characteristics of all the parameters in the underlying
economic model In addition the auxiliary model needs not be defined to reproduce the
distribution of ty in the basic model yet it needs to have a convenient analytical format
Based on the observed data we could estimate the parameters in the auxiliary model
using Maximum Likelihood Method
ɵ
1
arg max log ( | )T
t tt
f y xθ
θ θ=
= sum (11)
The estimated coefficient vectorɵθ could be used as an indicator of certain features of the
observed data
On the other hand the auxiliary model can be estimated based on simulated data from the
basic model as well We need to draw a sequence of random error terms 1 m Tt tε = from the
defined distribution in which m denotes the number of simulation with an interval of [1
M ] generally Given a coefficient vectorβ we could generate the values of endogenous
variables ɶ 1 ( )m T
tty β = which are explicitly dependent onβ With the help of Maximum
Likelihood Method we could get
ɶ ɶ
1 1
( ) arg max log ( ( ) | )M T m
ttm t
f y xθ
θ β β θ= =
= sumsum (12)
According to the principle of indirect inference we try to find the values of β to make
ɶ( )θ β as close toɵθ as possible Practically we need a metric to measure the distance
between ɵθ andɶ( )θ β and by minimizing the distance we could find out the estimates of
β in the basic economic model
29
333 Choices of the metrics
As mentioned above we need a metric to measure the distance betweenɵθ andɶ( )θ β
There are three approaches corresponding to the three classical hypothesis tests namely
Wald likelihood ratio (LR) and Lagrange multiplier (LM)37
In the Wald approach we try to minimize a quadratic form in the difference between the
two estimators ofɵθ andɶ( )θ β which is
ɵ ɶ ɵ ɶarg min( ( )) ( ( ))Wald
Wβ
β θ θ β θ θ β= minus minus (13)
in which W is a positive definite ldquoweightingrdquo matrix
In the LR approach a metric is formed based on the likelihood function related to the
auxiliary model which is
ɵ ɶ
1 1
arg min( log ( | ) log ( | ( )))T TLR
t t t tt t
f y x f y xβ
β θ θ β= =
= minussum sum (14)
According to the definition ofɵθ the first part of the objective function before the minus
sign on the right-hand side is always larger than the second part after the minus sign And
the first part is not dependent onβ
To minimize the objective function is equivalent to maximizing the log-likelihood
function withɶ( )θ β that is
ɶ
1
arg max( log ( | ( )))TLR
t tt
f y xβ
β θ β=
= sum (15)
In the LM approach the metric is formed using the derivative of the log-likelihood
function related to the auxiliary model which is
arg min ( ) ( )LM
S VSβ
β β β= (16)
in which
ɶ ɵ
1 1
( ) log ( ( ) | )M T m
ttm t
S f y xβ β θθ= =
part=partsumsum
(17)
and V is a positive definite matrix
37 Smith A (2008) Indirect Inference
30
By using any of the approaches we aim at getting the minimized distance betweenɵθ and
ɶ( )θ β so the value will approach to zero as expected So the hypothesis test of the
minimized value could be used as an indicator of whether the auxiliary model is suitably
specified In other words the minimized value being significantly different from zero
indicates a bad specification of the auxiliary model
In comparison the LM approach has an advantage over the others in computation when
it is relatively time-consuming to estimate the auxiliary model
334 Consistency Interpretation
Suppose the observed sample size T grows large while total number of simulations stays
fixed as M the estimator based on simulated data ɶ( )θ β will converge to a pseudo-true
value denoted as( )h β which is also dependent onβ This is called binding function
which characterized the relationship between the coefficients in the basic model and the
auxiliary model At the same time the estimator based on observed data ɵθ will converge
to a pseudo-true value0θ In case that T grows to a large number the aim of indirect
inference changes to finding β that guarantees0 ( )hθ β= This could explain that indirect
inference gives consistent estimate of the parameters in the basic economic model
In this project the binding function is what we focus on to get the correct estimates
instead of finding certain metrics Detailed methods will be discussed in the following
part
34 Model Specification in the Thesis
341 Basic Route Choice Model
Based on all the methods mentioned in previous sections the specification of models and
methods we use in the thesis will be explained in this section Since we are to estimate
the model based on true observations no model is known beforehand to adjust to the data
we use Several formulations of the model have been tested in the thesis The one
explained here could be seen as an example and all the other trials contain modifications
based on this model The other specifications of model will be explained along with the
results in the result section
31
We start by describing the underlying route choice model of interest38 We need to define
a road network as a representation of a real-size one from which we collected the trip
data The network denoted asN consists of a set of nodes (vertices) v and links (edges)
l Each link has a source node ( )s l and a target node or a destination node( )d l which
together indicate the direction of the link A path from an origin node ov to a destination
node dv could be seen as a sequence of links1 nl lhellip of which 1( ) os l v= 1( ) ( )i id l s l +=
and ( ) dnd l v= So a path can be defined by the index of links which is 1 nl lπ = hellip
A vector of characteristics denoted aslx is associated to each link as well as a strictly
positive cost function( )l lic x ε β in which liε is an individual specific random link cost
with i denoting the individual and β is a vector of coefficients of the link characteristics
left to be estimated In the Indirect Inference context we need an auxiliary model with
easily-estimated analytical form yet there is no such requirement for the basic model
Although not necessary we assume that the cost function has a linear deterministic form
the deterministic part and the random part are additively separable So we have the cost
function as
( ) Tl li l lic x xε β β ε= + (18)
In addition one important assumption is that the link cost is additive which means that
the cost of a path can be attained by the sum of all the link costs along the path This way
we have the cost of a path π as
( ) ( )l lil
C c xπ
π ε βisin
=sum (19)
We focus on the path-based model which means that the individuals choose among all
possible paths As defined above this turns out to be a random utility choice model As
indicated by the standard assumptions of this kind of models choice makers are assumed
to know both the link characteristics and their idiosyncratic random utility liε associated
to each link Since the choice makers maximize their utility this means that they will
choose the path with the lowest generalized cost in this model This way we have the
choice of individual i as
38 Karlstroumlm A Sundberg M amp Wang Q (2011) Consistently estimating flexible route choice models using an MNL lense
32
( )
arg min ( )o di i
iv v
Cπ
π πisinΩ
= (20)
in which oiv denotes the origin point of the trip for individual i and d
iv denotes the
destination ( )o di iv vΩ denotes all possible paths connecting the origin and destination in
the network for individual i which forms the choice set for the individual
When implementing the model we assume that the random utility component liε follows
a truncated normal distribution To be specific liε follows a standard normal distribution
yet with only the positive values retrieved This way we could guarantee that the link
costs are always positive so that additively the path would not have infinite loops With
this feature of the random component we could say that our model is probit-like Based
on this assumption the prerequisite of Dijkstrarsquos Algorithm is satisfied which always
needs positive edge values on the network We can use the Dijkstrarsquos Algorithm to find
the shortest paths iπ as an intermediate step in the implementation Apart from this we
assume that the unobserved cost captured by the random term is proportional to the
length of link To embody this in the cost function we add a fixed scale parameter to the
random term with a form of ( )Length l Lengthx Mean x in which ( )LengthMean x is the average
length of links in the network
We will assume that the data consists of J paths as dependent variables which means
that the dependent variables for the choice model are 1 Ji iy π == In addition the observed
characteristics of links in the network are provided 1 Ll lx x == To be specific we choose
to use two attributes of the links namely the length of the links Lengthx and the dummy
variable indicating the presence of speed bumps on the links SBx The cost function then
is specified as
( ) ( )l li Length Length l SB SB l li Length l Lengthc x x x x Mean xε β β ε= + + sdot (21)
Now the objective is to estimate the parametersβ in the model for which we will make
use of an auxiliary model
33
342 Auxiliary Model
Based on the idea of Indirect Inference we treat the route choice model defined above as
the basic model of interest which might have complex formation and be difficult to
estimate directly Then we need an auxiliary model to form a criterion which takes into
certain aspects of data to focus the analysis The auxiliary model needs not to reflect the
data generating process exactly as in the basic model yet it needs to include attributes of
interest in order for reference and to be easy to estimate We choose to use a logit model
for route choice as the auxiliary model since the logit model has always been a useful
tool for discrete choice analysis thanks to its analytical form and there is software for
estimating logit models which ensures that we can estimate very efficiently
As to the auxiliary model it is chosen to be a logit model for route choice We consider
that each individual i is choosing from a set of alternative routesr Each route r is given
a utility of riU
- Tri r ri r riU V Xε θ ε= + = + (22)
in which θ is the vector of auxiliary parameters which gives inference to the parameters
in the basic model One thing to be mentioned is that as expected the coefficients in the
utility function should have negative signs To make it easier for comparison with the
coefficients in the basic route choice model we assume the sign of θ to be positive per
se and add a negative sign ahead of it to guarantee that the coefficient part is negative as a
whole rX denotes route characteristics and riε is the random utility for each individual
which is assumed to follow an iid (independently identically distributed) Gumbel
distribution following the standard assumption of logit models
Note that as required for the auxiliary model it should be flexible enough to capture the
variability in the data and thus contains no fewer attributes than the basic model39 In
order to infer the parameters in the basic model and in consideration of efficiency we
pick the same attributes of interest in the basic models which are the link length Lengthx
and the speed bump dummy variableSBx So the utility function turns out to be
- -ri Length Length r SB SB r riU x xθ θ ε= + (23)
39 Karlstroumlm A Sundberg M amp Wang Q (2011) Consistently estimating flexible route choice models using an MNL lense
34
The probability of individual i choosing path r given an individual specific choice set
( )iI o d is
( )
ri
si
i
V
ri V
s I o d
eP
eisin
=sum
(24)
Theoretically we allow the individuals to choose from all possible paths between the
origin and destination in the network which intuitively could be infinite and impossible
to enumerate When implementing the model we generate the individual choice set based
on the basic route choice model Through simulation of the basic model we generate
infinite unique shortest paths for all the unique OD pairs by redrawing the random link
cost liε Without loss of generality the number of paths generated would be big enough
with fully consideration of efficiency We name the finite choice set composed by the
shortest paths generated as the pseudo-universal choice set ( )I o d which is a sample of
the infinite universal choice set The individual specific choice sets are generated by
randomly drawing certain number of paths out of the pseudo-universal choice set And
the size of individual specific choice set could be equal to or smaller than that of the
pseudo-universal one
The resulting individual specific choice set ( )iI o d describes a finite subset of all possible
paths connecting the origin oand destinationd for individuali When implementing the
methods the way of generating the choice set ( )iI o d for each individual i is viewed as
part of the auxiliary model
After the auxiliary model is built it could be estimated using a Maximum Likelihood
estimator based on the observed data of individual choices y and attributes variablesx
for individual 1 i N= hellip The estimate of parameters in the auxiliary model is
ɵ arg max ( )L y xθ
θ θ= (25)
in which ( )L y x θ is the log-likelihood function for the auxiliary model
Given the data of the link attributes xand some random draws of structural parameters
mβ 1 m M= hellip we can simulate choice data through the basic route choice model With
M draws of β from some given density we could simulate M sets of data resulting in
35
simulated choicesɶ( )my β Same as before parameters θ in the auxiliary model can be
estimated based on the simulated data as
ɶ ɶ( ) arg max ( ( ) )m m mL y xθ
θ β β θ= (26)
As the process indicated the simulated choice data depends on the structural parameterβ
in the basic route choice model and in sequence the estimates of parameters θ in the
auxiliary model depends on β when estimated based on the simulated data Based on
this theoretically we have a relationship of ( )θ β referred to as the binding function in
indirect inference literatures which we will discuss in detail for implementation of model
in this thesis A metric is then chosen to measure the distance between the observed and
simulated data viewed by the auxiliary model as a way to indirectly infer the values of
parameters β in the basic model To be specific for each draw of the structural parameter
mβ we can get the estimates of ɶ ( )m mθ β based on the simulated data and the distance
between ɶ ( )m mθ β and ɵθ measured by the chosen metric By doing more iteration with the
aim of minimizing the distance we will get the value of mβ which spurs the ɶ ( )m mθ β
closest toɵθ and this mβ is the inferred estimates of the parameter in the basic model
343 Consistency Discussion
The process of indirectly estimating parameters in the basic model is described above yet
we need to know whether the method we provide gives consistent estimation Here are
some discussions explaining the consistency in estimating by which consistency of the
estimator we proposed is illustrated
As proved the multinomial logit model (MNL) can be estimated consistently based on a
subset of alternatives (McFadden 1978)40 We may need to use the classical conditional
maximum likelihood estimator to deal with the problem at the same time the probability
that an individual n chooses an alternative i conditional on the subset of alternatives
denoted asnc becomes the conditional probability
40 McFadden D (1978) Modeling the Choice of Residential Location In A Karlqvist L Lundqvist F Snickars amp J Weibull (Ed) Spatial Interaction Theory and Residential Location (pp 75-96) Amsterdam North-Holland
36
ln ( | )
ln ( | )( | )in n
jn n
n
V q c i
n V q c j
j c
eP i c
e
micro
micro
+
+
isin
=sum
(27)
in which micro is a scale parameter and inV is the deterministic part of the utility There is a
term ln ( | )nq c j for correcting the sampling bias in which ( | )nq c j denotes the probability
of sampling nc given that alternative j is chosen
If all the alternatives in the choice set have the same probability to be chosen into the
subset the estimation on the subset of alternatives is equivalent to that on the full choice
set To be specific in this case ( | )nq c i is equal to ( | )n nq c j j cforall isin so by calculation the
term for sampling bias correction will cancel out in the probability function
In route choice context the alternative paths between an origin and a destination may be
in large amount and it is inefficient to give some very long-distance paths the same
probability as those short and attractive ones This means that we may need the
importance sampling method when generating subsets of alternatives which selects
attractive alternatives with higher probability than unattractive ones And the correction
term does not cancel out in this case Note that if alternative specific constants are
estimated we can get unbiased estimates of all the parameters except the constants even
if the correction term is not included in the utility function (Manski amp Lerman 1977)41
Back to the route choice context we tend to use large number of alternatives even with
subset of the full choice set which means that it is generally impossible to estimate the
constants and thus the correction term is essential To solve this problem Frejinger et al
(2009) developed a sampling approach in the context of route choice42
The discussion above focuses on the usage of MNL for route choice modeling When it
comes to our method the individual specific choice set is generated by randomly drawing
alternatives from the pseudo-universal choice set with the same probability yet there is
bias when generating the pseudo-universal ones since the pseudo-universal choice set is
composed of certain number of shortest paths between two nodes and this generating
process gives some paths higher probability to be included into the choice set So we
41 Manski C amp Lerman S (1977) The Estimation of Choice Probabilities from Choice Based Samples Econometrica 45 (8) 1977-1988 42 Frejinger E Bierlaire M amp Ben-Akiva M (2009) Sampling of Alternatives for Route Choice Modeling
37
actually use importance sampling to get the choice set which may consequently
introduce bias in estimating the parameterθ in the auxiliary model as discussed above
With the idea of indirect inference we consider only the relationship between θ andβ
denoted as( )θ β and use this relation to infer the value ofβ From this point of view
whether θ is estimated with bias or not does not matter since the relation between it and
β could always be captured which is the specific thing we focus on using the method of
indirect inference So we can say that even with biased subset of alternatives we could
still get consistent estimation by using indirect inference
344 Binding Function
As discussed in indirect inference method section when the sample size N increases
which means that we have more observations of choice the estimated parameter in the
auxiliary modelɶ ( )m mθ β will converge to a stable value ( )mθ β which is often referred
to as the binding function
Given that route choice model deals with discrete choices and by using indirect inference
we have a discrete choice model as the auxiliary model as well the estimates of binding
function ( )mθ β will inherit the discontinuous feature due to discrete individual choices
ɶ( )my β Keane and Smith (2003) proposed a solution of using logit-smoothing on the
simulated dependent choice data43 Following this idea we assume a continuous binding
functionɶ( )θ β for simplicity which could be approximated by a linear function locally
within small intervals With the M randomly drawn values of mβ and the corresponding
estimated parameters ɶ ( )m mθ β in the auxiliary model we could perform an Ordinary
Least Square (OLS) regression to estimate the local approximation of binding function
ɶ( ) c Dθ β β= + (28)
in which cdenotes the constant vector and D denotes the OLS parameter matrix44 To be
specific in our case each parameter in the auxiliary model will have a restriction
function with regard to both parameters in the basic model which is
43 Keane M amp Smith A (2003) Generalized Indirect Inference for Discrete Choice Models 44 Karlstroumlm A Sundberg M amp Wang Q (2011) Consistently estimating flexible route choice models using an MNL lense
38
ɶ1 11 12( )Length Length SBc d dθ β β β= + +
(29)
ɶ2 21 22( )SB Length SBc d dθ β β β= + +
(30)
Based on the observed data of choices y and explanatory variables xand the estimated
binding function which indicates the restrictions between ɶθ andβ we could use the
maximum likelihood method to give estimation of the parameters of interest The
likelihood ratio approach to indirect inference is following ideas of Smith (1993)45 and
Keane and Smith (2003)46
ɶ=arg max ( ( ))L y xβ
β θ β (31)
in which β is the estimate of the parameter of interest β in the basic economic model
With the restriction of binding function this is actually an indirectly inferred estimate In
line with the estimating process in auxiliary model ( )L sdot is the likelihood function of the
auxiliary model
Note that the form of binding function is based on an assumption in the result part we
will verify that this assumption is realistic
45 Smith A (1993) Estimating Nonlinear Time-series Models Using Simulated Vector Autoregressions 46 Keane M amp Smith A (2003) Generalized Indirect Inference for Discrete Choice Models
39
4 Data
41 Road Network
The data we use for estimation is based on a GPS data set collected in the Swedish city of
Borlaumlnge Borlaumlnge is located in the middle part of Sweden and has a population of about
47 000 inhabitants
The virtual road network contains 3077 nodes and 7459 unidirectional links (Frejinger amp
Bierlaire 2007)47 of which 3061 nodes and 7288 links are included in the network for
estimation Figure 3 gives a visual illustration of the road network in Borlaumlnge
Figure 3 Illustration of the Borlaumlnge road network
With regard to our research two of the link attributes are included namely link length
and speed bump dummy Link length is in the unit of km and speed bump dummy is an
indication of speed bump existence on the links which has the value 1 when there is a
speed bump on the link and 0 otherwise
Link length
47 Frejinger E amp Bierlaire M (2007) Capturing Correlation with Subnetworks in Route Choice Models
40
Some descriptive statistics of the link length data for the whole network is presented in
Table 1 below
Table 1 Descriptive statistics of link length
Number of links 7288
Minimum 0001
Maximum 7599
Mean 0184487
Median 0102
Variance 0103722
Lexis ratio (varmean) 1016884
Skewness 9871144
To describe the overall character of the link length attribute the histogram is shown in
Figure 4 below
Figure 4 Histogram of link length data
We could see that the link length data is quite clustered most of which lies within the
range of 01km and 06km Nonetheless there are some extreme values far away from the
range indicating extremely long links To display the variation in the relatively clustered
area we draw a histogram zoomed in the interval of (0 1km] shown Figure 5 in below
0
01
02
03
04
05
06
Fre
qu
en
cy
Link length (km)
Histogram
41
Figure 5 Histogram of link length data (zoomed within 1km)
Over 80 of all the links have length shorter than 03 km indicating concentration of
link length data
Speed bump dummy
Speed bump dummy is based on true situation in the network Of all the links 82 links
are equipped with speed bumps which account for a percentage of 113 The following
Figure 6 displays the locations of links with speed bumps
Figure 6 Illustration of links with speed bumps
0005
01015
02025
03035
04045
05
Fre
qu
en
cy
Link length (km)
Histogram(zoom in)
42
42 Observation Data
The GPS data set is collected as a part of the Swedish Intelligent Speed Adaptation (ISA)
study which aims at traffic safety effects of in-car information systems In the study 186
vehicles were equipped with GPS devices and traced within a radius of 25 km from the
center of Borlaumlnge The monitoring lasted for 30 days from 22th June 2000 to 4th March
2002 obtaining 49 667 vehicle days of travel and nearly a quarter of a million trips (for
more information on the GPS data set check Axhausen Schoumlnfelder Wolf Oliveira amp
Samaga 2003 Schoumlnfelder amp Samaga 2003 Schoumlnfelder Axhausen Antille amp Bierlaire
2002)48
The data collection is not originally designed for route choice analysis so the raw data
cannot be used in our research directly Extensive data processing is performed by the
company GeoStats in Atlanta to retrieve new data set available for route choice analysis
which contains 24 vehicles and 16 035 observations The final data set we use is provided
by Emma Frejinger which contains in total 1832 observations corresponding to 1458
observed unique routes made by 24 vehicles and 1409 unique origin-destination pairs
Considering that certain route may have been observed more than once we make a
distinction between observations and unique routes and number of unique routes should
be less than that of observations consistently with the numbers listed above
As indicated by data collection in the ISA study only licensed drivers with access to his
or her only car are recruited to minimize sharing or swapping of cars Minimum socio-
economic data of the drivers is included in data collection so we have no way to
understand driver characteristics from the data set Logically we make an assumption
that there is only one individual per vehicle
In the observation data a route is represented by a series of links and also an origin-
destination pair With relatively intensively distributed link length number of links could
48 Axhausen K Schoumlnfelder S Wolf J Oliveira M amp Samaga U (2003) 80 Weeks of GPS Traces Approaches to Enriching the Trip Information Transportation Research Record 1870 46-54 Schoumlnfelder S amp Samaga U (2003) Where Do You Want to Go Today-More Observations on Daily Mobility Third Swiss Transport Research Conference Ascona Schoumlnfelder S Axhausen K Antille N amp Bierlaire M (2002) Exploring the Potentials of Automatically Collected GPS Data for Travel Behaviour Analysis- A Swedish Data Source In J Moumlltgen amp A Wytzisk (Ed) GI-Technologien fuumlr Verkehr und Logistik number 13 Institut fuumlr Geoinformatik Universitaumlt Muumlnster (pp 155-179) Munster IfGIprints
43
be used to indicate total length of routes Some of the descriptive statistics of link number
is shown in Table 2 below
Table 2 Descriptive statistics of link numbers in observation data set
Number of observations 1832
Minimum 5
Maximum 106
Mean 202877
Median 16
Variance 1871968
Lexis ratio (varmean) 9227126
Skewness 1732597
For further overall inspection of link number distribution in the observation data set the
histogram is shown in Figure 7 below
Figure 7 Histogram of link numbers in observations data set
Seen from the histogram distribution of number of links is relatively dispersed with a
large range interval Judging by the statistics in general the routes observed have about
000
200
400
600
800
1000
1200
1400
1600
5 8
11
14
17
20
23
26
29
32
35
38
41
44
47
50
53
56
59
62
65
68
71
74
77
80
83
86
89
92
95
98
10
1
10
4
10
7
Mo
re
Fre
qu
en
cy
Number of links
Histogram
44
20 links in average Yet the data has a big variance which is reasonable As stated above
there are 1409 unique OD pairs for 1832 observations indicating that for most OD pairs
there is only one observation Spread within the detecting area different OD pairs could
have various numbers of links in between
Following our experiment design only a portion of the data could be used To be specific
routes with number of links fewer than ten would be eliminated when used for estimation
43 Further Exploration of data
Apart from the characters discussed above there are some other attributes in the data set
interesting to be explored Both in link attribute data set and observation data set there is
travel time data which to some extent is parallel with length in indicating distance
between two nodes
In the link attribute data set one attribute is denotes the estimated travel time of links in
unit of hour Some of the descriptive statistics is shown in Table 3 below switching unit
to minute
Table 3 Descriptive statistics of estimated travel time on links
Number of links 7288
Minimum 000186
Maximum 578268
Mean 0281696
Median 018744
Variance 0119337
Lexis ratio (varmean) 0423638
Skewness 5785361
Seen from Table 3 estimated travel time seems to have a more clustered distribution than
link length judging by lexis ratio and skewness Yet this time is roughly estimated not so
qualified as link length to use in estimation since the latter is much easier to measure and
guarantee precision
In the observation data set we have the duration time of the observations in the unit of
minute Some of the descriptive statistics is shown in Table 4 below
45
Table 4 Descriptive statistics of duration of trips
Number of observations 1832
Minimum 007
Maximum 316
Mean 4991195
Median 3925
Variance 1775639
Lexis ratio (varmean) 3557542
Skewness 2174728
Duration of trips can be used as an indication of distance between origin and destination
yet it is roughly measured and strongly affected by traffic condition on the road network
With similar reasons as discussed on estimated travel time on link we use number of
links instead of duration of trips to indicate the distance between OD pairs
46
5 Experiment Design
When doing the simulation-based estimation it is physically divided into two parts for
convenience of operation As discussed in the method section we choose to use a pseudo-
universal choice set which is generated and stored in the first part and ready for use in
the following experiment Then in the second part we do the simulation-based
experiment to carry out indirect inference method for estimating the parameters of
interest in the basic model β to be specific The Figure 8 below illustrates an abstracted
flow of how the estimation is carried out given certain origin-destination pair
Figure 8 Illustration of the flow in the experiment
As shown in the flow chart we get all the unique OD pairs in the trip data For each of
the OD pairs the Dijkstrarsquos algorithm is used to find the shortest paths between them
without duplicates We set the intended number of paths to be 400 as well as time
terminator in case not enough paths could be generated within certain bearable time
47
interval The generated paths form the pseudo-universal choice set of each OD pair
which is stored for future use Note that we abandon some OD pairs with too few paths
in the pseudo-universal choice set Observations containing the kept OD pairs are used
for following estimation which turns out to be 940 of them
For the OD pair in a given observation 200 alternatives are randomly drawn from the
pseudo-universal choice set and the sequential links in the observation itself is read as an
alternative path The 201 paths compose the observed choice set On the other hand a
given value of mβ is drawn from a predefined domainD The shortest path is generated
based on the given mβ as the simulated observation Like in the observed choice set part
200 alternatives are randomly drawn from the pseudo-universal choice set to form the
simulated choice set together with the simulated observation The auxiliary model is
estimated based on the simulated choice set and we could get a set of ɶ( ( ))mm mβ θ β pairs
which will be used to estimate the binding function Based on the binding function and
the observed choice set the parameters in the basic model could be indirectly estimated
The process described above is abstracted with no illustration of iterations Since this is
an experiment based on simulations certain loops of iteration should be carried out to get
statistics of the results
Given observed trip data at first we have no idea of the value of β In the process of
retrieving value ofβ the estimation process is repeated for several stages denoted asS
starting from a rough guess of the domainsD while for each following stage the domain
shrinks Since we tend to use a local OLS regression to approximate the smooth binding
function the draws of smβ need to be around the true value to prevent misspecification of
OLS regression due to the possibly inherent nonlinearity of the binding function The
estimated 0
β is not satisfactory in precision in the first stage yet it could give a hint of
where the true value lies The domain1D is centered on 0
β with smaller interval before
the estimation in the second stage This way +1sD is dependent on sD with smaller
interval As it goes on we will get a more accurate domain and as a result a well specified
OLS regression to approximate the binding function
48
The process of experiment with iterations is described below Suppose that we have the
experiment carried out for K times and the number of observations used isN
for run 1 k K= hellip for true observation 1 i N= hellip
Randomly draw alternatives from the pseudo-universal choice set end Form the observed choice sety for stage 1 s S= hellip
for 1 m M= hellip
Draw ksmβ from the domain ksD
Simulate paths for OD pairs in the used observations with mβ
for simulated observation 1 i N= hellip Randomly draw alternatives from the pseudo-universal choice set end
Form a simulated route choice setɶ( )ksmy β
Estimate ɶ ( )ks ksm mθ β in Equation (26)
end
Estimate ɶ ( )ks
θ β in Equation (28)
Estimate ks
β in Equation (31) end
Center the domain 1k sD + on ks
β and shrink the interval end
As a trial we first do the experiment on a route choice model with one parameter link
length to be specific For simplicity the random term is not scaled as described in the
model specification section which means we attach a truncated normally distributed
random term to the cost function without scaling it with link length After getting the
estimation of Lengthβ we move on to estimating the route choice model with both
parameters as described in the model specification Results under these two formulations
of models are presented separately in the result part
49
6 Results
61 Validation of Binding Function
As discussed in the binding function section we assume the binding function to be
continuous and feasible to be approximated by a linear function locally The assumption
of binding function can be verified based on the ɶ( ( ))mm mβ θ β pairs we attained as
intermediate results To explain this more explicitly we carry out a simple example with
only one parameter in the route choice model Lengthβ to be specific
The cost function is specified as
( )l li Length Length l lic x xε β ε= + (32)
corresponding to which the auxiliary model is
-ri Length Length r riU xθ ε= + (33)
For each run 10 values ofLengthβ are evenly drawn from a given domain By simulating
observations and estimating the auxiliary model 10 corresponding Lengthθ are generated to
form ten ɶ( ( ))mm mβ θ β pairs As assumed the binding functionɶ( )θ β is continuous which
could be approximated by a linear function locally To display the trend of binding
function we choose a relatively large domain for Lengthβ in the beginning [010]D = and
carry out 10 runs which generate 100 points in the beta-theta diagram shown in Figure 9
below
Figure 9 Scatter plots of the 90 beta-theta pairs
y = 12804x + 16264
Rsup2 = 09959
0
2
4
6
8
10
12
14
16
0 2 4 6 8 10
the
ta_
len
gth
beta_length
50
We do OLS regression for the dots and estimate the binding function Intuitively the
smaller the domain is the more accurate is the approximation of the binding function We
shrink the input domain based on the final estimate of Lengthβ from last trial
As it turned out to be we choose an input domain of [1214]D = for Lengthβ and the
binding function is assumed to take the form of
ɶ1 11( )Length Lengthc dθ β β= +
(34)
The result for one run is displayed in Figure 10 below
Figure 10 OLS regression based on the 10 beta-theta points from one run
The estimated binding function based on the 10 points is
ɶ ( ) 17371+10838Length Lengthθ β β= (35)
as indicated by 2 09783R = the function describes the trend of points very well Since
the interval is quite small we could use the estimated function to approximate the
binding function
When it comes to more parameters in the route choice model what we do is simply to
add more elements in the binding function After getting a vector of β and the
corresponding vector ofɶ( )θ β binding functions of each element in vector ɶ( )θ β with
y = 17371x + 10838
Rsup2 = 09783
315
32
325
33
335
34
345
35
355
12 125 13 135 14
the
ta_
len
gth
beta_length
51
regard to all the elements in vector β are estimated One example is shown in the
Equation (29) and Equation (30)
62 Estimation of model with one attribute
The route choice model with one attribute we used is the one described in Section 61
above After several trials by shrinking input interval every time we finally affirm that
the true value Lengthβ of lies in a relatively small interval of [12 14] Based on this
domain 50K = runs are carried out to get statistics of the estimate of Lengthβ As
discussed in the experimental design several stages Smean different trials before final
affirmation of input interval yet for the statistics only one stage is carried out for each
run Within each run 10M = values of input Lengthβ are drawn for estimating binding
function
The estimation statistics of Lengthβ is shown in Table 5 below
Table 5 Statistics of estimation of beta_length
Parameter Lengthβ
Mean 1337353
Standard deviation 0107537
RMSE 0013227
In the table RMSE is the root-mean-square error which is used to measure the distances
between the observed values being estimated and the predicted values by the estimator
The individual differences are called residuals and RMSE is an aggregated measure of
the residuals To be specific
ɵ ɵ ɵ 2( ) ( ) (( ) )RMSE MSE Eθ θ θ θ= = minus (36)
in which ɵθ is the estimator and θ is the parameter to be estimated so the RMSE is the
square root of the mean square error As defined the smaller the value of RMSE is the
better the estimator is
52
Here the RMSE is calculated based on the ten points ɶ( ( ))mm mβ θ β for estimating binding
function so basically it describes the goodness of fit of the estimated binding function
with regard to the points we generated The Equation (36) is specified as
ɶ 2( ( )) (( ( ) ( )) )mm m mRMSE Meanθ β θ β θ β= minus (37)
The value of RMSE displayed in the Table 5 is the mean value of all the RMSE values
for 50 runs Seen from this we have well-estimated binding function for all the 50 runs
on average In terms of the estimates of binding function taking the one in Section 61 as
an example the binding function estimated in the interval of [12 14] in Equation (35)
has a positive constant and a positive coefficient for Lengthβ which indicates that with
larger value of Lengthβ we will get larger value ofɶ Lengthθ and as a result a negative
coefficient for length in the utility function of the logit model This is reasonable for
bigger Lengthβ reveals larger incremental effect on the cost of certain path while lower
ɶ- Lengthθ reveals larger disutility effect on certain path these two effects are in fact
equivalent
By the way the high fitness of binding function is probably due to the relatively small
input interval of Lengthβ after certain trials and shrinkage As the final estimate indicates
Lengthβ falls right into the interval of [12 14] with small standard deviation So we can
say that the estimate is quite good
63 Estimation of model with two attributes
We use the model described in the model specification section to carry out the estimation
Two attributes are used namely length and speed bump dummy Similar to the one
attribute case we carried out several trials and shrinkage to finally determine the
relatively small input intervals forLengthβ and SBβ [05 1] and [0 05] respectively
50K = runs are carried out to get statistics of the estimates of the two parameters Within
each run 10M = values are drawn for inputs Lengthβ and SBβ respectively for estimating
binding function
53
One important thing to mention here is that the inputs are drawn evenly from the domain
yet to guarantee that the values of Lengthβ and SBβ are independent from each other or to
get rid of collinearity49 the domains of two parameters are defined in two dimensions To
explain this more explicitly we choose data of one run as an example The input points of
( Lengthβ SBβ ) are shown in Figure 11 below
Figure 11 Scatter plot of the input values for beta_length and beta_sb
We can see from Figure 11 that the points spread evenly in the domain quadrant Based
on these draws we could estimate the binding function and evaluate the relationship
between parameters in the logit model and Lengthβ and SBβ without worrying about
possible correlation between Lengthβ and SBβ
As discussed before in the binding function we are supposed to find the relationship
between each of the parameters in the logit model and both parameters in the route choice
model Mathematically this binding function should be a surface in the 3D coordinate
system We take the results of one run as an example and thus we have ten sets of Lengthβ
and SBβ along with corresponding ɶ Lengthθ andɶ SBθ
49 A set of points is collinear if they lie on a single straight line or a projective line (for example projective line over any field) and this way the two factors represented by the points are correlated
0
005
01
015
02
025
03
035
04
045
05
05 06 07 08 09 1
be
ta_
sb
beta_length
54
For the first binding function ɶ Lengthθ and ( Lengthβ SBβ ) are plotted in Figure 12 below
And the binding function takes a form as described in Equation (29)
Figure 12 Scatter plot of theta_length with regard to beta_length and beta_sb
By multi-linear regression we can get a surface to approximate the binding function
locally The estimated binding function is displayed in Figure 13 below
Figure 13 Display of the estimated binding function for theta_length
And the first binding function has a formula of
55
ɶ 18234+16933 +00633Length Length SBθ β β= (38)
For the second binding function ɶSBθ and ( Lengthβ SBβ ) are plotted in Figure 14 below
And the binding function takes a form as described in Equation (30)
Figure 14 Scatter plot of theta_sb with regard to beta_length and beta_sb
By multi-linear regression we can get a surface to approximate the binding function
locally The estimated binding function is displayed in Figure 15 below
Figure 15 Display of the estimated binding function for theta_sb
56
And the second binding function has a formula of
ɶ -06698+00371 +17619SB Length SBθ β β= (39)
The t-test of estimated parameters in the binding function is carried out with null
hypothesis of zero Estimates that are significantly different from zero with 95
confidence interval are marked as bold
Table 6 Estimated coefficients of binding function for model with two attributes
Constant Lengthβ SBβ
ɶLengthθ 18234
(43632) 16933
(33481) 00633 (1392)
ɶSBθ -06698
(-7991) 00371 (0366)
17619 (19323)
Seen from the magnitude of coefficients in the binding functions both Lengthβ and SBβ
have positive effect on ɶ Lengthθ andɶ SBθ and in sequence negative effect on the coefficients
in the logit model In addition coefficients of SBβ with regard to ɶ Lengthθ and Lengthβ with
regard to ɶ SBθ are not significantly different from zero so we can say Lengthβ has a more
apparent effect on ɶ Lengthθ than SBβ does while SBβ has a more apparent effect on ɶ SBθ
than Lengthβ does
Based on the estimated binding functions and the true observation data we could get the
estimates of Lengthβ and SBβ as shown in Table 7 below
Table 7 Statistics of estimation of beta_length and beta_sb
Parameter Lengthβ
SBβ
Mean 0761383 0079874
Standard deviation 0068493 0034375
RMSE 0022772 0085113
Seen from the RMSE results the relatively small values indicate that we have well-
estimated binding functions for all the 50 runs on average With regard to the estimates of
parameters in the route choice model both of them fall into the input domain we choose
57
and the standard deviation is quite small So we can say that the estimates are actually
very good
One thing to notice here is that the final estimate of Lengthβ falls approximately in the
middle of the input domain [05 1] while the estimate of SBβ falls closer to the left limit
which might need further shrinkage of input domain and more precise estimate of the
binding function To get rid of this we use the binding function estimate from all the 500
points to give a hint on the reasonability of acceptance of the estimate of SBβ The scatter
plots of theta_sb against beta_sb and beta_length are shown in Figure 16 below
Figure 16 Scatter plots of theta_sb against beta_sb and beta_length
The scatter plots in Figure 16 above are the decompositions of the binding function from
three dimensions to two dimensions Seen from the linear regression in the two plots ɶSBθ
is almost strictly positive proportional to SBβ and hardly effected byLengthβ This means
y = 19132x - 06404
Rsup2 = 0936
-1
-08
-06
-04
-02
0
02
04
06
0 01 02 03 04 05
the
ta_
sb
beta_sb
y = 00123x - 01717
Rsup2 = 4E-05
-1
-08
-06
-04
-02
0
02
04
06
05 06 07 08 09 1
the
ta_
sb
beta_length
58
that by shrinking the input domain ofSBβ we would probably get the same estimate of
binding function since it changes little in current domain And this leads to our
acceptance of the final estimate of SBβ
Given that we have a random cost following a truncated standard normal distribution and
the magnitudes of the estimated parameters are relatively small this would mean that the
randomness of the cost function are relatively large which in sequence leads to relatively
large randomness in individualrsquos choice of route
Another thing to be mentioned is that the magnitude of Lengthβ is smaller than that when
estimated singly Though these two values are not logically comparable with different
formation of random term in the cost function we could still get a hint from the
comparison This difference is probably due to the form of random cost we used which is
( )li Length l Lengthx E xε sdot and the effect of length on the cost is partially captured by this
random term
64 Estimations of other trial formulations of the model
641 Model with exponential form of cost function
During the process of estimation we carried out a lot of other trials in the formulations of
the basic route choice model the cost function to be specific and the auxiliary logit model
As it turned out the there are negative estimates of coefficients in the cost function
which conflicts our anticipation To capture this kind of negative estimation we choose to
use the exponential form of the cost function Without loss of generality the random term
is not scaled by the length of links The cost function is specified as
( ) Length Length l SB SB l lix x
i lic x eβ β εε + += (40)
Two attributes are used namely length and speed bump dummy variable Unlike the form
in Section 63 we allow the parameters Lengthβ and SBβ to have negative input and the
random term liε now follow a standard normal distribution without truncation Since we
take the exponential form of the cost function the cost of links could be kept positive
thus allowing the use of Dijkstrarsquos Algorithm to operate
59
In terms of the auxiliary model since we could have more attributes in the auxiliary
model than the underlying model Instead of using the same attributes as in the cost
function we choose to add an attributes which is number of links in the pathLNx So the
utility function of the logit model is specified as
- - -ri Length Length r SB SB r LN LN r riU x x xθ θ θ ε= + (41)
We still expect the value of θ to be positive and the coefficient of variables with the form
of -θ would be negative
Several trials and shrinkage were carried out for this formulation of our model to finally
determine the relatively small input intervals forLengthβ and SBβ [25 27] and [-05 0]
respectively 15K = runs are carried out to get statistics of the estimates of the two
parameters Within each run 10M = values are drawn for inputs Lengthβ and SBβ
respectively for estimating binding function
To visualize the trend of binding function more clearly we make use all the 150 sets of
vector β and vector θ to estimate the binding function Since we have three variables in
the logit model we have to estimate three binding functions
For the first binding function ɶ Lengthθ and ( Lengthβ SBβ ) are plotted in Figure 17 below
shown along with the estimated binding function
Figure 17 Scatter plot of theta_length against beta_length and beta_sb estimated binding function
The first binding function takes the form of
ɶ 41312+09114 +44845 10Length Length SBθ β βminus= sdot (42)
60
For the second binding function ɶSBθ and ( Lengthβ SBβ ) are plotted in Figure 18 below
shown along with the estimated binding function
Figure 18 Scatter plot of theta_sb against beta_length and beta_sb estimated binding function
The second binding function takes the form of
ɶ 01147 01362 +07119SB Length SBθ β β= minus (43)
For the third binding function ɶ LNθ and ( Lengthβ SBβ ) are plotted in Figure 19 below
shown along with the estimated binding function
Figure 19 Scatter plot of theta_ln against beta_length and beta_sb estimated binding function
The third binding function takes the form of
ɶ 10043 03378 +00068LN Length SBθ β β= minus (44)
The t-test of estimated parameters in the binding function is carried out with null
hypothesis of zero Estimates that are significantly different from zero with 95
confidence interval are marked as bold
61
Table 8 Estimated coefficients of binding functions for model with exponential cost function
Constant Lengthβ SBβ
ɶLengthθ 1312
(2411) 09114 (4360)
4484510-4 (0005)
ɶSBθ 01147
(0425) -01362 (-1314)
07119 (17221)
ɶLNθ 10043
(13767) -03378
(-12051) 00068 (0607)
Same as in the model with two attributes ɶ Lengthθ andɶ SBθ are significantly affected by
Lengthβ and SBβ respectively The negative signs for Lengthβ in the second and third binding
functions draw our attention Since in the second binding function it is not significantly
different from zero we can disregard the effect In the third binding function Lengthβ has
significantly negative effect on ɶ LNθ The larger value of Lengthβ we have the more
influential of path length on cost is With negative effect on ɶ LNθ we can say at the same
time number of links become less influential on the utility This is reasonable since
intuitively if we are sensitive to the path length we wouldnrsquot care too much of having to
switch several more or fewer links based on that path length and number of links are
more or less correlated to each other
Based on the estimated binding functions and the true observation data we could get the
estimates of Lengthβ and SBβ as shown in Table 9 below
Table 9 Statistics of estimation of beta_length and beta_sb in exponential-cost-function model
Parameter Lengthβ
SBβ
Mean 2537672 -045601
Standard deviation 0068377 0133036
We have negative estimate of SBβ which conflicts our assumption that length and
presence of speed bump on the path may increase the cost of traveling through certain
path This is probably due to omission of important attributes in the deterministic part of
the cost function Based on the estimate we are led to think that presence of speed bump
decrease the cost and individuals would prefer to drive on paths with speed bumps Yet
62
this is not true based on our estimation since we are only using two attributes And there
are great chance that some important features are not captured which accidentally are
related with speed bump So the estimate of SBβ is misleading per se in the simple model
as we are using To get more accurate estimate of SBβ we may need to include more
variables in the deterministic part of the cost function
642 Model with estimated scale parameter for random term
Considering the trial with two attributes in Section 63 we add a fixed scale parameter to
the random term to make it proportional to the length of links This appeals to our
assumption yet lays restrictions to the model Apart from this we also try to add an
unfixed scale parameter σ and estimate it along with the other two parameters Lengthβ and
SBβ Note that if we add a scale parameter directly to the random term it wonrsquot work out
as we expect since that way the scale parameter will scale the other two parameters
Lengthβ and SBβ as well as shown below
= ( )Length SBLength Length l SB SB l li Length l SB l lix x x x
β ββ β ε σ σ εσ σ
+ + sdot + + (45)
The right side equation is equivalent to Length Length l SB SB l lix xβ β ε+ + thus making no
difference So we choose to add a new random term including the scale parameter In
addition since we can get good estimate by assuming the random term proportional to
length we will keep this in the newly added random term Now the cost function is
specified as
1 ( ) + ( )l li li Length Length l SB SB l li li Length l Lengthc x x x x Mean xε ε β β ε η σ= + + sdot sdot 2
(46)
liε and liη follow the same truncated normal distribution but are drawn separately so that
they are not equal
In terms of the auxiliary model since now we have three parameters to be estimated in
the underlying model we need one more attribute in the logit model and number of links
in the path LNx is chosen The utility function of the logit model is actually the same as in
Section 641 which is
- - -ri Length Length r SB SB r LN LN r riU x x xθ θ θ ε= + (47)
63
With three parameters in the underlying model it is more reasonable to include
interactions of parameters in the binding function The binding functions take the form of
ɶ
1 2 3
4 5 6 7
( )
Length SB
Length SB Length SB Length SB
c d d d
d d d d
θ β β β σβ β β σ β σ β β σ
= + + +
+ + + + (48)
Since the estimates are not good we did not carry out too many trials to center the input
interval As a result the binding function may be of more interest in this case The chosen
interval is a trial one which is identical [0 3] for Lengthβ SBβ andσ We choose ten sets of
mβ and ɶ ( )m mθ β from one run as an example The values of ɶ ( )m mθ β are plotted against
Lengthβ SBβ andσ respectively The interactions are not shown in the figure yet we have
the estimates of binding function which will give a numerical description of how the
interactions impact theɶ ( )m mθ β
Figure 20 Plots of theta_length against beta_length beta_sb and sigma respectively
y = 09114x + 27818
Rsup2 = 07361
0
1
2
3
4
5
6
0 1 2 3 4
the
ta_
len
gth
beta_length
y = 03568x + 36215
Rsup2 = 00897
0
1
2
3
4
5
6
0 1 2 3 4
the
ta_
len
gth
beta_sb
y = 02572x + 38468
Rsup2 = 00516
0
1
2
3
4
5
6
0 1 2 3
the
ta_
len
gth
sigma
64
Figure 21 Plots of theta_sb against beta_length beta_sb and sigma respectively
y = 02363x + 0835
Rsup2 = 0088
0
05
1
15
2
25
3
0 1 2 3 4
the
ta_
sb
beta_length
y = 06351x + 01759
Rsup2 = 05054
0
05
1
15
2
25
3
0 1 2 3 4
the
ta_
sb
beta_sb
y = -03801x + 17212
Rsup2 = 02001
0
05
1
15
2
25
3
0 1 2 3
the
ta_
len
gth
sigma
y = 00477x + 04521
Rsup2 = 005460
02
04
06
08
1
0 1 2 3 4
the
ta_
ln
beta_length
y = -00553x + 06156
Rsup2 = 00582
0
02
04
06
08
1
0 1 2 3 4
the
ta_
ln
beta_sb
65
Figure 22 Plots of theta_ln against beta_length beta_sb and sigma respectively
As we can see from the three figures above ɶ Lengthθ ɶSBθ and ɶ LNθ are more affected by
Lengthβ SBβ andσ respectively Especially we can see a strong relationship between ɶ LNθ
and σ which assures that number of links can be used to infer the scale parameter in the
underlying model
The estimates of three binding functions are shown in Table 10 below with each row
representing the estimates for one of the three binding function and each column
representing certain variable in the binding function In the parenthesis below each
estimate of the coefficients is the t-test value with the null hypothesis of zero We take the
90 confidence interval and estimates with t-test value larger than 164 are supposed to
be significantly different from zero which are marked as bold
Table 10 Estimates of three binding functions
Constant Lengthβ SBβ σ
Length SBβ β
Lengthβ σ
SBβ σ Length SBβ β σ
ɶLengthθ
1814 (3085)
0861 (2417)
-0089 (-0258)
1038 (2913)
0202 (1030)
-0246 (-1240)
-0056 (-0292)
-0045 (-0412)
ɶSBθ 0284
(1482) -0125
(-1081) 0942
(8371) -0247
(-2127) 0118
(1856) 0070
(1086) -0141
(-2275) -0067
(-1883)
ɶLNθ 0819
(18643) 0015
(0577) -0026
(-0997) -0261
(-9794) 0006
(0419) 0007
(0498) 0024
(1663) -0007
(-0803)
As the constants indicate given no other attributes length and number of links have more
negative effects on the utility than the speed bump dummy does Judging from the
significance of coefficients for the three input parametersɶ Lengthθ ɶSBθ and ɶ LNθ are
significantly affected by Lengthβ SBβ andσ respectively As we can see σ has a negative
y = -02164x + 08218
Rsup2 = 09867
0
02
04
06
08
1
0 1 2 3th
eta
_ln
sigma
66
effect on ɶSBθ andɶ LNθ Since to some extent σ measures the scale of randomness we
could say that the more randomness of the costs on the links have the less influential of
presence of speed bump and number of links become ForɶSBθ it is significantly affected
by some of the interaction terms Notice that SBβ has positive effect onɶSBθ while σ has
effect The interaction terms including both σ and SBβ have negative effect onɶSBθ which
indicates that randomness of cost is more influential than presence of speed bump on the
disutility of speed bump
In terms of the final estimate as stated above the estimates of Lengthβ and SBβ have
negative signs whileσ has positive sign This result conflict our expectation that Lengthβ
and SBβ should have positive signs so we did not carry out more trials and shrinkage The
possible reason for negative estimate is similar to that in the model with exponential form
of cost function Given more attributes in the deterministic part of both the cost function
and utility function in the logit model we might be able to capture the features of the data
better and have the right sign in the final estimates
643 Monte Carlo evidence of model with estimated scale parameter for random
term
Based on the model formulation with estimated scale parameter for random term we also
carried out a Monte Carlo simulation experiment to verify the efficiency of using number
of links in the logti model to infer the scale parameter in the cost function and what we
do is to simulated observations instead of the true ones
We take three arbitrary values for the three parameters in the cost functionLengthβ SBβ and
σ to be 05 And simulated observations are generated based on the given values of
parameters in the cost function Since we know the true values for the parameters the
input domain is centered around the true values to be [04 06] for Lengthβ SBβ andσ
10K = runs are carried out to get statistics of the estimates of the three parameters
Within each run 10M = values are drawn for inputsLengthβ SBβ andσ respectively for
estimating binding function
67
In terms of the binding function by doing regression test we can see that the intersection
terms are unnecessary to be included or even hazardous for good estimate of binding
function so we decide to remove them and keep the binding function as
ɶ1 2 3( ) Length SBc d d dθ β β β σ= + + + (49)
We choose ten sets of mβ and ɶ ( )m mθ β from one run as an example The values of
ɶ ( )m mθ β are plotted againstLengthβ SBβ andσ respectively
Figure 23 Plots of theta_length against beta_length beta_sb and sigma respectively
y = 23826x + 14791
Rsup2 = 05326
15
2
25
3
35
04 05 06
the
ta_
len
gth
beta_length
y = -06434x + 30245
Rsup2 = 0048115
2
25
3
35
04 05 06
the
ta_
len
gth
beta_sb
y = 26255x + 14156
Rsup2 = 07607
15
2
25
3
35
04 05 06
the
ta_
len
gth
sigma
y = -02443x + 04708
Rsup2 = 0034
0
01
02
03
04
05
04 05 06
the
ta_
sb
beta_length
y = 11233x - 02096
Rsup2 = 089020
01
02
03
04
05
04 05 06
the
ta_
sb
beta_sb
68
Figure 24 Plots of theta_sb against beta_length beta_sb and sigma respectively
Figure 25 Plots of theta_ln against beta_length beta_sb and sigma respectively
The figures show similar trend to those in the trial model with estimated scale parameters
which is in line with our expectation
The estimates of three binding functions are shown in Table 11 below with each row
representing the estimates for one of the three binding function and each column
y = -04374x + 056
Rsup2 = 01283
0
01
02
03
04
05
04 05 06
the
ta_
sb
sigma
y = -01144x + 07619
Rsup2 = 01114066
067
068
069
07
071
072
073
074
04 05 06
the
ta_
ln
beta_length
y = 0053x + 06768
Rsup2 = 00296066
067
068
069
07
071
072
073
074
04 05 06
the
ta_
ln
beta_sb
y = -03115x + 08561
Rsup2 = 09717
066
067
068
069
07
071
072
073
074
04 05 06
the
ta_
ln
sigma
69
representing certain variable in the binding function In the parenthesis below each
estimate of the coefficients is the t-test value with the null hypothesis of zero We take the
95 confidence interval and estimates with t-test value larger than 196 are supposed to
be significantly different from zero which are marked as bold
Table 11 Estimates of three binding functions in the Monte Carlo experiment
Constant Lengthβ SBβ σ
ɶLengthθ 0853
(3606) 1009
(3724) -0034
(-0125) 2569
(9482)
ɶSBθ -0062
(-0385) -0104
(-0564) 1208
(6591) -0226
(-1227)
ɶLNθ 0854
(46688) 0013
(0624) -0004
(-0185) -0302
(-14428)
The estimates of binding function have similar characteristics as in the trial model with
estimated scale parameters as well They contain almost the same significant coefficients
and those significant estimates have the same signs as in the trial with true observations
Based on the estimated binding function and the simulated observations given true values
of the three parameters to be 05 the final estimates of Lengthβ SBβ andσ are shown in
Table 12 below
Table 12 Statistics of estimation of beta_length beta_sb and sigma in the Monte Carlo experiment
Parameter Lengthβ
SBβ σ
Mean 0404138359 0458624533 0639191487
Standard deviation 1109279424 0242570421 0377069799
As we can see the estimates of Lengthβ SBβ andσ are quite close to their true values What
is not satisfying is that the estimate of σ is a little large and lies outside the input domain
of [04 06] but is still quite near to this interval In addition the estimate of Lengthβ is
within the input domain yet the variation is large This is understandable since we scale
the random term by length together with the scale parameter and thus the parameter for
length could be influenced by the random term and turns out to have large variations In a
word the result of Monte Carlo experiment verifies that we get use the model
70
formulation with unfixed scale parameter for the random term to get the right estimate of
the true values And number of links is strongly related withσ which means that it is
reasonable and efficient to use it as a reference to σ in the cost function
71
7 Conclusions
This thesis aims at implementing the newly proposed route choice model based on
indirect inference in true observations The model assigns links specific errors for a
network which allows natural correlations among paths and is practical in simulating
observations by means of shortest path searching algorithms like the Dijkstrarsquos Algorithm
used in our experiment To get consistent estimation of this kind of model indirect
inference method is used and a simple model like logit model is used as an auxiliary
model The route choice model and indirect inference estimator has been tested on
synthetic data with simulated observations and proved to be capable of consistently
estimated
Compared to the synthetic experiment some extensions are done in this thesis By
replacing the simulated observations with the true observations the method is tested on
the empirical circumstance to prove that it could be used in solving practical problems
The true observations have more noises than the simulated ones thus more difficulty to
capture their features We know neither the right formulations of models based on the
data nor the values of parameters in the route choice model yet as defined the
parameters should have positive signs As it turned out to be in the experiment with only
length in the model we get the estimates of Lengthβ as 1337 while with two attributes in
the model we get the estimates of Lengthβ and SBβ as 0761 and 00799 respectively The
estimates in both experiments seem reasonable with the right sign In addition seen from
the estimation of the binding function the coefficients in the logit model is negatively
affected by the parameters they infer in the basic route choice model in the two attributes
case one parameter in the logit model is more apparently affected by the parameter it
refers than the other parameter in basic model
In the trial where we include a scale parameter to the random term and estimate it along
with the other parameters in the route choice model a Monte Carlo simulation
experiment is carried out using simulated observations The result shows that it is
efficient to use number of links in the auxiliary model to infer the scale parameter in the
basic rout choice model
72
In other trial formulations of the model we got negative estimates which may probably
be due to missing attributes in the cost function Future work should be done to include
more attributes
Another thing to recommend for future is that we generate the pseudo-universal choice
set as part of the auxiliary model Since the pseudo-universal choice set is partially used
for deciding which ODs and observations to be used in the project it is essential and
should be generated beforehand But from the choice set generation point of view we
could generate individual specific choice set directly instead of random drawing paths
from the pseudo-universal choice set This would increase computational efficiency
73
Bibliography
Axhausen K Schoumlnfelder S Wolf J Oliveira M amp Samaga U (2003) 80 Weeks of
GPS Traces Approaches to Enriching the Trip Information Transportation Research
Record 1870 46-54
Azevedo J Costa M Madeira J amp Martins E (1993) An Algorithm for the Ranking
of Shortest Paths European Journal of Operational Research 69 (1) 97-106
Bartels K Boztug Y amp Muumlller M (1999) Testing the Multinomial Logit Model
Working paper University Potsdam Germany
Bekhor S Ben-Akiva M amp Ramming M (2002) Adaptation of Logit Kernel to Route
Choice Situation Transportation Research Board of the National Academics 1805 78-85
Bekhor S Ben-Akiva M amp Ramming M (2006) Evaluation of Choice Set Generation
Algorithms for Route Choice Models Annals of Operations Research 114 (1) 235-247
Ben-Akiva M amp Bierlaire M (1999) Discrete Choice Methods and Their Applications
to Short Term Travel Decisions In Chapter for the Transport Science Handbook
Preliminary Draft
Ben-Akiva M amp Bierlaire M (2003) Discrete Choice Models with Applications to
Departure Time and Route Choice In Handbook of Transportation Science (second ed)
Kluwer
Ben-Akiva M amp Bolduc D (1996) Multinomial Probit with a Logit Kernel and a
General Parametric Specification of the Covariance Structure Working Paper
Ben-Akiva M amp Lerman S (1985) Discrete Choice Analysis Theory and Application
to Travel Demand MIT Press
Ben-Akiva M Bergman M Daly A amp Ramaswamy R (1984) Modeling Inter Urban
Route Choice Behaviour In J Vollmuller amp R Hamerslag (Ed) the 9th International
Symposium on Transportation and Traffic Theory (pp 299-330) Utrecht Netherlands
VNU Science Press
Cascetta E Nuzzolo A Russo F amp Vitetta A (1996) A Modified Logit Route Choice
Model Overcoming Path Overlapping ProblemsSpecification and Some Calibration
Results for Interurban Networks In J Lesort (Ed) the 13th International Symposium on
Transportation and Traffic Theory Lyon France
74
Creel M (2009) A Data Mining Approach to Indirect Inference Universitat Autonoma
de Barcelona Department of Economics and Economic History
De La Barra T Peacuterez B amp Anez J (1993) Multidimensional Path Search and
Assignment 21st PTRC Summer Meeting (pp 307-319)
Dijkstra E (1959) A note on two problems in connexion with graphs Numerische
Mathematik 1 269-271
Frejinger E amp Bierlaire M (2007) Capturing Correlation with Subnetworks in Route
Choice Models Transportation Research Part B 41 363-378
Frejinger E Bierlaire M amp Ben-Akiva M (2009) Sampling of Alternatives for Route
Choice Modeling Transportation Research Part B Methodological 43 (10) 984-994
Gallant A amp McCulloch R (2004) On the Determination of General Scientific Models
Manuscript Duke University
Gourieacuteroux C Monfort A amp Renault E (1993) Indirect Inference Journal of Applied
Econometrics 8 85-118
Karlstroumlm A Sundberg M amp Wang Q (2011) Consistently estimating flexible route
choice models using an MNL lense International Choice Modeling Conference Leeds
Keane M amp Smith A (2003) Generalized Indirect Inference for Discrete Choice
Models Manuscript Yale University
Manski C amp Lerman S (1977) The Estimation of Choice Probabilities from Choice
Based Samples Econometrica 45 (8) 1977-1988
McFadden D (1974) Conditional Logit Analysis of Qualitative Choice Behaviour (P
Zarembka Ed) Frontiers in Econometrics 105-142
McFadden D (1978) Modeling the Choice of Residential Location In A Karlqvist L
Lundqvist F Snickars amp J Weibull (Ed) Spatial Interaction Theory and Residential
Location (pp 75-96) Amsterdam North-Holland
McFadden D amp Train K (2000) Mixed MNL Models for Discrete Response Journal
of Applied Econometrics
Nerella S amp Bhat C (2004) Numerical Analysis of Effect of Sampling of Alternatives
in Discrete Choice Models Transportation Research Record 1894 11-19
Ramming M (2001) Network Knowledge and Route Choice PhD Thesis Massachusetts
Institute of Technology
75
Schoumlnfelder S amp Samaga U (2003) Where Do You Want to Go Today-More
Observations on Daily Mobility Third Swiss Transport Research Conference Ascona
Schoumlnfelder S Axhausen K Antille N amp Bierlaire M (2002) Exploring the
Potentials of Automatically Collected GPS Data for Travel Behaviour Analysis- A
Swedish Data Source i J Moumlltgen amp A Wytzisk (Red) GI-Technologien fuumlr Verkehr
und Logistik number 13 Institut fuumlr Geoinformatik Universitaumlt Muumlnster (ss 155-179)
Munster IfGIprints
Smith A (1993) Estimating Nonlinear Time-series Models Using Simulated Vector
Autoregressions Journal of Applied Econometrics 8 63-84
Smith A (2008) Indirect Inference In S Durlauf amp L Blume (Eds) The New
Palgrave Dictionary of Economics (Second ed) Palgrave Macmillan
Smith A (1990) Three Essays on the Solution and Estimation of Dynamic
Macroeconomic Models PhD Dissertation Duke University
Train K (2003) Discrete Choice Methods with Simulation Cambridge University Press
Vovsha P amp Bekhor S (1998) Link-nested Logit Model of Route Choice-Overcoming
Route Overlapping Problem Transportation Research Record 1645 133-142
Wang H (2011) Logistics Distribution Shortest Path Based on Dijkstra Algorithm
Computer and Digital Engineering 3
Assigned publication number
TSC-MT 11-016
wwwkthse

15
proposed for its property to overcoming the drawbacks of the conventional MNL models
This type of model can be easily estimated using popularized software The main
conclusion is that route choice models could be estimated for large-scale networks based
on the true observation data and prominent computing resources
Frejinger Bierlaire and Ben-Akiva (2009) proposed a paradigm for choice set generation
based on sampling for route choice modeling16 In the context of route choice modeling
the universal choice set which denotes all possible alternatives for a traveler to choose
from is not able to be enumerated So we practically work on a sampled choice set from
the universal one which may easily introduce bias to the final estimate In this paradigm
they focus on unbiased estimation of parameters instead of generating actual choice set
The path generation is seen as an importance sampling approach and a correction of
sampling is added to the path utility Since the following estimation process is based on
the sampled choice set which is treated as the universal one a correction for sampling is
added to the path size attribute in the commonly used path size logit (PSL) model ending
up with the expanded path size Modification in the previous two steps guarantees
unbiased estimation of the parameters Numerical results based on synthetic data are
presented in the paper to reveal that models with a sampling correction in the path utility
are better than those without it The proposed expanded path size logit model provides
unbiased estimation and is better than the original path size models
In this paper we will examine indirect inference Indirect inference is not a new method
it was first introduced by Smith (1990 1993)17 Then Gourieacuteroux et al (1993) gave
overall introduction to the methods and extended it in important ways18 Gallant and
McCulloch (2004) transferred the idea of indirect inference and used it for Bayesian
inference in models where likelihood function is intractable19
16 Frejinger E Bierlaire M amp Ben-Akiva M (2009) Sampling of Alternatives for Route Choice Modeling Transportation Research Part B Methodological 43 (10) 984-994 17 Smith A (1990) Three Essays on the Solution and Estimation of Dynamic Macroeconomic Models PhD Dissertation Duke University Smith A (1993) Estimating Nonlinear Time-series Models Using Simulated Vector Autoregressions Journal of Applied Econometrics 8 63-84 18 Gourieacuteroux C Monfort A amp Renault E (1993) Indirect Inference Journal of Applied Econometrics 8 85-118 19 Gallant A amp McCulloch R (2004) On the Determination of General Scientific Models Manuscript Duke University
16
Gourieacuteroux Monfort and Renault (1993) proposed the inference methods based on an
ldquoincorrectrdquo criterion which does not give consistent estimation to parameters of interest
directly20 The argument of the criterion is called the auxiliary parameter which may
have a larger dimension than the parameters of interest in the basic model After the
auxiliary parameters are selected a simulation-based process is carried out to get a
consistent and asymptotically normal estimator of parameters of interest As a simulation-
based method the only requirement for the basic model is that it could be simulated
regardless of formulations of the model So it could be used for estimating models which
are too complex to carry out direct approaches The paper shows how this kind of method
can be applied in fields such as micro-econometrics macro-econometrics and
econometrics of finance
Keane and Smith (2003) proposed a generalized form of the indirect inference method to
be implemented in the discrete choice model context21 Theoretically indirect inference
could deal with estimation of any economic models yet it has some limitations per se that
decrease the estimation efficiency or even make it difficult to implement Problems arise
when we use indirect inference in estimating discrete choice models since the objective
function the metric of distance between the auxiliary models estimated on observed data
and simulated data to be specific is inherently discrete which leaves the gradient-based
optimization methods infeasible Keane and Smith (2003) proposed that the estimation
procedures used for observed data and simulated data can be different22 Instead of the
discrete choice a continuous function of latent utilities including a smoothing parameter
is used as the dependent variable in the auxiliary model When the smoothing parameter
goes to zero the function of latent utilities converges to the discrete choices this way to
guarantee consistency According to the Monte Carlo results the generalized indirect
inference method proposed in this paper yields good estimates in small samples being as
efficient as maximum likelihood estimates in comparison
20 Gourieacuteroux C Monfort A amp Renault E (1993) Indirect Inference 21 Keane M amp Smith A (2003) Generalized Indirect Inference for Discrete Choice Models Manuscript Yale University 22 Keane M amp Smith A (2003) Generalized Indirect Inference for Discrete Choice Models
17
Creel (2009) presented a data mining approach to indirect inference23 which is similar to
the regular indirect inference method yet with certain advantages over it The method is a
simulation-based estimator relying also on an auxiliary model In line with the indirect
inference method an underlying economic model with parameterβ is referenced by an
auxiliary model with parameterθ Certain values of the parameter hβ in underlying
economic model are drawn randomly from a known density simulated data is generated
using Monte Carlo methods to estimate ɶh
θ of auxiliary model which ends up with a set
of tuples ɶ( )hhβ θ Nonparametric methods are used to get the function ɶ( | )E aβ θ = and
the final estimate of β is supposed to be the result of regression function evaluated at the
estimate of θ based on true observations ɶ ɵ( | )Eβ β θ θ= = Creel (2009) also presented a
way of calculating confidence intervals24 Monte Carlo results in dynamic and nonlinear
panel models and vector autoregressions show good performance of the new estimator
23 Creel M (2009) A Data Mining Approach to Indirect Inference Universitat Autonoma de Barcelona Department of Economics and Economic History 24 Creel M (2009) A Data Mining Approach to Indirect Inference
18
3 Methodology
31 Multinomial Logit Model (MNL)
311 Model Description
Route choice modeling is somewhat complicated when we want to capture the attributes
of both the alternative routes and choice maker accurately and reflect the choice making
process in the model Intuitively route choice can be regarded as choosing one specific
route from several alternative routes which coincides with the prerequisites of discrete
choice models Actually a lot of literatures have explored the route choice modeling and
possible improvements based on discrete choice models (see Cascetta et al 1996 Vovsha
and Bekhor 1998 Ben-Akiva and Bierlaire 1999 for more information on development
in route choice models with regard to discrete choice models)25
To understand the frontier development of route choice model we have got to know the
discrete choice models among which multinomial logit model (MNL) is the most widely
used In addition we choose to implement a new method ndash indirect inference in which
MNL is used as it is
Logit model is the most widely used discrete choice model till now due to its excellent
qualities in model specification To be specific the choice probability takes a closed form
which is easy to estimate and interpret (Train 2003)26
The multinomial logit model is a kind of choice model with more than two alternatives in
the choice set We assume that the choice maker makes his or her decision based on the
utility maximization rule (Ben-Akiva amp Lerman 1985)27 With regard to the utility njU
the decision maker n obtains from the thj alternative in the choice set it is made up of
two parts the deterministic part and the stochastic part The deterministic part denoted
25 Cascetta E Nuzzolo A Russo F amp Vitetta A (1996) A Modified Logit Route Choice Model Overcoming Path Overlapping ProblemsSpecification and Some Calibration Results for Interurban Networks Vovsha P amp Bekhor S (1998) Link-nested Logit Model of Route Choice-Overcoming Route Overlapping Problem Transportation Research Record 1645 133-142 Ben-Akiva M amp Bierlaire M (1999) Discrete Choice Methods and Their Applications to Short Term Travel Decisions 26 Train K (2003) Discrete Choice Methods with Simulation Cambridge University Press 27 Ben-Akiva M amp Lerman S (1985) Discrete Choice Analysis Theory and Application to Travel Demand MIT Press
19
by njV contains attributes known by the modelers while the stochastic part denoted by
njε is the attributes affecting peoplersquos the decision which cannot be observed by the
modelers yet are known by the decision makers themselves So the utility function turns
out to be
nj nj njU V jε= + forall (1)
The type of choice model is basically decided by the distribution of the stochastic part
When we assume that njε is independently identically Gumbel distributed the model
becomes a logit model
As stated above the decision follows utility maximization rule which means that the
decision maker n chooses the alternative with the highest utility say the thi alternative
Use as the probability the thi alternative is chosen over the others we have
( max ) ( )
( )
( )
ni ni nj ni njj C
ni ni nj nj
nj ni ni nj
P P U U P U U j i
P V V j i
P V V j i
ε εε ε
isin= = = ge forall ne
= + gt + forall ne
= minus lt minus forall ne (2)
With Equation (2) above and the assumption that njε follows iid Gumbel distribution we
could derive the probability of decision maker n chooses alternativei which is
ni
nj
V
ni V
j
eP
e=sum
(3)
Typically we specify the deterministic part of the utility function in a linear form which
is nj njV xβ= Then the probability becomes
ni
nj
x
ni x
j
eP
e
β
β=sum
(4)
This is the most common form of probability function for multinomial logit models
There are some good properties for this kind of logit probability as discussed by Train
(2009)28 With this form the probability of choosing certain alternative will be between
zero and one inherently which is basically required for probability definition Yet the
28 Train K (2003) Discrete Choice Methods with Simulation
20
value of niP will never drop to zero mathematically which means that all the alternatives
in the choice set are perceived to have chance to be chosen On the other hand if an
alternative is perceived never to be chosen it should not be included in the choice set at
all
The probabilities for all the alternatives in the choice set sums to be one which is easily
illustrated from the analytical properties 1 1 1
( ) 1njni
J J JVV
nii i j
P e e= = =
= =sum sum sum in which J denotes
the number of alternatives in the choice set
The logit probability and the deterministic part of the utility function follow an S-shaped
curve line shown in Figure 1 below
Figure 1 S-shaped relationship between probability and deterministic part of utility
This property gives implications for possible impacts of the deterministic utility of certain
alternative on its chances to be chosen We could see that when an alternative has about
50 probability to be chosen which infers to the steepest part on the curve a small
change in the deterministic part of the utility function could lead to a large change in the
probability the alternative has to be chosen
Apart from the nice properties of logit probability logit models have some disadvantages
as well (Bartels Boztug amp Muumlller 1999)29 One shortcoming is the assumption of
29 Bartels K Boztug Y amp Muumlller M (1999) Testing the Multinomial Logit Model Working paper University Potsdam Germany
21
Gumbel distribution of error terms in the utility function The inherent requirement for
iid property sets restrictions for logit model to be widely used especially in route choice
modeling context Several models have been proposed to overcome this shortcoming in
particular modifications based on MNL to adjust it to route choice practices have been
proposed Another drawback is the assumption of the linear composition for the
deterministic part of utility function Actually this assumption is for ease of following
estimation process since McFadden (1974) demonstrated that under this condition the
probabilities will be universally concave with regard to the coefficientsβ 30 which
improves the performance of numerical estimation Yet there could be nonlinear
compositions in the deterministic part to relax the restriction Under this condition the
universal concavity cannot be guaranteed which may lead to local convergence in the
estimation process
312 Model Estimation
The most commonly used numerical estimation method for multinomial logit models is
the Maximum Likelihood Estimation (MLE) In principle given a set of data and the
underlying probability model the method tries to find coefficients of the probability
model with which produced data has a distribution most likely resembles the distribution
of the observed data
Consider the case that N decision makers with their choice data are obtained Parameters
to be estimated are the coefficients in the utility function denoted byβ We could then
use the MLE to try to get the values of β vector with which the probability that choice
maker choose their observed alternatives is maximized
The probability of choice maker n to choose his or her observed alternative can be
written as
( ) niyni
i
Pprod (5)
in which niy is a dummy with value 1 if choice maker choose alternative i and value 0
otherwise
30 McFadden D (1974) Conditional Logit Analysis of Qualitative Choice Behaviour (P Zarembka Ed) Frontiers in Econometrics 105-142
22
Choice makers choose their alternative independently from each other so the probability
of all sampled choice makers choose their observed alternative is
1
( ) ( ) ni
Ny
nin i
L Pβ=
= prodprod (6)
This is the likelihood function with regard to the parameters to be estimated β in this
case We can take the logarithm of it to get the log-likelihood function
1
( ) lnN
ni nin i
LL y Pβ=
=sumsum (7)
Since we aim at getting the value of β to make the log-likelihood function maximized
we can take the derivative of it with respect to β and set it to zero
( )
0dLL
d
ββ
= (8)
By solving this equation we could get the estimate of β
32 Dijkstrarsquos Algorithm
321 Introduction
A method is needed for generating feasible alternatives and compose the choice set as
well as for deriving simulated observations for each OD pair in the process of indirect
inference As for choice set generation we would like to include certain number of high
ranking shortest paths in the choice set since these paths tend to have more possibility to
be chosen Similar to this the simulated observation is generated as the shortest path
between each OD pair We implement a method for shortest path finding which is the
Dijkstrarsquos Algorithm
Dijkstrarsquos Algorithm is named after the Dutch computer scientist Edsger Dijkstra who
conceived this method in 1956 and got it published in 195931 This is a graph search
algorithm aiming at solving shortest path problem for a graph the edge cost of which is
defined nonnegative The outcome of it is a shortest path tree demonstrating the path with
lowest value with respect to the defined cost
31 Dijkstra E (1959) A note on two problems in connexion with graphs Numerische Mathematik 1 269-271
23
This algorithm deals with single-source problem To be specific given one source node in
the graph the algorithm will give paths with the lowest value with regard to cost from
this source node to every other node in the network Given certain criterion we could use
the algorithm to find shortest path between two specific nodes by setting one node as the
source and the other as the target
After released it is widely used in path searching problems especially in transportation
related practices Routing problem is considered in investigation on traffic assignment
and optimization in logistics Real sized road network could be perceived as a graph with
vertices and edges in which cities can be abstracted as the vertices in the graph and the
roads connecting cities can then be regarded as the edges With the aid of Dijkstrarsquos
Algorithm the shortest path with respect to cost could be found from certain city to the
other cities The outcome is valuable for logistics corporations to work out their region-
wide distribution plans32
322 Algorithm
We connect a ldquodistancerdquo value with all the vertices in the graph indicating its distance
from the source vertex To be accurate the ldquodistancerdquo could be actual length of edges or
the generalized cost on the edges or anything desired The source vertex is defined as the
initial node with a value of zero In the process Dijkstrarsquos Algorithm will assign values
to vertices detected in one loop and update the values in the following loops till a
minimum value is found for each vertex The steps for searching and updating are
presented below
1 Initialize the network and assign the distance values of vertices other than the initial
node as infinity
2 When one vertex is to be detected it is denoted as current node All the vertices that
have been detected and attained the minimum distance values will be marked as detected
and will not be detected in the following loops while the vertices remaining unvisited
will be marked undetected To initialize all the vertices are marked undetected and the
initial node is set as current node
32 Wang H (2011) Logistics Distribution Shortest Path Based on Dijkstra Algorithm Computer and Digital Engineering 3
24
3 For current node all its directly connected adjacent nodes are considered except for
the newly detected vertex Labeled distance values of the neighbor vertices will be
updated if the calculated values from current node are smaller than their current values
For example current node A has a distance value of 4 and one of its neighbors B has a
value of 8 The edge linking A and B has a distance of 2 The newly calculated distance
value for B will be 4+2=6 which is smaller than 8 So the labeled distance value for B
will be updated to 6 indicating that the minimum distance from the source vertex to B till
now is 6 and the path should pass A
4 When all the neighbors of the current node are considered and updated mark the
current node as detected And mark the undetected node with the lowest distance value as
the current node and do the detection in step 3 again
5 When all the vertices in the network are marked detected the algorithm is finished and
we get the minimum distance from the source to all the other vertices The shortest path
from the source to a specific vertex could be found out following the detecting process
As mentioned above the stop criterion could also be modified as we desired If we aim at
finding the shortest path between two vertices at the beginning one vertex should be set
as the initial node and the algorithm could be stopped once the other vertex is marked as
detected
323 Explanatory Example
Here is a simple network to illustrate the mechanism of Dijstrarsquos Algorithm There are
five vertices and six edges with distance values labeled beside We define A as the source
and set it the initial node
Figure 2 A simple network for Dijstrrarsquoa Algorithm explanation
25
Initialization
Initial node A
Detected null
Distance value A=0 B=C=D=E=+infin
Loop 1
Current node A
Adjacent vertices B C
Detected null
Distance value A=0 B=4 C=1 D=E=+infin
Loop 2
Current node C
Adjacent vertices B D
Detected A
Distance value A=0 C=1 B=min 4 C+2 =3 D=C+3=4 E=+infin
Loop 3
Current node B
Adjacent vertices E
Detected A C
Distance value A=0 C=1 B=3 D=4 E=B+3=6
Loop 4
Current node E
Adjacent vertices null
Detected A B C D
Distance value A=0 C=1 B=3 D=4 E=6
If we want to get the shortest path from A to E following the detecting process we could
know that it should be A-C-B-E
26
324 Discussion
Dijkstrarsquos Algorithm has a clear logical structure which makes it easy to understand as
well as to implement in programming Nonetheless this method cannot search directly
from one node towards the other to find the shortest path between the two It works more
like detecting all the adjacent nodes in terms of shortest paths and expands from the
source iteratively until the target node is included and that is when we could figure out
the shortest path between the two specific vertices This reveals the fact that the method
wastes a lot of time in the blind search leaving it inefficient In addition this method is
not able to deal with networks with negative edge values yet this is not a problem in our
research since link cost on our network is defined nonnegative
33 Indirect Inference
331 Introduction
For problems in route choice context choice set size may be way too large to enumerate
all the alternatives Yet estimation based on sampled choice set may introduce biases
which can be corrected in some special cases (see Frejinger Bierlaire amp Ben-Akiva
2009)33 While in cases where estimation models are not based on MNL say multinomial
probit model we could not find corrections for biases caused by sampled choice set
Estimator based on the principle of indirect inference is then introduced to overcome
inconsistency problem34
Indirect inference35 is a simulation-based method for estimating parameters in economic
models by making references to the parameters of interest (Smith 2008) It is motivated
when general statistical estimation method such as Maximum Likelihood is intractable or
as discussed above consistent estimation is required given that only sampled choice set is
available Since in economic analysis we tend to build models which guarantee scientific
logic and inclusion of necessary attributes quite often the models will end up
33 Frejinger E Bierlaire M amp Ben-Akiva M (2009) Sampling of Alternatives for Route Choice Modeling 34 Karlstroumlm A Sundberg M amp Wang Q (2011) Consistently estimating flexible route choice models using an MNL lense 35 Smith A (2008) Indirect Inference In S Durlauf amp L Blume (Eds) The New Palgrave Dictionary of Economics (Second ed) Palgrave Macmillan
27
complicated from statistical estimation point of view This in sequence spurs the wide use
of indirect inference in economic analysis
It is common character that simulation-based methods allows modelers to simulate data
from the economic model of interest given certain perceived values of the parameters to
be estimated Since to generate data is essential and simple the true challenge is how to
estimate coefficients Indirect inference uses an auxiliary model which gives a rich
description of the covariance patterns in the data by including certain variables from the
basic economic model On the other hand the auxiliary model does not need to reflect
accurately the data generating process since it is supposed to be estimated based on the
data derived not to generate data itself The basic function of the auxiliary model is that
it provides a criterion to compare observed data and simulated data from the basic
economics model
We do iterations with the aim of finding the parameters of the basic economic model so
the observed data and the simulated data from the basic model looks almost the same by
the criterion of auxiliary model To be specific the auxiliary model is estimated based on
both observed data and simulated data we choose parameters for the basic model to
make sure that the two estimator of auxiliary model are as close as possible Based on
this idea the auxiliary model should be easy to estimate
332 Definition of the method
We define an economic model with the form of
( ) 12t t ty G x t Tε β= = (9)
in which 1 Tt tx = is a sequence of observed exogenous variables 1 T
t ty = is a sequence of
observed endogenous variables and 1 Tt tε = is a sequence of unobserved random error
terms β is a k -dimensional coefficient vector of the exogenous variables (Smith
2008)36
This model generally describes a relation that ty is dependent ontx with some random
errors Given the distribution of the random errors we could get the probability density
36 Smith A (2008) Indirect Inference
28
function of ty conditional on tx We will not focus on this density and instead this model
is only used for simulating data in indirect inference
In terms of the auxiliary model it could be defined by a probability density function with
the form of
( | )t tf y x θ (10)
in which θ is a p -dimensional coefficient vector and p is supposed to be not smaller
than k since we should capture characteristics of all the parameters in the underlying
economic model In addition the auxiliary model needs not be defined to reproduce the
distribution of ty in the basic model yet it needs to have a convenient analytical format
Based on the observed data we could estimate the parameters in the auxiliary model
using Maximum Likelihood Method
ɵ
1
arg max log ( | )T
t tt
f y xθ
θ θ=
= sum (11)
The estimated coefficient vectorɵθ could be used as an indicator of certain features of the
observed data
On the other hand the auxiliary model can be estimated based on simulated data from the
basic model as well We need to draw a sequence of random error terms 1 m Tt tε = from the
defined distribution in which m denotes the number of simulation with an interval of [1
M ] generally Given a coefficient vectorβ we could generate the values of endogenous
variables ɶ 1 ( )m T
tty β = which are explicitly dependent onβ With the help of Maximum
Likelihood Method we could get
ɶ ɶ
1 1
( ) arg max log ( ( ) | )M T m
ttm t
f y xθ
θ β β θ= =
= sumsum (12)
According to the principle of indirect inference we try to find the values of β to make
ɶ( )θ β as close toɵθ as possible Practically we need a metric to measure the distance
between ɵθ andɶ( )θ β and by minimizing the distance we could find out the estimates of
β in the basic economic model
29
333 Choices of the metrics
As mentioned above we need a metric to measure the distance betweenɵθ andɶ( )θ β
There are three approaches corresponding to the three classical hypothesis tests namely
Wald likelihood ratio (LR) and Lagrange multiplier (LM)37
In the Wald approach we try to minimize a quadratic form in the difference between the
two estimators ofɵθ andɶ( )θ β which is
ɵ ɶ ɵ ɶarg min( ( )) ( ( ))Wald
Wβ
β θ θ β θ θ β= minus minus (13)
in which W is a positive definite ldquoweightingrdquo matrix
In the LR approach a metric is formed based on the likelihood function related to the
auxiliary model which is
ɵ ɶ
1 1
arg min( log ( | ) log ( | ( )))T TLR
t t t tt t
f y x f y xβ
β θ θ β= =
= minussum sum (14)
According to the definition ofɵθ the first part of the objective function before the minus
sign on the right-hand side is always larger than the second part after the minus sign And
the first part is not dependent onβ
To minimize the objective function is equivalent to maximizing the log-likelihood
function withɶ( )θ β that is
ɶ
1
arg max( log ( | ( )))TLR
t tt
f y xβ
β θ β=
= sum (15)
In the LM approach the metric is formed using the derivative of the log-likelihood
function related to the auxiliary model which is
arg min ( ) ( )LM
S VSβ
β β β= (16)
in which
ɶ ɵ
1 1
( ) log ( ( ) | )M T m
ttm t
S f y xβ β θθ= =
part=partsumsum
(17)
and V is a positive definite matrix
37 Smith A (2008) Indirect Inference
30
By using any of the approaches we aim at getting the minimized distance betweenɵθ and
ɶ( )θ β so the value will approach to zero as expected So the hypothesis test of the
minimized value could be used as an indicator of whether the auxiliary model is suitably
specified In other words the minimized value being significantly different from zero
indicates a bad specification of the auxiliary model
In comparison the LM approach has an advantage over the others in computation when
it is relatively time-consuming to estimate the auxiliary model
334 Consistency Interpretation
Suppose the observed sample size T grows large while total number of simulations stays
fixed as M the estimator based on simulated data ɶ( )θ β will converge to a pseudo-true
value denoted as( )h β which is also dependent onβ This is called binding function
which characterized the relationship between the coefficients in the basic model and the
auxiliary model At the same time the estimator based on observed data ɵθ will converge
to a pseudo-true value0θ In case that T grows to a large number the aim of indirect
inference changes to finding β that guarantees0 ( )hθ β= This could explain that indirect
inference gives consistent estimate of the parameters in the basic economic model
In this project the binding function is what we focus on to get the correct estimates
instead of finding certain metrics Detailed methods will be discussed in the following
part
34 Model Specification in the Thesis
341 Basic Route Choice Model
Based on all the methods mentioned in previous sections the specification of models and
methods we use in the thesis will be explained in this section Since we are to estimate
the model based on true observations no model is known beforehand to adjust to the data
we use Several formulations of the model have been tested in the thesis The one
explained here could be seen as an example and all the other trials contain modifications
based on this model The other specifications of model will be explained along with the
results in the result section
31
We start by describing the underlying route choice model of interest38 We need to define
a road network as a representation of a real-size one from which we collected the trip
data The network denoted asN consists of a set of nodes (vertices) v and links (edges)
l Each link has a source node ( )s l and a target node or a destination node( )d l which
together indicate the direction of the link A path from an origin node ov to a destination
node dv could be seen as a sequence of links1 nl lhellip of which 1( ) os l v= 1( ) ( )i id l s l +=
and ( ) dnd l v= So a path can be defined by the index of links which is 1 nl lπ = hellip
A vector of characteristics denoted aslx is associated to each link as well as a strictly
positive cost function( )l lic x ε β in which liε is an individual specific random link cost
with i denoting the individual and β is a vector of coefficients of the link characteristics
left to be estimated In the Indirect Inference context we need an auxiliary model with
easily-estimated analytical form yet there is no such requirement for the basic model
Although not necessary we assume that the cost function has a linear deterministic form
the deterministic part and the random part are additively separable So we have the cost
function as
( ) Tl li l lic x xε β β ε= + (18)
In addition one important assumption is that the link cost is additive which means that
the cost of a path can be attained by the sum of all the link costs along the path This way
we have the cost of a path π as
( ) ( )l lil
C c xπ
π ε βisin
=sum (19)
We focus on the path-based model which means that the individuals choose among all
possible paths As defined above this turns out to be a random utility choice model As
indicated by the standard assumptions of this kind of models choice makers are assumed
to know both the link characteristics and their idiosyncratic random utility liε associated
to each link Since the choice makers maximize their utility this means that they will
choose the path with the lowest generalized cost in this model This way we have the
choice of individual i as
38 Karlstroumlm A Sundberg M amp Wang Q (2011) Consistently estimating flexible route choice models using an MNL lense
32
( )
arg min ( )o di i
iv v
Cπ
π πisinΩ
= (20)
in which oiv denotes the origin point of the trip for individual i and d
iv denotes the
destination ( )o di iv vΩ denotes all possible paths connecting the origin and destination in
the network for individual i which forms the choice set for the individual
When implementing the model we assume that the random utility component liε follows
a truncated normal distribution To be specific liε follows a standard normal distribution
yet with only the positive values retrieved This way we could guarantee that the link
costs are always positive so that additively the path would not have infinite loops With
this feature of the random component we could say that our model is probit-like Based
on this assumption the prerequisite of Dijkstrarsquos Algorithm is satisfied which always
needs positive edge values on the network We can use the Dijkstrarsquos Algorithm to find
the shortest paths iπ as an intermediate step in the implementation Apart from this we
assume that the unobserved cost captured by the random term is proportional to the
length of link To embody this in the cost function we add a fixed scale parameter to the
random term with a form of ( )Length l Lengthx Mean x in which ( )LengthMean x is the average
length of links in the network
We will assume that the data consists of J paths as dependent variables which means
that the dependent variables for the choice model are 1 Ji iy π == In addition the observed
characteristics of links in the network are provided 1 Ll lx x == To be specific we choose
to use two attributes of the links namely the length of the links Lengthx and the dummy
variable indicating the presence of speed bumps on the links SBx The cost function then
is specified as
( ) ( )l li Length Length l SB SB l li Length l Lengthc x x x x Mean xε β β ε= + + sdot (21)
Now the objective is to estimate the parametersβ in the model for which we will make
use of an auxiliary model
33
342 Auxiliary Model
Based on the idea of Indirect Inference we treat the route choice model defined above as
the basic model of interest which might have complex formation and be difficult to
estimate directly Then we need an auxiliary model to form a criterion which takes into
certain aspects of data to focus the analysis The auxiliary model needs not to reflect the
data generating process exactly as in the basic model yet it needs to include attributes of
interest in order for reference and to be easy to estimate We choose to use a logit model
for route choice as the auxiliary model since the logit model has always been a useful
tool for discrete choice analysis thanks to its analytical form and there is software for
estimating logit models which ensures that we can estimate very efficiently
As to the auxiliary model it is chosen to be a logit model for route choice We consider
that each individual i is choosing from a set of alternative routesr Each route r is given
a utility of riU
- Tri r ri r riU V Xε θ ε= + = + (22)
in which θ is the vector of auxiliary parameters which gives inference to the parameters
in the basic model One thing to be mentioned is that as expected the coefficients in the
utility function should have negative signs To make it easier for comparison with the
coefficients in the basic route choice model we assume the sign of θ to be positive per
se and add a negative sign ahead of it to guarantee that the coefficient part is negative as a
whole rX denotes route characteristics and riε is the random utility for each individual
which is assumed to follow an iid (independently identically distributed) Gumbel
distribution following the standard assumption of logit models
Note that as required for the auxiliary model it should be flexible enough to capture the
variability in the data and thus contains no fewer attributes than the basic model39 In
order to infer the parameters in the basic model and in consideration of efficiency we
pick the same attributes of interest in the basic models which are the link length Lengthx
and the speed bump dummy variableSBx So the utility function turns out to be
- -ri Length Length r SB SB r riU x xθ θ ε= + (23)
39 Karlstroumlm A Sundberg M amp Wang Q (2011) Consistently estimating flexible route choice models using an MNL lense
34
The probability of individual i choosing path r given an individual specific choice set
( )iI o d is
( )
ri
si
i
V
ri V
s I o d
eP
eisin
=sum
(24)
Theoretically we allow the individuals to choose from all possible paths between the
origin and destination in the network which intuitively could be infinite and impossible
to enumerate When implementing the model we generate the individual choice set based
on the basic route choice model Through simulation of the basic model we generate
infinite unique shortest paths for all the unique OD pairs by redrawing the random link
cost liε Without loss of generality the number of paths generated would be big enough
with fully consideration of efficiency We name the finite choice set composed by the
shortest paths generated as the pseudo-universal choice set ( )I o d which is a sample of
the infinite universal choice set The individual specific choice sets are generated by
randomly drawing certain number of paths out of the pseudo-universal choice set And
the size of individual specific choice set could be equal to or smaller than that of the
pseudo-universal one
The resulting individual specific choice set ( )iI o d describes a finite subset of all possible
paths connecting the origin oand destinationd for individuali When implementing the
methods the way of generating the choice set ( )iI o d for each individual i is viewed as
part of the auxiliary model
After the auxiliary model is built it could be estimated using a Maximum Likelihood
estimator based on the observed data of individual choices y and attributes variablesx
for individual 1 i N= hellip The estimate of parameters in the auxiliary model is
ɵ arg max ( )L y xθ
θ θ= (25)
in which ( )L y x θ is the log-likelihood function for the auxiliary model
Given the data of the link attributes xand some random draws of structural parameters
mβ 1 m M= hellip we can simulate choice data through the basic route choice model With
M draws of β from some given density we could simulate M sets of data resulting in
35
simulated choicesɶ( )my β Same as before parameters θ in the auxiliary model can be
estimated based on the simulated data as
ɶ ɶ( ) arg max ( ( ) )m m mL y xθ
θ β β θ= (26)
As the process indicated the simulated choice data depends on the structural parameterβ
in the basic route choice model and in sequence the estimates of parameters θ in the
auxiliary model depends on β when estimated based on the simulated data Based on
this theoretically we have a relationship of ( )θ β referred to as the binding function in
indirect inference literatures which we will discuss in detail for implementation of model
in this thesis A metric is then chosen to measure the distance between the observed and
simulated data viewed by the auxiliary model as a way to indirectly infer the values of
parameters β in the basic model To be specific for each draw of the structural parameter
mβ we can get the estimates of ɶ ( )m mθ β based on the simulated data and the distance
between ɶ ( )m mθ β and ɵθ measured by the chosen metric By doing more iteration with the
aim of minimizing the distance we will get the value of mβ which spurs the ɶ ( )m mθ β
closest toɵθ and this mβ is the inferred estimates of the parameter in the basic model
343 Consistency Discussion
The process of indirectly estimating parameters in the basic model is described above yet
we need to know whether the method we provide gives consistent estimation Here are
some discussions explaining the consistency in estimating by which consistency of the
estimator we proposed is illustrated
As proved the multinomial logit model (MNL) can be estimated consistently based on a
subset of alternatives (McFadden 1978)40 We may need to use the classical conditional
maximum likelihood estimator to deal with the problem at the same time the probability
that an individual n chooses an alternative i conditional on the subset of alternatives
denoted asnc becomes the conditional probability
40 McFadden D (1978) Modeling the Choice of Residential Location In A Karlqvist L Lundqvist F Snickars amp J Weibull (Ed) Spatial Interaction Theory and Residential Location (pp 75-96) Amsterdam North-Holland
36
ln ( | )
ln ( | )( | )in n
jn n
n
V q c i
n V q c j
j c
eP i c
e
micro
micro
+
+
isin
=sum
(27)
in which micro is a scale parameter and inV is the deterministic part of the utility There is a
term ln ( | )nq c j for correcting the sampling bias in which ( | )nq c j denotes the probability
of sampling nc given that alternative j is chosen
If all the alternatives in the choice set have the same probability to be chosen into the
subset the estimation on the subset of alternatives is equivalent to that on the full choice
set To be specific in this case ( | )nq c i is equal to ( | )n nq c j j cforall isin so by calculation the
term for sampling bias correction will cancel out in the probability function
In route choice context the alternative paths between an origin and a destination may be
in large amount and it is inefficient to give some very long-distance paths the same
probability as those short and attractive ones This means that we may need the
importance sampling method when generating subsets of alternatives which selects
attractive alternatives with higher probability than unattractive ones And the correction
term does not cancel out in this case Note that if alternative specific constants are
estimated we can get unbiased estimates of all the parameters except the constants even
if the correction term is not included in the utility function (Manski amp Lerman 1977)41
Back to the route choice context we tend to use large number of alternatives even with
subset of the full choice set which means that it is generally impossible to estimate the
constants and thus the correction term is essential To solve this problem Frejinger et al
(2009) developed a sampling approach in the context of route choice42
The discussion above focuses on the usage of MNL for route choice modeling When it
comes to our method the individual specific choice set is generated by randomly drawing
alternatives from the pseudo-universal choice set with the same probability yet there is
bias when generating the pseudo-universal ones since the pseudo-universal choice set is
composed of certain number of shortest paths between two nodes and this generating
process gives some paths higher probability to be included into the choice set So we
41 Manski C amp Lerman S (1977) The Estimation of Choice Probabilities from Choice Based Samples Econometrica 45 (8) 1977-1988 42 Frejinger E Bierlaire M amp Ben-Akiva M (2009) Sampling of Alternatives for Route Choice Modeling
37
actually use importance sampling to get the choice set which may consequently
introduce bias in estimating the parameterθ in the auxiliary model as discussed above
With the idea of indirect inference we consider only the relationship between θ andβ
denoted as( )θ β and use this relation to infer the value ofβ From this point of view
whether θ is estimated with bias or not does not matter since the relation between it and
β could always be captured which is the specific thing we focus on using the method of
indirect inference So we can say that even with biased subset of alternatives we could
still get consistent estimation by using indirect inference
344 Binding Function
As discussed in indirect inference method section when the sample size N increases
which means that we have more observations of choice the estimated parameter in the
auxiliary modelɶ ( )m mθ β will converge to a stable value ( )mθ β which is often referred
to as the binding function
Given that route choice model deals with discrete choices and by using indirect inference
we have a discrete choice model as the auxiliary model as well the estimates of binding
function ( )mθ β will inherit the discontinuous feature due to discrete individual choices
ɶ( )my β Keane and Smith (2003) proposed a solution of using logit-smoothing on the
simulated dependent choice data43 Following this idea we assume a continuous binding
functionɶ( )θ β for simplicity which could be approximated by a linear function locally
within small intervals With the M randomly drawn values of mβ and the corresponding
estimated parameters ɶ ( )m mθ β in the auxiliary model we could perform an Ordinary
Least Square (OLS) regression to estimate the local approximation of binding function
ɶ( ) c Dθ β β= + (28)
in which cdenotes the constant vector and D denotes the OLS parameter matrix44 To be
specific in our case each parameter in the auxiliary model will have a restriction
function with regard to both parameters in the basic model which is
43 Keane M amp Smith A (2003) Generalized Indirect Inference for Discrete Choice Models 44 Karlstroumlm A Sundberg M amp Wang Q (2011) Consistently estimating flexible route choice models using an MNL lense
38
ɶ1 11 12( )Length Length SBc d dθ β β β= + +
(29)
ɶ2 21 22( )SB Length SBc d dθ β β β= + +
(30)
Based on the observed data of choices y and explanatory variables xand the estimated
binding function which indicates the restrictions between ɶθ andβ we could use the
maximum likelihood method to give estimation of the parameters of interest The
likelihood ratio approach to indirect inference is following ideas of Smith (1993)45 and
Keane and Smith (2003)46
ɶ=arg max ( ( ))L y xβ
β θ β (31)
in which β is the estimate of the parameter of interest β in the basic economic model
With the restriction of binding function this is actually an indirectly inferred estimate In
line with the estimating process in auxiliary model ( )L sdot is the likelihood function of the
auxiliary model
Note that the form of binding function is based on an assumption in the result part we
will verify that this assumption is realistic
45 Smith A (1993) Estimating Nonlinear Time-series Models Using Simulated Vector Autoregressions 46 Keane M amp Smith A (2003) Generalized Indirect Inference for Discrete Choice Models
39
4 Data
41 Road Network
The data we use for estimation is based on a GPS data set collected in the Swedish city of
Borlaumlnge Borlaumlnge is located in the middle part of Sweden and has a population of about
47 000 inhabitants
The virtual road network contains 3077 nodes and 7459 unidirectional links (Frejinger amp
Bierlaire 2007)47 of which 3061 nodes and 7288 links are included in the network for
estimation Figure 3 gives a visual illustration of the road network in Borlaumlnge
Figure 3 Illustration of the Borlaumlnge road network
With regard to our research two of the link attributes are included namely link length
and speed bump dummy Link length is in the unit of km and speed bump dummy is an
indication of speed bump existence on the links which has the value 1 when there is a
speed bump on the link and 0 otherwise
Link length
47 Frejinger E amp Bierlaire M (2007) Capturing Correlation with Subnetworks in Route Choice Models
40
Some descriptive statistics of the link length data for the whole network is presented in
Table 1 below
Table 1 Descriptive statistics of link length
Number of links 7288
Minimum 0001
Maximum 7599
Mean 0184487
Median 0102
Variance 0103722
Lexis ratio (varmean) 1016884
Skewness 9871144
To describe the overall character of the link length attribute the histogram is shown in
Figure 4 below
Figure 4 Histogram of link length data
We could see that the link length data is quite clustered most of which lies within the
range of 01km and 06km Nonetheless there are some extreme values far away from the
range indicating extremely long links To display the variation in the relatively clustered
area we draw a histogram zoomed in the interval of (0 1km] shown Figure 5 in below
0
01
02
03
04
05
06
Fre
qu
en
cy
Link length (km)
Histogram
41
Figure 5 Histogram of link length data (zoomed within 1km)
Over 80 of all the links have length shorter than 03 km indicating concentration of
link length data
Speed bump dummy
Speed bump dummy is based on true situation in the network Of all the links 82 links
are equipped with speed bumps which account for a percentage of 113 The following
Figure 6 displays the locations of links with speed bumps
Figure 6 Illustration of links with speed bumps
0005
01015
02025
03035
04045
05
Fre
qu
en
cy
Link length (km)
Histogram(zoom in)
42
42 Observation Data
The GPS data set is collected as a part of the Swedish Intelligent Speed Adaptation (ISA)
study which aims at traffic safety effects of in-car information systems In the study 186
vehicles were equipped with GPS devices and traced within a radius of 25 km from the
center of Borlaumlnge The monitoring lasted for 30 days from 22th June 2000 to 4th March
2002 obtaining 49 667 vehicle days of travel and nearly a quarter of a million trips (for
more information on the GPS data set check Axhausen Schoumlnfelder Wolf Oliveira amp
Samaga 2003 Schoumlnfelder amp Samaga 2003 Schoumlnfelder Axhausen Antille amp Bierlaire
2002)48
The data collection is not originally designed for route choice analysis so the raw data
cannot be used in our research directly Extensive data processing is performed by the
company GeoStats in Atlanta to retrieve new data set available for route choice analysis
which contains 24 vehicles and 16 035 observations The final data set we use is provided
by Emma Frejinger which contains in total 1832 observations corresponding to 1458
observed unique routes made by 24 vehicles and 1409 unique origin-destination pairs
Considering that certain route may have been observed more than once we make a
distinction between observations and unique routes and number of unique routes should
be less than that of observations consistently with the numbers listed above
As indicated by data collection in the ISA study only licensed drivers with access to his
or her only car are recruited to minimize sharing or swapping of cars Minimum socio-
economic data of the drivers is included in data collection so we have no way to
understand driver characteristics from the data set Logically we make an assumption
that there is only one individual per vehicle
In the observation data a route is represented by a series of links and also an origin-
destination pair With relatively intensively distributed link length number of links could
48 Axhausen K Schoumlnfelder S Wolf J Oliveira M amp Samaga U (2003) 80 Weeks of GPS Traces Approaches to Enriching the Trip Information Transportation Research Record 1870 46-54 Schoumlnfelder S amp Samaga U (2003) Where Do You Want to Go Today-More Observations on Daily Mobility Third Swiss Transport Research Conference Ascona Schoumlnfelder S Axhausen K Antille N amp Bierlaire M (2002) Exploring the Potentials of Automatically Collected GPS Data for Travel Behaviour Analysis- A Swedish Data Source In J Moumlltgen amp A Wytzisk (Ed) GI-Technologien fuumlr Verkehr und Logistik number 13 Institut fuumlr Geoinformatik Universitaumlt Muumlnster (pp 155-179) Munster IfGIprints
43
be used to indicate total length of routes Some of the descriptive statistics of link number
is shown in Table 2 below
Table 2 Descriptive statistics of link numbers in observation data set
Number of observations 1832
Minimum 5
Maximum 106
Mean 202877
Median 16
Variance 1871968
Lexis ratio (varmean) 9227126
Skewness 1732597
For further overall inspection of link number distribution in the observation data set the
histogram is shown in Figure 7 below
Figure 7 Histogram of link numbers in observations data set
Seen from the histogram distribution of number of links is relatively dispersed with a
large range interval Judging by the statistics in general the routes observed have about
000
200
400
600
800
1000
1200
1400
1600
5 8
11
14
17
20
23
26
29
32
35
38
41
44
47
50
53
56
59
62
65
68
71
74
77
80
83
86
89
92
95
98
10
1
10
4
10
7
Mo
re
Fre
qu
en
cy
Number of links
Histogram
44
20 links in average Yet the data has a big variance which is reasonable As stated above
there are 1409 unique OD pairs for 1832 observations indicating that for most OD pairs
there is only one observation Spread within the detecting area different OD pairs could
have various numbers of links in between
Following our experiment design only a portion of the data could be used To be specific
routes with number of links fewer than ten would be eliminated when used for estimation
43 Further Exploration of data
Apart from the characters discussed above there are some other attributes in the data set
interesting to be explored Both in link attribute data set and observation data set there is
travel time data which to some extent is parallel with length in indicating distance
between two nodes
In the link attribute data set one attribute is denotes the estimated travel time of links in
unit of hour Some of the descriptive statistics is shown in Table 3 below switching unit
to minute
Table 3 Descriptive statistics of estimated travel time on links
Number of links 7288
Minimum 000186
Maximum 578268
Mean 0281696
Median 018744
Variance 0119337
Lexis ratio (varmean) 0423638
Skewness 5785361
Seen from Table 3 estimated travel time seems to have a more clustered distribution than
link length judging by lexis ratio and skewness Yet this time is roughly estimated not so
qualified as link length to use in estimation since the latter is much easier to measure and
guarantee precision
In the observation data set we have the duration time of the observations in the unit of
minute Some of the descriptive statistics is shown in Table 4 below
45
Table 4 Descriptive statistics of duration of trips
Number of observations 1832
Minimum 007
Maximum 316
Mean 4991195
Median 3925
Variance 1775639
Lexis ratio (varmean) 3557542
Skewness 2174728
Duration of trips can be used as an indication of distance between origin and destination
yet it is roughly measured and strongly affected by traffic condition on the road network
With similar reasons as discussed on estimated travel time on link we use number of
links instead of duration of trips to indicate the distance between OD pairs
46
5 Experiment Design
When doing the simulation-based estimation it is physically divided into two parts for
convenience of operation As discussed in the method section we choose to use a pseudo-
universal choice set which is generated and stored in the first part and ready for use in
the following experiment Then in the second part we do the simulation-based
experiment to carry out indirect inference method for estimating the parameters of
interest in the basic model β to be specific The Figure 8 below illustrates an abstracted
flow of how the estimation is carried out given certain origin-destination pair
Figure 8 Illustration of the flow in the experiment
As shown in the flow chart we get all the unique OD pairs in the trip data For each of
the OD pairs the Dijkstrarsquos algorithm is used to find the shortest paths between them
without duplicates We set the intended number of paths to be 400 as well as time
terminator in case not enough paths could be generated within certain bearable time
47
interval The generated paths form the pseudo-universal choice set of each OD pair
which is stored for future use Note that we abandon some OD pairs with too few paths
in the pseudo-universal choice set Observations containing the kept OD pairs are used
for following estimation which turns out to be 940 of them
For the OD pair in a given observation 200 alternatives are randomly drawn from the
pseudo-universal choice set and the sequential links in the observation itself is read as an
alternative path The 201 paths compose the observed choice set On the other hand a
given value of mβ is drawn from a predefined domainD The shortest path is generated
based on the given mβ as the simulated observation Like in the observed choice set part
200 alternatives are randomly drawn from the pseudo-universal choice set to form the
simulated choice set together with the simulated observation The auxiliary model is
estimated based on the simulated choice set and we could get a set of ɶ( ( ))mm mβ θ β pairs
which will be used to estimate the binding function Based on the binding function and
the observed choice set the parameters in the basic model could be indirectly estimated
The process described above is abstracted with no illustration of iterations Since this is
an experiment based on simulations certain loops of iteration should be carried out to get
statistics of the results
Given observed trip data at first we have no idea of the value of β In the process of
retrieving value ofβ the estimation process is repeated for several stages denoted asS
starting from a rough guess of the domainsD while for each following stage the domain
shrinks Since we tend to use a local OLS regression to approximate the smooth binding
function the draws of smβ need to be around the true value to prevent misspecification of
OLS regression due to the possibly inherent nonlinearity of the binding function The
estimated 0
β is not satisfactory in precision in the first stage yet it could give a hint of
where the true value lies The domain1D is centered on 0
β with smaller interval before
the estimation in the second stage This way +1sD is dependent on sD with smaller
interval As it goes on we will get a more accurate domain and as a result a well specified
OLS regression to approximate the binding function
48
The process of experiment with iterations is described below Suppose that we have the
experiment carried out for K times and the number of observations used isN
for run 1 k K= hellip for true observation 1 i N= hellip
Randomly draw alternatives from the pseudo-universal choice set end Form the observed choice sety for stage 1 s S= hellip
for 1 m M= hellip
Draw ksmβ from the domain ksD
Simulate paths for OD pairs in the used observations with mβ
for simulated observation 1 i N= hellip Randomly draw alternatives from the pseudo-universal choice set end
Form a simulated route choice setɶ( )ksmy β
Estimate ɶ ( )ks ksm mθ β in Equation (26)
end
Estimate ɶ ( )ks
θ β in Equation (28)
Estimate ks
β in Equation (31) end
Center the domain 1k sD + on ks
β and shrink the interval end
As a trial we first do the experiment on a route choice model with one parameter link
length to be specific For simplicity the random term is not scaled as described in the
model specification section which means we attach a truncated normally distributed
random term to the cost function without scaling it with link length After getting the
estimation of Lengthβ we move on to estimating the route choice model with both
parameters as described in the model specification Results under these two formulations
of models are presented separately in the result part
49
6 Results
61 Validation of Binding Function
As discussed in the binding function section we assume the binding function to be
continuous and feasible to be approximated by a linear function locally The assumption
of binding function can be verified based on the ɶ( ( ))mm mβ θ β pairs we attained as
intermediate results To explain this more explicitly we carry out a simple example with
only one parameter in the route choice model Lengthβ to be specific
The cost function is specified as
( )l li Length Length l lic x xε β ε= + (32)
corresponding to which the auxiliary model is
-ri Length Length r riU xθ ε= + (33)
For each run 10 values ofLengthβ are evenly drawn from a given domain By simulating
observations and estimating the auxiliary model 10 corresponding Lengthθ are generated to
form ten ɶ( ( ))mm mβ θ β pairs As assumed the binding functionɶ( )θ β is continuous which
could be approximated by a linear function locally To display the trend of binding
function we choose a relatively large domain for Lengthβ in the beginning [010]D = and
carry out 10 runs which generate 100 points in the beta-theta diagram shown in Figure 9
below
Figure 9 Scatter plots of the 90 beta-theta pairs
y = 12804x + 16264
Rsup2 = 09959
0
2
4
6
8
10
12
14
16
0 2 4 6 8 10
the
ta_
len
gth
beta_length
50
We do OLS regression for the dots and estimate the binding function Intuitively the
smaller the domain is the more accurate is the approximation of the binding function We
shrink the input domain based on the final estimate of Lengthβ from last trial
As it turned out to be we choose an input domain of [1214]D = for Lengthβ and the
binding function is assumed to take the form of
ɶ1 11( )Length Lengthc dθ β β= +
(34)
The result for one run is displayed in Figure 10 below
Figure 10 OLS regression based on the 10 beta-theta points from one run
The estimated binding function based on the 10 points is
ɶ ( ) 17371+10838Length Lengthθ β β= (35)
as indicated by 2 09783R = the function describes the trend of points very well Since
the interval is quite small we could use the estimated function to approximate the
binding function
When it comes to more parameters in the route choice model what we do is simply to
add more elements in the binding function After getting a vector of β and the
corresponding vector ofɶ( )θ β binding functions of each element in vector ɶ( )θ β with
y = 17371x + 10838
Rsup2 = 09783
315
32
325
33
335
34
345
35
355
12 125 13 135 14
the
ta_
len
gth
beta_length
51
regard to all the elements in vector β are estimated One example is shown in the
Equation (29) and Equation (30)
62 Estimation of model with one attribute
The route choice model with one attribute we used is the one described in Section 61
above After several trials by shrinking input interval every time we finally affirm that
the true value Lengthβ of lies in a relatively small interval of [12 14] Based on this
domain 50K = runs are carried out to get statistics of the estimate of Lengthβ As
discussed in the experimental design several stages Smean different trials before final
affirmation of input interval yet for the statistics only one stage is carried out for each
run Within each run 10M = values of input Lengthβ are drawn for estimating binding
function
The estimation statistics of Lengthβ is shown in Table 5 below
Table 5 Statistics of estimation of beta_length
Parameter Lengthβ
Mean 1337353
Standard deviation 0107537
RMSE 0013227
In the table RMSE is the root-mean-square error which is used to measure the distances
between the observed values being estimated and the predicted values by the estimator
The individual differences are called residuals and RMSE is an aggregated measure of
the residuals To be specific
ɵ ɵ ɵ 2( ) ( ) (( ) )RMSE MSE Eθ θ θ θ= = minus (36)
in which ɵθ is the estimator and θ is the parameter to be estimated so the RMSE is the
square root of the mean square error As defined the smaller the value of RMSE is the
better the estimator is
52
Here the RMSE is calculated based on the ten points ɶ( ( ))mm mβ θ β for estimating binding
function so basically it describes the goodness of fit of the estimated binding function
with regard to the points we generated The Equation (36) is specified as
ɶ 2( ( )) (( ( ) ( )) )mm m mRMSE Meanθ β θ β θ β= minus (37)
The value of RMSE displayed in the Table 5 is the mean value of all the RMSE values
for 50 runs Seen from this we have well-estimated binding function for all the 50 runs
on average In terms of the estimates of binding function taking the one in Section 61 as
an example the binding function estimated in the interval of [12 14] in Equation (35)
has a positive constant and a positive coefficient for Lengthβ which indicates that with
larger value of Lengthβ we will get larger value ofɶ Lengthθ and as a result a negative
coefficient for length in the utility function of the logit model This is reasonable for
bigger Lengthβ reveals larger incremental effect on the cost of certain path while lower
ɶ- Lengthθ reveals larger disutility effect on certain path these two effects are in fact
equivalent
By the way the high fitness of binding function is probably due to the relatively small
input interval of Lengthβ after certain trials and shrinkage As the final estimate indicates
Lengthβ falls right into the interval of [12 14] with small standard deviation So we can
say that the estimate is quite good
63 Estimation of model with two attributes
We use the model described in the model specification section to carry out the estimation
Two attributes are used namely length and speed bump dummy Similar to the one
attribute case we carried out several trials and shrinkage to finally determine the
relatively small input intervals forLengthβ and SBβ [05 1] and [0 05] respectively
50K = runs are carried out to get statistics of the estimates of the two parameters Within
each run 10M = values are drawn for inputs Lengthβ and SBβ respectively for estimating
binding function
53
One important thing to mention here is that the inputs are drawn evenly from the domain
yet to guarantee that the values of Lengthβ and SBβ are independent from each other or to
get rid of collinearity49 the domains of two parameters are defined in two dimensions To
explain this more explicitly we choose data of one run as an example The input points of
( Lengthβ SBβ ) are shown in Figure 11 below
Figure 11 Scatter plot of the input values for beta_length and beta_sb
We can see from Figure 11 that the points spread evenly in the domain quadrant Based
on these draws we could estimate the binding function and evaluate the relationship
between parameters in the logit model and Lengthβ and SBβ without worrying about
possible correlation between Lengthβ and SBβ
As discussed before in the binding function we are supposed to find the relationship
between each of the parameters in the logit model and both parameters in the route choice
model Mathematically this binding function should be a surface in the 3D coordinate
system We take the results of one run as an example and thus we have ten sets of Lengthβ
and SBβ along with corresponding ɶ Lengthθ andɶ SBθ
49 A set of points is collinear if they lie on a single straight line or a projective line (for example projective line over any field) and this way the two factors represented by the points are correlated
0
005
01
015
02
025
03
035
04
045
05
05 06 07 08 09 1
be
ta_
sb
beta_length
54
For the first binding function ɶ Lengthθ and ( Lengthβ SBβ ) are plotted in Figure 12 below
And the binding function takes a form as described in Equation (29)
Figure 12 Scatter plot of theta_length with regard to beta_length and beta_sb
By multi-linear regression we can get a surface to approximate the binding function
locally The estimated binding function is displayed in Figure 13 below
Figure 13 Display of the estimated binding function for theta_length
And the first binding function has a formula of
55
ɶ 18234+16933 +00633Length Length SBθ β β= (38)
For the second binding function ɶSBθ and ( Lengthβ SBβ ) are plotted in Figure 14 below
And the binding function takes a form as described in Equation (30)
Figure 14 Scatter plot of theta_sb with regard to beta_length and beta_sb
By multi-linear regression we can get a surface to approximate the binding function
locally The estimated binding function is displayed in Figure 15 below
Figure 15 Display of the estimated binding function for theta_sb
56
And the second binding function has a formula of
ɶ -06698+00371 +17619SB Length SBθ β β= (39)
The t-test of estimated parameters in the binding function is carried out with null
hypothesis of zero Estimates that are significantly different from zero with 95
confidence interval are marked as bold
Table 6 Estimated coefficients of binding function for model with two attributes
Constant Lengthβ SBβ
ɶLengthθ 18234
(43632) 16933
(33481) 00633 (1392)
ɶSBθ -06698
(-7991) 00371 (0366)
17619 (19323)
Seen from the magnitude of coefficients in the binding functions both Lengthβ and SBβ
have positive effect on ɶ Lengthθ andɶ SBθ and in sequence negative effect on the coefficients
in the logit model In addition coefficients of SBβ with regard to ɶ Lengthθ and Lengthβ with
regard to ɶ SBθ are not significantly different from zero so we can say Lengthβ has a more
apparent effect on ɶ Lengthθ than SBβ does while SBβ has a more apparent effect on ɶ SBθ
than Lengthβ does
Based on the estimated binding functions and the true observation data we could get the
estimates of Lengthβ and SBβ as shown in Table 7 below
Table 7 Statistics of estimation of beta_length and beta_sb
Parameter Lengthβ
SBβ
Mean 0761383 0079874
Standard deviation 0068493 0034375
RMSE 0022772 0085113
Seen from the RMSE results the relatively small values indicate that we have well-
estimated binding functions for all the 50 runs on average With regard to the estimates of
parameters in the route choice model both of them fall into the input domain we choose
57
and the standard deviation is quite small So we can say that the estimates are actually
very good
One thing to notice here is that the final estimate of Lengthβ falls approximately in the
middle of the input domain [05 1] while the estimate of SBβ falls closer to the left limit
which might need further shrinkage of input domain and more precise estimate of the
binding function To get rid of this we use the binding function estimate from all the 500
points to give a hint on the reasonability of acceptance of the estimate of SBβ The scatter
plots of theta_sb against beta_sb and beta_length are shown in Figure 16 below
Figure 16 Scatter plots of theta_sb against beta_sb and beta_length
The scatter plots in Figure 16 above are the decompositions of the binding function from
three dimensions to two dimensions Seen from the linear regression in the two plots ɶSBθ
is almost strictly positive proportional to SBβ and hardly effected byLengthβ This means
y = 19132x - 06404
Rsup2 = 0936
-1
-08
-06
-04
-02
0
02
04
06
0 01 02 03 04 05
the
ta_
sb
beta_sb
y = 00123x - 01717
Rsup2 = 4E-05
-1
-08
-06
-04
-02
0
02
04
06
05 06 07 08 09 1
the
ta_
sb
beta_length
58
that by shrinking the input domain ofSBβ we would probably get the same estimate of
binding function since it changes little in current domain And this leads to our
acceptance of the final estimate of SBβ
Given that we have a random cost following a truncated standard normal distribution and
the magnitudes of the estimated parameters are relatively small this would mean that the
randomness of the cost function are relatively large which in sequence leads to relatively
large randomness in individualrsquos choice of route
Another thing to be mentioned is that the magnitude of Lengthβ is smaller than that when
estimated singly Though these two values are not logically comparable with different
formation of random term in the cost function we could still get a hint from the
comparison This difference is probably due to the form of random cost we used which is
( )li Length l Lengthx E xε sdot and the effect of length on the cost is partially captured by this
random term
64 Estimations of other trial formulations of the model
641 Model with exponential form of cost function
During the process of estimation we carried out a lot of other trials in the formulations of
the basic route choice model the cost function to be specific and the auxiliary logit model
As it turned out the there are negative estimates of coefficients in the cost function
which conflicts our anticipation To capture this kind of negative estimation we choose to
use the exponential form of the cost function Without loss of generality the random term
is not scaled by the length of links The cost function is specified as
( ) Length Length l SB SB l lix x
i lic x eβ β εε + += (40)
Two attributes are used namely length and speed bump dummy variable Unlike the form
in Section 63 we allow the parameters Lengthβ and SBβ to have negative input and the
random term liε now follow a standard normal distribution without truncation Since we
take the exponential form of the cost function the cost of links could be kept positive
thus allowing the use of Dijkstrarsquos Algorithm to operate
59
In terms of the auxiliary model since we could have more attributes in the auxiliary
model than the underlying model Instead of using the same attributes as in the cost
function we choose to add an attributes which is number of links in the pathLNx So the
utility function of the logit model is specified as
- - -ri Length Length r SB SB r LN LN r riU x x xθ θ θ ε= + (41)
We still expect the value of θ to be positive and the coefficient of variables with the form
of -θ would be negative
Several trials and shrinkage were carried out for this formulation of our model to finally
determine the relatively small input intervals forLengthβ and SBβ [25 27] and [-05 0]
respectively 15K = runs are carried out to get statistics of the estimates of the two
parameters Within each run 10M = values are drawn for inputs Lengthβ and SBβ
respectively for estimating binding function
To visualize the trend of binding function more clearly we make use all the 150 sets of
vector β and vector θ to estimate the binding function Since we have three variables in
the logit model we have to estimate three binding functions
For the first binding function ɶ Lengthθ and ( Lengthβ SBβ ) are plotted in Figure 17 below
shown along with the estimated binding function
Figure 17 Scatter plot of theta_length against beta_length and beta_sb estimated binding function
The first binding function takes the form of
ɶ 41312+09114 +44845 10Length Length SBθ β βminus= sdot (42)
60
For the second binding function ɶSBθ and ( Lengthβ SBβ ) are plotted in Figure 18 below
shown along with the estimated binding function
Figure 18 Scatter plot of theta_sb against beta_length and beta_sb estimated binding function
The second binding function takes the form of
ɶ 01147 01362 +07119SB Length SBθ β β= minus (43)
For the third binding function ɶ LNθ and ( Lengthβ SBβ ) are plotted in Figure 19 below
shown along with the estimated binding function
Figure 19 Scatter plot of theta_ln against beta_length and beta_sb estimated binding function
The third binding function takes the form of
ɶ 10043 03378 +00068LN Length SBθ β β= minus (44)
The t-test of estimated parameters in the binding function is carried out with null
hypothesis of zero Estimates that are significantly different from zero with 95
confidence interval are marked as bold
61
Table 8 Estimated coefficients of binding functions for model with exponential cost function
Constant Lengthβ SBβ
ɶLengthθ 1312
(2411) 09114 (4360)
4484510-4 (0005)
ɶSBθ 01147
(0425) -01362 (-1314)
07119 (17221)
ɶLNθ 10043
(13767) -03378
(-12051) 00068 (0607)
Same as in the model with two attributes ɶ Lengthθ andɶ SBθ are significantly affected by
Lengthβ and SBβ respectively The negative signs for Lengthβ in the second and third binding
functions draw our attention Since in the second binding function it is not significantly
different from zero we can disregard the effect In the third binding function Lengthβ has
significantly negative effect on ɶ LNθ The larger value of Lengthβ we have the more
influential of path length on cost is With negative effect on ɶ LNθ we can say at the same
time number of links become less influential on the utility This is reasonable since
intuitively if we are sensitive to the path length we wouldnrsquot care too much of having to
switch several more or fewer links based on that path length and number of links are
more or less correlated to each other
Based on the estimated binding functions and the true observation data we could get the
estimates of Lengthβ and SBβ as shown in Table 9 below
Table 9 Statistics of estimation of beta_length and beta_sb in exponential-cost-function model
Parameter Lengthβ
SBβ
Mean 2537672 -045601
Standard deviation 0068377 0133036
We have negative estimate of SBβ which conflicts our assumption that length and
presence of speed bump on the path may increase the cost of traveling through certain
path This is probably due to omission of important attributes in the deterministic part of
the cost function Based on the estimate we are led to think that presence of speed bump
decrease the cost and individuals would prefer to drive on paths with speed bumps Yet
62
this is not true based on our estimation since we are only using two attributes And there
are great chance that some important features are not captured which accidentally are
related with speed bump So the estimate of SBβ is misleading per se in the simple model
as we are using To get more accurate estimate of SBβ we may need to include more
variables in the deterministic part of the cost function
642 Model with estimated scale parameter for random term
Considering the trial with two attributes in Section 63 we add a fixed scale parameter to
the random term to make it proportional to the length of links This appeals to our
assumption yet lays restrictions to the model Apart from this we also try to add an
unfixed scale parameter σ and estimate it along with the other two parameters Lengthβ and
SBβ Note that if we add a scale parameter directly to the random term it wonrsquot work out
as we expect since that way the scale parameter will scale the other two parameters
Lengthβ and SBβ as well as shown below
= ( )Length SBLength Length l SB SB l li Length l SB l lix x x x
β ββ β ε σ σ εσ σ
+ + sdot + + (45)
The right side equation is equivalent to Length Length l SB SB l lix xβ β ε+ + thus making no
difference So we choose to add a new random term including the scale parameter In
addition since we can get good estimate by assuming the random term proportional to
length we will keep this in the newly added random term Now the cost function is
specified as
1 ( ) + ( )l li li Length Length l SB SB l li li Length l Lengthc x x x x Mean xε ε β β ε η σ= + + sdot sdot 2
(46)
liε and liη follow the same truncated normal distribution but are drawn separately so that
they are not equal
In terms of the auxiliary model since now we have three parameters to be estimated in
the underlying model we need one more attribute in the logit model and number of links
in the path LNx is chosen The utility function of the logit model is actually the same as in
Section 641 which is
- - -ri Length Length r SB SB r LN LN r riU x x xθ θ θ ε= + (47)
63
With three parameters in the underlying model it is more reasonable to include
interactions of parameters in the binding function The binding functions take the form of
ɶ
1 2 3
4 5 6 7
( )
Length SB
Length SB Length SB Length SB
c d d d
d d d d
θ β β β σβ β β σ β σ β β σ
= + + +
+ + + + (48)
Since the estimates are not good we did not carry out too many trials to center the input
interval As a result the binding function may be of more interest in this case The chosen
interval is a trial one which is identical [0 3] for Lengthβ SBβ andσ We choose ten sets of
mβ and ɶ ( )m mθ β from one run as an example The values of ɶ ( )m mθ β are plotted against
Lengthβ SBβ andσ respectively The interactions are not shown in the figure yet we have
the estimates of binding function which will give a numerical description of how the
interactions impact theɶ ( )m mθ β
Figure 20 Plots of theta_length against beta_length beta_sb and sigma respectively
y = 09114x + 27818
Rsup2 = 07361
0
1
2
3
4
5
6
0 1 2 3 4
the
ta_
len
gth
beta_length
y = 03568x + 36215
Rsup2 = 00897
0
1
2
3
4
5
6
0 1 2 3 4
the
ta_
len
gth
beta_sb
y = 02572x + 38468
Rsup2 = 00516
0
1
2
3
4
5
6
0 1 2 3
the
ta_
len
gth
sigma
64
Figure 21 Plots of theta_sb against beta_length beta_sb and sigma respectively
y = 02363x + 0835
Rsup2 = 0088
0
05
1
15
2
25
3
0 1 2 3 4
the
ta_
sb
beta_length
y = 06351x + 01759
Rsup2 = 05054
0
05
1
15
2
25
3
0 1 2 3 4
the
ta_
sb
beta_sb
y = -03801x + 17212
Rsup2 = 02001
0
05
1
15
2
25
3
0 1 2 3
the
ta_
len
gth
sigma
y = 00477x + 04521
Rsup2 = 005460
02
04
06
08
1
0 1 2 3 4
the
ta_
ln
beta_length
y = -00553x + 06156
Rsup2 = 00582
0
02
04
06
08
1
0 1 2 3 4
the
ta_
ln
beta_sb
65
Figure 22 Plots of theta_ln against beta_length beta_sb and sigma respectively
As we can see from the three figures above ɶ Lengthθ ɶSBθ and ɶ LNθ are more affected by
Lengthβ SBβ andσ respectively Especially we can see a strong relationship between ɶ LNθ
and σ which assures that number of links can be used to infer the scale parameter in the
underlying model
The estimates of three binding functions are shown in Table 10 below with each row
representing the estimates for one of the three binding function and each column
representing certain variable in the binding function In the parenthesis below each
estimate of the coefficients is the t-test value with the null hypothesis of zero We take the
90 confidence interval and estimates with t-test value larger than 164 are supposed to
be significantly different from zero which are marked as bold
Table 10 Estimates of three binding functions
Constant Lengthβ SBβ σ
Length SBβ β
Lengthβ σ
SBβ σ Length SBβ β σ
ɶLengthθ
1814 (3085)
0861 (2417)
-0089 (-0258)
1038 (2913)
0202 (1030)
-0246 (-1240)
-0056 (-0292)
-0045 (-0412)
ɶSBθ 0284
(1482) -0125
(-1081) 0942
(8371) -0247
(-2127) 0118
(1856) 0070
(1086) -0141
(-2275) -0067
(-1883)
ɶLNθ 0819
(18643) 0015
(0577) -0026
(-0997) -0261
(-9794) 0006
(0419) 0007
(0498) 0024
(1663) -0007
(-0803)
As the constants indicate given no other attributes length and number of links have more
negative effects on the utility than the speed bump dummy does Judging from the
significance of coefficients for the three input parametersɶ Lengthθ ɶSBθ and ɶ LNθ are
significantly affected by Lengthβ SBβ andσ respectively As we can see σ has a negative
y = -02164x + 08218
Rsup2 = 09867
0
02
04
06
08
1
0 1 2 3th
eta
_ln
sigma
66
effect on ɶSBθ andɶ LNθ Since to some extent σ measures the scale of randomness we
could say that the more randomness of the costs on the links have the less influential of
presence of speed bump and number of links become ForɶSBθ it is significantly affected
by some of the interaction terms Notice that SBβ has positive effect onɶSBθ while σ has
effect The interaction terms including both σ and SBβ have negative effect onɶSBθ which
indicates that randomness of cost is more influential than presence of speed bump on the
disutility of speed bump
In terms of the final estimate as stated above the estimates of Lengthβ and SBβ have
negative signs whileσ has positive sign This result conflict our expectation that Lengthβ
and SBβ should have positive signs so we did not carry out more trials and shrinkage The
possible reason for negative estimate is similar to that in the model with exponential form
of cost function Given more attributes in the deterministic part of both the cost function
and utility function in the logit model we might be able to capture the features of the data
better and have the right sign in the final estimates
643 Monte Carlo evidence of model with estimated scale parameter for random
term
Based on the model formulation with estimated scale parameter for random term we also
carried out a Monte Carlo simulation experiment to verify the efficiency of using number
of links in the logti model to infer the scale parameter in the cost function and what we
do is to simulated observations instead of the true ones
We take three arbitrary values for the three parameters in the cost functionLengthβ SBβ and
σ to be 05 And simulated observations are generated based on the given values of
parameters in the cost function Since we know the true values for the parameters the
input domain is centered around the true values to be [04 06] for Lengthβ SBβ andσ
10K = runs are carried out to get statistics of the estimates of the three parameters
Within each run 10M = values are drawn for inputsLengthβ SBβ andσ respectively for
estimating binding function
67
In terms of the binding function by doing regression test we can see that the intersection
terms are unnecessary to be included or even hazardous for good estimate of binding
function so we decide to remove them and keep the binding function as
ɶ1 2 3( ) Length SBc d d dθ β β β σ= + + + (49)
We choose ten sets of mβ and ɶ ( )m mθ β from one run as an example The values of
ɶ ( )m mθ β are plotted againstLengthβ SBβ andσ respectively
Figure 23 Plots of theta_length against beta_length beta_sb and sigma respectively
y = 23826x + 14791
Rsup2 = 05326
15
2
25
3
35
04 05 06
the
ta_
len
gth
beta_length
y = -06434x + 30245
Rsup2 = 0048115
2
25
3
35
04 05 06
the
ta_
len
gth
beta_sb
y = 26255x + 14156
Rsup2 = 07607
15
2
25
3
35
04 05 06
the
ta_
len
gth
sigma
y = -02443x + 04708
Rsup2 = 0034
0
01
02
03
04
05
04 05 06
the
ta_
sb
beta_length
y = 11233x - 02096
Rsup2 = 089020
01
02
03
04
05
04 05 06
the
ta_
sb
beta_sb
68
Figure 24 Plots of theta_sb against beta_length beta_sb and sigma respectively
Figure 25 Plots of theta_ln against beta_length beta_sb and sigma respectively
The figures show similar trend to those in the trial model with estimated scale parameters
which is in line with our expectation
The estimates of three binding functions are shown in Table 11 below with each row
representing the estimates for one of the three binding function and each column
y = -04374x + 056
Rsup2 = 01283
0
01
02
03
04
05
04 05 06
the
ta_
sb
sigma
y = -01144x + 07619
Rsup2 = 01114066
067
068
069
07
071
072
073
074
04 05 06
the
ta_
ln
beta_length
y = 0053x + 06768
Rsup2 = 00296066
067
068
069
07
071
072
073
074
04 05 06
the
ta_
ln
beta_sb
y = -03115x + 08561
Rsup2 = 09717
066
067
068
069
07
071
072
073
074
04 05 06
the
ta_
ln
sigma
69
representing certain variable in the binding function In the parenthesis below each
estimate of the coefficients is the t-test value with the null hypothesis of zero We take the
95 confidence interval and estimates with t-test value larger than 196 are supposed to
be significantly different from zero which are marked as bold
Table 11 Estimates of three binding functions in the Monte Carlo experiment
Constant Lengthβ SBβ σ
ɶLengthθ 0853
(3606) 1009
(3724) -0034
(-0125) 2569
(9482)
ɶSBθ -0062
(-0385) -0104
(-0564) 1208
(6591) -0226
(-1227)
ɶLNθ 0854
(46688) 0013
(0624) -0004
(-0185) -0302
(-14428)
The estimates of binding function have similar characteristics as in the trial model with
estimated scale parameters as well They contain almost the same significant coefficients
and those significant estimates have the same signs as in the trial with true observations
Based on the estimated binding function and the simulated observations given true values
of the three parameters to be 05 the final estimates of Lengthβ SBβ andσ are shown in
Table 12 below
Table 12 Statistics of estimation of beta_length beta_sb and sigma in the Monte Carlo experiment
Parameter Lengthβ
SBβ σ
Mean 0404138359 0458624533 0639191487
Standard deviation 1109279424 0242570421 0377069799
As we can see the estimates of Lengthβ SBβ andσ are quite close to their true values What
is not satisfying is that the estimate of σ is a little large and lies outside the input domain
of [04 06] but is still quite near to this interval In addition the estimate of Lengthβ is
within the input domain yet the variation is large This is understandable since we scale
the random term by length together with the scale parameter and thus the parameter for
length could be influenced by the random term and turns out to have large variations In a
word the result of Monte Carlo experiment verifies that we get use the model
70
formulation with unfixed scale parameter for the random term to get the right estimate of
the true values And number of links is strongly related withσ which means that it is
reasonable and efficient to use it as a reference to σ in the cost function
71
7 Conclusions
This thesis aims at implementing the newly proposed route choice model based on
indirect inference in true observations The model assigns links specific errors for a
network which allows natural correlations among paths and is practical in simulating
observations by means of shortest path searching algorithms like the Dijkstrarsquos Algorithm
used in our experiment To get consistent estimation of this kind of model indirect
inference method is used and a simple model like logit model is used as an auxiliary
model The route choice model and indirect inference estimator has been tested on
synthetic data with simulated observations and proved to be capable of consistently
estimated
Compared to the synthetic experiment some extensions are done in this thesis By
replacing the simulated observations with the true observations the method is tested on
the empirical circumstance to prove that it could be used in solving practical problems
The true observations have more noises than the simulated ones thus more difficulty to
capture their features We know neither the right formulations of models based on the
data nor the values of parameters in the route choice model yet as defined the
parameters should have positive signs As it turned out to be in the experiment with only
length in the model we get the estimates of Lengthβ as 1337 while with two attributes in
the model we get the estimates of Lengthβ and SBβ as 0761 and 00799 respectively The
estimates in both experiments seem reasonable with the right sign In addition seen from
the estimation of the binding function the coefficients in the logit model is negatively
affected by the parameters they infer in the basic route choice model in the two attributes
case one parameter in the logit model is more apparently affected by the parameter it
refers than the other parameter in basic model
In the trial where we include a scale parameter to the random term and estimate it along
with the other parameters in the route choice model a Monte Carlo simulation
experiment is carried out using simulated observations The result shows that it is
efficient to use number of links in the auxiliary model to infer the scale parameter in the
basic rout choice model
72
In other trial formulations of the model we got negative estimates which may probably
be due to missing attributes in the cost function Future work should be done to include
more attributes
Another thing to recommend for future is that we generate the pseudo-universal choice
set as part of the auxiliary model Since the pseudo-universal choice set is partially used
for deciding which ODs and observations to be used in the project it is essential and
should be generated beforehand But from the choice set generation point of view we
could generate individual specific choice set directly instead of random drawing paths
from the pseudo-universal choice set This would increase computational efficiency
73
Bibliography
Axhausen K Schoumlnfelder S Wolf J Oliveira M amp Samaga U (2003) 80 Weeks of
GPS Traces Approaches to Enriching the Trip Information Transportation Research
Record 1870 46-54
Azevedo J Costa M Madeira J amp Martins E (1993) An Algorithm for the Ranking
of Shortest Paths European Journal of Operational Research 69 (1) 97-106
Bartels K Boztug Y amp Muumlller M (1999) Testing the Multinomial Logit Model
Working paper University Potsdam Germany
Bekhor S Ben-Akiva M amp Ramming M (2002) Adaptation of Logit Kernel to Route
Choice Situation Transportation Research Board of the National Academics 1805 78-85
Bekhor S Ben-Akiva M amp Ramming M (2006) Evaluation of Choice Set Generation
Algorithms for Route Choice Models Annals of Operations Research 114 (1) 235-247
Ben-Akiva M amp Bierlaire M (1999) Discrete Choice Methods and Their Applications
to Short Term Travel Decisions In Chapter for the Transport Science Handbook
Preliminary Draft
Ben-Akiva M amp Bierlaire M (2003) Discrete Choice Models with Applications to
Departure Time and Route Choice In Handbook of Transportation Science (second ed)
Kluwer
Ben-Akiva M amp Bolduc D (1996) Multinomial Probit with a Logit Kernel and a
General Parametric Specification of the Covariance Structure Working Paper
Ben-Akiva M amp Lerman S (1985) Discrete Choice Analysis Theory and Application
to Travel Demand MIT Press
Ben-Akiva M Bergman M Daly A amp Ramaswamy R (1984) Modeling Inter Urban
Route Choice Behaviour In J Vollmuller amp R Hamerslag (Ed) the 9th International
Symposium on Transportation and Traffic Theory (pp 299-330) Utrecht Netherlands
VNU Science Press
Cascetta E Nuzzolo A Russo F amp Vitetta A (1996) A Modified Logit Route Choice
Model Overcoming Path Overlapping ProblemsSpecification and Some Calibration
Results for Interurban Networks In J Lesort (Ed) the 13th International Symposium on
Transportation and Traffic Theory Lyon France
74
Creel M (2009) A Data Mining Approach to Indirect Inference Universitat Autonoma
de Barcelona Department of Economics and Economic History
De La Barra T Peacuterez B amp Anez J (1993) Multidimensional Path Search and
Assignment 21st PTRC Summer Meeting (pp 307-319)
Dijkstra E (1959) A note on two problems in connexion with graphs Numerische
Mathematik 1 269-271
Frejinger E amp Bierlaire M (2007) Capturing Correlation with Subnetworks in Route
Choice Models Transportation Research Part B 41 363-378
Frejinger E Bierlaire M amp Ben-Akiva M (2009) Sampling of Alternatives for Route
Choice Modeling Transportation Research Part B Methodological 43 (10) 984-994
Gallant A amp McCulloch R (2004) On the Determination of General Scientific Models
Manuscript Duke University
Gourieacuteroux C Monfort A amp Renault E (1993) Indirect Inference Journal of Applied
Econometrics 8 85-118
Karlstroumlm A Sundberg M amp Wang Q (2011) Consistently estimating flexible route
choice models using an MNL lense International Choice Modeling Conference Leeds
Keane M amp Smith A (2003) Generalized Indirect Inference for Discrete Choice
Models Manuscript Yale University
Manski C amp Lerman S (1977) The Estimation of Choice Probabilities from Choice
Based Samples Econometrica 45 (8) 1977-1988
McFadden D (1974) Conditional Logit Analysis of Qualitative Choice Behaviour (P
Zarembka Ed) Frontiers in Econometrics 105-142
McFadden D (1978) Modeling the Choice of Residential Location In A Karlqvist L
Lundqvist F Snickars amp J Weibull (Ed) Spatial Interaction Theory and Residential
Location (pp 75-96) Amsterdam North-Holland
McFadden D amp Train K (2000) Mixed MNL Models for Discrete Response Journal
of Applied Econometrics
Nerella S amp Bhat C (2004) Numerical Analysis of Effect of Sampling of Alternatives
in Discrete Choice Models Transportation Research Record 1894 11-19
Ramming M (2001) Network Knowledge and Route Choice PhD Thesis Massachusetts
Institute of Technology
75
Schoumlnfelder S amp Samaga U (2003) Where Do You Want to Go Today-More
Observations on Daily Mobility Third Swiss Transport Research Conference Ascona
Schoumlnfelder S Axhausen K Antille N amp Bierlaire M (2002) Exploring the
Potentials of Automatically Collected GPS Data for Travel Behaviour Analysis- A
Swedish Data Source i J Moumlltgen amp A Wytzisk (Red) GI-Technologien fuumlr Verkehr
und Logistik number 13 Institut fuumlr Geoinformatik Universitaumlt Muumlnster (ss 155-179)
Munster IfGIprints
Smith A (1993) Estimating Nonlinear Time-series Models Using Simulated Vector
Autoregressions Journal of Applied Econometrics 8 63-84
Smith A (2008) Indirect Inference In S Durlauf amp L Blume (Eds) The New
Palgrave Dictionary of Economics (Second ed) Palgrave Macmillan
Smith A (1990) Three Essays on the Solution and Estimation of Dynamic
Macroeconomic Models PhD Dissertation Duke University
Train K (2003) Discrete Choice Methods with Simulation Cambridge University Press
Vovsha P amp Bekhor S (1998) Link-nested Logit Model of Route Choice-Overcoming
Route Overlapping Problem Transportation Research Record 1645 133-142
Wang H (2011) Logistics Distribution Shortest Path Based on Dijkstra Algorithm
Computer and Digital Engineering 3
Assigned publication number
TSC-MT 11-016
wwwkthse

16
Gourieacuteroux Monfort and Renault (1993) proposed the inference methods based on an
ldquoincorrectrdquo criterion which does not give consistent estimation to parameters of interest
directly20 The argument of the criterion is called the auxiliary parameter which may
have a larger dimension than the parameters of interest in the basic model After the
auxiliary parameters are selected a simulation-based process is carried out to get a
consistent and asymptotically normal estimator of parameters of interest As a simulation-
based method the only requirement for the basic model is that it could be simulated
regardless of formulations of the model So it could be used for estimating models which
are too complex to carry out direct approaches The paper shows how this kind of method
can be applied in fields such as micro-econometrics macro-econometrics and
econometrics of finance
Keane and Smith (2003) proposed a generalized form of the indirect inference method to
be implemented in the discrete choice model context21 Theoretically indirect inference
could deal with estimation of any economic models yet it has some limitations per se that
decrease the estimation efficiency or even make it difficult to implement Problems arise
when we use indirect inference in estimating discrete choice models since the objective
function the metric of distance between the auxiliary models estimated on observed data
and simulated data to be specific is inherently discrete which leaves the gradient-based
optimization methods infeasible Keane and Smith (2003) proposed that the estimation
procedures used for observed data and simulated data can be different22 Instead of the
discrete choice a continuous function of latent utilities including a smoothing parameter
is used as the dependent variable in the auxiliary model When the smoothing parameter
goes to zero the function of latent utilities converges to the discrete choices this way to
guarantee consistency According to the Monte Carlo results the generalized indirect
inference method proposed in this paper yields good estimates in small samples being as
efficient as maximum likelihood estimates in comparison
20 Gourieacuteroux C Monfort A amp Renault E (1993) Indirect Inference 21 Keane M amp Smith A (2003) Generalized Indirect Inference for Discrete Choice Models Manuscript Yale University 22 Keane M amp Smith A (2003) Generalized Indirect Inference for Discrete Choice Models
17
Creel (2009) presented a data mining approach to indirect inference23 which is similar to
the regular indirect inference method yet with certain advantages over it The method is a
simulation-based estimator relying also on an auxiliary model In line with the indirect
inference method an underlying economic model with parameterβ is referenced by an
auxiliary model with parameterθ Certain values of the parameter hβ in underlying
economic model are drawn randomly from a known density simulated data is generated
using Monte Carlo methods to estimate ɶh
θ of auxiliary model which ends up with a set
of tuples ɶ( )hhβ θ Nonparametric methods are used to get the function ɶ( | )E aβ θ = and
the final estimate of β is supposed to be the result of regression function evaluated at the
estimate of θ based on true observations ɶ ɵ( | )Eβ β θ θ= = Creel (2009) also presented a
way of calculating confidence intervals24 Monte Carlo results in dynamic and nonlinear
panel models and vector autoregressions show good performance of the new estimator
23 Creel M (2009) A Data Mining Approach to Indirect Inference Universitat Autonoma de Barcelona Department of Economics and Economic History 24 Creel M (2009) A Data Mining Approach to Indirect Inference
18
3 Methodology
31 Multinomial Logit Model (MNL)
311 Model Description
Route choice modeling is somewhat complicated when we want to capture the attributes
of both the alternative routes and choice maker accurately and reflect the choice making
process in the model Intuitively route choice can be regarded as choosing one specific
route from several alternative routes which coincides with the prerequisites of discrete
choice models Actually a lot of literatures have explored the route choice modeling and
possible improvements based on discrete choice models (see Cascetta et al 1996 Vovsha
and Bekhor 1998 Ben-Akiva and Bierlaire 1999 for more information on development
in route choice models with regard to discrete choice models)25
To understand the frontier development of route choice model we have got to know the
discrete choice models among which multinomial logit model (MNL) is the most widely
used In addition we choose to implement a new method ndash indirect inference in which
MNL is used as it is
Logit model is the most widely used discrete choice model till now due to its excellent
qualities in model specification To be specific the choice probability takes a closed form
which is easy to estimate and interpret (Train 2003)26
The multinomial logit model is a kind of choice model with more than two alternatives in
the choice set We assume that the choice maker makes his or her decision based on the
utility maximization rule (Ben-Akiva amp Lerman 1985)27 With regard to the utility njU
the decision maker n obtains from the thj alternative in the choice set it is made up of
two parts the deterministic part and the stochastic part The deterministic part denoted
25 Cascetta E Nuzzolo A Russo F amp Vitetta A (1996) A Modified Logit Route Choice Model Overcoming Path Overlapping ProblemsSpecification and Some Calibration Results for Interurban Networks Vovsha P amp Bekhor S (1998) Link-nested Logit Model of Route Choice-Overcoming Route Overlapping Problem Transportation Research Record 1645 133-142 Ben-Akiva M amp Bierlaire M (1999) Discrete Choice Methods and Their Applications to Short Term Travel Decisions 26 Train K (2003) Discrete Choice Methods with Simulation Cambridge University Press 27 Ben-Akiva M amp Lerman S (1985) Discrete Choice Analysis Theory and Application to Travel Demand MIT Press
19
by njV contains attributes known by the modelers while the stochastic part denoted by
njε is the attributes affecting peoplersquos the decision which cannot be observed by the
modelers yet are known by the decision makers themselves So the utility function turns
out to be
nj nj njU V jε= + forall (1)
The type of choice model is basically decided by the distribution of the stochastic part
When we assume that njε is independently identically Gumbel distributed the model
becomes a logit model
As stated above the decision follows utility maximization rule which means that the
decision maker n chooses the alternative with the highest utility say the thi alternative
Use as the probability the thi alternative is chosen over the others we have
( max ) ( )
( )
( )
ni ni nj ni njj C
ni ni nj nj
nj ni ni nj
P P U U P U U j i
P V V j i
P V V j i
ε εε ε
isin= = = ge forall ne
= + gt + forall ne
= minus lt minus forall ne (2)
With Equation (2) above and the assumption that njε follows iid Gumbel distribution we
could derive the probability of decision maker n chooses alternativei which is
ni
nj
V
ni V
j
eP
e=sum
(3)
Typically we specify the deterministic part of the utility function in a linear form which
is nj njV xβ= Then the probability becomes
ni
nj
x
ni x
j
eP
e
β
β=sum
(4)
This is the most common form of probability function for multinomial logit models
There are some good properties for this kind of logit probability as discussed by Train
(2009)28 With this form the probability of choosing certain alternative will be between
zero and one inherently which is basically required for probability definition Yet the
28 Train K (2003) Discrete Choice Methods with Simulation
20
value of niP will never drop to zero mathematically which means that all the alternatives
in the choice set are perceived to have chance to be chosen On the other hand if an
alternative is perceived never to be chosen it should not be included in the choice set at
all
The probabilities for all the alternatives in the choice set sums to be one which is easily
illustrated from the analytical properties 1 1 1
( ) 1njni
J J JVV
nii i j
P e e= = =
= =sum sum sum in which J denotes
the number of alternatives in the choice set
The logit probability and the deterministic part of the utility function follow an S-shaped
curve line shown in Figure 1 below
Figure 1 S-shaped relationship between probability and deterministic part of utility
This property gives implications for possible impacts of the deterministic utility of certain
alternative on its chances to be chosen We could see that when an alternative has about
50 probability to be chosen which infers to the steepest part on the curve a small
change in the deterministic part of the utility function could lead to a large change in the
probability the alternative has to be chosen
Apart from the nice properties of logit probability logit models have some disadvantages
as well (Bartels Boztug amp Muumlller 1999)29 One shortcoming is the assumption of
29 Bartels K Boztug Y amp Muumlller M (1999) Testing the Multinomial Logit Model Working paper University Potsdam Germany
21
Gumbel distribution of error terms in the utility function The inherent requirement for
iid property sets restrictions for logit model to be widely used especially in route choice
modeling context Several models have been proposed to overcome this shortcoming in
particular modifications based on MNL to adjust it to route choice practices have been
proposed Another drawback is the assumption of the linear composition for the
deterministic part of utility function Actually this assumption is for ease of following
estimation process since McFadden (1974) demonstrated that under this condition the
probabilities will be universally concave with regard to the coefficientsβ 30 which
improves the performance of numerical estimation Yet there could be nonlinear
compositions in the deterministic part to relax the restriction Under this condition the
universal concavity cannot be guaranteed which may lead to local convergence in the
estimation process
312 Model Estimation
The most commonly used numerical estimation method for multinomial logit models is
the Maximum Likelihood Estimation (MLE) In principle given a set of data and the
underlying probability model the method tries to find coefficients of the probability
model with which produced data has a distribution most likely resembles the distribution
of the observed data
Consider the case that N decision makers with their choice data are obtained Parameters
to be estimated are the coefficients in the utility function denoted byβ We could then
use the MLE to try to get the values of β vector with which the probability that choice
maker choose their observed alternatives is maximized
The probability of choice maker n to choose his or her observed alternative can be
written as
( ) niyni
i
Pprod (5)
in which niy is a dummy with value 1 if choice maker choose alternative i and value 0
otherwise
30 McFadden D (1974) Conditional Logit Analysis of Qualitative Choice Behaviour (P Zarembka Ed) Frontiers in Econometrics 105-142
22
Choice makers choose their alternative independently from each other so the probability
of all sampled choice makers choose their observed alternative is
1
( ) ( ) ni
Ny
nin i
L Pβ=
= prodprod (6)
This is the likelihood function with regard to the parameters to be estimated β in this
case We can take the logarithm of it to get the log-likelihood function
1
( ) lnN
ni nin i
LL y Pβ=
=sumsum (7)
Since we aim at getting the value of β to make the log-likelihood function maximized
we can take the derivative of it with respect to β and set it to zero
( )
0dLL
d
ββ
= (8)
By solving this equation we could get the estimate of β
32 Dijkstrarsquos Algorithm
321 Introduction
A method is needed for generating feasible alternatives and compose the choice set as
well as for deriving simulated observations for each OD pair in the process of indirect
inference As for choice set generation we would like to include certain number of high
ranking shortest paths in the choice set since these paths tend to have more possibility to
be chosen Similar to this the simulated observation is generated as the shortest path
between each OD pair We implement a method for shortest path finding which is the
Dijkstrarsquos Algorithm
Dijkstrarsquos Algorithm is named after the Dutch computer scientist Edsger Dijkstra who
conceived this method in 1956 and got it published in 195931 This is a graph search
algorithm aiming at solving shortest path problem for a graph the edge cost of which is
defined nonnegative The outcome of it is a shortest path tree demonstrating the path with
lowest value with respect to the defined cost
31 Dijkstra E (1959) A note on two problems in connexion with graphs Numerische Mathematik 1 269-271
23
This algorithm deals with single-source problem To be specific given one source node in
the graph the algorithm will give paths with the lowest value with regard to cost from
this source node to every other node in the network Given certain criterion we could use
the algorithm to find shortest path between two specific nodes by setting one node as the
source and the other as the target
After released it is widely used in path searching problems especially in transportation
related practices Routing problem is considered in investigation on traffic assignment
and optimization in logistics Real sized road network could be perceived as a graph with
vertices and edges in which cities can be abstracted as the vertices in the graph and the
roads connecting cities can then be regarded as the edges With the aid of Dijkstrarsquos
Algorithm the shortest path with respect to cost could be found from certain city to the
other cities The outcome is valuable for logistics corporations to work out their region-
wide distribution plans32
322 Algorithm
We connect a ldquodistancerdquo value with all the vertices in the graph indicating its distance
from the source vertex To be accurate the ldquodistancerdquo could be actual length of edges or
the generalized cost on the edges or anything desired The source vertex is defined as the
initial node with a value of zero In the process Dijkstrarsquos Algorithm will assign values
to vertices detected in one loop and update the values in the following loops till a
minimum value is found for each vertex The steps for searching and updating are
presented below
1 Initialize the network and assign the distance values of vertices other than the initial
node as infinity
2 When one vertex is to be detected it is denoted as current node All the vertices that
have been detected and attained the minimum distance values will be marked as detected
and will not be detected in the following loops while the vertices remaining unvisited
will be marked undetected To initialize all the vertices are marked undetected and the
initial node is set as current node
32 Wang H (2011) Logistics Distribution Shortest Path Based on Dijkstra Algorithm Computer and Digital Engineering 3
24
3 For current node all its directly connected adjacent nodes are considered except for
the newly detected vertex Labeled distance values of the neighbor vertices will be
updated if the calculated values from current node are smaller than their current values
For example current node A has a distance value of 4 and one of its neighbors B has a
value of 8 The edge linking A and B has a distance of 2 The newly calculated distance
value for B will be 4+2=6 which is smaller than 8 So the labeled distance value for B
will be updated to 6 indicating that the minimum distance from the source vertex to B till
now is 6 and the path should pass A
4 When all the neighbors of the current node are considered and updated mark the
current node as detected And mark the undetected node with the lowest distance value as
the current node and do the detection in step 3 again
5 When all the vertices in the network are marked detected the algorithm is finished and
we get the minimum distance from the source to all the other vertices The shortest path
from the source to a specific vertex could be found out following the detecting process
As mentioned above the stop criterion could also be modified as we desired If we aim at
finding the shortest path between two vertices at the beginning one vertex should be set
as the initial node and the algorithm could be stopped once the other vertex is marked as
detected
323 Explanatory Example
Here is a simple network to illustrate the mechanism of Dijstrarsquos Algorithm There are
five vertices and six edges with distance values labeled beside We define A as the source
and set it the initial node
Figure 2 A simple network for Dijstrrarsquoa Algorithm explanation
25
Initialization
Initial node A
Detected null
Distance value A=0 B=C=D=E=+infin
Loop 1
Current node A
Adjacent vertices B C
Detected null
Distance value A=0 B=4 C=1 D=E=+infin
Loop 2
Current node C
Adjacent vertices B D
Detected A
Distance value A=0 C=1 B=min 4 C+2 =3 D=C+3=4 E=+infin
Loop 3
Current node B
Adjacent vertices E
Detected A C
Distance value A=0 C=1 B=3 D=4 E=B+3=6
Loop 4
Current node E
Adjacent vertices null
Detected A B C D
Distance value A=0 C=1 B=3 D=4 E=6
If we want to get the shortest path from A to E following the detecting process we could
know that it should be A-C-B-E
26
324 Discussion
Dijkstrarsquos Algorithm has a clear logical structure which makes it easy to understand as
well as to implement in programming Nonetheless this method cannot search directly
from one node towards the other to find the shortest path between the two It works more
like detecting all the adjacent nodes in terms of shortest paths and expands from the
source iteratively until the target node is included and that is when we could figure out
the shortest path between the two specific vertices This reveals the fact that the method
wastes a lot of time in the blind search leaving it inefficient In addition this method is
not able to deal with networks with negative edge values yet this is not a problem in our
research since link cost on our network is defined nonnegative
33 Indirect Inference
331 Introduction
For problems in route choice context choice set size may be way too large to enumerate
all the alternatives Yet estimation based on sampled choice set may introduce biases
which can be corrected in some special cases (see Frejinger Bierlaire amp Ben-Akiva
2009)33 While in cases where estimation models are not based on MNL say multinomial
probit model we could not find corrections for biases caused by sampled choice set
Estimator based on the principle of indirect inference is then introduced to overcome
inconsistency problem34
Indirect inference35 is a simulation-based method for estimating parameters in economic
models by making references to the parameters of interest (Smith 2008) It is motivated
when general statistical estimation method such as Maximum Likelihood is intractable or
as discussed above consistent estimation is required given that only sampled choice set is
available Since in economic analysis we tend to build models which guarantee scientific
logic and inclusion of necessary attributes quite often the models will end up
33 Frejinger E Bierlaire M amp Ben-Akiva M (2009) Sampling of Alternatives for Route Choice Modeling 34 Karlstroumlm A Sundberg M amp Wang Q (2011) Consistently estimating flexible route choice models using an MNL lense 35 Smith A (2008) Indirect Inference In S Durlauf amp L Blume (Eds) The New Palgrave Dictionary of Economics (Second ed) Palgrave Macmillan
27
complicated from statistical estimation point of view This in sequence spurs the wide use
of indirect inference in economic analysis
It is common character that simulation-based methods allows modelers to simulate data
from the economic model of interest given certain perceived values of the parameters to
be estimated Since to generate data is essential and simple the true challenge is how to
estimate coefficients Indirect inference uses an auxiliary model which gives a rich
description of the covariance patterns in the data by including certain variables from the
basic economic model On the other hand the auxiliary model does not need to reflect
accurately the data generating process since it is supposed to be estimated based on the
data derived not to generate data itself The basic function of the auxiliary model is that
it provides a criterion to compare observed data and simulated data from the basic
economics model
We do iterations with the aim of finding the parameters of the basic economic model so
the observed data and the simulated data from the basic model looks almost the same by
the criterion of auxiliary model To be specific the auxiliary model is estimated based on
both observed data and simulated data we choose parameters for the basic model to
make sure that the two estimator of auxiliary model are as close as possible Based on
this idea the auxiliary model should be easy to estimate
332 Definition of the method
We define an economic model with the form of
( ) 12t t ty G x t Tε β= = (9)
in which 1 Tt tx = is a sequence of observed exogenous variables 1 T
t ty = is a sequence of
observed endogenous variables and 1 Tt tε = is a sequence of unobserved random error
terms β is a k -dimensional coefficient vector of the exogenous variables (Smith
2008)36
This model generally describes a relation that ty is dependent ontx with some random
errors Given the distribution of the random errors we could get the probability density
36 Smith A (2008) Indirect Inference
28
function of ty conditional on tx We will not focus on this density and instead this model
is only used for simulating data in indirect inference
In terms of the auxiliary model it could be defined by a probability density function with
the form of
( | )t tf y x θ (10)
in which θ is a p -dimensional coefficient vector and p is supposed to be not smaller
than k since we should capture characteristics of all the parameters in the underlying
economic model In addition the auxiliary model needs not be defined to reproduce the
distribution of ty in the basic model yet it needs to have a convenient analytical format
Based on the observed data we could estimate the parameters in the auxiliary model
using Maximum Likelihood Method
ɵ
1
arg max log ( | )T
t tt
f y xθ
θ θ=
= sum (11)
The estimated coefficient vectorɵθ could be used as an indicator of certain features of the
observed data
On the other hand the auxiliary model can be estimated based on simulated data from the
basic model as well We need to draw a sequence of random error terms 1 m Tt tε = from the
defined distribution in which m denotes the number of simulation with an interval of [1
M ] generally Given a coefficient vectorβ we could generate the values of endogenous
variables ɶ 1 ( )m T
tty β = which are explicitly dependent onβ With the help of Maximum
Likelihood Method we could get
ɶ ɶ
1 1
( ) arg max log ( ( ) | )M T m
ttm t
f y xθ
θ β β θ= =
= sumsum (12)
According to the principle of indirect inference we try to find the values of β to make
ɶ( )θ β as close toɵθ as possible Practically we need a metric to measure the distance
between ɵθ andɶ( )θ β and by minimizing the distance we could find out the estimates of
β in the basic economic model
29
333 Choices of the metrics
As mentioned above we need a metric to measure the distance betweenɵθ andɶ( )θ β
There are three approaches corresponding to the three classical hypothesis tests namely
Wald likelihood ratio (LR) and Lagrange multiplier (LM)37
In the Wald approach we try to minimize a quadratic form in the difference between the
two estimators ofɵθ andɶ( )θ β which is
ɵ ɶ ɵ ɶarg min( ( )) ( ( ))Wald
Wβ
β θ θ β θ θ β= minus minus (13)
in which W is a positive definite ldquoweightingrdquo matrix
In the LR approach a metric is formed based on the likelihood function related to the
auxiliary model which is
ɵ ɶ
1 1
arg min( log ( | ) log ( | ( )))T TLR
t t t tt t
f y x f y xβ
β θ θ β= =
= minussum sum (14)
According to the definition ofɵθ the first part of the objective function before the minus
sign on the right-hand side is always larger than the second part after the minus sign And
the first part is not dependent onβ
To minimize the objective function is equivalent to maximizing the log-likelihood
function withɶ( )θ β that is
ɶ
1
arg max( log ( | ( )))TLR
t tt
f y xβ
β θ β=
= sum (15)
In the LM approach the metric is formed using the derivative of the log-likelihood
function related to the auxiliary model which is
arg min ( ) ( )LM
S VSβ
β β β= (16)
in which
ɶ ɵ
1 1
( ) log ( ( ) | )M T m
ttm t
S f y xβ β θθ= =
part=partsumsum
(17)
and V is a positive definite matrix
37 Smith A (2008) Indirect Inference
30
By using any of the approaches we aim at getting the minimized distance betweenɵθ and
ɶ( )θ β so the value will approach to zero as expected So the hypothesis test of the
minimized value could be used as an indicator of whether the auxiliary model is suitably
specified In other words the minimized value being significantly different from zero
indicates a bad specification of the auxiliary model
In comparison the LM approach has an advantage over the others in computation when
it is relatively time-consuming to estimate the auxiliary model
334 Consistency Interpretation
Suppose the observed sample size T grows large while total number of simulations stays
fixed as M the estimator based on simulated data ɶ( )θ β will converge to a pseudo-true
value denoted as( )h β which is also dependent onβ This is called binding function
which characterized the relationship between the coefficients in the basic model and the
auxiliary model At the same time the estimator based on observed data ɵθ will converge
to a pseudo-true value0θ In case that T grows to a large number the aim of indirect
inference changes to finding β that guarantees0 ( )hθ β= This could explain that indirect
inference gives consistent estimate of the parameters in the basic economic model
In this project the binding function is what we focus on to get the correct estimates
instead of finding certain metrics Detailed methods will be discussed in the following
part
34 Model Specification in the Thesis
341 Basic Route Choice Model
Based on all the methods mentioned in previous sections the specification of models and
methods we use in the thesis will be explained in this section Since we are to estimate
the model based on true observations no model is known beforehand to adjust to the data
we use Several formulations of the model have been tested in the thesis The one
explained here could be seen as an example and all the other trials contain modifications
based on this model The other specifications of model will be explained along with the
results in the result section
31
We start by describing the underlying route choice model of interest38 We need to define
a road network as a representation of a real-size one from which we collected the trip
data The network denoted asN consists of a set of nodes (vertices) v and links (edges)
l Each link has a source node ( )s l and a target node or a destination node( )d l which
together indicate the direction of the link A path from an origin node ov to a destination
node dv could be seen as a sequence of links1 nl lhellip of which 1( ) os l v= 1( ) ( )i id l s l +=
and ( ) dnd l v= So a path can be defined by the index of links which is 1 nl lπ = hellip
A vector of characteristics denoted aslx is associated to each link as well as a strictly
positive cost function( )l lic x ε β in which liε is an individual specific random link cost
with i denoting the individual and β is a vector of coefficients of the link characteristics
left to be estimated In the Indirect Inference context we need an auxiliary model with
easily-estimated analytical form yet there is no such requirement for the basic model
Although not necessary we assume that the cost function has a linear deterministic form
the deterministic part and the random part are additively separable So we have the cost
function as
( ) Tl li l lic x xε β β ε= + (18)
In addition one important assumption is that the link cost is additive which means that
the cost of a path can be attained by the sum of all the link costs along the path This way
we have the cost of a path π as
( ) ( )l lil
C c xπ
π ε βisin
=sum (19)
We focus on the path-based model which means that the individuals choose among all
possible paths As defined above this turns out to be a random utility choice model As
indicated by the standard assumptions of this kind of models choice makers are assumed
to know both the link characteristics and their idiosyncratic random utility liε associated
to each link Since the choice makers maximize their utility this means that they will
choose the path with the lowest generalized cost in this model This way we have the
choice of individual i as
38 Karlstroumlm A Sundberg M amp Wang Q (2011) Consistently estimating flexible route choice models using an MNL lense
32
( )
arg min ( )o di i
iv v
Cπ
π πisinΩ
= (20)
in which oiv denotes the origin point of the trip for individual i and d
iv denotes the
destination ( )o di iv vΩ denotes all possible paths connecting the origin and destination in
the network for individual i which forms the choice set for the individual
When implementing the model we assume that the random utility component liε follows
a truncated normal distribution To be specific liε follows a standard normal distribution
yet with only the positive values retrieved This way we could guarantee that the link
costs are always positive so that additively the path would not have infinite loops With
this feature of the random component we could say that our model is probit-like Based
on this assumption the prerequisite of Dijkstrarsquos Algorithm is satisfied which always
needs positive edge values on the network We can use the Dijkstrarsquos Algorithm to find
the shortest paths iπ as an intermediate step in the implementation Apart from this we
assume that the unobserved cost captured by the random term is proportional to the
length of link To embody this in the cost function we add a fixed scale parameter to the
random term with a form of ( )Length l Lengthx Mean x in which ( )LengthMean x is the average
length of links in the network
We will assume that the data consists of J paths as dependent variables which means
that the dependent variables for the choice model are 1 Ji iy π == In addition the observed
characteristics of links in the network are provided 1 Ll lx x == To be specific we choose
to use two attributes of the links namely the length of the links Lengthx and the dummy
variable indicating the presence of speed bumps on the links SBx The cost function then
is specified as
( ) ( )l li Length Length l SB SB l li Length l Lengthc x x x x Mean xε β β ε= + + sdot (21)
Now the objective is to estimate the parametersβ in the model for which we will make
use of an auxiliary model
33
342 Auxiliary Model
Based on the idea of Indirect Inference we treat the route choice model defined above as
the basic model of interest which might have complex formation and be difficult to
estimate directly Then we need an auxiliary model to form a criterion which takes into
certain aspects of data to focus the analysis The auxiliary model needs not to reflect the
data generating process exactly as in the basic model yet it needs to include attributes of
interest in order for reference and to be easy to estimate We choose to use a logit model
for route choice as the auxiliary model since the logit model has always been a useful
tool for discrete choice analysis thanks to its analytical form and there is software for
estimating logit models which ensures that we can estimate very efficiently
As to the auxiliary model it is chosen to be a logit model for route choice We consider
that each individual i is choosing from a set of alternative routesr Each route r is given
a utility of riU
- Tri r ri r riU V Xε θ ε= + = + (22)
in which θ is the vector of auxiliary parameters which gives inference to the parameters
in the basic model One thing to be mentioned is that as expected the coefficients in the
utility function should have negative signs To make it easier for comparison with the
coefficients in the basic route choice model we assume the sign of θ to be positive per
se and add a negative sign ahead of it to guarantee that the coefficient part is negative as a
whole rX denotes route characteristics and riε is the random utility for each individual
which is assumed to follow an iid (independently identically distributed) Gumbel
distribution following the standard assumption of logit models
Note that as required for the auxiliary model it should be flexible enough to capture the
variability in the data and thus contains no fewer attributes than the basic model39 In
order to infer the parameters in the basic model and in consideration of efficiency we
pick the same attributes of interest in the basic models which are the link length Lengthx
and the speed bump dummy variableSBx So the utility function turns out to be
- -ri Length Length r SB SB r riU x xθ θ ε= + (23)
39 Karlstroumlm A Sundberg M amp Wang Q (2011) Consistently estimating flexible route choice models using an MNL lense
34
The probability of individual i choosing path r given an individual specific choice set
( )iI o d is
( )
ri
si
i
V
ri V
s I o d
eP
eisin
=sum
(24)
Theoretically we allow the individuals to choose from all possible paths between the
origin and destination in the network which intuitively could be infinite and impossible
to enumerate When implementing the model we generate the individual choice set based
on the basic route choice model Through simulation of the basic model we generate
infinite unique shortest paths for all the unique OD pairs by redrawing the random link
cost liε Without loss of generality the number of paths generated would be big enough
with fully consideration of efficiency We name the finite choice set composed by the
shortest paths generated as the pseudo-universal choice set ( )I o d which is a sample of
the infinite universal choice set The individual specific choice sets are generated by
randomly drawing certain number of paths out of the pseudo-universal choice set And
the size of individual specific choice set could be equal to or smaller than that of the
pseudo-universal one
The resulting individual specific choice set ( )iI o d describes a finite subset of all possible
paths connecting the origin oand destinationd for individuali When implementing the
methods the way of generating the choice set ( )iI o d for each individual i is viewed as
part of the auxiliary model
After the auxiliary model is built it could be estimated using a Maximum Likelihood
estimator based on the observed data of individual choices y and attributes variablesx
for individual 1 i N= hellip The estimate of parameters in the auxiliary model is
ɵ arg max ( )L y xθ
θ θ= (25)
in which ( )L y x θ is the log-likelihood function for the auxiliary model
Given the data of the link attributes xand some random draws of structural parameters
mβ 1 m M= hellip we can simulate choice data through the basic route choice model With
M draws of β from some given density we could simulate M sets of data resulting in
35
simulated choicesɶ( )my β Same as before parameters θ in the auxiliary model can be
estimated based on the simulated data as
ɶ ɶ( ) arg max ( ( ) )m m mL y xθ
θ β β θ= (26)
As the process indicated the simulated choice data depends on the structural parameterβ
in the basic route choice model and in sequence the estimates of parameters θ in the
auxiliary model depends on β when estimated based on the simulated data Based on
this theoretically we have a relationship of ( )θ β referred to as the binding function in
indirect inference literatures which we will discuss in detail for implementation of model
in this thesis A metric is then chosen to measure the distance between the observed and
simulated data viewed by the auxiliary model as a way to indirectly infer the values of
parameters β in the basic model To be specific for each draw of the structural parameter
mβ we can get the estimates of ɶ ( )m mθ β based on the simulated data and the distance
between ɶ ( )m mθ β and ɵθ measured by the chosen metric By doing more iteration with the
aim of minimizing the distance we will get the value of mβ which spurs the ɶ ( )m mθ β
closest toɵθ and this mβ is the inferred estimates of the parameter in the basic model
343 Consistency Discussion
The process of indirectly estimating parameters in the basic model is described above yet
we need to know whether the method we provide gives consistent estimation Here are
some discussions explaining the consistency in estimating by which consistency of the
estimator we proposed is illustrated
As proved the multinomial logit model (MNL) can be estimated consistently based on a
subset of alternatives (McFadden 1978)40 We may need to use the classical conditional
maximum likelihood estimator to deal with the problem at the same time the probability
that an individual n chooses an alternative i conditional on the subset of alternatives
denoted asnc becomes the conditional probability
40 McFadden D (1978) Modeling the Choice of Residential Location In A Karlqvist L Lundqvist F Snickars amp J Weibull (Ed) Spatial Interaction Theory and Residential Location (pp 75-96) Amsterdam North-Holland
36
ln ( | )
ln ( | )( | )in n
jn n
n
V q c i
n V q c j
j c
eP i c
e
micro
micro
+
+
isin
=sum
(27)
in which micro is a scale parameter and inV is the deterministic part of the utility There is a
term ln ( | )nq c j for correcting the sampling bias in which ( | )nq c j denotes the probability
of sampling nc given that alternative j is chosen
If all the alternatives in the choice set have the same probability to be chosen into the
subset the estimation on the subset of alternatives is equivalent to that on the full choice
set To be specific in this case ( | )nq c i is equal to ( | )n nq c j j cforall isin so by calculation the
term for sampling bias correction will cancel out in the probability function
In route choice context the alternative paths between an origin and a destination may be
in large amount and it is inefficient to give some very long-distance paths the same
probability as those short and attractive ones This means that we may need the
importance sampling method when generating subsets of alternatives which selects
attractive alternatives with higher probability than unattractive ones And the correction
term does not cancel out in this case Note that if alternative specific constants are
estimated we can get unbiased estimates of all the parameters except the constants even
if the correction term is not included in the utility function (Manski amp Lerman 1977)41
Back to the route choice context we tend to use large number of alternatives even with
subset of the full choice set which means that it is generally impossible to estimate the
constants and thus the correction term is essential To solve this problem Frejinger et al
(2009) developed a sampling approach in the context of route choice42
The discussion above focuses on the usage of MNL for route choice modeling When it
comes to our method the individual specific choice set is generated by randomly drawing
alternatives from the pseudo-universal choice set with the same probability yet there is
bias when generating the pseudo-universal ones since the pseudo-universal choice set is
composed of certain number of shortest paths between two nodes and this generating
process gives some paths higher probability to be included into the choice set So we
41 Manski C amp Lerman S (1977) The Estimation of Choice Probabilities from Choice Based Samples Econometrica 45 (8) 1977-1988 42 Frejinger E Bierlaire M amp Ben-Akiva M (2009) Sampling of Alternatives for Route Choice Modeling
37
actually use importance sampling to get the choice set which may consequently
introduce bias in estimating the parameterθ in the auxiliary model as discussed above
With the idea of indirect inference we consider only the relationship between θ andβ
denoted as( )θ β and use this relation to infer the value ofβ From this point of view
whether θ is estimated with bias or not does not matter since the relation between it and
β could always be captured which is the specific thing we focus on using the method of
indirect inference So we can say that even with biased subset of alternatives we could
still get consistent estimation by using indirect inference
344 Binding Function
As discussed in indirect inference method section when the sample size N increases
which means that we have more observations of choice the estimated parameter in the
auxiliary modelɶ ( )m mθ β will converge to a stable value ( )mθ β which is often referred
to as the binding function
Given that route choice model deals with discrete choices and by using indirect inference
we have a discrete choice model as the auxiliary model as well the estimates of binding
function ( )mθ β will inherit the discontinuous feature due to discrete individual choices
ɶ( )my β Keane and Smith (2003) proposed a solution of using logit-smoothing on the
simulated dependent choice data43 Following this idea we assume a continuous binding
functionɶ( )θ β for simplicity which could be approximated by a linear function locally
within small intervals With the M randomly drawn values of mβ and the corresponding
estimated parameters ɶ ( )m mθ β in the auxiliary model we could perform an Ordinary
Least Square (OLS) regression to estimate the local approximation of binding function
ɶ( ) c Dθ β β= + (28)
in which cdenotes the constant vector and D denotes the OLS parameter matrix44 To be
specific in our case each parameter in the auxiliary model will have a restriction
function with regard to both parameters in the basic model which is
43 Keane M amp Smith A (2003) Generalized Indirect Inference for Discrete Choice Models 44 Karlstroumlm A Sundberg M amp Wang Q (2011) Consistently estimating flexible route choice models using an MNL lense
38
ɶ1 11 12( )Length Length SBc d dθ β β β= + +
(29)
ɶ2 21 22( )SB Length SBc d dθ β β β= + +
(30)
Based on the observed data of choices y and explanatory variables xand the estimated
binding function which indicates the restrictions between ɶθ andβ we could use the
maximum likelihood method to give estimation of the parameters of interest The
likelihood ratio approach to indirect inference is following ideas of Smith (1993)45 and
Keane and Smith (2003)46
ɶ=arg max ( ( ))L y xβ
β θ β (31)
in which β is the estimate of the parameter of interest β in the basic economic model
With the restriction of binding function this is actually an indirectly inferred estimate In
line with the estimating process in auxiliary model ( )L sdot is the likelihood function of the
auxiliary model
Note that the form of binding function is based on an assumption in the result part we
will verify that this assumption is realistic
45 Smith A (1993) Estimating Nonlinear Time-series Models Using Simulated Vector Autoregressions 46 Keane M amp Smith A (2003) Generalized Indirect Inference for Discrete Choice Models
39
4 Data
41 Road Network
The data we use for estimation is based on a GPS data set collected in the Swedish city of
Borlaumlnge Borlaumlnge is located in the middle part of Sweden and has a population of about
47 000 inhabitants
The virtual road network contains 3077 nodes and 7459 unidirectional links (Frejinger amp
Bierlaire 2007)47 of which 3061 nodes and 7288 links are included in the network for
estimation Figure 3 gives a visual illustration of the road network in Borlaumlnge
Figure 3 Illustration of the Borlaumlnge road network
With regard to our research two of the link attributes are included namely link length
and speed bump dummy Link length is in the unit of km and speed bump dummy is an
indication of speed bump existence on the links which has the value 1 when there is a
speed bump on the link and 0 otherwise
Link length
47 Frejinger E amp Bierlaire M (2007) Capturing Correlation with Subnetworks in Route Choice Models
40
Some descriptive statistics of the link length data for the whole network is presented in
Table 1 below
Table 1 Descriptive statistics of link length
Number of links 7288
Minimum 0001
Maximum 7599
Mean 0184487
Median 0102
Variance 0103722
Lexis ratio (varmean) 1016884
Skewness 9871144
To describe the overall character of the link length attribute the histogram is shown in
Figure 4 below
Figure 4 Histogram of link length data
We could see that the link length data is quite clustered most of which lies within the
range of 01km and 06km Nonetheless there are some extreme values far away from the
range indicating extremely long links To display the variation in the relatively clustered
area we draw a histogram zoomed in the interval of (0 1km] shown Figure 5 in below
0
01
02
03
04
05
06
Fre
qu
en
cy
Link length (km)
Histogram
41
Figure 5 Histogram of link length data (zoomed within 1km)
Over 80 of all the links have length shorter than 03 km indicating concentration of
link length data
Speed bump dummy
Speed bump dummy is based on true situation in the network Of all the links 82 links
are equipped with speed bumps which account for a percentage of 113 The following
Figure 6 displays the locations of links with speed bumps
Figure 6 Illustration of links with speed bumps
0005
01015
02025
03035
04045
05
Fre
qu
en
cy
Link length (km)
Histogram(zoom in)
42
42 Observation Data
The GPS data set is collected as a part of the Swedish Intelligent Speed Adaptation (ISA)
study which aims at traffic safety effects of in-car information systems In the study 186
vehicles were equipped with GPS devices and traced within a radius of 25 km from the
center of Borlaumlnge The monitoring lasted for 30 days from 22th June 2000 to 4th March
2002 obtaining 49 667 vehicle days of travel and nearly a quarter of a million trips (for
more information on the GPS data set check Axhausen Schoumlnfelder Wolf Oliveira amp
Samaga 2003 Schoumlnfelder amp Samaga 2003 Schoumlnfelder Axhausen Antille amp Bierlaire
2002)48
The data collection is not originally designed for route choice analysis so the raw data
cannot be used in our research directly Extensive data processing is performed by the
company GeoStats in Atlanta to retrieve new data set available for route choice analysis
which contains 24 vehicles and 16 035 observations The final data set we use is provided
by Emma Frejinger which contains in total 1832 observations corresponding to 1458
observed unique routes made by 24 vehicles and 1409 unique origin-destination pairs
Considering that certain route may have been observed more than once we make a
distinction between observations and unique routes and number of unique routes should
be less than that of observations consistently with the numbers listed above
As indicated by data collection in the ISA study only licensed drivers with access to his
or her only car are recruited to minimize sharing or swapping of cars Minimum socio-
economic data of the drivers is included in data collection so we have no way to
understand driver characteristics from the data set Logically we make an assumption
that there is only one individual per vehicle
In the observation data a route is represented by a series of links and also an origin-
destination pair With relatively intensively distributed link length number of links could
48 Axhausen K Schoumlnfelder S Wolf J Oliveira M amp Samaga U (2003) 80 Weeks of GPS Traces Approaches to Enriching the Trip Information Transportation Research Record 1870 46-54 Schoumlnfelder S amp Samaga U (2003) Where Do You Want to Go Today-More Observations on Daily Mobility Third Swiss Transport Research Conference Ascona Schoumlnfelder S Axhausen K Antille N amp Bierlaire M (2002) Exploring the Potentials of Automatically Collected GPS Data for Travel Behaviour Analysis- A Swedish Data Source In J Moumlltgen amp A Wytzisk (Ed) GI-Technologien fuumlr Verkehr und Logistik number 13 Institut fuumlr Geoinformatik Universitaumlt Muumlnster (pp 155-179) Munster IfGIprints
43
be used to indicate total length of routes Some of the descriptive statistics of link number
is shown in Table 2 below
Table 2 Descriptive statistics of link numbers in observation data set
Number of observations 1832
Minimum 5
Maximum 106
Mean 202877
Median 16
Variance 1871968
Lexis ratio (varmean) 9227126
Skewness 1732597
For further overall inspection of link number distribution in the observation data set the
histogram is shown in Figure 7 below
Figure 7 Histogram of link numbers in observations data set
Seen from the histogram distribution of number of links is relatively dispersed with a
large range interval Judging by the statistics in general the routes observed have about
000
200
400
600
800
1000
1200
1400
1600
5 8
11
14
17
20
23
26
29
32
35
38
41
44
47
50
53
56
59
62
65
68
71
74
77
80
83
86
89
92
95
98
10
1
10
4
10
7
Mo
re
Fre
qu
en
cy
Number of links
Histogram
44
20 links in average Yet the data has a big variance which is reasonable As stated above
there are 1409 unique OD pairs for 1832 observations indicating that for most OD pairs
there is only one observation Spread within the detecting area different OD pairs could
have various numbers of links in between
Following our experiment design only a portion of the data could be used To be specific
routes with number of links fewer than ten would be eliminated when used for estimation
43 Further Exploration of data
Apart from the characters discussed above there are some other attributes in the data set
interesting to be explored Both in link attribute data set and observation data set there is
travel time data which to some extent is parallel with length in indicating distance
between two nodes
In the link attribute data set one attribute is denotes the estimated travel time of links in
unit of hour Some of the descriptive statistics is shown in Table 3 below switching unit
to minute
Table 3 Descriptive statistics of estimated travel time on links
Number of links 7288
Minimum 000186
Maximum 578268
Mean 0281696
Median 018744
Variance 0119337
Lexis ratio (varmean) 0423638
Skewness 5785361
Seen from Table 3 estimated travel time seems to have a more clustered distribution than
link length judging by lexis ratio and skewness Yet this time is roughly estimated not so
qualified as link length to use in estimation since the latter is much easier to measure and
guarantee precision
In the observation data set we have the duration time of the observations in the unit of
minute Some of the descriptive statistics is shown in Table 4 below
45
Table 4 Descriptive statistics of duration of trips
Number of observations 1832
Minimum 007
Maximum 316
Mean 4991195
Median 3925
Variance 1775639
Lexis ratio (varmean) 3557542
Skewness 2174728
Duration of trips can be used as an indication of distance between origin and destination
yet it is roughly measured and strongly affected by traffic condition on the road network
With similar reasons as discussed on estimated travel time on link we use number of
links instead of duration of trips to indicate the distance between OD pairs
46
5 Experiment Design
When doing the simulation-based estimation it is physically divided into two parts for
convenience of operation As discussed in the method section we choose to use a pseudo-
universal choice set which is generated and stored in the first part and ready for use in
the following experiment Then in the second part we do the simulation-based
experiment to carry out indirect inference method for estimating the parameters of
interest in the basic model β to be specific The Figure 8 below illustrates an abstracted
flow of how the estimation is carried out given certain origin-destination pair
Figure 8 Illustration of the flow in the experiment
As shown in the flow chart we get all the unique OD pairs in the trip data For each of
the OD pairs the Dijkstrarsquos algorithm is used to find the shortest paths between them
without duplicates We set the intended number of paths to be 400 as well as time
terminator in case not enough paths could be generated within certain bearable time
47
interval The generated paths form the pseudo-universal choice set of each OD pair
which is stored for future use Note that we abandon some OD pairs with too few paths
in the pseudo-universal choice set Observations containing the kept OD pairs are used
for following estimation which turns out to be 940 of them
For the OD pair in a given observation 200 alternatives are randomly drawn from the
pseudo-universal choice set and the sequential links in the observation itself is read as an
alternative path The 201 paths compose the observed choice set On the other hand a
given value of mβ is drawn from a predefined domainD The shortest path is generated
based on the given mβ as the simulated observation Like in the observed choice set part
200 alternatives are randomly drawn from the pseudo-universal choice set to form the
simulated choice set together with the simulated observation The auxiliary model is
estimated based on the simulated choice set and we could get a set of ɶ( ( ))mm mβ θ β pairs
which will be used to estimate the binding function Based on the binding function and
the observed choice set the parameters in the basic model could be indirectly estimated
The process described above is abstracted with no illustration of iterations Since this is
an experiment based on simulations certain loops of iteration should be carried out to get
statistics of the results
Given observed trip data at first we have no idea of the value of β In the process of
retrieving value ofβ the estimation process is repeated for several stages denoted asS
starting from a rough guess of the domainsD while for each following stage the domain
shrinks Since we tend to use a local OLS regression to approximate the smooth binding
function the draws of smβ need to be around the true value to prevent misspecification of
OLS regression due to the possibly inherent nonlinearity of the binding function The
estimated 0
β is not satisfactory in precision in the first stage yet it could give a hint of
where the true value lies The domain1D is centered on 0
β with smaller interval before
the estimation in the second stage This way +1sD is dependent on sD with smaller
interval As it goes on we will get a more accurate domain and as a result a well specified
OLS regression to approximate the binding function
48
The process of experiment with iterations is described below Suppose that we have the
experiment carried out for K times and the number of observations used isN
for run 1 k K= hellip for true observation 1 i N= hellip
Randomly draw alternatives from the pseudo-universal choice set end Form the observed choice sety for stage 1 s S= hellip
for 1 m M= hellip
Draw ksmβ from the domain ksD
Simulate paths for OD pairs in the used observations with mβ
for simulated observation 1 i N= hellip Randomly draw alternatives from the pseudo-universal choice set end
Form a simulated route choice setɶ( )ksmy β
Estimate ɶ ( )ks ksm mθ β in Equation (26)
end
Estimate ɶ ( )ks
θ β in Equation (28)
Estimate ks
β in Equation (31) end
Center the domain 1k sD + on ks
β and shrink the interval end
As a trial we first do the experiment on a route choice model with one parameter link
length to be specific For simplicity the random term is not scaled as described in the
model specification section which means we attach a truncated normally distributed
random term to the cost function without scaling it with link length After getting the
estimation of Lengthβ we move on to estimating the route choice model with both
parameters as described in the model specification Results under these two formulations
of models are presented separately in the result part
49
6 Results
61 Validation of Binding Function
As discussed in the binding function section we assume the binding function to be
continuous and feasible to be approximated by a linear function locally The assumption
of binding function can be verified based on the ɶ( ( ))mm mβ θ β pairs we attained as
intermediate results To explain this more explicitly we carry out a simple example with
only one parameter in the route choice model Lengthβ to be specific
The cost function is specified as
( )l li Length Length l lic x xε β ε= + (32)
corresponding to which the auxiliary model is
-ri Length Length r riU xθ ε= + (33)
For each run 10 values ofLengthβ are evenly drawn from a given domain By simulating
observations and estimating the auxiliary model 10 corresponding Lengthθ are generated to
form ten ɶ( ( ))mm mβ θ β pairs As assumed the binding functionɶ( )θ β is continuous which
could be approximated by a linear function locally To display the trend of binding
function we choose a relatively large domain for Lengthβ in the beginning [010]D = and
carry out 10 runs which generate 100 points in the beta-theta diagram shown in Figure 9
below
Figure 9 Scatter plots of the 90 beta-theta pairs
y = 12804x + 16264
Rsup2 = 09959
0
2
4
6
8
10
12
14
16
0 2 4 6 8 10
the
ta_
len
gth
beta_length
50
We do OLS regression for the dots and estimate the binding function Intuitively the
smaller the domain is the more accurate is the approximation of the binding function We
shrink the input domain based on the final estimate of Lengthβ from last trial
As it turned out to be we choose an input domain of [1214]D = for Lengthβ and the
binding function is assumed to take the form of
ɶ1 11( )Length Lengthc dθ β β= +
(34)
The result for one run is displayed in Figure 10 below
Figure 10 OLS regression based on the 10 beta-theta points from one run
The estimated binding function based on the 10 points is
ɶ ( ) 17371+10838Length Lengthθ β β= (35)
as indicated by 2 09783R = the function describes the trend of points very well Since
the interval is quite small we could use the estimated function to approximate the
binding function
When it comes to more parameters in the route choice model what we do is simply to
add more elements in the binding function After getting a vector of β and the
corresponding vector ofɶ( )θ β binding functions of each element in vector ɶ( )θ β with
y = 17371x + 10838
Rsup2 = 09783
315
32
325
33
335
34
345
35
355
12 125 13 135 14
the
ta_
len
gth
beta_length
51
regard to all the elements in vector β are estimated One example is shown in the
Equation (29) and Equation (30)
62 Estimation of model with one attribute
The route choice model with one attribute we used is the one described in Section 61
above After several trials by shrinking input interval every time we finally affirm that
the true value Lengthβ of lies in a relatively small interval of [12 14] Based on this
domain 50K = runs are carried out to get statistics of the estimate of Lengthβ As
discussed in the experimental design several stages Smean different trials before final
affirmation of input interval yet for the statistics only one stage is carried out for each
run Within each run 10M = values of input Lengthβ are drawn for estimating binding
function
The estimation statistics of Lengthβ is shown in Table 5 below
Table 5 Statistics of estimation of beta_length
Parameter Lengthβ
Mean 1337353
Standard deviation 0107537
RMSE 0013227
In the table RMSE is the root-mean-square error which is used to measure the distances
between the observed values being estimated and the predicted values by the estimator
The individual differences are called residuals and RMSE is an aggregated measure of
the residuals To be specific
ɵ ɵ ɵ 2( ) ( ) (( ) )RMSE MSE Eθ θ θ θ= = minus (36)
in which ɵθ is the estimator and θ is the parameter to be estimated so the RMSE is the
square root of the mean square error As defined the smaller the value of RMSE is the
better the estimator is
52
Here the RMSE is calculated based on the ten points ɶ( ( ))mm mβ θ β for estimating binding
function so basically it describes the goodness of fit of the estimated binding function
with regard to the points we generated The Equation (36) is specified as
ɶ 2( ( )) (( ( ) ( )) )mm m mRMSE Meanθ β θ β θ β= minus (37)
The value of RMSE displayed in the Table 5 is the mean value of all the RMSE values
for 50 runs Seen from this we have well-estimated binding function for all the 50 runs
on average In terms of the estimates of binding function taking the one in Section 61 as
an example the binding function estimated in the interval of [12 14] in Equation (35)
has a positive constant and a positive coefficient for Lengthβ which indicates that with
larger value of Lengthβ we will get larger value ofɶ Lengthθ and as a result a negative
coefficient for length in the utility function of the logit model This is reasonable for
bigger Lengthβ reveals larger incremental effect on the cost of certain path while lower
ɶ- Lengthθ reveals larger disutility effect on certain path these two effects are in fact
equivalent
By the way the high fitness of binding function is probably due to the relatively small
input interval of Lengthβ after certain trials and shrinkage As the final estimate indicates
Lengthβ falls right into the interval of [12 14] with small standard deviation So we can
say that the estimate is quite good
63 Estimation of model with two attributes
We use the model described in the model specification section to carry out the estimation
Two attributes are used namely length and speed bump dummy Similar to the one
attribute case we carried out several trials and shrinkage to finally determine the
relatively small input intervals forLengthβ and SBβ [05 1] and [0 05] respectively
50K = runs are carried out to get statistics of the estimates of the two parameters Within
each run 10M = values are drawn for inputs Lengthβ and SBβ respectively for estimating
binding function
53
One important thing to mention here is that the inputs are drawn evenly from the domain
yet to guarantee that the values of Lengthβ and SBβ are independent from each other or to
get rid of collinearity49 the domains of two parameters are defined in two dimensions To
explain this more explicitly we choose data of one run as an example The input points of
( Lengthβ SBβ ) are shown in Figure 11 below
Figure 11 Scatter plot of the input values for beta_length and beta_sb
We can see from Figure 11 that the points spread evenly in the domain quadrant Based
on these draws we could estimate the binding function and evaluate the relationship
between parameters in the logit model and Lengthβ and SBβ without worrying about
possible correlation between Lengthβ and SBβ
As discussed before in the binding function we are supposed to find the relationship
between each of the parameters in the logit model and both parameters in the route choice
model Mathematically this binding function should be a surface in the 3D coordinate
system We take the results of one run as an example and thus we have ten sets of Lengthβ
and SBβ along with corresponding ɶ Lengthθ andɶ SBθ
49 A set of points is collinear if they lie on a single straight line or a projective line (for example projective line over any field) and this way the two factors represented by the points are correlated
0
005
01
015
02
025
03
035
04
045
05
05 06 07 08 09 1
be
ta_
sb
beta_length
54
For the first binding function ɶ Lengthθ and ( Lengthβ SBβ ) are plotted in Figure 12 below
And the binding function takes a form as described in Equation (29)
Figure 12 Scatter plot of theta_length with regard to beta_length and beta_sb
By multi-linear regression we can get a surface to approximate the binding function
locally The estimated binding function is displayed in Figure 13 below
Figure 13 Display of the estimated binding function for theta_length
And the first binding function has a formula of
55
ɶ 18234+16933 +00633Length Length SBθ β β= (38)
For the second binding function ɶSBθ and ( Lengthβ SBβ ) are plotted in Figure 14 below
And the binding function takes a form as described in Equation (30)
Figure 14 Scatter plot of theta_sb with regard to beta_length and beta_sb
By multi-linear regression we can get a surface to approximate the binding function
locally The estimated binding function is displayed in Figure 15 below
Figure 15 Display of the estimated binding function for theta_sb
56
And the second binding function has a formula of
ɶ -06698+00371 +17619SB Length SBθ β β= (39)
The t-test of estimated parameters in the binding function is carried out with null
hypothesis of zero Estimates that are significantly different from zero with 95
confidence interval are marked as bold
Table 6 Estimated coefficients of binding function for model with two attributes
Constant Lengthβ SBβ
ɶLengthθ 18234
(43632) 16933
(33481) 00633 (1392)
ɶSBθ -06698
(-7991) 00371 (0366)
17619 (19323)
Seen from the magnitude of coefficients in the binding functions both Lengthβ and SBβ
have positive effect on ɶ Lengthθ andɶ SBθ and in sequence negative effect on the coefficients
in the logit model In addition coefficients of SBβ with regard to ɶ Lengthθ and Lengthβ with
regard to ɶ SBθ are not significantly different from zero so we can say Lengthβ has a more
apparent effect on ɶ Lengthθ than SBβ does while SBβ has a more apparent effect on ɶ SBθ
than Lengthβ does
Based on the estimated binding functions and the true observation data we could get the
estimates of Lengthβ and SBβ as shown in Table 7 below
Table 7 Statistics of estimation of beta_length and beta_sb
Parameter Lengthβ
SBβ
Mean 0761383 0079874
Standard deviation 0068493 0034375
RMSE 0022772 0085113
Seen from the RMSE results the relatively small values indicate that we have well-
estimated binding functions for all the 50 runs on average With regard to the estimates of
parameters in the route choice model both of them fall into the input domain we choose
57
and the standard deviation is quite small So we can say that the estimates are actually
very good
One thing to notice here is that the final estimate of Lengthβ falls approximately in the
middle of the input domain [05 1] while the estimate of SBβ falls closer to the left limit
which might need further shrinkage of input domain and more precise estimate of the
binding function To get rid of this we use the binding function estimate from all the 500
points to give a hint on the reasonability of acceptance of the estimate of SBβ The scatter
plots of theta_sb against beta_sb and beta_length are shown in Figure 16 below
Figure 16 Scatter plots of theta_sb against beta_sb and beta_length
The scatter plots in Figure 16 above are the decompositions of the binding function from
three dimensions to two dimensions Seen from the linear regression in the two plots ɶSBθ
is almost strictly positive proportional to SBβ and hardly effected byLengthβ This means
y = 19132x - 06404
Rsup2 = 0936
-1
-08
-06
-04
-02
0
02
04
06
0 01 02 03 04 05
the
ta_
sb
beta_sb
y = 00123x - 01717
Rsup2 = 4E-05
-1
-08
-06
-04
-02
0
02
04
06
05 06 07 08 09 1
the
ta_
sb
beta_length
58
that by shrinking the input domain ofSBβ we would probably get the same estimate of
binding function since it changes little in current domain And this leads to our
acceptance of the final estimate of SBβ
Given that we have a random cost following a truncated standard normal distribution and
the magnitudes of the estimated parameters are relatively small this would mean that the
randomness of the cost function are relatively large which in sequence leads to relatively
large randomness in individualrsquos choice of route
Another thing to be mentioned is that the magnitude of Lengthβ is smaller than that when
estimated singly Though these two values are not logically comparable with different
formation of random term in the cost function we could still get a hint from the
comparison This difference is probably due to the form of random cost we used which is
( )li Length l Lengthx E xε sdot and the effect of length on the cost is partially captured by this
random term
64 Estimations of other trial formulations of the model
641 Model with exponential form of cost function
During the process of estimation we carried out a lot of other trials in the formulations of
the basic route choice model the cost function to be specific and the auxiliary logit model
As it turned out the there are negative estimates of coefficients in the cost function
which conflicts our anticipation To capture this kind of negative estimation we choose to
use the exponential form of the cost function Without loss of generality the random term
is not scaled by the length of links The cost function is specified as
( ) Length Length l SB SB l lix x
i lic x eβ β εε + += (40)
Two attributes are used namely length and speed bump dummy variable Unlike the form
in Section 63 we allow the parameters Lengthβ and SBβ to have negative input and the
random term liε now follow a standard normal distribution without truncation Since we
take the exponential form of the cost function the cost of links could be kept positive
thus allowing the use of Dijkstrarsquos Algorithm to operate
59
In terms of the auxiliary model since we could have more attributes in the auxiliary
model than the underlying model Instead of using the same attributes as in the cost
function we choose to add an attributes which is number of links in the pathLNx So the
utility function of the logit model is specified as
- - -ri Length Length r SB SB r LN LN r riU x x xθ θ θ ε= + (41)
We still expect the value of θ to be positive and the coefficient of variables with the form
of -θ would be negative
Several trials and shrinkage were carried out for this formulation of our model to finally
determine the relatively small input intervals forLengthβ and SBβ [25 27] and [-05 0]
respectively 15K = runs are carried out to get statistics of the estimates of the two
parameters Within each run 10M = values are drawn for inputs Lengthβ and SBβ
respectively for estimating binding function
To visualize the trend of binding function more clearly we make use all the 150 sets of
vector β and vector θ to estimate the binding function Since we have three variables in
the logit model we have to estimate three binding functions
For the first binding function ɶ Lengthθ and ( Lengthβ SBβ ) are plotted in Figure 17 below
shown along with the estimated binding function
Figure 17 Scatter plot of theta_length against beta_length and beta_sb estimated binding function
The first binding function takes the form of
ɶ 41312+09114 +44845 10Length Length SBθ β βminus= sdot (42)
60
For the second binding function ɶSBθ and ( Lengthβ SBβ ) are plotted in Figure 18 below
shown along with the estimated binding function
Figure 18 Scatter plot of theta_sb against beta_length and beta_sb estimated binding function
The second binding function takes the form of
ɶ 01147 01362 +07119SB Length SBθ β β= minus (43)
For the third binding function ɶ LNθ and ( Lengthβ SBβ ) are plotted in Figure 19 below
shown along with the estimated binding function
Figure 19 Scatter plot of theta_ln against beta_length and beta_sb estimated binding function
The third binding function takes the form of
ɶ 10043 03378 +00068LN Length SBθ β β= minus (44)
The t-test of estimated parameters in the binding function is carried out with null
hypothesis of zero Estimates that are significantly different from zero with 95
confidence interval are marked as bold
61
Table 8 Estimated coefficients of binding functions for model with exponential cost function
Constant Lengthβ SBβ
ɶLengthθ 1312
(2411) 09114 (4360)
4484510-4 (0005)
ɶSBθ 01147
(0425) -01362 (-1314)
07119 (17221)
ɶLNθ 10043
(13767) -03378
(-12051) 00068 (0607)
Same as in the model with two attributes ɶ Lengthθ andɶ SBθ are significantly affected by
Lengthβ and SBβ respectively The negative signs for Lengthβ in the second and third binding
functions draw our attention Since in the second binding function it is not significantly
different from zero we can disregard the effect In the third binding function Lengthβ has
significantly negative effect on ɶ LNθ The larger value of Lengthβ we have the more
influential of path length on cost is With negative effect on ɶ LNθ we can say at the same
time number of links become less influential on the utility This is reasonable since
intuitively if we are sensitive to the path length we wouldnrsquot care too much of having to
switch several more or fewer links based on that path length and number of links are
more or less correlated to each other
Based on the estimated binding functions and the true observation data we could get the
estimates of Lengthβ and SBβ as shown in Table 9 below
Table 9 Statistics of estimation of beta_length and beta_sb in exponential-cost-function model
Parameter Lengthβ
SBβ
Mean 2537672 -045601
Standard deviation 0068377 0133036
We have negative estimate of SBβ which conflicts our assumption that length and
presence of speed bump on the path may increase the cost of traveling through certain
path This is probably due to omission of important attributes in the deterministic part of
the cost function Based on the estimate we are led to think that presence of speed bump
decrease the cost and individuals would prefer to drive on paths with speed bumps Yet
62
this is not true based on our estimation since we are only using two attributes And there
are great chance that some important features are not captured which accidentally are
related with speed bump So the estimate of SBβ is misleading per se in the simple model
as we are using To get more accurate estimate of SBβ we may need to include more
variables in the deterministic part of the cost function
642 Model with estimated scale parameter for random term
Considering the trial with two attributes in Section 63 we add a fixed scale parameter to
the random term to make it proportional to the length of links This appeals to our
assumption yet lays restrictions to the model Apart from this we also try to add an
unfixed scale parameter σ and estimate it along with the other two parameters Lengthβ and
SBβ Note that if we add a scale parameter directly to the random term it wonrsquot work out
as we expect since that way the scale parameter will scale the other two parameters
Lengthβ and SBβ as well as shown below
= ( )Length SBLength Length l SB SB l li Length l SB l lix x x x
β ββ β ε σ σ εσ σ
+ + sdot + + (45)
The right side equation is equivalent to Length Length l SB SB l lix xβ β ε+ + thus making no
difference So we choose to add a new random term including the scale parameter In
addition since we can get good estimate by assuming the random term proportional to
length we will keep this in the newly added random term Now the cost function is
specified as
1 ( ) + ( )l li li Length Length l SB SB l li li Length l Lengthc x x x x Mean xε ε β β ε η σ= + + sdot sdot 2
(46)
liε and liη follow the same truncated normal distribution but are drawn separately so that
they are not equal
In terms of the auxiliary model since now we have three parameters to be estimated in
the underlying model we need one more attribute in the logit model and number of links
in the path LNx is chosen The utility function of the logit model is actually the same as in
Section 641 which is
- - -ri Length Length r SB SB r LN LN r riU x x xθ θ θ ε= + (47)
63
With three parameters in the underlying model it is more reasonable to include
interactions of parameters in the binding function The binding functions take the form of
ɶ
1 2 3
4 5 6 7
( )
Length SB
Length SB Length SB Length SB
c d d d
d d d d
θ β β β σβ β β σ β σ β β σ
= + + +
+ + + + (48)
Since the estimates are not good we did not carry out too many trials to center the input
interval As a result the binding function may be of more interest in this case The chosen
interval is a trial one which is identical [0 3] for Lengthβ SBβ andσ We choose ten sets of
mβ and ɶ ( )m mθ β from one run as an example The values of ɶ ( )m mθ β are plotted against
Lengthβ SBβ andσ respectively The interactions are not shown in the figure yet we have
the estimates of binding function which will give a numerical description of how the
interactions impact theɶ ( )m mθ β
Figure 20 Plots of theta_length against beta_length beta_sb and sigma respectively
y = 09114x + 27818
Rsup2 = 07361
0
1
2
3
4
5
6
0 1 2 3 4
the
ta_
len
gth
beta_length
y = 03568x + 36215
Rsup2 = 00897
0
1
2
3
4
5
6
0 1 2 3 4
the
ta_
len
gth
beta_sb
y = 02572x + 38468
Rsup2 = 00516
0
1
2
3
4
5
6
0 1 2 3
the
ta_
len
gth
sigma
64
Figure 21 Plots of theta_sb against beta_length beta_sb and sigma respectively
y = 02363x + 0835
Rsup2 = 0088
0
05
1
15
2
25
3
0 1 2 3 4
the
ta_
sb
beta_length
y = 06351x + 01759
Rsup2 = 05054
0
05
1
15
2
25
3
0 1 2 3 4
the
ta_
sb
beta_sb
y = -03801x + 17212
Rsup2 = 02001
0
05
1
15
2
25
3
0 1 2 3
the
ta_
len
gth
sigma
y = 00477x + 04521
Rsup2 = 005460
02
04
06
08
1
0 1 2 3 4
the
ta_
ln
beta_length
y = -00553x + 06156
Rsup2 = 00582
0
02
04
06
08
1
0 1 2 3 4
the
ta_
ln
beta_sb
65
Figure 22 Plots of theta_ln against beta_length beta_sb and sigma respectively
As we can see from the three figures above ɶ Lengthθ ɶSBθ and ɶ LNθ are more affected by
Lengthβ SBβ andσ respectively Especially we can see a strong relationship between ɶ LNθ
and σ which assures that number of links can be used to infer the scale parameter in the
underlying model
The estimates of three binding functions are shown in Table 10 below with each row
representing the estimates for one of the three binding function and each column
representing certain variable in the binding function In the parenthesis below each
estimate of the coefficients is the t-test value with the null hypothesis of zero We take the
90 confidence interval and estimates with t-test value larger than 164 are supposed to
be significantly different from zero which are marked as bold
Table 10 Estimates of three binding functions
Constant Lengthβ SBβ σ
Length SBβ β
Lengthβ σ
SBβ σ Length SBβ β σ
ɶLengthθ
1814 (3085)
0861 (2417)
-0089 (-0258)
1038 (2913)
0202 (1030)
-0246 (-1240)
-0056 (-0292)
-0045 (-0412)
ɶSBθ 0284
(1482) -0125
(-1081) 0942
(8371) -0247
(-2127) 0118
(1856) 0070
(1086) -0141
(-2275) -0067
(-1883)
ɶLNθ 0819
(18643) 0015
(0577) -0026
(-0997) -0261
(-9794) 0006
(0419) 0007
(0498) 0024
(1663) -0007
(-0803)
As the constants indicate given no other attributes length and number of links have more
negative effects on the utility than the speed bump dummy does Judging from the
significance of coefficients for the three input parametersɶ Lengthθ ɶSBθ and ɶ LNθ are
significantly affected by Lengthβ SBβ andσ respectively As we can see σ has a negative
y = -02164x + 08218
Rsup2 = 09867
0
02
04
06
08
1
0 1 2 3th
eta
_ln
sigma
66
effect on ɶSBθ andɶ LNθ Since to some extent σ measures the scale of randomness we
could say that the more randomness of the costs on the links have the less influential of
presence of speed bump and number of links become ForɶSBθ it is significantly affected
by some of the interaction terms Notice that SBβ has positive effect onɶSBθ while σ has
effect The interaction terms including both σ and SBβ have negative effect onɶSBθ which
indicates that randomness of cost is more influential than presence of speed bump on the
disutility of speed bump
In terms of the final estimate as stated above the estimates of Lengthβ and SBβ have
negative signs whileσ has positive sign This result conflict our expectation that Lengthβ
and SBβ should have positive signs so we did not carry out more trials and shrinkage The
possible reason for negative estimate is similar to that in the model with exponential form
of cost function Given more attributes in the deterministic part of both the cost function
and utility function in the logit model we might be able to capture the features of the data
better and have the right sign in the final estimates
643 Monte Carlo evidence of model with estimated scale parameter for random
term
Based on the model formulation with estimated scale parameter for random term we also
carried out a Monte Carlo simulation experiment to verify the efficiency of using number
of links in the logti model to infer the scale parameter in the cost function and what we
do is to simulated observations instead of the true ones
We take three arbitrary values for the three parameters in the cost functionLengthβ SBβ and
σ to be 05 And simulated observations are generated based on the given values of
parameters in the cost function Since we know the true values for the parameters the
input domain is centered around the true values to be [04 06] for Lengthβ SBβ andσ
10K = runs are carried out to get statistics of the estimates of the three parameters
Within each run 10M = values are drawn for inputsLengthβ SBβ andσ respectively for
estimating binding function
67
In terms of the binding function by doing regression test we can see that the intersection
terms are unnecessary to be included or even hazardous for good estimate of binding
function so we decide to remove them and keep the binding function as
ɶ1 2 3( ) Length SBc d d dθ β β β σ= + + + (49)
We choose ten sets of mβ and ɶ ( )m mθ β from one run as an example The values of
ɶ ( )m mθ β are plotted againstLengthβ SBβ andσ respectively
Figure 23 Plots of theta_length against beta_length beta_sb and sigma respectively
y = 23826x + 14791
Rsup2 = 05326
15
2
25
3
35
04 05 06
the
ta_
len
gth
beta_length
y = -06434x + 30245
Rsup2 = 0048115
2
25
3
35
04 05 06
the
ta_
len
gth
beta_sb
y = 26255x + 14156
Rsup2 = 07607
15
2
25
3
35
04 05 06
the
ta_
len
gth
sigma
y = -02443x + 04708
Rsup2 = 0034
0
01
02
03
04
05
04 05 06
the
ta_
sb
beta_length
y = 11233x - 02096
Rsup2 = 089020
01
02
03
04
05
04 05 06
the
ta_
sb
beta_sb
68
Figure 24 Plots of theta_sb against beta_length beta_sb and sigma respectively
Figure 25 Plots of theta_ln against beta_length beta_sb and sigma respectively
The figures show similar trend to those in the trial model with estimated scale parameters
which is in line with our expectation
The estimates of three binding functions are shown in Table 11 below with each row
representing the estimates for one of the three binding function and each column
y = -04374x + 056
Rsup2 = 01283
0
01
02
03
04
05
04 05 06
the
ta_
sb
sigma
y = -01144x + 07619
Rsup2 = 01114066
067
068
069
07
071
072
073
074
04 05 06
the
ta_
ln
beta_length
y = 0053x + 06768
Rsup2 = 00296066
067
068
069
07
071
072
073
074
04 05 06
the
ta_
ln
beta_sb
y = -03115x + 08561
Rsup2 = 09717
066
067
068
069
07
071
072
073
074
04 05 06
the
ta_
ln
sigma
69
representing certain variable in the binding function In the parenthesis below each
estimate of the coefficients is the t-test value with the null hypothesis of zero We take the
95 confidence interval and estimates with t-test value larger than 196 are supposed to
be significantly different from zero which are marked as bold
Table 11 Estimates of three binding functions in the Monte Carlo experiment
Constant Lengthβ SBβ σ
ɶLengthθ 0853
(3606) 1009
(3724) -0034
(-0125) 2569
(9482)
ɶSBθ -0062
(-0385) -0104
(-0564) 1208
(6591) -0226
(-1227)
ɶLNθ 0854
(46688) 0013
(0624) -0004
(-0185) -0302
(-14428)
The estimates of binding function have similar characteristics as in the trial model with
estimated scale parameters as well They contain almost the same significant coefficients
and those significant estimates have the same signs as in the trial with true observations
Based on the estimated binding function and the simulated observations given true values
of the three parameters to be 05 the final estimates of Lengthβ SBβ andσ are shown in
Table 12 below
Table 12 Statistics of estimation of beta_length beta_sb and sigma in the Monte Carlo experiment
Parameter Lengthβ
SBβ σ
Mean 0404138359 0458624533 0639191487
Standard deviation 1109279424 0242570421 0377069799
As we can see the estimates of Lengthβ SBβ andσ are quite close to their true values What
is not satisfying is that the estimate of σ is a little large and lies outside the input domain
of [04 06] but is still quite near to this interval In addition the estimate of Lengthβ is
within the input domain yet the variation is large This is understandable since we scale
the random term by length together with the scale parameter and thus the parameter for
length could be influenced by the random term and turns out to have large variations In a
word the result of Monte Carlo experiment verifies that we get use the model
70
formulation with unfixed scale parameter for the random term to get the right estimate of
the true values And number of links is strongly related withσ which means that it is
reasonable and efficient to use it as a reference to σ in the cost function
71
7 Conclusions
This thesis aims at implementing the newly proposed route choice model based on
indirect inference in true observations The model assigns links specific errors for a
network which allows natural correlations among paths and is practical in simulating
observations by means of shortest path searching algorithms like the Dijkstrarsquos Algorithm
used in our experiment To get consistent estimation of this kind of model indirect
inference method is used and a simple model like logit model is used as an auxiliary
model The route choice model and indirect inference estimator has been tested on
synthetic data with simulated observations and proved to be capable of consistently
estimated
Compared to the synthetic experiment some extensions are done in this thesis By
replacing the simulated observations with the true observations the method is tested on
the empirical circumstance to prove that it could be used in solving practical problems
The true observations have more noises than the simulated ones thus more difficulty to
capture their features We know neither the right formulations of models based on the
data nor the values of parameters in the route choice model yet as defined the
parameters should have positive signs As it turned out to be in the experiment with only
length in the model we get the estimates of Lengthβ as 1337 while with two attributes in
the model we get the estimates of Lengthβ and SBβ as 0761 and 00799 respectively The
estimates in both experiments seem reasonable with the right sign In addition seen from
the estimation of the binding function the coefficients in the logit model is negatively
affected by the parameters they infer in the basic route choice model in the two attributes
case one parameter in the logit model is more apparently affected by the parameter it
refers than the other parameter in basic model
In the trial where we include a scale parameter to the random term and estimate it along
with the other parameters in the route choice model a Monte Carlo simulation
experiment is carried out using simulated observations The result shows that it is
efficient to use number of links in the auxiliary model to infer the scale parameter in the
basic rout choice model
72
In other trial formulations of the model we got negative estimates which may probably
be due to missing attributes in the cost function Future work should be done to include
more attributes
Another thing to recommend for future is that we generate the pseudo-universal choice
set as part of the auxiliary model Since the pseudo-universal choice set is partially used
for deciding which ODs and observations to be used in the project it is essential and
should be generated beforehand But from the choice set generation point of view we
could generate individual specific choice set directly instead of random drawing paths
from the pseudo-universal choice set This would increase computational efficiency
73
Bibliography
Axhausen K Schoumlnfelder S Wolf J Oliveira M amp Samaga U (2003) 80 Weeks of
GPS Traces Approaches to Enriching the Trip Information Transportation Research
Record 1870 46-54
Azevedo J Costa M Madeira J amp Martins E (1993) An Algorithm for the Ranking
of Shortest Paths European Journal of Operational Research 69 (1) 97-106
Bartels K Boztug Y amp Muumlller M (1999) Testing the Multinomial Logit Model
Working paper University Potsdam Germany
Bekhor S Ben-Akiva M amp Ramming M (2002) Adaptation of Logit Kernel to Route
Choice Situation Transportation Research Board of the National Academics 1805 78-85
Bekhor S Ben-Akiva M amp Ramming M (2006) Evaluation of Choice Set Generation
Algorithms for Route Choice Models Annals of Operations Research 114 (1) 235-247
Ben-Akiva M amp Bierlaire M (1999) Discrete Choice Methods and Their Applications
to Short Term Travel Decisions In Chapter for the Transport Science Handbook
Preliminary Draft
Ben-Akiva M amp Bierlaire M (2003) Discrete Choice Models with Applications to
Departure Time and Route Choice In Handbook of Transportation Science (second ed)
Kluwer
Ben-Akiva M amp Bolduc D (1996) Multinomial Probit with a Logit Kernel and a
General Parametric Specification of the Covariance Structure Working Paper
Ben-Akiva M amp Lerman S (1985) Discrete Choice Analysis Theory and Application
to Travel Demand MIT Press
Ben-Akiva M Bergman M Daly A amp Ramaswamy R (1984) Modeling Inter Urban
Route Choice Behaviour In J Vollmuller amp R Hamerslag (Ed) the 9th International
Symposium on Transportation and Traffic Theory (pp 299-330) Utrecht Netherlands
VNU Science Press
Cascetta E Nuzzolo A Russo F amp Vitetta A (1996) A Modified Logit Route Choice
Model Overcoming Path Overlapping ProblemsSpecification and Some Calibration
Results for Interurban Networks In J Lesort (Ed) the 13th International Symposium on
Transportation and Traffic Theory Lyon France
74
Creel M (2009) A Data Mining Approach to Indirect Inference Universitat Autonoma
de Barcelona Department of Economics and Economic History
De La Barra T Peacuterez B amp Anez J (1993) Multidimensional Path Search and
Assignment 21st PTRC Summer Meeting (pp 307-319)
Dijkstra E (1959) A note on two problems in connexion with graphs Numerische
Mathematik 1 269-271
Frejinger E amp Bierlaire M (2007) Capturing Correlation with Subnetworks in Route
Choice Models Transportation Research Part B 41 363-378
Frejinger E Bierlaire M amp Ben-Akiva M (2009) Sampling of Alternatives for Route
Choice Modeling Transportation Research Part B Methodological 43 (10) 984-994
Gallant A amp McCulloch R (2004) On the Determination of General Scientific Models
Manuscript Duke University
Gourieacuteroux C Monfort A amp Renault E (1993) Indirect Inference Journal of Applied
Econometrics 8 85-118
Karlstroumlm A Sundberg M amp Wang Q (2011) Consistently estimating flexible route
choice models using an MNL lense International Choice Modeling Conference Leeds
Keane M amp Smith A (2003) Generalized Indirect Inference for Discrete Choice
Models Manuscript Yale University
Manski C amp Lerman S (1977) The Estimation of Choice Probabilities from Choice
Based Samples Econometrica 45 (8) 1977-1988
McFadden D (1974) Conditional Logit Analysis of Qualitative Choice Behaviour (P
Zarembka Ed) Frontiers in Econometrics 105-142
McFadden D (1978) Modeling the Choice of Residential Location In A Karlqvist L
Lundqvist F Snickars amp J Weibull (Ed) Spatial Interaction Theory and Residential
Location (pp 75-96) Amsterdam North-Holland
McFadden D amp Train K (2000) Mixed MNL Models for Discrete Response Journal
of Applied Econometrics
Nerella S amp Bhat C (2004) Numerical Analysis of Effect of Sampling of Alternatives
in Discrete Choice Models Transportation Research Record 1894 11-19
Ramming M (2001) Network Knowledge and Route Choice PhD Thesis Massachusetts
Institute of Technology
75
Schoumlnfelder S amp Samaga U (2003) Where Do You Want to Go Today-More
Observations on Daily Mobility Third Swiss Transport Research Conference Ascona
Schoumlnfelder S Axhausen K Antille N amp Bierlaire M (2002) Exploring the
Potentials of Automatically Collected GPS Data for Travel Behaviour Analysis- A
Swedish Data Source i J Moumlltgen amp A Wytzisk (Red) GI-Technologien fuumlr Verkehr
und Logistik number 13 Institut fuumlr Geoinformatik Universitaumlt Muumlnster (ss 155-179)
Munster IfGIprints
Smith A (1993) Estimating Nonlinear Time-series Models Using Simulated Vector
Autoregressions Journal of Applied Econometrics 8 63-84
Smith A (2008) Indirect Inference In S Durlauf amp L Blume (Eds) The New
Palgrave Dictionary of Economics (Second ed) Palgrave Macmillan
Smith A (1990) Three Essays on the Solution and Estimation of Dynamic
Macroeconomic Models PhD Dissertation Duke University
Train K (2003) Discrete Choice Methods with Simulation Cambridge University Press
Vovsha P amp Bekhor S (1998) Link-nested Logit Model of Route Choice-Overcoming
Route Overlapping Problem Transportation Research Record 1645 133-142
Wang H (2011) Logistics Distribution Shortest Path Based on Dijkstra Algorithm
Computer and Digital Engineering 3
Assigned publication number
TSC-MT 11-016
wwwkthse