consolidated financial results for the six months ended ...€¦ · 101 108 154 80 95 96 99 115 106...
TRANSCRIPT
Consolidated Financial Results
for the Six Months Ended June 30, 2020
and FY2020 Forecast
Kao Corporation
July 29, 2020
2
Forward-looking statements such as earnings forecasts and other projections contained in this release are based on information available at this time and assumptions that management believes to be reasonable, and do not constitute guarantees of future performance. Actual results may differ materially from those expectations due to various factors.
These presentation materials are available on our website in PDF format:
www.kao.com/global/en/investor-relations/library/presentations/
■ The Kao Group adopted IFRS 16 “Leases” in the three months ended March 31, 2019
■ Numbers in parentheses in charts are negative
3
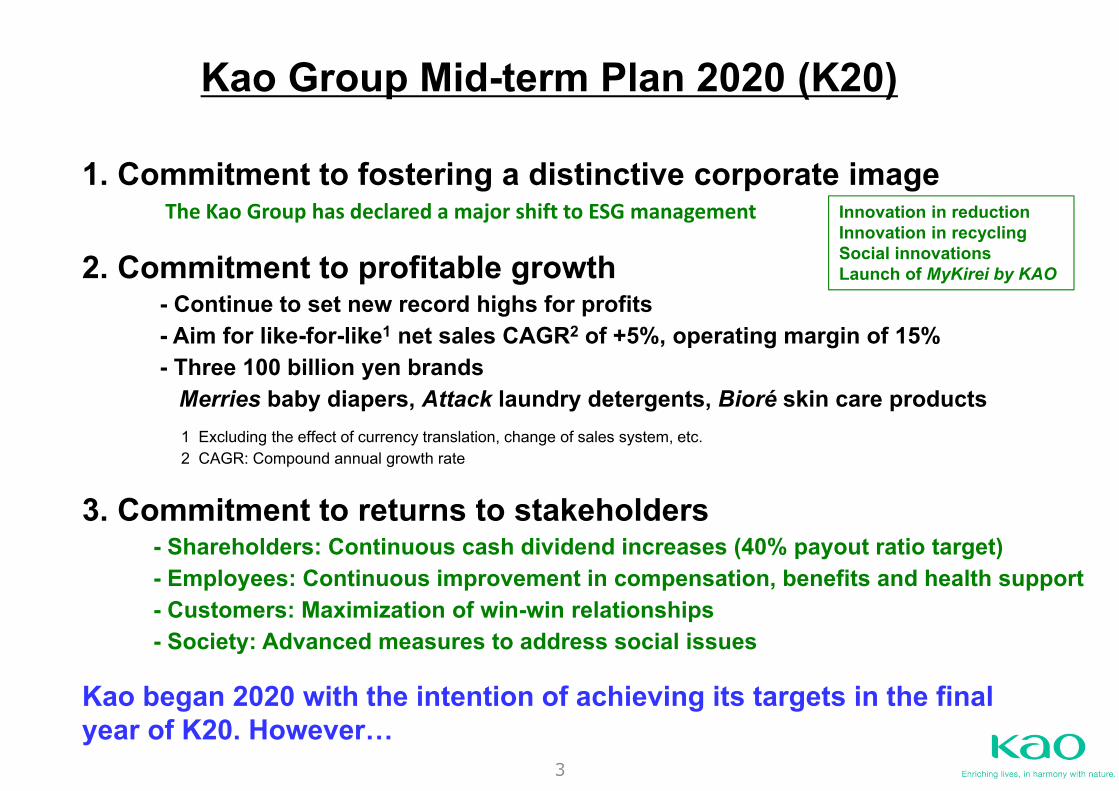
Kao Group Mid-term Plan 2020 (K20)
1. Commitment to fostering a distinctive corporate imageThe Kao Group has declared a major shift to ESG management
2. Commitment to profitable growth - Continue to set new record highs for profits- Aim for like-for-like1 net sales CAGR2 of +5%, operating margin of 15%- Three 100 billion yen brands
Merries baby diapers, Attack laundry detergents, Bioré skin care products1 Excluding the effect of currency translation, change of sales system, etc.2 CAGR: Compound annual growth rate
3. Commitment to returns to stakeholders- Shareholders: Continuous cash dividend increases (40% payout ratio target)- Employees: Continuous improvement in compensation, benefits and health support- Customers: Maximization of win-win relationships- Society: Advanced measures to address social issues
Kao began 2020 with the intention of achieving its targets in the final year of K20. However…
Innovation in reductionInnovation in recyclingSocial innovationsLaunch of MyKirei by KAO
4
Major ESG Investment Indices and Evaluations from External OrganizationsESG indices for which Kao has been selected
Evaluations from/activities with external organizations
* ESG Investment: Investment that takes into consideration Environmental, Social and Governance factors
5
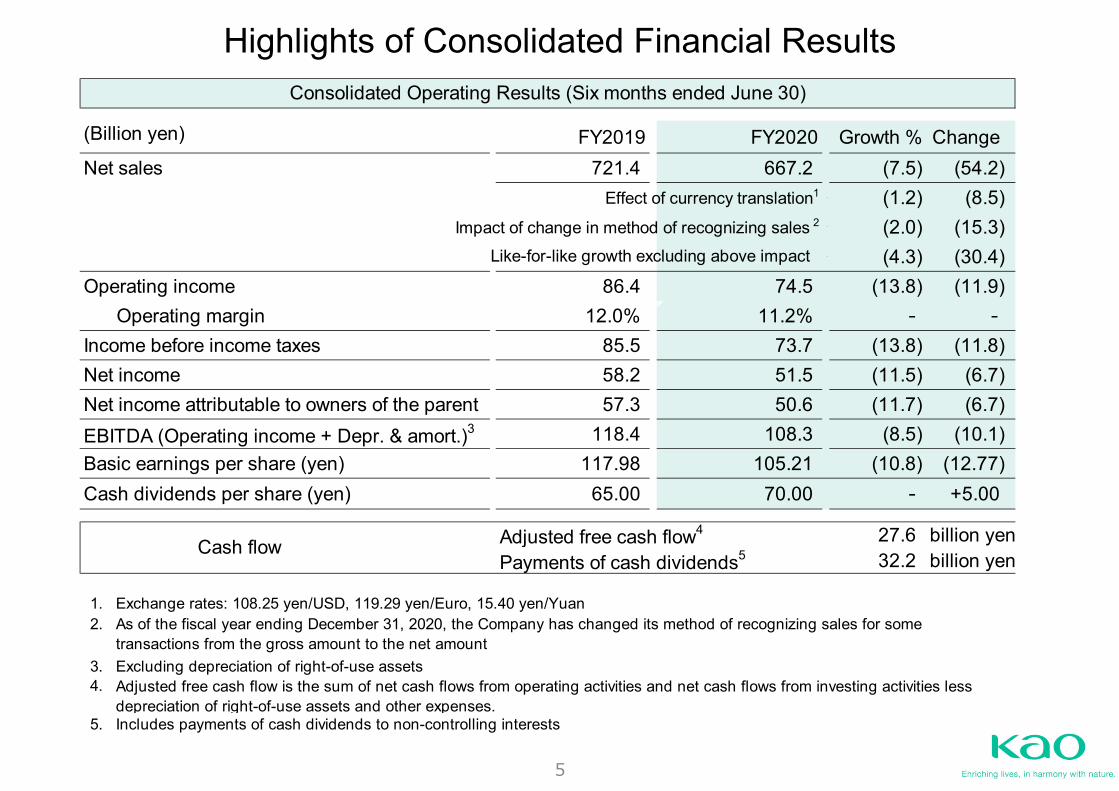
Highlights of Consolidated Financial Results
(Billion yen) FY2019 FY2020 Growth % Change Net sales 721.4 667.2 (7.5) (54.2)
Effect of currency translation1 - (1.2) (8.5)Impact of change in method of recognizing sales 2 - (2.0) (15.3)
Like-for-like growth excluding above impact - (4.3) (30.4)Operating income 86.4 74.5 (13.8) (11.9)
Operating margin 12.0% 11.2% - - Income before income taxes 85.5 73.7 (13.8) (11.8)Net income 58.2 51.5 (11.5) (6.7)Net income attributable to owners of the parent 57.3 50.6 (11.7) (6.7)EBITDA (Operating income + Depr. & amort.)3 118.4 108.3 (8.5) (10.1)Basic earnings per share (yen) 117.98 105.21 (10.8) (12.77)Cash dividends per share (yen) 65.00 70.00 - +5.00
Adjusted free cash flow4 27.6 billion yenPayments of cash dividends5 32.2 billion yen
1. Exchange rates: 108.25 yen/USD, 119.29 yen/Euro, 15.40 yen/Yuan2.
3. Excluding depreciation of right-of-use assets4.
5. Includes payments of cash dividends to non-controlling interests
As of the fiscal year ending December 31, 2020, the Company has changed its method of recognizing sales for sometransactions from the gross amount to the net amount
Adjusted free cash flow is the sum of net cash flows from operating activities and net cash flows from investing activities lessdepreciation of right-of-use assets and other expenses.
Consolidated Operating Results (Six months ended June 30)
Cash flow
6
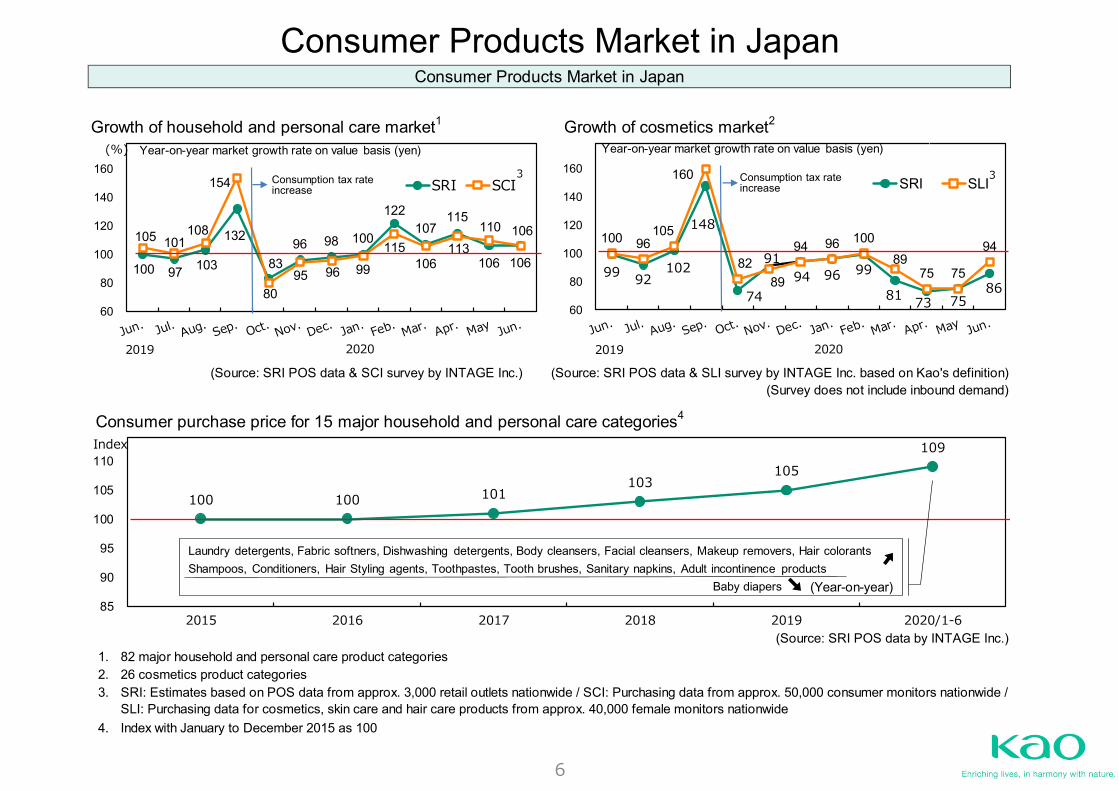
Consumer Products Market in Japan
Growth of household and personal care market1 Growth of cosmetics market2
(Source: SRI POS data & SCI survey by INTAGE Inc.) (Source: SRI POS data & SLI survey by INTAGE Inc. based on Kao's definition)(Survey does not include inbound demand)
Consumer purchase price for 15 major household and personal care categories4
(Source: SRI POS data by INTAGE Inc.)1. 82 major household and personal care product categories2. 26 cosmetics product categories3.
4. Index with January to December 2015 as 100
SRI: Estimates based on POS data from approx. 3,000 retail outlets nationwide / SCI: Purchasing data from approx. 50,000 consumer monitors nationwide /SLI: Purchasing data for cosmetics, skin care and hair care products from approx. 40,000 female monitors nationwide
Consumer Products Market in Japan
100 97 103
132
83 96 98 100
122 107
115
106
106 105 101 108
154
80 95 96 99
115 106
113 110
106
60
80
100
120
140
160(%)
SRI SCI3
99 92102
148
7494 96 99
81 73 75 86
100 96 105
160
82 89
94 96 100 89
75 75
94
60
80
100
120
140
160SRI SLI
3
Year-on-year market growth rate on value basis (yen) Year-on-year market growth rate on value basis (yen)
100 100 101 103
105 109
85
90
95
100
105
110
2015 2016 2017 2018 2019 2020/1-6
Index
Baby diapers (Year-on-year)
2019 20192020 2020
Consumption tax rate increase
91
Laundry detergents, Fabric softners, Dishwashing detergents, Body cleansers, Facial cleansers, Makeup removers, Hair colorantsShampoos, Conditioners, Hair Styling agents, Toothpastes, Tooth brushes, Sanitary napkins, Adult incontinence products
Consumption tax rate increase
7
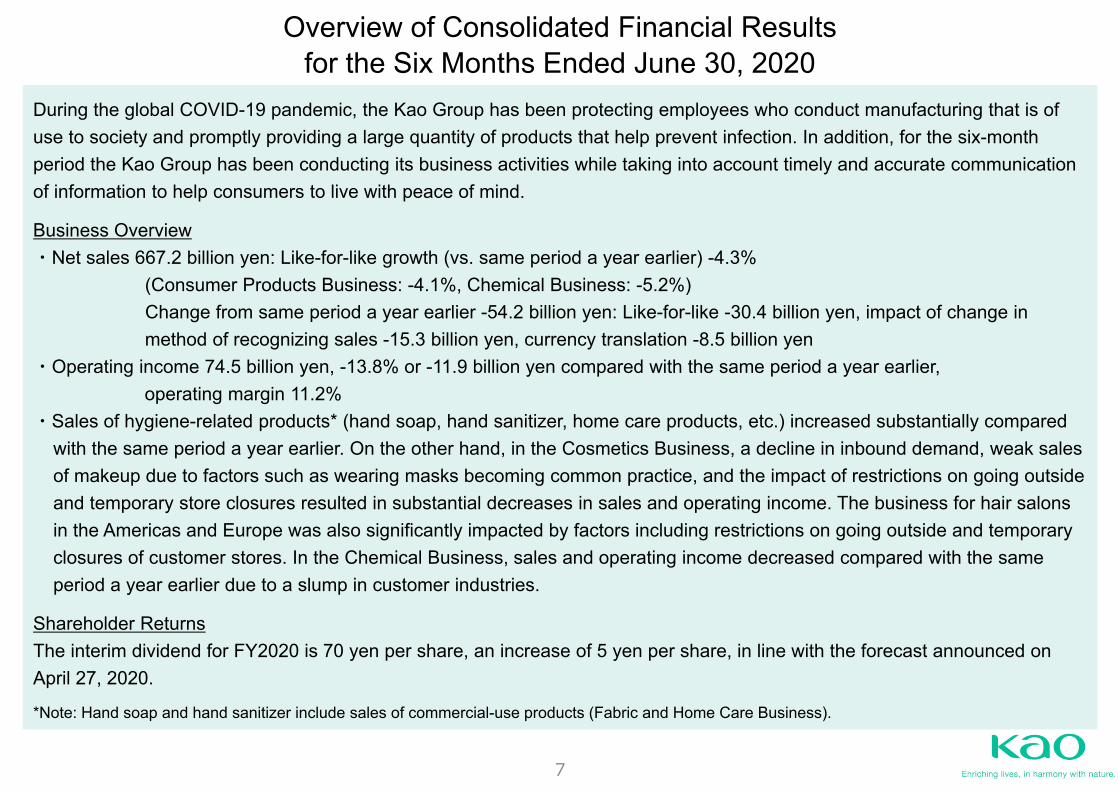
Overview of Consolidated Financial Results for the Six Months Ended June 30, 2020
During the global COVID-19 pandemic, the Kao Group has been protecting employees who conduct manufacturing that is of use to society and promptly providing a large quantity of products that help prevent infection. In addition, for the six-month period the Kao Group has been conducting its business activities while taking into account timely and accurate communication of information to help consumers to live with peace of mind.
Business Overview・Net sales 667.2 billion yen: Like-for-like growth (vs. same period a year earlier) -4.3%
(Consumer Products Business: -4.1%, Chemical Business: -5.2%)Change from same period a year earlier -54.2 billion yen: Like-for-like -30.4 billion yen, impact of change in method of recognizing sales -15.3 billion yen, currency translation -8.5 billion yen
・Operating income 74.5 billion yen, -13.8% or -11.9 billion yen compared with the same period a year earlier, operating margin 11.2%
・Sales of hygiene-related products* (hand soap, hand sanitizer, home care products, etc.) increased substantially compared with the same period a year earlier. On the other hand, in the Cosmetics Business, a decline in inbound demand, weak sales of makeup due to factors such as wearing masks becoming common practice, and the impact of restrictions on going outside and temporary store closures resulted in substantial decreases in sales and operating income. The business for hair salons in the Americas and Europe was also significantly impacted by factors including restrictions on going outside and temporary closures of customer stores. In the Chemical Business, sales and operating income decreased compared with the same period a year earlier due to a slump in customer industries.
Shareholder ReturnsThe interim dividend for FY2020 is 70 yen per share, an increase of 5 yen per share, in line with the forecast announced on April 27, 2020.
*Note: Hand soap and hand sanitizer include sales of commercial-use products (Fabric and Home Care Business).
8
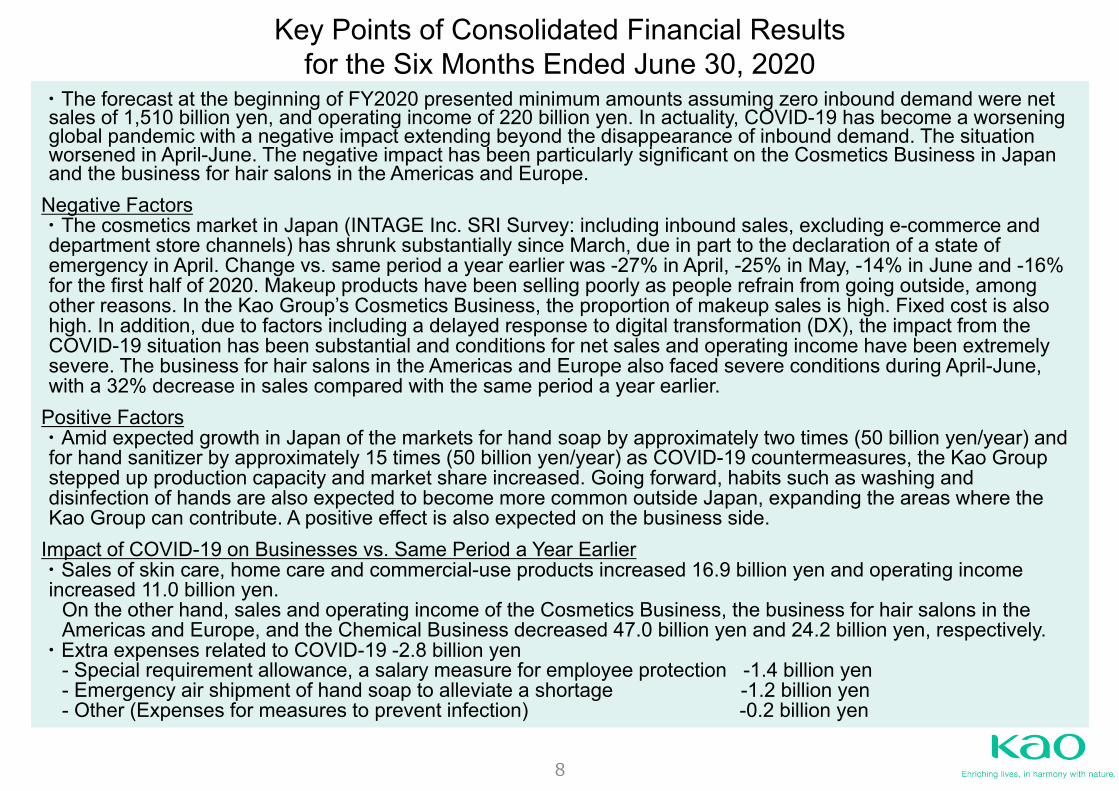
・The forecast at the beginning of FY2020 presented minimum amounts assuming zero inbound demand were net sales of 1,510 billion yen, and operating income of 220 billion yen. In actuality, COVID-19 has become a worsening global pandemic with a negative impact extending beyond the disappearance of inbound demand. The situation worsened in April-June. The negative impact has been particularly significant on the Cosmetics Business in Japan and the business for hair salons in the Americas and Europe.
Negative Factors・The cosmetics market in Japan (INTAGE Inc. SRI Survey: including inbound sales, excluding e-commerce and department store channels) has shrunk substantially since March, due in part to the declaration of a state of emergency in April. Change vs. same period a year earlier was -27% in April, -25% in May, -14% in June and -16% for the first half of 2020. Makeup products have been selling poorly as people refrain from going outside, among other reasons. In the Kao Group’s Cosmetics Business, the proportion of makeup sales is high. Fixed cost is also high. In addition, due to factors including a delayed response to digital transformation (DX), the impact from the COVID-19 situation has been substantial and conditions for net sales and operating income have been extremely severe. The business for hair salons in the Americas and Europe also faced severe conditions during April-June, with a 32% decrease in sales compared with the same period a year earlier.
Positive Factors・Amid expected growth in Japan of the markets for hand soap by approximately two times (50 billion yen/year) and for hand sanitizer by approximately 15 times (50 billion yen/year) as COVID-19 countermeasures, the Kao Group stepped up production capacity and market share increased. Going forward, habits such as washing and disinfection of hands are also expected to become more common outside Japan, expanding the areas where the Kao Group can contribute. A positive effect is also expected on the business side.
Impact of COVID-19 on Businesses vs. Same Period a Year Earlier・Sales of skin care, home care and commercial-use products increased 16.9 billion yen and operating income increased 11.0 billion yen.
On the other hand, sales and operating income of the Cosmetics Business, the business for hair salons in the Americas and Europe, and the Chemical Business decreased 47.0 billion yen and 24.2 billion yen, respectively.
・Extra expenses related to COVID-19 -2.8 billion yen- Special requirement allowance, a salary measure for employee protection -1.4 billion yen- Emergency air shipment of hand soap to alleviate a shortage -1.2 billion yen- Other (Expenses for measures to prevent infection) -0.2 billion yen
Key Points of Consolidated Financial Results for the Six Months Ended June 30, 2020
9
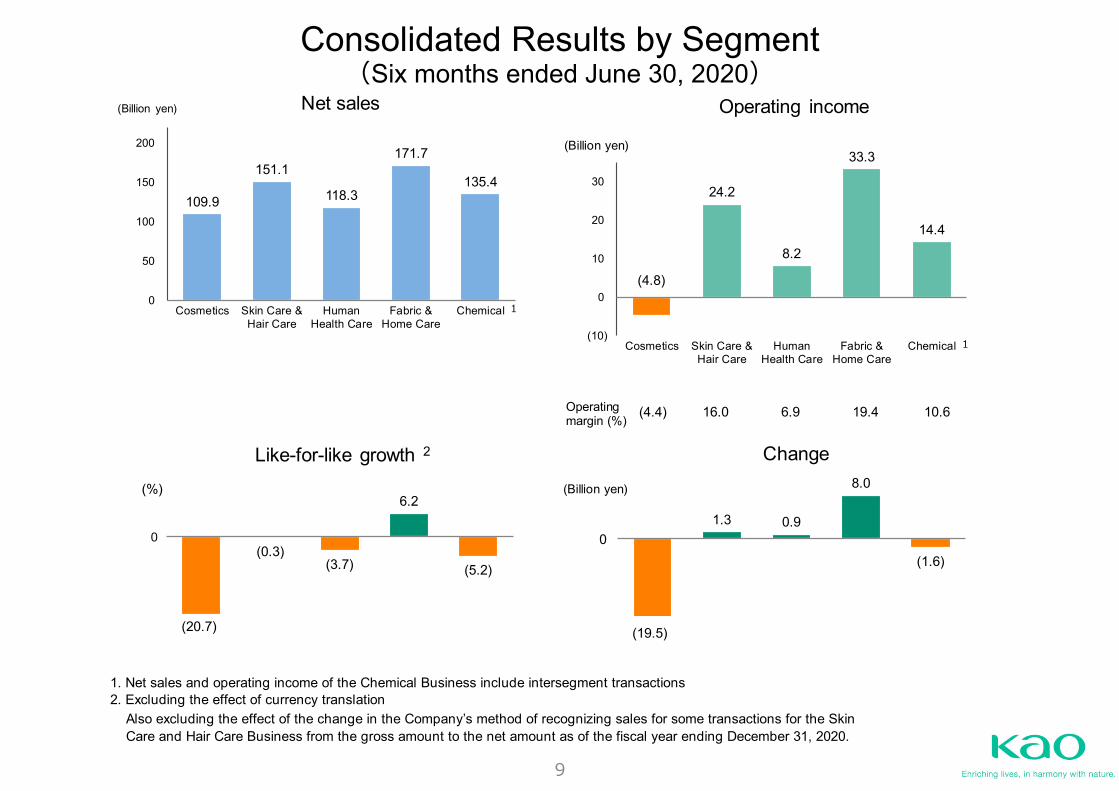
Consolidated Results by Segment(Six months ended June 30, 2020)
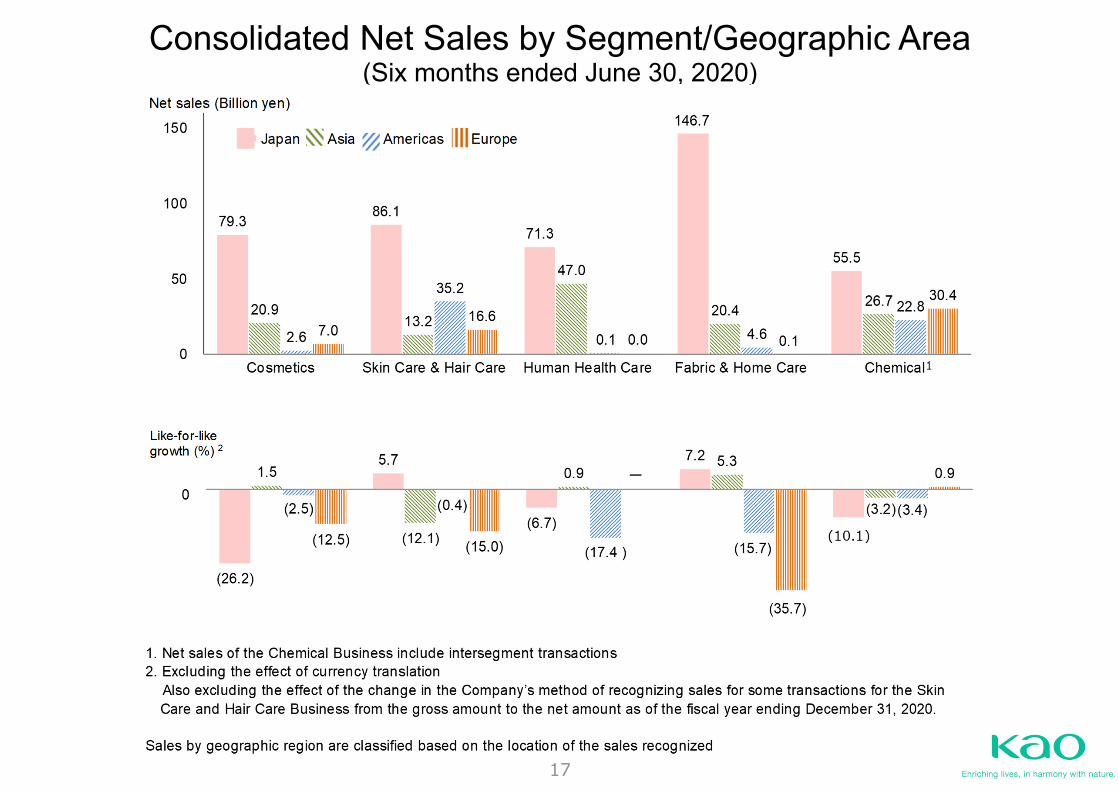
1. Net sales and operating income of the Chemical Business include intersegment transactions2. Excluding the effect of currency translation Also excluding the effect of the change in the Company’s method of recognizing sales for some transactions for the Skin Care and Hair Care Business from the gross amount to the net amount as of the fiscal year ending December 31, 2020.
109.9
151.1
118.3
171.7
135.4
0
50
100
150
200
Cosmetics Skin Care &Hair Care
HumanHealth Care
Fabric &Home Care
Chemical
(Billion yen)
1
24.2
8.2
33.3
14.4
(10)
0
10
20
30
Cosmetics Skin Care &Hair Care
HumanHealth Care
Fabric &Home Care
Chemical 1
(4.4) 16.0 6.9 19.4 10.6 Operatingmargin (%)
(Billion yen)
(20.7)
(0.3)(3.7)
6.2
(5.2)
(%)
1.3 0.9
8.0
(1.6)
(19.5)
Net sales Operating income
(4.8)
Like-for-like growth 2 Change
0 0
(Billion yen)
10
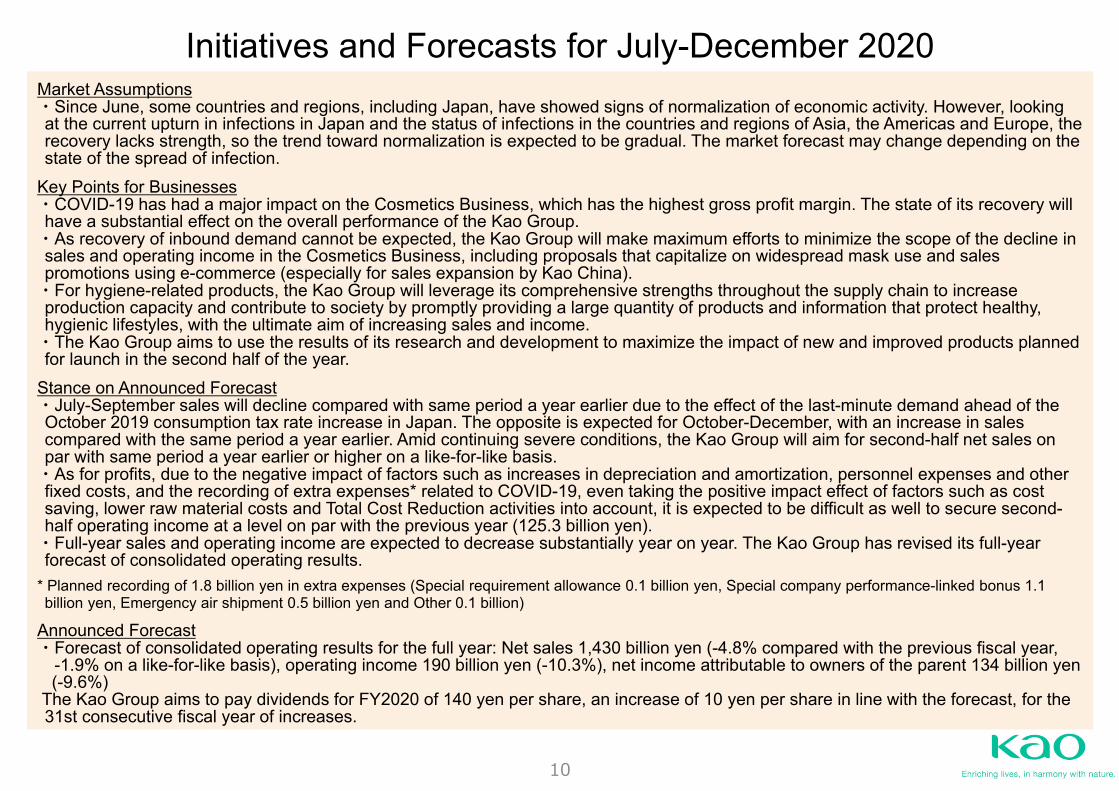
Initiatives and Forecasts for July-December 2020Market Assumptions・Since June, some countries and regions, including Japan, have showed signs of normalization of economic activity. However, looking at the current upturn in infections in Japan and the status of infections in the countries and regions of Asia, the Americas and Europe, the recovery lacks strength, so the trend toward normalization is expected to be gradual. The market forecast may change depending on the state of the spread of infection.
Key Points for Businesses・COVID-19 has had a major impact on the Cosmetics Business, which has the highest gross profit margin. The state of its recovery will have a substantial effect on the overall performance of the Kao Group.・As recovery of inbound demand cannot be expected, the Kao Group will make maximum efforts to minimize the scope of the decline in sales and operating income in the Cosmetics Business, including proposals that capitalize on widespread mask use and sales promotions using e-commerce (especially for sales expansion by Kao China).・For hygiene-related products, the Kao Group will leverage its comprehensive strengths throughout the supply chain to increase production capacity and contribute to society by promptly providing a large quantity of products and information that protect healthy, hygienic lifestyles, with the ultimate aim of increasing sales and income.・The Kao Group aims to use the results of its research and development to maximize the impact of new and improved products planned for launch in the second half of the year.
Stance on Announced Forecast・July-September sales will decline compared with same period a year earlier due to the effect of the last-minute demand ahead of the October 2019 consumption tax rate increase in Japan. The opposite is expected for October-December, with an increase in sales compared with the same period a year earlier. Amid continuing severe conditions, the Kao Group will aim for second-half net sales on par with same period a year earlier or higher on a like-for-like basis.・As for profits, due to the negative impact of factors such as increases in depreciation and amortization, personnel expenses and other fixed costs, and the recording of extra expenses* related to COVID-19, even taking the positive impact effect of factors such as cost saving, lower raw material costs and Total Cost Reduction activities into account, it is expected to be difficult as well to secure second-half operating income at a level on par with the previous year (125.3 billion yen).・Full-year sales and operating income are expected to decrease substantially year on year. The Kao Group has revised its full-year forecast of consolidated operating results.
* Planned recording of 1.8 billion yen in extra expenses (Special requirement allowance 0.1 billion yen, Special company performance-linked bonus 1.1 billion yen, Emergency air shipment 0.5 billion yen and Other 0.1 billion)
Announced Forecast・Forecast of consolidated operating results for the full year: Net sales 1,430 billion yen (-4.8% compared with the previous fiscal year,
-1.9% on a like-for-like basis), operating income 190 billion yen (-10.3%), net income attributable to owners of the parent 134 billion yen(-9.6%)
The Kao Group aims to pay dividends for FY2020 of 140 yen per share, an increase of 10 yen per share in line with the forecast, for the 31st consecutive fiscal year of increases.
Market Assumptions・Since June, some countries and regions, including Japan, have showed signs of normalization of economic activity. However, looking at the current upturn in infections in Japan and the status of infections in the countries and regions of Asia, the Americas and Europe, the recovery lacks strength, so the trend toward normalization is expected to be gradual. The market forecast may change depending on the state of the spread of infection.
Key Points for Businesses・COVID-19 has had a major impact on the Cosmetics Business, which has the highest gross profit margin. The state of its recovery will have a substantial effect on the overall performance of the Kao Group.・As recovery of inbound demand cannot be expected, the Kao Group will make maximum efforts to minimize the scope of the decline in sales and operating income in the Cosmetics Business, including proposals that capitalize on widespread mask use and sales promotions using e-commerce (especially for sales expansion by Kao China).・For hygiene-related products, the Kao Group will leverage its comprehensive strengths throughout the supply chain to increase production capacity and contribute to society by promptly providing a large quantity of products and information that protect healthy, hygienic lifestyles, with the ultimate aim of increasing sales and income.・The Kao Group aims to use the results of its research and development to maximize the impact of new and improved products planned for launch in the second half of the year.
Stance on Announced Forecast・July-September sales will decline compared with same period a year earlier due to the effect of the last-minute demand ahead of the October 2019 consumption tax rate increase in Japan. The opposite is expected for October-December, with an increase in sales compared with the same period a year earlier. Amid continuing severe conditions, the Kao Group will aim for second-half net sales on par with same period a year earlier or higher on a like-for-like basis.・As for profits, due to the negative impact of factors such as increases in depreciation and amortization, personnel expenses and other fixed costs, and the recording of extra expenses* related to COVID-19, even taking the positive impact effect of factors such as cost saving, lower raw material costs and Total Cost Reduction activities into account, it is expected to be difficult as well to secure second-half operating income at a level on par with the previous year (125.3 billion yen).・Full-year sales and operating income are expected to decrease substantially year on year. The Kao Group has revised its full-year forecast of consolidated operating results.
* Planned recording of 1.8 billion yen in extra expenses (Special requirement allowance 0.1 billion yen, Special company performance-linked bonus 1.1 billion yen, Emergency air shipment 0.5 billion yen and Other 0.1 billion)
Announced Forecast・Forecast of consolidated operating results for the full year: Net sales 1,430 billion yen (-4.8% compared with the previous fiscal year,
-1.9% on a like-for-like basis), operating income 190 billion yen (-10.3%), net income attributable to owners of the parent 134 billion yen(-9.6%)
The Kao Group aims to pay dividends for FY2020 of 140 yen per share, an increase of 10 yen per share in line with the forecast, for the 31st consecutive fiscal year of increases.
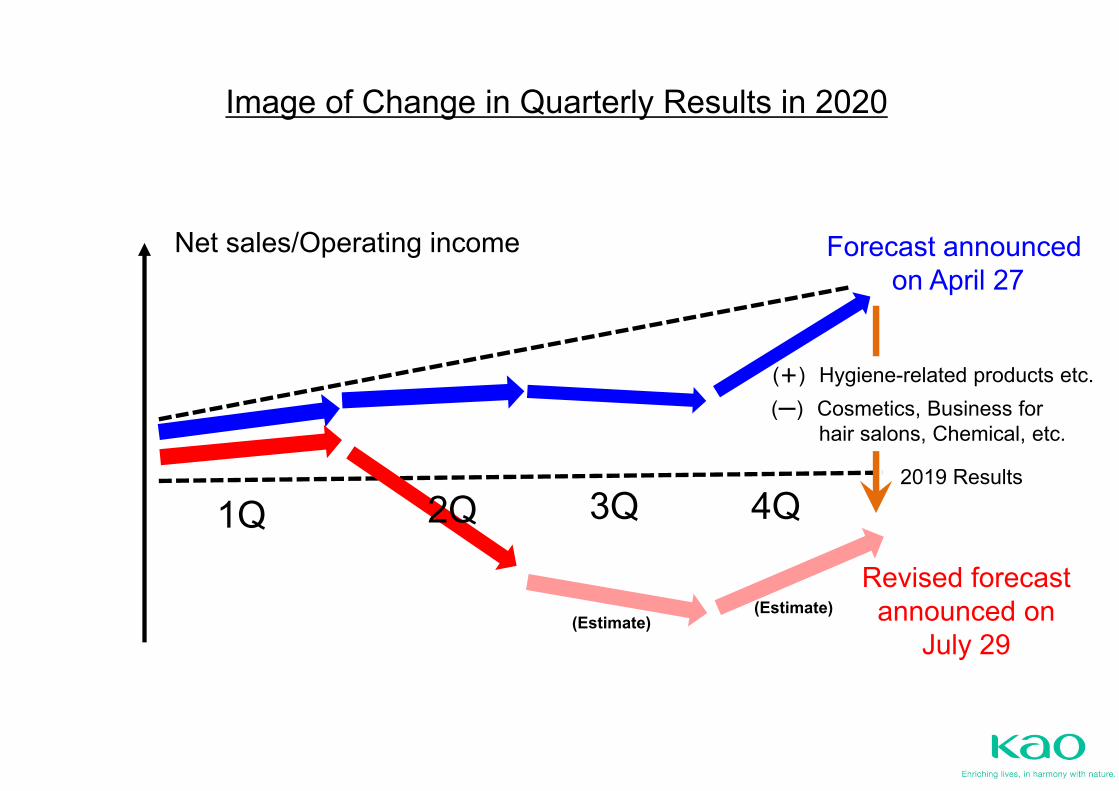
Image of Change in Quarterly Results in 2020
2019 Results
Forecast announced on April 27
1Q 2Q 3Q 4Q
Net sales/Operating income
Revised forecast announced on
July 29
(+) Hygiene-related products etc.(ー) Cosmetics, Business for
hair salons, Chemical, etc.
(Estimate)(Estimate)
12
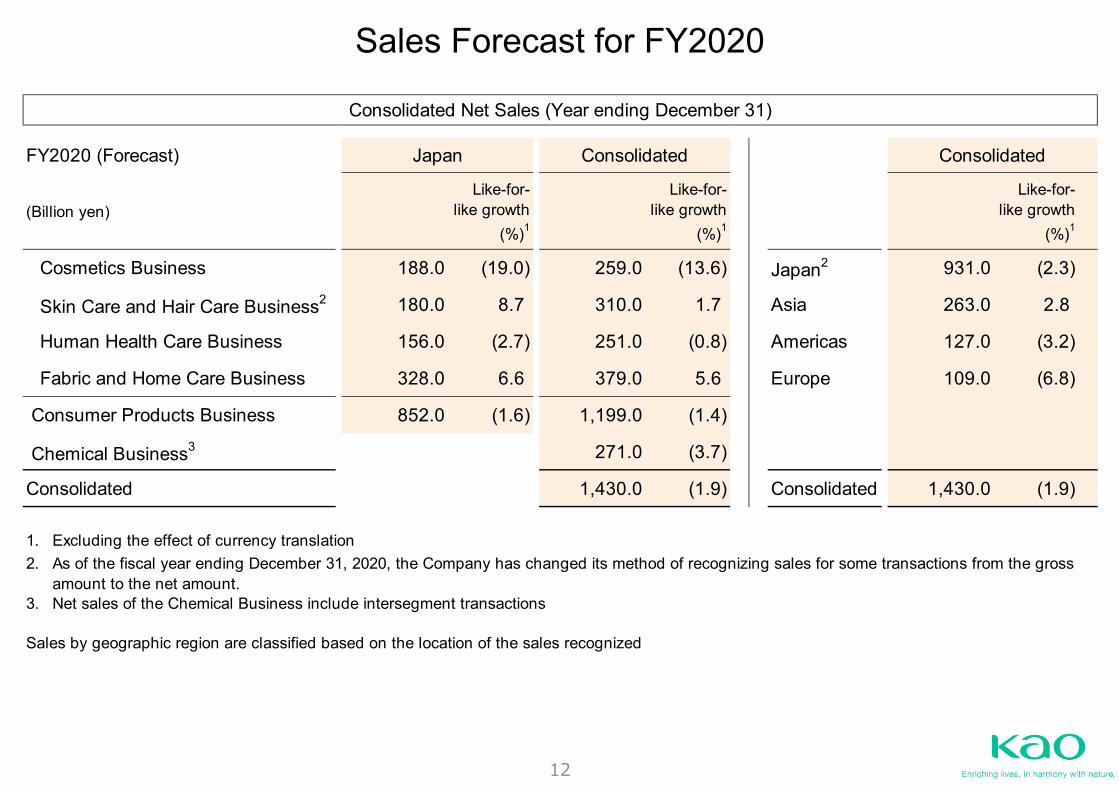
Sales Forecast for FY2020
FY2020 (Forecast)
(Billion yen)Like-for-
like growth(%)1
Like-for-like growth
(%)1
Like-for-like growth
(%)1
Cosmetics Business 188.0 (19.0) 259.0 (13.6) Japan2 931.0 (2.3)
Skin Care and Hair Care Business2 180.0 8.7 310.0 1.7 Asia 263.0 2.8
Human Health Care Business 156.0 (2.7) 251.0 (0.8) Americas 127.0 (3.2)
Fabric and Home Care Business 328.0 6.6 379.0 5.6 Europe 109.0 (6.8)
Consumer Products Business 852.0 (1.6) 1,199.0 (1.4)
Chemical Business3 271.0 (3.7)
Consolidated 1,430.0 (1.9) Consolidated 1,430.0 (1.9)
1. Excluding the effect of currency translation2.
3. Net sales of the Chemical Business include intersegment transactions
Sales by geographic region are classified based on the location of the sales recognized
As of the fiscal year ending December 31, 2020, the Company has changed its method of recognizing sales for some transactions from the grossamount to the net amount.
Consolidated ConsolidatedJapan
Consolidated Net Sales (Year ending December 31)
13
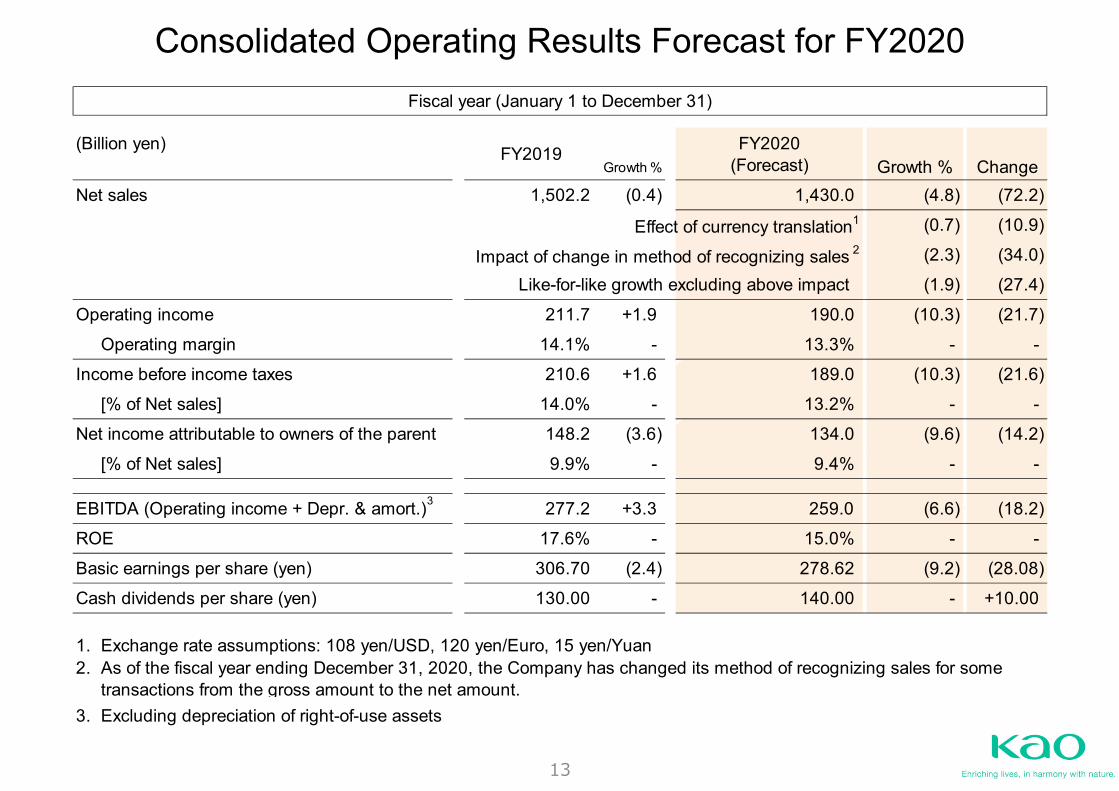
Consolidated Operating Results Forecast for FY2020
(Billion yen)Growth %
1,502.2 (0.4)
Effect of currency translation1
Impact of change in method of recognizing sales 2
Like-for-like growth excluding above impact
211.7 +1.9
Operating margin 14.1% -
210.6 +1.6
[% of Net sales] 14.0% -
148.2 (3.6)
[% of Net sales] 9.9% -
277.2 +3.3 ( 1 8 )
17.6% -
306.70 (2.4)
130.00 -
1. Exchange rate assumptions: 108 yen/USD, 120 yen/Euro, 15 yen/Yuan2.
3. Excluding depreciation of right-of-use assets
As of the fiscal year ending December 31, 2020, the Company has changed its method of recognizing sales for sometransactions from the gross amount to the net amount.
FY2019
Fiscal year (January 1 to December 31)
Cash dividends per share (yen)
Net sales
Operating income
Income before income taxes
Net income attributable to owners of the parent
(4.8)
(10.3)
(72.2)
EBITDA (Operating income + Depr. & amort.)
ROE
Basic earnings per share (yen)
+10.00
-
-
(0.7)
(2.3)
-
-
-
(10.9)
(34.0)
(Forecast)
-
-
(21.6)
(14.2)
(28.08)
(18.2)
Change
(21.7)
(27.4)
134.0
9.4%
259.0
15.0%
278.62
1,430.0
190.0
13.3%
189.0
13.2%
(9.6)
(9.2)
(6.6)
Growth %
(1.9)
(10.3)
-
-
140.00
FY2020
3
14
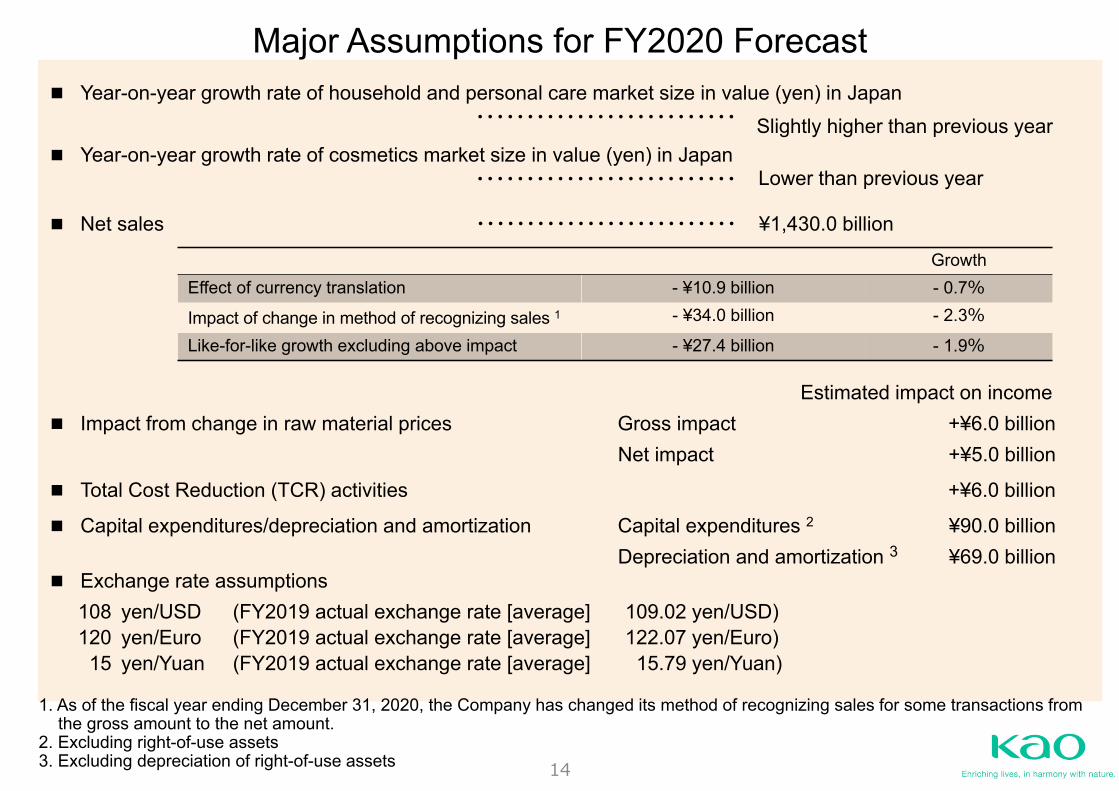
Major Assumptions for FY2020 Forecast Year-on-year growth rate of household and personal care market size in value (yen) in Japan
・・・・・・・・・・・・・・・・・・・・・・・・・・
Year-on-year growth rate of cosmetics market size in value (yen) in Japan・・・・・・・・・・・・・・・・・・・・・・・・・・
Net sales ・・・・・・・・・・・・・・・・・・・・・・・・・・ ¥1,430.0 billion
Estimated impact on income Impact from change in raw material prices Gross impact +¥6.0 billion
Net impact +¥5.0 billion
Total Cost Reduction (TCR) activities +¥6.0 billion
Capital expenditures/depreciation and amortization Capital expenditures 2 ¥90.0 billionDepreciation and amortization 3 ¥69.0 billion
Exchange rate assumptions108 yen/USD (FY2019 actual exchange rate [average] 109.02 yen/USD)120 yen/Euro (FY2019 actual exchange rate [average] 122.07 yen/Euro)15 yen/Yuan (FY2019 actual exchange rate [average] 15.79 yen/Yuan)
Slightly higher than previous year
Lower than previous year
GrowthEffect of currency translation - ¥10.9 billion - 0.7%Impact of change in method of recognizing sales 1 - ¥34.0 billion - 2.3%Like-for-like growth excluding above impact - ¥27.4 billion - 1.9%
1. As of the fiscal year ending December 31, 2020, the Company has changed its method of recognizing sales for some transactions from the gross amount to the net amount.
2. Excluding right-of-use assets3. Excluding depreciation of right-of-use assets
15
Even if circumstances worsen, we will fight to the finish without losing heart.
Inspired by our corporate philosophy, we will strive to be of service to society.
We will face this unprecedented crisisand accelerate our response to change.
16
Details of 1H FY2020 Consolidated Financial Results/Kao’s ESG Strategy
17
Consolidated Net Sales by Segment/Geographic Area(Six months ended June 30, 2020)
18
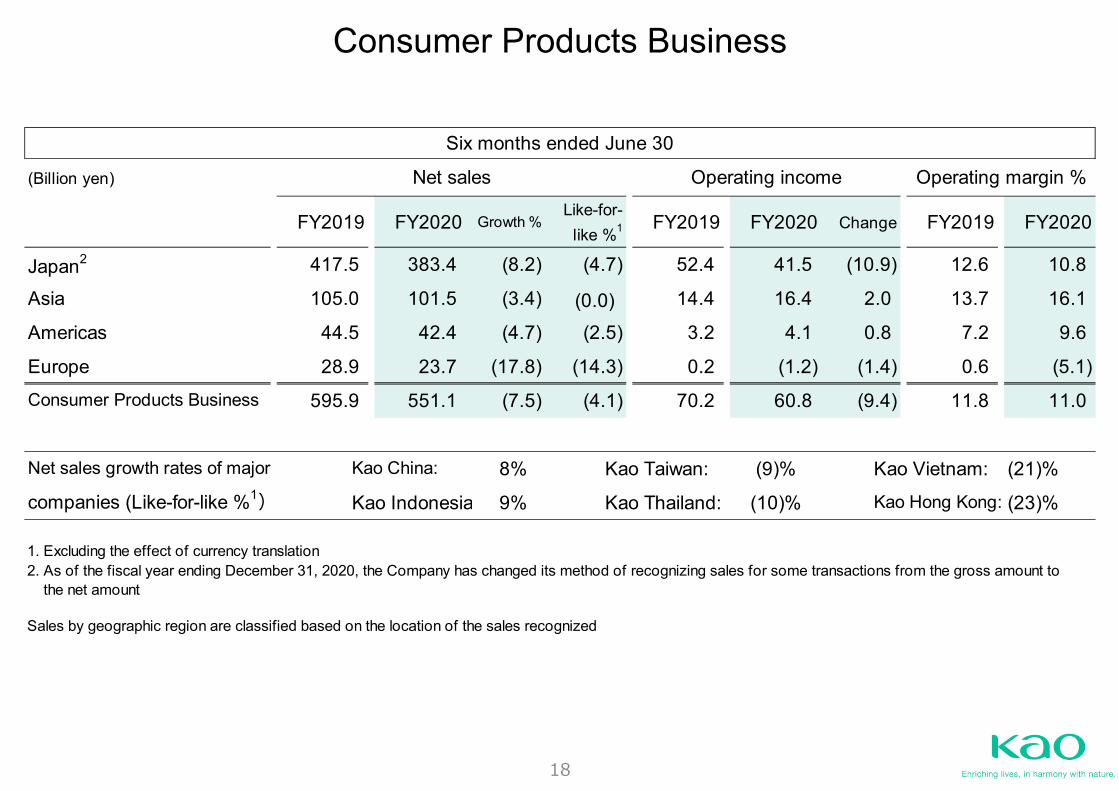
Consumer Products Business
(Billion yen)
FY2019 FY2020 Growth %Like-for-
like %1 FY2019 FY2020 Change FY2019 FY2020
417.5 383.4 (8.2) (4.7) 52.4 41.5 (10.9) 12.6 10.8
105.0 101.5 (3.4) 14.4 16.4 2.0 13.7 16.1
44.5 42.4 (4.7) (2.5) 3.2 4.1 0.8 7.2 9.6
28.9 23.7 (17.8) (14.3) 0.2 (1.2) (1.4) 0.6 (5.1)
595.9 551.1 (7.5) (4.1) 70.2 60.8 (9.4) 11.8 11.0
Net sales growth rates of major Kao China: 8% Kao Taiwan: (9)% Kao Vietnam: (21)%
companies (Like-for-like %1) Kao Indonesia 9% Kao Thailand: (10)% Kao Hong Kong: (23)%
1. Excluding the effect of currency translation
Sales by geographic region are classified based on the location of the sales recognized
Japan2
Operating margin %
2. As of the fiscal year ending December 31, 2020, the Company has changed its method of recognizing sales for some transactions from the gross amount to the net amount
Net sales Operating income
Consumer Products Business
Six months ended June 30
Asia
Americas
Europe
(0.0)
19
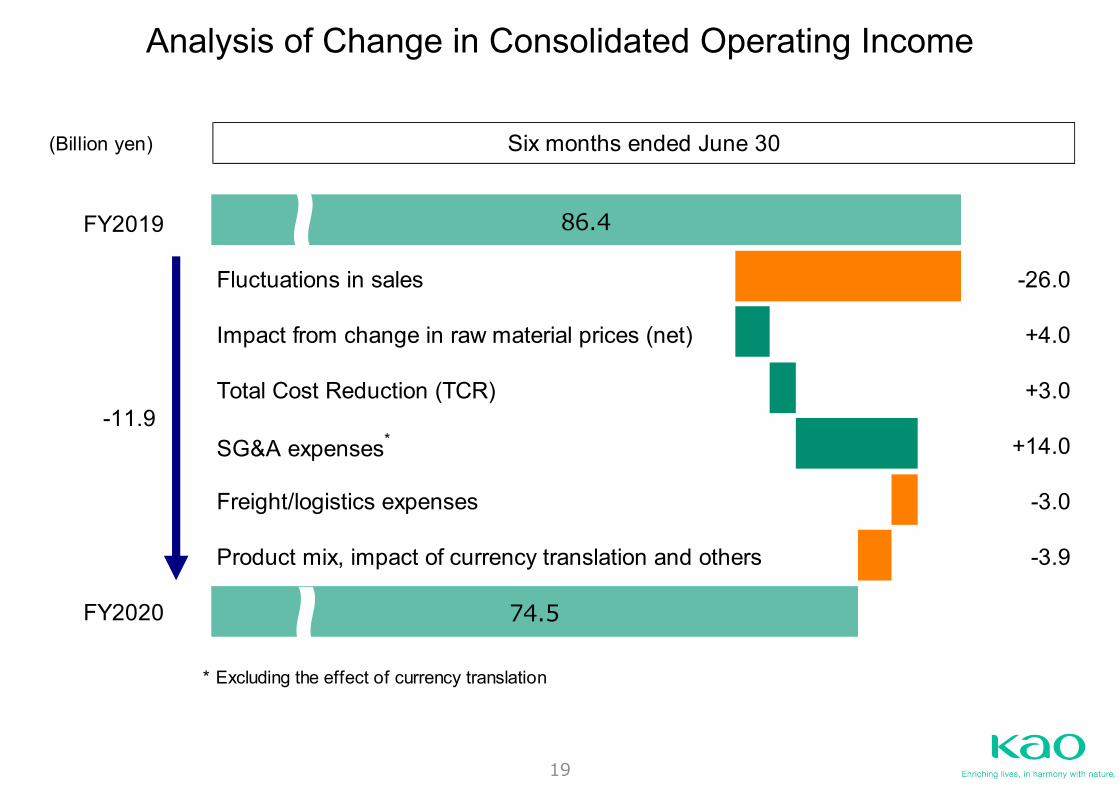
Analysis of Change in Consolidated Operating Income
(Billion yen)
FY2019
Fluctuations in sales -26.0
Impact from change in raw material prices (net) +4.0
Total Cost Reduction (TCR) +3.0
SG&A expenses* +14.0
Freight/logistics expenses -3.0
Product mix, impact of currency translation and others -3.9
FY2020
* Excluding the effect of currency translation
Six months ended June 30
-11.9
86.4
74.5
20
ESG Initiatives to Enhance Corporate Value
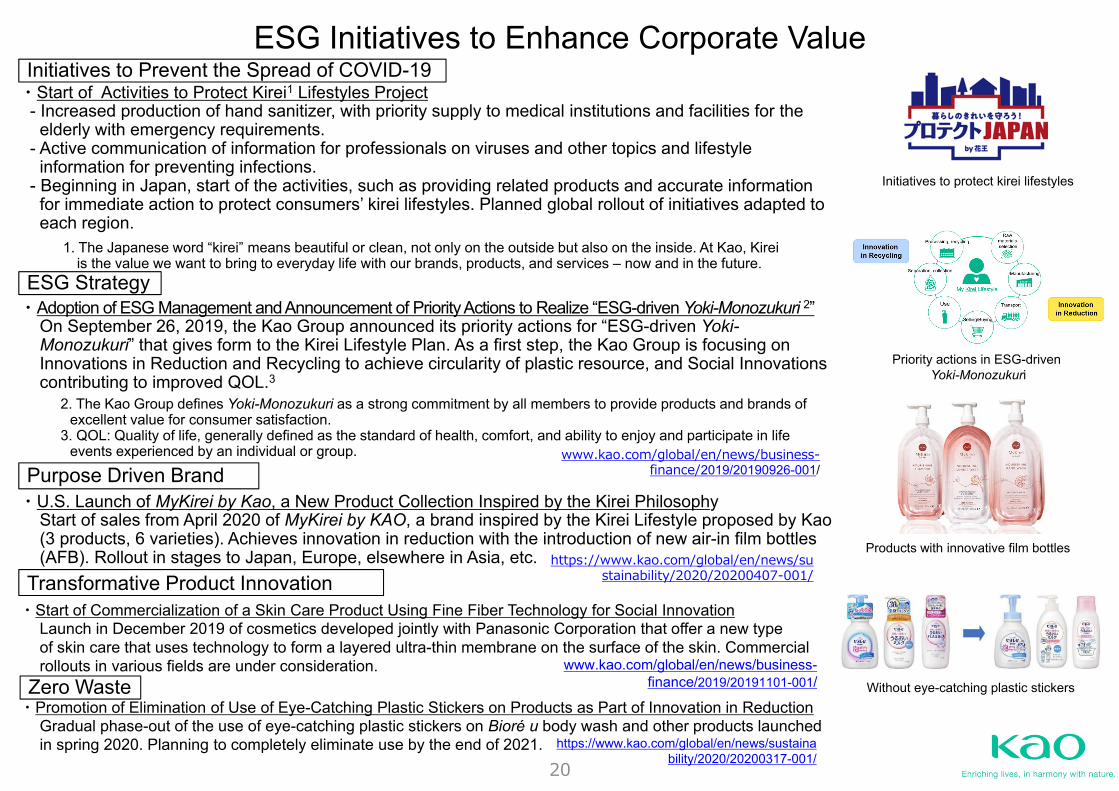
ESG Strategy
Purpose Driven Brand
Initiatives to Prevent the Spread of COVID-19
Without eye-catching plastic stickers
Transformative Product Innovation
Zero Waste
Initiatives to protect kirei lifestyles
Priority actions in ESG-driven Yoki-Monozukuri
Products with innovative film bottles
・Start of Activities to Protect Kirei1 Lifestyles Project- Increased production of hand sanitizer, with priority supply to medical institutions and facilities for the
elderly with emergency requirements.- Active communication of information for professionals on viruses and other topics and lifestyle
information for preventing infections.- Beginning in Japan, start of the activities, such as providing related products and accurate information
for immediate action to protect consumers’ kirei lifestyles. Planned global rollout of initiatives adapted to each region.
1. The Japanese word “kirei” means beautiful or clean, not only on the outside but also on the inside. At Kao, Kireiis the value we want to bring to everyday life with our brands, products, and services – now and in the future.
・Adoption of ESG Management and Announcement of Priority Actions to Realize “ESG-driven Yoki-Monozukuri 2”On September 26, 2019, the Kao Group announced its priority actions for “ESG-driven Yoki-Monozukuri” that gives form to the Kirei Lifestyle Plan. As a first step, the Kao Group is focusing on Innovations in Reduction and Recycling to achieve circularity of plastic resource, and Social Innovations contributing to improved QOL.3
2. The Kao Group defines Yoki-Monozukuri as a strong commitment by all members to provide products and brands of excellent value for consumer satisfaction.
3. QOL: Quality of life, generally defined as the standard of health, comfort, and ability to enjoy and participate in life events experienced by an individual or group.
・U.S. Launch of MyKirei by Kao, a New Product Collection Inspired by the Kirei PhilosophyStart of sales from April 2020 of MyKirei by KAO, a brand inspired by the Kirei Lifestyle proposed by Kao (3 products, 6 varieties). Achieves innovation in reduction with the introduction of new air-in film bottles (AFB). Rollout in stages to Japan, Europe, elsewhere in Asia, etc.
・Start of Commercialization of a Skin Care Product Using Fine Fiber Technology for Social InnovationLaunch in December 2019 of cosmetics developed jointly with Panasonic Corporation that offer a new typeof skin care that uses technology to form a layered ultra-thin membrane on the surface of the skin. Commercial rollouts in various fields are under consideration.
・Promotion of Elimination of Use of Eye-Catching Plastic Stickers on Products as Part of Innovation in ReductionGradual phase-out of the use of eye-catching plastic stickers on Bioré u body wash and other products launched in spring 2020. Planning to completely eliminate use by the end of 2021.
www.kao.com/global/en/news/business-finance/2019/20190926-001/
https://www.kao.com/global/en/news/sustainability/2020/20200407-001/
www.kao.com/global/en/news/business-finance/2019/20191101-001/
https://www.kao.com/global/en/news/sustainability/2020/20200317-001/
21
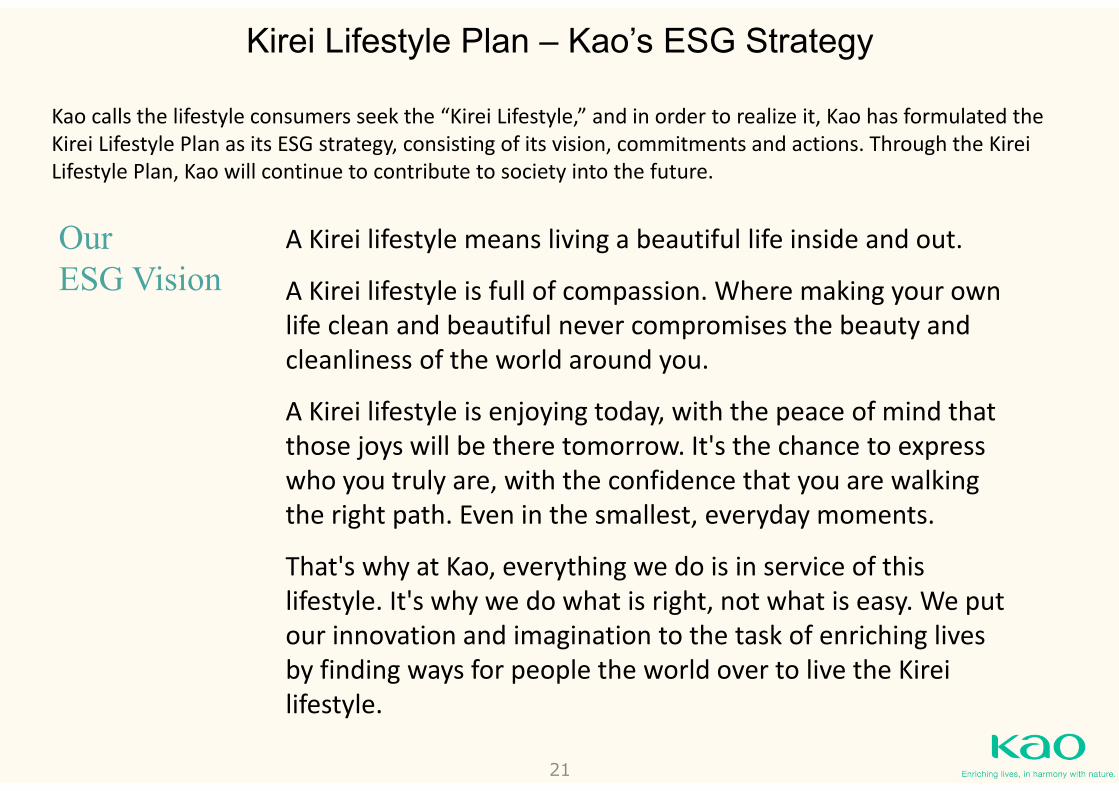
Kao calls the lifestyle consumers seek the “Kirei Lifestyle,” and in order to realize it, Kao has formulated the Kirei Lifestyle Plan as its ESG strategy, consisting of its vision, commitments and actions. Through the KireiLifestyle Plan, Kao will continue to contribute to society into the future.
A Kirei lifestyle means living a beautiful life inside and out.
A Kirei lifestyle is full of compassion. Where making your own life clean and beautiful never compromises the beauty and cleanliness of the world around you.
A Kirei lifestyle is enjoying today, with the peace of mind that those joys will be there tomorrow. It's the chance to express who you truly are, with the confidence that you are walking the right path. Even in the smallest, everyday moments.
That's why at Kao, everything we do is in service of this lifestyle. It's why we do what is right, not what is easy. We put our innovation and imagination to the task of enriching lives by finding ways for people the world over to live the Kireilifestyle.
OurESG Vision
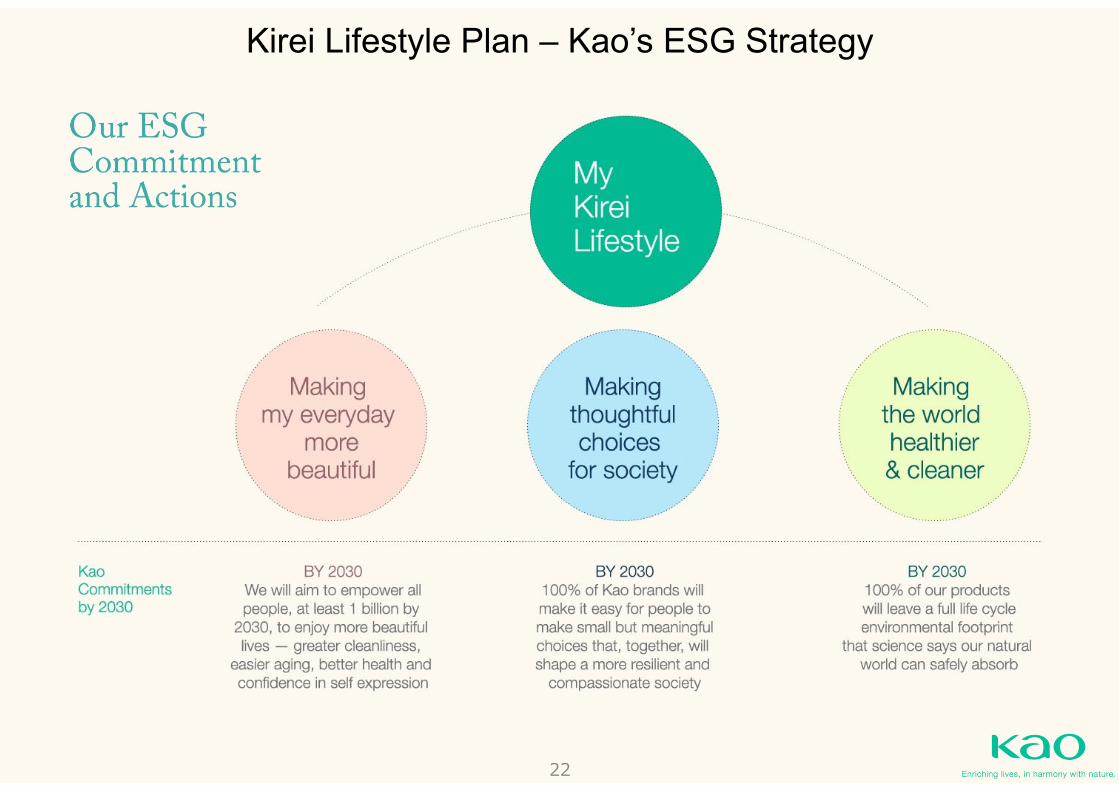
Kirei Lifestyle Plan – Kao’s ESG Strategy
22
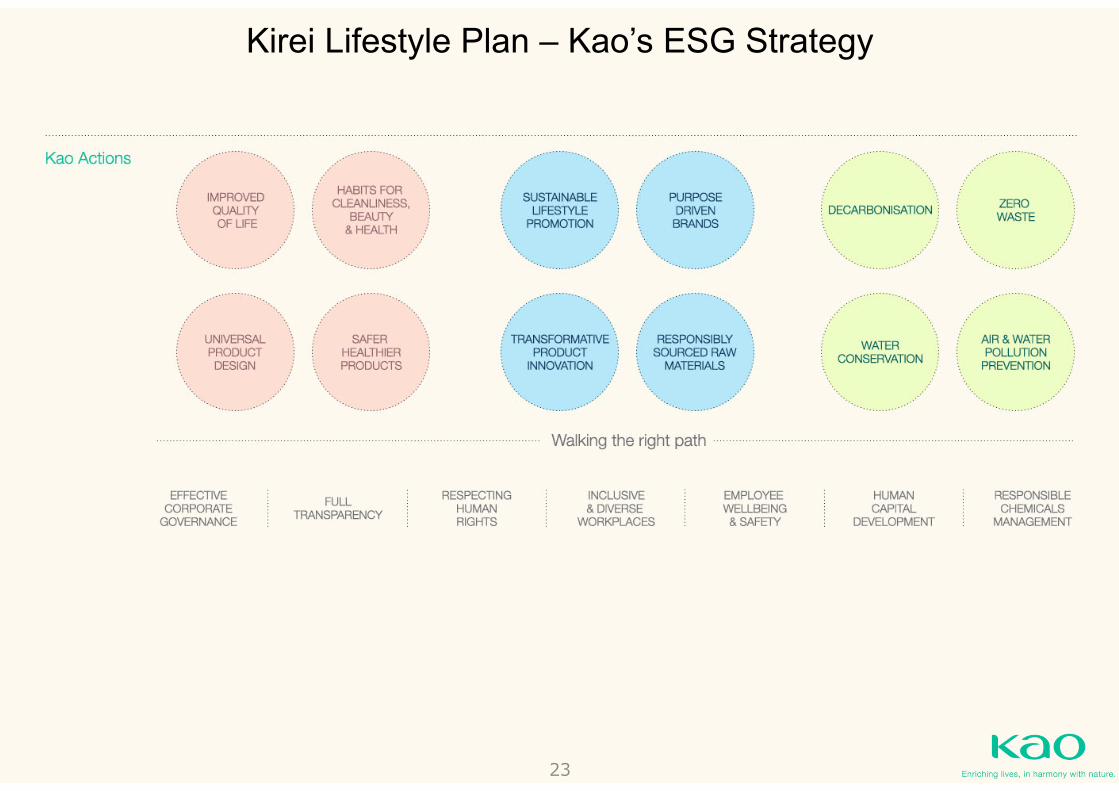
Kirei Lifestyle Plan – Kao’s ESG Strategy
23
Kirei Lifestyle Plan – Kao’s ESG Strategy
24
Use steadily generated cash flow effectively from an EVA standpoint as shown below toward further growth.
・ Investment for future growth (capital expenditures, M&A, etc.)
・ Steady and continuous cash dividends (40% payout ratio target)
・ Share repurchases and early repayment of interest-bearing debt including borrowings
* Net cash flows from operating activities
Use of Cash Flow* and Shareholder Returns
25
Historical Data
26
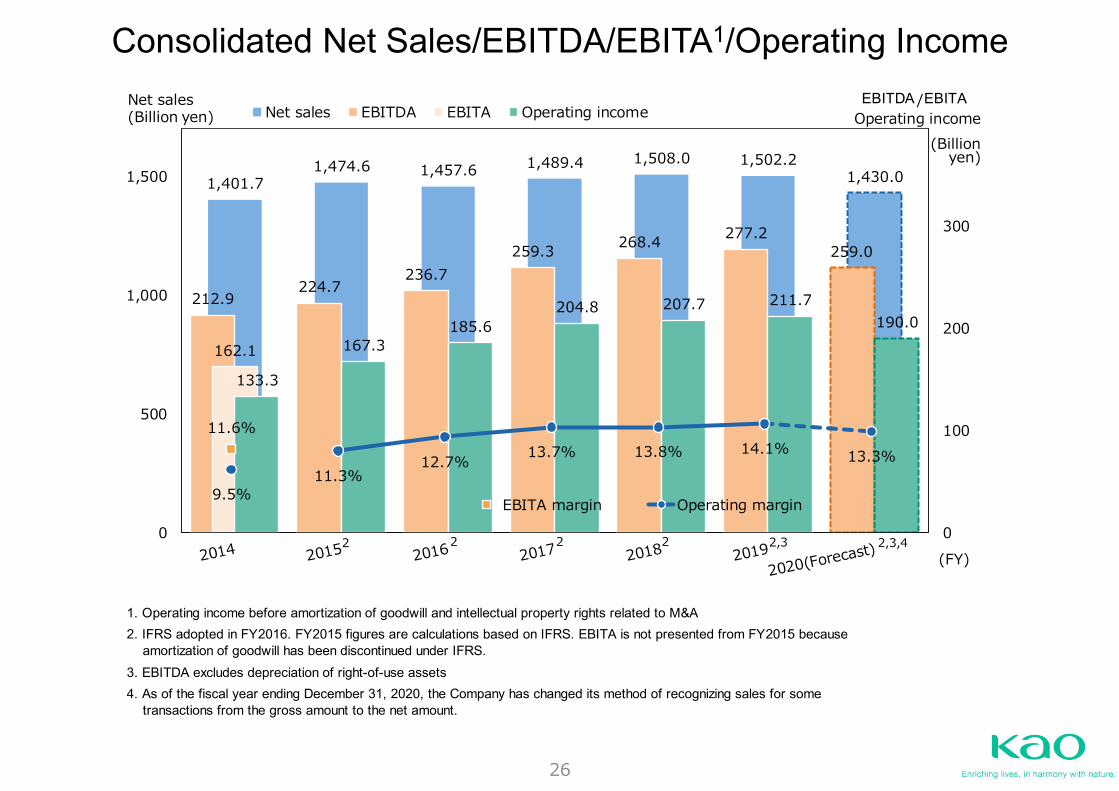
Consolidated Net Sales/EBITDA/EBITA1/Operating Income
1. Operating income before amortization of goodwill and intellectual property rights related to M&A
3. EBITDA excludes depreciation of right-of-use assets4. As of the fiscal year ending December 31, 2020, the Company has changed its method of recognizing sales for some transactions from the gross amount to the net amount.
2. IFRS adopted in FY2016. FY2015 figures are calculations based on IFRS. EBITA is not presented from FY2015 because amortization of goodwill has been discontinued under IFRS.
1,401.7 1,474.6 1,457.6 1,489.4 1,508.0 1,502.2
1,430.0
212.9 224.7
236.7 259.3 268.4 277.2
259.0
162.1
133.3
167.3 185.6
204.8 207.7 211.7 190.0
0
100
200
300
0
500
1,000
1,500
Net sales EBITDA EBITA Operating incomeNet sales EBITA
yen)
Operating income(Billion yen)
(FY)
EBITDA
(Billion
/
11.6%
9.5%11.3%
12.7% 13.7% 13.8% 14.1% 13.3%
EBITA margin Operating margin
22 2 2,32 2,3,4
27
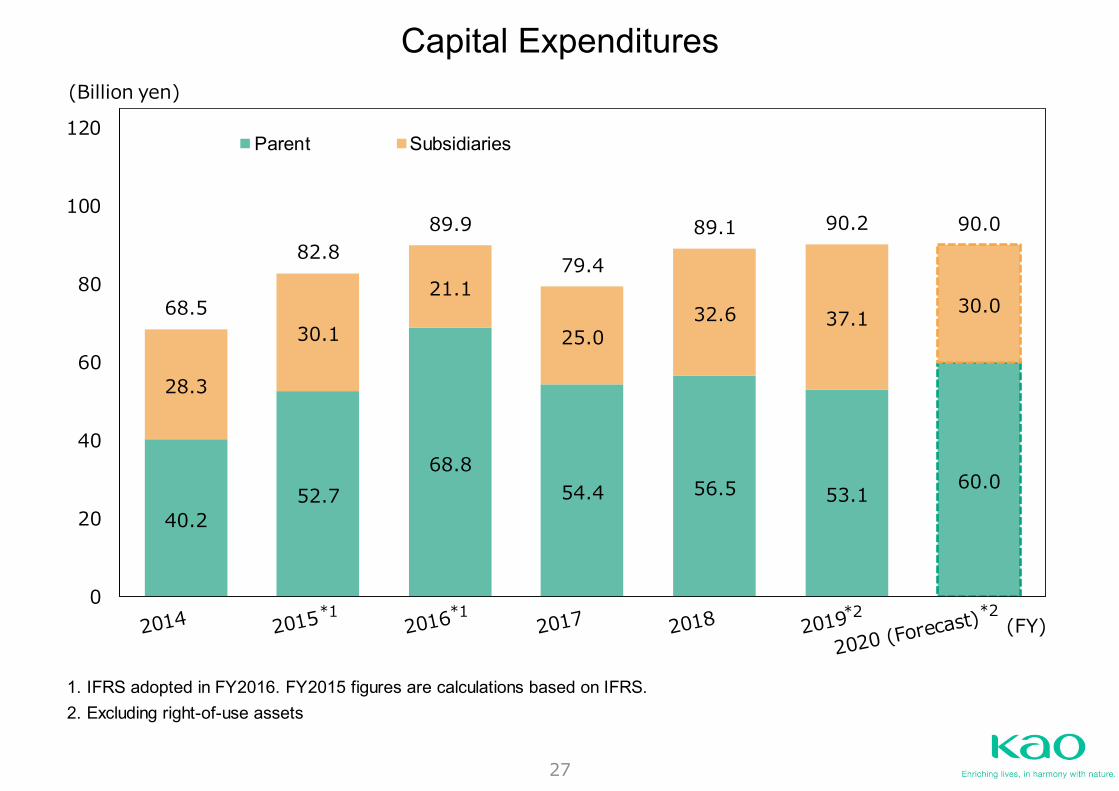
1. IFRS adopted in FY2016. FY2015 figures are calculations based on IFRS.2. Excluding right-of-use assets
40.2 52.7
68.8 54.4 56.5 53.1 60.0
28.3
30.1
21.1
25.0 32.6 37.1 30.0 68.5
82.8 89.9
79.4
89.1 90.2 90.0
0
20
40
60
80
100
120Parent
(Billion yen)
*1*1(FY)
*2 *2
Subsidiaries
Capital Expenditures
28
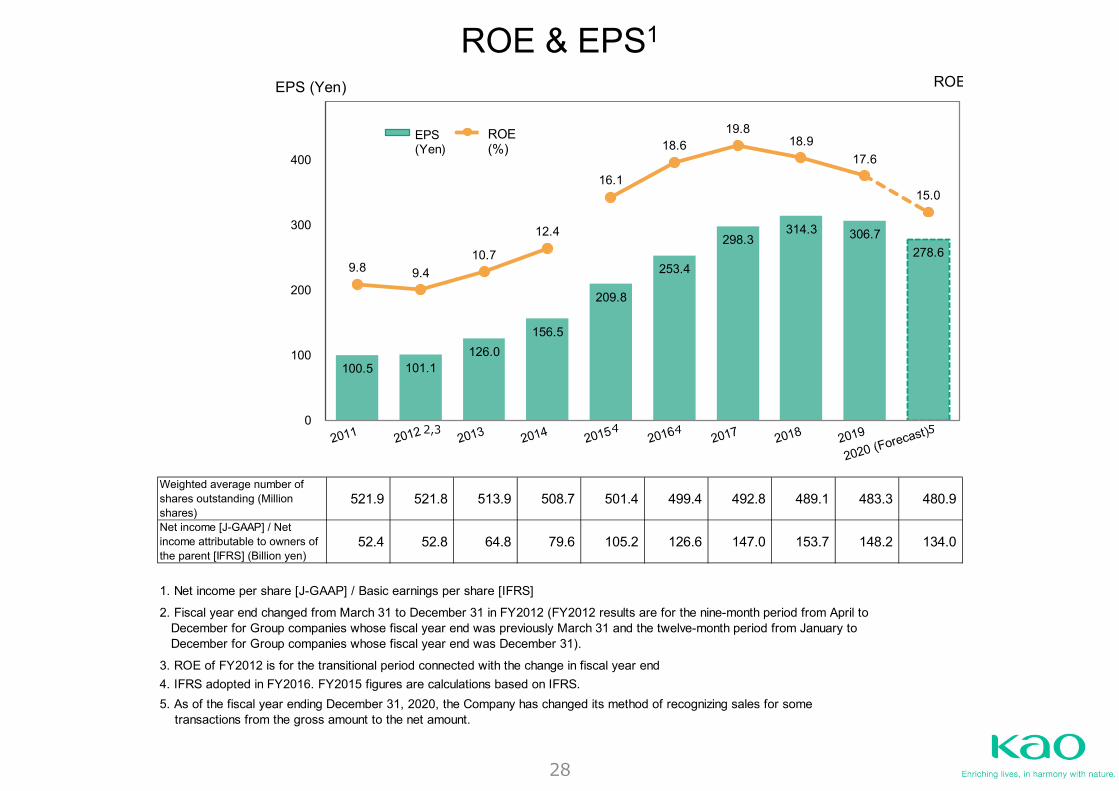
ROE & EPS1
Weighted average number ofshares outstanding (Millionshares)
521.9 521.8 513.9 508.7 501.4 499.4 492.8 489.1 483.3 480.9
Net income [J-GAAP] / Netincome attributable to owners ofthe parent [IFRS] (Billion yen)
52.4 52.8 64.8 79.6 105.2 126.6 147.0 153.7 148.2 134.0
1. Net income per share [J-GAAP] / Basic earnings per share [IFRS]
3. ROE of FY2012 is for the transitional period connected with the change in fiscal year end4. IFRS adopted in FY2016. FY2015 figures are calculations based on IFRS.
2. Fiscal year end changed from March 31 to December 31 in FY2012 (FY2012 results are for the nine-month period from April to December for Group companies whose fiscal year end was previously March 31 and the twelve-month period from January to December for Group companies whose fiscal year end was December 31).
5. As of the fiscal year ending December 31, 2020, the Company has changed its method of recognizing sales for some transactions from the gross amount to the net amount.
100.5 101.1 126.0
156.5
209.8
253.4
298.3 314.3 306.7
278.6 9.8 9.4
10.7
12.4
16.1
18.6 19.8
18.9 17.6
15.0
0
100
200
300
400
ROE (%)
ROE
2,3 44 5
EPS (Yen)
EPS(Yen)
ROE(%)
29
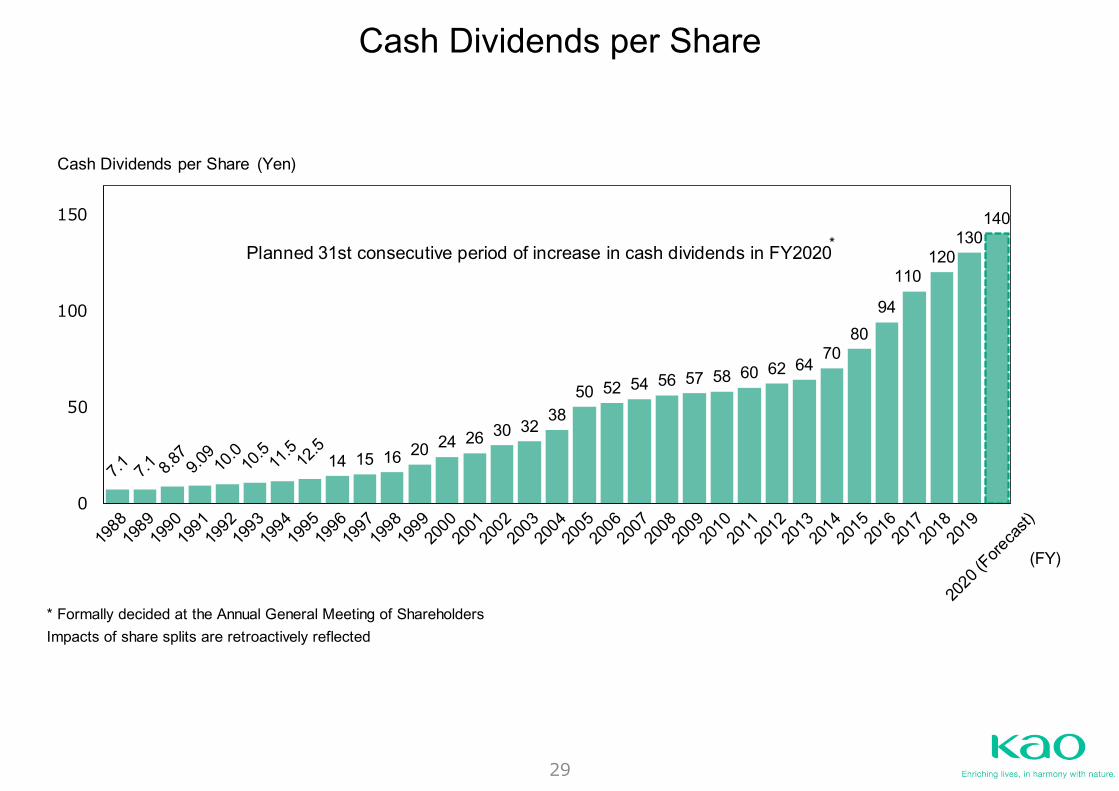
Cash Dividends per Share
* Formally decided at the Annual General Meeting of ShareholdersImpacts of share splits are retroactively reflected
14 15 16 20 24 26 30 32 38
50 52 54 56 57 58 60 62 64 70
80 94
110 120
130 140
0
50
100
150
(Yen)Cash Dividends per Share
Planned 31st consecutive period of increase in cash dividends in FY2020*
(FY)
30
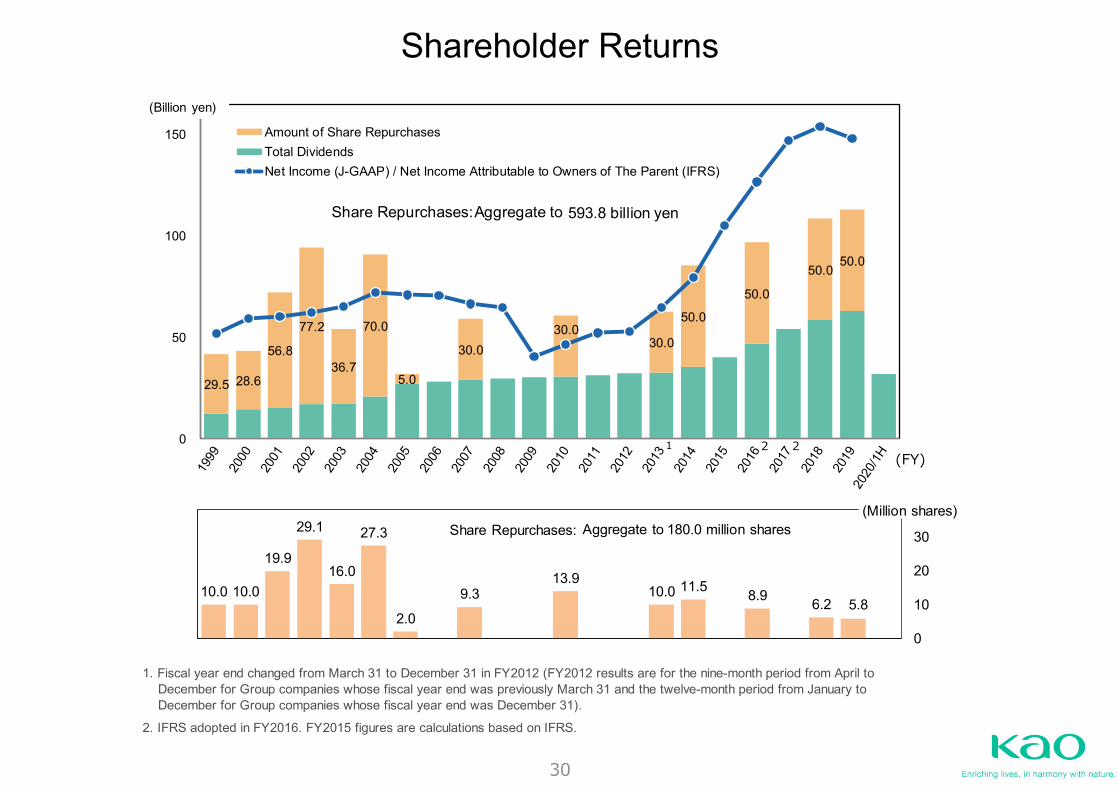
Shareholder Returns
2. IFRS adopted in FY2016. FY2015 figures are calculations based on IFRS.
1. Fiscal year end changed from March 31 to December 31 in FY2012 (FY2012 results are for the nine-month period from April to December for Group companies whose fiscal year end was previously March 31 and the twelve-month period from January to December for Group companies whose fiscal year end was December 31).
29.5 28.6
56.8
77.2
36.7
70.0
5.0
30.0 30.0
30.0
50.0
50.0
50.0 50.0
0
50
100
150 Amount of Share RepurchasesTotal DividendsNet Income (J-GAAP) / Net Income Attributable to Owners of The Parent (IFRS)
1 22(FY)
Aggregate to billion yen593.8Share Repurchases:
(Billion yen)
10.0 10.0
19.9
29.1
16.0
27.3
2.0
9.3 13.9
10.0 11.5 8.9 6.2
0
10
20
30
(Million shares)Aggregate to million shares180.0 Share Repurchases:
5.8
31
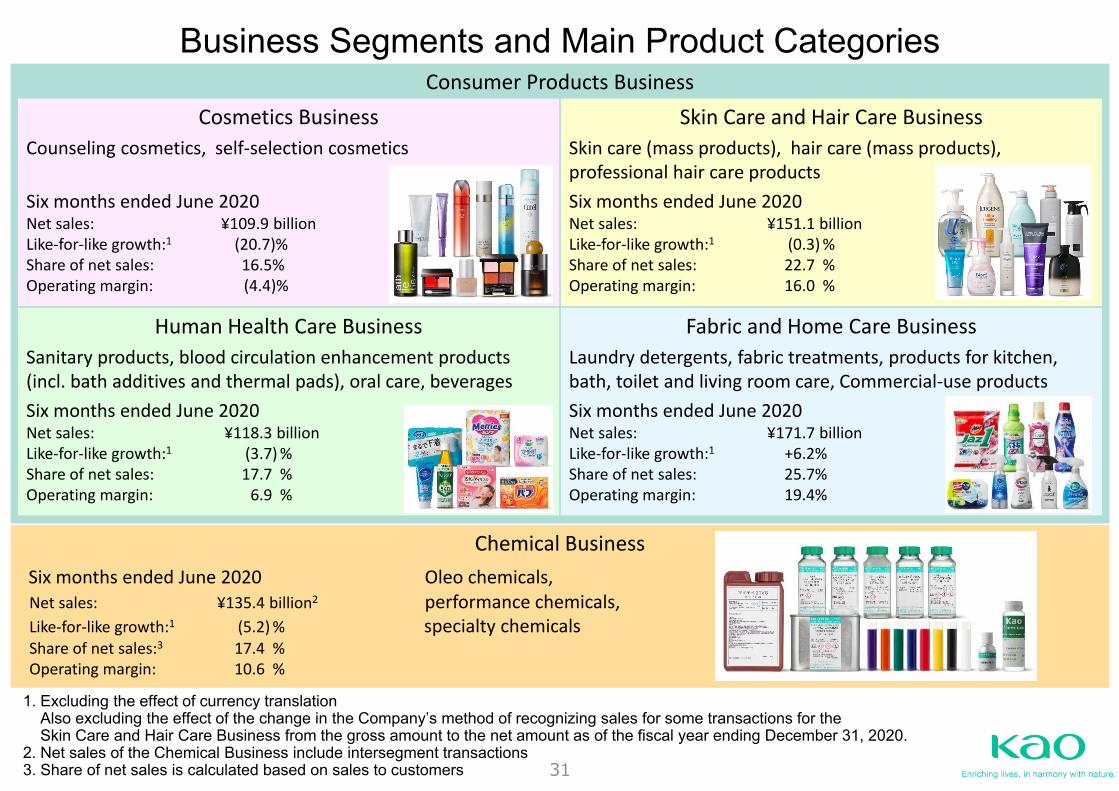
1. Excluding the effect of currency translationAlso excluding the effect of the change in the Company’s method of recognizing sales for some transactions for theSkin Care and Hair Care Business from the gross amount to the net amount as of the fiscal year ending December 31, 2020.
2. Net sales of the Chemical Business include intersegment transactions3. Share of net sales is calculated based on sales to customers
Business Segments and Main Product CategoriesConsumer Products Business
Fabric and Home Care BusinessLaundry detergents, fabric treatments, products for kitchen, bath, toilet and living room care, Commercial‐use productsSix months ended June 2020Net sales: ¥171.7 billionLike‐for‐like growth:1 +6.2%Share of net sales: 25.7%Operating margin: 19.4%
Skin Care and Hair Care BusinessSkin care (mass products), hair care (mass products), professional hair care productsSix months ended June 2020Net sales: ¥151.1 billionLike‐for‐like growth:1 (0.3)%Share of net sales: 22.7 %Operating margin: 16.0 %
Human Health Care BusinessSanitary products, blood circulation enhancement products(incl. bath additives and thermal pads), oral care, beveragesSix months ended June 2020Net sales: ¥118.3 billionLike‐for‐like growth:1 (3.7)%Share of net sales: 17.7 %Operating margin: 6.9 %
Chemical BusinessSix months ended June 2020 Oleo chemicals,Net sales: ¥135.4 billion2 performance chemicals, Like‐for‐like growth:1 (5.2)% specialty chemicalsShare of net sales:3 17.4 %Operating margin: 10.6 %
Cosmetics BusinessCounseling cosmetics, self‐selection cosmetics
Six months ended June 2020Net sales: ¥109.9 billionLike‐for‐like growth:1 (20.7)%Share of net sales: 16.5%Operating margin: (4.4)%