consolidated financial results of the year ended march 31
TRANSCRIPT

MAY 12, 2011
Consolidated Financial Results of the year ended March 31, 2011 (Japanese Standards)
Company name: NIKON CORPORATION Code number: 7731; Stock listings: Tokyo Stock Exchange URL http://www.nikon.co.jp/ Representative: Makoto Kimura, Representative Director and President Contact: Masayuki Hatori, General Manager, Corporate Communications & IR Department TEL: +81-3-3216-1032 Date for the annual shareholders’ meeting: June 29, 2011 Date for the filing of the consolidated financial statements: June 29, 2011 Date of year-end dividend payout: June 30, 2011 Preparation of supplementary materials for financial results: Yes Information meeting for financial results to be held: Yes (for institutional investors and analysts)
Note: Amounts less than 1 million yen are omitted.
1. Consolidated Results of the year ended March 31, 2011 (From April 1, 2010 to March 31, 2011) (1) Financial Results (Percentage represents comparison change to the corresponding previous period)
Net Sales Operating Income Ordinary Income Net Income Million yen % Million yen % Million yen % Million yen %
Year ended March 31, 2011 887,512 13.0 54,052 - 55,811 - 27,312 - Year ended March 31, 2010 785,498 (10.7) (13,854) - (15,334) - (12,615) -
(Note) Comprehensive Income: Year ended March, 2011; 20,323 million yen ( - %) Year ended March, 2010; (3,352) million yen ( - %)
Net Income per Share of Common
Stock
Net Income per Share of Common
Stock after Dilution
Ratio of Net Income to
Shareholders’ Equity
Ratio of Ordinary Income
to Total Assets
Ratio of Operating Income
to Net Sales Yen Yen % % %
Year ended March 31, 2011 68.90 68.83 7.2 7.1 6.1 Year ended March 31, 2010 (31.82) - (3.4) (2.1) (1.8)
(Reference) Equity in Earning of non-consolidated subsidiaries and affiliates: Year ended March, 2011; ,231 million yen 1 Year ended March, 2010; 992 million yen (2) Financial Position Total Assets Net Assets Equity Ratio Net Assets per Share of
Common Stock Million yen Million yen % Yen
Year ended March 31, 2011 829,909 389,220 46.8 980.62Year ended March 31, 2010 740,632 372,069 50.2 937.75
(Reference) Equity: Year ended March 31, 2011: 388,793 million yen Year ended March 31, 2010: 371,743 million yen (3) Cash Flows Cash Flows from
Operating Activities Cash Flows from
Investing ActivitiesCash Flows from
Financing Activities Cash and Cash Equivalents
at end of year Million yen Million yen Million yen Million yen
Year ended March 31, 2011 123,613 (23,589) (20,122) 181,061Year ended March 31, 2010 103,497 (47,107) (31,476) 104,669
2. Dividends Dividend per share
First Quarter ended
Second Quarter ended
Third Quarter ended Year-end Annual
Yen Yen Yen Yen YenYear ended March 31, 2010 - 4.00 - 4.00 8.00Year ended March 31, 2011 - 5.00 - 14.00 19.00Year ending March 31, 2012 (Forecast) 10.00 17.00 27.00
Total Annual Cash Dividend
Paid Dividend Payout Ratio
(Consolidated) Dividend Payout to Net
Assets Ratio (Consolidated) Million yen % %Year ended March 31, 2010 3,171 - 0.8Year ended March 31, 2011 7,532 27.6 2.0Year ending March 31, 2012 (Forecast) 25.5
1

2
3. Consolidated Financial Forecasts for the year ending March 31, 2012 (From April 1, 2011 to March 31, 2012) (Percentage represents comparison to previous fiscal year)
Net Sales Operating Income Ordinary Income Net Income Net Income per
Share of Common Stock
Million yen % Million yen % Million yen % Million yen % YenSecond quarter ending
September 30, 2011 435,000 9.3 25,000 64.8 26,000 45.9 16,000 50.4 40.36
Full year 940,000 5.9 68,000 25.8 70,000 25.4 42,000 53.8 105.94 4. Other (1) Changes of significant subsidiaries during the current fiscal year (change of specified subsidiaries that affected the
scope of consolidated reporting): None (2) Changes of accounting policies applied, procedures and methods of presentation for preparing consolidated financial
statements 1. Changes by revision of accounting standards: Yes 2. Changes other than the above: None
(3) Number of shares issued (common stock)
1. Number of shares issued as of the term end (including treasury stocks): Year ended March 31, 2011 400,878,921 shares Year ended March 31, 2010 400,878,921 shares
2. Number of treasury stock as of the term end: Year ended March 31, 2011 4,401,391 shares Year ended March 31, 2010 4,458,536 shares
3. Average number of shares during the term: Year ended March 31, 2011 396,434,820 shares Year ended March 31, 2010 396,398,498 shares
3
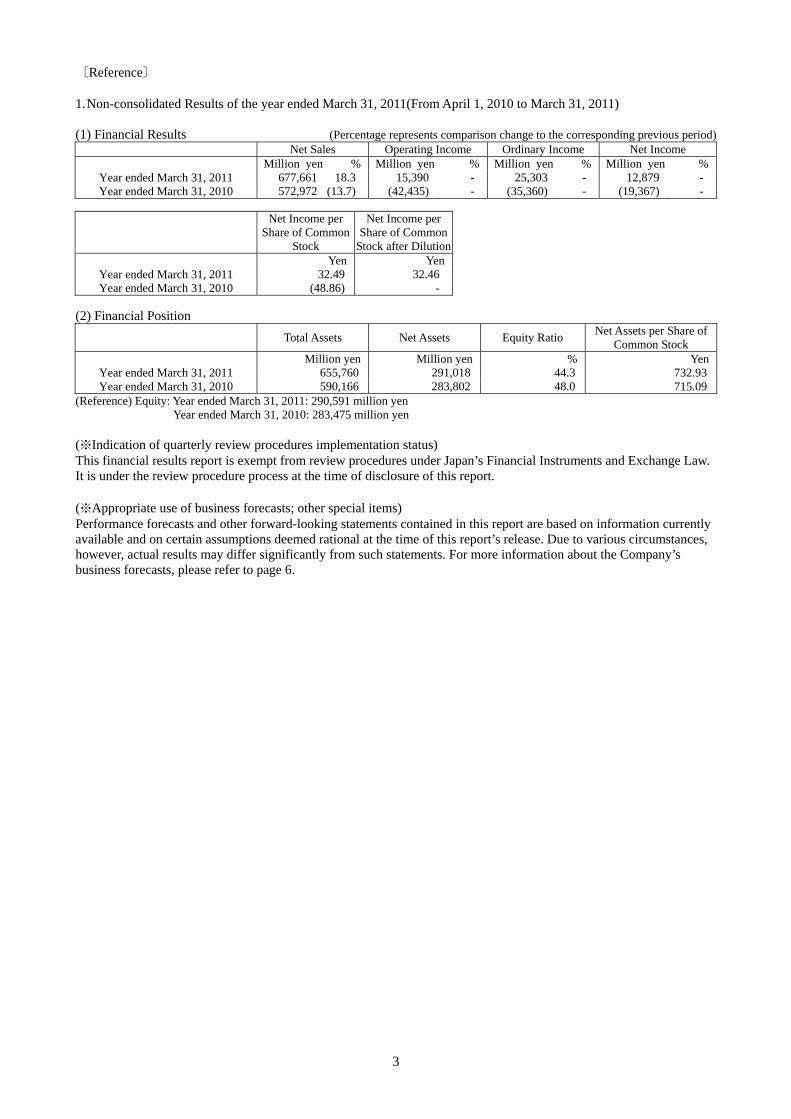
〔Reference〕 1. Non-consolidated Results of the year ended March 31, 2011(From April 1, 2010 to March 31, 2011) (1) Financial Results (Percentage represents comparison change to the corresponding previous period)
Net Sales Operating Income Ordinary Income Net Income Million yen % Million yen % Million yen % Million yen %
Year ended March 31, 2011 677,661 18.3 15,390 - 25,303 - 12,879 - Year ended March 31, 2010 572,972 (13.7) (42,435) - (35,360) - (19,367) -
Net Income per
Share of Common Stock
Net Income per Share of Common
Stock after Dilution Yen Yen
Year ended March 31, 2011 32.49 32.46 Year ended March 31, 2010 (48.86) -
(2) Financial Position Total Assets Net Assets Equity Ratio Net Assets per Share of
Common Stock Million yen Million yen % Yen
Year ended March 31, 2011 655,760 291,018 44.3 732.93Year ended March 31, 2010 590,166 283,802 48.0 715.09
(Reference) Equity: Year ended March 31, 2011: 290,591 million yen Year ended March 31, 2010: 283,475 million yen (※Indication of quarterly review procedures implementation status) This financial results report is exempt from review procedures under Japan’s Financial Instruments and Exchange Law. It is under the review procedure process at the time of disclosure of this report. (※Appropriate use of business forecasts; other special items) Performance forecasts and other forward-looking statements contained in this report are based on information currently available and on certain assumptions deemed rational at the time of this report’s release. Due to various circumstances, however, actual results may differ significantly from such statements. For more information about the Company’s business forecasts, please refer to page 6.

4
Contents
1. Operating Results ・・・・・・・・・・・・・・・・・・・・・・・・・・・・・・・・・・・・・・・・・・・・・・・・・・・・・・・・・5
(1) Analysis of operating results ・・・・・・・・・・・・・・・・・・・・・・・・・・・・・・・・・・・・・・・・・・・・・5 (2) Analysis of financial position ・・・・・・・・・・・・・・・・・・・・・・・・・・・・・・・・・・・・・・・・・・・・7 (3) Shareholder returns policy and dividends ・・・・・・・・・・・・・・・・・・・・・・・・・・・・・・・・・・・7 (4) Business and Other Risks・・・・・・・・・・・・・・・・・・・・・・・・・・・・・・・・・・・・・・・・・・・・・・・・8
2. Status of Nikon Group ・・・・・・・・・・・・・・・・・・・・・・・・・・・・・・・・・・・・・・・・・・・・・・・・・・・・・11 3. Management Policies ・・・・・・・・・・・・・・・・・・・・・・・・・・・・・・・・・・・・・・・・・・・・・・・・・・・・・・12
(1) Company’s Basic Management Policies ・・・・・・・・・・・・・・・・・・・・・・・・・・・・・・・・・・・・12 (2) Targeted management indices ・・・・・・・・・・・・・・・・・・・・・・・・・・・・・・・・・・・・・・・・・・・・12 (3) Medium and long-term management strategies and issues to be addressed ・・・・・・・・・12 (4) Other Important Matters in Business Management ・・・・・・・・・・・・・・・・・・・・・・・・・・・・・・・12
4. Consolidated Financial Statements ・・・・・・・・・・・・・・・・・・・・・・・・・・・・・・・・・・・・・・・・・・・・13 (1) Consolidated Balance Sheets ・・・・・・・・・・・・・・・・・・・・・・・・・・・・・・・・・・・・・・・・・・・・・13 (2) Consolidated Statements of Income and Statements of Comprehensive Income ・・・・・15 (3) Consolidated Statements of Changes in Net Assets ・・・・・・・・・・・・・・・・・・・・・・・・・・・17 (4) Consolidated Statement of Cash Flows ・ ・・・・・・・・・・・・・・・・・・・・・・・・・・・・・・・・・・19 ・
(5) Note on assumptions for going concern ・・・・・・・・・・・・・・・・・・・・・・・・・・・・・・・・・・・・20 (6) Basis of Presenting Consolidated Financial Statements ・・・・・・・・・・・・・・・・・・・・・・・・20 (7) Changes in Basis of Presenting Consolidated Financial Statements ・・・・・・・・・・・・・・20 (8) Notes to Consolidated Financial Statements ・・・・・・・・・・・・・・・・・・・・・・・・・・・・・・・・21
1) Consolidated Statements of Income ・・・・・・・・・・・・・・・・・・・・・・・・・・・・・・・・・・・21 2) Consolidated Statements of Comprehensive Income ・・・・・・・・・・・・・・・・・・・・・・21 3) Segment Information ・・・・・・・・・・・・・・・・・・・・・・・・・・・・・・・・・・・・・・・・・・・・・・・22 4) Segment Information ・・・・・・・・・・・・・・・・・・・・・・・・・・・・・・・・・・・・・・・・・・・・・・・23 5) Per-Share Information ・・・・・・・・・・・・・・・・・・・・・・・・・・・・・・・・・・・・・・・・・・・・・・・・・25
5. Non-Consolidated Financial Statements ・・・・・・・・・・・・・・・・・・・・・・・・・・・・・・・・・・・・・・・・26 (1) Non-Consolidated Balance Sheets ・・・・・・・・・・・・・・・・・・・・・・・・・・・・・・・・・・・・・・・・・26 (2) Non-Consolidated Statements of Income ・・・・・・・・・・・・・・・・・・・・・・・・・・・・・・・・・・・28 (3) Non-Consolidated Statements of Changes in Net Assets ・・・・・・・・・・・・・・・・・・・・・・・・・29

5
1. Operating Results
1. Analysis of operating results
(1) Overview of the fiscal year ended March 31, 2011 During the consolidated fiscal year ended March 31, 2011, both markets of the Precision Equipment Business,
semiconductor-related and liquid crystal panel-related, remained on a recovery trend. In the Imaging Products Business, the compact digital camera market remained solid, especially in the emerging countries, while the digital SLR (single-lens reflex) camera market continued to expand, following the previous fiscal year. In the Instruments Business, although conditions were severe in the bioscience-related market, there were strong capital investments in the industrial instruments-related markets.
Amid this situation, the Group introduced new products to the market in a timely manner, and made efforts to expand its sales bases in the markets of emerging countries. The Group also endeavored to improve its corporate structure, including shortening production lead time and thorough cost reductions.
Although operations at some facilities halted as a result of the Great East Japan Earthquake and its aftermath, the Group put forth a united effort toward recovery, and all facilities were able to resume operations before the end of March.
As a result of the foregoing, net sales for the consolidated fiscal year increased by 102,014 million yen (13.0%) year-on-year to 887,512 million yen, operating income totaled 54,052 million yen (compared with an operating loss of 13,854 million yen in the previous consolidated fiscal year), ordinary income was 55,811 million yen (compared with an ordinary loss of 15,334 million yen in the previous consolidated fiscal year), and a net income of 27,312 million yen was posted (compared with a net loss of 12,615 million yen in the previous consolidated fiscal year).
Performance by business segment is as follows.
1) Precision Equipment Business
Of the markets related to the business, both semiconductor-related and liquid crystal panel-related markets showed recovery throughout the fiscal year, and manufacturers made vigorous capital investments.
Amid this situation, the Group made focused efforts to strengthen the competitiveness of products in the market, while making ongoing efforts in the area of IC steppers and scanners to promote the sales of such cutting-edge models as the NSR-S610C ArF immersion scanner and NSR-S620D ArF immersion scanner compatible with double patterning that enables the semiconductor mass production with line widths of 32 nm or less.
In the area of LCD steppers and scanners, efforts were made to expand sales in the markets including China, which the Group has recently entered, with a focus on the ideal devices for the manufacture of large liquid crystal displays, including models compatible with 8th-generation plate sizes, while steppers and scanners for liquid crystal panels suitable for smart-phone/tablet terminals enjoyed growth in orders.
In addition, the Group made continuous efforts to strengthen business structure overall mainly by shortening manufacturing periods and adopting common platforms.
As a result of the foregoing, the business saw significant recovery as its net sales increase by 39.0% from the previous fiscal year to 208,613 million yen and incurred operating income of 2,711 million yen (compared with an operating loss of 58,557 million yen in the previous fiscal year).
2) Imaging Products Business
Of the markets related to the business, there was strong growth in the digital SLR camera market in each region, while the compact digital camera market remained solid throughout the fiscal year, especially in the emerging countries, despite some trends toward decline during the latter half of the second half of the fiscal year.
Amid this situation, the Group achieved strong sales of digital SLR cameras, including strong growth in sales of the entry-level model D3100, which was launched in September 2010, and strong sales of the mid-class D7000, which was launched in October 2010.
Compact digital cameras increased their shares of the market in each region compared with the previous fiscal year, thanks to the sales growth of the slim model COOLPIX S3000, the high magnification zoom model COOLPIX P100 and COOLPIX L110 as well as the slim high magnification model COOLPIX S8100. Popularity of the aforementioned models led to the capture of a leading share in the North American market in the second half of the fiscal year.
With regard to interchangeable lenses, sales of digital SLR camera lens kits grew, and sales of high-priced lenses were strong as well. In March 2011, cumulative production of the NIKKOR lens for SLR cameras reached 60 million units.
The Group also offered new ways to enjoy digital images, including the February 2011 launch of the new My Picturetown 3D service. My Picturetown 3D enables consumers to convert regular digital images into 3D images via the Internet, and display and watch them in a dedicated digital photo frame. The Group also expanded its sales sites while endeavored to raise production procurement in foreign currencies.
As a result of the foregoing, despite the effect of the strong yen, net sales increased by 4.7% from the previous fiscal year to 596,375 million yen, while operating income increased by 0.4% to 52,331 million yen.

6
3) Instruments Business Of the markets related to the business, despite a severe environment in the bioscience-related markets due to such
factors as reduced public-sector budgets in some regions, there were solid capital investments in the industrial instruments-related markets, including semiconductors, power generation, and electronic components.
Under these circumstances, the bioscience business worked to expand sales with a focus on high-end system products, including the super resolution microscope system N-SIM and N-STORM, etc.
The industrial instruments business enjoyed a considerable increase in sales of industrial microscopes, measuring instruments and semiconductor inspection equipment from the previous fiscal year, thanks to recovery of the Japanese and Asian markets. The Group also launched such distinctive new products as the digital microscope ShuttlePix P-400R and the Non-contact Multi-sensor 3D Metrology System HN-6060.
As a result of the foregoing, net sales increased by 27.5% from the previous fiscal year to 57,451 million yen, while operating loss was 5,247 million yen (compared with an operating loss of 9,330 million yen in the previous fiscal year) due in part to the effect of the foreign exchange rates.
4) Other Businesses
The customized products business made efforts to expand sales of space-related products, optical components and solid-state lasers, while the glass-related business endeavored to expand sales of LCD photomask substrates, and the sport optics products business made efforts to expand sales of laser rangefinders and binoculars.
As a result of the foregoing, net sales of these businesses increased by 20.1% from the previous fiscal year to 25,071 million yen, while operating income increased by 152.7% from the previous fiscal year to 4,258 million yen.
(2) Forecast for the fiscal year ending March 31, 2012 As regards the business segments of the Nikon Group, semiconductor-related manufacturing clients are expected
to continue to make strong capital investments. Liquid crystal panel-related clients are expected to shift their capital investments from large to mid-sized and smaller panels, and demand for devices is expected. In the digital camera market, demand is expected to continue to grow. Turning to the Instruments Business, the bioscience-related business is expected to remain stable, while the industrial instruments-related business is expected to show signs of recovery.
Under these circumstances, the Nikon Group will endeavor to establish an even stronger production system, making efforts to restore and strengthen its supply chain, which was impacted by the earthquake and its aftermath in March, with consideration for response to the situation of electric power supply.
The Group will also continue its efforts to launch new products meeting market needs in a timely manner, and to grow and strengthen its main businesses through a commitment to efficient and effective expansion in the markets of emerging countries, and increasing the speed and collaboration of its business processes.
In addition, the Group will continue its efforts to promote new businesses and search for new domains in order to find business segments that create new value, and further grow the Nikon Brand. The Group will additionally endeavor to build and improve a risk-management system capable of responding to disasters and other emergencies swiftly and appropriately.
Through these measures, the Nikon Group is committed to continued growth, and continually offering new value. Current forecast for the fiscal year ending March 31, 2012 is as below.
(From April 1, 2011 to March 31, 2012) Net sales Operating income Ordinary income Net income
Full year Million yen % 940,000 5.9
Million yen % 68,000 25.8
Million yen % 70,000 25.4
Million yen % 42,000 53.8
The above forecast is based on the following foreign currency exchange rate: 1 US dollar = 80 yen, 1 Euro = 115 yen
*Forecasts in this disclosure are made by management in light of information currency available. A number of factors could cause actual results to differ materially from disclosed as above.

7
2. Analysis of financial position
Financial position as of March 31, 2011 as compared with the end of the previous fiscal year is as follows. The balance of current assets as of March 31, 2011 increased by 106,330 million yen to 590,954 million yen
(484,624 million yen at the end of the previous fiscal year). This is due mainly to the increase in cash and deposits and inventories.
The balance of noncurrent assets as of March 31, 2011 decreased by 17,053 million yen to 238,954 million yen (256,007 million yen at the end of the previous fiscal year). This is attributable mainly to the decrease in property, plant and equipment and investment securities.
The balance of current liabilities as of March 31, 2011 increased by 42,468 million yen to 342,295 million yen (299,827 million yen at the end of the previous fiscal year). This is largely due to the increase in notes and accounts payable-trade and accrued expenses, in spite of decrease in current portion of bonds.
The balance of noncurrent liabilities as of March 31, 2011 increased by 29,658 million yen to 98,393 million yen (68,735 million yen at the end of the previous fiscal year). The increase is due mainly to the increase in bonds payable and long-term loans payable.
The balance of net assets as of March 31, 2011 increased by 17,150 million yen to 389,220 million yen (372,069 million yen at the end of the previous fiscal year). This is attributable mainly to the posting of 27,312 million yen in net income.
During the year ended March 31, 2011, cash flows from operating activities amounted to 123,613 million yen as a result mainly of the posting of 46,505 million yen in income before income taxes, the increase by 29,303 million yen in advances received and the increase by 47,027 million yen in notes and accounts receivable-trade. Cash flows from investing activities resulted in an expenditure of 23,589 million yen mainly as a result of an expenditure of 22,885 million yen for the purchase of property, plant and equipment. Cash flows from financing activities resulted in an expenditure of 20,122 million yen due mainly to an income of 19,892 million yen from the issuance of bonds, an expenditure of 32,900 million yen for the redemption of bonds.
(Reference) Changes in Cash Flow-Related Indices
March 31, 2007
March 31, 2008
March 31, 2009
March 31, 2010
March 31, 2011
Equity ratio (%) 46.5 47.9 50.5 50.2 46.8
Equity ratio based on market value (%)
132.5 129.2 58.5 109.2 81.9
Cash flow to interest-bearing debt ratio (years)
1.3 0.6 11.4 1.0 0.7
Interest coverage ratio (times) 46.8 80.7 8.3 89.5 128.0(Notes) Equity ratio: Equity/Total assets
Equity ratio based on market value: Total market value of shares/Total assets Cash flow to interest-bearing debt ratio: Interest-bearing debt/Operating cash flows Interest coverage ratio: Operating cash flows/Interest payments *All indices are calculated based on consolidated financial data. *The total market value of shares is calculated in accordance with the formula: final share price as of the end of the fiscal year x numbers of shares issued (after deducting treasury stock).
*Operating cash flows are the cash flows from operating activities as indicated in the consolidated cash flow statement. Interest-bearing debts include the short-term and long-term loans payable as posted in the consolidated balance sheet. As regards interest payments, the amount of interest paid as shown in the consolidated cash flow statement is used.
3. Shareholder returns policy and dividends
Nikon’s basic dividend policy is to improve the reflection of business performance based on paying a steady, continuous dividend, as well as expanding the investment for the future growth and strengthening of competitiveness. More specifically, its present goal is to provide a total return ratio of 25% or more.
The Group set the year-end dividends at 14 yen per share, an increase of 10 yen from previous fiscal year, due to the increase in both revenue and profit. As a result, cash dividends for the fiscal year ended March 31, 2011 will be 19 yen per share including 5 yen of interim dividend.
As for the dividends of the fiscal year ending March 31, 2012, the Group plans to pay 27 yen per share including 10 yen of interim dividend.

8
4. Business and Other Risks
There is a possibility that the business performance of the Nikon Group will be impacted significantly by various factors that may arise in the future. Following are principal matters that are believed to be likely risk factors in the promotion of business operations by the Group.
Matters concerning the future as stated herein are based on the Nikon Group's beliefs as of the date of the preparation hereof.
(1) Unique business environment and circumstances
1) Dependence on particular products The Nikon Group is highly dependent on the Precision Equipment Business and the Imaging Products
Business, which jointly account for 90.7% of total net sales. Hence, the business performance of the Group as a whole is greatly affected by the performance of the two businesses.
Further, the Group relies heavily on IC and LCD steppers and scanners in the Precision Equipment Business, and on digital cameras and interchangeable camera lenses in the Imaging Products Business.
2) Unique environment of main businesses The semiconductor industry, which is the main target market for the IC steppers and scanners handled by the
Precision Equipment Business, is characterized as an industry with drastic changes in the business cycle, although this inclination has been waning in recent years, due to the diversification of end products. As a result, an over-supply of semiconductor devices in the market poses the risk of a decrease in the demand for steppers, due to a cutback in capital investment by semiconductor manufacturers and an accompanying increase in inventories. However, it is difficult to predict the timing or the duration of such a situation or the degree of fluctuation. As an additional characteristic of customer behavior in the same industry, orders are subject to postponement or cancellation even after they have been placed, resulting in a structure that is prone to increases in inventory during periods of slow demand. The demand for LCD steppers and scanners, which is dependent on the climate of the LCD panel market, may experience a rapid decline, should LCD panel prices drop as a result of an over-supply.
The market for digital cameras, which are the leading products of the Imaging Products Business, continues to show a tendency to expand further. While a further increase in the penetration rate is expected and the markets in emerging countries have potential to grow, there is a possibility of the market undergoing changes such as the decline in demand for digital cameras, due to such factors as fluctuation of the economy of the respective regions and the emergence of strong competition, such as new digital equipment.
In the Instruments Business, the microscope market is becoming saturated, leading to the possibility of a change in competition structure, as a result of an industry restructuring or the like. Further, the Industrial Instruments Business is susceptible to the effect of the economic and facility trends of various industries, including semiconductors, power generation, electronic components, automobiles and machine tools.
Such changes in the business environment are likely to have a considerable impact on the business performance and the financial position of the Nikon Group.
(2) Dependence on specific suppliers In each business that it is engaged in, the Nikon Group is sometimes dependent on specific suppliers for such
things as raw materials, key components, and finished products that have been outsourced. Although the Group is making efforts to ensure stable procurement while maintaining a close relationship with specific suppliers, there is a possibility that the Group's profit and financial position will be adversely affected in the event of a steep increases in purchase price or a material problem with procurement due to a sudden surge in demand, natural disasters, quality issues, as well as policy changes or bankruptcy on the part of a specific supplier.
(3) Dependence on specific customers Moves such as mergers and partnerships are progressing within the semiconductor industry, which is a
customer of the Precision Equipment Business, in order to cope with expanding capital expenditure and increasingly diversified technology development. Further, selective elimination is proceeding as the competitive superiority or inferiority of various companies becomes more defined, based on the technologies owned and the characteristics of the devices manufactured. Competition among companies is intensifying also in the LCD panel industry as capital expenditures expand, resulting in some moves for industry restructuring. Capital investment plans of the Nikon Group's major customers are volatile owing to the foregoing circumstances. Hence, there is a possibility that the Group's profit and financial position will be adversely affected should; for example, a customer drastically reduce order volumes or take its business to a competitor, or should problems arise for any reason with respect to debt payment by a customer.
(4) Ability to develop new products and investment in development Being subject to intense competition, the Nikon Group's core businesses are constantly required to develop
new products by continuing to engage in highly advanced research and development. Therefore, it is necessary to continue to invest in product development, regardless of the fluctuations in the Group's profit.
In the Precision Equipment Business, there is a possibility of a decrease in profit in the event of failure to develop new products and/or next-generation technology in a timely manner, or of rejection by the market of a technology developed by the Nikon Group. Further, should a competitor acquire a patent on a new technology,

9
there is a danger that the production and/or sale of a product will be suspended or of a decrease in profit margin due to the payment of royalty, as well as the possibility that the adoption of a new technology by a competitor's device will cause the price of Nikon's devices to deteriorate. Further intensification of price competition is expected with respect to LCD steppers and scanners in the event of market entries by newcomers or introduction of a new technology, which may impact profit.
In the Imaging Products Business, given the rapid technological advances in and increasing sophistication and diversification of digital cameras, continual investment is required for the development of new technologies and new products. However, there is a conceivable possibility that a technology or a product that was developed will not lead to an increase in profit should the investment fail to produce adequate results or should there be an abrupt shift in demand to higher functioning digital equipment. As with the Precision Equipment Business, should a competitor acquire a patent on a new technology, there is a danger that the production and/or sale of a product will be suspended or of a decrease in profit margin due to the payment of royalty, which may impact profit.
(5) Intensification of price competition Competition is intensifying with respect to digital cameras, which are the leading products of the Imaging
Products Business, with both Japanese and overseas electrical equipment manufacturers entering the market in addition to the traditional camera manufacturers. As the product life cycle is short, particularly in the case of compact digital cameras, all companies have the tendency to try to sell mass-produced products within a short period, with the slowing market growth further spurring price competition.
As for IC steppers and scanners, while the development of cutting-edge technologies is progressing, there is a possibility that competitors will launch an offensive with low-priced steppers and scanners.
In the Instruments business, the maturing of the microscope market is further promoting the competition to differentiate products, while fanning price competition in the mid- and low-range markets. There is a possibility that the Nikon Group's profit and financial position will be affected adversely, should there be a sharp and sudden decrease in prices.
(6) Overseas business operations The Nikon Group is dependent on foreign countries for a significant portion of its production and sales
activities. Hence, it is affected by changes in various import and export laws, tax systems, and regulation in Japan and other countries in which the Group operates. Further, in conducting business operations overseas, there is a possibility that major problems will be encountered and/or losses will be incurred in conducting business activities, due to such risks as changes in political regimes or economic climate; social chaos caused by riots, terrorism, wars, infectious diseases, etc.; problems with such infrastructures or logistics-related functions as water, electricity, and communications network due to natural disaster; and difficulty hiring human resources or loss thereof. There is a possibility that the Nikon Group's profit and financial status will be affected adversely as a result of production and sales being limited by the foregoing.
(7) Risk of fluctuations in exchange rate The Nikon Group is highly dependent on overseas market, with overseas sales accounting for as much as
85.7% of net sales. While the Group is appropriately hedging foreign exchange risks in accordance with sales volumes and the sales region, the net sale of and profit from products and services subject to foreign currency transactions, or the yen values of the income, losses, assets and liabilities of overseas consolidated subsidiaries will be affected should there be a sharp fluctuation in foreign exchange rates.
(8) Fund procurement risk While the Nikon Group is procuring funds as the need arises with due consideration for the balance between
long-term and short-term funds, as well as between direct and indirect financing, there is a possibility that such effects as an increase in interest rates on the fund procured or limitation of the means for procuring fund may arise should the financial market climate deteriorate further. There is a possibility that fund procurement by the Group will also be impacted should the rating of the Company's bond be revised downward due to a decline in business performance.
(9) Risk relating to the protection of and litigations on intellectual property rights The Nikon Group acquires and holds numerous intellectual property rights as it develops products. In some
cases, the Group licenses such intellectual property rights to other companies. Although utmost efforts are being made for the maintenance and protection of these intellectual property rights, there is a possibility that considerable litigation expenses will be incurred should a lawsuit be filed in connection with an unlicensed use of the Group's intellectual property rights by another company.
Further, there is a possibility that other companies, individuals, or entities will file a complaint against the Nikon Group for an alleged infringement on their intellectual property rights, although the Group is paying adequate attention to avoiding infringing third-party intellectual property rights in conducting product development. Should such a situation occur, there is a possibility that the Group's profit and financial position will be affected significantly.
10
(10) Securing key personnel and outflow of human resources and know-how The Nikon Group is supported by its employees, who possess advanced technical and other expertise and
abilities, and securing such human resources is becoming increasingly more important in order to win through intense competitions in the market. However, should labor fluidity increase further for some reason, there is a possibility that such key personnel will resign, taking their expertise and know-how with them. In order to minimize such outflow of expertise and know-how, the internal transmission, standardization and sharing of proprietary technologies and skills are being promoted. While it is important to secure competent human resources locally overseas, it is believed that the possibility of an outflow of human resources is particularly high in regions with high labor fluidity.
Since long-term education and training are essential in order to foster human resources given the rapid technological renovations in the business that the Group is engaged in, replacing key personnel that depart may be difficult at times and may thus adversely affect the Group's future growth, profit and financial position.
(11) Information Leaks The Nikon Group retains such important information as technical information, corporate information, and the
personal information of its customers and other persons concerned. Among other things, the Group is enhancing its internal regulations on the handling of information and educating its employees, while thoroughly controlling external access to such information and improving the level of storage security. However, in the rare event of leakage of the Company's confidential information, including technical information, there is a possibility that the corporate value of the Nikon Group will be damaged. Further, should corporate or personal information leak out, the Group would not only suffer damages to its credibility, but would also be subject to claims for compensation from such entities as business partners, customers, employees or other entities suffering the effect of the leak. Should this occur, there is a possibility that the Group's profit and financial position will be affected adversely as tremendous costs will be necessary for various activities related to the recovery of trust, compensation to subject companies and individuals, implementation of measures to prevent recurrence, and other necessities.
(12) Defects in products and services As concerns the Nikon Group's products and services, advanced quality assurance systems are in place within
Japanese and overseas Group companies, as well as production contractors, in order to provide customers with highly trustable and sophisticated products. However, in the rare event that a customer suffers a loss due to a defect in a product or service, there is a possibility that profit and financial position will be adversely affected, there being the risk that large amounts will be incurred in repair expenses and costs related to liability, recall, disposal of products and the like, in addition to the decreased desire of customers to purchase the Group's products and services due to a decrease in customer trust in the Nikon brand.
(13) Occurrence of natural disasters, etc. Due attention is being paid to measures relating to such natural disasters as earthquakes, fires and flood, and
measures to counter the expansion of such infectious diseases as new strains of influenza, giving priority in particular to the promotion of the business continuity plan (BCP), which was formulated as a part of earthquake countermeasures. However, there is the risk that operations will be suspended and production and shipment will be delayed, should the Group's development or productions sites, suppliers or other relevant parties suffer critical damage. There is a possibility that the Group's profit and financial position will be adversely affected, should net sales decrease and considerable expenses be incurred for business recovery as a result thereof.
(14) Damages to brand value The Nikon Group is making utmost efforts to protect and enhance the 'Nikon Brand,' which was fostered over
years of corporate management marked with integrity and provision of products and services that are worthy of customer trust. However, there is a possibility that the Group's profit and financial position will be adversely affected should trust in the brand decline and the value of the Nikon brand be damaged, as a result of the circulation of negative reputation or evaluation of the Group's technologies, products or services.

2. Status of Nikon Group
The Nikon Group is comprised of Nikon Corporation (the Company), its 87 subsidiaries, and 11 affiliates. While the
principal operations of the Group are manufacturing and sales relating to the precision equipment, imaging product, instruments, and other businesses, it is also engaged in other operations and activities incidental thereto, such as services.
The business system diagram is as follows:
11
〔 Nikon Corporation 〕
Precision Equipment Business Imaging Products Business Instruments Business Other Business
Customers
Subsidiaries ** Nikon Inc. *** Nikon Instruments Inc. + Nikon Canada Inc. * Nikon Precision Inc. and five other companies
Affiliate one company
Subsidiaries ** Nikon Europe B.V. *** Nikon Instrument Europe B.V.+ Nikon AG + Nikon GmbH + Nikon France S.A.S. + Nikon U.K. Ltd. * Nikon Precision Europe GmbH** Nikon Nordic AB ** Nikon Polska Sp.z.o.o.
and seven other companies
Subsidiaries ** Nikon Hong Kong Ltd. ** Nikon Singapore Pte Ltd * Nikon Precision Korea Ltd. * Nikon Precision Taiwan Ltd. ** Nikon Imaging (China) Sales Co., Ltd.** Nikon Imaging Korea Co., Ltd.
and eight other companies
* Company engaged in precision equipment business ** Company engaged in imaging products business *** Company engaged in instruments business ****Company engaged in other business + Company engaged in multiple businesses
(Japanese sales & services companies) (North American sales & services companies) (European sales & services companies)
Subsidiaries ** Nikon Imaging Japan Inc. *** Nikon Instech Co., Ltd. **** Nikon Vision Co., Ltd. * Nikon Tec Corporation and three other companies
Affiliates **** Nikon-Essilor Co., Ltd. **** Nikon-Trimble Co., Ltd. and one other company
Flow of products (outsourced processing) Flow of manufacturing components Flow of products
(Japanese manufacturing companies)
Subsidiaries ** Tochigi Nikon Corporation * Tochigi Nikon Precision Co., Ltd. ** Sendai Nikon Corporation * Miyagi Nikon Precision Co., Ltd. **** Hikari Glass Co., Ltd.
and three other companies
(Overseas manufacturing companies)
Subsidiaries ** Nikon (Thailand) Co., Ltd. ** Nikon Imaging (China) Co., Ltd.
and seven other companies
Affiliates two companies
(Asian and Oceanian sales & services companies)
Subsidiaries **** Nikon Systems Inc. **** Nikon Business Services Co., Ltd. *** Nikon Metrology NV and eighteen other companies
Affiliates five companies
Subsidiaries **** Nikon Americas Inc. **** Nikon Holdings Europe B.V. **** Nikon Holdings Hong Kong Limited
(Other) (Overseas holding companies)

12
3. Management Policies (1) Company’s Basic Management Policies
The Company’s management vision, under the business philosophy of “Trustworthiness and Creativity,” is “Our Aspirations.” Our Philosophy “Trustworthiness and Creativity” Our Aspirations “Meeting needs. Exceeding expectations.”
・ Providing customers with new value that exceeds their expectations. ・ Sustaining growth through a break with the past and a passionate commitment by one and all. ・ Maximizing our understanding of light to lead the way towards transformation and a new future. ・ Maintaining integrity in order to contribute to social prosperity
(2) Targeted management indices
The Group made a unified effort to vigorously progress for the achievement of its goal, as set out in the Medium Term Management Plan announced in June 2010, to realize “the Nikon Group that keeps on providing customers with new values and generates sustainable growth.”
A new Medium Term Management Plan is announced in May 2011, with a performance target toward March 31, 2014. Under the plan, we aim to achieve 1,200 billion yen in net sales and 135 billion yen in operating income for the fiscal year ending March 31, 2014.
(3) Medium and long-term management strategies and issues to be addressed
To response to tight electricity supply and concerns over the procurement of raw materials, parts and components due to the Great East Japan Earthquake that took place in March 2011, the entire Group makes efforts to revise and strengthen the BCP (Business Continuity Plan) as a pressing issue.
With a view to realizing the Nikon Group that keeps on providing customers with new values, the Group will
promote its medium- and long-term management by focusing on the following measures. ・ To demonstrate the Nikon brand’s strength, the “Spirit of Innovation,” added with “Fun.” ・ To create new businesses in existing and new fields. ・ Every unit of the Group exercises autonomous management, while maintaining a sense of speed and unity in a
bid to realizing global cooperation. ・ All business functions collaborate with each other at high levels. The Group endeavors to achieve the above four measures, in parallel with the constant fulfillment of CSR.
(4) Other Important Matters in Business Management In light of the “Great East Japan Earthquake” that took place in March 2011, the Group is set to review and
strengthen its BCP (Business Continuity Plan).

13
4. Consolidated Financial Statements (1) Consolidated Balance Sheets
(Million yen)
As of March 31, 2010 As of March 31, 2011
Assets Current assets Cash and deposits 107,680 181,077 Notes and accounts receivable-trade 113,773 123,077 Inventories 206,995 236,407
Deferred tax assets 47,788 42,640 Other 16,713 15,118 Allowance for doubtful accounts (8,328) (7,365) Total current assets 484,624 590,954
Noncurrent assets Property, plant and equipment Buildings and structures, net 42,278 43,362
Machinery, equipment and vehicles, net 34,774 34,003 Land 15,033 14,777
Lease Assets, net 7,304 5,794 Construction in progress 11,838 7,566 Other, net 13,815 13,511 Total property, plant and equipment 125,045 119,016 Intangible assets 42,803 39,473 Investments and other assets Investment securities 63,150 56,303
Deferred tax assets 18,874 17,604 Other 6,934 6,817 Allowance for doubtful accounts (800) (260) Total investments and other assets 88,159 80,465 Total noncurrent assets 256,007 238,954 Total assets 740,632 829,909
14
(Million yen)
As of March 31, 2010 As of March 31, 2011
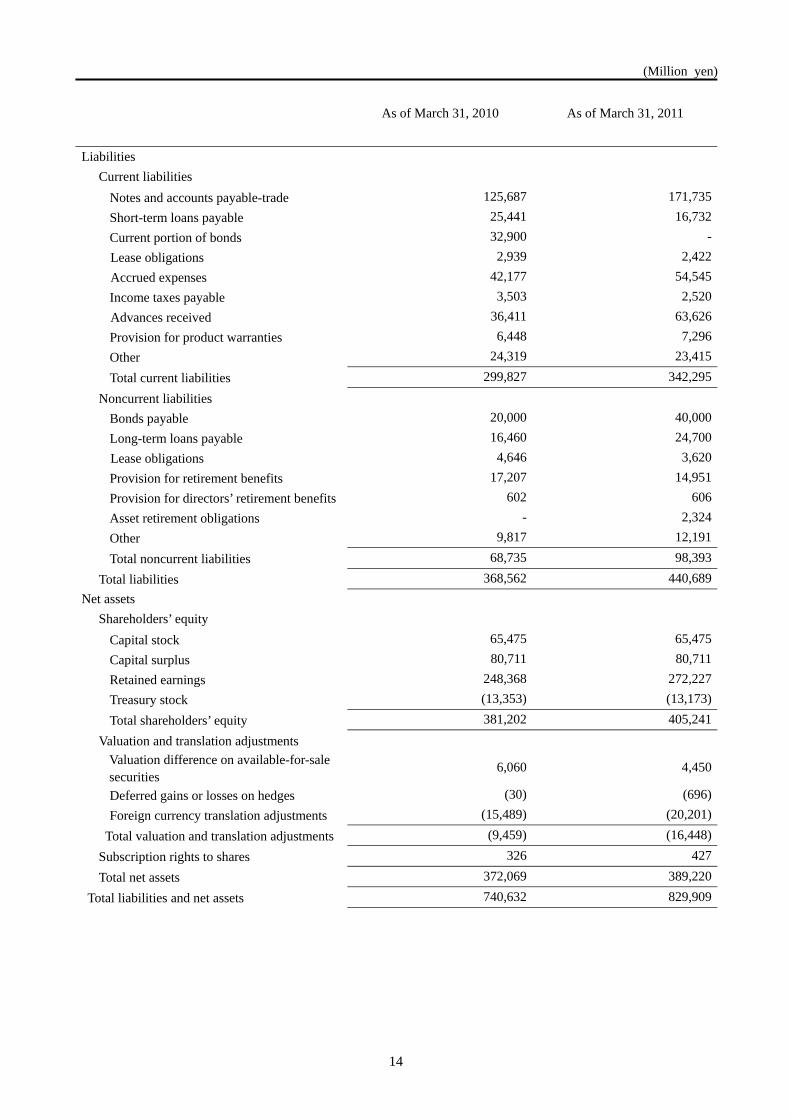
Liabilities Current liabilities Notes and accounts payable-trade 125,687 171,735 Short-term loans payable 25,441 16,732 Current portion of bonds 32,900 -
Lease obligations 2,939 2,422Accrued expenses 42,177 54,545
Income taxes payable 3,503 2,520Advances received 36,411 63,626
Provision for product warranties 6,448 7,296 Other 24,319 23,415 Total current liabilities 299,827 342,295
Noncurrent liabilities Bonds payable 20,000 40,000 Long-term loans payable 16,460 24,700
Lease obligations 4,646 3,620 Provision for retirement benefits 17,207 14,951
Provision for directors’ retirement benefits 602 606 Asset retirement obligations - 2,324 Other 9,817 12,191 Total noncurrent liabilities 68,735 98,393 Total liabilities 368,562 440,689
Net assets Shareholders’ equity Capital stock 65,475 65,475 Capital surplus 80,711 80,711 Retained earnings 248,368 272,227 Treasury stock (13,353) (13,173) Total shareholders’ equity 381,202 405,241 Valuation and translation adjustments
Valuation difference on available-for-sale securities
6,060 4,450
Deferred gains or losses on hedges (30) (696) Foreign currency translation adjustments (15,489) (20,201) Total valuation and translation adjustments (9,459) (16,448) Subscription rights to shares 326 427
Total net assets 372,069 389,220Total liabilities and net assets 740,632 829,909

15
(2) Consolidated Statements of Income and Statements of Comprehensive Income ①Consolidated Statements of Income
(Million yen)
Year ended March 31, 2010 Year ended March 31, 2011
Net sales 785,498 887,512Cost of sales 552,408 575,535Gross profit 233,090 311,977Selling, general and administrative expenses 246,944 257,924Operating income (loss) (13,854) 54,052Non-operating income Interest income 380 632 Dividends income 870 1,061
Foreign exchange gains 126 2,995Equity in earnings of affiliates 992 1,231
Other 4,023 3,939 Total non-operating income 6,393 9,860Non-operating expenses Interest expenses 1,225 945
Cash discount 3,957 3,387 Other 2,689 3,768 Total non-operating expenses 7,873 8,101Ordinary income (loss) (15,334) 55,811Extraordinary income Gain on sales of noncurrent assets 82 91
Gain on sale of investment securities 97 30 Total extraordinary income 180 121Extraordinary loss Loss on retirement of noncurrent assets 450 1,000 Loss on sales of noncurrent assets 4 47 Non-recurring depreciation on noncurrent
assets 86 -
Impairment loss 115 397Loss on sales of investment securities 13 82
Loss on valuation of investment securities 220 4,512Loss on restructuring of business 1,421 -Environmental expenses 206 -Effect of application in accounting standard for asset retirement obligations
- 1,073
Loss on disaster - 2,313 Total extraordinary loss 2,517 9,427Income (loss) before income taxes (17,671) 46,505Income taxes (5,056) 19,193Income (loss) before minority interests (12,615) 27,312Net income (loss) (12,615) 27,312

16
②Consolidated Statements of Comprehensive Income (Million yen)
Year ended March 31, 2010 Year ended March 31, 2011
Income before minority interests - 27,312Other comprehensive income
Unrealized gains or losses on available-for-sale securities
(1,595)
Deferred hedging gains or losses (666)Foreign currency translation adjustments (4,230)Equivalent share of gains or losses to equity method affiliates
(496)
Total other comprehensive income (6,989)Comprehensive income 20,323 (Breakdown)
Comprehensive income attributable to parent shareholder
20,323

17
(3) Consolidated Statements of Changes in Net Assets Year ended March 31, 2010 (Million yen)
Shareholders’ equity
Capital stock Capital surplus Retained
earnings Treasury stock Total
shareholders’ equity
Balance of March 31, 2009 65,475 80,711 264,827 (13,439) 397,576
Changes of items during the period
Dividends from surplus (2,180) (2,180)
Dividends from surplus (interim dividends) (1,585) (1,585)
Net income or loss (12,615) (12,615)
Purchase of treasury stock (45) (45)
Disposal of treasury stock (77) 131 53
Changes in the number of consolidated Subsidiaries
Net changes of items other than shareholders’ equity
Total changes of items during the period (16,458) 85 (16,373)
Balance of March 31, 2010 65,475 80,711 248,368 (13,353) 381,202
Valuation and translation adjustments
Valuation
difference on
available-for-sale
securities
Deferred gains or
losses on hedges
Foreign
currency
translation
adjustments
Total valuation
and translation
adjustments
Subscription
rights to
shares
Total net
assets
Balance of March 31, 2009 (2,429) (915) (15,377) (18,722) 233 379,086
Changes of items during the period
Dividends from surplus (2,180)
Dividends from surplus (interim dividends) (1,585)
Net income or loss (12,615)
Purchase of treasury stock (45)
Disposal of treasury stock 53
Changes in the number of consolidated Subsidiaries
Net changes of items other than shareholders’ equity
8,489 885 (112) 9,262 93 9,356
Total changes of items during the period 8,489 885 (112) 9,262 93 (7,017)
Balance of March 31, 2010 6,060 (30) (15,489) (9,459) 326 372,069

18
Consolidated Statements of Changes in Net Assets Year ended March 31, 2011 (Million yen)
Shareholders’ equity
Capital stock Capital surplus Retained
earnings Treasury stock Total
shareholders’ equity
Balance of March 31, 2010 65,475 80,711 248,368 (13,353) 381,202
Changes of items during the period
Dividends from surplus (1,585) (1,585)
Dividends from surplus (interim dividends) (1,982) (1,982)
Net income or loss 27,312 27,312
Purchase of treasury stock (12) (12)
Disposal of treasury stock (115) 192 77
Changes in the number of consolidated subsidiaries
229 229
Net changes of items other than shareholders’ equity
Total changes of items during the period 23,858 180 24,039
Balance of March 31, 2011 65,475 80,711 272,227 (13,173) 405,241
Valuation and translation adjustments
Valuation
difference on
available-for-sale
securities
Deferred gains or
losses on hedges
Foreign
currency
translation
adjustments
Total valuation
and translation
adjustments
Subscription
rights to
shares
Total net
assets
Balance of March 31, 2010 6,060 (30) (15,489) (9,459) 326 372,069
Effect of changes in accounting policies applied to foreign subsidiaries
Dividends from surplus (1,585)
Dividends from surplus (interim dividends) (1,982)
Net income or loss 27,312
Purchase of treasury stock (12)
Disposal of treasury stock 77
Changes in the number of consolidated subsidiaries
229
Net changes of items other than shareholders’ equity
(1,610) (666) (4,712) (6,989) 100 (6,888)
Total changes of items during the period (1,610) (666) (4,712) (6,989) 100 17,150
Balance of March 31, 2011 4,450 (696) (20,201) (16,448) 427 389,220

19
(4) Consolidated Statements of Cash Flows (Million yen)
Year ended March 31, 2010 Year ended March 31, 2011 Cash flows from operating activities Income (loss) before income taxes (17,671) 46,505
Depreciation and amortization 35,170 34,033 Impairment loss 545 399 Increase (decrease) in allowance for doubtful accounts 447 (602) Increase (decrease) in provision for product warranties (226) 1,042
Increase (decrease) in provision for retirement benefits 3,257 (2,134) Increase in provision for directors’ retirement benefits 132 3
Interest and dividends income (1,251) (1,694) Equity in earnings of affiliates (992) (1,231) Interest expenses 1,225 945 Gain on sales of noncurrent assets (68) (43) Loss on retirement of noncurrent assets 563 1,007
Loss (gain) on sales of investment securities (84) 52 Loss on valuation of investment securities 220 4,512 Decrease (increase) in notes and accounts receivable-trade 9,134 (14,843)
Decrease (increase) in inventories 57,390 (34,032) Increase in notes and accounts payable-trade 5,218 47,027
Increase (decrease) in advances received (9,137) 29,303 Other, net 15,249 23,451 Subtotal 99,126 133,701 Interest and dividends income received 2,836 2,465 Interest expenses paid (1,155) (965) Income taxes refund (paid) 2,690 (11,587) Net cash provided by operating activities 103,497 123,613 Cash flows from investing activities Purchase of property, plant and equipment (33,635) (22,885) Proceeds from sales of property, plant and equipment 621 722 Purchase of investment securities (1,150) (433)
Proceeds from sale of investment securities 771 685 Net decrease in loans receivable 359 398
Purchase of investments in subsidiaries resulting in change in scope of consolidation (9,428) -
Compensation income for expropriation 8,212 2,317 Other, net (12,856) (4,392) Net cash used in investing activities (47,107) (23,589) Cash flows from financing activities Net increase(decrease) in short-term loans payable (5,335) 121
Net decrease in commercial papers (20,000) - Proceeds from long-term loans payable 1,229 10,000
Repayments of long-term loans payable (10,199) (10,530)Issue of Bond 19,894 19,892
Redemption of bonds (10,000) (32,900) Cash dividends paid (3,771) (3,573) Purchase of treasury stock (45) (12) Other, net (3,247) (3,119) Net cash used in financial activities (31,476) (20,122) Effect of exchange rate change on cash and cash equivalents (49) (3,741) Net increase in cash and cash equivalents 24,863 76,160 Cash and cash equivalents at beginning of period 79,806 104,669
Increase in cash and cash equivalents from newly consolidated subsidiaries - 231
Cash and cash equivalents at end of period 104,669 181,061

20
(5) Note on assumptions for going concern Not applicable
(6) Basis of Presenting Consolidated Financial Statements 1. Scope of Consolidation (1)Number of Consolidated subsidiaries: 68 companies Principal subsidiaries:
Tochigi Nikon Corporation , Tochigi Nikon Precision Co., Ltd., Sendai Nikon Corporation , Miyagi Nikon Precision Co., Ltd., Nikon Imaging Japan Inc., Nikon Instech Co., Ltd., Nikon (Thailand) Co., Ltd., Nikon Imaging (China) Co., Ltd., Nikon Hong Kong Ltd., Nikon Inc., Nikon Precision Inc., Nikon Europe B.V. and others.
[Additions: 2 companies]
Nikon (Russia) LLC, Nikon Holdings Hong Kong Limited
[Exclusions: 3 companies] Three subsidiaries of Nikon Metrology NV (Completion of liquidation)
(2)Non-consolidated subsidiaries: 19 companies
Major company name : Nanjing Nikon Jiangnan Optical Instrument Co., Ltd.
Since these companies are small in scale, their combined assets, net sales, net income(the company’s interest share) and retained earnings(the company’s interest share) have a minimal effect on the company’s consolidated financial statements, and they are insignificant in general, they are not included in the scope of consolidation.
2. Scope of Equity Method (1)Number of Associated Company accounted for by Equity Method : 2 companies
Company name : Nikon-Essilor Co., Ltd. , Nikon-Trimble Co., Ltd. (2)Number of Associated company not accounted for by Equity Method : 19 companies
Major company name : Nanjing Nikon Jiangnan Optical Instrument Co., Ltd. (3) Number of Associated company not accounted for by Equity Method : 9 companies
Major company name : Nihon System Seigyo K.K.
Since these companies are small in scale, net income(the company’s interest share) and retained earnings(the company’s interest share) have a minimal effect on the company’s consolidated financial statements, and they are insignificant in general.
(7) Changes in Basis of Presenting Consolidated Financial Statements
1. Changes in Accounting Policies (Application of “Accounting Standard for Equity Method of Accounting for Investment” and “Practical Solution on Unification of Accounting Policies Applied to Associates Accounted for Using the Equity Method”)
From the current fiscal year, the Group applies the “Accounting Standard for Equity Method of Accounting for Investment” (Accounting Standards Board of Japan [ASBJ] Statement No.16 of March 10, 2008) and the “Practical Solution on Unification of Accounting Policies Applied to Associates Accounted for Using the Equity Method” (ASBJ PITF No.24 of March 10, 2008)
There is no impact on the Group’s consolidated financial statements as a result of this change. (Application of “Accounting Standard for Asset Retirement Obligations”)
From the current fiscal year, the Group applies the “Accounting Standard for Asset Retirement Obligations” (ASBJ Statement No.18 of March 31, 2008) and the “Guidance on Accounting Standard for Asset Retirement Obligations” (ASBJ Guidance No.21 of March 31, 2008)
Although the impact of this change on operating income, ordinary income and segment information is immaterial, 1,073 million yen is recorded loss on adjustment for changes of accounting standard for asset retirement obligations as extraordinary loss.

21
2. Changes of Presentation (Consolidated Statements of Income) Based on the “Accounting Standard for Consolidated Financial Statements” (ASBJ Statement No.22 of December
26, 2008), the Group applies the “Cabinet Office Ordinance Partially Revising Regulation on Terminology, Forms and Preparation of Financial Statements” (Cabinet Office Ordinance No.5 of March 24, 2009). As a result, “Income before minority interests” is included in the consolidated financial statements from the current fiscal year.
3. Additional Information (Application of Accounting Standard for Presentation of Comprehensive Income)
From the current fiscal year, the Group applies the “Accounting Standard for Presentation of Comprehensive Income” (ASBJ Statement No.25 of June 30, 2010).
For the prior fiscal year, however, the amounts for “accumulated other comprehensive income” and “total accumulated other comprehensive income” are stated under “valuation and translation adjustments” and “total valuation and translation adjustments.”
(8) Notes to Consolidated Financial Statements 1) Consolidated Statements of Income
1. Principal Items and Amounts under Selling, General and Administrative Expenses Fiscal year ended March 31, Fiscal year ended March 31,
2010 2011 (From April 1 2009 to (From April 1 2010 to March 31, 2010) March 31, 2011)
Advertising expenses 63,067 million yen 65,824 million yen Provision for doubtful debts 916 million yen 65 million yen Provision for product warranties 5,552 million yen 4,833 million yen Salary and allowances 31,984 million yen 30,597 million yen Retirement benefit expenses 4,455 million yen 3,446 million yen Other personnel expenses 13,141 million yen 15,923 million yen Research and development 60,260 million yen 60,767 million yen
2. Loss on Disaster
The loss of 2,313 million yen incurred in connection with the Great East Japan Earthquake, which took place on March 11, 2011, was posted as extraordinary loss.
The extraordinary loss mainly includes expenses to restore the noncurrent assets to original state of 775 million yen, expenses to restore the inventories to original state of 615 million yen and losses on abandonment and valuation of 237 million yen.
2) Consolidated Statements of Comprehensive Income
Fiscal year ended March 31, 2011 (From April 1 2010 to March 31, 2011) Consolidated comprehensive income for the fiscal year immediately preceding the fiscal year ended March 31, 2011 Comprehensive income attributable to parent shareholder (3,352) million yen Total (3,352) million yen Other consolidated comprehensive income for the fiscal year immediately preceding the fiscal year ended March 31, 2011 Unrealized gains or losses on available-for-sale securities 8,560 million yen Deferred hedging gains or losses 885 million yen Foreign currency translation adjustments (352) million yen Equivalent share of gains or losses to equity method affiliates 169 million yen Total 9,262 million yen
22
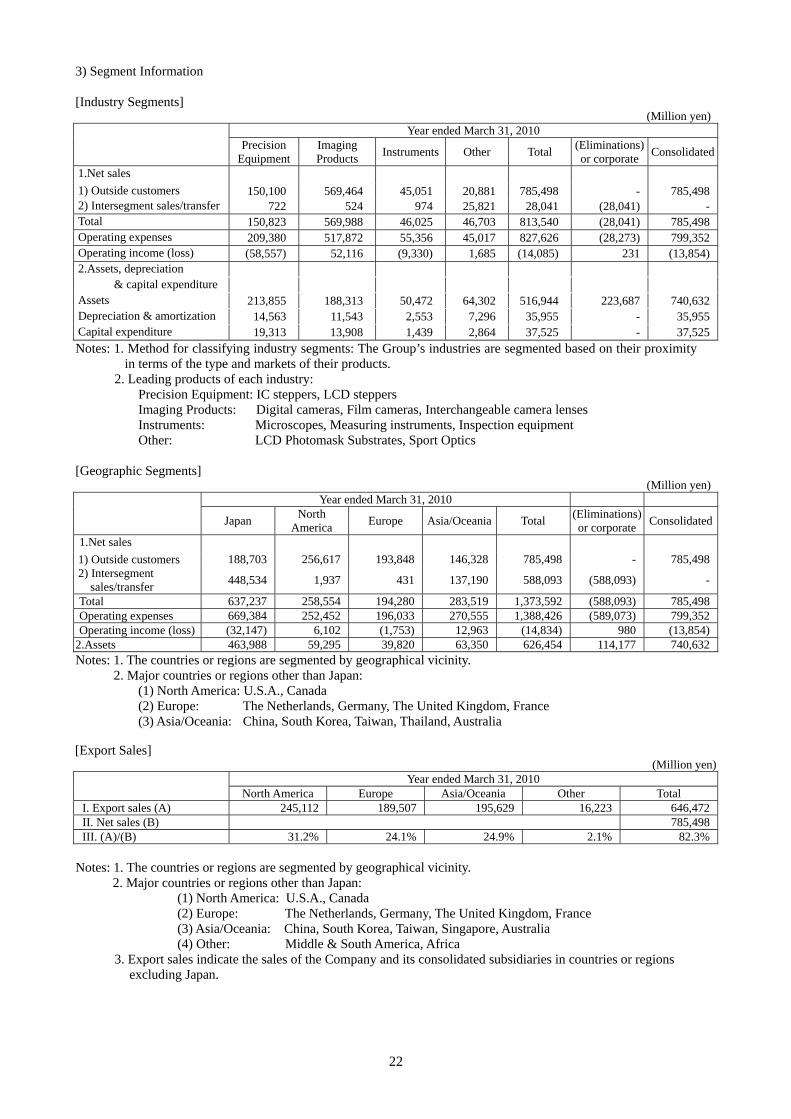
3) Segment Information [Industry Segments]
(Million yen) Year ended March 31, 2010
Precision Equipment
Imaging Products Instruments Other Total (Eliminations)
or corporate Consolidated
1.Net sales 1) Outside customers 150,100 569,464 45,051 20,881 785,498 - 785,4982) Intersegment sales/transfer 722 524 974 25,821 28,041 (28,041) -Total 150,823 569,988 46,025 46,703 813,540 (28,041) 785,498Operating expenses 209,380 517,872 55,356 45,017 827,626 (28,273) 799,352Operating income (loss) (58,557) 52,116 (9,330) 1,685 (14,085) 231 (13,854)2.Assets, depreciation & capital expenditure Assets 213,855 188,313 50,472 64,302 516,944 223,687 740,632Depreciation & amortization 14,563 11,543 2,553 7,296 35,955 - 35,955Capital expenditure 19,313 13,908 1,439 2,864 37,525 - 37,525Notes: 1. Method for classifying industry segments: The Group’s industries are segmented based on their proximity
in terms of the type and markets of their products. 2. Leading products of each industry:
Precision Equipment: IC steppers, LCD steppers Imaging Products: Digital cameras, Film cameras, Interchangeable camera lenses Instruments: Microscopes, Measuring instruments, Inspection equipment Other: LCD Photomask Substrates, Sport Optics
[Geographic Segments] (Million yen)
Year ended March 31, 2010
Japan North America Europe Asia/Oceania Total (Eliminations)
or corporate Consolidated
1.Net sales 1) Outside customers 188,703 256,617 193,848 146,328 785,498 - 785,4982) Intersegment
sales/transfer 448,534 1,937 431 137,190 588,093 (588,093) -
Total 637,237 258,554 194,280 283,519 1,373,592 (588,093) 785,498Operating expenses 669,384 252,452 196,033 270,555 1,388,426 (589,073) 799,352Operating income (loss) (32,147) 6,102 (1,753) 12,963 (14,834) 980 (13,854)
2.Assets 463,988 59,295 39,820 63,350 626,454 114,177 740,632Notes: 1. The countries or regions are segmented by geographical vicinity.
2. Major countries or regions other than Japan: (1) North America: U.S.A., Canada (2) Europe: The Netherlands, Germany, The United Kingdom, France (3) Asia/Oceania: China, South Korea, Taiwan, Thailand, Australia
[Export Sales]
(Million yen) Year ended March 31, 2010
North America Europe Asia/Oceania Other Total I. Export sales (A) 245,112 189,507 195,629 16,223 646,472II. Net sales (B) 785,498III. (A)/(B) 31.2% 24.1% 24.9% 2.1% 82.3%
Notes: 1. The countries or regions are segmented by geographical vicinity.
2. Major countries or regions o er than Japan: th(1) North America: U.S.A., Canada (2) Europe: The Netherlands, Germany, The United Kingdom, France (3) Asia/Oceania: China, South Korea, Taiwan, Singapore, Australia (4) Other: Middle & South America, Africa
3. Export sales indicate the sales of the Company and its consolidated subsidiaries in countries or regions excluding Japan.

23
4) Segment Information Fiscal year ended March 31, 2011 (From April 1 2010 to March 31, 2011) 1. Outline of business segments reported The business segments the Group reports are the business units for which the Company is able to obtain respective financial information separately in order for the Board of Directors to conduct periodic investigation to determine distribution of management resources and evaluate their business results. The Group introduces company-based organization. Each operating division addresses the creation of consistent
responsibility system and thoroughness of decentralized operation. Each Company is composed of segments by products and services based on operating division. Therefore, the Group has three reportable segments: the Precision Equipment Business, the Imaging Products Business and the Instruments Business. The precision equipment business provides products and services of IC steppers and LCD steppers. The imaging
products business provides products and services of imaging products and its peripheral domain, like digital SLR cameras, compact digital cameras and interchangeable camera lenses. The instruments business provides products and services of microscopes, measuring instruments and inspection equipments.
2. Method for calculating the sales, income (loss), assets, and other items for reporting segments The accounting methods for the reporting business segments are generally those set forth in “Material Items Which
Form the Basis for Preparation of the Consolidated Financial Statements.” Figures for income of reporting segments are on an operating income basis. Inter-segment sales or transfer are based on current market price.
3. Information on the amounts of sales, income (loss), assets, and other items by reporting segments Fiscal year ended March 31, 2011 (From April 1 2010 to March 31, 2011)
(Million of yen) Business segments reported
Precision Equipment
Imaging Products Instruments Total
Other Total Adjustment Consolidated Financial Statements
Sales
Outside customers 208,613 596,375 57,451 862,441 25,071 887,512 - 887,512
Inter-segment sales or transfer 749 1,050 1,801 3,601 27,222 30,823 (30,823) -
Total 209,362 597,426 59,253 866,042 52,293 918,336 (30,823) 887,512
Segment income (loss) 2,711 52,331 (5,247) 49,795 4,258 54,054 (1) 54,052
Segment assets 215,076 214,080 53,382 482,539 64,850 547,390 282,518 829,909
Other items
Depreciation and amortization 12,524 12,198 2,045 26,768 7,265 34,033 - 34,033Increase in tangible/intangible fixed assets 7,596 17,951 1,599 27,148 2,628 29,776 - 29,776
Notes: 1. The “Other Business” category incorporates operations not included in business segments reported, including the glass-related business, the sport optics products business and the customized products business.
2. Segment income adjustment includes elimination of intersegment transactions of minus 1 million yen. In addition, segment assets adjustment includes corporate assets not allocated to the respective reportable segments of 294,026 million yen and elimination of intersegment transactions of minus 11,507 million yen. Principal components of corporate assets are surplus funds (cash and deposits) held by the Company and its consolidated subsidiaries, long-term investments (investment securities) and deferred tax assets.
3. Segment income is adjusted with reported operating income on the consolidated financial statements.
(Additional Information) From the current fiscal year, the Group applies the “Revised Accounting Standard for Disclosures about Segments
of an Enterprise and Related information” (ASBJ Statement No.17 of March 27, 2009) and “Guidance on the Accounting Standard for Disclosures about Segments of an Enterprise and Related Information” (ASBJ Guidance No.20 of March 21, 2008).
24
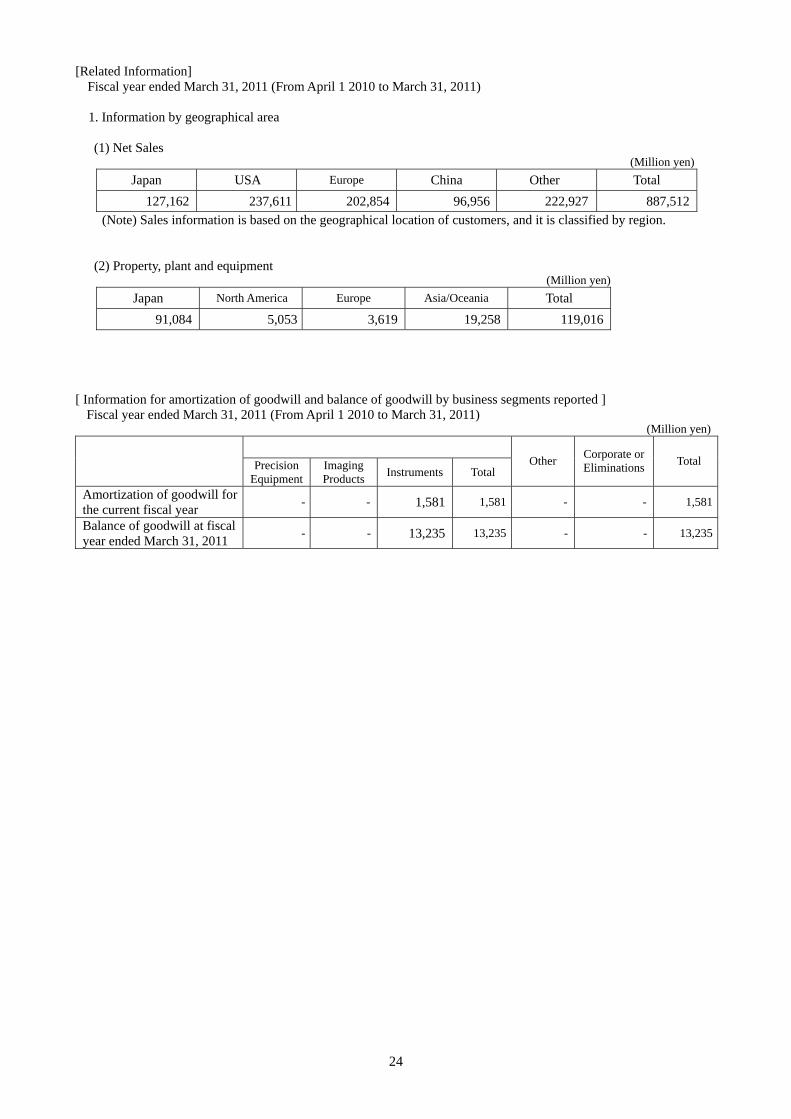
[Related Information] Fiscal year ended March 31, 2011 (From April 1 2010 to March 31, 2011)
1. Information by geographical area
(1) Net Sales
(Million yen) Japan USA Europe China Other Total
127,162 237,611 202,854 96,956 222,927 887,512(Note) Sales information is based on the geographical location of customers, and it is classified by region.
(2) Property, plant and equipment (Million yen)
Japan North America Europe Asia/Oceania Total 91,084 5,053 3,619 19,258 119,016
[ Information for amortization of goodwill and balance of goodwill by business segments reported ]
Fiscal year ended March 31, 2011 (From April 1 2010 to March 31, 2011) (Million yen)
Precision
Equipment Imaging Products Instruments Total
Other Corporate or Eliminations Total
Amortization of goodwill for the current fiscal year - - 1,581 1,581 - - 1,581
Balance of goodwill at fiscal year ended March 31, 2011 - - 13,235 13,235 - - 13,235

25
5)Per-Share Information Fiscal Year Ended March 2010
(From April 1, 2009 to March 31, 2010) Fiscal Year Ended March 2011
(From April 1, 2010 to March 31, 2011) (Yen) (Yen) Net assets per share 937.75 Net assets per share 980.62 Net income per share (31.82) Net income per share 68.90 Net income per share(fully diluted) 68.83 (Note) 1. Net income per share (fully diluted) for the year ended March 31, 2010 is not disclosed because of the
Company’s net loss position. 2. The basis for calculating net income per share and fully diluted net income par share is shown below.
Fiscal Year Ended March 2010
(From April 1, 2009 to March 31, 2010)
Fiscal Year Ended March 2011
(From April 1, 2010 to March 31, 2011)
Net income per share Net income (loss) (million yen) (12,615) 27,312 Amount not belonging to common stockholders (million yen) - - Net income (loss) related to common stock (million yen) (12,615) 27,312 Average shared outstanding (1,000 shares) 396,398 396,434
Net income per share (fully diluted) Increase in common stock (1,000 shares) - 355 (Subscription rights to shares) (1,000 shares) - 355
Latent shares not included in fully diluted net income per share calculation due to lack of dilution effect.
2007 stock options (99 new share subscription rights): 99,000 shares of common stock
2007 stock options (99 new share subscription rights): 99,000 shares of common stock
6) Significant subsequent events
Not applicable

5.Non-Consolidated Financial Statements (1) Non-Consolidated Balance Sheets
26

27

(2) Non-Consolidated Statements of Operations
28

(3) Non-Consolidated Statements of Changes in Net Assets
29

Non-Consolidated Statements of Changes in Net Assets
30