consolidated financial statements - informe integrado...
TRANSCRIPT

Consolidated financial statements

TO THE SHAREHOLDERS’ OF GRUPO NUTRESA S. A.
February 27, 2017
Statutory Auditor’s Report
I have audited the accompanying consolidated financial statements of Grupo Nutresa S. A., at December 31, 2016, comprising the statement of financial position, comprehensive income statements, of changes in the Shareholders’ equity, and of cash flows for the year then ended, as well as the summary of the main accounting policies and other explanatory notes.
Management’s Responsibility on the Financial StatementsThe management is responsible for the appropriate preparation and presentation of these financials statements in conformity with the accounting and financial reporting standards accepted in Colombia and the internal control considered by the management as relevant for the preparation of these financial statements to be free of material misstatements whether due to fraud or error.
Auditor’s ResponsibilityMy responsibility is to express an opinion on such financial statements based on my audit. I performed my work in accordance with the financial information auditing standards accepted in Colombia. These standards require that I comply with ethical requirements, as well as to plan and perform the audit to obtain reasonable assurance whether the financial statements are free from material misstatements.
An audit involves developing procedures to obtain audit evidence about the amounts and disclosures in the financial statements. The procedures selected depend on the auditor’s judgment, including the assessment of the risks of material misstatement in the financial statements due to fraud or error. In making those risk assessments, the auditor considers Company’s internal control relevant for the preparation of the financial statements, in order to design audit procedures that are appropriate in the circumstances. An audit also includes assessing the appropriateness of accounting policies used and reasonableness of accounting estimates made by the management, as well as assessing the overall presentation of the financial statements.
I believe that the audit evidence I obtained is enough and appropriate to provide a basis for my audit opinion.
5
Consolidated Financial Statements 2016

OpinionIn my opinion, the accompanying consolidated financial statements, present fairly, in all significant aspects, the financial position of Grupo Nutresa S. A. at December 31, 2016, and the results of its operations and cash flows for the year then ended, in conformity with the accounting and financial reporting standards accepted in Colombia.
Other MattersThe consolidated financial statements of the Company for the year ended on December 31, 2015 were audited by me by applying the audit standards generally accepted in Colombia in force at that date. I expressed an unqualified opinion thereon in my report dated February 26, 2016. Regarding this matter my opinion is unqualified.
TO THE SHAREHOLDERS’ OF GRUPO NUTRESA S. A.
February 27, 2017
Bibiana Moreno VásquezStatutory AuditorProfessional Card No. 167200-TMember of PricewaterhouseCoopers Ltda.
6

THE UNDERSIGNED LEGAL REPRESENTATIVE AND THE GENERAL COUNSEL OF GRUPO NUTRESA S. A.
CERTIFY:
24 of February of 2017
We have previously verified all claims, herewith contained, in the Consolidated Financial Statements, at December 31, 2016 and 2015, according to, the regulations, and the same that have been faithfully taken, from the Financial Statements of the Parent Company, and its subsidiaries, duly certified and audited.
In accordance with the above stated, in relationship to the Financial Statements, herewith mentioned, we declare the following:
1. The assets and liabilities, are stated and the recorded transactions, have been recorded, during said years.
2. All realized economic transactions, have been recognized.
3. The assets represent rights, and liabilities represent obligations, obtained or under the responsibility of the Companies.
4. All elements have been recognized, in the appropriate amounts, and in accordance with the accounting principles, generally accepted.
5. The economic transactions, that impact the Companies, have been correctly classified, described, and disclosed.
6. The Financial Statements and Notes, do not contain misstatements, errors, differences or material inaccuracies, which could impact the financial position, equity, and operations of the Companies. Similarly, appropriate procedures, reporting systems, and control of the financial information, have been established, to insure accurate reporting to third–party users, of such.
Certification of the Financial Statements
Jaime León Montoya VásquezGeneral AccountantT.P. 45056-T
Carlos Ignacio Gallego PalacioPresident
7
Consolidated Financial Statements 2016

GentlemenShareholdersGrupo Nutresa S.A.Medellín
THE UNDERSIGNED LEGAL REPRESENTATIVE OF GRUPO NUTRESA S.A.
CERTIFIES:
24 of February of 2017
That the Consolidated Financial Statements, and the operations of the Parent Company, and its subsidiaries, at December 31, 2016 and 2015, do not contain any defects, differences, inaccuracies, or errors that impede the knowledge of the true and fair presentation, of the financial situation, of the same.
The foregoing, is stated, for purposes of compliance with Article 46 of Law 964 of 2005.
And is signed, as a record, on the 24 day of the month of February of 2017.
Certification of the Financial Statements Law 964 of 2005
Carlos Ignacio Gallego PalacioPresident
th
8

Jaime León Montoya VásquezGeneral AccountantProfessional Card No. 45056-T(See attached certification)
Bibiana Moreno Vásquez Statutory Auditor Professional Card No. 167200-T Member of PricewaterhouseCoopers Ltda.(See attached auditor’s report)
Carlos Ignacio Gallego PalacioPresident(See attached certification)
Statement of Financial Position At December 31st of 2016 and 2015 (values expressed in millions of Colombian pesos)
Notas 2016 2015
ASSETSCurrent assetsCash and cash equivalents 8 $ 219.322 $ 286.064Trade and other receivables 9 889.197 878.280Inventories 10 1.028.417 1.032.969Biological assets 11 75.677 53.119Other current assets 12 246.832 220.762Non-current assets held for sale 13 100.330 71.679Total current assets $ 2.559.775 $ 2.542.873Non-current assets Trade and other receivables 9 23.495 26.729Biological assets 11 7.433 5.699Investments in associates and joint ventures 19 164.510 109.021Other financial non-current assets 20 3.885.206 3.418.149Property, plant and equipment, net 14 3.383.513 3.383.722Investment properties 15 71.842 82.393Goodwill 16 2.034.454 2.033.403Other intangible assets 17 1.163.671 1.179.957Deferred tax assets 18.4 356.994 355.461Other assets 12 48.661 40.645Total non-current assets $ 11.139.779 $ 10.635.179TOTAL ASSETS $ 13.699.554 $ 13.178.052LIABILITIES Current liabilities Financial obligations 21 847.689 1.059.660Trade and other payables 22 888.840 825.435Income tax and income tax payable 18.2 163.362 172.323Employee benefits liabilities 23 161.592 160.628Current provisions 24 2.734 4.415Other liabilities 25 49.746 26.641Total current liabilities $ 2.113.963 $ 2.249.102Non-current liabilities Financial obligations 21 2.277.429 2.034.604Trade and other payables 22 158 159Employee benefits liabilities 23 216.744 211.533Deferred tax liabilities 18.4 705.700 727.692Other liabilities 25 600 - Total non-current liabilities $ 3.200.631 $ 2.973.988TOTAL LIABILITIES $ 5.314.594 $ 5.223.090SHAREHOLDER EQUITY Share capital issued 27.1 2.301 2.301Paid-in-capital 27.1 546.832 546.832Reserves 27.2 3.655.280 1.859.537Other comprehensive income, accumulated 28 3.746.572 3.569.478Retained earnings - 1.514.303Earnings for the period 395.734 428.152Equity attributable to the controlling interest $ 8.346.719 $ 7.920.603Non-controlling interest 27.4 38.241 34.359TOTAL SHAREHOLDER EQUITY $ 8.384.960 $ 7.954.962TOTAL LIABILITIES AND EQUITY $ 13.699.554 $ 13.178.052
The notes are an integral part of the Consolidated Financial Statements.
Consolidated financial statements 2016
9

Jaime León Montoya VásquezGeneral AccountantProfessional Card No. 45056-T(See attached certification)
Bibiana Moreno Vásquez Statutory AuditorProfessional Card No. 167200-T Member of PricewaterhouseCoopers Ltda.(See attached auditor’s report)
Carlos Ignacio Gallego PalacioPresident(See attached certification)
Comprehensive Income Statement - AccumulatedFrom January 1st to December 31st (Values expressed in millions of Colombian Pesos)
Notas 2016 2015
CONTINUING OPERATIONSOperating revenue 6 $ 8.676.640 $ 7.945.417 Cost of goods sold 30 (4.966.031) (4.507.166)Gross profit $ 3.710.609 $ 3.438.251 Administrative expenses 30 (401.100) (371.810)Sales expenses 30 (2.384.866) (2.144.502)Production expenses 30 (147.694) (137.446)Exchange differences on operating assets and liabilities 33.2 15.873 2.619 Other operating income (expenses), net 31 22.149 (4.427)Operating profit $ 814.971 $ 782.685 Financial income 32.1 10.982 9.828 Financial expenses 32.2 (324.637) (234.896)Portfolio dividends 20 50.545 47.016 Exchange differences on non-operating assets and liabilities 33.2 (8.642) 27.181 Loss on net monetary position 29 (32.946) (32.160)Share of profit of associates and joint ventures 19 6.103 4.928 Other expenses, net 28.492 (288)Income before tax and non-controlling interest $ 544.868 $ 604.294 Current income tax 18.3 (172.866) (183.561)Deferred income tax 18.3 29.533 16.421 Profit after taxes from continuous operations $ 401.535 $ 437.154 Discontinued operations, after income tax 34 (1.844) (6.335)Net profit for the year $ 399.691 $ 430.819
Profit for the period attributable to: Controlling interest $ 395.734 $ 428.152 Non-controlling interest 27.4 3.957 2.667 Net profit for the year $ 399.691 $ 430.819 Earnings per share (*)Basic, attributable to controlling interest (in Colombian Pesos) 35 860,06 930,77 (*) Calculated on 460.123.458 shares, which have not been modified during the period, covered by these Financial Statements.
OTHER COMPREHENSIVE INCOMEItems that are not subsequently reclassified to profit and loss:Actuarial gains on defined benefit plans 28.1 $ (17.390) $ 6.727 Equity investments measured at fair value 28.2 395.023 (599.282)
Income tax from items that will not be reclassified 28.1-28.2 5.119 2.791
Total items that are not subsequently reclassified to profit and loss $ 382.752 $ (589.764)Items that are or may be subsequently reclassified to profit and loss:Share of other comprehensive income of associate and joint ventures 28.3 (3.414) 5.939 Exchange differences on translation of foreign operations 28.4 (202.497) 352.864 Deferred income tax from items that will be reclassified 28.3 176 - Total items that are or may be subsequently reclassified to profit and loss: $ (205.735) $ 358.803 Other comprehensive income, net taxes $ 177.017 $ (230.961)TOTAL COMPREHENSIVE INCOME FOR THE PERIOD $ 576.708 $ 199.858
Total comprehensive income attributable to:Controlling interest $ 572.828 $ 195.269 Non-controlling interest 3.880 4.589 TOTAL COMPREHENSIVE INCOME $ 576.708 $ 199.858
The notes are an integral part of the Consolidated Financial Statements.
10
Jaime León Montoya VásquezGeneral AccountantProfessional Card No. 45056-T(See attached certification)
Bibiana Moreno Vásquez Statutory Auditor Professional Card No. 167200-T Member of PricewaterhouseCoopers Ltda.(See attached auditor’s report)
Carlos Ignacio Gallego PalacioPresident(See attached certification)
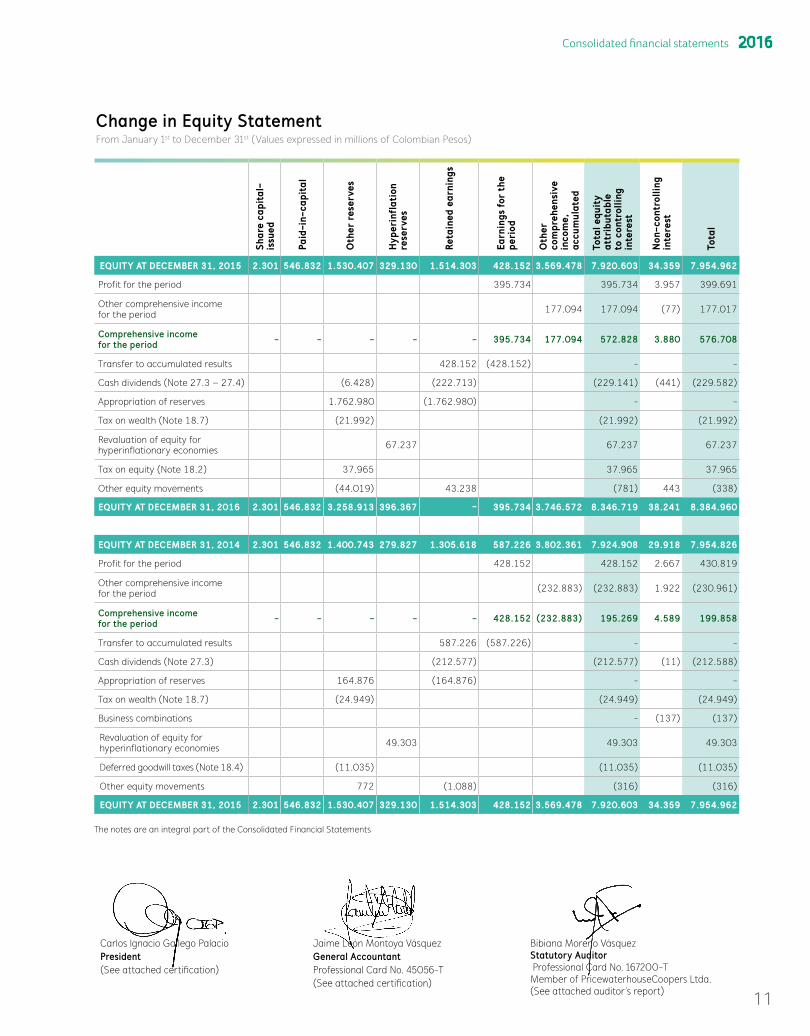
Change in Equity Statement From January 1st to December 31st (Values expressed in millions of Colombian Pesos)
Shar
e ca
pita
l-is
sued
Paid
-in-
capi
tal
Oth
er r
eser
ves
Hyp
erin
flat
ion
rese
rves
Reta
ined
ear
ning
s
Earn
ings
for
the
peri
od
Oth
er
com
preh
ensi
ve
inco
me,
ac
cum
ulat
ed
Tota
l equ
ity
attr
ibut
able
to
con
trol
ling
inte
rest
Non
-con
trol
ling
inte
rest
Tota
l
EQUITY AT DECEMBER 31, 2015 2.301 546.832 1.530.407 329.130 1.514.303 428.152 3.569.478 7.920.603 34.359 7.954.962
Profit for the period 395.734 395.734 3.957 399.691
Other comprehensive income for the period 177.094 177.094 (77) 177.017
Comprehensive income for the period - - - - - 395.734 177.094 572.828 3.880 576.708
Transfer to accumulated results 428.152 (428.152) - -
Cash dividends (Note 27.3 – 27.4) (6.428) (222.713) (229.141) (441) (229.582)
Appropriation of reserves 1.762.980 (1.762.980) - -
Tax on wealth (Note 18.7) (21.992) (21.992) (21.992)
Revaluation of equity for hyperinflationary economies 67.237 67.237 67.237
Tax on equity (Note 18.2) 37.965 37.965 37.965
Other equity movements (44.019) 43.238 (781) 443 (338)
EQUITY AT DECEMBER 31, 2016 2.301 546.832 3.258.913 396.367 - 395.734 3.746.572 8.346.719 38.241 8.384.960
EQUITY AT DECEMBER 31, 2014 2.301 546.832 1.400.743 279.827 1.305.618 587.226 3.802.361 7.924.908 29.918 7.954.826
Profit for the period 428.152 428.152 2.667 430.819
Other comprehensive income for the period (232.883) (232.883) 1.922 (230.961)
Comprehensive income for the period - - - - - 428.152 (232.883) 195.269 4.589 199.858
Transfer to accumulated results 587.226 (587.226) - -
Cash dividends (Note 27.3) (212.577) (212.577) (11) (212.588)
Appropriation of reserves 164.876 (164.876) - -
Tax on wealth (Note 18.7) (24.949) (24.949) (24.949)
Business combinations - (137) (137)
Revaluation of equity for hyperinflationary economies 49.303 49.303 49.303
Deferred goodwill taxes (Note 18.4) (11.035) (11.035) (11.035)
Other equity movements 772 (1.088) (316) (316)
EQUITY AT DECEMBER 31, 2015 2.301 546.832 1.530.407 329.130 1.514.303 428.152 3.569.478 7.920.603 34.359 7.954.962
The notes are an integral part of the Consolidated Financial Statements
Consolidated financial statements 2016
11

Jaime León Montoya VásquezGeneral AccountantProfessional Card No. 45056-T(See attached certification)
Bibiana Moreno Vásquez Statutory AuditorProfessional Card No. 167200-T Member of PricewaterhouseCoopers Ltda.(See attached auditor’s report)
Carlos Ignacio Gallego PalacioPresident(See attached certification)
The notes are an integral part of the Consolidated Financial Statements.
Cash-flows StatementFrom January 1st to December 31st (Values expressed in millions of Colombian Pesos)
2016 2015
CASH FLOWS FROM OPERATING ACTIVITIESCollection from sales of goods and services $ 8.630.392 $ 7.788.191 Payments to suppliers for goods and services (6.198.605) (5.640.140)Payments to and on behalf of employees (1.429.959) (1.290.701)Income taxes and tax on wealth, paid (221.788) (222.143)Other cash inflows/outflows 27.897 (19.669)Net cash flows from operating activities $ 807.937 $ 615.538 CASH FLOWS FROM INVESTMENT ACTIVITIESPayments to third parties for control of subsidiaries - (743.401)Cash and cash equivalents from acquisitions - 6.353 Decrease of cash and cash equivalents from classification of investments in subsidiaries to financial instruments (3.179) -
Purchases of equity of associates and joint ventures (36.583) (14.831)Sales of property, plant and equipment 41.004 9.309 Purchases of property, plant and equipment and assets held for sales (403.062) (399.387)Purchase of intangible assets (Note 17) (8.108) (11.208)Dividends received 49.661 46.142 Interest received 7.221 7.437 Other cash inflows 28.751 19.489 Net cash flows used in investment activities $ (324.295) $ (1.080.097)CASH FLOWS FROM FINANCING ACTIVITIESProceeds from loans 25.391 738.986 Dividends paid (Note 27.3) (224.805) (208.480)Interest paid (276.981) (197.100)Other financial expenses (32.409) (27.487)Other cash inflows 15.729 12.133 Net cash flows (used in) from financing activities $ (493.075) $ 318.052
DECREASE IN CASH AND CASH EQUIVALENT FROM OPERATIONS $ (9.433) $ (146.507)Net foreign exchange differences (57.309) 40.708 Decrease cash and cash equivalents, net (66.742) (105.799)Cash and cash equivalents at the beginning of the period 286.064 391.863 Cash and cash equivalents at the end of the period $ 219.322 $ 286.064
12

A MESSAGE FROM THE MANAGEMENT AT GRUPO NUTRESA
Grupo Nutresa S.A. is the leader in processed foods in Colombia and one of the most relevant players in this sector in Latin America, with consolidated annual sales of COP 8,7 billion, annually (2016), in 8 Business Units: Cold Cuts, Biscuits, Chocolate, Tresmontes Luchetti (TMLUC), Coffee, Retail Foods, Ice Cream, and Pasta. Grupo Nutresa is a diversified company in terms of geographical reach, products, and supplying.
Our Centennial Strategy is aimed to double our 2013 sales, by 2020, with sustained profitability between 12% and 14% of the EBITDA margin. To achieve this, we offer our consumer, nutrition, as well as, the expe-rience of recognized and beloved brands, that are nutritious, and generate wellness and well-being, and that are distinguished by the best value for price; widely available in our strategic regions, managed by talented, innovative, committed, and responsible people, who contribute to our sustainable development.
The differentiation of our unique business model:• Our People: Human talent is one of our most valuable assets. The cultural platform is supported by the
promotion of participatory environments, development of the competences of being and doing, recogni-tion, the building of a leading brand, as well as, a balanced life for our people.
• Our Brands: Our Brands are leaders in the markets in which we participate, are recognized, beloved, and are part of people’s daily life. They are supported on nutritional and reliable products, with high value at affordable prices.
• Our Distribution Network: Our extensive distribution network, differentiated by channels and segments, and with teams of specialized staff, allows us to have our products available, with adequate availability, affording us a close relationship with our clients.
RESULTS 2016The Organization presented very positive sales dynamics in 2016 in Colombia and abroad. At the consolidated level, the year closed with COP 8,7 trillion in sales, a 9,2% increase over those registered in 2015, and a 8,3% increase excluding the sales of recently acquired companies, for comparison purposes.
In Colombia, sales were COP 5,4 trillion, with a growth of 9,1%. Excluding January and February 2016 Gru-po El Corral sales, which are not comparable with those of 2015, growth was of 7,7%; this was made possible by the construction of a differentiated value offer for clients, buyers and consumers, and by the development of distribution networks that allowed us to take our products to more than 405.500 points of sale in Colombia with well-known and beloved brands.
Sales abroad, measured in Colombian Pesos, were 9,4% higher than those registered in December 2015 and amounted to COP 3,3 trillion, representing 38,2% of the total. In Dollars, this equaled USD 1,1 billion, 1,0% lower than those of last year.
Gross profit, COP 3,7 trillion, grew 7,9% over that achieved in 2015 and reflects the combined effect of responsible price management and the increased costs of some raw materials.
The variation in administrative and production expenses, in alignment with the increase of the gross profit, partially counter-balanced the impact of the greater effort required during the year regarding sales expen-ses, which led to an operating margin of 9,4%.
Net post-operating expenses, for COP 270.103 million, include the increase in the cost of the debt for higher reference-interest rates during 2016.
In terms of profitability, an EBITDA margin on sales of 11,9% is reported during the year, amounting to COP 1,03 trillion, and growing 5,5% over that of 2015. This level is largely explained by the high inflation rates regis-tered during the year, the effect of the devaluation of the currencies, and the El Niño phenomenon in Colombia, which were partially mitigated by responsible price management with a long-term vision of volume protection.
As a result, the consolidated net profit was COP 395.735 million, representing a 4,6% margin on sales.Assets grew 4,0% and closed at COP 13,7 trillion. This growth is largely due to the higher value of our in-
vestments in Grupo Sura and Grupo Argos.
13
Consolidated Financial Statements 2016
MANAGEMENT OF CAPITALThe increasing value creation is a fundamental part of the strategic objectives set by the Group. This transla-tes into the active management of the capital structure, which balances the sustained growth of current ope-rations, which requires constant investment in capital expenditures (Capex), and growth through acquisitions of ongoing businesses, which bring economic and strategic value to the Group.
In the allocation of resources, for both investments in fixed assets and acquisitions, the cost of capital (WACC) is used as a reference point to measure added value, relevant to each type of investment, geography, and particular level of risk. In every one of the investments, the goal is to seek a return that exceeds the cost of the capital.
Similarly, for each investment, the various sources of funding, both internal and external, are analyzed to secure a suitable profile for the duration of that specific investment, as well as, cost optimization. In accor-dance with a moderate financial risk profile, the capital structure of the Group aims towards obtaining the highest credit ratings.
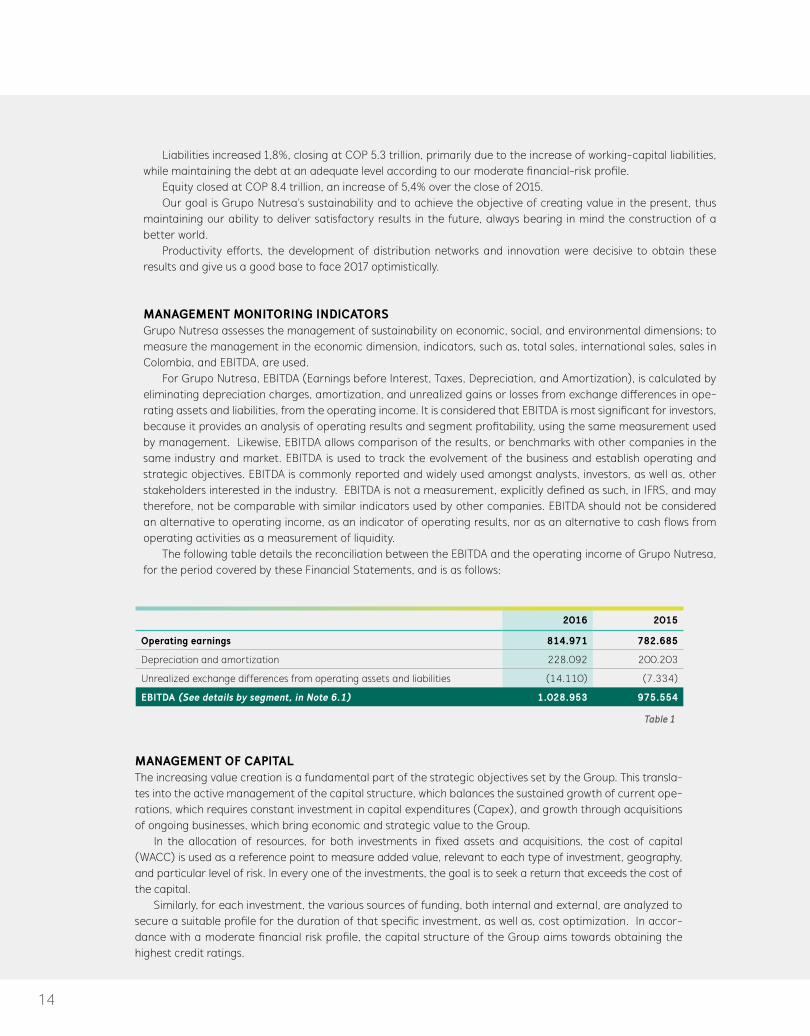
2016 2015
Operating earnings 814.971 782.685
Depreciation and amortization 228.092 200.203
Unrealized exchange differences from operating assets and liabilities (14.110) (7.334)
EBITDA (See details by segment, in Note 6.1) 1.028.953 975.554
Table 1
Liabilities increased 1,8%, closing at COP 5.3 trillion, primarily due to the increase of working-capital liabilities, while maintaining the debt at an adequate level according to our moderate financial-risk profile.
Equity closed at COP 8.4 trillion, an increase of 5,4% over the close of 2015.Our goal is Grupo Nutresa’s sustainability and to achieve the objective of creating value in the present, thus
maintaining our ability to deliver satisfactory results in the future, always bearing in mind the construction of a better world.
Productivity efforts, the development of distribution networks and innovation were decisive to obtain these results and give us a good base to face 2017 optimistically.
MANAGEMENT MONITORING INDICATORSGrupo Nutresa assesses the management of sustainability on economic, social, and environmental dimensions; to measure the management in the economic dimension, indicators, such as, total sales, international sales, sales in Colombia, and EBITDA, are used.
For Grupo Nutresa, EBITDA (Earnings before Interest, Taxes, Depreciation, and Amortization), is calculated by eliminating depreciation charges, amortization, and unrealized gains or losses from exchange differences in ope-rating assets and liabilities, from the operating income. It is considered that EBITDA is most significant for investors, because it provides an analysis of operating results and segment profitability, using the same measurement used by management. Likewise, EBITDA allows comparison of the results, or benchmarks with other companies in the same industry and market. EBITDA is used to track the evolvement of the business and establish operating and strategic objectives. EBITDA is commonly reported and widely used amongst analysts, investors, as well as, other stakeholders interested in the industry. EBITDA is not a measurement, explicitly defined as such, in IFRS, and may therefore, not be comparable with similar indicators used by other companies. EBITDA should not be considered an alternative to operating income, as an indicator of operating results, nor as an alternative to cash flows from operating activities as a measurement of liquidity.
The following table details the reconciliation between the EBITDA and the operating income of Grupo Nutresa, for the period covered by these Financial Statements, and is as follows:
14

15
For the period between January 1st and December 31st of 2016 and 2015
(Values are expressed as millions of Colombian Pesos, except for the values in foreign currency, exchange rates, and number of shares.)
NOTES FOR THE CONSOLIDATED FINANCIAL STATEMENTS
NOTE 1. CORPORATE INFORMATION
1.1 ENTITY AND CORPORATE PURPOSE OF PARENT COMPANY AND SUBSIDIARIESGrupo Nutresa S.A. and its subsidiaries, (hereinafter referred to as: Grupo Nutresa, the Company, the Group, or Nutresa), constitute an integrated and diversified food industry group, that operates mainly in Colombia and Latin America.
The Parent Company is Grupo Nutresa S.A., a corporation of Colombian nationality, incorporated on April 12, 1920, with its headquarters in the City of Medellin, Colombia; its terms
expire on April 12, 2050. The Corporate Business Purpose con-sists of the investment or application of available resources, in organized enterprises, under any of the forms permitted by law, whether domestic or foreign, and aimed at the use of any legal economic activity, either tangible or intangible assets, with the purpose of safeguarding its capital.
Below is information of subsidiaries: name, main activity, Country of Incorporation, functional currency, and percentage of shares held by Grupo Nutresa:
Consolidated financial statements 2016
16
Entity Main Activity
Func
tion
al
Cur
renc
y (1
)
% Participation
2016 2015
ColombiaIndustria Colombiana de Café S.A.S. Production of coffee and coffee related products COP 100,00 100,00
Compañía Nacional de Chocolates S. A. S. Production of chocolates, its derivatives, and related products COP 100,00 100,00
Compañía de Galletas Noel S. A. S. Production of biscuits, cereals, et al. COP 100,00 100,00
Industria de Alimentos Zenú S. A. S. Production and sales of meats and its derivatives COP 100,00 100,00
Productos Alimenticios Doria S. A. S. Production of pasta, flour, and cereals COP 100,00 100,00Molino Santa Marta S.A.S. Milling of grains COP 100,00 100,00Alimentos Cárnicos S.A.S. Production of meats and its derivatives COP 100,00 100,00Tropical Coffee Company S. A. S. Assembly and production of coffee products COP 100,00 100,00Litoempaques S. A. S. Production or manufacturing of packaging material COP 100,00 100,00Pastas Comarrico S. A. S. Production of pasta, flour, and cereals COP 100,00 100,00
Novaventa S.A.S. Sales of foods and other items via direct sales channels COP 100,00 100,00
La Recetta Soluciones Gastronómicas Integradas S.A.S. Distribution of foods via institutional channels COP 70,00 70,00
Meals Mercadeo de Alimentos de Colombia S.A.S.
Production and sales of ice cream, dairy beverages, et al. COP 100,00 100,00
Servicios Nutresa S.A.S. Provision of specialized business services COP 100,00 100,00Setas Colombianas S.A. Processing and sales of mushrooms COP 99,48 99,48
Alimentos Cárnicos Zona Franca Santa Fe S.A.S. Provision of logistics services COP 100,00 100,00
Gestión Cargo Zona Franca S.A.S. Provision of logistics services COP 100,00 100,00Comercial Nutresa S.A.S. Sales of food products COP 100,00 100,00Industrias Aliadas S.A.S. Provision of services related to coffee COP 100,00 100,00Opperar Colombia S.A.S. Provision of transportation services COP 100,00 100,00Fideicomiso Grupo Nutresa Management of financial resources COP 100,00 100,00
Fondo de Capital Privado “Cacao para el Futuro” – Compartimento A Investment in cocoa production COP 83,41 83,41
IRCC Ltda. Production of foods and operation of food establishments providing to the consumer COP 100,00 100,00
LYC S.A.S. Production of foods and operation of food establishments providing to the consumer COP 100,00 100,00
PJ COL S.A.S. Production of foods and operation of food establishments providing to the consumer COP 100,00 100,00
Panero S.A.S. Production of foods and operation of food establishments providing to the consumer COP 100,00 100,00
New Brands S.A. Production of dairy and ice cream COP 100,00 100,00
Schadel Ltda. Production of foods and operation of food establishments providing to the consumer COP 99,88 99,88
Tabelco S.A.S. (2) Production of foods and operation of food establishments providing to the consumer COP 100,00% -
Chile
Tresmontes Lucchetti S.A. Provision of specialized business services CLP 100,00 100,00
Nutresa Chile S.A. Management of financial and investment services CLP 100,00 100,00Tresmontes Lucchetti Agroindustrial S.A. Agricultural and industrial production CLP 100,00 100,00Tresmontes Lucchetti Servicios S.A. Management of financial and investment services CLP 100,00 100,00Tresmontes S.A. Production and sales of foods CLP 100,00 100,00Inmobiliaria Tresmontes Lucchetti S.A. Management of financial and investment services CLP 100,00 100,00
Table 2

17
Entity Main Activity
Func
tion
al
Cur
renc
y (1
)
% Participation
2016 2015
Lucchetti Chile S.A. Production of pasta, flour, and cereals CLP 100,00 100,00
Novaceites S.A. Production and sales of vegetable oils CLP 50,00 50,00
Inmobiliaria y Rentas Tresmontes Lucchetti Management of financial and investment services CLP 100,00 100,00
Costa Rica
Compañía Nacional de Chocolates DCR, S.A. Production of chocolates and its derivatives CRC 100,00 100,00
Compañía de Galletas Pozuelo DCR S.A. Production of biscuits, et al. CRC 100,00 100,00
Cía. Americana de Helados S.A. Production and sales of ice cream CRC 100,00 100,00
Servicios Nutresa CR S.A. Specialized business services provider CRC 100,00 100,00
Guatemala
Comercial Pozuelo Guatemala S.A. Distribution and sales of food products QTZ 100,00 100,00
Heladera Guatemalteca S.A. Production and sales of ice cream QTZ - 100,00
Distribuidora POPS S.A. Sales of ice cream QTZ 100,00 100,00
Nevada Guatemalteca S.A. Property leasing services QTZ - 100,00
Guate-Pops S.A. Personnel services QTZ - 100,00
Mexico
Nutresa S.A. de C.V. Production and sales of food products MXN 100,00 100,00
Serer S.A. de C.V. Personnel services MXN 100,00 100,00
Comercializadora Tresmontes Lucchetti S.A. de C.V. Sales of food products MXN 100,00 100,00
Servicios Tresmontes Lucchetti S.A. de C.V. Specialized business services provider MXN 100,00 100,00
Tresmontes Lucchetti Mexico S.A. de C.V. Production and sales of foods MXN 100,00 100,00
TMLUC Servicios Industriales, S. A. de CV Specialized business services provider MXN 100,00 100,00
Panama
Promociones y Publicidad Las Américas S.A. Management of financial and investment services PAB 100,00 100,00
Alimentos Cárnicos de Panama S.A. Production of meats and its derivatives PAB 100,00 100,00
Comercial Pozuelo Panama S. A Production of biscuits, et al. PAB 100,00 100,00
American Franchising Corp. (AFC) Management of financial and investment services USD 100,00 100,00
Aldage, Inc. Management of financial and investment services USD 100,00 100,00
LYC Bay Enterprise INC. Management of financial and investment services USD 100,00 100,00
Sun Bay Enterprise INC. Management of financial and investment services USD 100,00 100,00
The United States of America
Abimar Foods Inc. Production and sales of food products USD 100,00 100,00
Cordialsa Usa, Inc. Sales of food products USD 100,00 100,00
Costa Rica´s Creamery LLC. Operation of food establishments providing to the consumer – Ice cream USD - 100,00
Gulla Properties Development LLC.(2) Management of financial and investment resources USD - -
Heanor Consulting LLC.(2) Management of financial and investment services USD - -
VenezuelaCordialsa Noel Venezuela S.A.(3) Sales of food products VEI 100,00 100,00
Industrias Alimenticias Hermo de Venezuela (3) Production of foods VEI 100,00 100,00
Consolidated financial statements 2016

18
Entity Main Activity
Cou
ntry
Func
tion
al
Cur
renc
y (1
)
% Participation
2016 2015
Other CountriesTMLUC Argentina S.A. Production and sales of food products Argentina ARS 100,00 100,00
Corp. Distrib. de Alimentos S.A. (Cordialsa) Sales of food products Ecuador USD 100,00 100,00
Comercial Pozuelo El Salvador S.A. de C.V. Distribution and sales of food products El Salvador USD 100,00 100,00
Americana de Alimentos S.A. de C.V. Sales of food products El Salvador USD 100,00 100,00Comercial Pozuelo Nicaragua S.A. Sales of food products Nicaragua NIO 100,00 100,00Industrias Lácteas Nicaragua S.A. Sales and logistics management Nicaragua NIO 100,00 100,00
Compañía Nacional de Chocolates del Peru S.A. Production of foods and beverages Peru PEN 100,00 100,00
TMLUC Peru S.A. Production and sales of foods Peru PEN 100,00 100,00
Helados Bon Production and sales of ice cream, beverages, and dairy, et al.
Dominican Republic
DOP 81,18 81,18
Compañía de Galletas Pozuelo de República Dominicana S.R.L.
Management of financial and investment services
Dominican Republic
DOP 100,00 100,00
Gabon Capital LTD. Management of financial and investment services BVI USD 100,00 100,00
Baton Rouge Holdings LTD. Management of financial and investment services BVI USD 100,00 100,00
Ellenbrook Holdings Limited Management of financial and investment services BVI USD - 100,00
Perlita Investments LTD. Management of financial and investment services BVI USD 100,00 100,00
El Corral Investments INC Management of financial resources and franchises BVI USD 100,00 100,00
(1) See Note 33.1, for descriptions of abbreviations for each currency and the primary impact on Grupo Nutresa’s Financial Statements.
(2) At December 31, 2015, Grupo Nutresa had no direct or indirect participation of these companies; however, there was a private Shareholder agreement, resulting from the acquisition of Grupo El Corral, in which the Group was given control over the relevant decisions of these com-panies. This same agreement granted Grupo Nutresa control over Tabelco S.A.S., entity over which the ownership of 100% of the shares were obtained, according to, a private Shareholder Agreement in April, 2016.
(3) See note 20.1 changes in the classification of the investment.
Changes in the scope of consolidationThe following are the changes in consolidation parameters, during the period
2016: On March 1 , there was a merger between Guate-malteca Refrigerator S.A., Nevada Guatemalteca S.A., Gua-te-Pops S.A. and Distribuidora POPS S.A., thus leaving the latter in effect, in Guatemala. In April, there was a liquidation of the companies Heanor Consulting LLC, Gulla Properties Development and Ellenbrook Holdings Limited, which ope-rated as an investment vehicle for companies acquired of Grupo El Corral. As of October 1, 2016, the investments in Compañías Industrias Alimenticias Hermo de Venezuela S. A. and Cordialsa Noel Venezuela S. A., were classified as Finan-cial Instruments (Note 20.1).
2015: The acquisition of Grupo El Corral was realized and the assets and liabilities, of the companies acquired to February 28, 2015, as well as, its results, as of March 1, 2015, were incorpo-rated into Grupo Nutresa’s Consolidated Statements. In June, Servicios Nutresa CR S.A. was registered in Costa Rica. In Au-gust, a merger between Americana de Alimentos Ameral S.A. and Helados H.D. S.A. with Industrias Lácteas de Costa Rica S.A. was executed, thus leaving the latter active; similarly, Fransouno S.A. e Inmobiliaria Nevada S.A. was merged with Cía. America-na de Helados S.A., the latter active to date. In the U.S., the companies, POPS One LLC y POPS Two LLC, were liquidated and in September, Tresmontes Lucchetti Internacional S.A. and Tresmontes Lucchetti S.A. were merged. In November, Indus-trias Lácteas de Costa Rica was absorbed by Compañía Ame-ricana de Helados S.A. (American Ice Cream Co. Inc.), leaving the latter active.
st
19
NOTE 2. BASIS OF PREPARATION
Grupo Nutresa´s Consolidated Financial Statements, for the period between January 1st and December 31st of 2016, were prepared in accordance with the International Financial Re-porting Standards (hereinafter IFRS), issued by the Interna-tional Accounting Standards Board, (hereinafter IASB), and interpretations issued by the International Financial Reporting Interpretations Committee (hereinafter IFRIC), and appro-ved in Colombia through Decree 2784 of 2012, Decree 3023 of 2013, Decree 2420 of 2015, its regulations, and other ac-counting standards issued by the Financial Superintendence of Colombia.
2.1 FINANCIAL STATEMENTS AT THE CLOSE OF THE PERIOD The Consolidated Financial Statements, at the close of the period, have been prepared in accordance with International Financial Reporting Standards. Some of the figures and disclo-sures, relating to the year 2015, presented in these Financial Statements may present variations, compared to the informa-tion published in the Financial Statements, of December 31, 2015, due to the fact that, the same, include adjustments, and reclassifications, which were realized, as a result of the audit and internal review, by the Management. The Group Management considers that these adjustments are not material and do not affect the reasonability of the previously published information.
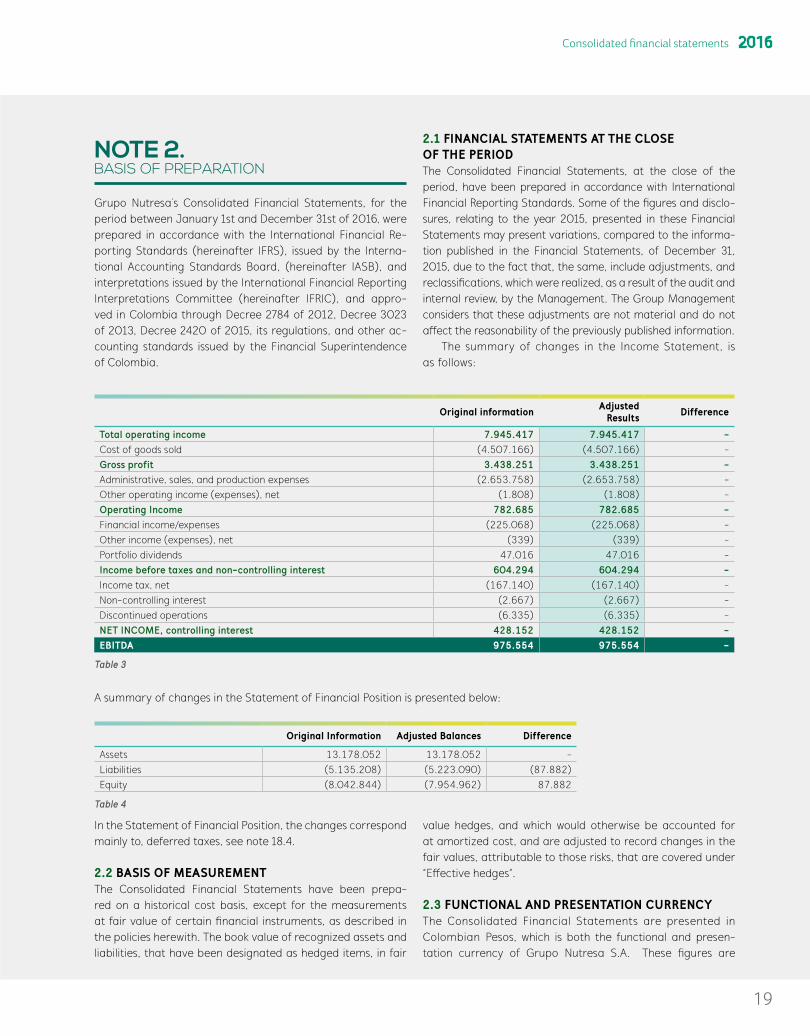
The summary of changes in the Income Statement, is as follows:
Original information Adjusted Results Difference
Total operating income 7.945.417 7.945.417 -Cost of goods sold (4.507.166) (4.507.166) -Gross profit 3.438.251 3.438.251 -Administrative, sales, and production expenses (2.653.758) (2.653.758) -Other operating income (expenses), net (1.808) (1.808) -Operating Income 782.685 782.685 -Financial income/expenses (225.068) (225.068) -Other income (expenses), net (339) (339) -Portfolio dividends 47.016 47.016 -Income before taxes and non-controlling interest 604.294 604.294 -Income tax, net (167.140) (167.140) -Non-controlling interest (2.667) (2.667) -Discontinued operations (6.335) (6.335) -NET INCOME, controlling interest 428.152 428.152 -EBITDA 975.554 975.554 -
Table 3
A summary of changes in the Statement of Financial Position is presented below:
Original Information Adjusted Balances Difference
Assets 13.178.052 13.178.052 -Liabilities (5.135.208) (5.223.090) (87.882)Equity (8.042.844) (7.954.962) 87.882
Table 4
In the Statement of Financial Position, the changes correspond mainly to, deferred taxes, see note 18.4.
2.2 BASIS OF MEASUREMENTThe Consolidated Financial Statements have been prepa-red on a historical cost basis, except for the measurements at fair value of certain financial instruments, as described in the policies herewith. The book value of recognized assets and liabilities, that have been designated as hedged items, in fair
value hedges, and which would otherwise be accounted for at amortized cost, and are adjusted to record changes in the fair values, attributable to those risks, that are covered under “Effective hedges”.
2.3 FUNCTIONAL AND PRESENTATION CURRENCYThe Consolidated Financial Statements are presented in Colombian Pesos, which is both the functional and presen-tation currency of Grupo Nutresa S.A. These figures are
Consolidated financial statements 2016
20
expressed as millions of Colombian Pesos, except for net ear-nings per share and the representative market exchange ra-tes, which are expressed as Colombian Pesos, and other cu-rrencies [E.g. USD, Euros, Pounds Sterling, et al.], which are expressed as monetary units.
2.4 CLASSIFICATION OF ITEMS IN CURRENT AND NON-CURRENTGrupo Nutresa presents assets and liabilities in the State-ment of Financial Position, classified as current and non-cu-rrent. An asset is classified as current, when the entity: ex-pects to realize the asset, or intends to sell or consume it within its normal operating cycle, holds the asset primarily for negotiating purposes, expects to realize the asset within twelve months after the reporting period is reported, or the asset is cash or cash equivalent, unless the asset is restricted for a period of twelve months after the close of the repor-ting period. All other assets are classified as non-current. A liability is classified as current when the entity expects to settle the liability within its normal operating cycle or holds the liability primarily for negotiating purposes
NOTE 3. SIGNIFICANT ACCOUNTING POLICIES
3.1 BASIS OF CONSOLIDATION3.1.1 INVESTMENTS IN SUBSIDIARIESThe Consolidated Financial Statements include Grupo Nu-tresa S.A.´s financial information, as well as, its subsidiaries, to December 31, 2016 and its corresponding comparative financial information. A subsidiary is an entity controlled by one of the companies that composes Grupo Nutresa. Con-trol exists when any of the Group companies has the power to direct the relevant activities of the subsidiary, which are generally: the operating and financing activities to obtain benefits from them, and is exposed, or has rights, to those variable yields.
The accounting policies and practices are applied homo-geneously, by the Parent Company and its subsidiary com-panies. In cases of subsidiaries located abroad, the practices do not differ significantly from the accounting practices used in the countries of origin, and/or have been homologized to those that have a significant impact on the Consolidated Fi-nancial Statements.
All balances and transactions between companies, as well as, the unrealized profits or losses, were eliminated in the con-solidation process.
The Consolidated Statements, from the date of acquisition until the date that Grupo Nutresa loses its control, are inclu-ded in the Financial Statements of subsidiaries; any residual interest that is retained is measured at fair value; the gains
or losses arising from this measurement are recognized in the results for that period.
The Separate Financial Statements are the basis for the distribution of dividends and other appropriations by the Shareholders. The Consolidated Financial Statements are presented at the Shareholders’ Meeting, for informational purposes only.
Consolidation of companies in which Grupo Nutresa owns less than the majority of voting rights:The Group considers exercising control of the relevant activities of Novaceites S.A., despite that their actual controlling shares are 50% which does not give the majority of the voting rights. This conclusion is based on the composition of the Directive of Novaceites S.A., the Administration of TMLUC, as well as, the General Management of the Company and the level of invol-vement of TMLUC in its accounting and commercial processes.
Companies in which Grupo Nutresa holds the majority, of the voting rights, but does not have the control, as such:The Group considers that it does not exercise control over the relevant activities of Industrias Alimenticias Hermo de Vene-zuela S.A. and Cordialsa Noel Venezuela S.A. despite having a 100% stake. See detailed information in Note 20.1.
3.1.2 NON-CONTROLLING INTERESTNon-controlling interest in net assets of the consolidated subsidiaries are presented separately within Grupo Nutresa’s equity. Profit and loss, and “Other comprehensive income”, is also attributed to non-controlling and controlling interest.
Subsidiaries’ purchases or sales, involving non-controlling ownership, that do not involve a loss of control, are recognized directly in equity.
Grupo Nutresa considers non-controlling interest tran-sactions, as transactions with Shareholders of the Company. When carrying out acquisitions of minority interest transac-tions, the difference between the consideration paid, and the interest acquired over the book value of the subsidiary´s net assets, is recognized as an equity transaction; therefore, goodwill for those acquisitions is not recognized.
3.2 INVESTMENTS IN ASSOCIATES AND JOINT VENTURESAn associate is an entity over which Grupo Nutresa has signi-ficant influence over financial and operating policies, without having control or joint control. A joint venture is an entity that Grupo Nutresa controls jointly with other participants, where, together, they maintain a contractual agreement that establi-shes joint control over the relevant activities of the entity.
At the date of acquisition, the excess acquisition cost over the net fair value of the identifiable assets, liabilities, and con-tingent liabilities assumed by the associate or joint venture, is

21
recognized as goodwill. Goodwill is included in the book value of the investment and is not amortized, nor is it individually tested for impairment.
The results, assets, and liabilities of the associate or joint venture are incorporated in the Consolidated Financial State-ments, using the equity method, under which the investment is initially recorded at cost and is adjusted with changes of the participation of Grupo Nutresa, over the net assets of the as-sociate or joint venture after the date of acquisition less any impairment loss on the investment. The losses of the asso-ciate or joint venture that exceed Grupo Nutresa’s shares in the investment, are recognized as a provision, only when it is probable that there will be an outflow of economic benefit and there is a legal or implicit obligation.
Where the equity method is applicable, adjustments are made to homologize the accounting policies of the associate or joint venture with those of Grupo Nutresa, the portion that corresponding to Grupo Nutresa. The portion that corres-ponds to Grupo Nutresa, of gains and losses, obtained from the measurement at fair value at the date of acquisition, is incorporated into the Financial Statements, and unrealized gains and losses from transactions between Grupo Nutresa and the associate or joint venture are eliminated, to the ex-tent of Grupo Nutresa´s participation in the associate or joint venture. The equity method is applied from the date of the acquisition to the date that significant influence or joint control over the entity is lost.
The portion of profit and loss, of an associate or joint ven-ture, is presented in the Comprehensive Income Statement, in the results section for the period, net of taxes and non-contro-lling interest of the subsidiaries of the associate or joint ventu-re. The portion of changes recognized directly in equity and “Other comprehensive income” of the associate or joint ven-ture is presented in the Statement of Changes in Equity and other consolidated comprehensive income. Cash dividends received, from the associate or joint ventures, are recognized by reducing the book value of the investment.
Grupo Nutresa periodically analyzes the existence of im-pairment indicators and, if necessary, recognizes impairment losses of the associate or joint venture investment. Impair-ment losses are recognized in profit and loss, and are calcula-ted as the difference between the recoverable amount of the associate or joint venture (which is the higher of the two va-lues, between the value in use and its fair value minus cost to sell), and the book value.
When the significant influence over an associate or joint control is lost, Grupo Nutresa measures and recognizes any re-tained residual investment at fair value. The difference between the book value of the associate or joint venture (taking into ac-count the relevant items of “Other comprehensive income”) and the fair value of the retained residual investment at its value from sale is recognized in profit and loss in that period.
3.3 SIGNIFICANT ACCOUNTING POLICIESGrupo Nutresa and its subsidiaries apply the accounting poli-cies and procedures of the Parent Company. The following is a breakdown of the significant accounting policies that Grupo Nutresa applies in the preparation of its Consolidated Finan-cial Statements. The following are the significant accounting policies applied by Grupo Nutresa in preparing its Consolida-ted Financial Statements:
3.3.1 BUSINESS COMBINATIONS AND GOODWILLOperations whereby the joining of two or more entities or eco-nomic units into one single entity or group of entities occurs are considered business combinations.
Business combinations are accounted for using the ac-quisition method. Identifiable assets acquired, liabilities, and contingent liabilities assumed from the acquisition are recognized at fair value at the date of acquisition; acquisi-tion expenses are recognized in profit and loss and goodwill as an asset in the Statement of Financial Position of the Consolidated.
The consideration transferred in the acquisition, is measu-red as the fair value of assets transferred, liabilities incurred or assumed, and equity instruments, issued by Grupo Nutresa, including any contingent consideration, to obtain control of the acquired.
Goodwill is measured as the excess of the sum of the con-sideration transferred, the value of any non-controlling in-terest, and when applicable, the fair value of any previously held equity interest, over the net value of the assets acquired, liabilities, and contingent liabilities assumed at the date of ac-quisition. The resulting gain or loss from the measurement of previously held interest can be recognized in current earnings or “Other comprehensive income”, accordingly. In previous periods for which it is reported, the acquirer may have recog-nized in “Other comprehensive income”, changes in the value of its equity interest in the acquired. If so, the amount, that was recognized, in ““Other comprehensive income””, shall be recognized, on the same basis as it would be required, if the acquirer had disposed directly of the previously held equity interest. When the consideration transferred is less than the fair value of the net assets acquired, the corresponding gain is recognized in profit and loss, on the date of acquisition.
For each business combination, at the date of acquisition, Grupo Nutresa chooses to measure non-controlling interest at the proportionate share of the identifiable assets acquired, liabilities, and contingent liabilities assumed from the acquisi-tion, or at fair value.
Any contingent consideration in a business combination is classified as liability or equity, and is recognized at fair value at the date of acquisition. Subsequent changes in fair value of a contingent consideration, classified as financial liability, are recognized in profit and losses, in that period
Consolidated financial statements 2016

22
or in “Other comprehensive income”. When it is classified as equity, it is not re-measured and its subsequent settlement is recognized in equity. If the consideration is not classi-fied as a financial liability, it is measured in accordance with applicable IFRS.
Goodwill acquired in a business combination is allocated, at the date of acquisition, to cash-generating units of Grupo Nutresa, that are expected to be benefitted by the combina-tion, irrespective of whether other assets or liabilities of the acquired are assigned to these units.
When goodwill is part of a cash-generating unit, and part of the operation within that unit is sold, the goodwill associa-ted with the operation disposed is included in the book value of the operation, when the gain or loss of the disposal of the operation is determined. Goodwill written off is determined based upon the percentage of the operation sold, which is the difference between the book value of the operation sold and the book value of the cash-generating unit.
3.3.2 TRANSLATION OF BALANCES AND TRANSACTIONS IN FOREIGN CURRENCIESTransactions made in a currency other than the functional cu-rrency of the Company are translated using the exchange rate at the date of the transaction. Subsequently, monetary assets and liabilities denominated in foreign currencies are translated using the exchange rates at the closing of the Financial State-ments and taken from the information published by the official entity responsible for certifying this information; non-mone-tary items that are measured at fair value are translated using the exchange rates on the date when its fair value is determi-ned and non-monetary items that are measured at historical cost, are translated using the official exchange rates, from the date of the original transaction.
All exchange differences arising from operating assets and liabilities are recognized on the Income Statement, as part of operating income or expenses; exchange differences in other assets and liabilities are recognized as income or expense, ex-cept for, monetary items that provide an effective hedge for a net investment in a foreign operation and from investments in shares classified as fair value through equity. These items and their tax impact are recognized in “Other comprehensive income” until disposal of the net investment, at which time are recognized in profit and loss.
Foreign subsidiariesFor the presentation of Grupo Nutresa’s Consolidated Finan-cial Statements, the financial situation, and results of entities whose functional currency is different from the presentation currency of the Company, and whose economy is not classi-fied as hyperinflationary, are translated, is as follows:
• Assets and liabilities, including goodwill, and any adjustment to the fair value of assets and liabilities, arising from the
acquisition are translated at end of period exchange rates.• Income and expenses are translated at the monthly ave-
rage exchange rate.Exchange differences, arising from translation of foreign ope-rations, are recognized in “other comprehensive income” on a separate account ledger named “Exchange differences on translation of foreign operations”, as well as, exchange diffe-rences, in long-term receivable or payable accounts, which are part of, the net investment abroad. In the disposal of fo-reign operations, the amount of “other comprehensive inco-me” that relates to the foreign operation is recognized in the period results.
Re-stated Financial Statements in hyperinflationary economies The Financial Statements of subsidiaries, whose functional cu-rrency is corresponding to that of a hyperinflationary economy, including comparative information, is restated in terms of the current measured unit, at the date of closing of the reporting period, before being translated into pesos for consolidation. Gains or losses, on the net monetary position, are included in profit or loss.
3.3.3 CASH AND CASH EQUIVALENTSCash and cash equivalents, in the Statement of Financial Po-sition and Statement of Cash Flows, include cash on hand and banks, highly liquid investments easily convertible to a deter-mined amount of cash and subject to an insignificant risk of changes in its value, with a maturity of three months or less from the date of purchase. These items are initially recogni-zed at historical cost and restated to recognize its fair value at the date of each annual accounting period.
3.3.4 FINANCIAL INSTRUMENTSA financial instrument is any contract that gives rise to a fi-nancial asset of one entity and, simultaneously, to a financial liability or equity instrument of another entity. Financial assets and liabilities are initially recognized at fair value plus (less) the transaction costs directly attributable, except for those who are subsequently measured at fair value.
At initial recognition, Grupo Nutresa classifies its finan-cial assets for subsequent measurement at amortized cost or fair value, depending on Grupo Nutresa’s business model for the administration of financial assets and the characte-ristics of the contractual cash flows of the instrument; or as derivatives designated as hedging instruments in an effec-tive hedge, accordingly.
(i) Financial assets measured at amortized costA financial asset is subsequently measured at amortized cost, using the effective interest rate, if the asset is held within a business model whose objective is to keep the contractual cash

23
flows, and the contractual terms, on specific dates, cash flows that are solely for payments of principal and interest on the value of outstanding capital. Notwithstanding the foregoing, Grupo Nutresa designates a financial asset as irrevocably me-asured at fair value through profit and loss.
Grupo Nutresa has determined that the business model for accounts receivable is to receive the contractual cash flows, which is why they are included in this category.
(ii) Financial assets measured at fair valueThe financial assets, different from those measured at amor-tized cost are subsequently measured at fair value, with changes recognized in profit and loss. However, for invest-ments in equity instruments that are not held for trading pur-poses, Grupo Nutresa irrevocably chooses to present gains or losses on the fair value measurement in “Other compre-hensive income”. Upon disposal of investments at fair value, through “Other comprehensive income”, the accumulated value of the OCI is transferred directly to retained earnings and are not reclassified to profit and loss, in that period. Cash dividends received from these investments are recog-nized in the Comprehensive Income Statement, in the profit and loss of that period.
The fair values of quoted investments are based on the valid quoted prices.
Financial assets measured at fair value are not tested for impairment.
(iii) Impairment of financial assets at amortized costFinancial assets measured at amortized cost are assessed for indicators of impairment at each balance sheet date. Finan-cial assets are impaired, when there exists, objective evidence, that, as a result of one or more events occurring after the initial recognition of the financial asset, the estimated future flows of the financial asset, (or group of financial assets) have been impacted.
The criteria used to determine if there is objective evi-dence of impairment losses, includes:
• significant financial difficulty of the issuer or counterparty • non-payment of principal and interest• probability that the lender will declare bankruptcy or fi-
nancial reorganizationThe amount of the impairment is the difference between the book value of the asset, and the present value of estimated future cash flows, discounted at the original effective rate of the financial asset. The book value of the asset is reduced and the amount of the loss is recognized in profit and loss, for the period.
(iv) DerecognitionA financial asset, or a part of it, is derecognized from the Statement of Financial Position when it is sold, transferred,
expires, or Grupo Nutresa loses control over the contractual rights or the cash flows of the instrument. A financial liabili-ty, or a portion of it, is derecognized from the Statement of Financial Position, when the contractual obligation has been settled, or has expired. When an existing financial liability is replaced by another, from the same counterparty on subs-tantially different terms, or the terms of an existing liability are substantially modified, such an exchange or modifica-tion, it is treated as a derecognition of the original liability and the recognition of a new liability, and the difference in the respective book value is recognized in the Comprehensi-ve Income Statement, in profit and loss.
(v) Financial liabilitiesFinancial liabilities are subsequently measured at amortized cost, using the effective interest rate. Financial liabilities in-clude balances with suppliers and accounts payable, finan-cial obligations, and other derivative financial liabilities. This category also includes those derivative financial instruments taken by the Group that are not designated as hedging ins-truments, in effective hedging risks.
Financial obligations are classified as such, for obligations that are obtained by resources, be it from credit institutions or other financial institutions, in the country or abroad.
(vi) Off-setting financial instruments
Financial assets and financial liabilities are offset so that the net value is reported on the Statement of Financial Position of the Consolidated, only if (i) there is, at present, a legally enfor-ceable right to offset the amounts recognized, and (ii) there is an intention to settle on a net basis, or to realize the assets and settle the liabilities, simultaneously.
(vii) Derivative instruments and hedge accountsA financial derivative is a financial instrument, whose value changes in response to changes in an observable market va-riable (such as an interest rate, foreign exchange, the price of a financial instrument, or a market index, including credit ratings) and whose initial investment is very small compared to other financial instruments with similar changes in response to market conditions, and are generally settled at a future date.
In the normal course of business, companies engage in transactions with derivative financial instruments with the sole purpose of reducing its exposure to fluctuations in exchange rates and interest rates on foreign currency obligations. These instruments include, among others, swaps, forwards, options, and futures over commodities traded for own-use.
Derivatives are classified under the category of financial assets or liabilities, according to, the nature of the derivative, and are measured at fair value on the Income Statement, ex-cept those that are designated as hedging instruments.
Consolidated financial statements 2016

24
Commodities contracts, with the purpose of receipt or de-livery a non-financial item, in accordance with the purchase, sale, or usage requirements expected by the entity, are consi-dered “derivatives for own-use” and the impact is recognized as part of cost of the inventory.
Hedges which meet the strict criteria required for hedge accounting are accounted for as follows:
Fair value hedges: The Group uses these hedges to miti-gate the risks of exchange rates and interest rates on recog-nized assets and liabilities. Changes in the fair value of the hedging instruments are recognized in the Income Statement, as a financial expense, and the hedged item is adjusted for the hedged risk and any gain or loss is recognized in the Income Statement as a financial expense.
3.3.5 INVENTORIES Assets held for sale in the ordinary course of business, or in the process of production for such sale, or in the form of materials or supplies to be consumed in the production process, or ser-vices provided, are classified as inventory.
Inventories are valued at the lower of, acquisition or ma-nufacturing cost, or the net realizable value. Cost is determi-ned using the average cost method. Net realizable value is the estimated selling price of inventory in the ordinary course of operations, less the applicable variable sales expenses. If the comparative analysis shows that the net realizable value is be-low the book value, the value impairment is recognized, as an adjustment in the Income Statement, decreasing the value of the inventory. When the circumstances warrant, the previously recognized impairment is reversed.
Inventories are valued using the weighted average method and the cost includes the costs directly related to the acqui-sition and those incurred to give them their current condition and location. The cost of finished goods and work in progress is comprised of: raw materials, direct labor, other direct costs, and indirect manufacturing expenses.
Trade discounts, rebates, and other similar items are de-ducted from the acquisition cost of inventory.
In the case of commodities, the cost of the inventory includes any gain or loss on the hedging of raw material procurement.
3.3.6 BIOLOGICAL ASSETSBiological assets held by Grupo Nutresa are measured from initial recognition at the fair value less expenses to realize the sale; the changes are recognized in the Income Statement, for the period. Agricultural products coming from biological as-sets are measured at fair value less costs to sell at the time of collection or harvest, when they are transferred to inventory.
When fair value cannot be reliably measured, they are measured at cost and the existence of impairment indicators permanently assessed.
3.3.7 PROPERTY, PLANT AND EQUIPMENTProperty, plant and equipment includes the value of land, buil-dings, furniture, vehicles, machinery and equipment, compu-ter hardware, and other facilities owned by the consolidated entities, which are used in the operation of the entity.
Fixed assets are measured at cost, net of accumulated depreciation, and accumulated impairment losses, if any. The cost includes: the acquisition price, costs directly related to the location of assets in place and the necessary conditions to operate in the manner intended by Grupo Nutresa, borrowing costs for construction projects that take a period of a year or more to be completed if the conditions for approval are met, and the present value of the expected cost for the decommis-sioning of the asset after its use, if the recognition criteria for a provision are met.
Trade discounts, rebates, and other similar items are de-ducted from the acquisition cost of the asset.
For significant components of property, plant and equip-ment that must be replaced periodically, the Group derecog-nizes the replaced component and recognizes the new compo-nent as an asset with a corresponding specific useful life, and depreciates it, accordingly. Likewise, when major maintenan-ce is performed, its cost is recognized as a replacement of the book value of the asset to the extent that the requirements for recognition are met. All other routine repair and maintenance expenses are recognized in results, as they are incurred.
Substantial improvements on properties of third parties are recognized as part of Grupo Nutresa’s fixed assets and depreciated for the shortest period between the useful life of the improvements made or the lease term.
Depreciation begins when the asset is available for use and is calculated on a straight-line basis over the estimated asset life as follows:
Buildings 20 to 60 years
Machinery (*) 10 to 40 years
Minor equipment - operating 2 to 10 years
Transport equipment 3 to 10 years
Communication and computer equipment 3 to 10 years
Furniture, fixtures, and office equipment 5 to 10 years
Table 5
(*) Some of the machinery related to production is depreciated using the hours produced method, according to the most appropriate manner, in which the consumption of the economic benefits of the asset is reflected
The residual values, useful lives, and depreciation methods of assets are reviewed at each year-end, and are adjusted prospectively, if required. The factors that can influence the adjustment are: changes in the use of the asset, unexpected

25
significant wear, technological advances, changes in market prices, et al.
A component of property, plant and equipment or any substantial part of it initially recognized is derecognized upon sale or when no future economic benefit from its use or its sale is expected. Any gain or loss at the time of derecognizing the asset, (calculated as the difference between the net income from the sale and the book value of the asset), is included in the Income Statement when the asset is written-off.
At each accounting close, Grupo Nutresa evaluates its assets, to identify indicators, both external and internal, of reductions in its recoverable values. If there is evidence of im-pairment, property, plant and equipment are tested, to assess whether their book values are fully recoverable. In accordance with IAS 36 “Impairment of Assets”, losses due to a reduction in the recoverable value are recognized for the amount at which the book value of the asset (or group of assets) exceeds its re-coverable value (the greater between its fair value minus the disposal costs and their value in use), and is recognized in the Income Statement, as impairment of other assets.
When the book value exceeds the recoverable value, the book value is adjusted to its recoverable value, modifying the future depreciation, in accordance with its new remaining useful life.
3.3.8 INVESTMENT PROPERTIESThe land and buildings, owned by Grupo Nutresa, are recogni-zed as investment properties, in order to, obtain an income or goodwill, rather being maintained for use or sale, in the ordi-nary course of operations.
Investment properties are initially measured at cost. The acquisition cost of an investment property includes its purcha-se price and any directly attributable expenditure. The cost of self-constructed investment property is its cost at the date when the construction or development is complete.
Subsequent to initial recognition, investment properties are measured at net cost of accumulated depreciation and loss accumulated impairment losses, if any.
Depreciation is calculated linearly over the asset’s useful lives, estimated between 20 and 60 years. Residual values and useful lives are reviewed and adjusted prospectively, at yearend, or when required.
Investment properties are written off, either at the time of disposal, or when it is removed permanently from use and no future economic benefit is expected. The difference between the net disposal and the book value of the assets is recognized in income for the period, in which it was derecognized.
Transfers to or from investment properties are made only when there is a change in use. In the case of a transfer from investment property, to property, plant and equipment, the cost, taken into account in subsequent accounting, is the book value at the date of change of use.
3.3.9 INTANGIBLE ASSETSAn intangible asset is an identifiable asset, non-monetary, and without physical substance. Intangible assets acquired sepa-rately are initially measured at cost. The cost of intangible assets acquired in business combinations is its fair value at the date of acquisition. After initial recognition, intangible assets are carried at cost less any accumulated amortization and any accumulated impairment losses in value.
The useful lives of intangible assets are determined as finite or indefinite. Intangible assets with finite useful li-ves are amortized over their useful life, linearly, and are assessed to determine whether they had any impairment whenever there are indications that the intangible asset might have suffered such impairment. The amortization period and the amortization method, for an intangible as-set with a finite useful life, are reviewed at least at the clo-se of each period. Changes in the expected useful life or the expected pattern of consumption of the future econo-mic benefits of the asset, are accounted for at the change of the amortization period or method, as appropriate, and are treated as changes in accounting estimates. Amorti-zation expenses of intangible assets with finite useful lives are recognized in the Comprehensive Income Statement. The useful life of an intangible asset with a finite life is be-tween 3 and 100 years.
Intangible assets with indefinite useful lives are not amor-tized, but are tested annually to determine if they have su-ffered impairment either individually or at the level of the cash-generating unit. The assessment of indefinite life is reviewed annually to determine whether the assessment re-mains valid. If not, the change in useful life from indefinite to finite is made prospectively.
Gains or losses, that arise when an intangible asset is wri-tten-off, are measured as the difference between the value obtained in the disposal, and the book value of the asset are recognized in the Comprehensive Income Statement, in profit and loss.
Research and development costsResearch costs are expensed as they are incurred. The ex-penditures directly related to the development in an individual project are recognized as intangible assets when the Grupo Nutresa can demonstrate:
• The technical feasibility of completing the intangible asset so that it is available for use or sale;
• Its intention to complete the asset and its capacity to use or sell the asset;
• How the asset will generate future economic benefits;• The availability of resources to complete the asset; and• The ability to reliably measure the expenditure during
development.
Consolidated financial statements 2016

26
In the Statement of Financial Position, assets arising from de-velopment expenditures are stated at cost less accumulated amortization and accumulated impairment losses.
Amortization of the asset begins when development is complete and the asset is available for use. It is amortized over the period of expected future economic benefit. During the development period, the asset is subject to annual impair-ment tests to determine if loss of value exists.
Research costs and development costs not eligible for ca-pitalization, are accounted as expenses in profit and loss.
3.3.10 IMPAIRMENT OF NON-FINANCIAL ASSETS, CASH GENERATING UNITS AND GOODWILL Grupo Nutresa assesses if there is any indication that an as-set, or cash generating unit, may be impaired in value, and estimates the recoverable amount of the asset or cash-ge-nerating unit, at the moment that an indication of impair-ment is detected, or annually (at December 31st), for good-will, intangible assets with indefinite useful lives, and those not yet in use.
Grupo Nutresa uses its judgment in the determination of the Cash Generating Units (CGU), for the purposes of impair-ment testing, and defined as CGUs, those legally constituted entities, dedicated to production, assigning each one of those net assets of the legally constituted entities, dedicated to the provision of services to the producing units (in a transversal or individual way). The assessment of the impairment is realized, at the level of the CGU, or Group of CGUs, that contains the asset to be assessed.
The recoverable value of an asset is the greater of the fair value less costs to sell, either an asset or a cash-generating unit, and its value in use, and is determined for an individual asset, unless the asset does not generate cash flows that are substantially independent of other assets or groups of assets; in this case the asset must be grouped to a cash-generating unit. When the book value of an asset or cash-generating unit exceeds its recoverable amount, the asset is considered impai-red and is reduced to its recoverable amount.
In calculating the value in use, the estimated future cash flows, whether of an asset or a cash-generating unit, are dis-counted to their present value using a discount rate, which re-flects market considerations of the value of money over time, as well as, the specific risks of the asset. An appropriate valuation model is used to determine the fair value minus the cost to sell.
The impairment losses of continuing operations are recog-nized in the Comprehensive Income Statement, in profit and loss, in those expense categories that correspond to the func-tion of the impaired asset. Impairment losses attributable to a cash-generating unit are initially allocated to goodwill and, once exhausted, the impairment losses are proportionally at-tributed to other non-current assets of the cash-generating unit, based upon the book value of each asset.
The impairment for goodwill is determined by assessing the recoverable amount of each CGU (or group of cash-ge-nerating units) related to the goodwill. The impairment losses related to goodwill cannot be reversed in future periods.
For assets in general, excluding goodwill, at each reporting date (at the close of each period), an assessment of whether there is any indication that impairment losses previously re-cognized value no longer exists or have decreased, is perfor-med. If any such indication exists, Grupo Nutresa estimates the recoverable amount of the asset or cash-generating unit. An impairment loss, previously recognized, is reversed only if there was a change in the assumptions used to determine the recoverable value of an asset, since the last time that the last impairment loss was recognized. The reversal is limited so that the book value of the asset does not exceed its recoverable amount, nor does it exceed the book value that would have been determined, net of depreciation, if it had not recognized impairment loss for the asset in previous years. Such a rever-sal is recognized in the Comprehensive Income Statement in profit and loss.
3.3.11 TAXESThis heading includes the value of mandatory general-nature taxation in favor of the State, by way of private closeouts, that are based on the taxes of the fiscal year and responsibility of each company, according to the tax norms of national and territorial governing entities, in each of the countries where Grupo Nutresa´s companies operate.
a) Income tax(i) CurrentAssets and liabilities for income tax for the period are mea-sured by the values expected to be recovered or paid to the taxation authorities. The expense for income tax is recognized under current tax, in accordance with the tax clearance, be-tween taxable income and accounting profit and loss, and is affected by the rate of income tax in the current year in ac-cordance with the provisions of the tax rules of each country. Taxes and tax norms or laws used to compute these values are those that are approved at the end of the reporting period in the countries where Grupo Nutresa operates and generates taxable income.
(ii) DeferredDeferred income tax is recognized using the liability method, and is calculated on temporary differences between the taxa-ble bases of assets and liabilities in and book value. Deferred tax liabilities are generally recognized for all temporary tax differences imposed, and all of the deferred tax assets are recognized for: all temporary deductible differences, future compensation of tax credits, and unused tax losses, to the ex-tent that it is likely there will be availability of future tax profit,

27
against which, they can be attributed. Deferred taxes are not subject to financial discount.
Deferred asset and liability taxes are not recognized, if a temporary difference arises from the initial recognition of an asset or liability, in a transaction that is not a business combi-nation, and at the time of the transaction, it impacted neither the accounting profit nor taxable profit and loss; and in the case of deferred tax liability, arising from the initial recognition of goodwill.
Deferred tax assets, that relate to investments in associa-tes and joint ventures, and deferred tax liabilities, related to goodwill, are recognized only to the extent that it is probable that the temporary differences will be reversed in the near fu-ture, and it is likely there will be availability of future tax profit, against which these deductible differences will be charged.
The book value of deferred tax assets is reviewed at each reporting date, and is reduced to the extent that it is no lon-ger probable that sufficient taxable profit will be available for use, in part or in totality, or a part of the asset, from said tax. Unrecognized deferred tax assets are reassessed at each reporting date, and are recognized to the extent that it is probable that future taxable profit income are likely to allow for their recovery.
Deferred assets and liabilities taxes are measured at the tax rates, that are expected to be applicable, in the period when the asset is realized, or the liability is settled, based on tax rates and tax , that were approved at the date of filing, or whose approval will be nearing completion by that date.
Deferred assets and liabilities taxes are offset, if there is a legally enforceable right to do so, and are with the same taxation authority.
Deferred tax is recognized in profit and loss, except when relating to items not recognized in profit and loss, in which case will be presented in “other comprehensive income” or di-rectly in equity.
The current assets and liabilities, for income tax, are also offset, if related to the same taxation authority, and are inten-ded to be settled at net value, or the asset realized and liability settled, simultaneously.
b) Income tax for equity - CREEThe income tax for equity – CREE, applicable to Colombian Companies, is the tax with which taxpayers, legal entities, and assimilated filers of income taxes, contribute to employee be-nefits, creation of employment, and social investment.
The income tax for equity – CREE applies a fee of 9% un-der the Law 1739 December 2014.
During the years 2015 and 2016, the Law 1739 of Decem-ber 23, 2014, establishes a surcharge on income tax for equity - CREE, which is at the responsibility of the taxpayer, of this tax, and is applied to a taxable base, in excess of $800 COP, at rates of 5%, and 6%, per year, respectively.
With the issuance of Law 1819 of December 29, 2016, the income tax for equity – CREE, and the temporary surtax for 2017 and 2018 is waived; and the new income tax rates are determined.
c) Tax on wealthThe tax burden of the “wealth tax” is originated, for Colombian Companies, from possession of the same to the January 1st of the years 2015, 2016, and 2017, by taxpayers. Therefore, those taxpayers with gross assets minus debts, whose value exceeds $1.000, should determine their tax under the conditions esta-blished in the tax regulations.
According to the provisions of Article 6 of Law 1739 of 2014, and additionally, Article 297-2 of the tax statute, the ac-crual of wealth tax will take place on January 1st of the years 2015, 2016, and 2017, and may be allocated to capital reser-ves without affecting net income, in accordance with Article 10 of the same law.
3.3.12 EMPLOYEE BENEFITSa) Short-term benefitsThey are, (other than termination benefits), benefits expec-ted to be settled in its totality, before the end of the following twelve months, at the end of the annual period, of which the services provided by employees, is reported. Short-term be-nefits are recognized to the extent that the employee renders the service, to the expected value to be paid.
b) Other long-term benefitsLong-term employee benefits, (that differ from post-emplo-yment benefits and termination benefits) that do not expire within twelve (12) months after the end of the annual period in which the employee renders services, are remunerated, such as long-term benefits, the variable compensation system, and retroactive severance interest. The cost of long-term benefits is distributed over the time measured between the employee starting date, and the expected date of when the benefit is re-ceived. These benefits are projected to the payment date, and are discounted with the projected unit credit method.
c) Pensions and other post-employment benefits (i) Defined contribution plansContributions to defined contribution plans are recognized as expenses in the Comprehensive Income Statement, in profit and loss, on an accrual basis.
(ii) Defined benefit plansDefined benefit plans are plans for post-employment benefits in which Grupo Nutresa has a legal or implicit obligation, of the payment of benefits. Subsidiary companies domiciled in Colombia, Ecuador, Mexico, and Peru, have actuarial liability as required by law.
Consolidated financial statements 2016

28
The cost of this benefit is determined by the projected unit credit method. The liability is measured annually, by the pre-sent value of expected future payments required to settle the obligations arising from services rendered by employees in the current period and prior periods.
Updates of the liability for actuarial gains and losses are recognized in the Statement of Financial Position, against re-tained earnings through “Other comprehensive income”. The-se items will not be reclassified to profit and loss, in subsequent periods; the cost of past and present services, and net inte-rest on the liability, is recognized in profit and loss, distributed among cost of sales and administrative expenses, sales and distribution, likewise as are gains and losses by reductions in benefits and non-routine settlements.
Interest on the liability is calculated by applying the dis-count rate on said liability.
Payments made to retirees are deducted from the amounts provisioned for this benefit.
d) Termination benefitsTermination benefits are provided for the period of emplo-yment termination, as a result of the Company’s decision to terminate a contract of employment, before the normal re-tirement date; or the employee’s decision to accept an offer of benefits in exchange for termination of an employment contract. Termination benefits are measured in accordance with the provisions of the laws and the agreements between Grupo Nutresa and the employee, at the time the decision to terminate the employment relationship with the employee, is officially released.
3.3.13 LEASESWhen determining the classification of an agreement, or conclusion of a contract as a lease, it is based on the essen-ce of the nature of the same, at the date of its conclusion, assessing whether compliance with the agreement rests on the use of a specific asset or if the right to use the asset is conferred on the group, even if this right is not explicit in the agreement.
Leases are classified as financial or operating leases. They will be classified as finance leases, provided that the terms of the lease substantially transfer the risks and rewards, inhe-rent in the ownership of the asset, and the asset is recorded at its fair value, at the inception of the lease or, if less, at the present value of the minimum lease payments; The present obligation of minimum payments and the purchase option will be recognized in the Statement of Financial Position, as a financial lease obligation. The lease payments are distribu-ted between the financial expense and the reduction of the obligation, and the expense will be recognized immediately in the results unless they are attributable to the assets, ac-cording to the costs per loan.
Operating leases will be classified as such, those in which the risks and benefits inherent in the ownership of the asset, are not transferred by the lessor, and their payments will be recognized as a linear expense over the lease term.
3.3.14 PROVISIONS, CONTINGENT LIABILITIES AND ASSETSa) ProvisionsProvisions are recognized when, as a result of, a past event, Grupo Nutresa has a present legal or constructive obligation to a settlement, and requires an outflow of resources, are con-sidered probable, and can be estimated with certainty.
In cases where Grupo Nutresa expects the provision to be reimbursed in whole, or in part, the reimbursement is recogni-zed as a separate asset, only in cases where such reimburse-ment is virtually certain.
Provisions are measured at best estimate of the disburse-ment of the expenditure required to settle the present obligation. The expense relating to any provision is presented in the Compre-hensive Income Statement, net of all reimbursement. The increa-se in the provision, due to the passage of time, is recognized as financial expense.
b) Contingent liabilitiesPossible obligations arising from past events, and whose exis-tence will be confirmed only by the occurrence or non-oc-currence of one or more uncertain future events, not wholly within the control of Grupo Nutresa, or present obligations arising from past events, that are not likely, but there exists a possibility that an outflow of resources including economic benefits is required to settle the obligation, or the amount of the obligation cannot be measured with sufficient reliability, are not recognized in the Statement of Financial Position and are instead revealed as contingent liabilities.
c) Contingent assetsPossible assets, arising out of past events and whose existen-ce will be confirmed only by the occurrence, or possibly by the non-occurrence of one or more uncertain future events which are not entirely under the control Grupo Nutresa, are not recognized in the Statement of Financial Position, and are however, disclosed as contingent assets when it is a probable occurrence. When the contingent event is certain, then the asset is recognized and the associated income is recognized in profit and loss, for that period.
3.3.15 REVENUERevenue is recognized to the extent that it is probable that the economic benefits will flow to the entity and the revenue can be measured reliably.
The specific recognition criteria, listed below, must also be met for revenue to be recognized:

29
a) Sale of goodsRevenue, from the sale of goods, is recognized when the signi-ficant risks and rewards of ownership have been substantially transferred to the buyer.
b) ServicesRevenue from providing services is recognized when these ser-vices are rendered, or according to the degree of completion (or percentage of completion) of contracts.
c) Interest For all financial instruments measured at amortized cost, in-terest income or expense, is recognized with the effective in-terest rate method. The effective interest rate is the rate that exactly discounts estimated future cash payments or those re-ceived through the expected life of the financial instrument, or in a shorter period, in the net book value of the financial asset or financial liability.
d) Dividend incomeThis income is recognized when Grupo Nutresa’s right to re-ceive payment is established, which is generally when the Shareholders approve the dividend, except when the dividend represents a recovery of investment costs. Dividend income is not recognized, when payment is made to all Shareholders, in the same proportion of stocks from the issuer.
3.3.16 PRODUCTION EXPENSESIndirect production costs that do not contribute to move in-ventories to their present location and condition, and that are not necessary for the production process, are recorded as pro-duction expenses.
3.3.17 GOVERNMENT GRANTSGovernment grants are recognized when there is reasonable assurance that they will be received and all conditions linked to them will be safely met. When the grant relates to an expense item, it is recognized as income on a systematic basis over the periods in which related costs that are intended for compen-sation are recognized as expense. When the grant relates to an asset, it is recorded as deferred income and is recognized as profit or loss on a systematic basis over the estimated useful life of the asset.
3.3.18 FAIR VALUEFair value is the price that would be received in selling an asset or paid to transfer a liability in an orderly transaction between independent market participants, at the measure-ment date. The fair value of all financial assets and liabilities is determined at the date of presentation of the Financial Statements, for recognition or disclosure in the Notes to the Financial Statements.
Grupo Nutresa uses valuation techniques which are appro-priate under circumstances for which sufficient information is available to measure the fair value, maximizing the use of re-levant observable inputs and minimizing the use of unobser-vable inputs.
Fair value is determined:• Based on quoted prices in active markets for identical
assets or liabilities that the Company can access at the measurement date (Level 1).
• Based on valuation techniques commonly used by market participants using variables other than the quoted prices that are observable for the asset or liability, either directly or indirectly (Level 2).
• Based on internal discount cash flow techniques or other valuation models, using estimated variables by Grupo Nu-tresa for the unobservable asset or liability, in the absence of variables observed in the market (Level 3).
Judgments include data such as liquidity risk, credit risk, and volatility. Changes in assumptions about these factors could impact the reported fair value of financial instruments.
3.3.19 OPERATING SEGMENTS An operating segment is a component of Grupo Nutresa that: engages in business activities from which it may earn income from ordinary activities and incur costs and expenses, from which it has financial information and whose operating results are regularly reviewed by the maximum authority in making operating decisions for Grupo Nutresa, The Board of Grupo Nutresa, to decide about the allocation of resources to seg-ments, as well as, assess performance.
The financial information of the operating segments is pre-pared under the same accounting policies used in the prepara-tion of the Consolidated Financial Statements of Grupo Nutresa.
For those operational segments that overreach the quan-titative threshold of 10% of income, EBITDA, and operational income, as well as, the informational segments that are con-sidered relevant for decision making by the Board of Direc-tors; financial information is presented separately; the other segments are grouped in categories called “Other segments”.
3.3.20 EARNINGS PER SHAREBasic earnings per share are calculated by dividing profit or loss, for the period that is attributable to holders of ordinary shares, by the weighted average number of ordinary shares, outstanding.
The average number of shares outstanding, for the pe-riods ended December 31, 2016 and 2015, is 460.123.458.
To calculate diluted earnings per share, profit for the pe-riod, attributable to holders of ordinary shares, and the weigh-ted average number of shares outstanding, for all the inherent dilutive potential ordinary shares, is adjusted.
Consolidated financial statements 2016

30
3.3.21 RELATIVE IMPORTANCE OR MATERIALITYInformation is material or has relative importance, if it can, individually, or collectively, influence the economic decisions taken by users, based on the Financial Statements. Mate-riality depends on the size and nature of error or inaccuracy and prosecuted depending on the particular circumstances in which they are produced. The size or nature of the item, or a combination of both, could be the determining factor.
3.4 NEW ACCOUNTING PRONOUNCEMENTS ON IN-TERNATIONAL REPORTING STANDARDS3.4.1 NORMATIVE CHANGESNew standards, modifications and interpretations incorpo-rated into the accounting framework accepted in Colombia, whose application must be assessed beyond January 1, 2017, or that can be applied in advance
The Decrees 2496 of December 24, 2015 and 2131 of Decem-ber 22, 2016, introduced to the technical framework norms of financial information, new standards, modifications, or amendments or impacts by the IASB to the International Fi-nancial Reporting Standards between the year (s) 2015 and 2016, to evaluate its application in financial years beginning later than January 1, 2017, although its application could be made in advance.
IFRS 9 “Financial Instruments”Financial instruments, addresses the classification, valuation and recognition of financial assets and financial liabilities. The full version of this IFRS was published in July 2016. It repla-ces the guidance in IAS 39, on the classification and valua-tion of financial instruments. IFRS 9 maintains, but simplifies, the miscellaneous valuation model and establishes three main valuation categories for financial assets: amortized cost, fair value with changes in other comprehensive income, and fair value with changes in profit or loss. The basis of classification depends on the business model of the entity and the charac-teristics of the contractual cash flows of the financial asset. In-vestments in equity instruments are required to be measured at fair value, through profit or loss, with the irrevocable option at the commencement of changes in fair value in other com-prehensive non-recyclable income. There is now a new model of expected credit losses, that replaces the model of impair-ment losses incurred in IAS 39. For financial liabilities, there were no changes in the classification and valuation, except for the recognition of changes in the risk of own credit, in other comprehensive income, for liabilities designated at fair value through profit or loss. IFRS 9 reflects the requirements for the effectiveness of coverage. Under IAS 39, a hedge must be highly effective, both prospectively and retrospectively. IFRS
9 replaces this line by requiring an economic relationship between the hedged item and the hedging instrument, and that the hedged ratio is the same that the entity actually uses for its risk management. Contemporary documenta-tion is still required but is different from the one that was being prepared under IAS 39. The standard is effective for accounting periods beginning on or after January 1, 2018. Early adoption is permitted.
IFRS 15 “Income from client contracts”Issued in May 2016, it is a new standard that is applicable to all contracts with customers, except leases, financial instruments, and insurance contracts. This new standard aims to improve the inconsistencies and weaknesses of IAS 18 and provide a model that will facilitate the comparability of companies from different industries and regions. It provides a new model for revenue recognition and more detailed requirements for mul-ti-item contracts. In addition, it requires more detailed disclo-sures. Its application is effective as of January 1, 2018, and early application is allowed. The Company is evaluating the impacts that this standard may generate.
IAS 16 “Property, plant and equipment”, IAS 38 - “Intangibles assets”IAS 16 and IAS 38 establish the principle of the depreciation and amortization basis, being the expected pattern of the consumption of the future economic benefits of an asset. In its amendments to IAS 16 and IAS 38, published in May 2015, the IASB clarified that the use of income-based methods to calculate the depreciation of an asset is not adequate, because the income generated by an activity that includes the use of an asset, generally reflect factors other than the consumption of the economic benefits incorporated into the asset. The IASB also clarified that income generally presents an inadequate basis for measuring the consumption of the economic benefits embodied in an intangible asset. However, this assumption may be rebutted in certain limited circum-stances. The amendments are applicable, as of January 1, 2016. Early application is permitted.
IAS 16 “Property, plant and equipment”, IAS 41 - “Agriculture”The IASB made modifications to IAS 16 Property, Plant and Equipment, and IAS 41 Agriculture, in order to, distinguish pro-ducing plants from other biological assets. Production plants are only used to grow products during their productive life, and are observed to be similar to one element of the machi-nery, for which they are now dealt with in IAS 16. However, the agricultural products that grow in the production plants will remain within the scope of IAS 41, and will continue to be me-asured at fair value less minus the cost to sell.

31
IAS 7 “Cash-Flows Statement”The amendment requires the disclosure of: changes in finan-cing cash flows, changes arising from the acquisition, or loss of control, changes in exchange rates, changes in fair values, and other changes.
IAS 12 “Income tax”When an entity evaluates whether taxable benefits will be available against which a temporary deductible difference can be used, it is considered whether the tax law restricts the sources of the taxable profits, against which it can make de-ductions. If tax legislation imposes no restrictions, an entity evaluates a temporary deductible difference in combination with all of its other deductible temporary differences.
Annual Improvements to IFRS, 2012-2015 Cycle• IFRS 5 Non-current Assets Held for Sale and Discontinued
Operations: changes in method of disposal method.• IFRS 7 Financial Instruments: Disclosure Information:
applicability of the amendments to IFRS 7, to the Conden-sed Interim Financial Statements.
• IAS 19 Employee Benefits: Discount Rate: issued in a re-gional market
3.4.2 NEW STANDARDS, AMENDMENTS, AND INTERPRETATIONS ISSUED BY THE INTERNATIONAL ACCOUNTING STANDARDS BOARD (IASB - ITS ACRONYM IN ENGLISH) THAT HAVE NOT BEEN INCORPORATED INTO THE ACCOUNTING FRAMEWORK ACCEPTED IN COLOMBIADuring the year 2016, and until the date of issuance of the-se Financial Statements, a new standard has been issued and amendments have been included to IFRSs, which could be in-corporated into the Colombian regulatory framework, namely:
IFRS 16, Leases was issued in January 2016. It sets for-th the principles for the recognition, measurement, presen-tation, and disclosure of leases. IFRS 16 introduces an ac-counting model for single tenants and requires a lessee to recognize assets and liabilities, for all leases with a matu-rity of more than 12 months, unless the underlying asset is of low value. A lessee is required to recognize a right of use asset that represents his right to use the underlying leased asset and a lease liability representing his obligation to make payments for the lease. IFRS 16, substantially maintains the accounting requirements of the lessor of IAS 17 Leases. Ac-cordingly, a lessor will continue to classify its leases as opera-ting leases or financial leases, and will account for these two types of leases differently. IFRS 16 applies to annual repor-ting periods, beginning on or after January 1, 2019. Advance
application is permitted for entities, applying IFRS 15 Reve-nue from Ordinary Activities from Customer Contracts, prior to the date of initial application of IFRS 16. IFRS 16 replaces IAS 17 Leases, IFRIC 4 Determining Whether an Agreement Contains a Lease, SIC-15 Operating Leases – Incentives, and SIC-27 Evaluating the Essence of Transactions That Adopt the Legal Form of a Lease.
Changes in the Effective Date of the Amendments to IFRS 10 and IAS 28, to defer indefinitely the effective date of Sale or Contribution of Assets, between an investor and its associate, or joint venture, that was issued in September 2015, pending the Result of the Council’s Research Project on Equity Accounting. The deferment is in force from the time of its publication.
Management is evaluating the impact of adopting IFRS 16 in Grupo Nutresa, in its Statement of Financial Position and disclosures.
NOTE 4. JUDGMENTS, ESTIMATES, AND SIGNIFICANT ACCOUNTING ASSUMPTIONS
The preparation of Grupo Nutresa’s Financial Statements requires that management must make judgments, accoun-ting estimates, and assumptions that impact the amount of revenue and expenses, assets, and liabilities, and related disclosures, as well as, the disclosure of contingent liabilities at the close of the reporting period. The Group bases its assumptions and estimates, considering all parameters avai-lable at the time of preparation of the Consolidated Financial Statements. In this regard, the uncertainty of assumptions and estimates could impact future results that could require significant adjustments to the book amounts of the assets or liabilities impacted.
In applying Grupo Nutresa’s accounting policies, Mana-gement has made the following judgments and estimates, which have significant impact on the amounts recognized in these Consolidated Financial Statements:
• Classification of leases (Note 26)• Income tax (Note 18)• Employee benefits (Note 23)• Impairment of non-financial assets (Note 16-17)• Useful life and residual value of property, plant and equi-
pment and intangibles (Note 14-15-17)• Derivative financial instruments and hedges (Note 21.6) • Deferred taxes (Note 18.4)
Consolidated financial statements 2016

32
NOTE 5. BUSINESS COMBINATIONS
5.1 BUSINESS COMBINATIONS REALIZED DURING THE CURRENT PERIODNo business combinations were carried out during 2016.
5.2 BUSINESS COMBINATIONS OF PRIOR PERIODS
The February 19, 2015 the share purchase agreement was finalized at $743.401 in which Grupo Nutresa acquired 100% of the outstanding shares of Aldage, INC., owners of Colom-bian Companies that make up Grupo El Corral. The operation
was financed with domestic bank loans of $685.000 and Grupo resources.
Grupo El Coral is the leader of retail foods in Colombia, with a total of 355 POS in the segment “fast casual” of ham-burgers, with the brand El Corral, and in “casual dining” with its restaurants El Corral Gourmet, Leños y Carbón and Leños Gourmet. In addition to operating these chains, Grupo El Coral, operates international leading brands like Papa John’s (pizza), Yogen Fruz (frozen yogurt), Krispy Kreme (donuts), and Taco Bell (Mexican food).
The acquisition of Grupo El Corral, includes the following companies:
Entity Main Activity Country of Constitution
Functional Currency
% Participation Grupo Nutresa
Aldage, Inc. Administration of Investments Panama USD 100,00
Gabon Capital Ltd. Administration of Investments BVI USD 100,00
Baton Rouge Holdings Ltd. Administration of Investments BVI USD 100,00
LyC Bay Enterprises Inc. Administration of Investments Panama USD 100,00
Sun Bay Enterprises Inc. Administration of Investments Panama USD 100,00
Ellenbrook Holdings Limited (2) Administration of Investments BVI USD 100,00
Perlita Investments Ltd. Administration of Investments BVI USD 100,00
El Corral Investments Inc. Administration of Investments BVI USD 100,00
Gulla Properties Development LLC.(1) (2) Administration of Investments USA USD -
Heanor Consulting LLC.(1) (2) Administration of Investments USA USD -
Industria de Restaurantes Casuales Ltda. – IRCC
Food production and operation of retail food establishments Colombia COP 100,00
LyC S.A.S. Food production and operation of retail food establishments Colombia COP 100,00
PJ Col S.A.S. Food production and operation of retail food establishments Colombia COP 100,00
Panero S.A.S. Food production and operation of retail food establishments Colombia COP 100,00
New Brands S.A. Production of lactates and ice cream Colombia COP 100,00
Schadel Ltda. Production of lactates and ice cream Colombia COP 99,88
Tabelco S.A.S. (1) Food production and operation of retail food establishments Colombia COP -
Table 6
(1) At the time of the acquisition, Grupo Nutresa had no direct or indirect holding over these companies; however, there was a private sharehol-der agreement, derived from the acquisition of Grupo El Corral, in which the Group was given control over the relevant decisions.
(2) These companies, which operated as an investment vehicle, were liquidated during 2016.
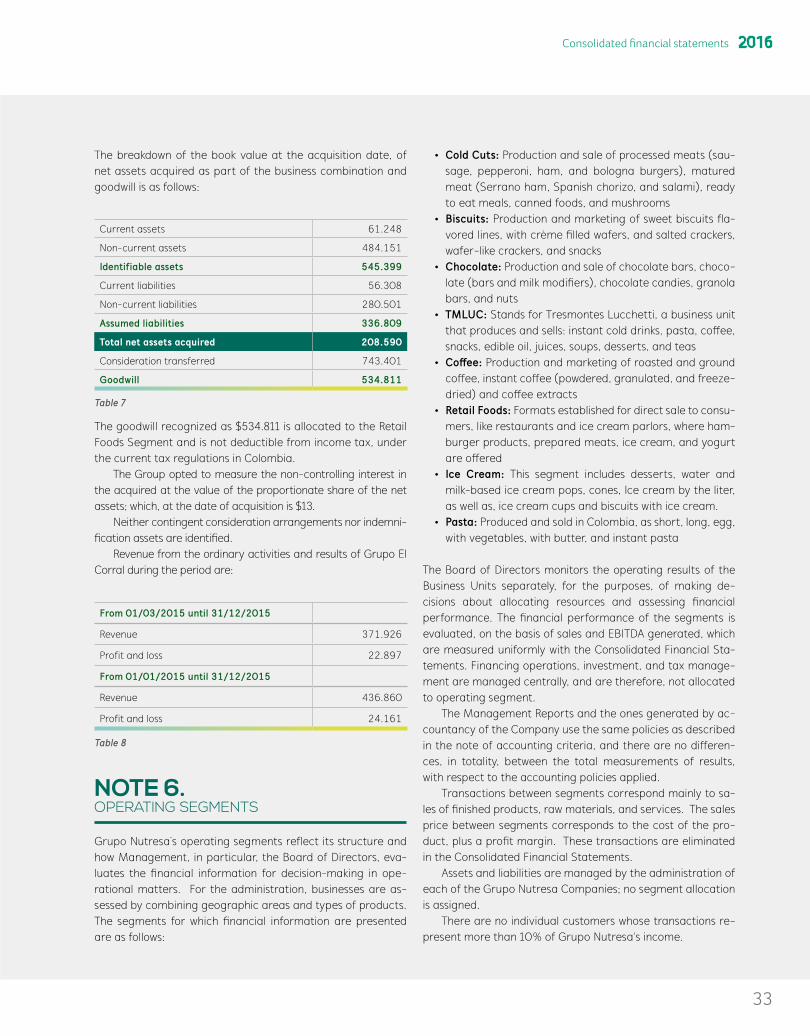
33
The breakdown of the book value at the acquisition date, of net assets acquired as part of the business combination and goodwill is as follows:
Current assets 61.248
Non-current assets 484.151
Identifiable assets 545.399
Current liabilities 56.308
Non-current liabilities 280.501
Assumed liabilities 336.809
Total net assets acquired 208.590
Consideration transferred 743.401
Goodwill 534.811
Table 7
The goodwill recognized as $534.811 is allocated to the Retail Foods Segment and is not deductible from income tax, under the current tax regulations in Colombia.
The Group opted to measure the non-controlling interest in the acquired at the value of the proportionate share of the net assets; which, at the date of acquisition is $13.
Neither contingent consideration arrangements nor indemni-fication assets are identified.
Revenue from the ordinary activities and results of Grupo El Corral during the period are:
From 01/03/2015 until 31/12/2015
Revenue 371.926
Profit and loss 22.897
From 01/01/2015 until 31/12/2015
Revenue 436.860
Profit and loss 24.161
Table 8
NOTE 6. OPERATING SEGMENTS
Grupo Nutresa`s operating segments reflect its structure and how Management, in particular, the Board of Directors, eva-luates the financial information for decision-making in ope-rational matters. For the administration, businesses are as-sessed by combining geographic areas and types of products. The segments for which financial information are presented are as follows:
• Cold Cuts: Production and sale of processed meats (sau-sage, pepperoni, ham, and bologna burgers), matured meat (Serrano ham, Spanish chorizo, and salami), ready to eat meals, canned foods, and mushrooms
• Biscuits: Production and marketing of sweet biscuits fla-vored lines, with crème filled wafers, and salted crackers, wafer-like crackers, and snacks
• Chocolate: Production and sale of chocolate bars, choco-late (bars and milk modifiers), chocolate candies, granola bars, and nuts
• TMLUC: Stands for Tresmontes Lucchetti, a business unit that produces and sells: instant cold drinks, pasta, coffee, snacks, edible oil, juices, soups, desserts, and teas
• Coffee: Production and marketing of roasted and ground coffee, instant coffee (powdered, granulated, and freeze-dried) and coffee extracts
• Retail Foods: Formats established for direct sale to consu-mers, like restaurants and ice cream parlors, where ham-burger products, prepared meats, ice cream, and yogurt are offered
• Ice Cream: This segment includes desserts, water and milk-based ice cream pops, cones, Ice cream by the liter, as well as, ice cream cups and biscuits with ice cream.
• Pasta: Produced and sold in Colombia, as short, long, egg, with vegetables, with butter, and instant pasta
The Board of Directors monitors the operating results of the Business Units separately, for the purposes, of making de-cisions about allocating resources and assessing financial performance. The financial performance of the segments is evaluated, on the basis of sales and EBITDA generated, which are measured uniformly with the Consolidated Financial Sta-tements. Financing operations, investment, and tax manage-ment are managed centrally, and are therefore, not allocated to operating segment.
The Management Reports and the ones generated by ac-countancy of the Company use the same policies as described in the note of accounting criteria, and there are no differen-ces, in totality, between the total measurements of results, with respect to the accounting policies applied.
Transactions between segments correspond mainly to sa-les of finished products, raw materials, and services. The sales price between segments corresponds to the cost of the pro-duct, plus a profit margin. These transactions are eliminated in the Consolidated Financial Statements.
Assets and liabilities are managed by the administration of each of the Grupo Nutresa Companies; no segment allocation is assigned.
There are no individual customers whose transactions re-present more than 10% of Grupo Nutresa’s income.
Consolidated financial statements 2016
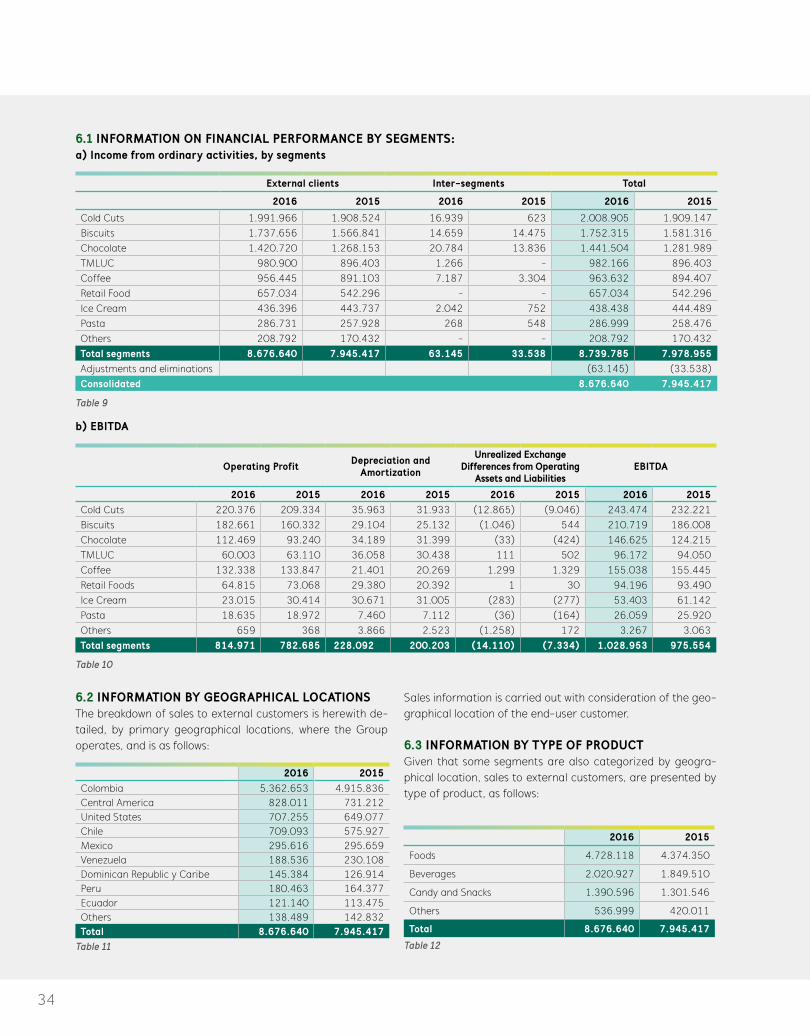
34
6.1 INFORMATION ON FINANCIAL PERFORMANCE BY SEGMENTS:a) Income from ordinary activities, by segments
External clients Inter-segments Total
2016 2015 2016 2015 2016 2015
Cold Cuts 1.991.966 1.908.524 16.939 623 2.008.905 1.909.147 Biscuits 1.737.656 1.566.841 14.659 14.475 1.752.315 1.581.316 Chocolate 1.420.720 1.268.153 20.784 13.836 1.441.504 1.281.989 TMLUC 980.900 896.403 1.266 - 982.166 896.403 Coffee 956.445 891.103 7.187 3.304 963.632 894.407 Retail Food 657.034 542.296 - - 657.034 542.296 Ice Cream 436.396 443.737 2.042 752 438.438 444.489 Pasta 286.731 257.928 268 548 286.999 258.476 Others 208.792 170.432 - - 208.792 170.432 Total segments 8.676.640 7.945.417 63.145 33.538 8.739.785 7.978.955 Adjustments and eliminations (63.145) (33.538)Consolidated 8.676.640 7.945.417
Table 9
b) EBITDA
Operating Profit Depreciation and Amortization
Unrealized Exchange Differences from Operating
Assets and LiabilitiesEBITDA
2016 2015 2016 2015 2016 2015 2016 2015Cold Cuts 220.376 209.334 35.963 31.933 (12.865) (9.046) 243.474 232.221Biscuits 182.661 160.332 29.104 25.132 (1.046) 544 210.719 186.008Chocolate 112.469 93.240 34.189 31.399 (33) (424) 146.625 124.215TMLUC 60.003 63.110 36.058 30.438 111 502 96.172 94.050Coffee 132.338 133.847 21.401 20.269 1.299 1.329 155.038 155.445Retail Foods 64.815 73.068 29.380 20.392 1 30 94.196 93.490Ice Cream 23.015 30.414 30.671 31.005 (283) (277) 53.403 61.142Pasta 18.635 18.972 7.460 7.112 (36) (164) 26.059 25.920Others 659 368 3.866 2.523 (1.258) 172 3.267 3.063Total segments 814.971 782.685 228.092 200.203 (14.110) (7.334) 1.028.953 975.554
Table 10
6.2 INFORMATION BY GEOGRAPHICAL LOCATIONSThe breakdown of sales to external customers is herewith de-tailed, by primary geographical locations, where the Group operates, and is as follows:
2016 2015Colombia 5.362.653 4.915.836 Central America 828.011 731.212 United States 707.255 649.077 Chile 709.093 575.927 Mexico 295.616 295.659 Venezuela 188.536 230.108 Dominican Republic y Caribe 145.384 126.914 Peru 180.463 164.377 Ecuador 121.140 113.475 Others 138.489 142.832 Total 8.676.640 7.945.417
Table 11
Sales information is carried out with consideration of the geo-graphical location of the end-user customer.
6.3 INFORMATION BY TYPE OF PRODUCTGiven that some segments are also categorized by geogra-phical location, sales to external customers, are presented by type of product, as follows:
2016 2015
Foods 4.728.118 4.374.350
Beverages 2.020.927 1.849.510
Candy and Snacks 1.390.596 1.301.546
Others 536.999 420.011
Total 8.676.640 7.945.417
Table 12

35
NOTE 7. INVESTMENTS IN SUBSIDIARIES
The following details financial information of the major subsidiaries that represent 95% of the gross equity of Gru-po Nutresa. This information was taken from the Financial Statements of the subsidiary companies at December 31st, certified and audited, subject to prescribed legal norms, in
each country, where they operate, which are homologized, in order to, apply, in a uniform manner, the accounting policies and practices of the Parent and translated to the Colombian peso for the purposes of consolidation.
2016 2015
Ass
ets
Liab
iliti
es
Equi
ty
Prof
it fo
r th
e Pe
riod
Oth
er
Com
preh
ensi
ve
Inco
me
for
The
Peri
od
Ass
ets
Liab
iliti
es
Equi
ty
Prof
it fo
r th
e Pe
riod
Oth
er
Com
preh
ensi
ve
Inco
me
for
The
Peri
od
Subsidiaries directly or indirectly 100% owned by Grupo Nutresa
Grupo Nutresa S.A. 8.543.254 103.221 8.440.033 399.098 260.195 8.102.526 92.538 8.009.988 427.096 (207.093)
Nutresa Chile S.A. 1.467.723 55.097 1.412.626 508 (31) 1.459.528 56.952 1.402.576 (6.461) (440)
Compañía de Galletas Noel S. A. S. 2.045.660 880.477 1.165.183 99.128 (63.543) 2.007.222 851.757 1.155.465 111.873 149.036
Compañía Nacional de Chocolates S. A. S. 1.621.352 595.814 1.025.538 58.332 (46.393) 1.604.850 578.928 1.025.922 52.731 117.486
American Franchising Corp. (AFC) 999.897 6 999.891 (17) - 1.049.512 - 1.049.512 1.886 203.003
Alimentos Cárnicos S.A.S. 1.886.086 1.130.322 755.764 61.005 (4.608) 1.750.430 984.475 765.955 72.079 98.493
Tresmontes S. A. 1.171.679 497.826 673.853 15.592 (391) 1.314.115 659.927 654.188 31.173 1.785
Compañía de Galletas Pozuelo DCR S.A. 720.246 85.335 634.911 (56.484) (3.319) 848.362 94.630 753.732 38.201 5.056
Industria Colombiana de Café S.A.S. 1.350.441 731.123 619.318 39.909 (14.275) 1.378.407 734.435 643.972 53.078 44.361
Lucchetti Chile S.A. (Newco) 656.474 61.699 594.775 5.989 (212) 711.510 126.504 585.006 6.518 584
Compañía Nacional de Chocolates del Peru S.A.
428.651 63.547 365.104 3.783 232 435.753 62.315 373.438 16.163 316
Meals Mercadeo de Alimentos de Colombia S.A.S.
779.130 551.423 227.707 4.774 (2.551) 753.315 489.984 263.331 14.302 2.360
Inmobiliaria Tresmontes Lucchetti S.A. (Newco)
233.649 22.689 210.960 3.061 (28) 239.293 32.776 206.517 2.720 209
Industria de Alimentos Zenú S. A. S. 350.471 141.653 208.818 23.528 (20.486) 368.019 159.096 208.923 19.429 (22)
Tresmontes Lucchetti S. A. 538.607 379.983 158.624 18.343 (521) 624.424 484.577 139.847 14.993 343
Abimar Foods Inc. 292.741 160.786 131.955 16.586 (1.218) 258.379 135.981 122.398 15.931 2.373
Productos Alimenticios Doria S. A. S. 307.682 180.184 127.498 6.840 (1.452) 324.534 190.991 133.543 12.502 1.953
Tresmontes Lucchetti Mexico S. A. de C. V. 178.190 61.523 116.667 (14.232) 1.337 247.324 85.627 161.696 (21.505) (1.008)
Inmobiliaria y Rentas Tresmontes Lucchetti 115.489 - 115.489 - - 114.706 - 114.706 - -
Novaventa S. A. S. 182.521 66.068 116.453 21397 - 167.643 74.186 93.457 19.967 -
Other subsidiaries (1) 2.726.853 1.842.241 884.612 28.536 (45.967) 3.367.104 2.364.719 1.002.385 57.682 5.409
Subsidiaries with non-controlling interest
Novaceites S.A. 63.801 12.325 51.476 4.010 (13) 68.712 21.555 47.157 2.425 84
Setas Colombianas S.A 65.958 16.127 49.831 5.051 - 70.107 23.364 46.743 3.439 -
Helados Bon 44.026 15.039 28.987 9.629 (553) 42.965 19.068 23.897 6.880 1.036
La Recetta Soluciones Gastronómicas Integradas S.A.S.
44.196 42.527 1.669 (25) 9 49.837 48.147 1.689 (81) -
Fondo de Capital Privado “Cacao para el Futuro” – Compartimento A
40.132 12.014 28.118 720 - 34.416 7.018 27.398 1.275 -
Table 13
Consolidated financial statements 2016

36
(1) Other subsidiaries include equity of $884.612, for the following com-panies: Alimentos Cárnicos de Panama S.A., Alimentos Cárnicos Zona Franca Santa Fe S.A.S., Compañía Nacional de Chocolates DCR. S.A., Nutresa S.A. de C.V., Serer S.A. de C.V., Pastas Comarrico S. A. S., Industrias Aliadas S.A.S., Tropical Coffee Company S. A. S., Molino Santa Marta S.A.S., Comercial Pozuelo Nicaragua S.A., Comercial Pozuelo Panama S. A., Cía. Americana de Helados S.A., Americana de Alimentos S.A. de C.V., Comercial Nutresa S.A.S., Distribuidora POPS S.A., Corp. Distrib. de Alimentos S.A (Cordialsa), Comercial Po-zuelo Guatemala S.A., Industrias Lácteas Nicaragua S.A., Novaventa S.A.S., Comercial Pozuelo El Salvador S.A. de C.V., Cordialsa Usa, Inc., TMLUC Argentina S.A., Comercializadora Tresmontes Lucchetti S.A.
de C.V., Tresmontes Lucchetti Internacional S.A., TMLUC Peru S.A., Tresmontes Lucchetti Servicios S.A., Fideicomiso Grupo Nutresa, In-mobiliaria Nevada S.A., Gestión Cargo Zona Franca S.A.S., Opperar Colombia S.A.S., Servicios Nutresa S.A.S., Promociones y Publicidad Las Américas S.A., TMLUC Servicios Industriales, S. A. de CV , Servi-cios Tresmontes Lucchetti S.A. de C.V., A2-Aldage, Inc., Aldage Inc., Litoempaques S.A.S., Servicios Nutresa Costa Rica S.A., Tresmontes Lucchetti Agroindustrial S. A., Aldage, Inc., LYC Bay Enterprise INC., Sun Bay Enterprise INC., Gulla Properties Development LLC., Hea-nor Consulting LLC., Gabon Capital LTD., Baton Rouge Holdings LTD., Ellenbrook Holdings Limited, Perlita Investments LTD., El Corral In-vestments INC.
NOTE 8. CASH AND CASH EQUIVALENTS
Cash and cash equivalents at December 31st includes the following:
2016 2015Cash and banks 149.987 234.620 Short-term investments 69.335 51.444 Total 219.322 286.064
Table 14
Short-term collocations are realized for varying periods of be-tween one day and three months, depending on the immediate cash requirements of the Group and accrue interest at market rates of the respective short-term collocations. Balances with banks accrue interest at variable rates based on the return daily
bank deposit rates. The average returns on cash and cash equi-valents, in all currencies, is 4.1% (2015 - 2,7%)
These values have no restrictions over their availability.At December 31, 2016, the Group had $2.500.000 (2015 –
2.100.000) available in committed unused credit lines.
NOTE 9. TRADE AND OTHER RECEIVABLES
2016 2015
Customer 811.653 842.362 Accounts receivable from employees 39.201 40.149 Loans to third-parties 2.298 2.248 Dividends receivable 12.496 11.612 Other accounts receivable 56.136 21.807 Impairment (9.092) (13.169)Total trade and other receivables 912.692 905.009Current portion 889.197 878.280 Non-current portion 23.495 26.729
Table 15
At December 31, accounts receivable from customers have the following stratifications:
2016 2015Not overdue 610.866 624.023 Up to 90 days 178.150 188.894 Between 91 and 180 days 9.556 10.588 Between 181 and 365 days 8.116 9.779 More than 365 days 4.965 9.078 Total 811.653 842.362
Table 16
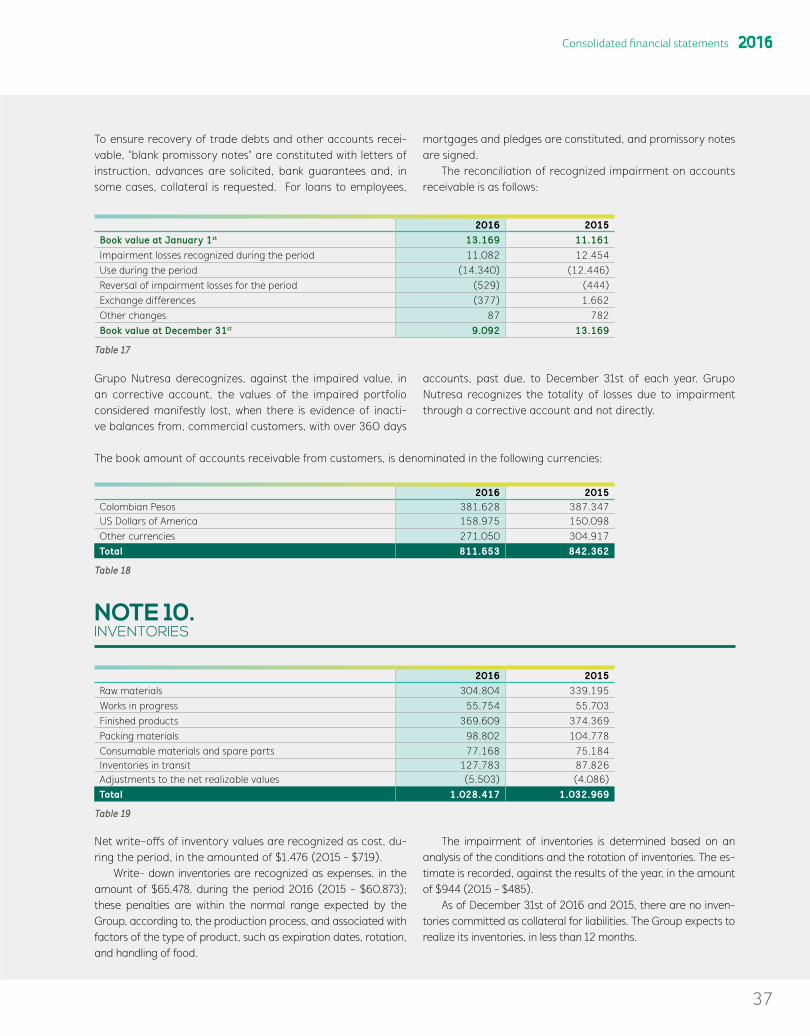
37
To ensure recovery of trade debts and other accounts recei-vable, “blank promissory notes” are constituted with letters of instruction, advances are solicited, bank guarantees and, in some cases, collateral is requested. For loans to employees,
mortgages and pledges are constituted, and promissory notes are signed.
The reconciliation of recognized impairment on accounts receivable is as follows:
2016 2015Book value at January 1st 13.169 11.161 Impairment losses recognized during the period 11.082 12.454 Use during the period (14.340) (12.446)Reversal of impairment losses for the period (529) (444)Exchange differences (377) 1.662 Other changes 87 782 Book value at December 31st 9.092 13.169
Table 17
Grupo Nutresa derecognizes, against the impaired value, in an corrective account, the values of the impaired portfolio considered manifestly lost, when there is evidence of inacti-ve balances from, commercial customers, with over 360 days
accounts, past due, to December 31st of each year. Grupo Nutresa recognizes the totality of losses due to impairment through a corrective account and not directly.
The book amount of accounts receivable from customers, is denominated in the following currencies:
2016 2015Colombian Pesos 381.628 387.347 US Dollars of America 158.975 150.098 Other currencies 271.050 304.917 Total 811.653 842.362
Table 18
NOTE 10. INVENTORIES
2016 2015Raw materials 304.804 339.195Works in progress 55.754 55.703Finished products 369.609 374.369Packing materials 98.802 104.778Consumable materials and spare parts 77.168 75.184Inventories in transit 127.783 87.826Adjustments to the net realizable values (5.503) (4.086)Total 1.028.417 1.032.969
Table 19
Net write-offs of inventory values are recognized as cost, du-ring the period, in the amounted of $1.476 (2015 - $719).
Write- down inventories are recognized as expenses, in the amount of $65.478, during the period 2016 (2015 - $60.873); these penalties are within the normal range expected by the Group, according to, the production process, and associated with factors of the type of product, such as expiration dates, rotation, and handling of food.
The impairment of inventories is determined based on an analysis of the conditions and the rotation of inventories. The es-timate is recorded, against the results of the year, in the amount of $944 (2015 - $485).
As of December 31st of 2016 and 2015, there are no inven-tories committed as collateral for liabilities. The Group expects to realize its inventories, in less than 12 months.
Consolidated financial statements 2016

38
NOTE 11. BIOLOGICAL ASSETS
2016 2015
Biological assets – cattle 42.763 24.636
Biological assets – pig 29.414 25.269
Forest plantation 10.933 8.913
Total 83.110 58.818
Current portion 75.677 53.119
Non-current portion 7.433 5.699
Table 20
The following are the amounts and principal locations of the biological assets:
Quantities
Location2016 2015
Biological assets – cattle (1) 30,400 units 22,394 units Antioquia, Córdoba, Cesar, Santander, Sucre, and Caldas - Colombia
Biological assets – pig (1)73,251 units 67,833 units Antioquia and Caldas - Colombia
12,418 units 13,184 units Provincia de Oeste - Panama
Forest plantations
Cocoa plantations (2) 170 ha 170 ha Santander - Colombia
Mushroom crops (3) 40.290 m2 40.290 m2 Yarumal - Colombia
Table 21
(1) Pork livestock farming in Colombia is carried out own farms, farms in participation, and leased farms; its production is used as raw ma-terial for the development of business products of the Cold Cuts Business.
Pigs and cattle, in Colombia, are measured at fair value, using as a reference, the market values published by the National Association of Pig Farmers and livestock auctions at fairs in each location; this measurement is at the Level 2 of the fair value hierarchy, of IFRS 13.
Pigs that are produced abroad, in 2016 is $4.709 (2015 - $5.125), are measured upon initial recognition under the cost model,, taking into account, that there is no active market.
(2) Owned cocoa plantations are intended to encourage the develop-ment of the cocoa crops through to agroforestry systems (Cacao timber), to farmers in the Country, in addition to supply of raw ma-terial consumption of Group; they have an average life of 15 years, and therefore, are classified as non-current assets.
(3) Mushroom crops are used by Setas Colombianas S.A., in its pro-duction process, located in Yarumal, Colombia, and is measured under the cost model, considering that there no active market exists, for these crops
The gain or loss for the period, due to changes in fair value minus the costs to sell of biological assets, in 2016 is $8.696 (2015 - $1.582), and is included in operating income.
At the end of the reporting period, and the comparati-ve period, there are no restrictions on the ownership of the Group’s biological assets, nor significant contractual commit-ments for its development or acquisition, and have not been pledged as collateral for debt compliance.

39
NOTE 12. OTHER ASSETS
Other assets are comprised of the following:
2016 2015
Other current assets
Current taxes (See note 18.2) 208.803 146.006
Prepaid expenses (1) 29.009 58.679
Financial derivative instruments (See Note 21.6) 9.020 16.077
Total other current assets 246.832 220.762
Other non-current assets
Non current taxes 970 -
Prepaid expenses 5.915 4.182
Other financial instruments measured at fair value (2) 40.109 34.324
Other non-current assets 1.667 2.139
Total other non-current assets 48.661 40.645
Total other assets 295.493 261.407
Table 22
(1) The expenses paid in advance, correspond mainly to insurance in the amount of $12.397 (2015 - $16.978), contractors for $4.223 (2015 - $14.264), and leases for $1.068 (2015 - $937).
The decrease is mainly due to the fact, that the balance at Decem-ber 2015, it includes pre-payments of $19.560 from the companies Industrias Alimenticias Hermo and Cordialsa de Venezuela, which were excluded from the consolidation perimeter of Grupo Nutresa, as of October 2016 and onwards, as explained in Note 20.1.
(2) Other financial instruments measured at fair value corresponding to the rights held by the private equity “Cacao para el futuro” - Compartment A, in cocoa plantations. See Note 37 for the infor-mation for the measurement of the fair value of this asset.
NOTES 13. NON-CURRENT ASSETS HELD FOR SALE
Currently under construction, are five distribution centers that form part of “build to suit” and that will house the fini-shed product for secondary distribution in Colombia, in the cities of Florence, Palermo, Pasto, Cartagena, and Montería.
This initiative is framed under the strategy of sustainable development, in construction, and ensures the welfare for human resources, as well as, the product. Grupo Nutre-sa realizes the design and construction of these buildings which will be sold to a real estate fund, once construction is complete in mid-2016, to then be taken into operating leases by Grupo Nutresa, thereby achieving a significant re-lease of working capital.
As of December 31, 2016, the balance of $100.330 (De-cember 2015 - $71.679), included machinery and equipment for $631, land purchased for $15.586, and constructions in progress for $84.113; These constructions are expected to be completed in the first quarter of 2017, for which, resources are committed for, in the amount of $14.377.
In the year 2016, real estate sales were carried out clas-sified in this category for a value of $35.069, transfers were made to properties, plant and equipment, in the amount of $9.784, and additional investments in projects-in-progress, in the amount of $73.504.
Consolidated financial statements 2016

40
NOTE 14. PROPERTY, PLANT AND EQUIPMENT, NET
The movement of property, plant and equipment occurring during the period, is as follows:
Land
Bui
ldin
gs
Mac
hine
ry
and
Prod
ucti
on
Equi
pmen
t
Tran
spor
tati
on
Equi
pmen
t
Com
pute
r Eq
uipm
ent
Off
ice
Equi
pmen
t
Leas
ehol
d Im
prov
emen
ts
Ass
ets
in
Prog
ress
Tota
l
Cost 778.971 910.913 2.059.609 22.433 30.186 47.113 102.462 180.986 4.132.673
Depreciation and/ or impairment (327) (103.136) (560.123) (12.614) (17.110) (29.256) (26.385) - (748.951)
Balance at January 1, 2016 778.644 807.777 1.499.486 9.819 13.076 17.857 76.077 180.986 3.383.722
Acquisitions - 872 11.950 2.092 6.243 4.754 19.971 283.676 329.558
Disposals (96) (4.335) (7.299) (653) (35) (19) (117) (3.194) (15.748)
Depreciation - (33.195) (157.513) (2.913) (4.273) (4.683) (12.459) - (215.036)
Impairment - - (173) (5) (4) - - - (182)
Transfers 10.537 17.444 275.066 1.664 812 4.038 (878) (307.161) 1.522
Classification to financial instruments (Venezuela) (526) (18.509) (12.381) (34) (73) (59) - (6.778) (38.360)
Adjustments in hyperinflationary economies 262 10.274 8.319 6 (32) 85 - 3.527 22.441
Currency translation impact (7.488) (28.945) (38.082) (552) (516) (1.026) (452) (7.343) (84.404)
Cost 781.644 891.388 2.260.229 23.464 33.963 51.888 116.709 143.713 4.302.998
Depreciation and/ or impairment (311) (140.005) (680.856) (14.040) (18.765) (30.941) (34.567) - (919.485)
Balance at December 31, 2016 781.333 751.383 1.579.373 9.424 15.198 20.947 82.142 143.713 3.383.513
Cost 751.664 706.040 1.564.133 30.349 18.056 38.615 10.402 316.809 3.436.068
Depreciation and/ or impairment (200) (57.541) (363.350) (13.222) (11.888) (22.812) (3.720) - (472.733)
Balance at January 1, 2015 751.464 648.499 1.200.783 17.127 6.168 15.803 6.682 316.809 2.963.335
Acquisitions - 9.612 20.239 1.973 3.511 729 12.492 346.408 394.964
Business combinations 1.868 16.521 44.188 1.046 2.455 3.218 63.390 1.001 133.687
Disposals (2.401) (2.336) (3.365) (432) (106) (168) (171) (79) (9.058)
Depreciation - (31.091) (144.295) (2.935) (3.638) (4.232) (8.231) - (194.422)
Impairment - (7) (162) - 7 - - - (162)
Transfers (273) 144.092 329.880 (10.141) 4.281 596 538 (519.382) (50.409)
Adjustments in hyperinflationary economies 606 9.833 9.540 83 2 12 - 3.396 23.472
Currency translation impact 27.380 12.654 42.678 3.098 396 1.899 1.377 32.833 122.315
Cost 778.971 910.913 2.059.609 22.433 30.186 47.113 102.462 180.986 4.132.673
Depreciation and/ or impairment (327) (103.136) (560.123) (12.614) (17.110) (29.256) (26.385) - (748.951)
Balance at December 31, 2015 778.644 807.777 1.499.486 9.819 13.076 17.857 76.077 180.986 3.383.722
Table 23

41
As of December 31, 2016, there was collateral of property, plant and equipment, at a book value of $178.910, to cover financial obligations or credit quotas. (2015 $178.910).
The main acquisitions in 2016, are part of the purchase of
a plant of cattle slaughtering in the Cold Cuts Business, new lines of production of pasta and biscuits, and in 2015, corres-ponds primarily to the new lines of biscuit production and re-position of assets in the business.
NOTE 15. INVESTMENT PROPERTIES
The movement of investment properties is detailed, during 2016 and 2015, as follows:
Land Buildings Total
Cost 68.336 14.777 83.113
Depreciation and impairment - (720) (720)
Balance at January 1, 2016 68.336 14.057 82.393
Depreciation - (184) (184)
Transfers - (2.641) (2.641)
Impact of differences of currency translation - (7.726) (7.726)
Cost 68.336 4.040 72.376
Depreciation and impairment - (534) (534)
Balance at December 31, 2016 68.336 3.506 71.842
Cost 80.483 15.992 96.475
Depreciation and impairment - (195) (195)
Balance at January 1, 2015 80.483 15.797 96.280
Withdrawals (461) (880) (1.341)
Depreciation - (581) (581)
Transfers (11.686) - (11.686)
Adjustments in hyperinflationary economies - 7.090 7.090
Impact of differences of currency translation - (7.369) (7.369)
Cost 68.336 14.777 83.113
Depreciation and impairment - (720) (720)
Balance at December 31, 2015 68.336 14.057 82.393
Table 24
At December 31, 2016, there were no materials commitments for acquisition or construction of the investment properties.
The fair value of investment properties, at December 31, 2016, amounted to $98.064 (2015 $103.538), and was de-termined by an independent appraiser using an income and market approach. The variation is mainly explained by the
classification of investments in Venezuela, as Financial Instru-ments in the amount of $9.900, and the rest, based on prices from active market share prices, adjusted for differences in nature, location and/or condition of each property particular; or by financial discounting of future cash flows obtained from leased property.
Consolidated financial statements 2016

42
NOTE 16. GOODWILL
The movement of book values of goodwill, assigned to each one of the segments of the Group, is as follows:
2016
Reportable Segment CGU Balance at January 1
Exchange Differences
Balance at December 31
Retail Foods
Grupo El Corral 534.811 - 534.811
Grupo Pops 170.494 - 170.494
Helados Bon 51.530 - 51.530
Coffee Industrias Aliadas S.A.S 4.313 - 4.313
Cold Cuts Setas Colombianas S.A. 906 - 906
Chocolate Nutresa de Mexico 182.642 (2.571) 180.071
BiscuitsAbimar Foods Inc. 96.546 - 96.546
Galletas Pozuelo 36.995 (2.896) 34.099
TMLUC Grupo TMLUC 955.166 6.518 961.684
2.033.403 1.051 2.034.454
Table 25
2015
Reportable Segment CGU Balance at January 1 Additions (*) Exchange
DifferencesBalance at
December 31
Retail Foods
Grupo El Corral (*) - 534.811 - 534.811
Grupo Pops 170.494 - - 170.494
Helados Bon 51.530 - - 51.530
Coffee Industrias Aliadas S.A.S 4.313 - - 4.313
Cold Cuts Setas Colombianas S.A. 906 - - 906
Chocolate Nutresa de Mexico 172.248 - 10.394 182.642
Biscuitss Abimar Foods Inc. 96.546 - - 96.546
Galletas Pozuelo 27.950 - 9.045 36.995
TMLUC Grupo TMLUC 849.085 - 106.081 955.166
1.373.072 534.811 125.520 2.033.403
Table 26
(*) In 2015, the addition corresponds to the business combination for the acquisition of Grupo El Corral (See Note 5.2).
16.1 ASSESSMENT OF IMPAIRMENT OF GOODWILLGoodwill is not subject to amortization. The Group reviews the existence of impairment, annually, by comparing the book va-lue of net assets allocated to the Cash Generating Unit (CGU), with their recoverable value. During the current period, as well as, in the previous, no impairment loss was recognized.
The recoverable segments Coffee, Cold Cuts, Chocolate, Biscuits, TMLUC, and some CGU from the Consumer Food Segment are calculated, based on the value in use, which co-rresponds to the discounted future cash flows.
The recoverable amount of the CGU of Grupo El Corral is estimated, based on the fair value less costs of disposal. To
estimate the fair value less costs of disposal, the methodology of discounted cash flow less costs of disposal, was applied. To apply this methodology, a discount rate. The method of calcu-lation is the weighted average cost of capital, which weighs the cost of shareholders, with the cost of debt. The estimate of the variables for both the cost of capital, and to debt, is based on market information available at the date of valuation. Regar-ding the estimate of the projections, the best estimates were used by the Management, and were adjusted, based on the historic results. These projections include those projects that are authorized, at the date of valuation.
For each CGU or group of CGU, the recoverable amount is
st
st st
st

43
higher than its book amount. Cash flows have been projected for a period of 10 years, which consists of five years of explicit plans and an additional 5 years, where a stabilization period is projected, with a decreasing convergence equivalent to the anticipated nominal economic comportment, and the perpe-tual long-term growth, according to the requirements of the applicable norms, giving more consistency to the normal evo-lution of the businesses and projections. These flows have been established throughout the experience of the Group.
The operating income included within the future cash flows correspond to the income of the businesses that con-form to the CGU or group of CGU’s, and the projected com-portment considered the expected evolution of the market and the growth strategies approved by the Direction, for the following years, determinant, at the moment that the
evolution of the gross profit margin is defined, which includes a study of the cost factors based upon the efficiencies pro-jected by the Administration.
Grupo Nutresa uses a specific growth rate that is similar to the average rate of long-term growth, for the industry, and is 1.5%, indexed to the inflation of the country, where is each CGU is assessed; all flows have been discounted, according to the spe-cific for that relevant country, and varies according the variables determined, for each CGU, according to the WACC “weighted average cost of capital” methodology. The average discount rate used, is in a range established, between 8% and 14%.
Grupo Nutresa considers that there is no reasonable chan-ge possible, in the previous key assumption indicators listed above, used in the assessment of impairment, in such way that the book value of a CGU, exceeds its recoverable amount.
NOTE 17. OTHER INTANGIBLE ASSETS
Brands Software and Licenses
Concessions and Franchises Others Total
Cost 1.160.527 41.242 54.351 3.627 1.259.747
Amortization and impairment (54.714) (24.465) (564) (47) (79.790)
Balance at January 1, 2016 1.105.813 16.777 53.787 3.580 1.179.957
Acquisitions - 4.448 607 3.053 8.108
Amortization (4.125) (5.679) (192) (256) (10.252)
Transfers - (510) - 458 (52)
Impact of currency translation (13.996) (7) (80) (7) (14.090)
Cost 1.145.839 35.660 54.877 7.131 1.243.507
Amortization and impairment (58.147) (20.631) (755) (303) (79.836)
Balance at December 31, 2016 1.087.692 15.029 54.122 6.828 1.163.671
Cost 801.740 31.325 27 59 833.151
Amortization and impairment (50.569) (15.742) (11) - (66.322)
Balance at January 1, 2015 751.171 15.583 16 59 766.829
Acquisitions 117 7.659 512 2.920 11.208
Business combinations (See Note 5) 269.545 953 53.367 - 323.865
Amortization (4.029) (6.214) (122) (47) (10.412)
Transfers 1.193 (2.075) 8 640 (234)
Impact of currency translation 87.816 871 6 8 88.701
Cost 1.160.527 41.242 54.351 3.627 1.259.747
Amortization and impairment (54.714) (24.465) (564) (47) (79.790)
Balance at December 31, 2015 1.105.813 16.777 53.787 3.580 1.179.957
Table 27
Consolidated financial statements 2016

44
17.1 BRANDS This corresponds to the brands acquired through business combinations or transactions with third parties.
The following table shows the allocation of brands to each business segment and the classification by useful life at De-cember 31st of 2016 and 2015:
2016
Reportable Segment Finite Useful Life Brands
Indefinite Useful Life Brands Total
Retail Foods - 268.327 268.327
Cold Cuts 1.031 - 1.031
Chocolate - 16.840 16.840
Biscuits - 183.293 183.293
Ice Cream 287.196 - 287.196
TMLUC - 331.005 331.005
Total 288.227 799.465 1.087.692
Table 28
2015
Reportable Segment Finite Useful Life Brands
Indefinite Useful Life Brands Total
Retail Foods - 268.992 268.992
Cold Cuts 1.398 - 1.398
Chocolate - 17.442 17.442
Biscuits - 198.864 198.864
Ice Cream 290.356 - 290.356
TMLUC - 328.761 328.761
Total 291.754 814.059 1.105.813
Table 29
Brands with a finite useful life are amortized with a useful life of 99 years.
Brands with a net book value of $799.465 (2015 - $814.059) are considered to have indefinite useful lives, due to the fact that a consistent basis it is not determined, in refe-rence to the flows that are expected to generate each one of the brands; these assets are not amortized and are assessed for impairment, annually.
17.1.1 IMPAIRMENT OF THE VALUE OF INTANGIBLE ASSETS WITH INDEFINITE USEFUL LIVESThe brands that have indefinite useful lives are subject, an-nually, to an assessment of impairment, using the projection
of future cash flows, to determine its value in-use; in this as-sessment, such variables, as: the discounted rate, the increa-sed rate of long-term, among other variables, similar to tho-se used in the impairment assessment of goodwill (See Note 16.1), are taken into account. During 2016 and 2015, no losses from impairment of brands were not recognized.
In relation to intangible assets with finite useful lives, Gru-po Nutresa considers that there are no situations that can im-pact the projections of expected results, in the remainder of the useful life, and in whose opinion, to December 31st of 2016 and 2015, there exists no indications of impairment of intangi-ble assets with a finite useful life.

45
NOTE 18. INCOME TAXES AND PAYABLE TAXES
18.1 APPLICABLE NORMSThe effective tax provisions and applicable, state that nominal rates of income tax for Grupo Nutresa, are as follows:
Income tax % 2015 2016 2017 2018 2019 2020
Colombia 39,0 40,0 40,0 37,0 33,0 33,0
Costa Rica 30,0 30,0 30,0 30,0 30,0 30,0
Ecuador 22,0 22,0 22,0 22,0 22,0 22,0
El Salvador 30,0 30,0 30,0 30,0 30,0 30,0
Estados Unidos 30,0 34,0 34,0 34,0 34,0 34,0
Guatemala 25,0 25,0 25,0 25,0 25,0 25,0
Mexico 30,0 30,0 30,0 30,0 30,0 30,0
Nicaragua 30,0 30,0 30,0 30,0 30,0 30,0
Panama 25,0 25,0 25,0 25,0 25,0 25,0
Peru 28,0 28,0 29,5 29,5 29,5 29,5
Dominican Republic 27,0 27,0 27,0 27,0 27,0 27,0
Chile 22,5 24,0 25,5 27,0 27,0 27,0
Argentina 35,0 35,0 35,0 35,0 35,0 35,0
Table 30
a) Colombia Until the taxable year 2016, tax revenues are taxed at the rate of 25%, to income tax, except taxpayers by express provision, handle special rates, such as those located in free zones, and 10% income from occasional profit.
The income tax for equity, “CREE”, a fee of 9% is applied, in accordance with Law 1739 of December 2014. In addition, during 2015 and 2016, the Law 1739 of 2014 established a
surtax on income tax for equity “CREE”, which is the respon-sibility of the taxpayers of this tax at rates of 5%, 6% per year, respectively.
The Structural Tax Reform - Law 1819 of December 29, 2016 – aside of repealing the income tax for equity - CREE, as of January 1, 2017, modified the income tax rate, as well, as follows:
Before the Reform Within the Reform Nominal Variation
2017
Income tax: 25%CREE: 9%CREE surtax: 8% (TB*>800 Millon)Total: 42%
Income tax: 34%Income surtax: 6%(TB*>800 Millon)Total: 40%
Reduction of 2%
2018
Income tax: 25%CREE: 9%CREE surtax: 9% (TB*>800 Millon)Total: 43%
Income tax: 33%Income surtax: 4%(TB*>800 Millon)Total: 37%
Reduction of 6%
2019 ForwardIncome tax: 25%CREE: 9%Total: 34%
Income tax: 33%Total: 33% Reduction of 1%
Table 31
*TB: Tax Base
Consolidated financial statements 2016

46
b) ChileIn Chile, the law implemented separate “capital income” and “earned income” systems. The first are taxed with tax class act, which mainly impacts businesses. This tax has a fixed rate of 24% for the year 2016, and 25.5% for the year 2017, on the tax base, which is calculated effecting aggregates or decreases mandated by law. The tax paid in this way, is imputable against the Global Complementary, which taxes the entire income of natural persons residing in the country; or additional, levies on income generated in Chile, to natural and legal persons, resi-ding outside the country, according to, the case.
c) MexicoThe income tax rate of Mexico is 30%; which is applied to ta-xable income for the year.
d) Costa RicaIncome tax is calculated based on the actual income for the year, with advances during the estimated year. The provisions for taxes on income accounts includes, in addition, taxable
income tax for the year, the tax effect applicable to tempo-rary differences between accounting and tax items, used for calculation of income tax. The value of tax such differences are recorded in an account of deferred income tax. The rate of income tax is 30%.
e) PanamaThe income tax is determined based on the actual income for the year. The income tax rate is 25%.
f) EcuadorAccording to the Law of Tax Regime, companies incorporated in Ecuador, have tax incentives applications for investments that run in any part of the country, which is the progressive reduction of percentage points in the tax rent, and they’re subject to the tax rate of 22%. .
18.2 CURRENT TAX ASSETS AND LIABILITIESThe balance of current tax assets at December 31st includes:
2016 2015
Income tax and complementary (1) 123.903 110.275
Income tax for equity "CREE” (2) 16.805 10.158
Equity tax (3) 49.486 -
Sales tax payable 15.801 22.982
Other taxes 2.808 2.591
Total 208.803 146.006
Table 32
(1) Income tax assets and complementary, include automatic withhol-dings of $8.648 (2015 - $9.022), credit balances of $94.883 (2015 - $67.546), tax advances of $20.162 (2015 - $32.923), tax rebates for $56 (2015 - $782), and withholding $154 (2015 - $2).
(2) Assets from income tax for equity “ CREE” include automatic wi-thholdings of $1.895 (2015 - $582), and credit balances of $ 14.910 (2015 - $ 9.576).
(3) Grupo Nutresa has six (6) companies that signed on with, in 2009, the Colombian Government, judicial stability contracts; one of the stabilized tax was the equity tax, which, according to the interpretation of the Directorate National Tax and Customs,
according to those contracts, these companies hold the obli-gation to pay, despite being sheltered by the contracts. These companies proceeded to fulfill the legal obligation. Parallel to this situation, other contributors took legal action and demanded the concept through the sentence 18636 of August 30, 2016, and nullifying the concept, by judgment 05001-23-31-000-2012-00612-01 [21012]. As a result of said, and applying Article 594-2 of the Tax Code, these statements do not produce legal effects; generating a credit balance, from the payment due in the amount of $ 37.965, in the Changes in Equity Statement, and $ 11.521 in the Comprehensive Income Statement.
The current taxes payable balances to December 31st include:
2016 2015
Income tax and complementary 39.336 61.273
Income tax for equity - CREE 8.478 11.002
Sales tax payable 79.453 65.662
Withholding taxes, payable 28.556 27.105
Other taxes 7.539 7.281
Total 163.362 172.323
Table 33
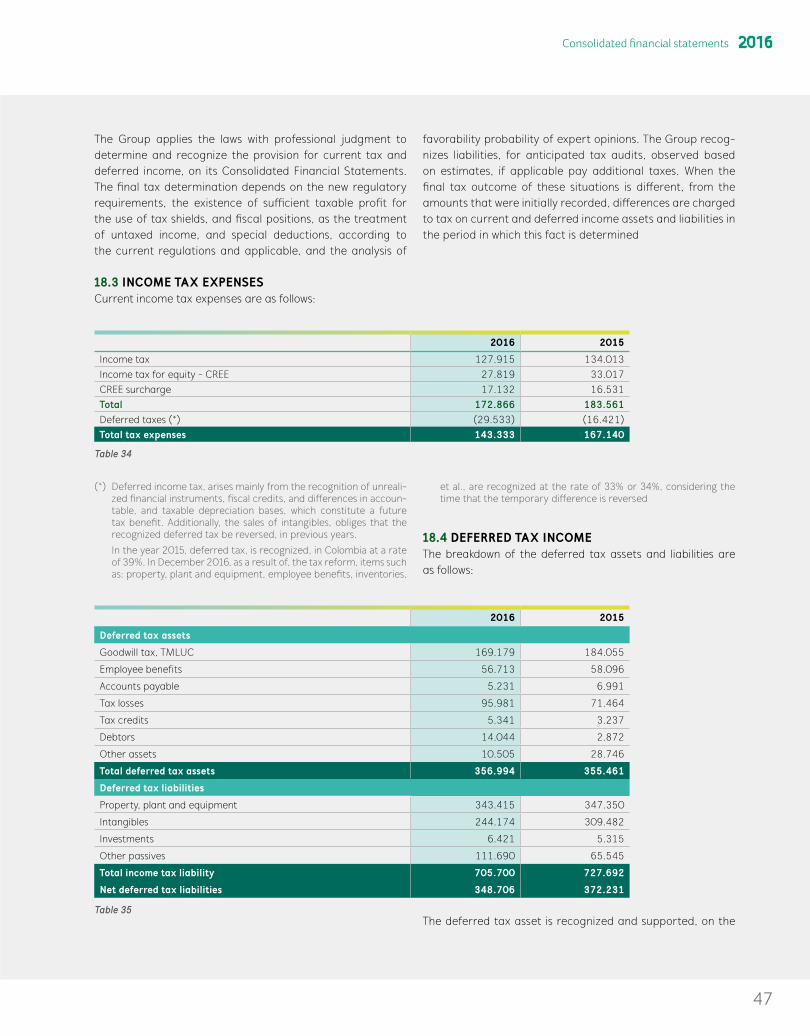
47
The Group applies the laws with professional judgment to determine and recognize the provision for current tax and deferred income, on its Consolidated Financial Statements. The final tax determination depends on the new regulatory requirements, the existence of sufficient taxable profit for the use of tax shields, and fiscal positions, as the treatment of untaxed income, and special deductions, according to the current regulations and applicable, and the analysis of
favorability probability of expert opinions. The Group recog-nizes liabilities, for anticipated tax audits, observed based on estimates, if applicable pay additional taxes. When the final tax outcome of these situations is different, from the amounts that were initially recorded, differences are charged to tax on current and deferred income assets and liabilities in the period in which this fact is determined
18.3 INCOME TAX EXPENSESCurrent income tax expenses are as follows:
2016 2015
Income tax 127.915 134.013Income tax for equity - CREE 27.819 33.017CREE surcharge 17.132 16.531Total 172.866 183.561Deferred taxes (*) (29.533) (16.421)Total tax expenses 143.333 167.140
Table 34
(*) Deferred income tax, arises mainly from the recognition of unreali-zed financial instruments, fiscal credits, and differences in accoun-table, and taxable depreciation bases, which constitute a future tax benefit. Additionally, the sales of intangibles, obliges that the recognized deferred tax be reversed, in previous years.
In the year 2015, deferred tax, is recognized, in Colombia at a rate of 39%. In December 2016, as a result of, the tax reform, items such as: property, plant and equipment, employee benefits, inventories,
et al., are recognized at the rate of 33% or 34%, considering the time that the temporary difference is reversed
18.4 DEFERRED TAX INCOMEThe breakdown of the deferred tax assets and liabilities are as follows:
2016 2015
Deferred tax assets
Goodwill tax, TMLUC 169.179 184.055
Employee benefits 56.713 58.096
Accounts payable 5.231 6.991
Tax losses 95.981 71.464
Tax credits 5.341 3.237
Debtors 14.044 2.872
Other assets 10.505 28.746
Total deferred tax assets 356.994 355.461
Deferred tax liabilities
Property, plant and equipment 343.415 347.350
Intangibles 244.174 309.482
Investments 6.421 5.315
Other passives 111.690 65.545
Total income tax liability 705.700 727.692
Net deferred tax liabilities 348.706 372.231
Table 35The deferred tax asset is recognized and supported, on the
Consolidated financial statements 2016

48
basis that the Group has generating positive taxable inco-me, and it is projected to generate future income sufficient to compensate tax credits and tax losses, from previous pe-riods, prior to maturity, and obtain future tax benefits, for goodwill tax in Chile, employee benefits, as well as, items recognized in the deferred tax assets. Projections of annual taxable income and actual data, are reviewed to determine the impact and adjustments, on asset values, and their reco-verability in future periods.
The deferred tax liability, on intangibles, relates mainly to brands and goodwill. In the year 2016 Grupo Nutresa, recognized the deferred tax liability, associated with good-will for $92.155, of which $4.273, were the result of the year in 2016, and $ 87.882 was credited directly to equity, in the respective accounts.
In the process of consolidation at year-end 2016, a di-fference identified in the interpretation rules of deferred goodwill taxes, of which are not eliminated in the process of
consolidation, due to the fact the Separate Financial State-ments the goodwill is part of the cost of permanent invest-ments, in accordance with IAS 12. It is important to highlight that this impact was recognized in the Consolidated Financial Statements, as was in the opening balance of First-time adop-tion.
The application of the definitions, established in IAS 8 - Materiality and Relative Importance, the Management of the Group considered that this difference in the rules interpreta-tion does not constitute a material difference, that could in-fluence the economic decisions made by users of the Financial Statements in 2015, they were the first Financial Statements under International Financial Reporting Standards, in Colom-bia. Additionally, it is important to note that in Colombia, and according to Article 34 of Law 222 and Article 150, of the Code of Commerce, which regulates the distribution of dividends, it is stipulated that such distribution is not performed in the Consolidated Financial Statements.
Deferred tax liabilities
Other reserves
Opening balance January 1, 2014 - -
Initial recognition of deferred goodwill tax 62.342 62.342
Opening balance January 1, 2014, adjusted 62.342 62.342
Tax deferred recognition of goodwill, payable 2014 14.505 14.505
Balance at December 31, 2014, adjusted 76.847 76.847
Tax deferred recognition of goodwill, payable 2015 11.035 11.035
Balance at December 31, 2015 adjusted 87.882 87.882
Table 36
The movement of deferred tax during the period was as follows:
2016 2015
Opening balance, net deferred tax liabilities 372.231 250.776
Deferred tax expenses, recognized in income for the period (29.533) (16.421)
Income tax relating to items, credited directly to equity - 11.035
Income tax relating to components, of other comprehensive income (5.742) (2.791)
Increase for business combinations - 121.059
Impact of variation in rates of foreign exchange 11.750 4.261
Other impact - 4.312
Opening balance, net deferred tax liabilities 348.706 372.231
Table 37

49
The temporary differences associated with investments in subsidiaries, associates, and interests in joint ventu-res, for which were not recognized deferred tax liabilities, are $6.597.239 (2016) and $6.498.528 (2015), said defe-rred tax liability, would be from $2.204.150 (2016) and $ 2.177.091 (2015).
The income tax relating to components of other compre-hensive income, is determined by new measurements of bene-fit plans to employees of $(5.419) (2015 - $2.297), the partici-pation in associates and joint ventures, accounted for by using the Equity Method, in the amount of $(176) (2015 - $0), and that related to changes in the fair value of financial liabilities in the amount of $(147) (2015 - $(5.088).
18.5 EFFECTIVE TAX RATESThe effective tax rate differs from the theoretical rate by the effect produced by applying the tax rules. As part of tax re-gulations, benefits such as: untaxed income (e.g. dividends,
research incentives, et al.); additionally, there are tax deduc-tions restricted, such as in the case of taxation of the finan-cial movement, that is deductible only in Colombia at 50%, non-deductibility of tax, provisions, costs, and expenses, from previous years, fines, sanctions, et al. Legal entity stability contracts, signed by six companies of the Group, allows legal security and effective legal entity tax planning, without sur-taxes of tax burdens; within these contracts, the allowance of deduction of major real productive investment expenses in fixed-assets, investments in science and technology, dona-tions, fiscal amortization of the goodwill are permitted, as well as the application of depreciation and amortization, different to those that the accounting standard establishes. All these special treatments, results in a difference between the effec-tive rate and the deferred tax, with respect to the theoretical rate in each country.
The following is the reconciliation of the applicable tax rate and the effective tax rate:
2016 2015 Value % Value %Accounting profit 544.868 604.294Applicable tax rate expenses 191.845 35,21 211.986 35,08Portfolio of untaxed dividends (19.493) (3,58) (17.476) (2,89)Unrealized untaxed financial instruments 2.506 0,46 (3.916) (0,65)Other untaxed accounting income (12.580) (2,31) (7.176) (1,19)Non-deductible tax expense (3.890) (0,71) 6.407 1,06Non-deductible tax to financial transactions 3.847 0,71 3.193 0,53Provision portfolio 3.980 0,73 40 0,01Depreciation 3.725 0,68 6.988 1,16Other non-deductible expenses accounting 13.658 2,51 43.876 7,26Tax liquidity for deductions recovery 6.800 1,25 1.407 0,23Other tax income 3.218 0,59 14.275 2,36Amortization (7.807) (1,43) (13.857) (2,29)Special deductions for productive fixed-assets (11.864) (2,18) (17.332) (2,87)Compensation of excess presumptive income and losses (1.200) (0,22) (593) (0,10)Other tax deductions (3.302) (0,61) (36.875) (6,10)Other tax impact (26.110) (4,79) (23.807) (3,94)Total tax expenses 143.333 26,31 167.140 27,66
Table 38
The income tax expense is calculated using the weighted ave-rage tax rates, applicable in each of the countries where it Grupo Nutresa operates.
The effective tax rate decreases due to the deferred tax, composed primarily by the changes in rates of income tax and surtax, established in Law 1819 of 2016, unrealized financial instruments, tax credits, and differences in the bases of ac-countable and taxable depreciation, that constitute a future fiscal benefit.
In addition, the effective rate is impacted in applying rules established in legal entity stability contracts, that allow special
deductions and constant tax rates, by the presence of the Group, in free zone with a differential income rate, non-de-ductible expenses, treated as non-temporary differences, and based on presumptive income tax.
18.6 PRESUMPTIVE INCOME TAX EXCESS AND LOSSES At December 31, 2016, the tax losses of the Company’s sub-sidiaries amounted to $393.592 (2015 - $ 339.567). As of the expedition of Law 1819 of 2016, the compensation of tax losses in Colombia is limited to 12 taxable periods, following the year
Consolidated financial statements 2016
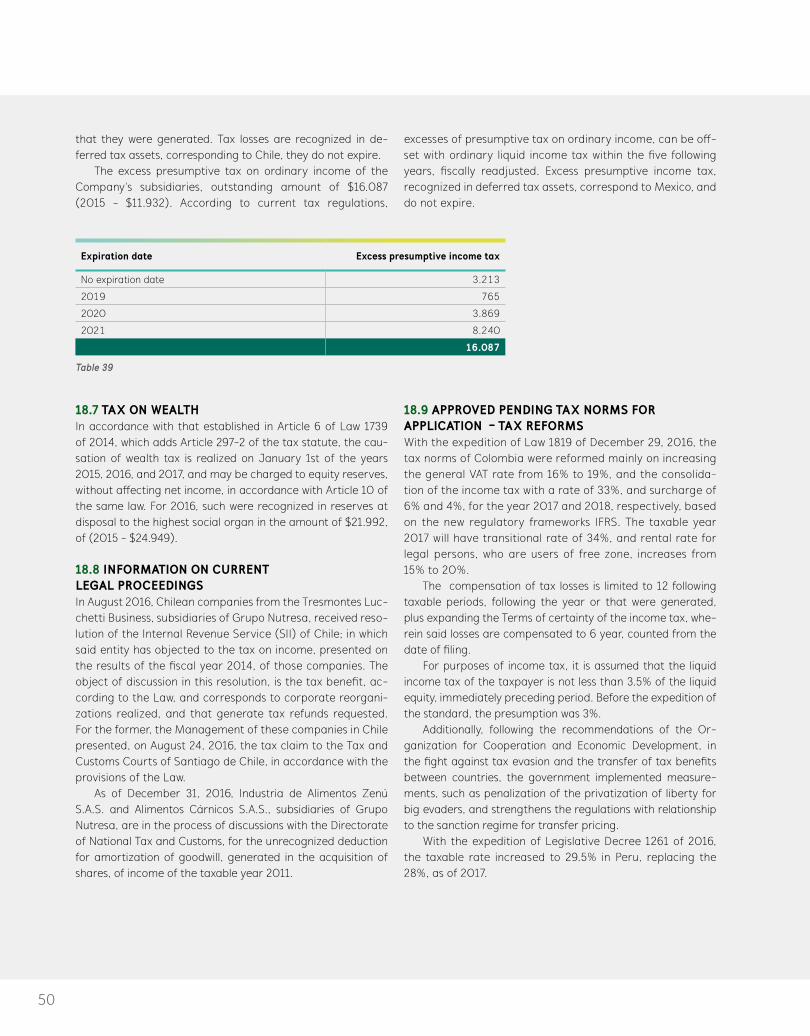
50
that they were generated. Tax losses are recognized in de-ferred tax assets, corresponding to Chile, they do not expire.
The excess presumptive tax on ordinary income of the Company’s subsidiaries, outstanding amount of $16.087 (2015 - $11.932). According to current tax regulations,
excesses of presumptive tax on ordinary income, can be off-set with ordinary liquid income tax within the five following years, fiscally readjusted. Excess presumptive income tax, recognized in deferred tax assets, correspond to Mexico, and do not expire.
Expiration date Excess presumptive income tax
No expiration date 3.213
2019 765
2020 3.869
2021 8.240
16.087
Table 39
18.7 TAX ON WEALTHIn accordance with that established in Article 6 of Law 1739 of 2014, which adds Article 297-2 of the tax statute, the cau-sation of wealth tax is realized on January 1st of the years 2015, 2016, and 2017, and may be charged to equity reserves, without affecting net income, in accordance with Article 10 of the same law. For 2016, such were recognized in reserves at disposal to the highest social organ in the amount of $21.992, of (2015 - $24.949).
18.8 INFORMATION ON CURRENT LEGAL PROCEEDINGSIn August 2016, Chilean companies from the Tresmontes Luc-chetti Business, subsidiaries of Grupo Nutresa, received reso-lution of the Internal Revenue Service (SII) of Chile; in which said entity has objected to the tax on income, presented on the results of the fiscal year 2014, of those companies. The object of discussion in this resolution, is the tax benefit, ac-cording to the Law, and corresponds to corporate reorgani-zations realized, and that generate tax refunds requested. For the former, the Management of these companies in Chile presented, on August 24, 2016, the tax claim to the Tax and Customs Courts of Santiago de Chile, in accordance with the provisions of the Law.
As of December 31, 2016, Industria de Alimentos Zenú S.A.S. and Alimentos Cárnicos S.A.S., subsidiaries of Grupo Nutresa, are in the process of discussions with the Directorate of National Tax and Customs, for the unrecognized deduction for amortization of goodwill, generated in the acquisition of shares, of income of the taxable year 2011.
18.9 APPROVED PENDING TAX NORMS FOR APPLICATION - TAX REFORMSWith the expedition of Law 1819 of December 29, 2016, the tax norms of Colombia were reformed mainly on increasing the general VAT rate from 16% to 19%, and the consolida-tion of the income tax with a rate of 33%, and surcharge of 6% and 4%, for the year 2017 and 2018, respectively, based on the new regulatory frameworks IFRS. The taxable year 2017 will have transitional rate of 34%, and rental rate for legal persons, who are users of free zone, increases from 15% to 20%.
The compensation of tax losses is limited to 12 following taxable periods, following the year or that were generated, plus expanding the Terms of certainty of the income tax, whe-rein said losses are compensated to 6 year, counted from the date of filing.
For purposes of income tax, it is assumed that the liquid income tax of the taxpayer is not less than 3.5% of the liquid equity, immediately preceding period. Before the expedition of the standard, the presumption was 3%.
Additionally, following the recommendations of the Or-ganization for Cooperation and Economic Development, in the fight against tax evasion and the transfer of tax benefits between countries, the government implemented measure-ments, such as penalization of the privatization of liberty for big evaders, and strengthens the regulations with relationship to the sanction regime for transfer pricing.
With the expedition of Legislative Decree 1261 of 2016, the taxable rate increased to 29.5% in Peru, replacing the 28%, as of 2017.
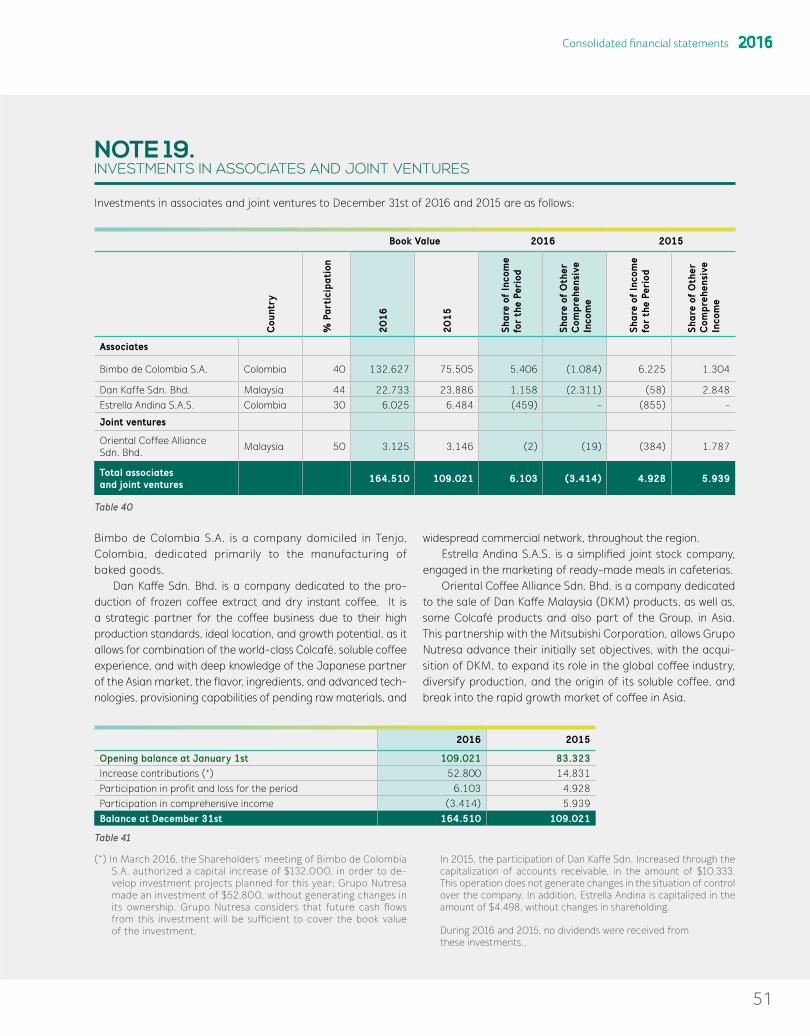
51
NOTE 19. INVESTMENTS IN ASSOCIATES AND JOINT VENTURES
Investments in associates and joint ventures to December 31st of 2016 and 2015 are as follows:
Book Value 2016 2015
Cou
ntry
% P
arti
cipa
tion
20
16
20
15
Shar
e of
Inco
me
for
the
Peri
od
Shar
e of
Oth
er
Com
preh
ensi
ve
Inco
me
Shar
e of
Inco
me
for
the
Peri
od
Shar
e of
Oth
er
Com
preh
ensi
ve
Inco
me
Associates
Bimbo de Colombia S.A. Colombia 40 132.627 75.505 5.406 (1.084) 6.225 1.304
Dan Kaffe Sdn. Bhd. Malaysia 44 22.733 23.886 1.158 (2.311) (58) 2.848 Estrella Andina S.A.S. Colombia 30 6.025 6.484 (459) - (855) -
Joint ventures
Oriental Coffee Alliance Sdn. Bhd. Malaysia 50 3.125 3.146 (2) (19) (384) 1.787
Total associates and joint ventures 164.510 109.021 6.103 (3.414) 4.928 5.939
Table 40
Bimbo de Colombia S.A. is a company domiciled in Tenjo, Colombia, dedicated primarily to the manufacturing of baked goods.
Dan Kaffe Sdn. Bhd. is a company dedicated to the pro-duction of frozen coffee extract and dry instant coffee. It is a strategic partner for the coffee business due to their high production standards, ideal location, and growth potential, as it allows for combination of the world-class Colcafé, soluble coffee experience, and with deep knowledge of the Japanese partner of the Asian market, the flavor, ingredients, and advanced tech-nologies, provisioning capabilities of pending raw materials, and
widespread commercial network, throughout the region.Estrella Andina S.A.S. is a simplified joint stock company,
engaged in the marketing of ready-made meals in cafeterias. Oriental Coffee Alliance Sdn. Bhd. is a company dedicated
to the sale of Dan Kaffe Malaysia (DKM) products, as well as, some Colcafé products and also part of the Group, in Asia. This partnership with the Mitsubishi Corporation, allows Grupo Nutresa advance their initially set objectives, with the acqui-sition of DKM, to expand its role in the global coffee industry, diversify production, and the origin of its soluble coffee, and break into the rapid growth market of coffee in Asia.
2016 2015
Opening balance at January 1st 109.021 83.323 Increase contributions (*) 52.800 14.831 Participation in profit and loss for the period 6.103 4.928Participation in comprehensive income (3.414) 5.939Balance at December 31st 164.510 109.021
Table 41
(*) In March 2016, the Shareholders’ meeting of Bimbo de Colombia S.A. authorized a capital increase of $132.000, in order to de-velop investment projects planned for this year; Grupo Nutresa made an investment of $52.800, without generating changes in its ownership. Grupo Nutresa considers that future cash flows from this investment will be sufficient to cover the book value of the investment.
In 2015, the participation of Dan Kaffe Sdn. Increased through the capitalization of accounts receivable, in the amount of $10.333. This operation does not generate changes in the situation of control over the company. In addition, Estrella Andina is capitalized in the amount of $4.498, without changes in shareholding.
During 2016 and 2015, no dividends were received from these investments..
Consolidated financial statements 2016

52
The following is a summary of financial information of associates and joint ventures
2016 2015
Ass
ets
Liab
iliti
es
Equi
ty
Prof
it a
nd L
oss
Tota
l C
ompr
ehen
sive
In
com
e fo
r th
e Pe
riod
Ass
ets
Liab
iliti
es
Equi
ty
Prof
it a
nd L
oss
Tota
l C
ompr
ehen
sive
In
com
e fo
r
the
Peri
od
Associates
Bimbo de Colombia S.A. 511.912 218.613 293.299 13.516 (876) 409.084 221.261 187.823 (15.564) 3.130
Dan Kaffe Sdn. Bhd 70.726 16.054 54.672 2.533 (1.185) 71.754 18.089 53.665 (148) -
Estrella Andina S.A.S. 22.880 2.964 19.916 (1.531) - 23.130 1.439 21.691 (2.849) -
Joint Ventures
Oriental Coffee Alliance Sdn. Bhd 4.079 1.063 3.016 (5) - 3.477 150 3.327 (1.228) -
Table 42
None of the associates and joint ventures, held by the Group are listed on a stock market, and consequently, there are no quoted market prices for the investment.
NOTE 20. OTHER NON-CURRENT FINANCIAL ASSETS
Grupo Nutresa classifies portfolio investments that are not held for trading, as financial instruments measured at fair
value, through “other comprehensive income”. The results for the period include income from divi-
dends on said instruments, and are recognized, by Nutre-sa, on the date that the right to receive future payments is established, which is the date of declaration of dividends by the issuing company. The “Other comprehensive inco-me” includes changes in the fair value of these financial instruments.
The breakdown of financial instruments is as follows:
Book Value Number of Shares Held
Participation as % in Total Ordinary Shares December 2016 December 2015
Grupo de Inversiones Suramericana S.A. 59.387.803 12,66 2.268.614 2.120.145
Grupo Argos S.A. 79.804.628 12,36 1.538.633 1.292.835
Other Companies 77.959 5.169
3.885.206 3.418.149
Table 43
2016 2015
DividendIncome
Loss on Fair Value Measurement Divident Income Profit on Fair Value
Measurement
Grupo de Inversiones Suramericana S.A. 27.081 148.470 25.062 (255.367)
Grupo Argos S.A. 22.904 245.798 21.388 (343.160)
Other Companies 560 755 566 (755)
50.545 395.023 47.016 (599.282)
Table 44

53
At December 31, 2016, accounts receivable from dividends of financial instruments are in the amount of $12.496 (2015 - $11.612).
At December 31, 2016, there were pledges for 36.875.000 (2015 - 26.000.000) shares of Grupo de In-versiones Suramericana S.A., in favor of financial entities in Colombia, as collateral for obligations contracted by Grupo Nutresa and its subsidiaries.
20.1 CHANGES IN THE CLASSIFICATION OF AN INVESTMENT Grupo Nutresa operates in Venezuela, since 1995, across two 100% subsidiaries, called Industrias Alimenticias Hermo de Venezuela S.A. and Cordialsa Noel Venezuela S.A.; the first of these is dedicated to the production and sale of food cold cuts, and the second, to the marketing in that country, of the
products manufactured by Grupo Nutresa, and the manage-ment of investments in real estate.
Venezuela is considered a hyperinflationary economy, sin-ce 2009, reason why it is recognized in Consolidated Equity of Grupo Nutresa, reserves due to hyperinflation $396.367 (2015 - $329.130). Until September 30, 2016, assets, liabilities, and profit and loss of the operation in Venezuela, is included in the Consolidated Financial Statements, after homologizing the accounting policies to those of the Parent Company, and translating the Financial Statements of Venezuelan Bolivars to Colombian Pesos at a rate of 657,55 VEF/USD (4,38 pesos per Bolivars) pesos.
The following is a summary of the assets and liabilities co-rresponding to the companies in Venezuela, included in the Consolidated Financial Statements of Grupo Nutresa Septem-ber 30, 2016 is as follows:
September 2016
Total assets 84.768
Total liabilities (30.775)
Equity, net (53.993)
Table 45
In the accumulated, at September 30, 2016, the results of the operation in Venezuela, accounted for 2.93% of consolidated net sales, and 2.96% of EBITDA. Following the summary of these results is as follows:
January - September 2016
Total operating income 187.828
Gross Profit 49.447
Administrative, sales, and production expenses (24.984)
Other operating income (expenses), net 12.279
Operating income 36.742
NET LOSSES (2.819)
EBITDA 23.745
Table 46
The changing conditions in the Venezuelan market, including regulations in the exchange market, and limited of the purcha-se of currency, through official systems, together with other government controls, such as price controls and profitability, imports, and labor laws, et al., limits the ability of the com-pany to maintain a normal level of production, it decreases the ability of the Management to take and implement opera-tional decisions, restricts the ability to access liquidity resulting from such operations, and the realization of these benefits to investors in other countries through the payment of dividends. The Management of Grupo Nutresa considers that this situa-tion will hold-fast, in the foreseeable future, and therefore, sets up a loss of control in the investment, that is had in these
company, as established in IFRS 10. As of October 1, 2016, these investments were classified as financial instruments, and were measured under IFRS 9, classified under “measurement at fair value, with impact to profit and loss”. Accordingly, finan-cial results in future periods, include income, only to the extent that dividends are distributed to shareholders, or expenses, in cases where this is an impairment in value.
The estimate of the fair value of Industrias Alimenticias Hermo de Venezuela S.A., at the time of the change in the situation of control, realized, using the discounted cash flows Method, including estimates of the exchange rate and the discount rate, which reflects inflation and the uncertainty of the economy in Venezuela, which did not generate significant
Consolidated financial statements 2016

54
impacts on the consolidated of Grupo Nutresa. This media-tion is considered non-recurring and is classified at Level 3, in accordance with the fair value hierarchy of IFRS 13.
For Cordialsa Noel Venezuela S. A., the estimate of fair value is realized, using independent experts for valuation of real estate, which the company owns in Venezuela, using the methods market value, which is obtained from the re-search conducted in sub-alternate records, patented in the
purchase and sale of similar properties in use, located in the same area or nearby, in a period of prudently short-term, with respect to the date of assessment, a measurement that generated a profit of $16.971.
This accounting classification does not compromise the production and commercial operation of Grupo Nutresa in Venezuela, its staff, nor their relationships with customers and suppliers.
NOTE 21. FINANCIAL OBLIGATIONS
21.1 FINANCIAL LIABILITIES AT AMORTIZED COSTFinancial obligations held by Grupo Nutresa are classified as measured, by using the amortized cost method, and are based on the Group’s Business Model. Book values, at the end of the reporting period, are as follows:
2016 2015
Loans 2.692.845 2.537.306
Bonds 375.491 510.924
Leases (Note 26.1.1) 14.840 18.712
Gross debt 3.083.176 3.066.942
Accrued interest and others 41.942 27.322
Total 3.125.118 3.094.264
Current 847.689 1.059.660
Non-current 2.277.429 2.034.604
Table 47
At December 2015, the financial obligations, mainly loans, taken out by Colombian companies in dollars, incorporates ad-justments to the amortized cost, in the amount of $7.896, as a result of the measurement at fair value of hedging exchan-ge rates, as described in Note 21.6, henceforth. At December 2016, there are no derivative transactions, classified as hed-ges, on financial obligations.
21.2 BONDSGrupo Nutresa generated issuance of two bonds:
• In July 2008, Compañía Nacional de Chocolates de Peru S.A. issued corporate bonds with Grupo Nutresa, serving as guarantor. The issuance was executed in the amount of $118.520.000 Sols, with a maturity date of 10 years (2018), at a fixed interest 8,84% E.A., payable in arrears
and amortized at maturity. In 2016, expenses attributable to interest in the amounts of $9.282 (2015 – $9.009) were recorded. The balance of this obligation in pesos at Decem-ber 2016 is $105.923 (2015 - $109.465).
• In August 2009, an issue of corporate bonds took place in Colombia, through Fideicomiso Grupo Nutresa, which is managed by Alianza Fiduciaria S.A., the issuance was realized in the amount of $500.000, maturing in four coupons at 5, 7, 10, and 12 years, with interest payable quarterly, in arrears, and amortized to maturity of each coupon. In 2016, there were interest expenses in the amount of $44.889 (2015 - $38.223). The emission has a balance at December 2016, including accrued interest in the amount of $273.171(2015 - 406.396), and has the following characteristics:
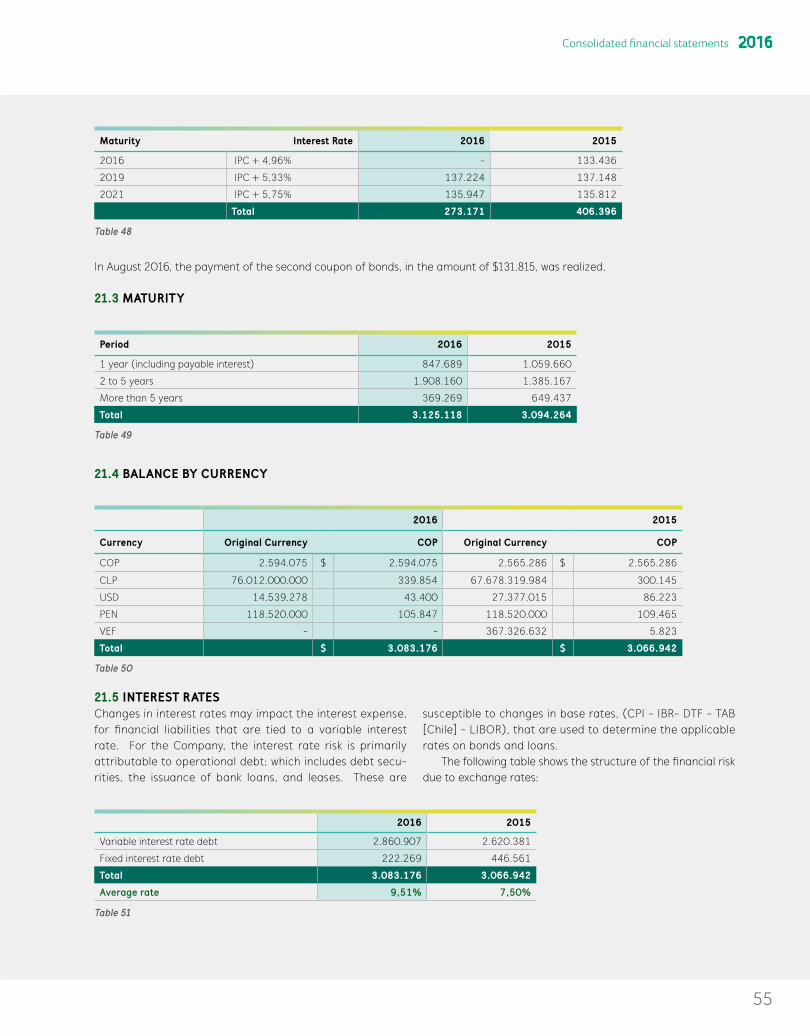
55
Maturity Interest Rate 2016 2015
2016 IPC + 4,96% - 133.436
2019 IPC + 5,33% 137.224 137.148
2021 IPC + 5,75% 135.947 135.812
Total 273.171 406.396
Table 48
In August 2016, the payment of the second coupon of bonds, in the amount of $131.815, was realized.
21.3 MATURITY
Period 2016 2015
1 year (including payable interest) 847.689 1.059.660
2 to 5 years 1.908.160 1.385.167
More than 5 years 369.269 649.437
Total 3.125.118 3.094.264
Table 49
21.4 BALANCE BY CURRENCY
2016 2015
Currency Original Currency COP Original Currency COP
COP 2.594.075 $ 2.594.075 2.565.286 $ 2.565.286
CLP 76.012.000.000 339.854 67.678.319.984 300.145
USD 14.539.278 43.400 27.377.015 86.223
PEN 118.520.000 105.847 118.520.000 109.465
VEF - - 367.326.632 5.823
Total $ 3.083.176 $ 3.066.942
Table 50
21.5 INTEREST RATESChanges in interest rates may impact the interest expense, for financial liabilities that are tied to a variable interest rate. For the Company, the interest rate risk is primarily attributable to operational debt; which includes debt secu-rities, the issuance of bank loans, and leases. These are
susceptible to changes in base rates, (CPI - IBR- DTF - TAB [Chile] - LIBOR), that are used to determine the applicable rates on bonds and loans.
The following table shows the structure of the financial risk due to exchange rates:
2016 2015
Variable interest rate debt 2.860.907 2.620.381
Fixed interest rate debt 222.269 446.561
Total 3.083.176 3.066.942
Average rate 9,51% 7,50%
Table 51
Consolidated financial statements 2016
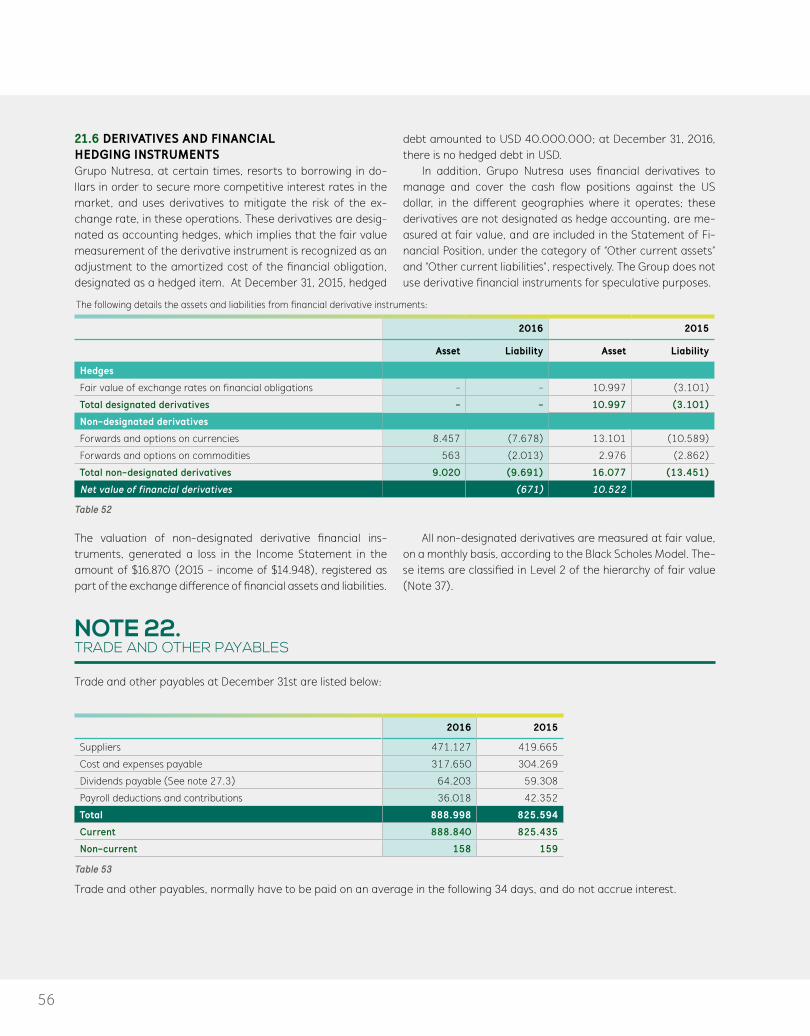
56
21.6 DERIVATIVES AND FINANCIAL HEDGING INSTRUMENTS Grupo Nutresa, at certain times, resorts to borrowing in do-llars in order to secure more competitive interest rates in the market, and uses derivatives to mitigate the risk of the ex-change rate, in these operations. These derivatives are desig-nated as accounting hedges, which implies that the fair value measurement of the derivative instrument is recognized as an adjustment to the amortized cost of the financial obligation, designated as a hedged item. At December 31, 2015, hedged
debt amounted to USD 40.000.000; at December 31, 2016, there is no hedged debt in USD.
In addition, Grupo Nutresa uses financial derivatives to manage and cover the cash flow positions against the US dollar, in the different geographies where it operates; these derivatives are not designated as hedge accounting, are me-asured at fair value, and are included in the Statement of Fi-nancial Position, under the category of “Other current assets” and “Other current liabilities”, respectively. The Group does not use derivative financial instruments for speculative purposes.
2016 2015
Asset Liability Asset Liability
Hedges
Fair value of exchange rates on financial obligations - - 10.997 (3.101)
Total designated derivatives - - 10.997 (3.101)
Non-designated derivatives
Forwards and options on currencies 8.457 (7.678) 13.101 (10.589)
Forwards and options on commodities 563 (2.013) 2.976 (2.862)
Total non-designated derivatives 9.020 (9.691) 16.077 (13.451)
Net value of financial derivatives (671) 10.522
Table 52
The valuation of non-designated derivative financial ins-truments, generated a loss in the Income Statement in the amount of $16.870 (2015 - income of $14.948), registered as part of the exchange difference of financial assets and liabilities.
All non-designated derivatives are measured at fair value, on a monthly basis, according to the Black Scholes Model. The-se items are classified in Level 2 of the hierarchy of fair value (Note 37).
NOTE 22. TRADE AND OTHER PAYABLES
Trade and other payables at December 31st are listed below:
2016 2015
Suppliers 471.127 419.665
Cost and expenses payable 317.650 304.269
Dividends payable (See note 27.3) 64.203 59.308
Payroll deductions and contributions 36.018 42.352
Total 888.998 825.594
Current 888.840 825.435
Non-current 158 159
Table 53
Trade and other payables, normally have to be paid on an average in the following 34 days, and do not accrue interest.
The following details the assets and liabilities from financial derivative instruments:

57
NOTE 23. EMPLOYEE BENEFITS LIABILITIES
The balance of liabilities due to employee benefits at December 31st of 2016 and 2015 is as follows:
2016 2015
Short-term benefits 86.056 128.212
Post-Employment benefits 168.640 144.714
Defined contribution plans 31.955 29.340
Defined benefit plans 136.685 115.374
Other long-term benefits (Note 23.2) 123.640 99.235
Total liabilities for employee benefits 378.336 372.161
Current 161.592 160.628
Non-current 216.744 211.533
Table 54
23.1 PENSIONS AND OTHER POST-EMPLOYMENT BENEFITSApplicable regulations:
Colombia:Defined Contributions: Severance: The Colombian Government allowed companies which, subject to approval of its employees, transfer their obligation to severance benefits of private pension funds. The severance of all worker with labor contracts, after en-try into force of Law 50 of 1990, and former workers, who benefited from this system, are accounted for as a defined contribution plan.
Defined benefits:Pensions: Grupo Nutresa has beneficiaries from the defined pension plan benefits, according to legal regulations (Former Model of Regime for defined pension payouts). There are no current employees, who can access this benefit.
Severance: According to Colombian labor laws, employees hi-red before the entry into force of Law 50 of 1990, are entitled to receive one month’s salary, in effect for each year or ser-vices, and proportionally, a fraction of year or as aid of seve-rance, for any reason the end of employment, including: reti-rement, disability, death, el al. The benefit is liquidated, at the time of retirement of an employee, based on the last salary earned. There may be distributions before the date of retire-ment, at the request of the worker, which are not compulsory distributable. Severance is retroactive settled for of 668 wor-kers belonging to the labor force, before the Law 50 of 1990.
Ecuador: Employer retirement: Plan un-funded defined benefit. The le-gal basis for this benefit is typified in the Ecuadorian Labor Code, Chapter XI, Paragraph 3rd; Articles 216 to 219. The monthly annuity payment is required, taking in option to deli-ver a global fund, equivalent of the basis of a duly substantia-ted, and used to cover compliance, and additional determined by law, so that the same worker can administer, this capital on their own. Workers, who for twenty-five years or more have rendered services, continued or un-interruptedly, have a right to be retired by their employers.
Bonus of dismissal: Plan un-funded defined benefit. The legal basis for this benefit is typified in the Ecuadorian Labor Code, Chapter X; Articles 184 to 186. Dismissal is written notice that a working person, does the employer know, that his will is to terminate the employment contract, including by electronic means. The benefit payment is required, even in cases where the employment relationship is terminated by an agreement, between the parties. Also, the bonus of eviction will be paid, in all cases in which labor relations were completed, in accordan-ce with Number 2 of Article 169, of the Labor Code.
Chile: Only indemnifications, that are entitled, and which are esta-blished in the collective and individual contracts, are recorded and provided for. These are due to death, voluntary resigna-tion, due to a serious and personal illness, and personnel that are entitled to all events.
A reconciliation of the movements, of the defined benefit plans, is as follows:
Consolidated financial statements 2016

58
Pensions Retroactive severance
Other defined benefit plans TOTAL
2016 2015 2016 2015 2016 2015 2016 2015
Present value of obligations at January 1st 49.433 47.456 15.666 21.483 50.275 50.228 115.374 119.167
(+) Cost of services 2.088 2.189 531 707 3.196 191 5.815 3.087
(+) Interest expenses 3.073 2.893 1.336 1.210 4.189 2.785 8.598 6.888
(+/-) Actuarial losses and/or gains 4.102 (551) 5.652 (3.122) 7.636 (3.054) 17.390 (6.727)
(+/-) Other movements (293) - - - 2.463 - 2.170 -
(-) Payments (6.308) (5.697) (4.534) (4.612) (600) (367) (11.442) (10.676)
(+/-) Difference in exchange rate (315) 3.143 - - (905) 492 (1.220) 3.635
Present value of obligations at December 31st 51.780 49.433 18.651 15.666 66.254 50.275 136.685 115.374
Table 55
Actuarial gains and losses are recognized in the Income State-ment, under other comprehensive income.
The Group registered defined contribution plans, for pen-sions, during the period of $ 69.225 million (2015: $ 61.935 million); and severance, during the period, in the amount of $ 41.754 million (2015: $28.127 million).
The undiscounted estimated for payments for defined be-nefits, over the next five years, are as follows, for the Group:
Year of expiration Future value
2017 7.060
2018 18.815
2019 20.239
2020 8.670
2021 9.729
Total 64.513
Table 56
23.2 OTHER LONG-TERM BENEFITS The long-term benefits include primarily, Seniority Pre-
miums and superior achievements.The following is the reconciliation of movements of other
long-term employee benefits:
Seniority Premium Other Long-term Benefits Total
2016 2015 2016 2015 2016 2015
Present value of obligations at January 1st 62.865 62.342 36.370 30.973 99.235 93.315
(+) Cost of service 6.115 6.895 22.486 15.378 28.601 22.273
(+/-) Interest income or (expense) 5.235 3.841 2.588 1.856 7.823 5.697
(+/-) Actuarial gains or losses (1.570) (5.207) (1.832) (689) (3.402) (5.896)
(-) Payments (1.150) - 38.415 - 37.265 -
(+) Business combinations (8.387) (5.766) (37.083) (11.093) (45.470) (16.859)
(+/-) Other movements - 646 - - - 646
(+/-) Exchange rate differences (33) 114 (379) (55) (412) 59
Present value of obligation at December 31st 63.075 62.865 60.565 36.370 123.640 99.235
Table 57

59
23.3 EXPENSES FOR EMPLOYEE BENEFITS The amounts recognized as expenses for employee benefits were:
2016 2015
Short-term benefits 1.270.140 1.198.896
Post-employment benefits 116.794 93.150
Defined contribution plans 110.979 90.063
Defined benefit plans 5.815 3.087
Other long-term employee benefits 25.199 16.378
Termination benefits 11.996 11.735
Total 1.424.129 1.320.159
Table 58
23.4 ACTUARIAL ASSUMPTIONSThe main actuarial assumptions used in the actuarial measurement of the defined and long-term plans are:
2016 2015
Discount rates 6,11% - 12% 6,31% - 8,81%
Salary increase rates 3% - 7% 3% - 6,7%
Employee turn-over rates 1% - 23% 2,54%
Table 59
23.5 SENSITIVITY ANALYSISA quantitative analysis of sensitivity to a change in a significant key assumption, as of December 31, 2016, would generate the following impact on the obligation for defined benefits, as well as, long-term:
Pensions Retroactive severance
Seniority premiums
Discount rate + 1% (2.298) (891) (4.065)
Discount rate -1% 2.772 967 4.586
Salary increase rate + 1% 2.683 2.584 4.089
Salary increase rate -1% (2.254) (2.434) (3.684)
Table 60
In Resolution 1555 of 2010, the mortality rates for men and women, are found.
Wage increase rates were determined, based on the ma-croeconomic variables of each country.
There were no changes, in the methods and assumptions, used for the preparation of the analysis of sensitivity, in previous years.
Consolidated financial statements 2016
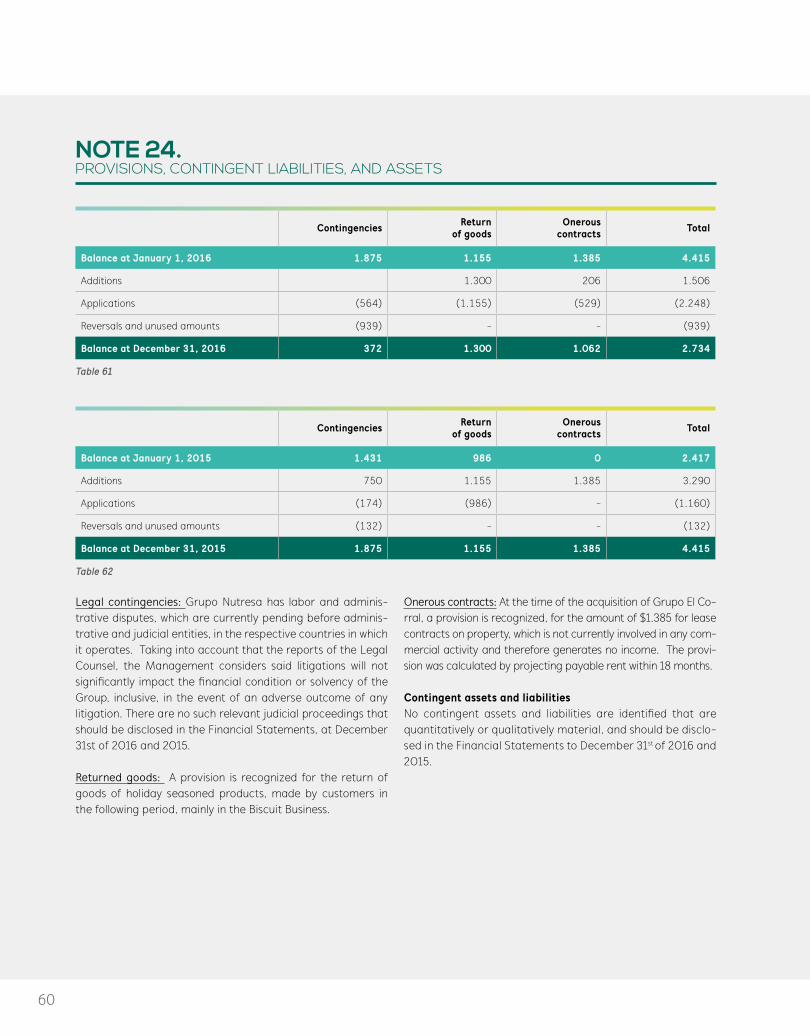
60
NOTE 24. PROVISIONS, CONTINGENT LIABILITIES, AND ASSETS
Contingencies Return of goods
Onerous contracts Total
Balance at January 1, 2016 1.875 1.155 1.385 4.415
Additions 1.300 206 1.506
Applications (564) (1.155) (529) (2.248)
Reversals and unused amounts (939) - - (939)
Balance at December 31, 2016 372 1.300 1.062 2.734
Table 61
Contingencies Return of goods
Onerous contracts Total
Balance at January 1, 2015 1.431 986 0 2.417
Additions 750 1.155 1.385 3.290
Applications (174) (986) - (1.160)
Reversals and unused amounts (132) - - (132)
Balance at December 31, 2015 1.875 1.155 1.385 4.415
Table 62
Legal contingencies: Grupo Nutresa has labor and adminis-trative disputes, which are currently pending before adminis-trative and judicial entities, in the respective countries in which it operates. Taking into account that the reports of the Legal Counsel, the Management considers said litigations will not significantly impact the financial condition or solvency of the Group, inclusive, in the event of an adverse outcome of any litigation. There are no such relevant judicial proceedings that should be disclosed in the Financial Statements, at December 31st of 2016 and 2015.
Returned goods: A provision is recognized for the return of goods of holiday seasoned products, made by customers in the following period, mainly in the Biscuit Business.
Onerous contracts: At the time of the acquisition of Grupo El Co-rral, a provision is recognized, for the amount of $1.385 for lease contracts on property, which is not currently involved in any com-mercial activity and therefore generates no income. The provi-sion was calculated by projecting payable rent within 18 months.
Contingent assets and liabilities No contingent assets and liabilities are identified that are quantitatively or qualitatively material, and should be disclo-sed in the Financial Statements to December 31st of 2016 and 2015.

61
NOTE 25. OTHER LIABILITIES
2016 2015
Derivative financial instruments (See Note 21.6) 9.691 13.451
Pre-payments and advances received (*) 35.104 8.443
Other 5.551 4.747
Total other liabilities 50.346 26.641
Current 49.746 26.641
Non-current 600 -
Table 63
(*) Corresponds primarily to income and advances received from in-demnifications from lost income and consequential damage claims,
caused by accidents, presented in April 2016, from the Cold Cuts plant in Bogota (Fontibón).
NOTE 26. LEASES
26.1 GRUPO NUTRESA AS LESSEEThe Group leases mainly computer equipment, vehicles, buil-dings for storage, offices, and commercial stores; these con-tracts have been evaluated on the basis of the terms and con-ditions of the agreements, the lease term, the economic life of the asset, among others, to assess the substantial transfer of risks and benefits, of the ownership of these assets.
26.1.1 FINANCIAL LEASESThe amount of property, plant and equipment in financial lea-ses totaled $20.349 at December 31, 2016 (2015 - $21.391). The financial liabilities for these leases amounted to $14.840 (2015 - $18.712).
Future minimum payments for leases, under these contracts, and the present value of the minimum payments are as follows:
2016
Up to 1 year 4.1542 to 5 years 9.756More than 5 years 8.359Total of payments 22.269Minus finance charges 7.429Present value 14.840
Table 64
The Group maintains 94 financial leases and leases with option to buy, related to various components of property, plant and equipment. Each leasing contract has particular clauses, for each particular contract, which sets rates, ranging from DTF + 2,23%, and average length is between 1 and 13 years.
26.1.2 OPERATING LEASESThe Group has entered into operating leases on land,
building, production equipment machinery, transportation equipment and computer equipment, which have average terms of 5 years.
To December 31, 2016 operating lease expenses were $196.591 (2015 - $229.342), mainly generated from property leases, which were used for the normal operation of the company.
The minimum payments for operating leases, under “non-cancellable” contract, at December 31st are as follows:
2016
Up to 1 year 134.794 From 2 to 5 years 429.940 More than 5 years 445.481 Total of payments 1.010.215
Table 65
26.2 GRUPO NUTRESA AS LESSORGrupo Nutresa has properties under operating leases, (prima-rily buildings) with a book value of $5.938 (2015 – 16.489), upon which income of $1.158 (2015 - $1.611), with a duration period between 1 to 10 years.
The total amount of future minimum non-cancelable ope-rating lease payments at December 31st, are as follows:
2016
Up to 1 year 1.430
From 2 to 5 years 5.795
More than 5 years 6.345
Total of payments 13.570
Table 66
Consolidated financial statements 2016

62
NOTE 27. EQUITY
27.1 SUBSCRIBED AND PAID SHARESAs of December 31st, of 2016 and 2015, the balance of capital of the Parent Company was $2.301, representing a total of 460.123.458 shares, fully paid and subscribed shares. There were no changes to the make-up of the capital, during neither the period, nor the comparative period.
There is a paid-in capital of shares for $546.831, from the issuance of shares made in previous periods.
The shares of the company are listed on the Stock Exchange of Colombia to December 31, 2016, and its value was $24.900, per share ($22.620 at December 31, 2015).
At December 31, 2016, the common shares are held by 13.167 shareholders (2015-14.576). The corporate structure, of the company, at December 31, 2016 and December 31, 2015, is as follows:
2016 2015
Group of Investors Number of shares % Participation Number of
shares % Participation
Grupo de Inversiones Suramericana S.A. 162.883.420 35,4 164.344.564 35,7
Grupo Argos S.A. 45.243.781 9,8 45.243.781 9,8
Colombian Funds 75.561.157 16,4 71.090.281 15,5
International Funds 34.467.295 7,5 26.706.553 5,8
Other investors 141.967.805 30,9 152.738.279 33,2
Total outstanding shares 460.123.458 100,0 460.123.458 100,0
Table 67
27.2 RESERVESOf the accounts that make up the equity, reserves at December 31st of 2016 and 2015, are as follows:
2016 2015
Legal reserves 79.256 75.010
Hyperinflationary reserves (Note 29) 396.367 329.130
Non-distributable occasional reserves 1.558.597 -
Other reserves 1.621.060 1.455.397
Total Reserves 3.655.280 1.859.537
Table 68
Legal reserves: In accordance with Colombian Commercial Law, 10% of the net income each year should be appropriated as a legal reserve, until the balance is equivalent to at least 50% of the subscribed capital. The reserve is not distributable before the liquidation of the Company, but must be used to absorb losses. The excess over the minimum required by law is freely available to the Shareholders.
Occasional non-distributable reserves: Corresponds to the vo-luntary reserve approved by the Shareholders in a meeting on March 18, 2016, about the retained earnings, generated in the process of First-time adoption of IFRS.
Other reserves: Corresponds to voluntary reserves, subs-tantially unrestricted by the Shareholders
27.3 DISTRIBUTION OF DIVIDENDSThe ordinary Shareholders of Grupo Nutresa S.A., at the mee-ting, held on March 18, 2016, declared ordinary share dividends of $41,55 per-share and per-month, equivalent to $498 annua-lly per share (2015 - $462 annually per share), over 460.123.458 outstanding shares, during the months from April 2016 to March 2017, inclusive, for a total of $229.141 (2015 - $212.577).
This dividend was declared by taking net income in the amount of $222.713 (2015) and untaxed occasional reserves for $6.428

63
Between January and December 2016, dividends, in the amount of $167.587 (2015 - $155.588), were paid.
At December 30, 2016, accounts payable pending, are in the amount of $121.418 (2015 - $59.308).
27.4 NON-CONTROLLING INTERESTEquity of non-controlling interest at December 31st of 2016 and 2015 is as follows:
Subsidiary Country of Origin
% Non-controlling interest 2016 2015
2016 2015
Non-controlling Interest in
Equity
Gains Or (Losses)
Attributable to Non-controlling
Interest
Non-controlling Interest in
Equity
Gains or (losses)
Attributable to Non-controlling
Interest
Novaceites S.A. Chile 50,00 50,00 27.071 2.005 24.897 1.211
La Recetta Soluciones Gastronómicas Integradas S.A.S.
Colombia 30,00 30,00 495 (7) 375 (24)
Setas Colombianas S.A. Colombia 0,52 0,52 257 26 260 18
Helados Bon Dominican Republic 18,82 18,82 5.744 1.812 4.308 1.310
Fondo de Capital Privado “Cacao para el Futuro” – Compartimento A
Colombia 16,59 16,59 4.665 119 4.528 211
Schadel Ltda. Colombia 0,12 0,12 9 2 9 1
Others - - (18) (60)
Total 38.241 3.957 34.359 2.667
Table 69
During 2016, Setas de Colombia S.A. distributed dividends in the amount of $1.725 (2015 - $2.050), of which $9 was paid to non-controlling interests (2015 - $11). Helados Bon distributed dividends in the amount of $2.297 (2015 - $0), of which $432, were paid to the non-controlling interest.
NOTE 28. OTHER COMPREHENSIVE INCOME, ACCUMULATED
Below is a breakdown of each of the components of accumulated other comprehensive results, in the Consolidated Financial Statements
2016 2015
Actuarial gains/losses (28.1) (19.866) (7.895)
Financial Instruments (28.2) 3.632.476 3.237.753
Associates and joint ventures (28.3) 3.467 6.705
Exchange translation reserves (28.4) 136.016 338.513
Total other comprehensive income, accumulated 3.752.093 3.575.076
Non-controlling interest (5.521) (5.598)
Total OCI attributed to controlling interest 3.746.572 3.569.478
Table 70
During the period, no reclassification of gains/losses previously recognized in other comprehensive income to profit and loss,
Consolidated financial statements 2016
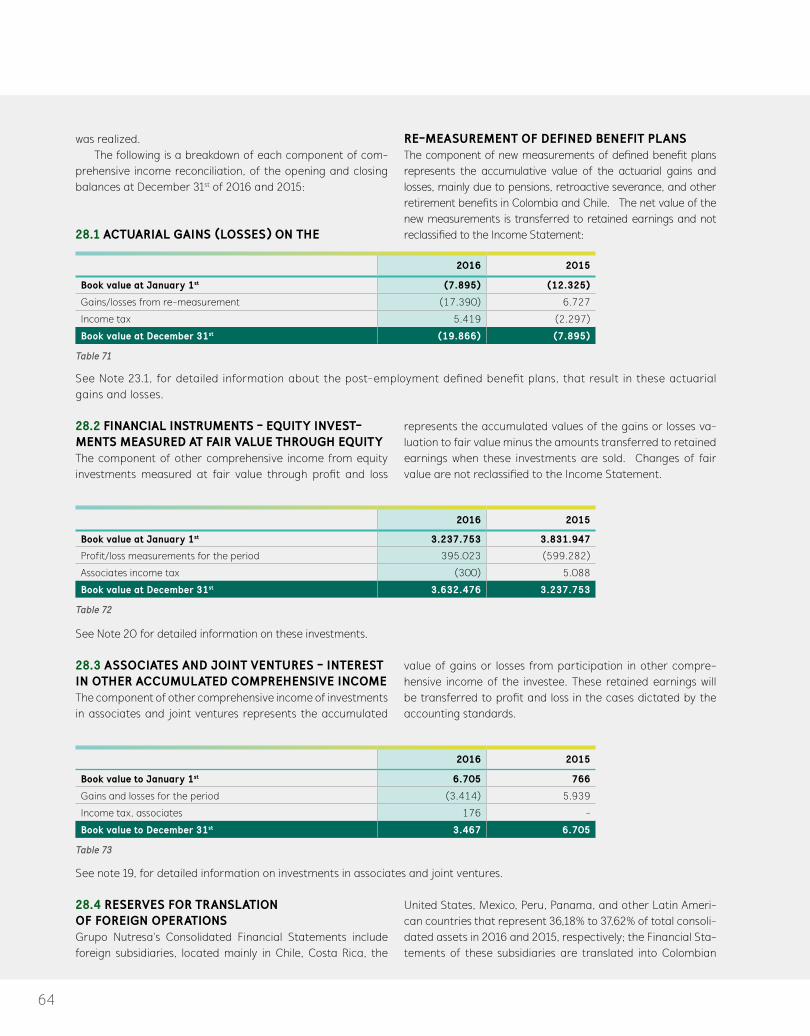
64
was realized.The following is a breakdown of each component of com-
prehensive income reconciliation, of the opening and closing balances at December 31st of 2016 and 2015:
28.1 ACTUARIAL GAINS (LOSSES) ON THE
RE-MEASUREMENT OF DEFINED BENEFIT PLANSThe component of new measurements of defined benefit plans represents the accumulative value of the actuarial gains and losses, mainly due to pensions, retroactive severance, and other retirement benefits in Colombia and Chile. The net value of the new measurements is transferred to retained earnings and not reclassified to the Income Statement:
2016 2015
Book value at January 1st (7.895) (12.325)
Gains/losses from re-measurement (17.390) 6.727
Income tax 5.419 (2.297)
Book value at December 31st (19.866) (7.895)
Table 71
See Note 23.1, for detailed information about the post-employment defined benefit plans, that result in these actuarial gains and losses.
28.2 FINANCIAL INSTRUMENTS - EQUITY INVEST-MENTS MEASURED AT FAIR VALUE THROUGH EQUITYThe component of other comprehensive income from equity investments measured at fair value through profit and loss
represents the accumulated values of the gains or losses va-luation to fair value minus the amounts transferred to retained earnings when these investments are sold. Changes of fair value are not reclassified to the Income Statement.
2016 2015
Book value at January 1st 3.237.753 3.831.947
Profit/loss measurements for the period 395.023 (599.282)
Associates income tax (300) 5.088
Book value at December 31st 3.632.476 3.237.753
Table 72
See Note 20 for detailed information on these investments.
28.3 ASSOCIATES AND JOINT VENTURES - INTEREST IN OTHER ACCUMULATED COMPREHENSIVE INCOMEThe component of other comprehensive income of investments in associates and joint ventures represents the accumulated
value of gains or losses from participation in other compre-hensive income of the investee. These retained earnings will be transferred to profit and loss in the cases dictated by the accounting standards.
2016 2015
Book value to January 1st 6.705 766
Gains and losses for the period (3.414) 5.939
Income tax, associates 176 -
Book value to December 31st 3.467 6.705
Table 73
See note 19, for detailed information on investments in associates and joint ventures.
28.4 RESERVES FOR TRANSLATION OF FOREIGN OPERATIONS Grupo Nutresa’s Consolidated Financial Statements include foreign subsidiaries, located mainly in Chile, Costa Rica, the
United States, Mexico, Peru, Panama, and other Latin Ameri-can countries that represent 36,18% to 37,62% of total consoli-dated assets in 2016 and 2015, respectively; the Financial Sta-tements of these subsidiaries are translated into Colombian
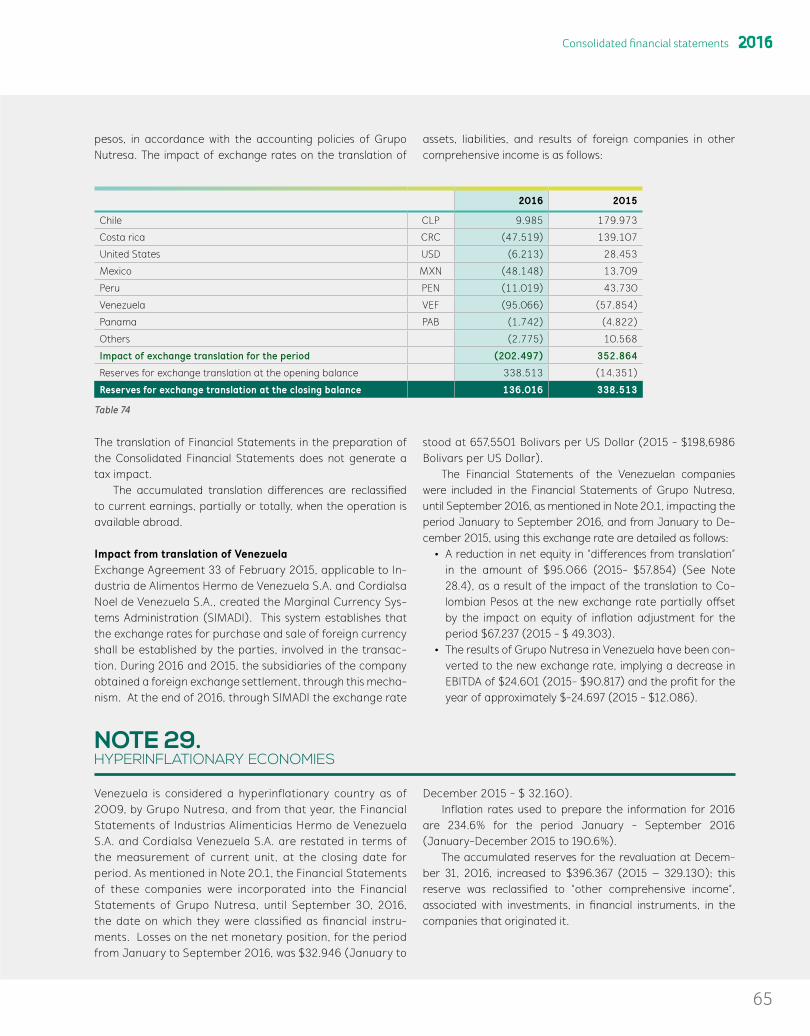
65
pesos, in accordance with the accounting policies of Grupo Nutresa. The impact of exchange rates on the translation of
assets, liabilities, and results of foreign companies in other comprehensive income is as follows:
2016 2015
Chile CLP 9.985 179.973
Costa rica CRC (47.519) 139.107
United States USD (6.213) 28.453
Mexico MXN (48.148) 13.709
Peru PEN (11.019) 43.730
Venezuela VEF (95.066) (57.854)
Panama PAB (1.742) (4.822)
Others (2.775) 10.568
Impact of exchange translation for the period (202.497) 352.864
Reserves for exchange translation at the opening balance 338.513 (14.351)
Reserves for exchange translation at the closing balance 136.016 338.513
Table 74
The translation of Financial Statements in the preparation of the Consolidated Financial Statements does not generate a tax impact.
The accumulated translation differences are reclassified to current earnings, partially or totally, when the operation is available abroad.
Impact from translation of VenezuelaExchange Agreement 33 of February 2015, applicable to In-dustria de Alimentos Hermo de Venezuela S.A. and Cordialsa Noel de Venezuela S.A., created the Marginal Currency Sys-tems Administration (SIMADI). This system establishes that the exchange rates for purchase and sale of foreign currency shall be established by the parties, involved in the transac-tion. During 2016 and 2015, the subsidiaries of the company obtained a foreign exchange settlement, through this mecha-nism. At the end of 2016, through SIMADI the exchange rate
stood at 657,5501 Bolivars per US Dollar (2015 - $198,6986 Bolivars per US Dollar).
The Financial Statements of the Venezuelan companies were included in the Financial Statements of Grupo Nutresa, until September 2016, as mentioned in Note 20.1, impacting the period January to September 2016, and from January to De-cember 2015, using this exchange rate are detailed as follows:
• A reduction in net equity in “differences from translation” in the amount of $95.066 (2015- $57.854) (See Note 28.4), as a result of the impact of the translation to Co-lombian Pesos at the new exchange rate partially offset by the impact on equity of inflation adjustment for the period $67.237 (2015 - $ 49.303).
• The results of Grupo Nutresa in Venezuela have been con-verted to the new exchange rate, implying a decrease in EBITDA of $24.601 (2015- $90.817) and the profit for the year of approximately $-24.697 (2015 - $12.086).
NOTE 29. HYPERINFLATIONARY ECONOMIES
Venezuela is considered a hyperinflationary country as of 2009, by Grupo Nutresa, and from that year, the Financial Statements of Industrias Alimenticias Hermo de Venezuela S.A. and Cordialsa Venezuela S.A. are restated in terms of the measurement of current unit, at the closing date for period. As mentioned in Note 20.1, the Financial Statements of these companies were incorporated into the Financial Statements of Grupo Nutresa, until September 30, 2016, the date on which they were classified as financial instru-ments. Losses on the net monetary position, for the period from January to September 2016, was $32.946 (January to
December 2015 - $ 32.160).Inflation rates used to prepare the information for 2016
are 234.6% for the period January - September 2016 (January-December 2015 to 190.6%).
The accumulated reserves for the revaluation at Decem-ber 31, 2016, increased to $396.367 (2015 – 329.130); this reserve was reclassified to “other comprehensive income”, associated with investments, in financial instruments, in the companies that originated it.
Consolidated financial statements 2016
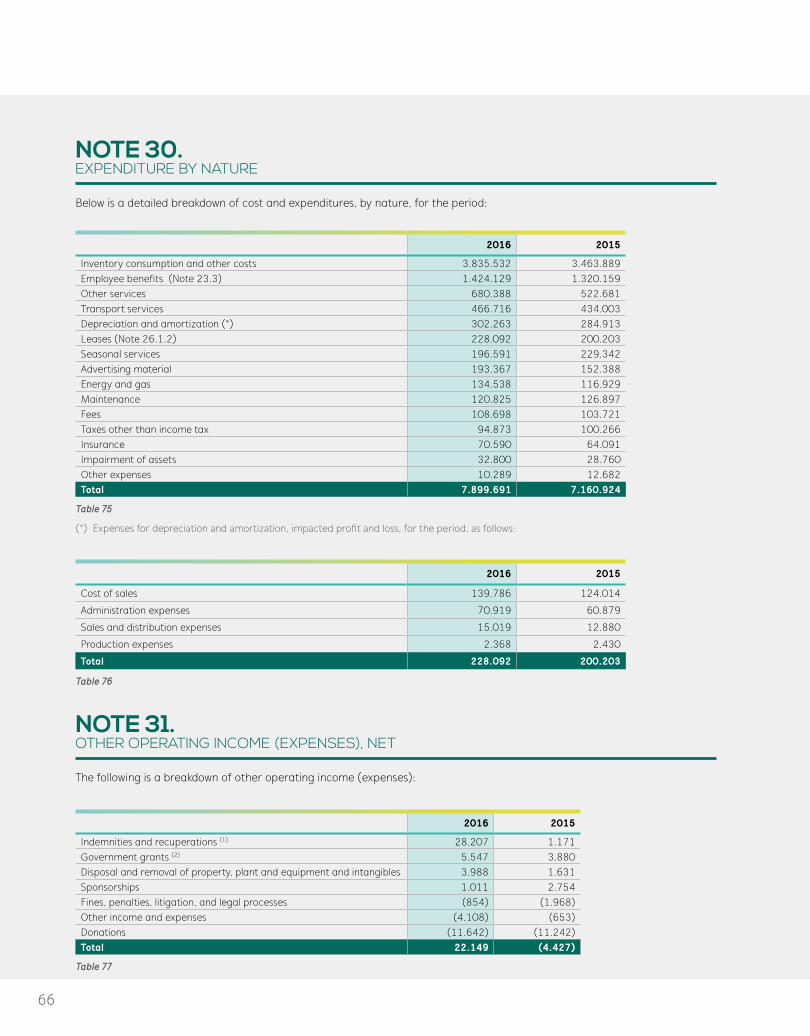
66
NOTE 30. EXPENDITURE BY NATURE
Below is a detailed breakdown of cost and expenditures, by nature, for the period:
2016 2015
Inventory consumption and other costs 3.835.532 3.463.889 Employee benefits (Note 23.3) 1.424.129 1.320.159 Other services 680.388 522.681 Transport services 466.716 434.003 Depreciation and amortization (*) 302.263 284.913 Leases (Note 26.1.2) 228.092 200.203 Seasonal services 196.591 229.342 Advertising material 193.367 152.388 Energy and gas 134.538 116.929 Maintenance 120.825 126.897 Fees 108.698 103.721 Taxes other than income tax 94.873 100.266 Insurance 70.590 64.091 Impairment of assets 32.800 28.760 Other expenses 10.289 12.682 Total 7.899.691 7.160.924
Table 75
(*) Expenses for depreciation and amortization, impacted profit and loss, for the period, as follows:
2016 2015
Cost of sales 139.786 124.014
Administration expenses 70.919 60.879
Sales and distribution expenses 15.019 12.880
Production expenses 2.368 2.430
Total 228.092 200.203
Table 76
NOTE 31. OTHER OPERATING INCOME (EXPENSES), NET
The following is a breakdown of other operating income (expenses):
2016 2015
Indemnities and recuperations (1) 28.207 1.171 Government grants (2) 5.547 3.880 Disposal and removal of property, plant and equipment and intangibles 3.988 1.631 Sponsorships 1.011 2.754 Fines, penalties, litigation, and legal processes (854) (1.968)Other income and expenses (4.108) (653)Donations (11.642) (11.242)Total 22.149 (4.427)
Table 77

67
(1) Corresponds, primarily to compensation for loss of profits and emerging damages. On April 22, 2016, a fire broke out at the plant, Alimentos Cárnicos ( Fontibón), un Bogotá. The affected area compromised an area of operation of 3000 m2, where the “Centro de Distribución Nacional y Regional” ( National and Re-gional Distribution Center), of finished products. At December 31, 2016, the total value of the reserve, that the insurance com-pany has determined for indemnification is $ 45,066, for loss of profits and emergent damages, and reimbursements have been received in the amount of $ 30,328;. It is estimated, that at the end of 2017, the total payment of the indemnification of the claim for the loss will be made, according to the closing of the items to be indemnified.
(2) With regard to income recorded in Abimar Foods Inc., for grants re-ceived from the Development Corporation of Abilene – DCOA, an organization that provides financial assistance to private companies to facilitate the maintenance and expansion of employment or to at-tract more investment that contribute to Abilene’s economic develo-pment. This grant has been essential in the initiation of operations of the new production line of crackers, which began operations in June 2015. DCOA granted a loan, in the amount of USD 2.500.000, for two years, and without interest. In addition, upon pre-certification of the investment, and compliance with other requirements necessary to obtain the grant, USD $1.500.000 (COP $3.880) is received in 2015, as well as, USD $1.300.000 in 2016 (COP $4.048); and as a cash grant in 2016 of USD $500.000 (COP $1.499) was received.
NOTE 32. FINANCIAL INCOME AND EXPENSES
32.1 FINANCIAL INCOMEThe balance at December 31st of 2016 and 2015 included:
2016 2015
Interest 8.972 7.892
Valuation of other financial instruments (Fondo Cacao) 1.415 1.434
Others 595 502
Total 10.982 9.828
Table 78
Income from the assessment of other financial instruments corresponds to the valuation of the rights held by the private equity “Cacao para el Futuro”.
32.2 FINANCIAL EXPENSESThe financial expenses recognized in the Income Statement at December 31st of 2016 and 2015, are as follows:
2016 2015
Loans interest 220.988 148.416
Bonds interest 54.171 47.232
Interest from financial leases 653 733
Other interest 16.419 11.034
Total interest expenses 292.231 207.415
Other financial expenses 32.406 27.481
Total financial expenses 324.637 234.896
Table 79
The increase in interest expenses in 2016 is primarily due to the increase in benchmark rates, such as CPI, IBR, DTF, among others
(81,1%), and due to the higher level of debt for the acquisition of Grupo El Corral and working capital (18,9%).
Consolidated financial statements 2016

68
NOTE 33. EXCHANGE RATE VARIATION IMPACT
33.1 MAIN CURRENCIES AND EXCHANGE RATESHerewith is an evolution of exchange rates at close, to Colombian Pesos from foreign currencies, corresponding
to the functional currency of Grupo Nutresa´s subsidiaries, which have a significant impact on the Consolidated Finan-cial Statements:
2016 2015
Balboas PAB 3000,71 3.149,47
Colons CRC 5,34 5,78
Cordobas NIO 102,33 112,77
Peruvian Sols PEN 893,07 923,6
Dollars USD 3000,71 3.149,47
Mexican Pesos MXN 145,53 181,63
Quetzals GTQ 398,92 412,65
Bolivars VEF 4,45 15,85
Dominican Pesos DOP 64,25 69,14
Chilean Pesos CLP 4,48 4,43
Argentinean Pesos ARS 189,32 242,72
Table 80
33.2 DIFFERENCES IN EXCHANGE RATES FROM FOREIGN CURRENCY TRANSACTIONSThe differences in exchange rates of assets and liabilities, recognized in profit and loss, are as follows:
2016 2015
Realized 1.763 (4.715)
Unrealized 14.110 7.334
Operating exchange differences 15.873 2.619
Non-operating exchange differences (8.642) 27.181
Total income from exchange differences 7.231 29.800
Table 81
Note 21.6 discloses information related to hedging transactions that have an impact on profit/loss from exchange differences.
NOTE 34. DISCONTINUED OPERATIONS
2016: During the year, the close of two distribution centers, was realized, in the ice cream business and the closure of the bread company, in the food to the consumer business; where significant efforts to comply with the proposed plans, were realized, and initiatives were launched to make them
competitive and achieve the goals; but the expected results were not met, and the levels of market share were not rea-ched, to ensure the sustainability of the operation. In addi-tion, the expenses associated with the Tresmontes Lucchetti project of 2015, were recorded.
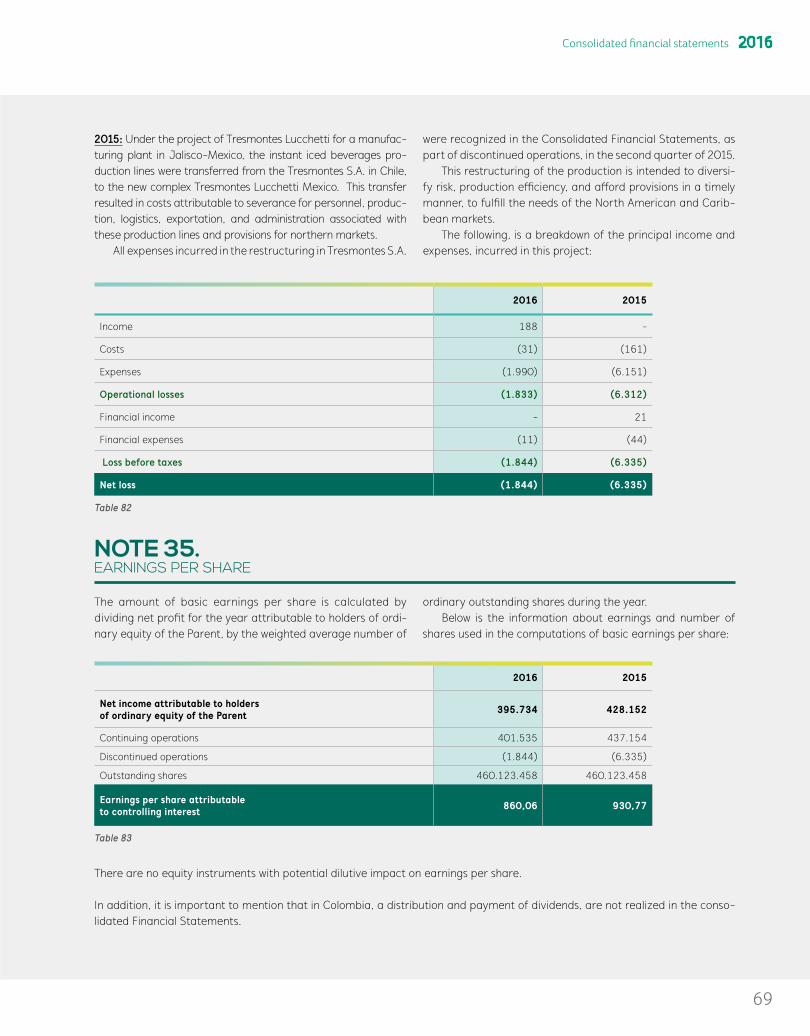
69
2015: Under the project of Tresmontes Lucchetti for a manufac-turing plant in Jalisco-Mexico, the instant iced beverages pro-duction lines were transferred from the Tresmontes S.A. in Chile, to the new complex Tresmontes Lucchetti Mexico. This transfer resulted in costs attributable to severance for personnel, produc-tion, logistics, exportation, and administration associated with these production lines and provisions for northern markets.
All expenses incurred in the restructuring in Tresmontes S.A.
were recognized in the Consolidated Financial Statements, as part of discontinued operations, in the second quarter of 2015.
This restructuring of the production is intended to diversi-fy risk, production efficiency, and afford provisions in a timely manner, to fulfill the needs of the North American and Carib-bean markets.
The following, is a breakdown of the principal income and expenses, incurred in this project:
2016 2015
Income 188 -
Costs (31) (161)
Expenses (1.990) (6.151)
Operational losses (1.833) (6.312)
Financial income - 21
Financial expenses (11) (44)
Loss before taxes (1.844) (6.335)
Net loss (1.844) (6.335)
Table 82
NOTE 35. EARNINGS PER SHARE
The amount of basic earnings per share is calculated by dividing net profit for the year attributable to holders of ordi-nary equity of the Parent, by the weighted average number of
ordinary outstanding shares during the year. Below is the information about earnings and number of
shares used in the computations of basic earnings per share:
2016 2015
Net income attributable to holders of ordinary equity of the Parent 395.734 428.152
Continuing operations 401.535 437.154
Discontinued operations (1.844) (6.335)
Outstanding shares 460.123.458 460.123.458
Earnings per share attributable to controlling interest 860,06 930,77
Table 83
There are no equity instruments with potential dilutive impact on earnings per share.
In addition, it is important to mention that in Colombia, a distribution and payment of dividends, are not realized in the conso-lidated Financial Statements.
Consolidated financial statements 2016

70
NOTE 36. FINANCIAL RISKS: OBJECTIVE AND POLICIES
The activities of the Parent Company and its subsidiaries are exposed to various financial risks: market risk (including fo-reign exchange risk, interest rate risk and commodities pri-ce risk), counterparty credit risk, and liquidity risk. The Risk Management Policy of the Company is focused on the risks that impede or jeopardize the achievement of its financial objectives seeking to minimize potential adverse effects on financial profitability. The Company uses financial deriva-tives to hedge some of the risks described above likewise has a risk committee that defines and controls the policies relating to market risks (raw material prices, exchange rate, interest rate), and counterparty credit.
36.1 EXCHANGE RATE RISKThe Company operates internationally and therefore is ex-posed to the risk of exchange rate operations with foreign currencies, especially the U.S. dollar. The exchange rate risk arises mainly from commercial operations and liabilities, whe-re in some cases, derivatives are used to mitigate it. The exis-ting basic standards allow free negotiation of foreign currency through banks and other financial institutions at freely deter-mined exchange rates. However, most foreign currency tran-sactions still require official approval.
The impact of the translation of the Financial Statements of subsidiaries, whose functional currency is different from the Colombian peso, is presented in Note 28. The Company and its subsidiaries held the following assets and liabilities in foreign currencies accounted for the equivalent in Colombian pesos to December 31st.
2016 2015
USD $ USD $
Current assets 381.985.875 1.146.229 428.791.075 1.350.464
Non-current assets 988.140.705 2.965.124 954.708.792 3.006.827
Total assets 1.370.126.580 4.111.353 1.383.499.867 4.357.291
Current liabilities (207.606.196) (622.966) (252.361.533) (794.805)
Non-current liabilities (135.117.723) (405.449) (136.412.189) (429.626)
Total liabilities (342.723.919) (1.028.415) (388.773.722) (1.224.431)
Net assets 1.027.402.661 3.082.938 994.726.145 3.132.860
Table 84
The Group also maintains obligations in foreign currencies which are exposed to exchange rate risks (the balances of financial obligations in other currencies are detailed in Note 21.4).
To evaluate the sensitivity of balances of financial obli-gations related to exchange rates, all of the obligations, to December 31, 2016, in currencies other than the Colombian pesos and that do not have cash flow hedges, are evaluated. A 10% increase in exchange rates, in reference to the dollars, generates an increase of $5.709 over the book value.
36.2 EXCHANGE RATE RISKChanges in interest rates affect the interest expense on fi-nancial liabilities tied to a variable interest rate; like they can modify the fair value of financial liabilities that have a fixed interest rate. For the Company, the interest rate risk
comes mainly from debt operations, including debt secu-rities, bank lending, and leasing. These financings are ex-posed to the risk of interest rate, mainly due to changes in base rates (mostly IPC - IBR - DTF - TAB [Chile] and to a lesser extent, LIBOR - TIIE [Mexico]) that are used to de-termine the applicable interest rates on bonds and loans. The Company uses derivative financial instruments to cover part of the debt service. Information on the structure of financial risk tied to fixed interest rate and variable interest rate, and the corresponding hedging transactions are de-tailed in Note 21.5.
To provide an idea of the sensitivity of financial expenses to interest rates, an increase of +100bp has been supposed, a scenario in which the interest expense of the Group would increase by $28.609.

71
36.3 COUNTERPARTY CREDIT RISKLiquid assets are invested primarily in savings accounts; co-llective funds and short-term CDT comply with the risk policy of the Company, in both amount and issuer. In addition, the Company evaluates credit risk of counterparties for the finan-cial institutions with which it is related.
36.4 LIQUIDITY RISKThe Parent Company and its subsidiaries, are able to finance their liquidity requirements and capital resources, through va-rious sources, including:
• Cash generated from operations• Lines of short and long-term credits• Debt emissions for medium and long-term• Issuance of treasury shares
NOTE 37. FAIR VALUE MEASUREMENT
The following table shows the fair value hierarchy measurement of assets and liabilities of the Group:
2016
Type of asset
Hierarchy of Fair Value MeasurementFair value of
assetsLevel 1 Level 2 Level 3
Assets whose fair value is disclosed in the notes to the Financial Statements
Investment properties (Note 15) - 98.064 - 98.064
Assets measured at fair value 3.807.247 106.906 77.959 3.992.112
* Recurrent 3.807.247 106.906 - 3.914.153
Investments in quoted shares (Note 20) 3.807.247 3.807.247
Other financial assets (Note 12) 40.109 40.109
Financial derivatives (Note 21.6) (671) (671)
Biological assets (Note 11) 67.468 67.468
*Non- recurrent - - 77.959 77.959
Investments in non-quoted shares (Note 20) - - 77.959 77.959
Total 3.807.247 204.970 77.959 4.090.176
Table 85
Consolidated financial statements 2016

72
2015
Type of assetHierarchy of Fair Value Measurement
Fair value of assets
Level 1 Level 2 Level 3
Assets whose fair value is disclosed in the notes to the Financial Statements
Investment properties (Note 15) - 103.538 - 103.538
Assets measured at fair value 3.412.980 89.626 5.169 3.507.775
* Recurrent 3.412.980 89.626 - 3.502.606
Investments in quoted shares (Note 20) 3.412.980 - - 3.412.980
Other financial assets (Note 12) - 34.324 - 34.324
Financial derivatives (Note 21.6) - 10.522 - 10.522
Biological assets (Note 11) - 44.780 - 44.780
*Non- recurrent - - 5.169 5.169
Investments in non-quoted shares (Note 20) - - 5.169 5.169
Total 3.412.980 193.164 5.169 3.611.313
Table 86
Investment property: The fair value of investment property was determined, by an independent appraiser using the in-come approach and market. This means that valuations are based on quoted prices in active markets, adjusted for diffe-rences in the nature, location and / or condition of the parti-cular property; in addition to the properties for which no active market was found, the method of discounted cash flows was used, using the future cash flows derived from the leasing of real estate.
Investments in listed shares: The fair value of shares traded and that are classified as high trading volume is determined based on the price quoted on the Colombian Stock Exchan-ge; this measurement is in the Hierarchy 1, established by IFRS 13 for measuring fair value. This category includes in-vestments held by Grupo Nutresa in Grupo de Inversiones Suramericana S.A. and Grupo Argos S.A. This measurement is done monthly.
Investments in other companies classified in this category are measured at fair value on a non-recurrent basis, only when a market value is available. The Company considers omission of recurrent measurement of these investments is immaterial for the presentation of Grupo Nutresa’s Financial Statements.
There have been no changes in the fair value hierarchy for the measurement of these investments, nor have there been changes in the valuation techniques used.
Other financial assets: Corresponds to the rights held for “Fondo de Capital Privado – Cacao para el futuro”, valued ac-cording to the regulations of the fund, using the methodology approved by the Financial Superintendence of Colombia. The valuation uses variables like the price of cocoa at $6,4 pesos/ton, an average productivity of 1.800 – 1.900 tons per hecta-re, cost of the debt of DTF + 3,6%, and a expected redemption term of 18 years.
Financial derivatives: All financial derivatives are measu-red at fair value, on a monthly basis, according to the Black Scholes Model. These items are classified in Level 2, of the fair value hierarchy
Biological assets: Corresponds to the inventory of pigs and cattle in Colombia, which are measured at fair value, using as a reference the market value published by the National Association of Pig Farmers and livestock auctions at fairs in each location.
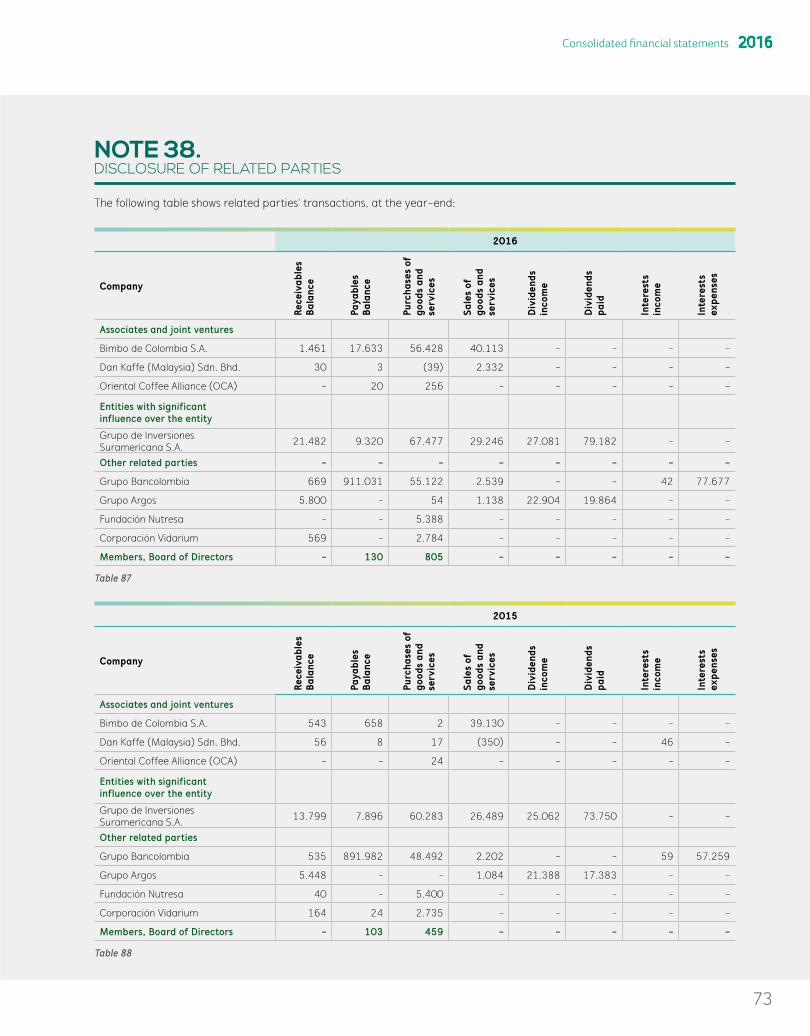
73
NOTE 38. DISCLOSURE OF RELATED PARTIES
The following table shows related parties’ transactions, at the year-end:
2016
CompanyRe
ceiv
able
s B
alan
ce
Paya
bles
B
alan
ce
Purc
hase
s of
go
ods
and
serv
ices
Sale
s of
go
ods
and
serv
ices
Div
iden
ds
inco
me
Div
iden
ds
paid
Inte
rest
s in
com
e
Inte
rest
s ex
pens
es
Associates and joint ventures
Bimbo de Colombia S.A. 1.461 17.633 56.428 40.113 - - - -
Dan Kaffe (Malaysia) Sdn. Bhd. 30 3 (39) 2.332 - - - -
Oriental Coffee Alliance (OCA) - 20 256 - - - - -
Entities with significant influence over the entity
Grupo de Inversiones Suramericana S.A. 21.482 9.320 67.477 29.246 27.081 79.182 - -
Other related parties - - - - - - - -
Grupo Bancolombia 669 911.031 55.122 2.539 - - 42 77.677
Grupo Argos 5.800 - 54 1.138 22.904 19.864 - -
Fundación Nutresa - - 5.388 - - - - -
Corporación Vidarium 569 - 2.784 - - - - -
Members, Board of Directors - 130 805 - - - - -
Table 87
2015
Company
Rece
ivab
les
Bal
ance
Paya
bles
B
alan
ce
Purc
hase
s of
go
ods
and
serv
ices
Sale
s of
go
ods
and
serv
ices
Div
iden
ds
inco
me
Div
iden
ds
paid
Inte
rest
s in
com
e
Inte
rest
s ex
pens
esAssociates and joint ventures
Bimbo de Colombia S.A. 543 658 2 39.130 - - - -
Dan Kaffe (Malaysia) Sdn. Bhd. 56 8 17 (350) - - 46 -
Oriental Coffee Alliance (OCA) - - 24 - - - - -
Entities with significant influence over the entity
Grupo de Inversiones Suramericana S.A. 13.799 7.896 60.283 26.489 25.062 73.750 - -
Other related parties
Grupo Bancolombia 535 891.982 48.492 2.202 - - 59 57.259
Grupo Argos 5.448 - - 1.084 21.388 17.383 - -
Fundación Nutresa 40 - 5.400 - - - - -
Corporación Vidarium 164 24 2.735 - - - - -
Members, Board of Directors - 103 459 - - - - -
Table 88
Consolidated financial statements 2016
74
Purchases and sales were executed in equivalent conditions than those of the market. Outstanding balances are expected to be settled under normal conditions; these balances have not been granted, nor received guarantees. No expense has been recognized in the current or prior periods, regarding
uncollectable debts or doubtful accounts related amounts owed by related parties.
During the period payments in the amount of $130.212 (2015 - $103.674) for 172 (2015 – 166) key personnel were made.
NOTE 39. EVENTS AFTER THE REPORTING PERIOD
These Consolidated Financial Statements were authorized for issue by the Board of Grupo Nutresa on February 24, 2017 and will be subject to approval by March 29, 2017 at the Shareholders’ Meeting.
In January 2017, the Superintendence of Corporations, au-thorized the spin-off of the investment properties of Gestión Cargo Zona Franca S.A.S., in the amount of $65.904, toge-ther with societies Meals Mercadeo de Alimentos de Colombia S.A.S. and Alimentos Cárnicos S.A.S.