consolidated financial statements - simona ag · 2017-05-12 · supply, sewage disposal and...
TRANSCRIPT

ANNUAL REPORT 2016
A company like a friend.Consolidated Financial StatementsFOR THE FINACIAL YEAR 2016

2 3
COMBINED MANAGEMENT REPORT
03 Fundamental Information about the Group06 Business Review15 Report on Opportunities and Risks18 Report on Expected Developments20 Other Information
GROUP FINANCIAL STATEMENTS
24 Group Income Statement25 Group Statement of Comprehensive Income26 Group Statement of Financial Position27 Group Statement of Cash Flows 28 Group Statement of Changes in Equity29 Notes to Consolidated Financial Statements 64 Details of Shareholdings 65 Reproduction of the Auditor’s Report66 Other Information OTHER DETAILS
67 Shareholdings of SIMONA AG69 Key Financials SIMONA Group
Contents
2 344 45
1. FUNDAMENTAL INFORMATION ABOUT THE GROUP
1.1 Group business modelThe SIMONA Group develops, manufactures and markets a range of semi-finished thermoplastics, pipes and fittings as well as fin-ished parts and profiles. The materials used include polyethylene (PE), polypropylene (PP), polyvinyl chloride (PVC), polyethylene terephthalate (PETG), polyvinylidene fluoride (PVDF), ethyl-ene-chlorotrifluoroethylene (E-CTFE) and perfluoroalkoxy (PFA) as well as various specialist materials. The production methods applied within this area range from extrusion, pressing and injec-tion moulding to CNC manufacturing. SIMONA also maintains its own plastics workshop for the production of customised fittings.
Key sales marketsSemi-Finished Products are deployed mainly within the area of chemical tank and equipment construction, mechanical engineer-ing, the transport industry, the construction sector, the exhibition and display sector as well as the automobile and aerospace industry. Pipes and fittings are used primarily for drinking-water supply, sewage disposal and industrial piping systems, including the chemical process industry. Finished parts and profiles are destined in particular for the mechanical engineering and trans-port technology sectors.
The SIMONA Group markets its products worldwide. The primary reporting segments are categorised according to the following regions:
� Europe � Americas � Asia and Pacific
The secondary classification is based on product areas: � Semi-finished and finished parts � Pipes and fittings
Production and sales locationsSales activities at Group level are conducted by SIMONA AG and subsidiaries in the United Kingdom, Italy, France, Spain, Poland, the Czech Republic, Russia, Hong Kong, China, India and the United States, both directly and via trading partners. Beyond this, SIMONA AG operates a sales office in Möhlin, Switzerland. It con-tributes around 3 per cent to Group sales revenue. The parent company, SIMONA AG, has its registered office in 55606 Kirn (Germany). In the period under review, the SIMONA Group oper-ated three facilities in Germany and four plants located abroad. Semi-Finished Products (sheets, rods, welding rods) are manufac-tured at two plants in Kirn (Rhineland-Palatinate), while pipes, fittings and finished parts are produced at a facility in Ringsheim (Baden-Württemberg). The plant in Litvinov (Czech Republic) pro-duces pipes and sheets, while the site in Jiangmen (China) manu-factures sheets. The facility operated by SIMONA AMERICA Inc. in Archbald (Pennsylvania, USA) mainly produces sheet products. Additionally, Boltaron Inc. produces thermoplastic sheets at its plant in Newcomerstown (Ohio, USA), which are primarily used for aircraft interiors and in the building sector.
Combined Management Reportfor the 2016 Financial Year
This management report combines the Group management report and the separate management report of SIMONA Aktiengesellschaft, Kirn (referred to also as SIMONA AG, SIMONA or company) (Section 315(3) in conjunction with Section 298(3) of the German Commercial Code – HGB). This combined management report has been published instead of a Group management report in the annual report of the SIMONA Group. It includes details relating to the course of business, including performance, as well as the position and expected development of the Group and SIMONA AG. Information pertaining to SIMONA AG has been included in the business review that can be found in a separate section with details presented in accordance with provisions set out in the German Commercial Code (Handelsgesetzbuch – HGB).
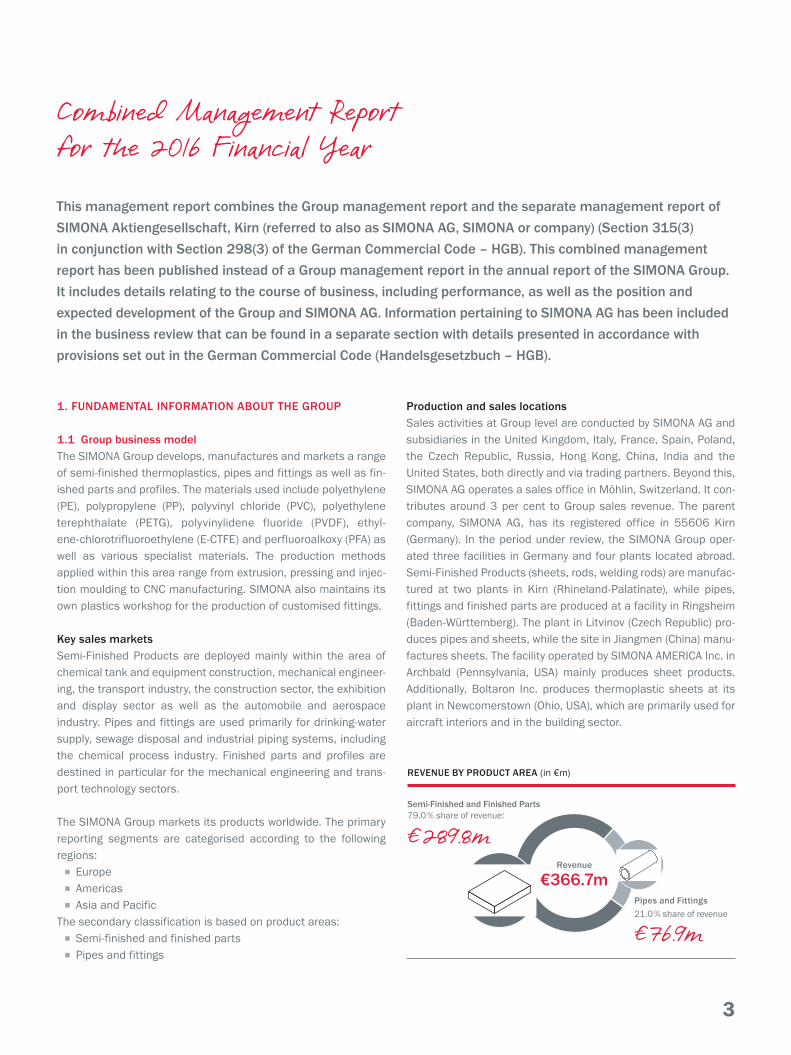
REVENUE BY PRODUCT AREA (in €m)
Pipes and Fittings21.0 % share of revenue
Semi-Finished and Finished Parts79.0 % share of revenue:
Revenue
€366.7m
€ 289.8m
€ 76.9m

4 544 45
Management and supervision at SIMONA AGIn the financial year under review the Management Board con-sisted of Wolfgang Moyses (Chairman/CEO), Dirk Möller (Deputy Chairman/COO) and Fredy Hiltmann.
The Supervisory Board included the following members in the financial year under review: Dr. Rolf Goessler (Chairman), Roland Frobel (Deputy Chairman), Dr. Roland Reber and Joachim Trapp as well as Jörg Hoseus (Employee Representative) and Gerhard Flohr (Employee Representative).
1.2 Objectives and strategiesFocusing invariably on customer value, the SIMONA Group sees itself as a global solution provider for plastics applications. Super-ior operations technology and premium-quality products together with reliable, efficient and speedy processes are hallmarks of SIMONA. The SIMONA Group is committed to steady growth in revenues and earnings, while pursuing business expansion on its own terms and remaining independent. The goal for the medium term remains SIMONA500, i.e. annual Group sales of €500 mil-lion. Revenue growth is to be achieved organically and through acquisitions. The Group’s long-term goal is to achieve an EBIT margin of 6–8 per cent.
SIMONA has defined three core strategic objectives for the purpose of meeting its revenue and earnings targets:
� Enhanced innovatory abilities � More pronounced growth in the emerging markets � Operational excellence
The aim is for SIMONA to grow within its core market of Europe in particular, the emphasis being on new fields of application and new markets. With this in mind, the Business Development struc-ture agreed in 2015 with regard to the market segments Con-struction, Agriculture and Mobility was implemented in the period under review, which included the appointment of staff members to the respective functions. The Technology Centre opened in 2016 has added to the company’s R&D capabilities. It also brings together at a single location the various departments involved in the process of innovation. Efforts to develop new products are being stepped up around the globe. Among the prime examples are applications within the area of mobility being spearheaded by Boltaron Inc., our subsidiary in the United States, or the market
for pipes and fittings in Asia. As for the emerging markets, SIMONA is increasingly looking to establish a local presence in these regions. With this in mind, a subsidiary company was founded in India in 2016 in order to better exploit the potential for poly mer applications in this burgeoning market. In addition, SIMONA introduced sales and distribution structures for pipes and fittings in Asia. When it comes to operational excellence, the objective set is to raise productivity levels gradually at all plants and in all processes. In 2016, the Semi-Finished and Finished Parts division in particular made further progress in this area.
1.3 Internal management systemSIMONA uses the Balanced Scorecard (BSC) as a strategic man-agement and monitoring instrument. Within this context, the Management Board is responsible for the BSC-related corporate goals, as well as being accountable for regularly reviewing the efficacy of the BSC process as part of an overall assessment of the management system and initiating adjustments to the BSC process and the BSC-related corporate goals. The BSC cascades down to the company’s other management levels.
The analysis and assessment of earnings performance by SIMONA is conducted primarily with the help of sales revenue as well as the two financial indicators EBIT and EBITDA. EBIT represents the operating result before interest and taxes as well as income from investments. EBITDA (earnings before interest, taxes, deprecia-tion and amortisation as well as investment income) represents an approximation for cash flow from operating activities, as non-cash depreciation/write-downs of property, plant and equipment as well as amortisation/write-downs of intangible assets are added to the EBIT figure.
Reconciliation from IFRS to HGB of EBIT generated by SIMONA AG is mainly as follows:
in €m 2016 2015
EBIT under IFRS 13.6 15.2
Change in inventories 1.8 –0.8
Staff costs (pensions) 2.5 2.4
Depreciation/amortisation/write-downs of intangible assets and property, plant and equipment 1.3 1.1
Other changes –0.4 –1.0
EBIT under HGB 18.8 16.9

4 546 47
Additionally, the return on operating assets is reviewed annually within the Group as part of the forecasting process and is an important criterion when it comes to managing the investment budget. ROCE, which stands for return on capital employed, is used as a profitability indicator; capital employed includes intan-gible assets, property, plant and equipment, financial assets, inventories and trade receivables less trade payables.
The principal non-financial indicators employed by the company include customer satisfaction, number of staff and their qualifica-tions as well as quality and energy management.
1.4 Research and developmentResearch and development is subdivided into the areas of Formula Development, New Products & Applications and Process Develop-ment. Innovation Circles apply the Stage-Gate process to evalu-ate and prioritise new product ideas, before pursuing market roll-out. The indicator used in this area is the share of recent products (no older than three years) in total sales revenue, which was further increased over the course of 2016.
The new Technology Centre at the Group headquarters in Kirn was officially opened in July 2016. The event was attended by the state premier of Rhineland-Palatinate, Malu Dreyer. The Technol-ogy Centre has commenced full operations. Its goal is to enhance the Group’s capabilities as an innovator with the help of more expansive R&D capacities, lean structures, a high degree of knowledge transfer and a broader choice of materials.
The product range offered by the Semi-Finished and Finished Parts division was extended to include the high-performance plastic PFA (perfluoroalkoxy), which is used primarily in the chem-ical and electroplating sector, in the semiconductor industry and in the area of energy and environmental technology. The third generation of twin-wall sheets was unveiled at the world’s leading plastics trade fair, “K”, in October 2016 and is to be launched onto the market during the second quarter of 2017. These sheets combine excellent efficiency with superior stability. SIMONA also showcased the prototype of a wear protection sheet at the “K” trade show in Düsseldorf. This is a multilayer sheet made of PE-HD. Featuring a functional wear layer, it has been designed mainly for applications in the area of bulk materials handling. Committed to building on its expertise as engineering consultants in the core “Industry” market, SIMONA launched the tank calcula-tion program “SmartTank” in the period under review. Using state-
of-the-art methods and featuring a user-friendly project manage-ment function, the application is capable of calculating cylindrical and rectangular tanks in accordance with DVS (Deutscher Ver-band für Schweißen und verwandte Verfahren) requirements.
In the Pipes and Fittings division, the focus was on establishing and expanding the market segment of mining (pilot projects with multilayer piping system AP-Line) and repair/rehabilitation (PP interconnecting modules for Tight-in-Pipe method, extension of fittings range). Efforts within the area of injection moulding were stepped up by channelling funds into multi-tools among other things.
Expenses attributable to research and development within the Group amounted to €3,950 thousand in the period under review (previous year: €3,608 thousand). These expenses are mainly comprised of staff costs, material costs and depreciation of prop-erty, plant and equipment.

6 746 47
2. BUSINESS REVIEW
2.1 Macroeconomic and sector-specific environment
According to data presented by the International Monetary Fund (IMF), the global economy is likely to have grown by 3.1 per cent in 2016, which is comparable to the rate of growth recorded in the previous year. Industrial output in the advanced economies rose by just two per cent, while the emerging countries recorded growth of four per cent. The situation was dominated by sluggish demand-side momentum and a sustained dip in investment spending. At the same time, there were hardly any gains made with regard to productivity.
Germany again recorded solid economic growth. According to pre-liminary data presented by the Federal Statistical Office, price-ad-justed GDP rose by 1.9 per cent (2015: 1.7 per cent). As in the past, growth was driven by private and public-sector consumption. At the same time, however, investments within the area of con-struction (+3.1 per cent) and machinery/equipment (+1.7 per cent) also contributed to growth. The number of people in employment reached 43.5 million, the highest level since 1991. Growth in the eurozone as a whole was also stable. Based on initial projections by the European Commission, GDP for the 19 member states within the euro area rose by 1.7 per cent (2015: 1.6 per cent). Alongside Germany, Spain proved to be a key growth driver with economic growth of 3.0 per cent. The economies of France (+1.1 per cent) and Italy (+1.0 per cent) remained sluggish.
The rate of growth in the United States, meanwhile, fell short of expectations. While the US economy continued on a path of mod-erate recovery, the scale of expansion is thought to be minuscule. After two weak first quarters growth for the year as a whole is likely to stand at around 1.5 per cent. Low energy prices in the first half of the year, a strong dollar and anaemic capital expend-iture on machinery and equipment are among the key influencing factors.
According to preliminary data, the Chinese economy expanded by 6.7 per cent in real terms. Benefiting from monetary and fiscal policy measures at the beginning of the year, it continues to de -velop in line with government targets. The country is in the midst of a structural transition towards services and a stronger focus on domestic consumption. Private investment rose by a mere three per cent, whereas state-led capital expenditure on infrastructure projects increased by around 20 per cent.
Germany’s plastics processing industry put in a solid performance in 2016. According to data presented by the Association of the Plastics Processing Industry, total revenue within this sector expanded by 3.2 per cent to €60.8 billion. The overall volume of plastics processed was also higher than in the previous year, rising by 3.6 per cent to 14.1 million tonnes. At 3.6 per cent, foreign sales rose much faster than those from domestic business (2.8 per cent). In terms of sub-sectors, Construction (+4.7 per cent) and Packaging (+4.4 per cent) were the most prominent growth drivers. 61 per cent of member companies surveyed by the Association of the Plastics Processing Industry reported an increase in revenues for 2016. At the same time, however, the number of those stating that revenues had fallen rose sharply from 11 to 19 per cent.
Chemical production in Germany proved lacklustre in 2016, with preliminary data issued by industry association Verband der chemischen Industrie e.V. suggesting growth of 0.5 per cent in output. Revenues generated in this industry were approx. 3 per cent lower year on year due to price reductions associated with chemicals and pharmaceuticals. Revenue from domestic sales declined by 4 per cent, while foreign sales fell by 2.5 per cent.
Production output in Germany’s mechanical and plant engineering industry remained stagnant in 2016. Based on preliminary data presented by the Federal Statistical Office, production fell by 0.2 per cent in real terms. The German Engineering Association (VDMA) cites increasing investor scepticism in the second half of the year as a key determinant. A downturn in China and the United States – in some cases severe – was offset by business in Europe and a number of smaller markets.
Revenues generated in the German construction industry rose by 6.3 per cent year on year in 2016. This positive performance was underpinned above all by public-sector projects and construction work in the housing sector. Growth in the area of public-sector construction stood at 6.4 per cent, while the housing sector expanded by 8.5 per cent. The commercial building sector suf-fered a sharp downturn in order intake in November. The month of December proved much more dynamic, as a result of which reve-nue generated over the year as a whole increased by 3.9 per cent.
The market for aircraft interiors expanded by 4 per cent in 2016 according to data issued by market intelligence agency Counter-point. This industry continued to benefit from higher passenger throughput, particularly in Asia.

6 748 49
2.2 Course of business – SIMONA GroupSales revenue totalled €366.7 million in the 2016 financial year (previous year: €360.3 million). This corresponds to an increase of 1.8 per cent. The direction taken by revenue was dominated by a slight downturn in business in Europe, a gradual recovery in the challenging Asian markets and a strong performance in North America. Competitive forces remained intense for all sales regions and product groups. The Group slightly exceeded its reve-nue forecast of €355–365 million for the 2016 financial year, as presented in the previous year’s Group management report. This was due primarily to an extremely solid performance in the United States. The revenue guidance figures (€360–370 million) pre-sented in the Group interim report for the first half and the press release for the third quarter were met.
Based on Group earnings before interest and taxes (EBIT) of €30.2 million (previous year: €26.7 million), the budgeted EBIT margin (4–6 per cent) as well as the prior-year figure of 7.4 per cent were exceeded by a substantial margin and stood at 8.2 per cent in 2016. EBITDA rose from €40.1 million a year ago to €43.9 million at the end of the reporting period. The EBITDA margin stood at 12.0 per cent, compared to 11.1 per cent for the same period a year ago.
At 11.7 per cent, Group ROCE was up on the prior-year figure (10.5 per cent) as well as the figure originally forecast.
Earnings growth was fuelled in particular by more expansive reve-nues in the Americas segment and an improved product mix. In terms of expense items, higher other expenses exerted pressure on earnings.
EuropeRevenue from sales in the region encompassing “Europe” fell by 1.5 per cent to €257.3 million (previous year: €261.3 million), particularly on account of a decline in business within the Pipes and Fittings division. Germany recorded a slight downturn in reve-nue of 0.2 per cent. Revenue growth continued in Spain as the local economy maintained its forward momentum. Business in France was adversely affected by the country’s sluggish economic performance. The downturn recorded in Russia was offset by moderate revenue growth in Eastern Europe. Owing to the expan-sion in revenue from sales in the “Americas”, the share of total revenue attributable to Europe fell further in the period under review, down from 72.5 per cent to 70.1 per cent. EBIT recorded in the segment categorised as “Europe” declined from €18.3 million in the previous financial year to €17.2 million in the period under review.
AmericasThe region comprising the “Americas” saw sales revenue increase by 10.3 per cent to €90.1 million in total (previous year: €81.7 million). The company recaptured market share in the area of Industrial Products and managed to exceed the figures defined in its budget. Business at the subsidiary Boltaron Inc., with its Avia-tion and Specialty Products division, continued to develop well and was again above budget. This region accounted for 24.6 per cent of total sales revenue, up from 22.7 per cent. The “Americas” segment produced EBIT of €14.4 million (previous year: €9.1 mil-lion) in the period under review. The US plants again succeeded in raising their productivity levels.
Asia and PacificThe region covering “Asia and Pacific” saw sales revenue expand by 11.5 per cent to €19.3 million. Business was particularly buoy-ant in the fourth quarter of 2016. The region as a whole accounted for 5.3 per cent of total revenue, up from 4.8 per cent a year ago. The “Asia and Pacific” segment posted a loss before interest and taxes of €1.2 million (previous year: loss of €0.3 million), which was attributable mainly to currency effects (€–0.8 million).
Sales revenue by product areaThe product area comprising Semi-Finished and Finished Parts developed well in 2016. Sales revenue rose by 4.7 per cent to €289.8 million (previous year: €276.9 million). Despite the loss of a key account, the product group consisting of extruded sheets managed to generate growth in the period under review. Business within the product area of pressed sheets and solid rods also
REVENUE BY YEAR SIMONA GROUP (in €m)
€m
400
375
350
325
300
275
250
2014 2015 2016
€366.7m !
8 948 49
expanded. In the case of PVC sheets, new fields of application provided a boost to both foamed and compact products. Busi-ness relating to semi-finished products used in aircraft interiors remained dynamic. The core area of business centred around chemical tank and equipment engineering was strengthened fur-ther by a new range of products made of fluoroplastics. It, too, generated growth in the period under review, despite the contin-ued lack of major projects in this field.
The product area covering Pipes and Fittings was adversely affected by anaemic infrastructure business, particularly in the second half of the year. The crisis within the energy sector and sustained collapse of crude oil prices proved detrimental to investment behaviour in the district heating and lignite markets. The product groups PE pipes and fittings were unable to isolate themselves from this general market trend. Business was up slightly in the area of industrial pipes and also – supported by projects – with regard to rail drainage systems and pipeline reha-bilitation. In total, the area of Pipes and Fittings saw revenue fall by 7.9 per cent to €76.9 million (previous year: €83.4 million).
OrdersOrder backlog within the Group amounts to €30.4 million (previ-ous year: €28.0 million); of this figure, €17.9 million (previous year: €17.6 million) was attributable to SIMONA AG.
2.3 Financial performance
EarningsBenefiting from the positive direction taken by business, Group earnings before interest, taxes and income from investments (EBIT) increased by 12.9 per cent, from €26.7 million to €30.2 million. After 7.4 per cent in 2015, the EBIT margin rose to 8.2 per cent in the period under review.
Supported by revenue growth, gross profit (revenue, other income, change in inventories of finished goods and work in progress less cost of materials) rose by €7.5 million to €178.4 million in 2016, which corresponds to 48.7 per cent of revenue (previous year: 47.4 per cent).
In this context, a decrease in inventories of €0.1 million (previous year: increase in inventories of €1.7 million) was accounted for in the income statement.
Other income totalled €8.6 million (previous year: €11.1 million). This figure includes gains of €3.7 million (previous year: €8.3 mil-lion) arising from changes in foreign exchange rates. Having accounted for foreign exchange losses recognised in other expenses, the net foreign exchange gain was €1.3 million (previ-ous year: €4.7 million).
The cost of raw materials fell slightly over the course of 2016. The cost of materials was €196.7 million (previous year: €202.2 mil-lion); while revenue grew, the cost of materials fell by 2.7 per cent
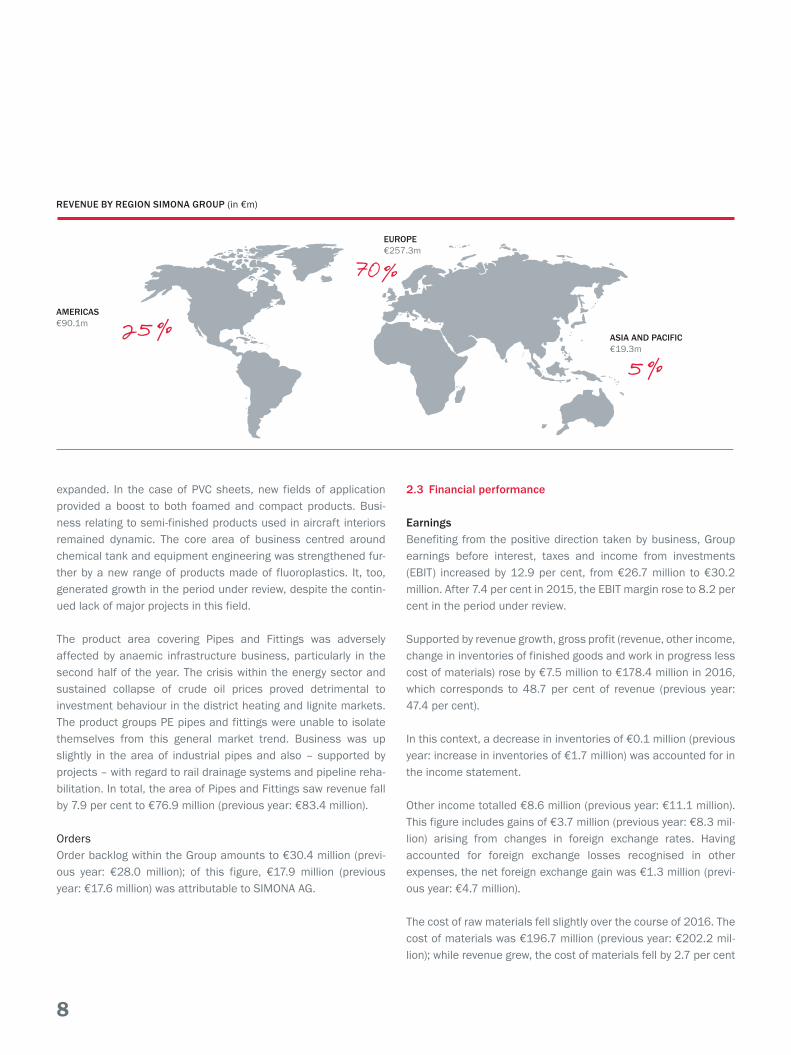
REVENUE BY REGION SIMONA GROUP (in €m)
AMERICAS€90.1m
ASIA AND PACIFIC€19.3m
5 %25 %
EUROPE€257.3m
70 %

8 950 51
year on year. This was attributable primarily to the direction taken by commodity prices and the downturn in business within the area of Pipes and Fittings. Energy-related costs were lower than in the previous year.
Staff costs stood €72.4 million (previous year: €70.8 million), up 2.3 per cent on last year’s figure. The year-on-year change was mainly the result of an increase in expenses relating to manage-ment and staff bonuses.
Depreciation of property, plant and equipment and amortisation of intangible assets amounted to €13.7 million (previous year: €13.4 million).
Other expenses rose by 3.6 per cent to €62.2 million. The year-on-year increase was due primarily to higher expenses for mainte-nance, advertising, exhibitions and packaging material. By con-trast, expenses attributable to outward freight and foreign curren-cies were lower in the period under review.
In line with higher pre-tax profit, taxes on income rose from €7.5 million in 2015 to €8.6 million in the reporting period. At 30.6 per cent, the Group tax rate was up slightly on last year’s figure of 30.2 per cent.
Segment-specific disclosuresWith the exception of the United Kingdom – mainly as a result of currency effects – the individual sales companies within the seg-ment covering Europe made a positive contribution to earnings. In particular, the earnings contributions made by the subsidiaries in
Russia and Poland were, in part, substantially higher year on year. Compared with the previous year, the production company in the Czech Republic made a larger contribution to earnings in 2016. Material-related expenses were lower, down from €153.9 million in the previous year to €148.2 million in the period under review, primarily as a result of a decline in revenue from sales in the Pipes and Fittings product area. Staff costs rose by 1.1 per cent to €54.9 million. Other expenses rose by €1.3 million to €42.5 mil-lion.
The subsidiaries operating within the Americas segment saw their contributions to earnings expand significantly in the financial year under review. Despite the increase in sales revenue, material-re-lated expenses were scaled back from €42.3 million in the previ-ous year to €41.6 million in the period under review. Staff costs increased by 7.0 per cent to €15.1 million. Other expenses rose by €1.2 million to €16.3 million.
Overall, the sales companies in the segment covering Asia and Pacific saw a downturn in earnings compared to the previous year, despite bene fiting from growth in revenue. This was attributable primarily to declining profit margins. The plant in China fell short of the break-even mark in 2016, with earnings before interest and taxes (EBIT) remaining in negative territory. Currency effects proved to be the main factor. EBITDA, by contrast, continued to improve. Staff costs, write-downs and other expenses were com-parable to the figure recorded in the previous financial year.
2.4 Financial positionAs at 31 December 2016, total assets at Group level were up substantially by €44.6 million to €363.0 million. This was attribut-able primarily to KfW funding received by the Group.
Changes to assetsAs in the previous financial year, intangible assets totalled €33.9 million; they mainly consist of goodwill relating to the entities acquired in the United States.
Property, plant and equipment amounted to €116.7 million (previ-ous year: €113.8 million). The year-on-year change was attributa-ble primarily to the addition of the Technology Centre in Kirn. Investments in property, plant and equipment totalled €15.5 mil-lion at Group level. Depreciation and write-downs of property, plant and equipment amounted to €12.3 million.
EBIT PERFORMANCE SIMONA GROUP
Per c
ent
€m
12.00 30.0
11.00
10.00 25.0
9.00
8.00 20.0
7.00
6.00 15.0
5.00
4.00 10.0
3.00
2.00 5.0
1.00
EBIT in per cent
EBIT in €m
2014 2015 2016

10 1150 51
Deferred tax assets rose from €4.4 million a year ago to €7.6 million in the period under review, primarily due to utilisation of loss carryforwards in respect of the US subsidiaries.
Inventories totalled €69.2 million (previous year: €66.9 million). At €26.2 million, inventories of raw materials, consumables and supplies were unchanged year on year. Finished goods and mer-chandise rose by €2.5 million to €41.4 million.
At €52.2 million, trade receivables remained largely unchanged year on year.
Current and non-current other assets and tax assets totalled €3.4 million (previous year: €6.3 million). This item includes the entitlement of SIMONA AG, capitalised at its present value, relating to corporation tax credits of €0.8 million (previous year: €1.4 million).
Other financial assets fell to €0.8 million (previous year: €4.0 million), primarily as a result of short-term financial arrangements.
Assets held for sale stood at €3.8 million (previous year: €4.7 million) and are attributable to property, plant and equipment in the United States. The property in France, containing offices and a storage facility, was sold in the period under review.
Changes to equity and liabilitiesThe Group strengthened its equity further compared to the previ-ous financial year, in addition to seeing an increase in non-current liabilities.
At the end of the financial year, Group equity amounted to €192.0 million (previous year: €182.6 million). This figure primarily includes annual profit of €19.5 million and a dividend payment of €6.0 million in 2016. The revaluation of pension provisions due to the reduction in the IAS actuarial interest rate had an impact on Group equity, equivalent to €5.1 million. The Group’s equity ratio fell from 57 per cent to 53 per cent due to the higher balance sheet total.
Current and non-current provisions for pensions had to be reval-ued mainly in response to the reduction in the IAS actuarial inter-est rate from 2.30 per cent a year ago to 1.80 per cent. The figure recognised in the period under review was €103.3 million in total (previous year: €91.4 million).
At €15.1 million, trade payables were higher year on year (previous year: €11.7 million) due to factors relating to the end of the report-ing period.
Other non-current and current financial liabilities totalling €3.4 million (previous year: €5.6 million) mainly relate to purchase price payments outstanding in connection with corporate acquisi-tions.
Other liabilities totalled €14.5 million in the period under review (previous year: €13.6 million) and were attributable primarily to management and staff bonus payments as well as deferrals/accruals relating to invoices and credit notes yet to be received.
In total, non-current (€2.7 million) and current (€1.6 million) other provisions were slightly lower than in the previous financial year.
InvestmentsGroup capital expenditure on property, plant and equipment amounted to €15.5 million (previous year: €16.0 million). This mainly relates to investments in the segment covering “Europe”, the emphasis being on the new Technology Centre at the compa-ny’s headquarters as well as technical and office equipment at sites in Germany and the United States. Additionally, a logistics facility was built at the company’s production site in Asia. In total, net investments in property, plant and equipment amounted to €3.1 million at Group level (previous year: €4.0 million).
2.5 Financial management and cash flows
Principles and aims of financial managementThe primary goal of financial management is to safeguard the financial strength of the SIMONA Group. In this context, the most important aspect is to meet the Group’s financial requirements relating to its operational business and its investing activities to a sufficient degree. Financial management is centrally organised within the Group. To a large extent, SIMONA covers the liquidity required within the Group by means of internal Group funding via loans or similar arrangements. Additionally, firmly agreed lines of credit are in place in various currencies and maturities. Excess cash resources are invested in the money or capital markets by applying an approach that is optimised in terms of both risk and returns.
52 53
Financing analysisNon-current financial liabilities rose significantly, by €18.3 mil-lion to €22.1 million. They were attributable to KfW loans taken out by the company, producing an inflow of funds in the fourth quarter in particular. Current financial liabilities amounted to €3.4 million at the end of the reporting period (previous year: €2.9 million), which were attributable mainly to short-term KfW loans (previous year: €0.4 million).
No derivative financial instruments were recognised as at 31 December 2016.
At the end of the reporting period the Group had undrawn lines of credit totalling €18.9 million (previous year: €42.8 million). The year-on-year reduction was due to KfW funds drawn by the company.
Cash flowsIn the period under review the inflow of cash from operating activ-ities (gross cash flow) was €42.2 million (previous year: €37.3 million). Net cash used in investing activities totalled €–11.7 mil-lion (previous year: €–22.1 million). Net cash from financing activ-ities was €12.4 million (previous year: net cash used in financing activities of €–5.7 million) and mainly consisted of an inflow of KfW funds and an outflow in connection with dividend payments.
Cash and cash equivalentsThe Group’s cash and cash equivalents totalling €74.8 million (previous year: €31.9 million) mainly consist of short-term bank deposits. The year-on-year swing of €42.9 million (previous year: €10.6 million) was mainly the result of net cash from operating and financing activities as well as net cash used in investing activ-ities. These changes are presented in detail in the statement of cash flows.
Financial obligationsCurrent obligations included €15.1 million (previous year: €10.7 million) for contracts already awarded in connection with invest-ment projects and €12.9 million in respect of purchase orders for raw materials. Other financial obligations totalling €2.5 million (previous year: €1.0 million) were attributable to operating rental and lease agreements. Of this total, an amount of €0.6 million is due within one year.
Net finance costBased on finance income of €0.2 million and finance cost of €2.4 million, net finance cost amounted to €–2.2 million in the period under review (previous year €–2.0 million).
2.6 Course of business – SIMONA AGSales performance at SIMONA AG was influenced by a moderate upturn in business within the area of Semi-Finished and Finished Parts on the one hand and a general lack of momentum in the market for Pipes and Fittings on the other.
Sales revenue totalled €254.5 million in 2016 (previous year: €256.0 million). This corresponds to a slight decline in revenue of 0.6 per cent. Thus, the company fell short of its original revenue target of €263 million. With the Accounting Directive Implementa-tion Act (Bilanzrichtlinie-Umsetzungsgesetz – BilRUG) coming into effect, the company recognised, for the first time, revenue of €1.0 million from services (previous year: €0.8 million) in sales revenue for Germany. This item had previously been accounted for in other operating income.
GermanySales revenue in Germany fell by 0.7 per cent to €96.7 million (previous year: €97.5 million), primarily as a result of the dip in business within the area of Pipes and Fittings.
Rest of Europe & AfricaAt €140.9 million, revenue generated from sales in the region covering the Rest of Europe & Africa was just under the prior-year figure of €141.7 million.
Americas The region comprising the Americas saw sales revenue decline by 10.4 per cent to €4.2 million in total (previous year: €4.7 million).
Asia and PacificRevenue from sales in the Asia and Pacific region grew by 3.7 per cent to €12.6 million.
Sales revenue by product area In the product area comprising Semi-Finished and Finished Parts sales revenue increased by 2.0 per cent to €179.9 million (previ-ous year: €176.4 million). Revenue from the product area compris-ing Pipes and Fittings fell by 7.7 per cent, down from €79.7 million to €73.6 million.

12 1352 53
SIMONA AG earnings declined year on year. Earnings before inter-est and taxes (EBIT), calculated on the basis of IFRS, totalled €13.6 million (previous year: €15.2 million), while the EBIT margin stood at 5.2 per cent (previous year: 6.0 per cent). The company achieved its budgeted EBIT margin (4 to 6 per cent). EBITDA, cal-culated on the basis of IFRS, fell from €23.2 million in the previ-ous year to €21.5 million in 2016. The EBITDA margin stood at 8.5 per cent, compared to 9.1 per cent for the same period a year ago (budgeted EBITDA margin of 7 to 8 per cent). At 9.3 per cent, ROCE (based on IFRS) remained below the prior-year figure of 10.6 per cent but exceeded the ROCE target set by the company (7 to 9 per cent).
The decline in EBIT and EBITDA was attributable primarily to the lower net result from currency translation as well as higher ex -penses in connection with sales and administration. In total, busi-ness performance was satisfactory during the 2016 financial year.
2.7 Review of financial position, performance and cash flows of SIMONA AG
Earnings performanceAt €105.0 million, gross profit (sales revenue less cost of mate-rial) was higher than in the previous year (€101.0 million). Thus, the gross profit margin improved from 39.5 per cent a year ago to 41.3 per cent in the period under review. The cost of material declined in line with lower sales revenue in the area of Pipes and Fittings and as a result of lower energy costs.
Other operating income totalled €3.9 million (previous year: €5.1 million). This figure includes gains of €1.5 million (previous year: €2.3 million) from currency translation.
Staff costs amounted to €46.7 million, thus remaining largely unchanged year on year. This was attributable to higher expenses in connection with staff bonuses as well as lower expenses relat-ing to social security and old-age provision.
Depreciation/write-downs of property, plant and equipment and amortisation/write-downs of intangible assets amounted to €6.6 million (previous year: €6.9 million).
At €39.1 million, other operating expenses were up on last year’s figure (€36.5 million). Expenses were higher primarily in the areas of advertising, packaging material and consulting services.
By contrast, expenses relating to outward freight were lower.
As in the previous year (€3.1 million), write-ups of €9.2 million in respect of financial assets relate to interests held in SIMONA AMERICA Inc., USA.
Write-downs of €6.2 million (previous year: €5.3 million) relating to financial assets were attributable to loans granted to SIMONA ASIA Ltd., Hong Kong.
Interest and similar expenses were €4.2 million (previous year: €3.4 million) and consisted primarily of expenses relating to the unwinding of the discount, i.e. interest cost, of pension provisions (€3.9 million, previous year: €3.2 million). Due to the adoption of Section 253 of the German Commercial Code (Handelsgesetz-buch – HGB) in the version that transposes the Directive on Credit Agreements for Consumers Relating to Residential Immovable Property and amends statutory requirements under German com-mercial law, interest expense was down €6.1 million in the report-ing period (previous year: €2.9 million). This was due to the fact that the period specified for the purpose of determining the aver-age interest rate used to discount pension obligations was extended from 7 to 10 years.
Earnings before interest and taxes (EBIT), calculated on the basis of the German Commmercial Code (Handelsgesetzbuch – HGB), totalled €18.8 million in the period under review (previous year: €16.9 million), as a result of which the EBIT margin stood at 7.4 per cent (previous year: 6.6 per cent). EBITDA rose from €23.7 million a year ago to €25.5 million at the end of the reporting period. At 10.0 per cent, the EBITDA margin was up on last year’s figure of 9.3 per cent. Profit after taxes stood at €15.2 million. Earnings performance in the financial year under review was dom-inated in particular by a higher gross profit as well as higher other operating expenses.
AssetsTotal assets attributable to SIMONA AG rose by €38.1 million to €275.6 million.
At €139.3 million, non-current assets remained unchanged year on year.
Property, plant and equipment increased by €2.8 million to €55.0 million, which was mainly due to the construction of a new Tech-nology Centre in Kirn.
54 55
Interests in affiliated companies rose from €46.1 million to €55.6 million. This was attributable primarily to a write-up relating to the investment in the US subsidiary (€9.2 million).
Loans to affiliated companies, amounting to €28.1 million (previ-ous year: €40.1 million), relate to subsidiaries in the Americas and Asia. The subsidiary in the United States repaid loans of €6.3 million in the reporting period. Loans to the subsidiary in Asia were written down by €6.2 million.
In total, inventories increased by €4.2 million to €34.8 million. They include raw materials (€13.0 million), work in progress (€0.4 million) and finished goods (€21.3 million). Inventories of finished goods rose by €2.1 million compared to the previous financial year.
Trade receivables fell to €23.7 million in the period under review (previous year: €24.3 million). At €14.3 million, receivables from affiliated companies – comprising loans and goods deliveries – were down by €3.6 million year on year. This reduction was due primarily to the repayment of loans.
Other assets were down by €1.0 million year on year to €3.0 million.
In total, receivables and other assets stood at €41.4 million at the end of the financial year, down from €46.8 million in the pre-vious year.
Cash and cash equivalents rose from €20.4 million a year ago to €59.5 million at the end of the reporting period, an increase of €39.1 million. The expansion in cash and cash equivalents was attributable mainly to the inflow of KfW funds and to operating activities.
Equity and liabilitiesSIMONA AG’s equity rose from €162.5 million a year ago to €171.6 million as at the end of the 2016 financial year. Despite this, the equity ratio fell from 68 per cent a year ago to 62 per cent in the period under review. The latter was attributable mainly to the inflow of KfW funds, which prompted an increase in the bal-ance sheet total. SIMONA AG pursues a policy of consistent dividend payments based on the performance of Group profit calculated in accord-ance with IFRS and an average dividend ratio that is stable over the long term. As in the past, the dividend payout is to be funded from free cash flow.
Provisions totalled €58.7 million (previous year: €54.4 million). In total, allocations to provisions for pensions were increased by €2.8 million compared to the previous year and stood at €46.4 million at the end of the reporting period. The higher alloca-tion is attributable primarily to a reduction in the discount rate to 4.01 per cent (previous year: 4.31 per cent). Other provisions totalled €11.5 million (previous year: €9.7 million).
Total liabilities rose by €24.7 million to €45.2 million in total.
At €7.6 million, trade payables were up €0.3 million on the prior- year figure. Liabilities towards affiliated companies amounted to €9.8 million (previous year: €4.1 million), which relate mainly to goods deliveries from the subsidiary in the Czech Republic.
Bank borrowings totalled €25.6 million (previous year: €6.8 mil-lion) and were attributable to long-term KfW loans. At the end of the period under review no funds had been drawn from the short-term global credit facility (previous year: €2.5 million).
The KfW loans are subject to fixed interest rates, with quarterly debt repayments scheduled under the terms of the agreement. The funds are to be used to finance long-term innovation pro-grammes in Germany. The global credit facility is subject to inter-est on the basis of EONIA (Euro OverNight Index Average rate) plus a fixed premium calculated on an arm’s length basis; these bor-rowings can be denominated in euros or a foreign currency.
At the end of the reporting period, SIMONA AG had undrawn bor-rowing facilities of €16.0 million.
InvestmentsCapital expenditure relating to property, plant and equipment at SIMONA AG amounted to €9.3 million in the period under review (previous year: €10.6 million). This mainly relates to investments in technical equipment at the company sites in Germany as well as the construction of a Technology Centre at the company site in Kirn. In total, net investments (additions less write-downs) amounted to €3.0 million (previous year: €4.0 million). With a planned investment volume of around €2.2 million, the new build-ing located at the Ringsheim site is scheduled for completion in 2017.
Obligations from investment projects already initiated amounted to €10.9 million, while those attributable to raw material orders were €8.6 million; they are financed from operating cash flow.

14 1554 55
Analysis of liquidityCash and cash equivalents held by SIMONA AG at the end of the reporting period totalled €59.5 million (previous year: €20.4 mil-lion), comprising bank deposits denominated in euro and foreign currencies. The year-on-year increase is mainly attributable to an inflow of cash from operating activities and financing activities.
2.8 Non-financial indicators
Customer satisfactionSIMONA measures customer satisfaction as part of pan-European surveys. Additionally, customers and target groups are surveyed in key markets outside of Europe, such as China and the United States. Based on the results of the most recent pan-European survey, SIMONA further improved overall customer satisfaction from 82.4 per cent in 2013 to 86.7 per cent in the period under review. 88.0 per cent of our customers would recommend our products and services to others (comparative figure: 85.4 per cent). The next customer survey for Europe as a whole is to take place in April 2017.
EmployeesThe SIMONA Group saw a slight increase in its headcount as at the end of the reporting period. As at 31 December 2016, the Group employed 1,288 people (31 Dec. 2015: 1,278). In Ger-many, the overall number of employees remained largely unchanged. In response to more expansive business, staffing levels in Eastern Europe were increased in the period under review. The headcount in Asia rose following the establishment of a new subsidiary in India. The number of people employed by the Group in the United States was slightly down year on year.
At 789, the number of staff employed at SIMONA AG was largely unchanged when compared to the previous year (31 Dec. 2015: 788).
The headcount of school-leaver trainees rose further, up from the high figure recorded a year ago. In total, 48 (previous year: 42) young people were enrolled in vocational programmes relating to one of eight technical and commercial training courses offered by SIMONA. For the first time, a female school-leaver trainee joined the vocational training programme for Materials Testing in 2016. Twelve young people were enrolled in an integrated/dual work-study degree course supported by SIMONA or sponsored training to become a state-certified technician.
Within the area of HR management the focus in 2016 was on personal and professional development, staff satisfaction and projects centred on ergonomics. The emphasis with regard to staff development was on English language courses and the com-pletion of the international Talent Promotion Circle programme for Year 2 candidates. Towards the end of November 2016, SIMONA conducted an extensive staff survey covering all of its sites in Germany. The response rate was solid and revealed a high level of satisfaction in the majority of categories compared to the pre-vious survey and the industry as a whole. As part of the company’s occupational health management scheme, the health insurer AOK Rhineland-Palatinate/Saarland and SIMONA agreed a joint pro-gramme of “Promoting Health at Work”. Additionally, the company coordinated a number of ergonomics projects and organised two Health Days at its Group headquarters in Kirn. SIMONA also made preparations for a qualifications matrix and the introduction of appraisal interviews for industrial staff at Plant II in Kirn. This was implemented at the beginning of 2017.
Quality, environment and energyThe goal of SIMONA’s quality management system is to maintain and optimise product and process quality on a continual and sus-tainable basis. In this context, meeting the requirements of DIN EN ISO 9001, ISO/TS 16949 and the Pressure Equipment Direc-tive 97/23/EC is an essential prerequisite, and full compliance with these standards was again confirmed by independent audits in 2016. SIMONA conducted interdisciplinary quality circle meet-ings and product audits in the period under review, as well as taking part in various sampling and approval procedures for exist-ing and newly launched projects relating to the automotive supply industry. As was the case in previous years, the pipes and fittings division saw a number of specific product accreditations in response to customer and market requirements. This resulted in
EMPLOYEES BY REGION (SIMONA GROUP)
ASIA10 %
AMERICAS17 %
EUROPE73 %
TOTAL1,288
31 December 2016
56 57
several audits as part of which we were able to prove to external auditors the efficacy of the SIMONA management systems as well as the exceptionally high quality of our products and processes.
In October, SIMONA’s energy management system implemented in accordance with DIN ES ISO 50001 underwent a successful audit at the company sites in Kirn and Ringsheim. This confirmed the efficiency of the system put in place by the company. Decem-ber 2016 saw the successful completion of an audit at the plant in Litvinov, Czech Republic.
As a company, SIMONA is aware of its responsibilities towards people and the environment. Therefore, sustainability and envi-ronmental compatibility are central issues for SIMONA. The SIMONA Environmental Management System is certified in accordance with DIN EN ISO 14001. When it comes to planning new production processes and manufacturing methods, we are fully committed to intensifying environmental protection as an integral element of our operations. Additionally, durable SIMONA products help to deliver effective solutions in response to market challenges, e.g. with regard to environmental engineering and utilities. SIMONA is an active member of VinylPlus, an organisa-tion that focuses on improving sustainability within the PVC supply chain. Furthermore, SIMONA is a co-initiator and user of the certi-fied quality mark for PVC sheets issued by Industrieverband Halb-zeuge und Konsumprodukte aus Kunststoff e. V. (pro-K). Those entitled to use this mark have committed themselves to specific quality standards, in addition to delivering the best possible man-ufacturing expertise and a premium-quality service.
Information technologyAs regards IT infrastructure, the focus in 2016 was on further improving security within the area of information technology. Due to the heightened risk of crypto trojans and other malware, addi-tional security components were installed. A high degree of IT security is achieved with the help of multilevel scans performed by solutions supplied by various vendors and more extensive filter settings. Another focal point was the migration of the company’s SAP system to a new system platform. The latest generation of servers and state-of-the-art data storage systems provide the basis for a stable, high-performance ERP system for all SIMONA sites. In the field of IT applications development the emphasis in 2016 was on harmonising operational processes at all production sites within the SIMONA Group. A Manufacturing Execution Sys-tem (MES) was implemented as a pilot project at the Group head-quarters in Kirn.
3. REPORT ON OPPORTUNITIES AND RISKS
According to a study published by Grand View Research, global demand for plastics will expand by 5.3 per cent on average in the coming years, reaching approx. 335 million tons by the year 2020. Demand continues to be driven by the Asia-Pacific region. This is underpinned by more expansive investments in construction and infrastructures throughout Asia as well as growth in private trans-port. The study points to relatively high levels of market saturation in North America and Europe, where further growth can only be unlocked by means of new technologies and applications. North America is expected to generate average annual growth of 4.3 per cent up to 2020. Market research institute Ceresana predicts that the European plastics market will expand by an average of 2.9 per cent annually up to the year 2022.
The strategy applied by SIMONA is in keeping with these global trends. In Europe, the emphasis is on further strengthening SIMONA’s capabilities as an innovator, among other things in the field of high-performance plastics. At the same time, new market segments are to be opened up in the area of construction, mobil-ity and agriculture. It is precisely here that SIMONA sees good opportunities to expand revenue with the help of new products and applications, also in view of the more extensive manufactur-ing possibilities offered by the new Technology Centre. Within the core segment covering the area of “Industry” the aim is for SIMONA to maintain and strengthen its market position in Europe. With this in mind, the company rolled out a product range featur-ing fully fluorinated plastics, e.g., PFA (perfluoroalkoxy alkane) and FEP (fluorinated ethylene propylene), and introduced a proprietary software program for tank calculation.
SIMONA is confident that it can expand its Industrial Products business in the Americas region. Given the high level of demand associated with infrastructure projects, this also includes the product categories of pipes and fittings. With passenger numbers rising, investment spending on new aircraft looks set to increase. This presents a good business opportunity for Group company Boltaron Inc., which has directed its portfolio of innovative prod-ucts – with a vast array of designs, colours and surface finishes on offer – at this specific market.
In the Asia-Pacific region, meanwhile, SIMONA will be looking to benefit from more expansive infrastructure investments, having stepped up its sales activities in this region. SIMONA continues to operate within the premium segment of the market in this region,
16 1756 57
which has been growing in response to greater environmental awareness and stricter legislation. The subsidiary launched in India in 2016 has now established itself and offers a solid oppor-tunity for the Group to tap the burgeoning plastics market in this country.
The opportunities with regard to SIMONA’s business have not changed markedly compared to the previous year. The short-term economic determinants have improved slightly worldwide. By con-trast, medium-term structural factors, particularly those influenc-ing investment spending within the industrial sector, an area that is of importance to SIMONA’s own business, have possibly deteri-orated somewhat. In introducing a Business Development struc-ture and launching its Technology Centre, SIMONA has estab-lished solid foundations within the Group in order to unlock opportunities in the plastics market even more effectively than in the financial year just ended.
Significant elements of the internal control and management systemOverall responsibility for the internal control system with regard to the financial reporting process and the Group financial reporting process rests with the Management Board. All entities included within the consolidated group have been integrated within this system by means of clearly defined management and reporting structures.
The internal control system, which implements specific controls with regard to the financial reporting process, is aimed at provid-ing reasonable assurance that annual financial statements and consolidated financial statements can be prepared in accordance with statutory requirements despite possible risks. As regards financial management, consolidation of the subsidiaries is per-formed with the help of a system certified in accordance with IDW PS 880. Data is provided via an SAP interface as well as in a Web/Excel format. Several technical validation tasks are performed as soon as the data is transferred. Machine-based and manual pro-cess verifications as well as the two-man rule are considered to be key monitoring procedures when it comes to preparing finan-cial statements. Income statements and statements of financial position prepared on a quarterly basis, in addition to the publica-tion of an interim report for the first half of the financial year, provide a good basis for plausibility checks in respect of the annual financial statements.
Risk reportThe risk management system includes the full range of guidelines and measures required to identify risk and to manage risk associ-ated with commercial operations. The policies, the structural and procedural organisation as well as the processes of the internal control and risk management system operated in respect of finan-cial reporting have been incorporated in guidelines and organisa-tional instructions. They are revised regularly to account for the latest external and internal developments.
As regards financial reporting and the accounting process, we consider those elements to be of significance to the internal con-trol and risk management system that may potentially influence financial reporting and the overall assessment of the annual financial statements, including the management report. These elements are as follows:
� Measures that safeguard the appropriate IT-based prepara-tion of items and data of relevance to financial reporting
� Monitoring of commodity price trends for accounting-related control of procurement and sales prices within the context of price management
On the basis of a risk map, the risk management system of SIMONA controls the following material risks associated with the Group. The management of opportunities and risks is centred around the aspects of effect and probability of occurrence. Signifi-cant individual risks are considered to be those displaying a medium risk profile with an expected value in excess of €5.0 mil-lion when viewed over the medium term. The expected value is computed as the product of the effect/impact and the probability of occurrence; it is used solely for prioritising and focusing risk reporting on issues of material importance. A probability of occur-rence of over 50 per cent is considered high, while one of less than 50 per cent is deemed low. SIMONA considers the following individual risks to be material:
� Market environment and sector-specific risks � Business strategy risks � Financial risks � Risks attributable to procurement and purchasing
Market environment and sector-specific risksThe risks associated with the general business environment and the sector in which the company operates relate mainly to the economic performance of customer segments served by SIMONA. They also include exchange rate and commodity price volatility, political conflicts and the availability of raw materials. Among the
58 59
primary sector-specific risks are the substitution of plastics with other materials, new developments within the competitive envi-ronment, the loss of key customers and changes to customer requirements. A diversified product portfolio, thorough monitoring of markets and structured procurement management provide the basis for risk mitigation. Expansion of production in the United States through corporate acquisitions and the plants located in China and the Czech Republic help to raise flexibility levels for the purpose of meeting customer requirements in close proximity to their sites of operation and in a market-driven manner.
The geopolitical risks remain virulent and have become more pronounced. Within the segment covering Europe the refugee sit-uation and the as yet unresolved financial crisis are dominant factors when it comes to business environment and industry-spe-cific risks. In the segment covering the Americas the price of oil, the direction taken by the US dollar and uncertainty about the future political stance taken by the United States are key determi-nants affecting the wider business environment. There is a risk of a continued decline in industry investment spending due to one of the above-mentioned factors, which could have an adverse effect on our business. As regards the Asia and Pacific segment, the economic performance of China within the industrial sector will have a significant bearing on risk patterns. As regards the aspect of changes to sales markets the expected value for a decline in revenue, in the medium term, has been determined as being approx. €5.0 – 10.0 million with a probability of occurrence of less than 50 per cent at present. Overall, the probability of adverse effects occurring from exposure to sector-specific risks is at pres-ent considered low.
Business strategy risksThese encompass the risk of misjudgements with regard to the future direction taken by the market. Measures aimed at risk pre-vention mainly include close monitoring of the market and com-petitive environment as well as regular strategy meetings with key accounts and between the company’s senior management and sales organisation. The probability of adverse effects occurring from exposure to business strategy risks is at present not consid-ered to be material.
Financial risksThese encompass, above all, currency risks, default risks includ-ing risks associated with voidability of insolvency, product liability risks, risks of a change in interest rates and risks associated with the company pension scheme.
The principal aim of financial risk management is to mitigate risks attributable to ongoing operating and finance-related transac-tions. Depending on the risk, the aim is to restrict individual risks by means of derivative financial instruments and non-derivative hedging instruments.
Dependence on the euro within the Group was scaled back signif-icantly through recent acquisitions and the expansion of manufac-turing operations within the US market. At the same, however, currency risk relating to US dollar transactions has now become more pronounced for SIMONA. In the medium term, the probabil-ity of occurrence of a dilute or accretive effect on earnings equiv-alent to €2.0 to 4.0 million is estimated at over 50 per cent. The greatest risk to business performance in 2016 was the subdued state of the economy, particularly in the areas of industrial pro-duction and investment spending. The risk of bad debt losses remains high in particular within the Eastern European market. Within this context, thorough assess-ments of credit ratings and continuous monitoring within this area help to mitigate risk as a whole as well as risk associated with individually identifiable items. As regards transactions in Russia, a separate directive for the conclusion of business agreements relating to this country is in place for the purpose of limiting asso-ciated risks. Default-related risk associated with specific custom-ers is limited by credit insurance and the cut-off of deliveries in the case of outstanding payments. Additionally, the risk exposure relating to voidability of insolvency has increased. The carrying amounts of inventories are assessed on a regular basis, and adjustments in the form of allowances are made for specific unsaleable products.
Risks associated with interest rate changes are currently consid-ered to be low. Interest payable in connection with KfW loans is based on fixed interest rates. The overdraft facility of SIMONA AG, with its floating interest rate calculated on the basis of EONIA (Euro Over-Night Index Average), is not being utilized at present.
The risks associated with occupational pension schemes are considered to be significant and the probability of their occur-rence is deemed to be high. Risks that are difficult to gauge in the long term, such as future levels of pay and pensions as well as risks relating to longevity, have been categorised as material. They also include risks or encumbrances that are difficult to pre-dict with regard to liquidity and equity, risks associated with investments and volatility of plan assets as well as fluctuating

18 1958 59
costs in respect of contributions to the German Pensions-sicherungsverein. The volatility of plan assets is estimated at €3 to 10 million, which is attributable primarily to the share per-formance of SIMONA AG stock in the last three years.
Risks attributable to procurement and purchasingThese risks relate in particular to the direction taken by commod-ity prices as well as supply-side disruptions. The prices of raw materials used by the company are mainly determined by the availability of direct input and end products, i.e. they are no longer dependent entirely on the price of oil. There were no significant raw material shortages in 2016 and prices remained relatively stable. Having said that, the price of key additives needed in the production of PVC surged in the period under review and at the end of the year there was growing evidence to suggest that the full range of raw materials would become much more expensive at the beginning of 2017. Thus, we expect to see a further structural upturn in commodity prices over the medium to long term.
Other risks relate to the area of information technology. Informa-tion technology risks mainly include the disruption of IT systems, loss of data and attacks on IT systems together with industrial espionage. SIMONA controls these risks by maintaining its own IT department, whose task is to manage, maintain, refine and pro-tect the IT systems on a continual basis. Additionally, the company regularly invests in hardware and software, as well as using virus scanning applications, firewall systems and access control. The probability of occurrence of external attacks on IT systems is con-sidered high.
At the end of the 2016 financial year, we are of the opinion that the overall risk situation for the Group remains largely unchanged from that of the previous year. At the time of preparing this report, there were no identifiable risks that might jeopardise the exist-ence of the SIMONA Group and SIMONA AG as a going concern.
4. REPORT ON EXPECTED DEVELOPMENTS
Economic conditionsAccording to the forecast presented by the IMF, the global econ-omy will pick up in 2017 and expand by 3.4 per cent. In the United States, GDP is expected to increase by 2.3 per cent. Growth is likely to be fuelled by lower taxes together with private consump-tion and more expansive defence spending. Following a protracted recession, Brazil (+0.2 per cent) and Russia (+1.1 per cent) are expected to return to a path of growth. Projections for the euro-zone, meanwhile, point to slightly weaker growth of 1.6 per cent. In this context, private consumption will continue to provide the largest impetus. Investment spending is likely to contribute around 0.5 percentage points to growth. In a year that is consid-ered to be of particular political importance, China will again be faced with lower growth of 6.5 per cent, while the financial risks are likely to become more pronounced. The emerging economies within the Asia-Pacific region are likely to maintain their forward momentum, with growth estimated at 6.3 per cent.
Growth within the majority of the established economies will be driven by private consumption. In terms of growth, global industrial production and investment spending on machinery and equip-ment will remain relatively subdued. The chemical industry is also unlikely to see any sizeable boost to chemical production in 2017, with Germany’s VCI federation forecasting growth of just 0.5 per cent. Excluding pharmaceuticals, the VCI anticipates zero growth for the year ahead. VCI data suggests that revenue within the industry as a whole (excluding pharmaceuticals) will expand by 0.5 per cent. Foreign sales are expected to be the only source of growth within this industry. Germany’s mechanical and plant engin eering industry is also predicting just a slight upturn in 2017. Production output is expected to grow by 1.0 per cent, fuelled mainly by foreign sales. Hauptverband der Deutschen Bauindus-trie, Germany’s central federation of the construction industry, has presented an optimistic outlook for 2017 and predicts rev-enue growth of 5 per cent. The largest contribution to growth is expected to come from the housing sector. The global market for aircraft interiors will continue to expand dynamically in 2017 according to recent forecasts.
Sector-specific conditionsAccording to data available to the industry federation GKV, Ger-many’s plastics processing companies are confident that sales will expand in 2017. Despite having experienced a record year in 2016 in terms of revenue and employment, 57 per cent of the
60 61
companies surveyed anticipate growth in turnover for the year ahead. Expectations with regard to earnings performance are also positive on the whole. 38 per cent predict growth in profits, while 45 per cent believe earnings will remain stable. The majority of the companies surveyed are of the opinion that exports will continue to rise. On a less positive note, high energy costs due to EEG charges payable under the provisions of the Renewable Energy Act, political uncertainty in Europe and a growing shortage of qualified personnel are expected to exert downward pressure.
Future performance of the GroupFor the 2017 financial year, the SIMONA Group has budgeted consolidated revenue of €381 million, an EBIT margin of between 7 and 8 per cent and an EBITDA margin of 11 to 12 per cent.
At Group level, the return on capital employed (ROCE) in 2017 is expected to be between 10 and 11 per cent.
The United States and Eastern Europe are expected to provide the strongest impetus for revenue growth. In the United States, SIMONA anticipates that its industrial products business will con-tinue on a path of stability, while the aviation market is likely to remain dynamic. In Central and Western Europe, SIMONA will continue to be confronted with intense competition within a mar-ket that is consolidating. For this sales region, the goal is to defend the company’s position within the core segment, the industrial market, and generate growth through new fields of application such as agriculture, mobility and construction. In Asia,
meanwhile, the solid performance recorded in the last two quar-ters of 2016 is to be used as a launch pad for further growth.
The company’s ability to achieve these targets will depend in par-ticular on the capacity to impose viable prices in a market environ-ment that remains highly competitive and the direction taken by commodity markets. In some cases, the prices for raw materials used by SIMONA increased dramatically in February and March 2017. At present our guidance figure for revenue achievable in 2017 stands at €370–380 million, while that for EBIT is €25–30 million. Trends relating to global industrial output and investment spending as well as the direction taken by commodity markets are key determinants as regards the attainment of our goals.
By extending our technical expertise and focusing on new market segments alongside our core market of industrial applications, we believe that customer satisfaction can be maintained at the high levels achieved at present.Given our efforts in the area of energy management, we antici-pate that energy efficiency can be held at the level currently seen.
The employee headcount within the SIMONA Group is likely to remain stable in 2017. Based on the vocational training contracts signed up to now, the number of school-leaver trainees will prob-ably remain unchanged year on year.
Future performance of SIMONA AGDespite significant uncertainties within the economic and geopo-litical domain, SIMONA has set itself some ambitious goals for the future. For the financial year 2017, SIMONA has set a guidance target of €260 million in sales revenue, together with an EBIT margin of between 4 and 6 per cent and an EBITDA margin of between 7 and 9 per cent, each calculated on the basis of IFRS.
The return on capital employed (ROCE) in 2017 is expected to be between 8 and 9 per cent.
The sales region covering Germany is expected to undergo further market consolidation. Our goal for the region encompassing the Rest of Europe and Africa, meanwhile, is to achieve slight growth. Eastern Europe is expected to provide greater impetus for growth. In Europe, SIMONA will continue to pursue growth by introducing new products and moving into new fields of application. The establishment of our Business Development structure should also act as a stimulus. Business in the sales region covering the Americas is to be maintained at the current level. SIMONA will be
FORECAST FOR GLOBAL PLASTICS DEMAND UP TO 2020
Source: “Global Plastic Market” Grand View Research
WORLDWIDE2013: ~234m t2020: ~335m t
+5.3% CAGR ASIA-PACIFIC
Biggest regional market
(44.6 per cent of total volume)
EUROPErelatively mature markets driven by
innovation and new technologies
CENTRAL AND SOUTH AMERICA
+6.3% CAGR
NORTH AMERICA
+4.3% CAGR

20 2160 61
looking to achieve higher rates of growth in the region of Asia and Pacific.
5. OTHER INFORMATION
5.1 Declaration on corporate governanceThe declaration on corporate governance pursuant to Section 289a (1) sentences 2 and 3 of the German Commercial Code (Handelsgesetzbuch – HGB) has been published by SIMONA AG on its corporate website at www.simona.de.
5.2 Compensation report
Management Board compensationThe Supervisory Board, based on the recommendations of the Personnel Committee, is responsible for determining the overall compensation of the respective Management Board members. It also regularly reviews the compensation system relating to the Management Board. The Personnel Committee consists of the Supervisory Board Chairman Dr. Rolf Goessler as well as the Supervisory Board members Roland Frobel and Dr. Roland Reber. Compensation for the members of the Management Board of SIMONA AG is calculated on the basis of the size of the company, its commercial and financial position, as well as the level and structure of compensation granted to Management Board mem-bers of similar enterprises. In addition, the duties and the contri-bution of the respective members of the Management Board are taken into account.
Management Board compensation is performance-based. It is comprised of a fixed level of remuneration as well as a variable component. The fixed component of compensation is paid as a salary on a monthly basis. The variable component of compensa-tion is reviewed annually, while the fixed component is assessed once every two years. In addition, both components are subject to thorough analyses in intervals of two to three years, based on a comparison with compensation figures applicable to executive staff of similar enterprises. The variable component of Manage-ment Board compensation is based on earnings performance within the Group and a long-term incentive programme. As regards the performance periods 2013–2015 and 2014–2016, the long-term incentive programme was based on the attainment of a defined target figure (capital employed and a weighted aver-age cost of capital (WACC) of 8 per cent). In the period under
review, a new long-term incentive programme was implemented. It uses average Group NOPAT (net operating profit after taxes) as the key performance indicator, calculated on the basis of a three-year performance period. The first performance period with regard to the new method of calculation encompasses the finan-cial years 2015–2017 and the second performance period com-prises the financial years 2016–2018. Payment occurs subse-quent to the adoption of the consolidated financial statements for the final year of the respective performance period.
In the financial year under review Management Board compensa-tion included the following components: COMPOSITION OF MANAGEMENT BOARD COMPENSATION
in € ’000 2016 2015
Fixed compensation
Fixed salary and fringe benefits 906 1,012
Variable compensation
Annual bonus 1,067 715
Long-term incentive programme (LIP)
Period 2013–2015, payment 2016 0 335
Period 2014–2016, payment 2017 517 0
Total Management Board compensation 2,490 2,062
On 10 June 2016, the Annual General Meeting of Shareholders of SIMONA AG agreed by a three-quarter majority to disclose Man-agement Board compensation in an aggregated format, divided into fixed and performance-related components, rather than dis-closing each amount by name. The resolution is valid up to and including the 2020 financial year. Therefore, no individual, i.e. itemised, disclosures are made under Section 285 no. 9 a) sen-tence 5 to 8 and Section 314(1) no. 6 a) sentence 5 to 8 of the German Commercial Code (Handelsgesetzbuch – HGB).
The company’s Articles of Association contain no provisions that are non-compliant with those set out in the German Stock Corpo-ration Act as regards the conditions applicable to the appoint-ment or removal of Management Board members as well as amendments to the company’s Articles of Association. In view of this, readers are asked to refer to the relevant statutory provisions set out in Sections 84, 85, 133 and 179 of the German Stock Corporation Act (Aktiengesetz – AktG) for further details.
Remuneration for the former members of the Management Board amounts to €470 thousand (previous year: €486 thousand). Pen-
62 63
sion provisions for active and former members of the Manage-ment Board, as governed by the German Commercial Code, were recognised to the full extent and amounted to €12,890 thousand as at 31 December 2016 (previous year: €11,810 thousand). IFRS-based pension provisions for active and former members of the Management Board were recognised to the full extent and amounted to €18,861 thousand as at 31 December 2016 (previ-ous year: €16,333 thousand).
The members of the Management Board also receive fringe bene-fits in the form of non-cash remuneration, which mainly consists of a company car, telephone and insurance premiums. Members of the Management Board received neither loans nor share options or other share-based compensation from the company.
Supervisory Board compensationSupervisory Board compensation is calculated according to the size of the company, as well as the duties and responsibilities of the Supervisory Board members. The Chairman and the Deputy Chairman as well as members involved in Committees receive supplementary compensation.
Members of the Supervisory Board of SIMONA AG receive a stand-ard fixed level of compensation amounting to €13,000. The Chair-man of the Supervisory Board receives an amount equivalent to double the standard level of compensation; the Deputy Chairman receives an amount equivalent to one and a half times the stand-ard level of compensation. Supervisory Board members who are engaged in Committee work receive supplementary compensa-tion of €7,000. All expenses associated directly with a position on the Supervisory Board, as well as sales tax payable on such com-pensation, are reimbursed.
Compensation payable to members of the Supervisory Board was increased in accordance with the resolution passed by the Annual General Meeting convened on 10 June 2016. In addition to fixed compensation, the General Meeting of Shareholders shall be authorised to pass a resolution on a variable component of com-pensation, payment of which shall be dependent on whether specific corporate performance indicators have been met or exceeded. At the Annual General Meeting of Shareholders on 10 June 2016 no such resolution for variable compensation compo-nents was passed for the 2016 financial year.
Supervisory Board compensation for the financial year under review amounted to €163 thousand (previous year: €131 thou-
sand), of which €139 thousand (previous year: €105 thousand) was attributable to SIMONA AG. Members of the Supervisory Board received neither loans nor share options or other share-based compensation from the company.
5.3 Disclosures pursuant to Section 289(4) and Section 315(4) HGB and explanatory report
As at 31 December 2016, the share capital of SIMONA AG remained unchanged at €15,500,000, divided into 600,000 no-par-value bearer shares (“Stückaktien” governed by German law). The shares are traded in the General Standard of the Ger-man stock exchange in Frankfurt as well as on the Berlin securi-ties exchange. There are no different categories of share or shares furnished with special rights. Each share is equipped with one vote at the General Meeting of Shareholders. In view of the fact that a shareholder’s right to a certificate of ownership inter-ests has been precluded under the company’s Articles of Associ-ation, the share capital of our company is represented only in the form of a global certificate, which has been deposited with Clear-stream Banking AG, Frankfurt am Main. Therefore, our sharehold-ers will in future only have an interest as co-owners in the collec-tive holdings of the no-par-value shares in our company, as held by Clearstream Banking AG, according to their interest in the company’s share capital.
A 31.19 per cent interest was held by Dr. Wolfgang und Anita Bürkle Stiftung, Kirn, a 15.0 per cent interest by Kreissparkasse Biberach (Biberach), an 11.64 per cent interest by Dirk Möller (Kirn), an 11.25 per cent interest by Regine Tegtmeyer (Nebel), a 10.0 per cent interest by SIMONA Vermögensverwaltungs-gesellschaft der Belegschaft mbH (Kirn) and a 10.1 per cent interest by Rossmann Beteiligungs GmbH (Burgwedel). The remaining 10.9 per cent of shares in the company were in free float.
As at 10 June 2016, members of the Management Board reported a total holding of 70,909 shares; this corresponds to 11.82 per cent of the share capital of SIMONA AG. The members of the Supervisory Board reported holdings of 1,300 shares in total as at the attendance date of the Annual General Meeting on 10 June 2016. This corresponds to 0.22 per cent of SIMONA AG’s share capital.

22 2362 63
To the extent that employees hold an interest in the company’s capital, these employees themselves directly exercise the rights of control associated with their shareholdings. The appointment and the removal of members of the Management Board are gov-erned by the statutory provisions set out in Sections 84 and 85 of the German Stock Corporation Act (Aktiengesetz – AktG) as well as by Section 9 of the Articles of Association of SIMONA AG. Under these provisions, the Management Board of the company con-sists of at least two members. The appointment of deputy mem-bers of the Management Board is permitted. The Management Board shall generally have a Chairperson appointed by the Super-visory Board.
The Supervisory Board may delegate decisions on the conclusion, amendment and termination of Management Board employment contracts to a Supervisory Board committee. Any amendments to the Articles of Association must be made in accordance with the statutory provisions set out in Section 179 et seq. of the German Stock Corporation Act.
According to Section 6 of the Articles of Association, the company is entitled to issue share certificates that embody one share (sin-gle certificate) or multiple shares (global certificates).
At present there are no significant agreements containing a change of control provision that would apply in the event of a takeover bid.
At present there are no agreements with members of the Manage-ment Board or with employees relating to compensation pay-ments in the event of a change of control.
Forward-looking statements and forecastsThis combined management report contains forward-looking statements that are based on the current expectations, presump-tions and forecasts of the Management Board of SIMONA AG as well as on information currently available to the Management Board. These forward-looking statements shall not be interpreted as a guarantee that the future events and results to which they refer will actually materialise. Rather, future circumstances and results depend on a multitude of factors. These include various risks and imponderables, as well as being based on assumptions that may conceivably prove to be incorrect. SIMONA AG shall not be obliged to adjust or update the forward-looking statements made in this report.
Responsibility StatementWe hereby declare that, to the best of our knowledge, the com-bined management report includes a fair review of the develop-ment and performance of the business and the position of the SIMONA Group and SIMONA AG, together with a description of the principal opportunities and risks associated with the expected development of the Group and SIMONA AG.
Kirn, 31 March 2017SIMONA AktiengesellschaftThe Management Board
Wolfgang Moyses Dirk Möller Fredy Hiltmann

22 23
GROUP FINANCIAL STATEMENTS
24 Group Income Statement25 Group Statement of Comprehensive Income26 Group Statement of Financial Position27 Group Statement of Cash Flows 28 Group Statement of Changes in Equity29 Notes to Consolidated Financial Statements 64 Details of Shareholdings 65 Reproduction of the Auditor’s Report66 Other Information OTHER DETAILS
67 Shareholdings of SIMONA AG69 Key Financials SIMONA Group
Group Financial Statements for the financial year 2016

24 2564 65
in € ’000 Notes 01/01/ – 31/12/2016 01/01/ – 31/12/2015
Revenue [7] 366,675 360,332
Other income [8] 8,600 11,109
Changes in inventories of finished goods and work in progress –132 1,733
Cost of materials [9] 196,722 202,215
Staff costs [10] 72,398 70,801
Depreciation/write-downs of property, plant and equipment, and amortisation/write-downs of intangible assets [17, 18] 13,700 13,419
Other expenses [12] 62,168 60,034
Income from investments accounted for using the equity method [19] 159 130
Finance income [13] 212 153
Finance cost [13] 2,374 2,195
Profit before tax 28,152 24,793
Income tax expense [14] 8,617 7,486
Profit for the period 19,535 17,307
of which attributable to:
Owners of the parent company 19,486 17,270
Non-controlling interests 49 37
EARNINGS PER SHARE
in €
basic, calculated on the basis of profit for the period attributable to ordinary shareholders of the parent company [15] 32.48 28.78
diluted, calculated on the basis of profit for the period attributable to ordinary shareholders of the parent company [15] 32.48 28.78
GROUP INCOME STATEMENT OF SIMONA AG FOR THE FINANCIAL YEAR 2016
64 65
in € ’000 01/01/ – 31/12/2016 01/01/ – 31/12/2015
Profit for the period 19,535 17,307
Items that will not be reclassified subsequently to profit or loss
Remeasurement of defined benefit obligations –7,177 6,079
Deferred taxes on remeasurement of defined benefit obligations 2,116 –1,792
Items that may be reclassified subsequently to profit or loss
Exchange differences on translating foreign operations 898 6,815
Deferred taxes from currency translation 128 –509
Other comprehensive income recognised directly in equity –4,035 10,593
Total comprehensive income 15,500 27,900
of which attributable to:
Owners of the parent company 15,461 27,881
Non-controlling interests 39 19
GROUP STATEMENT OF COMPREHENSIVE INCOMEOF SIMONA AG FOR THE FINANCIAL YEAR 2016

26 2766 67
GROUP STATEMENT OF FINANCIAL POSITIONOF SIMONA AG FOR THE FINANCIAL YEAR 2016
ASSETS
in € ’000 Notes 31/12/2016 31/12/2015
Intangible assets [17] 33,877 33,930
Property, plant and equipment [18] 116,690 113,833
Financial assets [34] 340 340
Investments accounted for using the equity method [19] 293 205
Non-current tax assets [22] 0 670
Deferred tax assets [14] 7,641 4,391
Non-current assets 158,841 153,369
Inventories [20] 69,203 66,877
Trade receivables [21] 52,186 51,140
Other assets [22] 2,630 4,610
Income tax assets [22] 768 1,020
Other financial assets [34] 836 4,831
Cash and cash equivalents [24, 31] 74,759 31,892
Current assets held for sale [23] 3,785 4,696
Current assets 204,167 165,066
Total assets 363,008 318,435
EQUITY AND LIABILITIES
in € ’000 Notes 31/12/2016 31/12/2015
Equity attributable to owners of the parent company
Issued capital 15,500 15,500
Capital reserve 15,274 15,274
Revenue reserves 148,661 140,390
Other reserves 12,354 11,167
191,789 182,331
Non-controlling interests 254 270
Total equity [25] 192,043 182,601
Financial liabilities [26] 22,111 3,851
Provisions for pensions [27, 28] 101,623 89,729
Other provisions [29] 2,705 2,734
Other financial liabilities [26] 58 2,187
Deferred tax liabilities [14] 3,150 199
Non-current liabilities 129,647 98,700
Financial liabilities [26] 3,444 2,936
Provisions for pensions [27] 1,710 1,664
Other provisions [29] 1,563 1,950
Trade payables 15,152 11,722
Income tax liabilities 1,620 1,911
Other financial liabilities [26] 3,358 3,364
Other liabilities [30] 14,471 13,587
Current liabilities 41,318 37,134
Total equity and liabilities 363,008 318,435

26 2766 67
GROUP STATEMENT OF CASH FLOWSOF SIMONA AG FOR THE FINANCIAL YEAR 2016
in € ’000 Notes 01/01/ – 31/12/2016 01/01/ – 31/12/2015
Profit before tax 28,152 24,793
Income taxes paid –6,445 –4,798
Finance income and finance cost (excl. interest expense relating to pensions) [13] 84 71
Depreciation/write-downs of property, plant and equipment, and amortisation/write-downs of intangible assets [17, 18] 13,700 13,419
Other non-cash expenses and income 151 117
Change in pension provisions [27, 28] 4,763 4,943
Result from disposal of non-current assets –816 52
Change in inventories [20] –855 –2,593
Change in trade receivables [21] –1,188 5,159
Change in other assets [22] 792 438
Change in liabilities and other provisions [29, 30] 3,846 –4,274
Net cash from operating activities 42,184 37,327
Investments in intangible assets and property, plant and equipment [17, 18] –15,754 –16,187
Payments relating to acquisition of subsidiaries and other business units (from prior years) –2,017 –2,091
Proceeds from the disposal of assets 1,951 160
Proceeds relating to the short-term financial management of cash investments [34] 4,000 0
Payments relating to the short-term financial management of cash investments [34] –101 –4,000
Interest received 212 44
Net cash used in investing activities –11,709 –22,074
Proceeds from financial liabilities taken on by the Group [26] 21,980 0
Repayment of financial liabilities [26] –3,212 –718
Payment of prior-year dividend [16] –6,000 –4,800
Payment dividend to non-controlling interests –28 0
Interest paid and similar expenses –295 –225
Net cash from/(used in) financing activities 12,445 –5,743
Effect of foreign exchange rate changes on liquidity [31] –53 1,069
Change in cash and cash equivalents 42,867 10,579
Cash and cash equivalents at 1 January [24, 31] 31,892 21,313
Cash and cash equivalents at 31 December [24, 31] 74,759 31,892
Change in cash and cash equivalents 42,867 10,579
66 67
GROUP STATEMENT OF FINANCIAL POSITIONOF SIMONA AG FOR THE FINANCIAL YEAR 2016
ASSETS
in € ’000 Notes 31/12/2016 31/12/2015
Intangible assets [17] 33,877 33,930
Property, plant and equipment [18] 116,690 113,833
Financial assets [34] 340 340
Investments accounted for using the equity method [19] 293 205
Non-current tax assets [22] 0 670
Deferred tax assets [14] 7,641 4,391
Non-current assets 158,841 153,369
Inventories [20] 69,203 66,877
Trade receivables [21] 52,186 51,140
Other assets [22] 2,630 4,610
Income tax assets [22] 768 1,020
Other financial assets [34] 836 4,831
Cash and cash equivalents [24, 31] 74,759 31,892
Current assets held for sale [23] 3,785 4,696
Current assets 204,167 165,066
Total assets 363,008 318,435
EQUITY AND LIABILITIES
in € ’000 Notes 31/12/2016 31/12/2015
Equity attributable to owners of the parent company
Issued capital 15,500 15,500
Capital reserve 15,274 15,274
Revenue reserves 148,661 140,390
Other reserves 12,354 11,167
191,789 182,331
Non-controlling interests 254 270
Total equity [25] 192,043 182,601
Financial liabilities [26] 22,111 3,851
Provisions for pensions [27, 28] 101,623 89,729
Other provisions [29] 2,705 2,734
Other financial liabilities [26] 58 2,187
Deferred tax liabilities [14] 3,150 199
Non-current liabilities 129,647 98,700
Financial liabilities [26] 3,444 2,936
Provisions for pensions [27] 1,710 1,664
Other provisions [29] 1,563 1,950
Trade payables 15,152 11,722
Income tax liabilities 1,620 1,911
Other financial liabilities [26] 3,358 3,364
Other liabilities [30] 14,471 13,587
Current liabilities 41,318 37,134
Total equity and liabilities 363,008 318,435

28 2968 69
EQUITY ATTRIBUTABLE TO OWNERS OF THE PARENT COMPANY
NO
N-
CON
TRO
LLIN
G
INTE
RES
TS
TOTA
L EQ
UIT
YIssued capital
Capital reserve
Revenue reserves
Other reserves
Total
in € ’000
Currency translation differences
Notes [25] [25] [25] [25]
Balance at 01/01/2015 15,500 15,274 123,633 4,843 159,250 251 159,501
Amount recognised directly in equity as part of the Statementof Comprehensive Income 0 0 4,287 6,324 10,611 –18 10,593
Profit for the period 0 0 17,270 0 17,270 37 17,307
Total comprehensive income for the period 0 0 21,557 6,324 27,881 19 27,900
Dividend payment [16] 0 0 –4,800 0 –4,800 0 –4,800
Balance at 31/12/2015 15,500 15,274 140,390 11,167 182,331 270 182,601
Balance at 01/01/2016 15,500 15,274 140,390 11,167 182,331 270 182,601
Amount recognised directly in equity as part of the Statementof Comprehensive Income 0 0 –5,061 1,036 –4,025 –10 –4,035
Profit for the period 0 0 19,486 0 19,486 49 19,535
Total comprehensive income for the period 0 0 14,425 1,036 15,461 39 15,500
Dividend payment [16] 0 0 –6,000 0 –6,000 –29 –6,029
Other changes 0 0 –154 151 –3 –26 –29
Balance at 31/12/2016 15,500 15,274 148,661 12,354 191,789 254 192,043
GROUP STATEMENT OF CHANGES IN EQUITY OF SIMONA AG FOR THE FINANCIAL YEAR 2016

28 2968 69
[1] COMPANY INFORMATION
SIMONA AG is a stock corporation (Aktiengesellschaft) founded in Germany – registered office at Teichweg 16, 55606 Kirn, Ger-many. Its shares are traded within the General Standard of the Frankfurt and Berlin Stock Exchanges. The company is entered in the Commercial Register at the District Court of Bad Kreuznach (HRB 1390). The consolidated financial statements of SIMONA AG for the financial year ended 31 December 2016 were released by the Management Board on the basis of a resolution of 31 March 2017 for the purpose of forwarding them to the Supervisory Board.
The activities of the SIMONA Group mainly include the production and sale of semi-finished parts in the form of sheets, rods, weld-ing rods and profiles as well as pipes, fittings and finished parts made of thermoplastics.
The semi-finished parts are manufactured at the plant in Kirn (Germany) as well as in Archbald and Newcomerstown (USA) and in Jiangmen (China). Pipes and fittings are produced at the plant in Ringsheim (Germany). The plant in Litvinov (Czech Republic) manufactures semi-finished products, pipes and fittings. The products are marketed under the joint SIMONA brand as well as a range of separate brands.
SIMONA AG operates a sales office in Möhlin, Switzerland, and is the ultimate controlling parent of the Group.
Additionally, the following subsidiaries, among others, are respon-sible for handling sales and distribution activities:
Company Registered office, country
SIMONA UK Ltd. Stafford, United Kingdom
SIMONA S.A.S. Domont, France
SIMONA S.r.l. Società UNIPERSONALE Cologno Monzese (MI), Italy
SIMONA IBERICA SEMIELABORADOS S.L. Barcelona, Spain
SIMONA POLSKA Sp. z o.o. Wrocław, Poland
DEHOPLAST POLSKA Sp. z o.o. Kwidzyn, Poland
SIMONA Plast-Technik s.r.o. Litvinov, Czech Republic
SIMONA FAR EAST Ltd. Hong Kong, China
SIMONA ENGINEERING PLASTICS TRADING Co. Ltd.
Shanghai, China
SIMONA ENGINEERING PLASTICS (Guangdong) Co. Ltd.
Jiangmen, China
SIMONA AMERICA Inc. Hazleton, USA
Laminations Inc. Archbald, USA
Boltaron Inc. Newcomerstown, USA
OOO SIMONA RUS Moscow, Russian Federation
SIMONA INDIA PRIVATE LIMITED Mumbai, India
[2] ACCOUNTING POLICIES
Basis of preparationThe consolidated financial statements are prepared using the historical cost principle, unless otherwise specified in Note [5] “Summary of significant accounting policies”. The consolidated financial statements are prepared in euro. Unless otherwise stated, all amounts are rounded to € ’000.
Statement of compliance with IFRSThe consolidated financial statements of SIMONA AG and the entities included in the consolidated group for the period ended 31 December 2016 have been prepared in accordance with the International Financial Reporting Standards (IFRS) applicable at the reporting date, as adopted by the European Union, and the provisions of commercial law to be applied additionally pursuant to Section 315a(1) of the German Commercial Code (Handels-gesetzbuch – HGB).
The term “IFRS” comprises all International Financial Reporting Standards (IFRS) and International Accounting Standards (IAS) to be applied on a mandatory basis as at the reporting date.
NOTES TO CONSOLIDATED FINANCIAL STATEMENTS OF SIMONA AG FOR THE FINANCIAL YEAR 2016
68 69
EQUITY ATTRIBUTABLE TO OWNERS OF THE PARENT COMPANY
NO
N-
CON
TRO
LLIN
G
INTE
RES
TS
TOTA
L EQ
UIT
YIssued capital
Capital reserve
Revenue reserves
Other reserves
Total
in € ’000
Currency translation differences
Notes [25] [25] [25] [25]
Balance at 01/01/2015 15,500 15,274 123,633 4,843 159,250 251 159,501
Amount recognised directly in equity as part of the Statementof Comprehensive Income 0 0 4,287 6,324 10,611 –18 10,593
Profit for the period 0 0 17,270 0 17,270 37 17,307
Total comprehensive income for the period 0 0 21,557 6,324 27,881 19 27,900
Dividend payment [16] 0 0 –4,800 0 –4,800 0 –4,800
Balance at 31/12/2015 15,500 15,274 140,390 11,167 182,331 270 182,601
Balance at 01/01/2016 15,500 15,274 140,390 11,167 182,331 270 182,601
Amount recognised directly in equity as part of the Statementof Comprehensive Income 0 0 –5,061 1,036 –4,025 –10 –4,035
Profit for the period 0 0 19,486 0 19,486 49 19,535
Total comprehensive income for the period 0 0 14,425 1,036 15,461 39 15,500
Dividend payment [16] 0 0 –6,000 0 –6,000 –29 –6,029
Other changes 0 0 –154 151 –3 –26 –29
Balance at 31/12/2016 15,500 15,274 148,661 12,354 191,789 254 192,043
GROUP STATEMENT OF CHANGES IN EQUITY OF SIMONA AG FOR THE FINANCIAL YEAR 2016

30 3170 71
Amendment to IFRS 10, IFRS 12 and IAS 28 “Investment Entities: Applying the Consolidation Exception”The amendments are designed to clarify that entities that are both investment entities and parent entities are exempt from presenting consolidated financial statements even if they are themselves subsidiaries. They further clarify that subsidiaries providing investment-related services that are themselves invest-ment entities shall be measured at fair value. For non-investment entities, they clarify that such entities should account for an investment entity using the equity method. This will have no impact on the consolidated financial statements of SIMONA.
Amendments to IAS 27 “Equity Method in Separate Financial Statements”The amendments permit the use of the equity method as an accounting option for investments in subsidiaries, joint ventures and associates in the separate financial statements of an in ves t or. The amendments shall be applied retrospectively in accordance with IAS 8 “Accounting Policies, Changes in Accounting Estimates and Errors” for annual periods beginning on or after 1 January 2016. This will have no impact on the consolidated financial state-ments of SIMONA.
Amendments to IAS 1 “Presentation of Financial Statements”The amendments are primarily intended to clarify disclosures of material information and of the aggregation and disaggregation of line items in the statement of financial position and in the state-ment of comprehensive income. The amendments further provide that an entity’s share of the other comprehensive income of com-panies accounted for using the equity method shall be presented in its statement of comprehensive income. This will have no impact on the consolidated financial statements of SIMONA.
Omnibus Standard to Amend Multiple International Financial Reporting Standards (IFRSs 2012–2014 Cycle)In the context of its Annual Improvements Process, the IASB revises existing standards. It contains changes to IFRS and their associated Bases for Conclusions. The revisions affect the standards IFRS 5, IFRS 7, IAS 19 and IAS 34. This will have no impact on the consolidated financial statements of SIMONA.
Amendments to IAS 16, IAS 38 “Clarification of Acceptable Methods of Depreciation and Amortisation”The amendments contain further guidance on which methods can be used to depreciate property, plant and equipment and to amor-tise intangible assets. In particular, they clarify that the use of a revenue-based method arising from an activity that includes the use of an asset does not provide an appropriate representation of its consumption. Within the context of IAS 38, however, this pre-sumption can be rebutted in certain limited circumstances. This will have no impact on the consolidated financial statements of SIMONA.
Amendments to IFRS 11 “Accounting for Acquisitions of Interests in Joint Operations”The standard thus amended requires the acquirer of an interest in a joint operation in which the activity constitutes a business as defined in IFRS 3 to apply all of the principles relating to business combinations accounting in IFRS 3 and other standards, as long as those principles are not in conflict with the guidance in IFRS 11. Accordingly, the relevant information specified in those stand-ards is to be disclosed. These amendments necessitated conse-quential amendments to IFRS 1 “First-time Adoption of Interna-tional Financial Reporting Standards” to have the exemption extended to business combinations. Accordingly, it now also includes past acquisitions of interests in joint operations in which the activity of the joint operation constitutes a business. This will have no impact on the consolidated financial statements of SIMONA.
Amendments to IAS 16 and IAS 41 “Agriculture: Bearer Plants”They provide that bearer plants shall be accounted for in the same way as property, plant and equipment, in accordance with IAS 16. IAS 41 shall continue to apply for the produce they bear. As a result of the amendments, bearer plants will in future no longer be measured at fair value less estimated costs to sell, but rather in accordance with IAS 16, using either a cost model or a revaluation model. SIMONA possesses no bearer plants.
Amendments to IAS 19 “Defined Benefit Plans: Employee Contributions”This pronouncement amends IAS 19 in respect of the accounting for defined benefit plans involving contributions from employees (or third parties). If the contributions made by employees (or third parties) to a defined benefit plan are independent of the number
70 71
Additionally, all interpretations issued by the International Finan-cial Reporting Standards Interpretations Committee (IFRS IC) – formerly Standing Interpretations Committee (SIC) – were applied insofar as their application was mandatory for the 2016 financial year.
The consolidated financial statements consist of the financial statements of SIMONA AG and its subsidiaries as at 31 December of each financial year (herein-after also referred to as “Group” or “SIMONA Group”).
The Group statement of financial position conforms with the pres-entation requirements of IAS 1. Various items reported in the income statement and the statement of financial position have been aggregated for the purpose of improving the overall clarity of presentation. These items are disclosed and discussed separately in the notes to the consolidated financial statements.
Principles of consolidationThe consolidated financial statements comprise the accounts of SIMONA AG and its subsidiaries for each financial year ended 31 December. The financial statements of SIMONA AG and the sub-sidiaries are prepared using uniform accounting policies for the same reporting period.
All intragroup balances (receivables, liabilities, provisions), trans-actions, income and expenses as well as profits and losses from transactions between consolidated entities (“intercompany prof-its/losses”) are eliminated as part of consolidation.
Subsidiaries are fully consolidated effective from the acquisition date, which is the date on which the Group effectively obtains control. Inclusion in the consolidated financial statements ends as soon as the parent ceases to control the subsidiary. Changes in a parent’s ownership interest in a subsidiary that do not result in a loss of control are accounted for as equity transactions.
Non-controlling interests are disclosed separately in the Group income statement and within equity of the Group statement of financial position.
[3] NEW FINANCIAL REPORTING STANDARDS
3.1 Accounting standards to be applied for the first time in the financial year
The International Accounting Standards Board (IASB) and the IFRS Interpretations Committee (IFRS IC) issued the following Stand-ards and Interpretations that have been endorsed by the EU and incorporated into European law and must be applied with regard to the reporting period from 1 January 2016 to 31 December 2016. The accounting standards to be applied for the first time in the financial year 2016 have no material impact on the presentation of the consolidated financial statements.
IFRS pronouncement ApprovalIASB
EU endorse-ment
EU first-time adoption
Amendments to IFRS 10, IFRS 12 and IAS 28, “Investment Entities: Applying the Consolidation Exception”
18/12/2014 22/09/2016 01/01/2016
Amendments to IAS 27 “Equity Method in Sepa-rate Financial Statements”
12/08/2014 18/12/2015 01/01/2016
IAS 1 “Presentation of Financial Statements”
18/12/2014 18/12/2015 01/01/2016
Omnibus Standard to Amend International Finan-cial Reporting Standards (IFRSs 2012–2014 Cycle)
25/09/2014 15/12/2015 01/01/2016
Amendments to IAS 16 and IAS 38 “Clarification ofAcceptable Methods of Depreciation and Amorti-sation”
12/05/2014 02/12/2015 01/01/2016
Amendments to IFRS 11 “Accounting for Acquisi-tions of Interests in Joint Operations”
06/05/2014 24/11/2015 01/01/2016
Amendments to IAS 16 and IAS 41 "Agriculture: Bearer Plants"
30/06/2014 23/11/2015 01/01/2016
Amendments to IAS 19 “Defined Benefit Plans: Employee Contributions”
21/11/2013 17/12/2014 01/02/2015
Omnibus Standard to Amend International Finan-cial Reporting Standards (IFRSs 2010–2012 Cycle)
12/12/2013 17/12/2014 01/02/2015
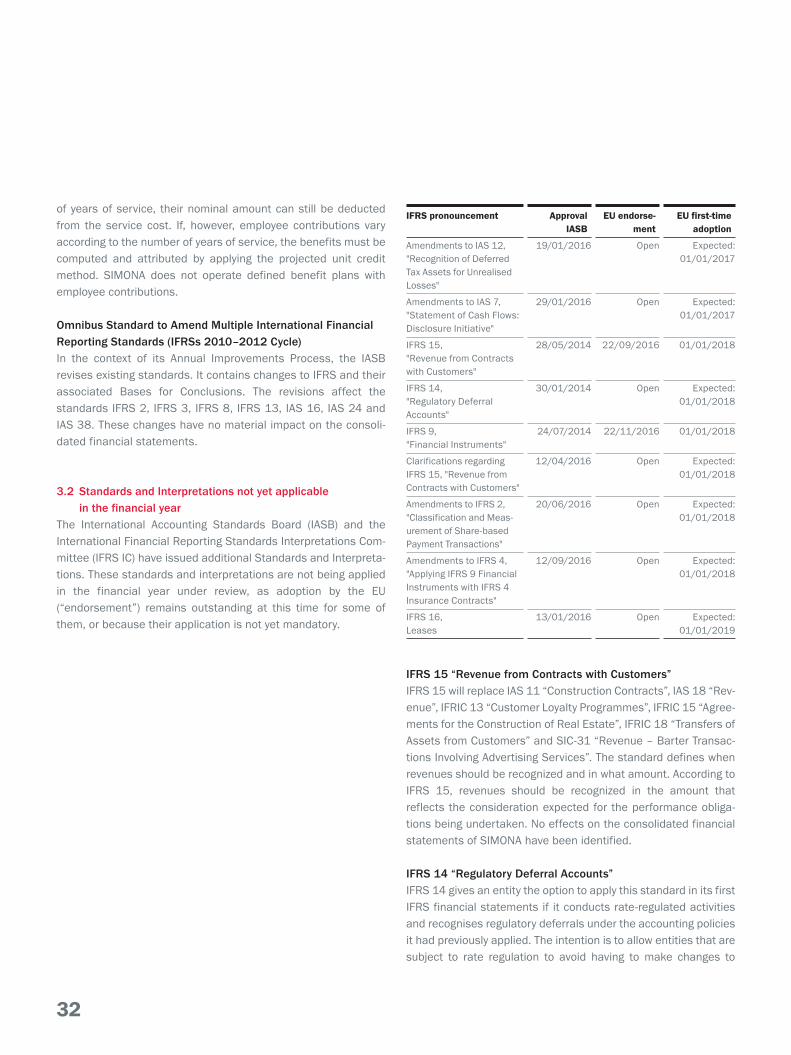
32 3372 73
accounting policies relating to regulatory deferrals. The introduc-tion of this standard will have no impact on the consolidated financial statements of SIMONA.
IFRS 9 “Financial Instruments”Under IFRS 9, all financial instruments currently within the scope of IAS 39 will henceforth generally be subdivided into only two classifications: financial instruments measured at amortised cost and financial instruments measured at fair value. As part of the amended requirements issued on 24 July 2014, an additional measurement category will be introduced for debt instruments. In future, these may be classified as fair value in other comprehen-sive income (FVOCI) if the conditions in respect of the business model and the contractual cash flows have been met. In this context, the IASB has also published a discussion paper relating to additional requirements for macro hedge accounting that are unconnected to IFRS 9. SIMONA considers it possible that the future application of this standard may have a considerable impact on the presentation of financial assets and financial liabil-ities of the Group. However, a reliable assessment of the implica-tions can only be provided after a detailed analysis.
IFRS 16 “Leases”IFRS 16 is effective for annual periods beginning on or after 1 January 2019. Earlier application is permitted for entities that apply IFRS 15 “Revenue from Contracts with Customers” at or before the date of initial application of IFRS 16. As regards les-sees, the new regulations stipulate that all leases shall be accounted for in the statement of financial position as a right-of-use asset and a corresponding liability representing its obligation to make lease payments. Presentation in the income statement is always on the basis of a financing transaction, i.e. the right-of-use asset is generally subject to straight-line depreciation while the effective interest method is to be applied to the lease liability. Essentially, initial application of IFRS 16 is likely to produce an increase in non-current assets and liabilities with a corresponding impact on total assets/total equity and liabilities, debt and the equity ratio. The precise implications for SIMONA’s consolidated financial statements are currently being reviewed.
[4] MATERIAL JUDGEMENTS AND ESTIMATES
JudgementsWhen applying the accounting policies, the management made the following judgements with the most significant effect on the amounts recognised in the financial statements. Within this con-text, decisions containing estimates have not been taken into account. Among other aspects, significant estimates relate to the useful lives of assets.
Material judgements relate to the classification of leases, the recognition of provisions, the estimation or assessment of the recoverability or possible impairment of trade receivables, inven-tories and deferred tax assets, as well as the assessment of fac-tors that may indicate an impairment of assets.
Uncertainties relating to estimatesThe following section outlines the most important forward-looking assumptions as well as other material uncertainty regarding the use of estimates, applicable at the reporting date, as a result of which there is a significant risk that the carrying amounts of assets and liabilities may require material adjustments within the coming financial year.
Impairment of goodwillThe Group performs impairment tests for goodwill at least once per year. This requires estimates to be made with regard to the value in use of cash-generating units (“CGU”) to which goodwill is allocated. For the purpose of estimating the value in use, the Group has to determine, on the basis of estimates, the projected cash flows associated with the cash-generating unit, as well as selecting an appropriate discount rate in order to determine the present value of the aforementioned cash flows.
Impairment of non-financial assetsThe Group determines at the end of each reporting period whether there are observable indications that a non-financial asset or group of non-financial assets is impaired. For the pur-pose of determining the value in use, the future expected cash flows are discounted to their present value using a pretax dis-count rate that reflects current market assessments of the time value of money and the risks specific to the asset. An appropriate valuation model is applied for the purpose of determining the fair value. The Group bases its impairment tests on detailed budget calculations that are prepared separately for each cash-generat-ing unit. Budget planning spans a period of four years. As regards
72 73
of years of service, their nominal amount can still be deducted from the service cost. If, however, employee contributions vary according to the number of years of service, the benefits must be computed and attributed by applying the projected unit credit method. SIMONA does not operate defined benefit plans with employee contributions.
Omnibus Standard to Amend Multiple International Financial Reporting Standards (IFRSs 2010–2012 Cycle)In the context of its Annual Improvements Process, the IASB revises existing standards. It contains changes to IFRS and their associated Bases for Conclusions. The revisions affect the standards IFRS 2, IFRS 3, IFRS 8, IFRS 13, IAS 16, IAS 24 and IAS 38. These changes have no material impact on the consoli-dated financial statements.
3.2 Standards and Interpretations not yet applicable in the financial year
The International Accounting Standards Board (IASB) and the International Financial Reporting Standards Interpretations Com-mittee (IFRS IC) have issued additional Standards and Interpreta-tions. These standards and interpretations are not being applied in the financial year under review, as adoption by the EU (“endorsement”) remains outstanding at this time for some of them, or because their application is not yet mandatory.
IFRS pronouncement ApprovalIASB
EU endorse-ment
EU first-time adoption
Amendments to IAS 12, "Recognition of Deferred Tax Assets for Unrealised Losses"
19/01/2016 Open Expected:01/01/2017
Amendments to IAS 7, "Statement of Cash Flows: Disclosure Initiative"
29/01/2016 Open Expected:01/01/2017
IFRS 15, "Revenue from Contracts with Customers"
28/05/2014 22/09/2016 01/01/2018
IFRS 14, "Regulatory Deferral Accounts"
30/01/2014 Open Expected:01/01/2018
IFRS 9, "Financial Instruments"
24/07/2014 22/11/2016 01/01/2018
Clarifications regarding IFRS 15, "Revenue from Contracts with Customers"
12/04/2016 Open Expected:01/01/2018
Amendments to IFRS 2, "Classification and Meas-urement of Share-based Payment Transactions"
20/06/2016 Open Expected:01/01/2018
Amendments to IFRS 4, "Applying IFRS 9 Financial Instruments with IFRS 4 Insurance Contracts"
12/09/2016 Open Expected:01/01/2018
IFRS 16, Leases
13/01/2016 Open Expected:01/01/2019
IFRS 15 “Revenue from Contracts with Customers”IFRS 15 will replace IAS 11 “Construction Contracts”, IAS 18 “Rev-enue”, IFRIC 13 “Customer Loyalty Programmes”, IFRIC 15 “Agree-ments for the Construction of Real Estate”, IFRIC 18 “Transfers of Assets from Customers” and SIC-31 “Revenue – Barter Transac-tions Involving Advertising Services”. The standard defines when revenues should be recognized and in what amount. According to IFRS 15, revenues should be recognized in the amount that reflects the consideration expected for the performance obliga-tions being undertaken. No effects on the consolidated financial statements of SIMONA have been identified.
IFRS 14 “Regulatory Deferral Accounts”IFRS 14 gives an entity the option to apply this standard in its first IFRS financial statements if it conducts rate-regulated activities and recognises regulatory deferrals under the accounting policies it had previously applied. The intention is to allow entities that are subject to rate regulation to avoid having to make changes to

34 3574 75
Company Registered office, country
Currency
SIMONA UK Ltd. Stafford, United Kingdom
Pound sterling
SIMONA POLSKA Sp. z o.o. Wrocław, Poland Polish zloty
DEHOPLAST POLSKA Sp. z o.o. Kwidzyn, Poland Polish zloty
SIMONA-PLASTICS CZ, s.r.o. Prague, Czech Republic
Czech koruna
SIMONA Plast-Technik s.r.o. Litvinov, Czech Republic
Czech koruna
SIMONA FAR EAST Ltd. Hong Kong, China Hong Kong dollar
SIMONA ASIA Ltd. Hong Kong, China Hong Kong dollar
SIMONA AMERICA Inc. Hazleton, USA US dollar
64 NORTH CONAHAN DRIVE HOLDING, LLC
Hazleton, USA US dollar
Laminations Inc. Archbald, USA US dollar
Boltaron Inc. Newcomerstown, USA
US dollar
DANOH, LLC Akron, USA US dollar
SIMONA ENGINEERING PLASTICS TRADING Co. Ltd.
Shanghai, China Chinese renminbi yuan
SIMONA ENGINEERING PLASTICS (GUANGDONG) Co. Ltd.
Jiangmen, China Chinese renminbi yuan
OOO SIMONA RUS Moscow, Russian Federation
Russian rouble
SIMONA INDIA PRIVATE LIMITED Mumbai, India Indian rupee
The items accounted for in the respective financial statements are measured on the basis of the functional currency. Foreign currency transactions are translated initially between the func-tional currency and the foreign currency at the arithmetic mean rate applicable on the day of the transaction. All exchange differ-ences are recorded in profit or loss for the period. This does not include monetary items that have been designated as part of a hedge of a net investment by the Group in a foreign operation. They are recognised in other comprehensive income until disposal of the net investment; the cumulative amount is reclassified in profit and loss only upon disposal. Taxes arising from exchange differences relating to these monetary items are also recognised directly in other comprehensive income.
Non-monetary items that are measured at historical cost of pur-chase or conversion in a foreign currency are translated at the foreign exchange rate applicable on the day of the transaction. Non-monetary items that are measured at fair value in the for-eign currency are translated at the rate that was prevailing at the time the fair value was determined.
In the consolidated financial statements expenses and income associated with financial statements of subsidiaries prepared in a foreign currency are translated on the basis of the year-average exchange rate, whereas assets and liabilities are translated on the basis of the closing rate. Exchange differences arising from the translation of equity as well as exchange differences arising from the use of exchange rates in the income statement that differ from those used for the translation of items presented in the statement of financial position are recognised in other reserves.
On the disposal of a foreign operation, the cumulative amount of the exchange differences accounted for in respect of the foreign operation is recognised in profit or loss.
Property, plant and equipmentAll items classified as property, plant and equipment are used for operational purposes and are measured at cost less depreciation on a systematic basis. Depreciation of property, plant and equip-ment is performed on a straight-line basis in accordance with the pattern of use of such items. To the extent that depreciable assets of property, plant and equipment have different useful lives, the respective components of these assets are depreciated separately.
The carrying amounts of property, plant and equipment attributa-ble to a cash-generating unit are tested for impairment as soon as there are indications that the carrying amount of the assets of this cash-generating unit exceeds its recoverable amount. Items of property, plant and equipment are derecognised upon disposal. Gains and losses arising from the derecognition of an item of property, plant and equipment are determined as the difference between the net disposable proceeds and the carrying amount of the item; these gains and losses are included in profit or loss when the item is derecognised.
The residual values of assets as well as the useful lives and depreciation methods are assessed at the end of each financial year and are adjusted where necessary.
74 75
periods beyond this time frame, long-term growth rates are deter-mined and applied to the projection of future cash flows beyond four years.
Deferred tax assetsDeferred tax assets are recognised for the carryforward of unused tax losses to the extent that it is probable that future taxable profit will be available against which the unused tax losses can be utilised. The process of determining the level of deferred tax assets requires significant judgement by the management with regard to the timing and amount of future taxable profit as well as the future tax planning strategies. For further details, please refer to Note [14].
ProvisionsProvisions are recognised in accordance with the accounting pol-icies discussed in Note [29]. In determining the level of provisions, the management is required to make significant judgements as to the timing and the amounts of future outflow of resources.
PensionsExpenses relating to defined benefit plans are determined on the basis of actuarial methods. Actuarial valuation is conducted on the basis of assumptions that include discount rates, expected salary and pension increases as well as mortality rates. The assumptions used as a basis of valuations may differ from actual developments due to changing market, economic and social con-ditions. Any change in these assumptions will have an impact on the carrying amounts of pension obligations. For further details, please refer to Note [27] and [28].
[5] SUMMARY OF SIGNIFICANT ACCOUNTING POLICIES
Business combinationsBusiness combinations subsequent to 1 January 2010 are accounted for by applying the acquisition method. The cost of a business combination is calculated as the sum of the considera-tion transferred, measured at the acquisition-date fair value, and any non-controlling interest in the acquiree. In the case of each business combination, the acquirer measures components of non-controlling interests either at fair value or at the proportion-ate share in the recognised amounts of the acquiree’s identifiable net assets. Acquisition-related costs are accounted for as expenses and presented as other expenses.
On first-time recognition, goodwill is measured at cost, being the excess of the consideration transferred and the amount of any non-controlling interest in the acquiree over the net of the acqui-sition-date amounts of the identifiable assets acquired and the liabilities assumed. If the consideration transferred is lower than the fair value of the net assets of the acquired subsidiary, the difference is accounted for in profit and loss.
After initial recognition, goodwill is measured at cost less accumu-lated impairment losses. For the purpose of impairment testing, as from the date of acquisition goodwill acquired as part of a business combination is allocated to those cash-generating units of the Group that are expected to benefit from the business com-bination. This method is applied regardless of whether other assets or liabilities of the acquiree are allocated to these cash-generating units.
Currency translationAnnual financial statements prepared by the consolidated Group entities in a foreign currency are translated on the basis of the functional currency method. The functional currency is the cur-rency of the primary economic environment in which the entities operate, which in the case of the Group companies of SIMONA AG is the respective local currency. The consolidated financial state-ments are prepared in euro.
Those foreign entities whose functional currencies differ from the euro have been presented below, together with details of their functional currency:
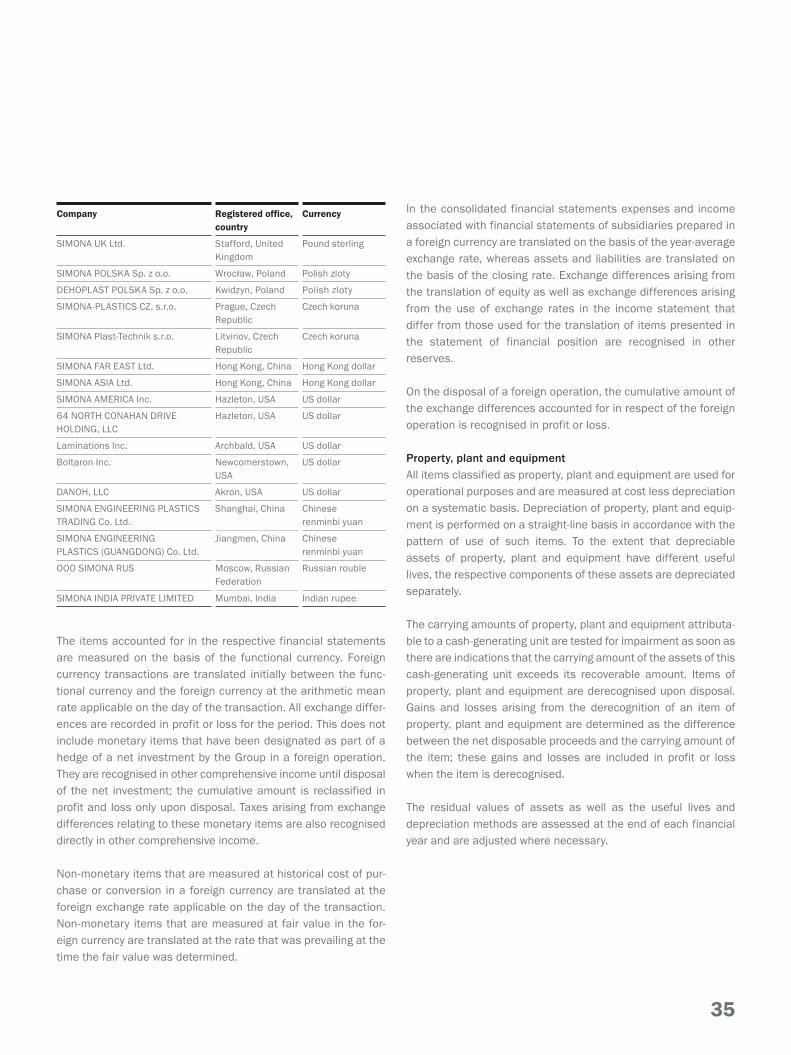
36 3776 77
Non-current assets held for saleSIMONA classifies a non-current asset (or disposal group) as held for sale if its carrying amount will be recovered principally through a sale transaction or a distribution to shareholders rather than through continuing use. For this to be the case, the asset (or dis-posal group) must be available for immediate sale/distribution in its present condition subject only to terms that are usual and customary for sale/distribution of such assets (or disposal groups) and its sale/distribution must be highly probable. Insofar as they refer to the Group statement of financial position, the disclosures made in the notes to the consolidated financial state-ments relate to assets not held for sale. SIMONA reports non-cur-rent assets held for sale (or disposal groups) separately in Note [23]. Non-current assets held for sale and disposal groups are measured at the lower of their carrying amount and fair value less costs to sell, unless the items presented in the disposal group do not fall under the provisions set out in IFRS 5 Non-current Assets Held for Sale and Discontinued Operations.
LeasingWhether an agreement constitutes a lease is determined on the basis of the substance of the transaction detailed in the agree-ment at the time the agreement is concluded. This requires an assessment as to whether the fulfilment of the contractual agree-ment is dependent on the use of a specific asset or specific assets and whether the agreement grants the right to use the asset/assets even if this right is not specifically defined in the agreement.
Finance leases, which transfer to the Group substantially all the risks and rewards incidental to ownership of an asset, are recog-nised as assets in the statement of financial position at the com-mencement of the lease term. As at 31 December 2016, no such finance leases existed within the Group.
Lease payments under an operating lease are recognised in the income statement as an expense on a straight-line basis and are presented as other expense.
Borrowing costsBorrowing costs that are directly attributable to the acquisition, construction or production of a qualifying asset, which is defined as an asset that necessarily takes a substantial period of time to get ready for its intended use or sale, form part of the cost of that asset and are capitalised accordingly. All other borrowing costs are recognised as an expense in the period in which they are
incurred. Borrowing costs are interest and other costs that an entity incurs in connection with the borrowing of funds. No borrow-ing costs have been capitalised by the Group, as it does not pos-sess qualifying assets.
Intangible assetsAcquired and internally generated intangible assets are capital-ised in accordance with IAS 38 if it is probable that the intangible asset will generate future economic benefits and the costs of the intangible asset can be reliably measured. They are measured at cost of purchase or conversion. Intangible assets with a finite useful life are amortised on the basis of the length of that useful life. Amortisation of intangible assets, with the exception of cap-italised development costs, is performed over a useful life of between three and ten years.
Research and development costsThe research and development activities conducted by SIMONA AG are directed principally at the optimisation of production and manufacturing processes (advancement within the area of pro-cess engineering), at changes and improvements to formulas, some of which have been in existence for an extensive period of time, or at fundamental improvements for the purpose of meeting specified quality and inspection requirements, including new test-ing procedures and new areas of application. Generally, these activities do not involve the development of an entirely new product that would sever the link with existing formulas and man-ufacturing processes.
To the extent that research and development activities provide the basis for a product that is technically feasible and from which the Group can generate future economic benefits, the period attributable to general research activities constitutes the major part thereof. The scale of development expenses arising after the product has been made marketable is negligible. In consideration of the principle of materiality the intangible asset is not capital-ised in such cases. This approach does not adversely affect the true and fair view of the Group’s state of affairs as regards finan-cial performance, financial position and cash flows.
In addition, SIMONA AG does not capitalise development costs to the extent that costs (expenditure) cannot be reliably allocated to development projects. The costs are recognised as expense in the period in which they are incurred.

36 3776 77
There were no development projects resulting in the capitalisation of intangible assets in the financial year under review or the pre-vious financial year.
Impairment of assetsThe Group assesses at each reporting date whether there is any indication that an asset may be impaired. If such indications are present or an annual impairment test of an asset is required, the Group makes an estimate of the recoverable amount. The recov-erable amount of an asset or a cash-generating unit is the higher of its fair value less costs of disposal and its value in use. If the recoverable amount of an asset, or of all assets of a cash-gener-ating unit, is less than its carrying amount, the carrying amount of the asset or the cash-generating unit shall be reduced to its recov-erable amount. That reduction is an impairment loss.
Impairment of non-financial assetsThe Group determines at the end of each reporting period whether there are observable indications that a non-financial asset or group of non-financial assets is impaired. If such indications are present or if an annual impairment test of an asset or a group of assets is required, the Group makes an estimate of the recover-able amount of each asset or of the group of assets. The recover-able amount of an asset or a cash-generating unit is the higher of its fair value less costs of disposal and its value in use. Impair-ment losses are recognised in profit or loss with-in the expense category that corresponds to the function of the impaired asset.
For the purpose of determining the value in use, the future expected cash flows are discounted to their present value using a pretax discount rate that reflects current market assessments of the time value of money and the risks specific to the asset. The Group bases its impairment tests on detailed budget and fore-casting calculations that are prepared separately for each of the Group’s cash-generating units to which individual assets are assigned. Such budget and fore-casting calculations generally cover a period of four years. As regards periods beyond this time frame, long-term growth rates are determined and applied to the projection of future cash flows subsequent to the fourth year.
Investments and other financial assetsFinancial assets within the meaning of IAS 39 are classified either as financial assets at fair value through profit or loss, as loans and receivables, as held-to-maturity investments or as available-for-sale financial assets. On initial recognition the financial assets are measured at fair value. Additionally, in the case of financial
assets other than those classified as at fair value through profit or loss, transaction costs directly attributable to the acquisition of the asset are accounted for accordingly. The designation of finan-cial assets to the respective measurement categories occurs upon initial recognition. To the extent that they are permitted and neces-sary, reclassifications are performed at the end of the financial year. No reclassifications have been performed to date.
All regular way purchases or sales of financial assets are accounted for at the date of settlement. A regular way purchase or sale is a purchase or sale of a financial asset under a contract whose terms require delivery of the asset within the time frame established generally by regulation or convention in the market-place concerned.
The group of financial assets at fair value through profit or loss comprises financial assets held for trading. A financial asset is classified as held for trading if it is acquired principally for the purpose of selling it in the near term. Derivatives, including embedded derivatives accounted for separately, are also classi-fied as held for trading, with the exception of those derivatives that are designated and effective hedging instruments. Gains and losses on financial assets held for trading are recognised in profit or loss. The Group has not made use of the option to designate financial assets or liabilities as “measured at fair value through profit or loss”.
Derivatives embedded within a host contract are recognised sep-arately at their fair value if their economic characteristics and risks are not closely related to those of the host contract and the host contracts are not held for trading purposes or are not desig-nated as “at fair value through profit or loss”. These embedded derivatives are measured at their fair value; changes to the fair value are recognised in profit or loss. A reassessment is per-formed only upon amendments to the contractual terms and conditions if this leads to a significant change to the cash flows that would otherwise have resulted from the contract.
Non-derivative financial assets, quoted in an active market, with fixed or determinable payments and fixed maturity that an entity has the positive intention and ability to hold to maturity are clas-sified as held-to-maturity investments. After initial recognition held-to-maturity investments are measured at amortised cost using the effective interest method. Gains or losses are recog-nised in profit or loss when the financial asset is derecognised or impaired, and through the amortisation process.
76 77
Non-current assets held for saleSIMONA classifies a non-current asset (or disposal group) as held for sale if its carrying amount will be recovered principally through a sale transaction or a distribution to shareholders rather than through continuing use. For this to be the case, the asset (or dis-posal group) must be available for immediate sale/distribution in its present condition subject only to terms that are usual and customary for sale/distribution of such assets (or disposal groups) and its sale/distribution must be highly probable. Insofar as they refer to the Group statement of financial position, the disclosures made in the notes to the consolidated financial state-ments relate to assets not held for sale. SIMONA reports non-cur-rent assets held for sale (or disposal groups) separately in Note [23]. Non-current assets held for sale and disposal groups are measured at the lower of their carrying amount and fair value less costs to sell, unless the items presented in the disposal group do not fall under the provisions set out in IFRS 5 Non-current Assets Held for Sale and Discontinued Operations.
LeasingWhether an agreement constitutes a lease is determined on the basis of the substance of the transaction detailed in the agree-ment at the time the agreement is concluded. This requires an assessment as to whether the fulfilment of the contractual agree-ment is dependent on the use of a specific asset or specific assets and whether the agreement grants the right to use the asset/assets even if this right is not specifically defined in the agreement.
Finance leases, which transfer to the Group substantially all the risks and rewards incidental to ownership of an asset, are recog-nised as assets in the statement of financial position at the com-mencement of the lease term. As at 31 December 2016, no such finance leases existed within the Group.
Lease payments under an operating lease are recognised in the income statement as an expense on a straight-line basis and are presented as other expense.
Borrowing costsBorrowing costs that are directly attributable to the acquisition, construction or production of a qualifying asset, which is defined as an asset that necessarily takes a substantial period of time to get ready for its intended use or sale, form part of the cost of that asset and are capitalised accordingly. All other borrowing costs are recognised as an expense in the period in which they are
incurred. Borrowing costs are interest and other costs that an entity incurs in connection with the borrowing of funds. No borrow-ing costs have been capitalised by the Group, as it does not pos-sess qualifying assets.
Intangible assetsAcquired and internally generated intangible assets are capital-ised in accordance with IAS 38 if it is probable that the intangible asset will generate future economic benefits and the costs of the intangible asset can be reliably measured. They are measured at cost of purchase or conversion. Intangible assets with a finite useful life are amortised on the basis of the length of that useful life. Amortisation of intangible assets, with the exception of cap-italised development costs, is performed over a useful life of between three and ten years.
Research and development costsThe research and development activities conducted by SIMONA AG are directed principally at the optimisation of production and manufacturing processes (advancement within the area of pro-cess engineering), at changes and improvements to formulas, some of which have been in existence for an extensive period of time, or at fundamental improvements for the purpose of meeting specified quality and inspection requirements, including new test-ing procedures and new areas of application. Generally, these activities do not involve the development of an entirely new product that would sever the link with existing formulas and man-ufacturing processes.
To the extent that research and development activities provide the basis for a product that is technically feasible and from which the Group can generate future economic benefits, the period attributable to general research activities constitutes the major part thereof. The scale of development expenses arising after the product has been made marketable is negligible. In consideration of the principle of materiality the intangible asset is not capital-ised in such cases. This approach does not adversely affect the true and fair view of the Group’s state of affairs as regards finan-cial performance, financial position and cash flows.
In addition, SIMONA AG does not capitalise development costs to the extent that costs (expenditure) cannot be reliably allocated to development projects. The costs are recognised as expense in the period in which they are incurred.

38 3978 79
Loans and receivables are non-derivative financial assets with fixed or determinable payments that are not quoted in an active market. After initial recognition loans and receivables are meas-ured at amortised cost using the effective interest method, less impairments where applicable. Gains or losses are recognised in profit or loss when the loans and receivables are derecognised or impaired, and through the amortisation process.
Available-for-sale financial assets are those non-derivative finan-cial assets that are designated as available for sale or are not classified within one of the three above-mentioned categories. After initial recognition available-for-sale financial assets are measured at fair value. Unrealised gains and losses on availa-ble-for-sale financial assets are recognised directly in equity. If an available-for-sale financial asset is derecognised or impaired, the cumulative gain or loss previously recognised in equity is recog-nised in profit or loss. The fair value of financial instruments traded within organised and active markets is determined on the basis of the market price quoted at the end of the reporting period. The fair value of financial instruments for which no active market exists is determined on the basis of valuation techniques. Valuation techniques include using recent arm’s length market transactions between knowledgeable, willing parties, if available, reference to the current fair value of another instrument that is substantially the same, discounted cash flow analysis and other valuation models.
Held-to-maturity investments as well as loans and receivables are measured at amortised cost. The calculation includes all fees and points paid or received between parties to the contract that are an integral part of the effective interest rate, transaction costs, and all other premiums or discounts, minus any reduction for impairments.
A financial asset (or a part of a financial asset or a part of a group of similar financial assets) is derecognised when the contractual rights to the cash flows from the financial asset expire.
Impairment of financial assetsThe Group determines at the end of each reporting period whether there is any objective evidence that a financial asset or group of financial assets is impaired. If there is objective evidence that an impairment loss on financial assets carried at amortised cost has been incurred, the amount of the impairment loss is meas-ured as the difference between the asset’s carrying amount and the present value of estimated future cash flows discounted at
the financial asset’s original effective interest rate, i.e. the effec-tive interest rate computed at initial recognition. The carrying amount of the asset is reduced through use of an allowance account. The amount of the impairment loss is recognised in profit or loss. If, in a subsequent period, the amount of the impair-ment loss decreases and the decrease can be related objectively to an event occurring after the impairment was recognised, the previously recognised impairment loss is reversed. However, the new carrying amount must not exceed the amortised cost at the date the impairment is reversed. The amount of the reversal is recognised in profit or loss.
If in the case of trade receivables there is objective evidence that not all due amounts will be received in accordance with the agreed invoicing terms and conditions (e.g. likelihood of an insol-vency or significant financial difficulties of the obligor), the carry-ing amount is reduced through use of an allowance account. Receivables are derecognised when they are considered to be uncollectible.
As regards available-for-sale financial assets, the Group deter-mines at the end of each reporting period whether there is any objective evidence that a financial asset or group of financial assets is impaired. When determining the impairment of debt instruments classified as available for sale, the same criteria are used as those applied to financial assets measured at amortised cost. The amount recognised for impairments, however, is the cumulative loss determined as the difference between the amor-tised cost and the current fair value less any impairment losses of this instrument recognised in profit or loss on an earlier occasion.
Investments accounted for using the equity methodAssociates are accounted for using the equity method, an associ-ate being an entity over which the investor has significant influ-ence. On initial recognition the investment in an associate is rec-ognised at cost. On initial recognition any differences between the cost of the investment and the entity’s share of equity has to be determined. This then has to be analysed as to whether it is attrib-utable to hidden reserves or liabilities. Any excess, i.e. positive difference, remaining after the allocation of hidden reserves and assets is to be treated as goodwill and presented in the carrying amount of the investment. Any negative difference is accounted for in profit and loss by increasing the assigned value of the investment.

38 3978 79
Based on the cost of purchase, the carrying amount of the invest-ment is increased or decreased in the subsequent periods by the share of annual profit. Further adjustments to the carrying amount of the investment are required if the equity of the investee has changed due to circumstances accounted for in the other components of profit/loss.
A part of subsequent measurement, write-downs relating to hid-den reserves realised in the context of initial measurement have to be accounted for accordingly and deducted from the share of annual profit. To avoid double recognition, dividends received are to be deducted from the carrying amount.
If there are circumstances indicating that the investment may be impaired, an impairment test is to be conducted in respect of this investment. No separate review of prorata goodwill is conducted as part of this process. The assessment applies to the total carry-ing amount of the investment.
InventoriesInventories are stated at the lower of purchase or conversion cost and net realisable value.
The inventories associated with consumables have been capital-ised at average historical cost. As part of Group accounting, the cost of raw materials is assigned mainly by using the weighted average cost formula. Finished goods are measured at manufac-turing cost (cost of conversion) according to item-by-item calcula-tions based on current operational accounting; in addition to the directly related cost of direct material and units of production, this item also includes special production costs as well as production and material overheads, including depreciation. Financing costs are not accounted for in the cost of conversion. All identifiable risks associated with inventories, particularly relating to holding periods in excess of average duration, diminished usability and net realisable value, are recognised by an appropriate write-down.
The net realisable value is the estimated selling price achievable in the ordinary course of business, less the estimated costs incurred until completion and the estimated costs necessary to make the sale.
Cash and cash equivalentsCash and cash equivalents recognised in the statement of finan-cial position comprise cash on hand, bank balances and short-term deposits with original maturities of less than three months.
As regards the Group statement of cash flows, cash and cash equivalents comprise the aforementioned cash items in addition to overdrafts used by the Group and securities that are readily convertible to cash.
Financial liabilitiesFinancial liabilities within the meaning of IAS 39 are classified either as financial liabilities measured at fair value or as loans. The Group determines the classification of its financial liabilities upon initial recognition. All financial liabilities are measured at fair value upon initial recognition. The Group’s financial liabilities com-prise trade payables, other payables, bank overdrafts, loans and derivative financial instruments.
Interest-bearing borrowingsOn initial recognition, loans are measured at the fair value of the consideration received, having deducted the transaction costs relating to the origination of the loan. After initial recognition inter-est-bearing borrowings are measured at amortised cost using the effective interest method. A financial liability is derecognised when the obligation specified in the contract is discharged, can-celled or when it expires.
Other provisionsOther provisions are recognised when an obligation exists towards a third party, settlement of this obligation is probable and a relia-ble estimate can be made of the amount of the required provision. Other provisions are measured at aggregate costs. Long-term provisions with more than one year to maturity are recognised at their discounted settlement value as at the end of the reporting period.
PensionsThe Group has direct pension plans as well as one indirect pen-sion plan. The indirect pension plan is serviced by SIMONA Sozial-werk GmbH, which manages the plan assets. The plan assets are accounted for in the Group statement of financial position such that the fair value of those assets of SIMONA Sozialwerk GmbH and SIMONA Vermögensverwaltungsgesellschaft der Belegschaft mbH that fulfil the requirements for plan assets are deducted from the benefit obligation of the Group (funding company) when measuring the pension provision to be recognised. The fair value of the plan assets is based on information regarding the market price; in the case of securities traded on public exchanges, it cor-responds to the published purchase price. As the requirements for plan assets specified in IAS 19.8 have been fulfilled, the
78 79
Loans and receivables are non-derivative financial assets with fixed or determinable payments that are not quoted in an active market. After initial recognition loans and receivables are meas-ured at amortised cost using the effective interest method, less impairments where applicable. Gains or losses are recognised in profit or loss when the loans and receivables are derecognised or impaired, and through the amortisation process.
Available-for-sale financial assets are those non-derivative finan-cial assets that are designated as available for sale or are not classified within one of the three above-mentioned categories. After initial recognition available-for-sale financial assets are measured at fair value. Unrealised gains and losses on availa-ble-for-sale financial assets are recognised directly in equity. If an available-for-sale financial asset is derecognised or impaired, the cumulative gain or loss previously recognised in equity is recog-nised in profit or loss. The fair value of financial instruments traded within organised and active markets is determined on the basis of the market price quoted at the end of the reporting period. The fair value of financial instruments for which no active market exists is determined on the basis of valuation techniques. Valuation techniques include using recent arm’s length market transactions between knowledgeable, willing parties, if available, reference to the current fair value of another instrument that is substantially the same, discounted cash flow analysis and other valuation models.
Held-to-maturity investments as well as loans and receivables are measured at amortised cost. The calculation includes all fees and points paid or received between parties to the contract that are an integral part of the effective interest rate, transaction costs, and all other premiums or discounts, minus any reduction for impairments.
A financial asset (or a part of a financial asset or a part of a group of similar financial assets) is derecognised when the contractual rights to the cash flows from the financial asset expire.
Impairment of financial assetsThe Group determines at the end of each reporting period whether there is any objective evidence that a financial asset or group of financial assets is impaired. If there is objective evidence that an impairment loss on financial assets carried at amortised cost has been incurred, the amount of the impairment loss is meas-ured as the difference between the asset’s carrying amount and the present value of estimated future cash flows discounted at
the financial asset’s original effective interest rate, i.e. the effec-tive interest rate computed at initial recognition. The carrying amount of the asset is reduced through use of an allowance account. The amount of the impairment loss is recognised in profit or loss. If, in a subsequent period, the amount of the impair-ment loss decreases and the decrease can be related objectively to an event occurring after the impairment was recognised, the previously recognised impairment loss is reversed. However, the new carrying amount must not exceed the amortised cost at the date the impairment is reversed. The amount of the reversal is recognised in profit or loss.
If in the case of trade receivables there is objective evidence that not all due amounts will be received in accordance with the agreed invoicing terms and conditions (e.g. likelihood of an insol-vency or significant financial difficulties of the obligor), the carry-ing amount is reduced through use of an allowance account. Receivables are derecognised when they are considered to be uncollectible.
As regards available-for-sale financial assets, the Group deter-mines at the end of each reporting period whether there is any objective evidence that a financial asset or group of financial assets is impaired. When determining the impairment of debt instruments classified as available for sale, the same criteria are used as those applied to financial assets measured at amortised cost. The amount recognised for impairments, however, is the cumulative loss determined as the difference between the amor-tised cost and the current fair value less any impairment losses of this instrument recognised in profit or loss on an earlier occasion.
Investments accounted for using the equity methodAssociates are accounted for using the equity method, an associ-ate being an entity over which the investor has significant influ-ence. On initial recognition the investment in an associate is rec-ognised at cost. On initial recognition any differences between the cost of the investment and the entity’s share of equity has to be determined. This then has to be analysed as to whether it is attrib-utable to hidden reserves or liabilities. Any excess, i.e. positive difference, remaining after the allocation of hidden reserves and assets is to be treated as goodwill and presented in the carrying amount of the investment. Any negative difference is accounted for in profit and loss by increasing the assigned value of the investment.

40 4180 81
� Deferred tax liabilities for taxable temporary differences associated with investments in subsidiaries if the timing of the reversal of the temporary difference can be controlled and it is probable that the temporary difference will not reverse in the foreseeable future.
Deferred tax assets and deferred tax liabilities are offset if the Group has a legally enforceable right to set off current tax assets and current tax liabilities and if they relate to the income taxes of the same taxable entity, imposed by the same taxation authority.
c) Value added taxSales revenues, expenses and assets are recognised after deduc-tion of value added tax.
Derivative financial instruments and hedging instrumentsDerivative financial instruments are used solely for hedging pur-poses in order to mitigate currency and interest rate risks arising from operating business. Under IAS 39, all derivative financial instruments, such as interest rate, currency and foreign exchange forward contracts as well as currency options, are to be carried at fair value, irrespective of the purpose such transactions have been entered into by the entity.
The derivative financial instruments do not fulfil the restrictive requirements of IAS 39 applying to the recognition of hedging relationships. Therefore, gains and losses arising from a change in the fair value of derivative financial instruments are recognised immediately in profit or loss.
The fair value of derivative financial instruments is calculated on the basis of market data and generally accepted valuation meth-odologies. The market changes associated with derivative finan-cial instruments are reported in net finance cost/income.
[6] SEGMENT REPORTING
For company management purposes, the Group is organised according to geographic regions and has the three following reportable operating segments:
� Europe � Americas � Asia and Pacific
As was the case in the previous financial year, the segments have been allocated on the basis of the region in which the revenue-generating business unit has its registered office.
All three segments generate their revenues mainly through the sale of semi-finished plastics and pipes, as well as fittings and finished parts. The segment categorised as “Europe” encom-passes the production and sale of semi-finished and finished thermoplastics, profiles, pipes and fittings. The segment catego-rised as “Americas” mainly covers the production and sale of extruded thermoplastic sheets, the emphasis being on aircraft interiors. The segment categorised as “Asia and Pacific” includes the production and sale of semi-finished thermoplastics.
Management assesses earnings before interest and taxes (EBIT) of these segments for the purpose of making decisions as to the distribution of resources and determining the profitability of the business units. Segment profitability is determined on the basis of operating results from operating activities before the effects of financing activities and excluding income tax effects.
As a matter of course, segment information is based on the same principles of presentation and the same accounting poli-cies as those applied to the consolidated financial statements. Receivables, liabilities, revenues and expenses as well as profit/loss between the individual segments are eliminated as part of reconciliation. Internal transfer pricing between the business segments is determined on the basis of competitive market prices charged to unaffiliated third parties (regular way transac-tion). External sales revenue relates to the registered office of the revenue-generating business unit. Capital expenditure relates to additions to intangible assets as well as property, plant and equipment. Segment assets comprise assets that contribute to the achievement of operating profit. Depreciation and amortisation of non-current assets relate to both intangible assets and property, plant and equipment.
80 81
deduction of the plan assets from the obligation of the Group does not give rise to an obligation to consolidate on the part of SIMONA Sozialwerk GmbH and SIMONA Vermögensverwaltungs-gesellschaft der Belegschaft mbH because their sole purpose is to service the pension obligations.
Provisions for pensions are accounted for on the basis of the Pro-jected Unit Credit Method (sometimes known as the accrued benefit method prorated on service or as the benefit/years of service method) (IAS 19, Projected Unit Credit Method). As part of this process, besides pensions and benefits known as at the end of the reporting period, expected future increases in salaries and pensions are accounted for with sufficient reliability. The calcula-tion is based on actuarial reports that take into account specific biometric data.
In accordance with IAS 19, interest expenses and the expected return on plan assets are replaced with a net interest amount. It is calculated by applying the discount rate used to measure defined benefit obligations to the net defined benefit liability (asset). The net interest from a net defined benefit liability (asset) includes the interest expenses attributable to defined benefit obligations and interest income from plan assets. The difference between the interest income on plan assets and the return on plan assets is included in the remeasurement of defined benefit obligations in other comprehensive income for the Group. In accordance with IAS 19, the return on plan assets is calculated on the basis of the discount rate.
The amount recognised as a defined benefit liability is the net total of the present value of the defined benefit obligation less the fair value of plan assets out of which the obligations are to be settled directly.
Government grantsA government grant is not recognised until there is reasonable assurance that the entity will comply with the conditions attaching to it, and that the grant will be received. Grants related to income are presented as part of profit or loss under the heading of “other income” and are recognised on a systematic basis over the peri-ods in which the entity recognises as expenses the related costs for which the grants are intended to compensate.
Revenue recognitionRevenue is recognised when it is probable that the economic benefits associated with a transaction will flow to the Group and the amount of revenue can be measured reliably. Additionally, the following conditions must be satisfied for the recognition of revenue.
a) Sale of goodsRevenue is recognised when the Group has transferred to the buyer the significant risks and rewards of ownership of the goods.
b) InterestRevenue is recognised using the effective interest method when the interest arises.
Taxesa) Current tax assets and current tax liabilitiesCurrent tax liabilities and current tax assets for current and prior periods are measured at the amount expected to be paid to or recovered from the taxation authorities, using the tax rates and tax laws that have been enacted or substantively enacted by the end of the reporting period. Management regularly assesses indi-vidual tax issues as to whether there is any room for interpretation on the basis of applicable tax regulations. Where required, tax liabilities are recognised.
b) Deferred taxesApplying the liability method, deferred taxes are recognised for all temporary differences between the carrying amount of an asset or liability in the statement of financial position and its tax base as well as in connection with consolidation procedures. Addition-ally, a deferred tax asset is recognised for all deductible tempo-rary differences to the extent that it is probable that taxable profit will be available against which the deductible temporary difference can be utilised. Deferred tax assets and liabilities are measured at the tax rates that are expected to apply to the period when the asset is realised or the liability is settled, based on tax rates (and tax laws) that have been enacted or substantively enacted by the end of the reporting period.
Deferred taxes are recognised for all taxable and deductible tem-porary differences, with the exception of:
� Deferred tax liabilities from the initial recognition of goodwill or of an asset or liability in a transaction which is not a busi-ness combination and, at the time of the transaction, affects neither profit for the period nor taxable profit/tax loss.

42 4382 83
SEGMENT INFORMATION BY REGION
Europe Americas Asia and Pacific Total Reconciliation Group
in € ’000 2016 2015 2016 2015 2016 2015 2016 2015 2016 2015 2016 2015
Revenues from external customers 257,269 261,293 90,077 81,705 19,329 17,334 366,675 360,332 0 0 366,675 360,332
Revenues from other segments 6,834 5,402 21 0 0 0 6,855 5,402 –6,855 –5,402 0 0
Segment revenues 264,103 266,695 90,098 81,705 19,329 17,334 373,530 365,734 –6,855 –5,402 366,675 360,332
Other income 7,307 8,390 1,188 1,121 1,025 2,707 9,520 12,218 –920 –1,109 8,600 11,109
Cost of materials 148,232 153,877 41,627 42,258 13,718 11,482 203,577 207,617 –6,855 –5,402 196,722 202,215
Staff costs 54,899 54,337 15,095 14,110 2,404 2,354 72,398 70,801 72,398 70,801
Depreciation/amortisation 8,991 9,160 3,283 2,938 1,426 1,321 13,700 13,419 13,700 13,419
Other expenses1 42,467 41,212 16,281 15,035 4,365 4,560 63,113 60,807 –945 –773 62,168 60,034
Earnings before interest and taxes (EBIT) 17,185 18,295 14,384 9,067 –1,193 –299 30,376 27,063 –221 –358 30,155 26,705
Earnings before taxes (EBT) 15,714 16,953 14,024 8,671 –1,365 –469 28,373 25,155 –221 –362 28,152 24,793
Segment capital expenditure 9,978 11,505 4,077 3,648 1,696 1,034 15,754 16,187 15,754 16,187
Non-current assets 79,740 79,824 59,667 57,314 11,160 11,295 150,567 148,433 150,567 148,433
1 Other expenses within the segment covering the Americas include impairments of €461 thousand (previous year: €0 thousand) relating to assets held for sale; please refer to Note [23].
The following table includes information relating to segment revenues, income and expenses as well as segment results. The differences in respect of the consolidated financial statements are presented in the reconciliation.
GERMANY
in € ’000 2016 2015
Domestic revenue 101,653 101,840
Non-current assets 66,882 66,009
SEGMENT INFORMATION RELATING TO PRODUCT AREAS
in € ’000 2016 2015
Semi-finished and finished parts 289,786 276,884
Pipes and fittings 76,889 83,448
Revenues from external customers 366,675 360,332

42 4382 83
NOTES TO GROUP INCOME STATEMENT
[7] SALES REVENUE
Sales revenue is attributable solely to the sale of semi-finished plastics, pipes and fittings as well as finished parts. The classifi-cation of sales revenue by region and product area is outlined in segment reporting – Note [6].
[8] OTHER INCOME
Other income comprises the following items:
in € ’000 2016 2015
Income from currency translation 3,750 8,283
Reversal of provisions /accruals 1,278 1,616
Income from disposal of assets 1,135 56
Income from services and commissions 211 255
Income from rental and lease 61 189
Miscellaneous other income 2,165 710
8,600 11,109
Income from the disposal of assets is mainly attributable to the gain on disposal of €1,032 thousand from the sale of an office and storage facility owned by the sales company in France. Mis-cellaneous other income includes the reimbursement of energy tax of €1,325 thousand attributable to prior periods.
[9] COST OF MATERIALS
The cost of materials includes the following items:
in € ’000 2016 2015
Raw materials and consumables used 195,084 200,678
Cost of purchased services 1,638 1,537
196,722 202,215
[10] STAFF COSTS
Staff costs include the following items:
in € ’000 2016 2015
Wages and salaries 56,954 54,633
of which from long-term employee benefits 777 235
Expenses relating to social security 11,105 11,249
Expenses relating to old-age provision and pensions 4,339 4,919
72,398 70,801
Staff costs include employment termination indemnities totalling €219 thousand (previous year: €37 thousand). Expenses relating to social security include defined contribution plans governed by German legislation (statutory pension insurance) totalling €3,976 thousand (previous year: €2,861 thousand; attributable to SIMONA AG). As regards the internal multifinanced defined contri-bution plan, the total expense for SIMONA AG was €29 thousand (previous year: €24 thousand) in the period under review.
[11] RESEARCH AND DEVELOPMENT EXPENSES
Research and development expenses amounted to €3,950 thousand in the period under review (previous year: €3,608 thousand). Expenses are mainly comprised of staff costs, material costs and depreciation of property, plant and equipment. No development costs were capitalised in the financial year under review.
82 83
SEGMENT INFORMATION BY REGION
Europe Americas Asia and Pacific Total Reconciliation Group
in € ’000 2016 2015 2016 2015 2016 2015 2016 2015 2016 2015 2016 2015
Revenues from external customers 257,269 261,293 90,077 81,705 19,329 17,334 366,675 360,332 0 0 366,675 360,332
Revenues from other segments 6,834 5,402 21 0 0 0 6,855 5,402 –6,855 –5,402 0 0
Segment revenues 264,103 266,695 90,098 81,705 19,329 17,334 373,530 365,734 –6,855 –5,402 366,675 360,332
Other income 7,307 8,390 1,188 1,121 1,025 2,707 9,520 12,218 –920 –1,109 8,600 11,109
Cost of materials 148,232 153,877 41,627 42,258 13,718 11,482 203,577 207,617 –6,855 –5,402 196,722 202,215
Staff costs 54,899 54,337 15,095 14,110 2,404 2,354 72,398 70,801 72,398 70,801
Depreciation/amortisation 8,991 9,160 3,283 2,938 1,426 1,321 13,700 13,419 13,700 13,419
Other expenses1 42,467 41,212 16,281 15,035 4,365 4,560 63,113 60,807 –945 –773 62,168 60,034
Earnings before interest and taxes (EBIT) 17,185 18,295 14,384 9,067 –1,193 –299 30,376 27,063 –221 –358 30,155 26,705
Earnings before taxes (EBT) 15,714 16,953 14,024 8,671 –1,365 –469 28,373 25,155 –221 –362 28,152 24,793
Segment capital expenditure 9,978 11,505 4,077 3,648 1,696 1,034 15,754 16,187 15,754 16,187
Non-current assets 79,740 79,824 59,667 57,314 11,160 11,295 150,567 148,433 150,567 148,433
1 Other expenses within the segment covering the Americas include impairments of €461 thousand (previous year: €0 thousand) relating to assets held for sale; please refer to Note [23].
The following table includes information relating to segment revenues, income and expenses as well as segment results. The differences in respect of the consolidated financial statements are presented in the reconciliation.
GERMANY
in € ’000 2016 2015
Domestic revenue 101,653 101,840
Non-current assets 66,882 66,009
SEGMENT INFORMATION RELATING TO PRODUCT AREAS
in € ’000 2016 2015
Semi-finished and finished parts 289,786 276,884
Pipes and fittings 76,889 83,448
Revenues from external customers 366,675 360,332

44 4584 85
Changes to the tax rates of the consolidated subsidiaries are presented below: On 27 November 2014, a gradual reduction in corporation tax was agreed in Spain, taking effect on 1 January 2015. In 2016, the corporation tax was reduced from 28 per cent to 25 per cent (2015 from 30 per cent to 28 per cent). A reduction in corporation tax in the United Kingdom from 21 per cent (2015) to 20 per cent in 2016 was implemented under the provisions of the Finance Act 2016.
At 31 December 2016, the potential credit for the reduction of corporation tax, which results from the provisions set out in Section 37 and 38 KStG, was €739 thousand (previous year: €1,478 thou-sand). In the period under review, the credit for the reduction of corporation tax was measured at the present value to €718 thou-sand (previous year: €1,410 thousand). The payout of the remain-ing corporation tax credit will be made in one remaining annual instalment of €739 thousand in 2017. To the extent that these payments do not fall due within one year, the items are accounted for in the statement of financial position as non-current assets. Payments due within one year are carried as current assets.
Deferred taxAt the end of the reporting period, deferred tax assets and deferred tax liabilities were as follows:
GROUP STATEMENT OF FINANCIAL POSITION
in € ’000 31/12/2016 31/12/2015
Deferred tax liabilities
Goodwill 1,512 1,011
Other intangible assets –492 –114
Non-current assets 7,987 7,701
Inventories 2,926 3,380
Receivables and other assets 2,598 2,712
Other provisions and liabilities 96 19
Other items 2 1
14,629 14,710
Deferred tax assets
Provisions for pensions 17,767 15,011
Other provisions and liabilities 265 207
Inventories 41 309
Receivables and other assets 9 11
Loss carryforwards and tax credits 528 3,327
Non-current assets 154 29
Other items 356 8
19,120 18,902
Set-off –11,479 –14,511
Deferred tax assets 7,641 4,391
Deferred tax liabilities –3,150 –199
Net balance sheet position 4,491 4,192
The net balance sheet position of deferred taxes changed as follows:
in € ’000 2016 2015
Beginning of the period 1 January 4,192 9,561
Income tax expense –1,804 –2,451
Amount recognised directly in equity (total comprehensive income) 2,244 –2,301
Currency translation –141 96
Other adjustments 0 –713
End of period 31 December 4,491 4,192
At the end of the reporting period, loss carryforwards amounted to €6,098 thousand (previous year: €8,227 thousand). Deferred tax assets of €1,446 thousand (previous year: €6,545 thousand) were recognised for €492 thousand (previous year: €3,054 thou-sand) of the loss carryforwards mentioned above. Beyond this, no other deferred tax assets were recognised, as the losses may not be used for the purpose of set-off with the taxable profit of other Group companies. Furthermore, the loss carryforwards are attrib-utable to subsidiaries that have incurred losses over a period of several years, and at present there is no reasonably reliable indi-cation that the earnings situation of these entities will improve so significantly in the short term that future taxable profit will be available against which the unused tax losses can be utilised.
Expiry date of tax loss carryforwards:
in € ’000 2016 2015
Between 3 and 20 years 3,343 8,227
Indefinite carryforward 0 0
3,343 8,227
Deferred tax assets of around €28 thousand (previous year: €2,235 thousand) are expected to be realised in the subsequent financial year.
84 85
[12] OTHER EXPENSES
in € ’000 2016 2015
Outward freight 14,893 15,142
Other selling expenses 10,398 8,318
Maintenance expenses 11,039 10,438
Other administrative expenses 8,199 8,235
Expenses for packaging material 7,640 7,233
Other operating costs 2,186 2,332
Rental and lease expenses 1,789 2,400
Losses from disposal of assets 319 108
Expenses from foreign currency translation 2,452 3,567
Other 3,253 2,261
62,168 60,034
The rental and lease expenses are mainly attributable to rental agreements for dispatch warehouses and the property for the production facility in the United States. The rental agreements have various contractual maturities (3 to 30 years); some of the rental agreements include options for the extension of rental periods. All rental and lease agreements are structured as oper-ating leases within the meaning of IAS 17. As at 31 December 2016, no finance leases existed within the Group.
[13] NET FINANCE INCOME/COST
in € ’000 2016 2015
Finance income 212 153
of which from the measurement of derivatives 0 16
of which from loans and receivables 163 60
of which others 49 77
in € ’000 2016 2015
Finance costs 2,374 2,195
of which interest expenses from termination benefits 2,078 1,970
of which from borrowings and financial liabilities 296 225
These items relate solely to interest income and interest expenses.
[14] INCOME TAXES
The principal elements of income tax expense for the 2016 and 2015 financial years are as follows:
GROUP INCOME STATEMENT
in € ’000 2016 2015
Current tax
Current tax expense 6,845 5,045
Adjustments of current tax attributable to previ-ous periods –32 –10
Deferred tax
Origination and reversal of temporary differences –995 1,564
Change in loss carry forwards and tax credits recognised 2,799 887
Income tax expense reported in the Group income statement 8,617 7,486
Reconciliation between income tax expense and the product of profit for the year carried in the statement of financial position and the tax rate applicable to the Group for the 2016 and 2015 financial years is as follows:
in € ’000 2016 2015
Profit before taxes 28,152 24,793
Income tax expense at German tax rate of 29.48 % (previous year: 29.48 %) 8,299 7,309
Adjustments of current tax attributable to previous periods –32 –10
Unrecognised deferred tax assets relating to tax losses 394 370
Loss carryforwards used in connection with defer-red tax assets not recognised in previous year –795 –419
Capitalisation of deferred tax assets relating to tax losses 0 –2,529
Tax effect of non-deductible expenses 104 289
Tax rate differences 601 159
Tax-free dividend income 23 22
Other tax-free income –595 –118
Tax effects of permanent differences 0 565
Adjustments to carrying amount for loss carryforwards and tax credits 366 553
Other tax effects not attributable to the period 0 953
Other 252 342
Income tax expense at effective tax rate of 30.6 % (previous year: 30.2 %) 8,617 7,486
Income tax expense reported in the Group income statement 8,617 7,486

46 4786 87
[15] EARNINGS PER SHARE
For the calculation of basic earnings per share, the profit or loss attributable to ordinary equity holders of the parent entity shares is divided by the weighted average number of ordinary shares outstanding during the year. There were no dilutive effects in the 2016 financial year or prior-year reporting period.
The following table presents the amounts relevant to the calcula-tion of basic and diluted earnings per share:
in € ’000 or units of 1,000 2016 2015
Profit or loss attributable to ordinary equity holders of the parent company 19,486 17,270
Weighted average number of ordinary shares (without treasury shares) for the purpose of calculating basic earnings per share 600 600
Dilutive effects 0 0
Weighted average number of ordinary shares (without treasury shares) for the purpose of calculating diluted earnings per share 600 600
Basic earnings per share (in euro) 32.48 28.78
Diluted earnings per share (in euro) 32.48 28.78
No transactions with ordinary shares occurred between the end of the reporting period and the preparation of the consolidated financial statements.
[16] PAID AND PROPOSED DIVIDENDS
During the financial year a dividend, attributable to the ordinary shares of the parent company, in the amount of €10.00 (previous year: €8.00) per share was declared and distributed. The total payment made in the financial year under review amounted to €6,000 thousand (previous year: €4,800 thousand).
A dividend proposal of €12.00 per share (previous year: €10.00 per share) will be submitted to the Annual General Meeting of Shareholders. The proposed total dividend was not recognised as a liability at the end of the reporting period. The corresponding payment would total €7,200 thousand (previous year: €6,000 thousand).
NOTES TO THE GROUP STATEMENT OF FINANCIAL POSITION
[17] INTANGIBLE ASSETS
31. DEZEMBER 2016
in € ’000 Patents and licences
Customer base
Goodwill Total
Balance at 1 January 2016 (Cost of purchase/conversion, taking into account accumu-lated amortisation and impair-ments) 1,316 5,549 27,065 33,930
Additions 302 0 0 302
Transfer 43 0 0 43
Depreciation/amortisation during the financial year –441 –934 0 –1,375
Transfer depreciation/amortisation 200 –200 0 0
Effects of changes in foreign currency exchange rates –34 135 876 977
Balance at 31 December 2016 (Cost of purchase/conversion, taking into account accumu-lated amortisation and impair-ments) 1,386 4,550 27,941 33,877
Balance at 1 January 2016
Cost of purchase or conver-sion (gross carrying amount) 8,354 7,305 27,781 43,440
Accumulated depreciation/amortisation –7,038 –1,756 –716 –9,510
Carrying amount 1,316 5,549 27,065 33,930
Balance at 31 December 2016
Cost of purchase or conver-sion (gross carrying amount) 8,131 7,545 28,657 44,333
Accumulated depreciation/amortisation –6,745 –2,995 –716 –10,456
Carrying amount 1,386 4,550 27,941 33,887

46 4786 87
Goodwill was as follows:
in € ’000 31/12/2015
Addi-tions/disposals
Amortisa-tion
Change in foreign exchange rate
31/12/2016
Boltaron Inc., USA 24,547 0 0 805 25,352
SIMONA AMERICA Inc., Laminations Inc., USA 2,375 0 0 71 2,446
Other 143 0 0 0 143
27,065 0 0 876 27,941
In accordance with the method applied in the previous year, pa tents and licences are amortised systematically over their eco-nomic life of three to five years by using the straight-line method; customer relationships are amortised over an economic life of five to ten years by using the straight-line method. The residual book value of customer relationships resulting from acquisitions is as follows:
31/12/2016 Residual book valuein € ‘000
Remaining period of amortisation
Boltaron Inc., USA 4,104 4 years
SIMONA AMERICA Inc./ Laminations Inc., USA 446 7 years
Total 4,550
31/12/2015Residual book value
in € ‘000Remaining
period of amortisation
Boltaron Inc., USA 4,923 5 years
SIMONA AMERICA Inc./ Laminations Inc., USA 626 8 years
Total 5,549
Impairment of goodwillThe Group conducts the mandatory annual impairment test for significant goodwill in the fourth quarter of the financial year, applying the method outlined in Note [5] “Impairment of Assets”. As part of the impairment test conducted in the financial year under review in respect of the cash-generating units (CGU), the recoverable amounts on the basis of the value in use were esti-mated to be higher than the carrying amounts. No impairment losses were required as part of the goodwill impairment test con-ducted for the financial year under review.
The fundamental assumptions made in connection with the impair-ment test are based primarily on projected market growth rates as well as Group estimates/assessments provided by the respective sales and purchasing departments. The assumptions in the finan-cial year under review are based on the parameters presented in the following table. Projections relating to cash flows are based on a period of four years, subsequently transitioning into perpetuity.
GOODWILL IMPAIRMENT TEST
31/12/2016 31/12/2015
Boltaron Inc.
Revenue growth forecasting period % 4.0 – 5.0 3.0
EBITDA margin forecasting period % 32 –34 26 –27
Duration forecasting period years 4 4
Revenue growth at end of forecasting period % 1.5 1.5
EBITDA margin at end of forecasting period % 34 26.3
Discount rate at end of forecasting period % 8.9 9.3
Carrying amount goodwill € '000 25,352 24,547
Recoverable amount (value in use of the CGU) € '000 152,865 78,677
Required reduction in carrying amount € '000 — —
An increase or decrease in the discount rate by plus 0.5 per cent or minus 0.5 per cent does not result in an impairment of good-will. No reduction in the carrying amount would be required even in the event of a significant and unexpected deterioration in the assumptions made.
31/12/2016 31/12/2015
SIMONA AMERICA Inc./Laminations Inc.
Revenue growth forecasting period % 1.5 – 2.0 1.8 –5.3
EBITDA margin forecasting period % 9.0 –9.5 4.6 –6.8
Duration forecasting period years 4 4
Revenue growth at end of forecasting period % 1.5 1.5
EBITDA margin at end of forecasting period % 9.4 6.8
Discount rate at end of forecasting period % 7.6 8.8
Carrying amount goodwill € '000 2,446 2,375
Recoverable amount (value in use of the CGU) € '000 43,233 33,720Required reduction in carrying amount € '000 — —
86 87
[15] EARNINGS PER SHARE
For the calculation of basic earnings per share, the profit or loss attributable to ordinary equity holders of the parent entity shares is divided by the weighted average number of ordinary shares outstanding during the year. There were no dilutive effects in the 2016 financial year or prior-year reporting period.
The following table presents the amounts relevant to the calcula-tion of basic and diluted earnings per share:
in € ’000 or units of 1,000 2016 2015
Profit or loss attributable to ordinary equity holders of the parent company 19,486 17,270
Weighted average number of ordinary shares (without treasury shares) for the purpose of calculating basic earnings per share 600 600
Dilutive effects 0 0
Weighted average number of ordinary shares (without treasury shares) for the purpose of calculating diluted earnings per share 600 600
Basic earnings per share (in euro) 32.48 28.78
Diluted earnings per share (in euro) 32.48 28.78
No transactions with ordinary shares occurred between the end of the reporting period and the preparation of the consolidated financial statements.
[16] PAID AND PROPOSED DIVIDENDS
During the financial year a dividend, attributable to the ordinary shares of the parent company, in the amount of €10.00 (previous year: €8.00) per share was declared and distributed. The total payment made in the financial year under review amounted to €6,000 thousand (previous year: €4,800 thousand).
A dividend proposal of €12.00 per share (previous year: €10.00 per share) will be submitted to the Annual General Meeting of Shareholders. The proposed total dividend was not recognised as a liability at the end of the reporting period. The corresponding payment would total €7,200 thousand (previous year: €6,000 thousand).
NOTES TO THE GROUP STATEMENT OF FINANCIAL POSITION
[17] INTANGIBLE ASSETS
31. DEZEMBER 2016
in € ’000 Patents and licences
Customer base
Goodwill Total
Balance at 1 January 2016 (Cost of purchase/conversion, taking into account accumu-lated amortisation and impair-ments) 1,316 5,549 27,065 33,930
Additions 302 0 0 302
Transfer 43 0 0 43
Depreciation/amortisation during the financial year –441 –934 0 –1,375
Transfer depreciation/amortisation 200 –200 0 0
Effects of changes in foreign currency exchange rates –34 135 876 977
Balance at 31 December 2016 (Cost of purchase/conversion, taking into account accumu-lated amortisation and impair-ments) 1,386 4,550 27,941 33,877
Balance at 1 January 2016
Cost of purchase or conver-sion (gross carrying amount) 8,354 7,305 27,781 43,440
Accumulated depreciation/amortisation –7,038 –1,756 –716 –9,510
Carrying amount 1,316 5,549 27,065 33,930
Balance at 31 December 2016
Cost of purchase or conver-sion (gross carrying amount) 8,131 7,545 28,657 44,333
Accumulated depreciation/amortisation –6,745 –2,995 –716 –10,456
Carrying amount 1,386 4,550 27,941 33,887

48 4988 89
The value in use of the CGU SIMONA AMERICA Inc./Laminations Inc. would correspond to the carrying amounts if the following key assumptions were to be changed separately:
from to
Revenue growth forecasting period % 1.5 – 2.0 0.5 – 1.3
EBITDA margin forecasting period % 9.0 – 9.5 4.5 –5.0
Revenue growth at end of forecast-ing period % 1.5 0.4
31 DECEMBER 2015
in € ’000 Patents and licences
Customer base
Goodwill Total
Balance at 1 January 2015 (Cost of purchase/conversion, taking into account accumu-lated amortisation and impair-ments) 1,362 5,826 24,343 31,531
Additions 142 0 0 142
Transfer –444 0 716 272
Depreciation/amortisation during the financial year –447 –931 0 –1,378
Transfer depreciation/amortisation 716 0 –716 0
Effects of changes in foreign currency exchange rates –13 654 2,722 3,363
Balance at 31 December 2015 (Cost of purchase/conversion, taking into account accumu-lated amortisation and impair-ments) 1,316 5,549 27,065 33,930
Balance at 1 January 2015
Cost of purchase or conversion (gross carrying amount) 8,655 6,164 24,343 39,162
Accumulated depreciation/amortisation –7,293 –338 0 –7,631
Carrying amount 1,362 5,826 24,343 31,531
Balance at 31 December 2015
Cost of purchase or conversion (gross carrying amount) 8,354 7,305 27,781 43,440
Accumulated depreciation/amortisation –7,038 –1,756 –716 –9,510
Carrying amount 1,316 5,549 27,065 33,930
[18] PROPERTY, PLANT AND EQUIPMENT
31 DECEMBER 2016
in € ’000 Land andbuildings
Plant and equipment
Prepay-mentsand assets under con-struction
Total
Balance at 1 January 2016 (Cost of purchase/conver-sion, taking into account accumulated amortisation and impairments) 38,700 62,788 12,345 113,833
Additions 1,846 5,693 7,912 15,451
Transfer 2,403 6,222 –8,668 –43
Transfer depreciation/amortisation –83 83 0 0
Disposals –9 –561 0 –570
Depreciation/amortisation during the financial year –2,042 –10,283 0 –12,325
Effects of changes inforeign currency exchange rates 207 106 31 344
Balance at 31 December 2016 (Cost of purchase/conver-sion, taking into account accumulated amortisation and impairments) 41,022 64,048 11,620 116,690
Balance at 1 January 2016
Cost of purchase or conversion 75,652 239,860 12,345 327,857
Accumulated depreciation/amortisation and impair-ments –36,952 –177,072 0 –214,024
Carrying amount 38,700 62,788 12,345 113,833
Balance at 31 December 2016
Cost of purchase or conversion 79,055 240,669 11,620 331,344
Accumulated depreciation/amortisation and impair-ments –38,033 –176,621 0 –214,654
Carrying amount 41,022 64,048 11,620 116,690
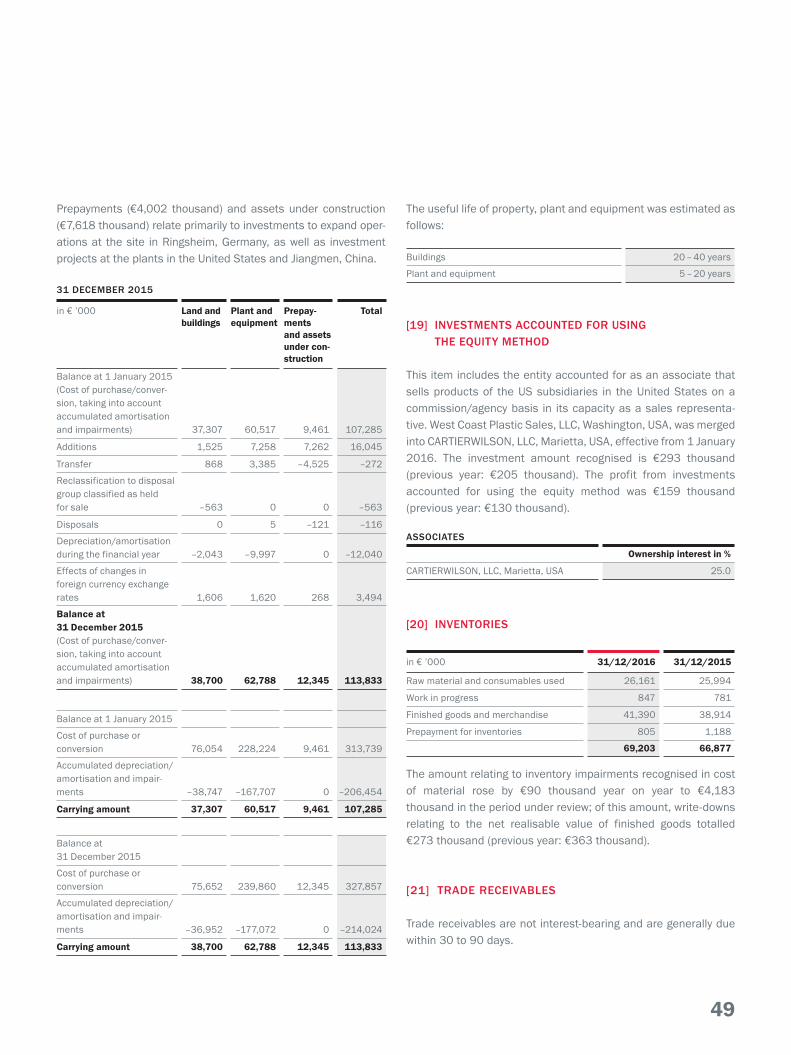
48 4988 89
Prepayments (€4,002 thousand) and assets under construction (€7,618 thousand) relate primarily to investments to expand oper-ations at the site in Ringsheim, Germany, as well as investment projects at the plants in the United States and Jiangmen, China.
31 DECEMBER 2015
in € ’000 Land andbuildings
Plant and equipment
Prepay-mentsand assets under con-struction
Total
Balance at 1 January 2015 (Cost of purchase/conver-sion, taking into account accumulated amortisation and impairments) 37,307 60,517 9,461 107,285
Additions 1,525 7,258 7,262 16,045
Transfer 868 3,385 –4,525 –272
Reclassification to disposal group classified as held for sale –563 0 0 –563
Disposals 0 5 –121 –116
Depreciation/amortisation during the financial year –2,043 –9,997 0 –12,040
Effects of changes in foreign currency exchange rates 1,606 1,620 268 3,494
Balance at 31 December 2015 (Cost of purchase/conver-sion, taking into account accumulated amortisation and impairments) 38,700 62,788 12,345 113,833
Balance at 1 January 2015
Cost of purchase or conversion 76,054 228,224 9,461 313,739
Accumulated depreciation/amortisation and impair-ments –38,747 –167,707 0 –206,454
Carrying amount 37,307 60,517 9,461 107,285
Balance at 31 December 2015
Cost of purchase or conversion 75,652 239,860 12,345 327,857
Accumulated depreciation/amortisation and impair-ments –36,952 –177,072 0 –214,024
Carrying amount 38,700 62,788 12,345 113,833
The useful life of property, plant and equipment was estimated as follows:
Buildings 20 – 40 years
Plant and equipment 5 – 20 years
[19] INVESTMENTS ACCOUNTED FOR USING THE EQUITY METHOD
This item includes the entity accounted for as an associate that sells products of the US subsidiaries in the United States on a commission/agency basis in its capacity as a sales representa-tive. West Coast Plastic Sales, LLC, Washington, USA, was merged into CARTIERWILSON, LLC, Marietta, USA, effective from 1 January 2016. The investment amount recognised is €293 thousand (previous year: €205 thousand). The profit from investments accounted for using the equity method was €159 thousand (previous year: €130 thousand).
ASSOCIATES
Ownership interest in %
CARTIERWILSON, LLC, Marietta, USA 25.0
[20] INVENTORIES
in € ’000 31/12/2016 31/12/2015
Raw material and consumables used 26,161 25,994
Work in progress 847 781
Finished goods and merchandise 41,390 38,914
Prepayment for inventories 805 1,188
69,203 66,877
The amount relating to inventory impairments recognised in cost of material rose by €90 thousand year on year to €4,183 thousand in the period under review; of this amount, write-downs relating to the net realisable value of finished goods totalled €273 thousand (previous year: €363 thousand).
[21] TRADE RECEIVABLES
Trade receivables are not interest-bearing and are generally due within 30 to 90 days.
88 89
The value in use of the CGU SIMONA AMERICA Inc./Laminations Inc. would correspond to the carrying amounts if the following key assumptions were to be changed separately:
from to
Revenue growth forecasting period % 1.5 – 2.0 0.5 – 1.3
EBITDA margin forecasting period % 9.0 – 9.5 4.5 –5.0
Revenue growth at end of forecast-ing period % 1.5 0.4
31 DECEMBER 2015
in € ’000 Patents and licences
Customer base
Goodwill Total
Balance at 1 January 2015 (Cost of purchase/conversion, taking into account accumu-lated amortisation and impair-ments) 1,362 5,826 24,343 31,531
Additions 142 0 0 142
Transfer –444 0 716 272
Depreciation/amortisation during the financial year –447 –931 0 –1,378
Transfer depreciation/amortisation 716 0 –716 0
Effects of changes in foreign currency exchange rates –13 654 2,722 3,363
Balance at 31 December 2015 (Cost of purchase/conversion, taking into account accumu-lated amortisation and impair-ments) 1,316 5,549 27,065 33,930
Balance at 1 January 2015
Cost of purchase or conversion (gross carrying amount) 8,655 6,164 24,343 39,162
Accumulated depreciation/amortisation –7,293 –338 0 –7,631
Carrying amount 1,362 5,826 24,343 31,531
Balance at 31 December 2015
Cost of purchase or conversion (gross carrying amount) 8,354 7,305 27,781 43,440
Accumulated depreciation/amortisation –7,038 –1,756 –716 –9,510
Carrying amount 1,316 5,549 27,065 33,930
[18] PROPERTY, PLANT AND EQUIPMENT
31 DECEMBER 2016
in € ’000 Land andbuildings
Plant and equipment
Prepay-mentsand assets under con-struction
Total
Balance at 1 January 2016 (Cost of purchase/conver-sion, taking into account accumulated amortisation and impairments) 38,700 62,788 12,345 113,833
Additions 1,846 5,693 7,912 15,451
Transfer 2,403 6,222 –8,668 –43
Transfer depreciation/amortisation –83 83 0 0
Disposals –9 –561 0 –570
Depreciation/amortisation during the financial year –2,042 –10,283 0 –12,325
Effects of changes inforeign currency exchange rates 207 106 31 344
Balance at 31 December 2016 (Cost of purchase/conver-sion, taking into account accumulated amortisation and impairments) 41,022 64,048 11,620 116,690
Balance at 1 January 2016
Cost of purchase or conversion 75,652 239,860 12,345 327,857
Accumulated depreciation/amortisation and impair-ments –36,952 –177,072 0 –214,024
Carrying amount 38,700 62,788 12,345 113,833
Balance at 31 December 2016
Cost of purchase or conversion 79,055 240,669 11,620 331,344
Accumulated depreciation/amortisation and impair-ments –38,033 –176,621 0 –214,654
Carrying amount 41,022 64,048 11,620 116,690

50 5190 91
Other reserves include currency translation effects attributable to exchange differences occurring upon translation of the financial statements of foreign subsidiaries as well as the foreign exchange effects (accounted for in equity) of translating net investments in foreign subsidiaries.
Non-controlling interestsThis item relates solely to non-controlling interests in DEHOPLAST POLSKA Sp. z o.o., Kwidzyn, Poland. The non-controlling interests correspond to the applicable voting rights and amount to 49 per cent. There are no restraints in place as regards the right of SIMONA AG to access or use assets of this subsidiary and to meet contractual obligations. Revenue generated by this entity amounted to €2,137 thousand in the period under review (previous year: €2,012 thousand). The total payment made in the financial year under review amounted to €29 thousand (previous year: €18 thousand). The company’s balance sheet total stands at €989 thousand and is mainly composed of current assets (€983 thousand) and current liabilities (€413 thousand).
[26] FINANCIAL LIABILITIES
Financial liabilities are comprised of the following items:
in € ’000 Due date 31/12/2016 31/12/2015
Non-current financial liabilities
Pro-rata bank loan of €26,229 thousand (nominal amount), principal repayments due after 31/12/2017 2018 – 2024 22,111 3,851
22,111 3,851
Current financial liabilities
Bank overdrafts Immediately 0 2,538
Pro-rata bank loan of €26,229 thousand (nominal amount), principal repayments due up to 31/12/2017
01/2017–12/2017 3,444 398
3,444 2,936
As regards loans from banks, fixed interest rates of between 1.8 per cent and 2.1 per cent have been agreed in respect of KfW funds. Interest is computed either on the basis of the nomi-nal amount of the loan or the remaining amount of the loan.
the subsidiaries in China. At the end of the reporting period cash attributable to the Chinese entities amounted to €1,895 thousand (previous year: €2,715 thousand).
As at 31 December 2016, the Group had undrawn borrowing facil-ities of €18,873 thousand (previous year: €42,775 thousand). The year-on-year decline is attributable primarily to the utilisation of KfW loans of €21,980 thousand as well as undrawn KfW funds of €4,520 thousand.
[25] EQUITY
Changes in equity are presented in a separate Group statement of changes in equity.
Issued capitalAs at 31 December 2016, the share capital of SIMONA AG was divided into 600,000 no-par-value shares. These shares are clas-sified as ordinary bearer shares. Each no-par-value share has a notional interest of €25.83 in the company’s share capital. The ordinary shares have been issued and fully paid in.
in € ’000 31/12/2016 31/12/2015
Share capital 15,500 15,500
15,500 15,500
As was the case in the previous financial year, SIMONA AG has no treasury shares.
Capital reserve
in € ’000 31/12/2016 31/12/2015
Share premium from the issuance of stock 15,274 15,274
15,274 15,274
Capital reserve include the share premium from the issuance of SIMONA AG stock. There was no increase in capital reserve in the period under review.
Other reserves
in € ’000 31/12/2016 31/12/2015
Currency translation effects 12,354 11,167
12,354 11,167
90 91
in € ’000 31/12/2016 31/12/2015
Carrying amount 52,186 51,140
Neither impaired nor past due at the end of the reporting period 40,623 37,486
Past due and not impaired within the following time ranges
up to 30 days 6,130 5,120
between 31 and 60 days 1,680 1,718
between 61 and 90 days 616 878
between 91 and 120 days 535 428
more than 120 days 2,149 1,956
As regards the trade receivables that were neither impaired nor past due, there were no indications at the end of the reporting period that customers will fail to meet their payment obligations.
The changes to valuation allowances for trade receivables are outlined below:
in € ’000 31/12/2016 31/12/2015
Balance of specific allowances at 1 January 1,961 1,956
Exchange differences +111 +27
Allocated +288 +296
Utilised –47 –285
Reversed –84 –33
Balance of specific allowances at 31 December 2,229 1,961
The following table includes expenses attributable to the derecog-nition of trade receivables as well as income from amounts received in connection with derecognised trade receivables. Expenses attributable to the derecognition of trade receivables are reported as other expenses, while income attributable to amounts received in connection with derecognised trade receiv-ables is accounted for as other income.
in € ’000 2016 2015
Expenses attributable to the derecognition of trade receivables 235 140
Income attributable to amounts received in connection with derecognised trade receivables 57 80
[22] OTHER ASSETS AND TAX ASSETS
in € ’000 31/12/2016 31/12/2015
Receivables from value-added tax 546 1,853
Prepayments 51 1,290
Advance payments for future periods 1,001 762
Receivables from energy tax 691 66
Other receivables 341 639
2,630 4,610
At the end of the reporting period, other assets were neither impaired nor past due.
Total tax assets of €768 thousand (previous year: €1,690 thou-sand) include a reimbursement right in respect of credits for the reduction of corporation tax relating to SEStEG.
[23] ASSETS HELD FOR SALE
Assets held for sale include property, plant and equipment of €3,785 thousand (previous year: €4,696 thousand). This item related to the amalgamation of production sites in the Americas segment. Within the context of ongoing sales activities an estate agent determined a value indication, on the basis of which an impairment of €461 thousand was recognised. This impairment was included in other expenses. The effect of currency translation is equivalent to €113 thousand. An interested party is considering the purchase of this property. The sale is expected to be trans-acted over the course of the 2017 financial year. In July 2016 an office and storage facility owned by the sales company in France was sold; this related to the segment covering Europe. The gain on disposal was €1,032 thousand and has been recognised in profit and loss as other income.
[24] CASH AND CASH EQUIVALENTS
in € ’000 31/12/2016 31/12/2015
Bank balances and cash on hand 74,759 31,892
74,759 31,892
Bank balances bear interest on the basis of floating interest rates applicable to balances payable on demand. No restraints on use are known apart from the local statutory restrictions applicable to

52 5392 93
The overdraft facility of SIMONA AG is subject to a floating interest rate based on EONIA (Euro Over Night Index Average).
Other financial liabilities are comprised of the following items:
in € ’000 Due date 31/12/2016 31/12/2015
Non-current other financial liabilities
Liabilities due to purchase price obligations 04/2017 0 2,060
Other 58 127
58 2,187
Current other financial liabilities
Liabilities due to purchase price obligations 04/2017 2,174 2,096
Accounts receivable with credit balances Immediately 1,184 1,268
3,358 3,364
[27] PENSIONS
The majority of employees within SIMONA AG are entitled to post-employment benefits attributable to pension plan agree-ments. The aforementioned plans are structured as final salary pension plans in the case of both personnel employed on the basis of collective wage agreements and managerial staff, includ-ing members and former members of the Management Board. These relate to benefits in respect of retirement, disability and surviving dependants.
In order to mitigate the risks associated with defined benefit plans, particularly as regards longevity, inflation and salary increases, SIMONA introduced multifinanced defined contribution plans for employees joining the company on or after 1 January 2009.
With the exception of payments to SIMONA Sozialwerk GmbH, no contributions are made to funds, cf. Note [28].
The following table includes a breakdown of the expense items recognised in the Group income statement in connection with retirement benefits as well as the amounts carried in the state-ment of financial position for the respective plans.
The changes in the liabilities of defined benefit obligations (DBO) are as follows:
in € ’000 31/12/2016 31/12/2015
DBO at beginning of reporting period 60,808 60,790
Service cost 1,664 1,801
Interest cost 1,377 1,288
Remeasurement 5,642 –1,430
Actuarial gains/losses due to changes in financial assumptions 6,004 –1,693
Actuarial gains/losses from changes in the entitlement base –362 263
Benefits paid –1,624 –1,641
DBO at end of reporting period 67,867 60,808
of which non-current liability 66,157 59,144
of which current liability 1,710 1,664
The Group anticipates benefit payments of €1,710 thousand (pre-vious year: €1,664 thousand) in connection with defined benefit pension plans for the 2017 financial year.
The assumptions made for the purpose of determining the pen-sion obligations are as follows:
Parameters 31/12/2016 31/12/2015
Discount rate 1.80 % 2.30 %
Salary increase 2.50 % 2.50 %
Pension increase 1.87 % 1.87 %
Mortality (mortality tables published by Prof. Dr. K. Heubeck) 2005 G 2005 G
A change of half a percentage point each in the above-mentioned basic assumptions used for the purpose of determining the DBO as at 31 December 2016 would increase or decrease the DBO as outlined below. This was determined on the basis of the projected unit credit method as well as the parameters mentioned:
Parameters Change in DBO if parameters are changed by half a percentage point as at 31/12/2016 in € ‘000 (previous year)
Increase Decrease
Discount rate –6,004 (–5,164) 6,929 (5,935)
Salary increase 1,401 (1,263) –1,325 (–1,192)
Pension increase 4,869 (4,304) –4,386 (–3,885)

52 5392 93
The decline in mortality rates by 10 per cent results in an increase in life expectancy dependent on the individual ages of each par-ticipant. The DBO as at 31 December 2016 would increase by €2,374 thousand (previous year: €2,019 thousand) following a reduction in the mortality rate by 10% and would decrease by €-2,110 thousand (previous year: €–1,802 thousand) following a 10 % increase in the mortality rate.
The weighted average duration of the DBO attributable to defined benefit pension plans of SIMONA AG is 18.9 years (previous year: 18.2 years).
[28] COMPANY WELFARE INSTITUTIONS
SIMONA Sozialwerk GmbH is structured as a long-term employee benefit fund within the meaning of IAS 19.8. Under the Articles of Association, the entity operates solely for the purpose of ensuring that former employees of SIMONA AG as well as their dependants receive retirement benefits. The beneficiaries of pensions are entitled to all the assets belonging to the entity as well as all income derived from these assets while the entity is in existence as well as in the case of liquidation or insolvency of the entity. SIMONA AG has no access rights to assets held by SIMONA Sozial-werk GmbH. In the event of liquidation of the entity, the entity’s assets are to be allocated to the recipients of benefits or are to be secured for the purpose of providing future benefits for said recip-ients. Thus, even in the event that SIMONA AG becomes insolvent, the creditors identified in connection with insolvency have no rights in respect of the assets of SIMONA Sozialwerk GmbH.
The assets of SIMONA Vermögensverwaltungsgesellschaft der Belegschaft mbH may be utilised solely for benefit-related pur-poses relating to SIMONA Sozialwerk GmbH. The agreed plans are structured as final salary pension plans in the case of both per-sonnel employed on the basis of collective wage agreements and managerial staff. The defined benefit plans are associated in particular with risks in respect of longevity, inflation and salary increases.
Funding of SIMONA Sozialwerk GmbH is performed in observance of tax regulations.
in € ’000 31/12/2016 31/12/2015
DBO at beginning of reporting period 66,854 66,647
Service cost 2,646 2,813
Interest cost 1,523 1,420
Remeasurement 6,676 –2,903
Actuarial gains/losses due to changes in financial assumptions 7,883 –2,215
Actuarial gains/losses from changes in the entitlement base –1,207 –688
Benefits paid –1,187 –1,123
DBO at end of reporting period 76,512 66,854
Fair value of plan assets at beginning of year 36,270 34,908
Returns on plan assets 821 738
Remeasurement 5,142 1,747
Benefits paid –1,187 –1,123
Fair value of plan assets at end of year 41,046 36,270
Deficit of plan assets –35,466 –30,584
The Group anticipates benefit payments of €1,364 thousand (previous year: €1,214 thousand) in connection with indirect defined benefit pension plans for the 2017 financial year.
As regards the basic assumptions for determining the pension obligations, please refer to the details in Note [27].
A surplus relating to plan assets is not accounted for in the con-solidated financial statements of SIMONA AG, as SIMONA AG has no control over these assets. In accordance with the provisions set out in IAS 19.8, the plan assets are available to be used only to pay or fund employee benefits.
The change in the deficit as at 31 December 2016 is attributable primarily to the remeasurement implemented due to the change in financial assumptions and the increase in value of plan assets.
A change of half a percentage point each in the above-mentioned basic assumptions used for the purpose of determining the DBO as at 31 December 2016 would increase or decrease the DBO as follows (cf. also Note [27]):
92 93
The overdraft facility of SIMONA AG is subject to a floating interest rate based on EONIA (Euro Over Night Index Average).
Other financial liabilities are comprised of the following items:
in € ’000 Due date 31/12/2016 31/12/2015
Non-current other financial liabilities
Liabilities due to purchase price obligations 04/2017 0 2,060
Other 58 127
58 2,187
Current other financial liabilities
Liabilities due to purchase price obligations 04/2017 2,174 2,096
Accounts receivable with credit balances Immediately 1,184 1,268
3,358 3,364
[27] PENSIONS
The majority of employees within SIMONA AG are entitled to post-employment benefits attributable to pension plan agree-ments. The aforementioned plans are structured as final salary pension plans in the case of both personnel employed on the basis of collective wage agreements and managerial staff, includ-ing members and former members of the Management Board. These relate to benefits in respect of retirement, disability and surviving dependants.
In order to mitigate the risks associated with defined benefit plans, particularly as regards longevity, inflation and salary increases, SIMONA introduced multifinanced defined contribution plans for employees joining the company on or after 1 January 2009.
With the exception of payments to SIMONA Sozialwerk GmbH, no contributions are made to funds, cf. Note [28].
The following table includes a breakdown of the expense items recognised in the Group income statement in connection with retirement benefits as well as the amounts carried in the state-ment of financial position for the respective plans.
The changes in the liabilities of defined benefit obligations (DBO) are as follows:
in € ’000 31/12/2016 31/12/2015
DBO at beginning of reporting period 60,808 60,790
Service cost 1,664 1,801
Interest cost 1,377 1,288
Remeasurement 5,642 –1,430
Actuarial gains/losses due to changes in financial assumptions 6,004 –1,693
Actuarial gains/losses from changes in the entitlement base –362 263
Benefits paid –1,624 –1,641
DBO at end of reporting period 67,867 60,808
of which non-current liability 66,157 59,144
of which current liability 1,710 1,664
The Group anticipates benefit payments of €1,710 thousand (pre-vious year: €1,664 thousand) in connection with defined benefit pension plans for the 2017 financial year.
The assumptions made for the purpose of determining the pen-sion obligations are as follows:
Parameters 31/12/2016 31/12/2015
Discount rate 1.80 % 2.30 %
Salary increase 2.50 % 2.50 %
Pension increase 1.87 % 1.87 %
Mortality (mortality tables published by Prof. Dr. K. Heubeck) 2005 G 2005 G
A change of half a percentage point each in the above-mentioned basic assumptions used for the purpose of determining the DBO as at 31 December 2016 would increase or decrease the DBO as outlined below. This was determined on the basis of the projected unit credit method as well as the parameters mentioned:
Parameters Change in DBO if parameters are changed by half a percentage point as at 31/12/2016 in € ‘000 (previous year)
Increase Decrease
Discount rate –6,004 (–5,164) 6,929 (5,935)
Salary increase 1,401 (1,263) –1,325 (–1,192)
Pension increase 4,869 (4,304) –4,386 (–3,885)

54 5594 95
in € ’000 Personnel-related obligations
Guaran-tees/warranties
Other Total
Balance at 1 January 2015 1,829 3,479 163 5,471
Allocated 78 1,203 9 1,290
Used 395 350 62 807
Reversed 278 1,237 101 1,616
Exchange differences 0 13 0 13
Effect of time value of money 18 315 0 333
Balance at 31 December 2015 1,252 3,423 9 4,684
Current provisions 418 1,523 9 1,950
Non-current provisions 834 1,900 0 2,734
Balance at 31 December 2015 1,252 3,423 9 4,684
Personnel-related provisions encompass obligations in connec-tion with agreements regarding part-time employment of staff approaching retirement and provisions relating to anniversaries. Personnel-related provisions are measured on the basis of actu-arial figures.
At the reporting date, obligations in connection with agreements regarding part-time employment of staff approaching retirement amounted to €68 thousand (previous year: €260 thousand). This item is composed of obligations for performance-related arrears, additional compensation and severance payments.
Provisions for guarantees are recognised in connection with war-ranties for products sold in preceding years. The calculation is based on historical claims from guarantees and warranties. Guar-antee-related provisions at SIMONA AG are recognised for ongo-ing, regularly occurring warranty cases as well as for individual cases that occur on an irregular basis and are associated with the risk of above-average claims.
As regards regularly occurring warranty cases, a provision is calcu-lated on the basis of experience over what is adjudged to be a probable average claim period of 5 years. For the purpose of meas-uring the provision, the expenses actually incurred in connection with customer credits/refunds from warranty obligations as well as the thus resulting direct costs of processing a complaint are ana-lysed in detail. Within this context, the weighted average warranty expense of the past 5 years is used for calculation purposes.
The portion of warranty provisions calculated in respect of individ-ual cases occurring on an irregular basis is recognised only when the utilisation of the provision is considered likely, a payment relating thereto is deemed probable and a reliable estimate can be made.
The portion of the warranty provision whose utilisation is not due within one year after the reporting date is discounted.
[30] OTHER LIABILITIES
Other liabilities comprise the following items:
in € ’000 31/12/2016 31/12/2015
Payables to workforce 9,158 7,578
Payables relating to social security 1,312 1,455
Liabilities relating to credit notes and commissions 1,034 1,334
Tax payables 864 817
Payables relating to outstanding invoices 0 502
Other 2,103 1,901
14,471 13,587
[31] STATEMENT OF CASH FLOWS
The statement of cash flows presents changes to cash and cash equivalents during the financial year by outlining cash inflows and outflows. In accordance with IAS 7, the statement of cash flows includes information relating to cash flows from operating activities, investing activities and financing activities.
As at 31 December, total cash and cash equivalents were as follows:
in € ’000 31/12/2016 31/12/2015
Cash and cash equivalents 74,759 31,892
74,759 31,892
The effects of changes to cash and cash equivalents attributable to exchange rates were €–53 thousand (previous year: €1,069 thousand) at Group level.
94 95
Parameters Change in DBO if parameters are changed by half a percentage point as at 31/12/2016 in € ‘000 (previous year)
Increase Decrease
Discount rate –7,883 (–6,684) 9,245 (7,810)
Salary increase 2,916 (2,498) –2,683 (–2,298)
Pension increase 5,486 (4,617) –4,974 (–4,197)
The decline in mortality rates by 10 per cent results in an increase in life expectancy dependent on the individual ages of each par-ticipant. The DBO as at 31 December 2016 would increase by €2,793 thousand (previous year: €2,327 thousand) following a reduction in the mortality rate by 10 % and would decrease by €–2,492 thousand (previous year: €–2,085 thousand) following a 10 % increase in the mortality rate.
The composition of plan assets is presented below:
FAIR VALUE AT
in € ’000 31/12/2016 31/12/2015
Category of assets
Shares in SIMONA AG 26,460 21,900
Bonded loans 2,999 3,010
Time deposits 2,598 2,499
Investment funds 7,583 5,658
Cash and cash equivalents 1,406 3,203
Total plan assets 41,046 36,270
The shares in SIMONA AG and the interests in investment funds are quoted in an active market.
The weighted average duration of the DBO relating to defined benefit pension plans of SIMONA Sozialwerk GmbH is 22.2 years (previous year: 21.6 years). The liability recognised in the statement of financial position with regard to this pension plan changed as follows:
in € ’000 31/12/2016 31/12/2015
Liability at beginning of reporting period 30,584 31,739
Service cost 2,646 2,813
Net interest expense 702 681
Remeasurement 1,534 –4,649
Actuarial gains/losses due to changes in financial assumptions 7,883 –2,215
Actuarial gains/losses from changes in the entitlement base –1,207 –688
Remeasurement from plan assets –5,142 –1,746
Liability at end of reporting period 35,466 30,584
[29] OTHER PROVISIONS
in € ’000 Personnel-related obligations
Guaran-tees/warranties
Other Total
Balance at 1 January 2016 1,252 3,423 9 4,684
Allocated 37 311 61 409
Used 211 530 0 741
Reversed 0 129 12 141
Exchange differences 0 26 0 26
Effect of time value of money 15 16 0 31
Balance at 31 December 2016 1,093 3,117 58 4,268
Current provisions 294 1,211 58 1,563
Non-current provisions 799 1,906 0 2,705
Balance at 31 December 2016 1,093 3,117 58 4,268

56 5796 97
Beyond this, companies of the SIMONA Group entered into no significant transactions with members of the Management Board or the Supervisory Board of SIMONA AG and/or entities to which these persons have been appointed in an executive or controlling capacity (revenues less than €25 thousand in total). This also applies to close family members of the aforementioned persons.Payables to related parties consist of compensation to Supervi-sory Board members of SIMONA AG for the 2016 financial year and amount to €133 thousand (previous year: €109 million). There are no other outstanding balances or obligations towards related parties.
As part of its ordinary operating activities, SIMONA AG provides various services for the subsidiaries included in the consolidated financial statements. Conversely, the respective Group compa-nies render services within the SIMONA Group in the context of their business purpose.
Business relationships exist with associates on a commission/agency basis in respect of the sale of products in the United States; this business totals €2,712 thousand (previous year: €2,654 thousand).
The supply and business relations between the respective per-sons and companies are conducted on arm’s length terms.
Compensation of members of the Management Board and Supervisory Board
MANAGEMENT BOARD COMPENSATION ACCORDING TO IAS 24.17
in € ’000 2016 2015
Short-term benefits
Fixed salary and fringe benefits 906 1,012
Annual bonus 1,067 715
1,973 1,727
Other long-term benefits 702 335
Total compensation 2,675 2,062
COMPENSATION DISCLOSURE PURSUANT TO SECTION 314(1) NO. 6 HGB
in € ’000 2016 2015
Non-performance-based compensation
Fixed salary and fringe benefits 906 1,012
Performance-based compensation
Annual bonus 1,067 715
Compensation with long-term incentive effect 517 335
Total compensation 2,490 2,062
The variable component of Management Board compensation is based on earnings performance within the Group and a long-term incentive programme. In the period under review, a new long-term incentive programme was implemented effective from 1 January 2015. It uses average Group NOPAT (net operating profit after taxes) as the key performance indicator, calculated on the basis of a three-year performance period. The first performance period with regard to the new method of calculation encompasses the financial years 2015 – 2017 and the second performance period comprises the financial years 2016 – 2018. Payment occurs sub-sequent to the adoption of the consolidated financial statements for the final year of the respective performance period. Members of the Management Board do not receive grants in respect of state-managed defined contribution plans, nor do they receive share-based payments or loans.
Post-employment benefits of €18,861 thousand (previous year: €16,333 thousand) have been provisioned for active members of the Management Board, former members of the Management Board and their surviving dependants. The allocation to provi-sions for active members of the Management Board was €1,957 thousand (previous year: €454 thousand). Full allocations have been made to pension provisions for former members of the Man-agement Board. At the end of the reporting period, these amounted to €8,276 thousand (previous year: €7,706 thousand).
Compensation of former Management Board members and their surviving dependants amounted to €470 thousand (previous year: €486 thousand).
At Group level, Supervisory Board compensation for 2016 amounted to €160 thousand (previous year: €131 thousand). Supervisory Board compensation encompasses no variable components. Alongside their Supervisory Board compensation, staff representa-tives appointed to the Supervisory Board received remuneration in the form of wages and salaries during the 2016 financial year,
96 97
Cash flows from investing and financing activities are accounted for directly, i.e. on a payments basis. Cash flows from operating activities are determined indirectly on the basis of earnings before taxes, i.e. via changes to operating items in the Group statement of financial position, having eliminated changes relat-ing to acquisitions and currency translation.
[32] RELATED PARTY DISCLOSURES
Entities and persons with control over the SIMONA Group or who are exposed to the significant influence of SIMONA AG, as well as associated entities and persons, including close members of the family and intermediate entities, with significant influence over the financial and operating policies of the SIMONA Group are to be disclosed in accordance with IAS 24. The Management Board and the Supervisory Board are considered to be management in key positions.
Management Board � Wolfgang Moyses, Chairman, Kirn � Dirk Möller, Deputy Chairman, Kirn � Fredy Hiltmann, Kirn
Supervisory Board � Dr. Rolf Goessler, Bad Dürkheim, Diplom-KaufmannChairman of the Supervisory Board– Member of the Supervisory Board of J. Engelsmann AG,
Ludwigshafen � Roland Frobel, Isernhagen,Managing Director of ROSSMANN CENTRAL EUROPE B.V., Renswoude, NetherlandsDeputy Chairman of the Supervisory Board– Chairman of the Advisory Board of Saxonia Holding-
Gesellschaft mbH & Co. KG, Wolfsburg– Member of the Supervisory Board of GBK Beteiligungen AG,
Hannover– Member of the Supervisory Board of Hannover 96
GmbH & Co. KGaA, Hannover– Member of the Supervisory Board of Deutsche Beteiligungs
AG, Frankfurt am Main (until 25/02/2016) � Dr. Roland Reber, StuttgartManaging Director of Ensinger GmbH, Nufringen
� Joachim Trapp, Biberach, Qualified Lawyer – Member of the Management Board of Kreissparkasse
Biberach, Biberach– Managing Director of SparkasseImmobilien BC GmbH,
Biberach– Managing Director of SparkasseImmobilien BC Grund-
stücksverwaltungsgesellschaft mbH, Biberach � Andy Hohlreiter, BecherbachEmployee Representative (as from 01/03/2017)
� Markus Stein, MittelreidenbachEmployee Representative (as from 01/03/2017)
� Gerhard Flohr, BergenEmployee Representative (until 28/02/2017)
� Jörg Hoseus, MonzingenEmployee Representative (until 28/02/2017)
Wolfgang Moyses performs executive or controlling duties in the following entities:
� Customer Advisory Board member Landesbank Rheinland-Pfalz
� Advisory Board of CW Brabender Instruments Inc., South Hackensack/USA
� Supervisory Board member of SURTECO SE, Buttenwiesen-Pfaffenhofen
Dirk Möller is a shareholder (11.64 per cent of shares in SIMONA AG) and Member of the Management Board of SIMONA AG. Addi-tionally, Dirk Möller performs executive or controlling duties within the following companies of the SIMONA Group:
� SIMONA Plast-Technik s.r.o., Litvinov, (1) � SIMONA AMERICA Inc., Hazleton, (2) � SIMONA FAR EAST Ltd., Hong Kong, (2) � SIMONA ENGINEERING PLASTICS TRADING Co. Ltd., Shanghai, (2)
� SIMONA ASIA Ltd., Hong Kong, (2) � SIMONA ENGINEERING PLASTICS (Guangdong) Co. Ltd. Jiangmen, (2)
His executive duties are as follows:(1) Managing Director, (2) Member of the Board of Directors.
Dr. Roland Reber, member of the Supervisory Board of SIMONA AG, is also the Managing Director of Ensinger GmbH, Nufringen. In the financial year under review, product sales amounting to €3,483 thousand (previous year: €1,867 thousand) were trans-acted between SIMONA AG and the entities of the Ensinger Group.
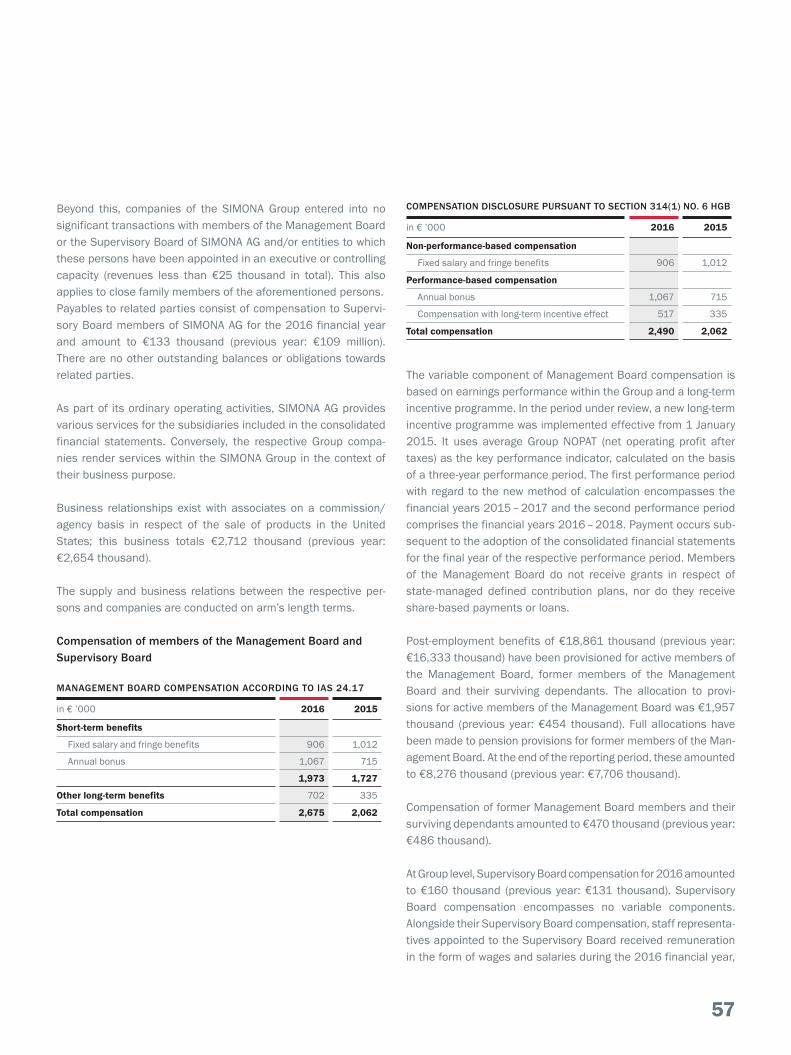
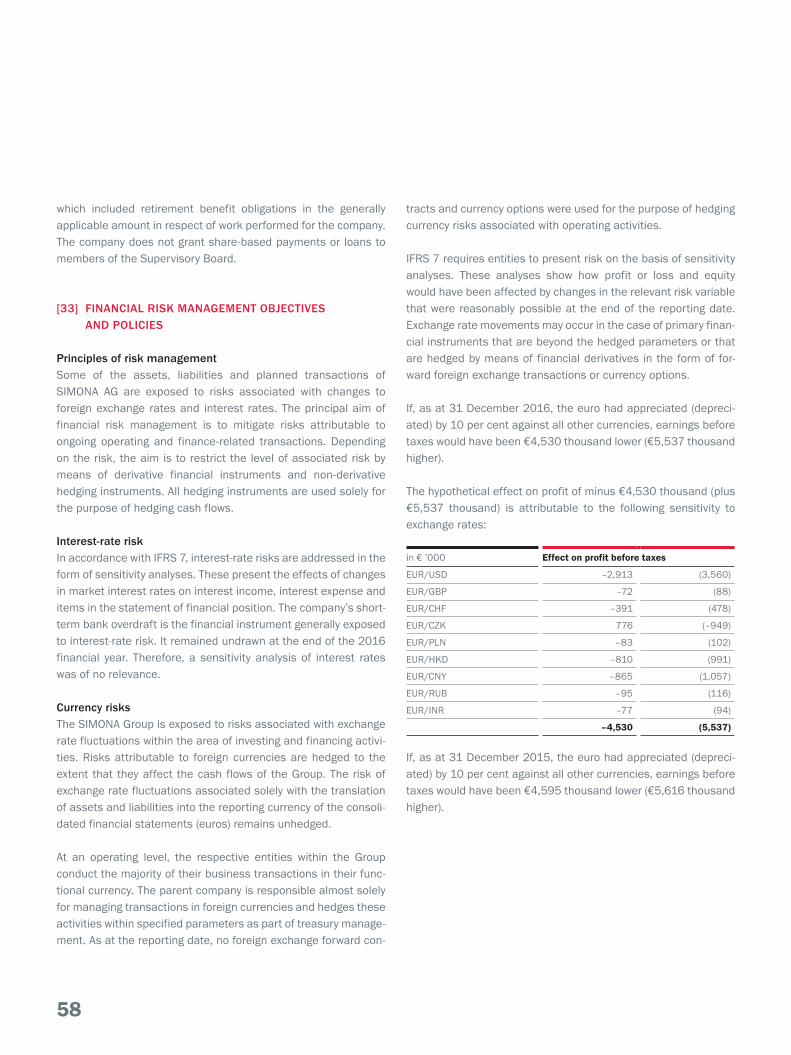
58 5998 99
which included retirement benefit obligations in the generally applicable amount in respect of work performed for the company. The company does not grant share-based payments or loans to members of the Supervisory Board.
[33] FINANCIAL RISK MANAGEMENT OBJECTIVES AND POLICIES
Principles of risk managementSome of the assets, liabilities and planned transactions of SIMONA AG are exposed to risks associated with changes to foreign exchange rates and interest rates. The principal aim of financial risk management is to mitigate risks attributable to ongoing operating and finance-related transactions. Depending on the risk, the aim is to restrict the level of associated risk by means of derivative financial instruments and non-derivative hedging instruments. All hedging instruments are used solely for the purpose of hedging cash flows.
Interest-rate riskIn accordance with IFRS 7, interest-rate risks are addressed in the form of sensitivity analyses. These present the effects of changes in market interest rates on interest income, interest expense and items in the statement of financial position. The company’s short-term bank overdraft is the financial instrument generally exposed to interest-rate risk. It remained undrawn at the end of the 2016 financial year. Therefore, a sensitivity analysis of interest rates was of no relevance.
Currency risksThe SIMONA Group is exposed to risks associated with exchange rate fluctuations within the area of investing and financing activi-ties. Risks attributable to foreign currencies are hedged to the extent that they affect the cash flows of the Group. The risk of exchange rate fluctuations associated solely with the translation of assets and liabilities into the reporting currency of the consoli-dated financial statements (euros) remains unhedged.
At an operating level, the respective entities within the Group conduct the majority of their business transactions in their func-tional currency. The parent company is responsible almost solely for managing transactions in foreign currencies and hedges these activities within specified parameters as part of treasury manage-ment. As at the reporting date, no foreign exchange forward con-
tracts and currency options were used for the purpose of hedging currency risks associated with operating activities.
IFRS 7 requires entities to present risk on the basis of sensitivity analyses. These analyses show how profit or loss and equity would have been affected by changes in the relevant risk variable that were reasonably possible at the end of the reporting date. Exchange rate movements may occur in the case of primary finan-cial instruments that are beyond the hedged parameters or that are hedged by means of financial derivatives in the form of for-ward foreign exchange transactions or currency options.
If, as at 31 December 2016, the euro had appreciated (depreci-ated) by 10 per cent against all other currencies, earnings before taxes would have been €4,530 thousand lower (€5,537 thousand higher).
The hypothetical effect on profit of minus €4,530 thousand (plus €5,537 thousand) is attributable to the following sensitivity to exchange rates:
in € ’000 Effect on profit before taxes
EUR/USD –2,913 (3,560)
EUR/GBP –72 (88)
EUR/CHF –391 (478)
EUR/CZK 776 (–949)
EUR/PLN –83 (102)
EUR/HKD –810 (991)
EUR/CNY –865 (1,057)
EUR/RUB –95 (116)
EUR/INR –77 (94)
–4,530 (5,537)
If, as at 31 December 2015, the euro had appreciated (depreci-ated) by 10 per cent against all other currencies, earnings before taxes would have been €4,595 thousand lower (€5,616 thousand higher).
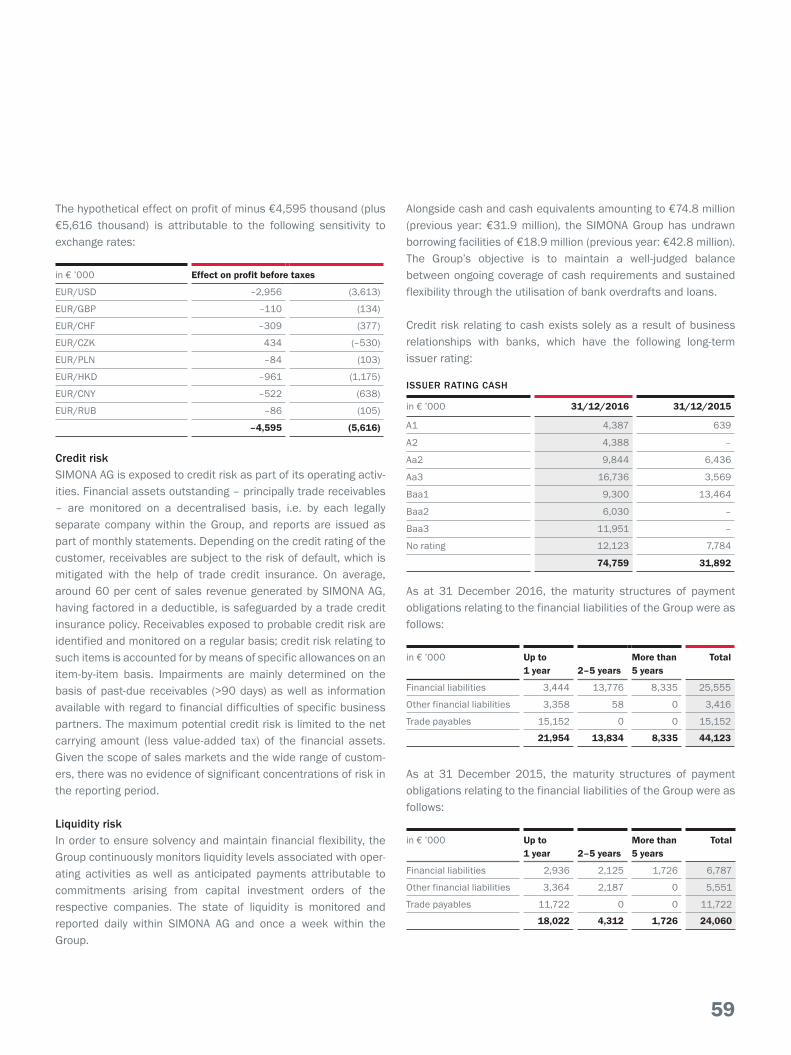
58 5998 99
The hypothetical effect on profit of minus €4,595 thousand (plus €5,616 thousand) is attributable to the following sensitivity to exchange rates:
in € ’000 Effect on profit before taxes
EUR/USD –2,956 (3,613)
EUR/GBP –110 (134)
EUR/CHF –309 (377)
EUR/CZK 434 (–530)
EUR/PLN –84 (103)
EUR/HKD –961 (1,175)
EUR/CNY –522 (638)
EUR/RUB –86 (105)
–4,595 (5,616)
Credit riskSIMONA AG is exposed to credit risk as part of its operating activ-ities. Financial assets outstanding – principally trade receivables – are monitored on a decentralised basis, i.e. by each legally separate company within the Group, and reports are issued as part of monthly statements. Depending on the credit rating of the customer, receivables are subject to the risk of default, which is mitigated with the help of trade credit insurance. On average, around 60 per cent of sales revenue generated by SIMONA AG, having factored in a deductible, is safeguarded by a trade credit insurance policy. Receivables exposed to probable credit risk are identified and monitored on a regular basis; credit risk relating to such items is accounted for by means of specific allowances on an item-by-item basis. Impairments are mainly determined on the basis of past-due receivables (>90 days) as well as information available with regard to financial difficulties of specific business partners. The maximum potential credit risk is limited to the net carrying amount (less value-added tax) of the financial assets. Given the scope of sales markets and the wide range of custom-ers, there was no evidence of significant concentrations of risk in the reporting period.
Liquidity riskIn order to ensure solvency and maintain financial flexibility, the Group continuously monitors liquidity levels associated with oper-ating activities as well as anticipated payments attributable to commitments arising from capital investment orders of the respective companies. The state of liquidity is monitored and reported daily within SIMONA AG and once a week within the Group.
Alongside cash and cash equivalents amounting to €74.8 million (previous year: €31.9 million), the SIMONA Group has undrawn borrowing facilities of €18.9 million (previous year: €42.8 million). The Group’s objective is to maintain a well-judged balance between ongoing coverage of cash requirements and sustained flexibility through the utilisation of bank overdrafts and loans.
Credit risk relating to cash exists solely as a result of business relationships with banks, which have the following long-term issuer rating:
ISSUER RATING CASH
in € ’000 31/12/2016 31/12/2015
A1 4,387 639
A2 4,388 –
Aa2 9,844 6,436
Aa3 16,736 3,569
Baa1 9,300 13,464
Baa2 6,030 –
Baa3 11,951 –
No rating 12,123 7,784
74,759 31,892
As at 31 December 2016, the maturity structures of payment obligations relating to the financial liabilities of the Group were as follows:
in € ’000 Up to 1 year 2–5 years
More than 5 years
Total
Financial liabilities 3,444 13,776 8,335 25,555
Other financial liabilities 3,358 58 0 3,416
Trade payables 15,152 0 0 15,152
21,954 13,834 8,335 44,123
As at 31 December 2015, the maturity structures of payment obligations relating to the financial liabilities of the Group were as follows:
in € ’000 Up to 1 year 2–5 years
More than 5 years
Total
Financial liabilities 2,936 2,125 1,726 6,787
Other financial liabilities 3,364 2,187 0 5,551
Trade payables 11,722 0 0 11,722
18,022 4,312 1,726 24,060
98 99
which included retirement benefit obligations in the generally applicable amount in respect of work performed for the company. The company does not grant share-based payments or loans to members of the Supervisory Board.
[33] FINANCIAL RISK MANAGEMENT OBJECTIVES AND POLICIES
Principles of risk managementSome of the assets, liabilities and planned transactions of SIMONA AG are exposed to risks associated with changes to foreign exchange rates and interest rates. The principal aim of financial risk management is to mitigate risks attributable to ongoing operating and finance-related transactions. Depending on the risk, the aim is to restrict the level of associated risk by means of derivative financial instruments and non-derivative hedging instruments. All hedging instruments are used solely for the purpose of hedging cash flows.
Interest-rate riskIn accordance with IFRS 7, interest-rate risks are addressed in the form of sensitivity analyses. These present the effects of changes in market interest rates on interest income, interest expense and items in the statement of financial position. The company’s short-term bank overdraft is the financial instrument generally exposed to interest-rate risk. It remained undrawn at the end of the 2016 financial year. Therefore, a sensitivity analysis of interest rates was of no relevance.
Currency risksThe SIMONA Group is exposed to risks associated with exchange rate fluctuations within the area of investing and financing activi-ties. Risks attributable to foreign currencies are hedged to the extent that they affect the cash flows of the Group. The risk of exchange rate fluctuations associated solely with the translation of assets and liabilities into the reporting currency of the consoli-dated financial statements (euros) remains unhedged.
At an operating level, the respective entities within the Group conduct the majority of their business transactions in their func-tional currency. The parent company is responsible almost solely for managing transactions in foreign currencies and hedges these activities within specified parameters as part of treasury manage-ment. As at the reporting date, no foreign exchange forward con-
tracts and currency options were used for the purpose of hedging currency risks associated with operating activities.
IFRS 7 requires entities to present risk on the basis of sensitivity analyses. These analyses show how profit or loss and equity would have been affected by changes in the relevant risk variable that were reasonably possible at the end of the reporting date. Exchange rate movements may occur in the case of primary finan-cial instruments that are beyond the hedged parameters or that are hedged by means of financial derivatives in the form of for-ward foreign exchange transactions or currency options.
If, as at 31 December 2016, the euro had appreciated (depreci-ated) by 10 per cent against all other currencies, earnings before taxes would have been €4,530 thousand lower (€5,537 thousand higher).
The hypothetical effect on profit of minus €4,530 thousand (plus €5,537 thousand) is attributable to the following sensitivity to exchange rates:
in € ’000 Effect on profit before taxes
EUR/USD –2,913 (3,560)
EUR/GBP –72 (88)
EUR/CHF –391 (478)
EUR/CZK 776 (–949)
EUR/PLN –83 (102)
EUR/HKD –810 (991)
EUR/CNY –865 (1,057)
EUR/RUB –95 (116)
EUR/INR –77 (94)
–4,530 (5,537)
If, as at 31 December 2015, the euro had appreciated (depreci-ated) by 10 per cent against all other currencies, earnings before taxes would have been €4,595 thousand lower (€5,616 thousand higher).

60 61100 101
As in the previous financial year, at 31 December 2016, there were no foreign exchange forward contracts and no currency options that would result in amounts due to the entity or payment obligations.
Capital managementAs at 31 December 2016, the equity ratio was 53 per cent (previ-ous year: 57 per cent). The level of debt stood at 89 per cent (previous year: 72 per cent). Among the key financial goals of the SIMONA Group are objectives to raise enterprise value in a sus-tainable manner, ensure solvency at all times and achieve an equity ratio of at least 50 per cent. At the same time, safeguarding
sufficient cash reserves is considered particularly important. The Group manages its capital structure mainly on the basis of its equity ratio and makes adjustments in response to changing eco-nomic conditions where such action is deemed appropriate. External financing is mainly conducted via short- and long-term bank borrowings and bank loans.
[34] FINANCIAL INSTRUMENTS
The following table presents the carrying amounts and fair values of all financial instruments recognised by the Group:
FINANCIAL INSTRUMENTS CARRYING AMOUNT FAIR VALUE
in € ‘000 31/12/2016 31/12/2015 31/12/2016 31/12/2015
Non-current financial assets
Financial assets AfS 340 340 340 340
Investments accounted for using the equity method AfS 293 205 n/a n/a
Current financial assets
Trade receivables LaR 52,186 51,140 52,186 51,140
Other financial assets LaR 836 4,831 836 4,831
Cash and cash equivalents LaR 74,759 31,892 74,759 31,892
Non-current financial liabilities and other financial liabilities
Loans FLAC –22,111 –3,851 –22,111 –3,851
Other financial liabilities FLAC –58 –2,187 –58 –2,187
Current financial liabilities and other financial liabilities
Bank overdrafts FLAC 0 –2,538 0 –2,538
Loans FLAC –3,444 –398 –3,444 –398
Trade payables FLAC –15,152 –11,722 –15,152 –11,722
Other financial liabilities FLAC –3,358 –3,364 –3,358 –3,364
Total by measurement category
AfS 633 545 340 340
LaR 127,781 87,863 127,781 87,863
FLAC –44,123 –24,060 –44,123 –24,060
AfS = Available for Sale, LaR = Loans and Receivables, FLAC = Financial Liabilities Measured at Amortised Cost

60 61100 101
The fair value of loans was determined by discounting the expected future cash flows on the basis of the prevailing market rate of interest as well as by applying option pricing models. Within this context, the calculation takes into account that the loans are sub-ject to floating or fixed interest rates on the basis of standard market terms and conditions.
Short-term deposits held as Loans and Receivables (LaR) include time deposits with a maturity of three months at most.
The following table presents the net gains and losses from subse-quent measurement of financial instruments recognised in the statement of financial position, listed according to the respective measurement categories:
2016: NET GAINS AND LOSSES BY MEASUREMENT CATEGORY
in € ‘000 Interest Fair value Currencytranslation
Impairment loss/Disposal
Total
AfS 0 0 0 0 0
LaR 163 0 1,543 –642 1,064
FLAC –152 0 –177 5 –324
11 0 1,366 –637 740
2015: NET GAINS AND LOSSES BY MEASUREMENT CATEGORY
in € ‘000 Interest Fair value Currencytranslation
Impairment loss/Disposal
Total
AfS 0 0 0 0 0
LaR 61 0 –222 –51 –212
HfT 0 16 0 0 16
FLAC –85 0 755 –152 518
–24 16 533 –203 322
The Group uses the following hierarchy for the purpose of deter-mining and disclosing the fair values of financial instruments per measurement method:
� Level 1: quoted prices (unadjusted) in active markets for identical assets or liabilities
� Level 2: methods for which all inputs with a significant effect on the recognised fair value are observable either directly or indirectly; and
� Level 3: methods that use inputs which have a significant effect on the recognised fair value and are not based on observable market data
With the exception of derivative financial instruments, no fair value hierarchy is disclosed for financial assets and liabilities, as the carrying amount is a reasonable approximation of fair value.
Hedging transactions
Cash flow hedging instrumentsAs at 31 December 2016, as was the case in the previous finan-cial year, the Group held no forward currency contracts or cur-rency options.
[35] OTHER INFORMATION
SubsidiariesAlongside SIMONA AG as the parent, the consolidated financial statements include the following entities. Unless otherwise speci-fied, the ownership interest in the previous year was identical to that of the financial year under review.
OWNERSHIP INTEREST
in %
SIMONA Beteiligungs-GmbH, Kirn, Germany 100.0
SIMONA UK Ltd., Stafford, United Kingdom 100.0
SIMONA S.A.S., Domont, France 100.0
SIMONA S.r.l. Società UNIPERSONALE, Cologno Monzese (MI), Italy 100.0
SIMONA IBERICA SEMIELABORADOS S.L., Barcelona, Spain 100.0
SIMONA POLSKA Sp. z o.o., Wrocław, Poland 100.0
SIMONA-PLASTICS CZ s.r.o., Prague, Czech Republic 100.0
SIMONA FAR EAST Ltd., Hong Kong, China 100.0
SIMONA AMERICA Inc., Hazleton, USA 100.0
Laminations Inc., Archbald, USA 100.0
Boltaron Inc., Newcomerstown, USA 100.0
DANOH, LLC, Akron, USA 100.0
SIMONA ENGINEERING PLASTICS TRADING Co. Ltd. Shanghai, China 100.0
SIMONA ASIA Ltd., Hong Kong, China 100.0
SIMONA ENGINEERING PLASTICS (Guangdong) Co. Ltd., Jiangmen, China 100.0
64 NORTH CONAHAN DRIVE HOLDING, LLC, Hazleton, USA 100.0
DEHOPLAST POLSKA Sp. z o.o., Kwidzyn, Poland 51.0
SIMONA Plast-Technik s.r.o., Litvinov, Czech Republic 100.0
OOO SIMONA RUS, Moscow, Russian Federation 100.0
SIMONA INDIA PRIVATE LIMITED, Mumbai, India 100.0
100 101
As in the previous financial year, at 31 December 2016, there were no foreign exchange forward contracts and no currency options that would result in amounts due to the entity or payment obligations.
Capital managementAs at 31 December 2016, the equity ratio was 53 per cent (previ-ous year: 57 per cent). The level of debt stood at 89 per cent (previous year: 72 per cent). Among the key financial goals of the SIMONA Group are objectives to raise enterprise value in a sus-tainable manner, ensure solvency at all times and achieve an equity ratio of at least 50 per cent. At the same time, safeguarding
sufficient cash reserves is considered particularly important. The Group manages its capital structure mainly on the basis of its equity ratio and makes adjustments in response to changing eco-nomic conditions where such action is deemed appropriate. External financing is mainly conducted via short- and long-term bank borrowings and bank loans.
[34] FINANCIAL INSTRUMENTS
The following table presents the carrying amounts and fair values of all financial instruments recognised by the Group:
FINANCIAL INSTRUMENTS CARRYING AMOUNT FAIR VALUE
in € ‘000 31/12/2016 31/12/2015 31/12/2016 31/12/2015
Non-current financial assets
Financial assets AfS 340 340 340 340
Investments accounted for using the equity method AfS 293 205 n/a n/a
Current financial assets
Trade receivables LaR 52,186 51,140 52,186 51,140
Other financial assets LaR 836 4,831 836 4,831
Cash and cash equivalents LaR 74,759 31,892 74,759 31,892
Non-current financial liabilities and other financial liabilities
Loans FLAC –22,111 –3,851 –22,111 –3,851
Other financial liabilities FLAC –58 –2,187 –58 –2,187
Current financial liabilities and other financial liabilities
Bank overdrafts FLAC 0 –2,538 0 –2,538
Loans FLAC –3,444 –398 –3,444 –398
Trade payables FLAC –15,152 –11,722 –15,152 –11,722
Other financial liabilities FLAC –3,358 –3,364 –3,358 –3,364
Total by measurement category
AfS 633 545 340 340
LaR 127,781 87,863 127,781 87,863
FLAC –44,123 –24,060 –44,123 –24,060
AfS = Available for Sale, LaR = Loans and Receivables, FLAC = Financial Liabilities Measured at Amortised Cost

62 63102 103
Directors’ holdings – Shares held by members of the Management Board and Supervisory Board of SIMONA AGAs at 10 June 2016 (date of the Annual General Meeting of Share-holders) the members of the Management Board reported a total holding of 70,909 shares; this corresponds to approx. 11.82 per cent of the share capital of SIMONA AG.
As at 10 June 2016 (date of the Annual General Meeting of Share-holders) the members of the Supervisory Board reported a total holding of 1,300 shares; this corresponds to approx. 0.22 per cent of the share capital of SIMONA AG.
In accordance with Section 15a of the Securities Trading Act (Wertpapierhandelsgesetz – WpHG), the members of the Supervi-sory Board and the Management Board, as well as related par-ties, are legally obliged to disclose all significant acquisitions or disposals of shares in SIMONA AG.
Audit feesThe total fees invoiced by the independent auditor of SIMONA AG and subsidiaries were €318 thousand. These fees were attribut-able to the following items: year-end audit services €247 thou-sand, tax consulting services €39 thousand and other services €32 thousand.
Events after the Reporting PeriodNo significant events occurred after the reporting date that would necessitate a change to measurements or recognised amounts.
Responsibility StatementTo the best of our knowledge, and in accordance with the applic-able reporting principles, the consolidated financial statements give a true and fair view of the assets, liabilities, financial position and profit or loss of the Group, and the Group management report that has been combined with the management report of SIMONA Aktiengesellschaft, Kirn, includes a fair review of the development and performance of the business and the position of the Group, together with a description of the principal opportunities and risks associated with the expected development of the Group.
Kirn, 31 March 2017SIMONA AktiengesellschaftThe Management Board
Wolfgang Moyses Dirk Möller Fredy Hiltmann
102 103
SIMONA INDIA PRIVATE LIMITED, Mumbai, India, was fully consoli-dated for the first time in the 2016 financial year. There were no changes to the ownership interests held in subsidiaries in the financial year under review.
Financial assetsSIMONA AG holds at least a one-fifth interest in the following entities, without being able to control or significantly influence the financial and operating policies of the entities in question. Unless otherwise specified, the ownership interest in the previ-ous year was identical to that of the financial year under review.
COMPANY
Company Equity 31/12/2015
Profit/loss 2015
in % in € ‘000 in € ‘000
SIMONA Sozialwerk GmbH, Kirn, Germany 50.0 12,413 –32
SIMONA Vermögensverwaltungs-gesellschaft der Belegschaft mbH, Kirn, Germany 50.0 3,349 362
Owing to its classification as a pension fund, SIMONA Sozialwerk GmbH is not included in the consolidated financial statements, as specified in IAS 19.8.
SIMONA Vermögensverwaltungsgesellschaft der Belegschaft mbH is not included in the consolidated financial statements because the assets of this entity may be utilised solely for funding purposes in respect of SIMONA Sozialwerk GmbH and thus remain outside SIMONA AG’s scope of economic control.
The interests in SIMONA Sozialwerk GmbH and SIMONA Vermö-gensverwaltungsgesellschaft der Belegschaft mbH are accounted for at book value, as the fair value is not reliably determinable. The book values of SIMONA Sozialwerk GmbH and SIMONA Vermö-gensverwaltungsgesellschaft der Belegschaft mbH are €10 thou-sand and €13 thousand respectively.
Average number of staff employed in the financial year:
GROUP
2016 2015
Industrial staff 694 734
Clerical staff 543 505
Employees 1,237 1,239
School-leavers (apprentices) 46 40
Total number of employees 1,283 1,279
Contingent liabilities and other financial commitmentsContingent liabilities relate in particular to extended warranty periods regarding the sale of plastic products. No information on the financial implications and uncertainties relating to the amount or timing of any outflow has been disclosed as it is not practicable to do so. At present, SIMONA does not expect any outflow from contingent liabilities.
OTHER FINANCIAL COMMITMENTS
in € ‘000 31/12/2016 31/12/2015
Commitments from operating rental and lease agreements
Due within:
1 year 633 611
2 – 5 years 1,309 298
after 5 years 520 42
2,462 951
PURCHASE COMMITMENTS
in € ‘000 31/12/2016 31/12/2015
Investment projects 15,107 10,741
Raw material orders 12,870 –
27,977 10,741
The share of intangible assets in total commitments is negligible. Declaration of Conformity regarding the German Corporate Governance CodeIn accordance with Section 161 AktG, the company filed a Decla-ration of Conformity for 2016 on 23 February 2017. It has been made permanently available to shareholders on its corporate website at www.simona.de.

64 65104 105104 105
DETAILS OF SHAREHOLDINGSOF SIMONA AG FOR THE FINANCIAL YEAR 2016
Company Ownership interest Equity Profit/loss of last financial year
% in € ’000 in € ’000
Indirectly
SIMONA IBERICA SEMIELABORADOS S.L., Barcelona, Spain 100.0 357 71
SIMONA S.A.S., Domont, France 100.0 4,017 958
SIMONA S.r.l. Società UNIPERSONALE, Cologno Monzese (MI), ltaly 100.0 314 144
SIMONA UK Ltd., Stafford, United Kingdom 100.0 2,148 –14
64 NORTH CONAHAN DRIVE HOLDING, LLC, Hazleton, USA 100.0 3,106 –337
Laminations Inc., Archbald, USA 100.0 15,992 781
Boltaron Inc., Newcomerstown, USA 100.0 19,729 9,685
DANOH, LLC, Akron, USA 100.0 202 159
CARTIERWILSON, LLC, Marietta, USA* 25.0 352 685
SIMONA ENGINEERING PLASTICS TRADING Co. Ltd., Shanghai, China 100.0 743 –334
SIMONA ENGINEERING PLASTICS (Guangdong) Co. Ltd., Jiangmen, China 100.0 4,333 –1,221
SIMONA INDIA PRIVATE LIMITED, Mumbai, India 0.01 251 –13
Directly
SIMONA Beteiligungs-GmbH, Kirn ** 100.0 1,834 0
SIMONA Sozialwerk GmbH, Kirn *** 50.0 12,413 –32
SIMONA Vermögensverwaltungsgesellschaft der Belegschaft mbH, Kirn *** 50.0 3,349 362
SIMONA Plast-Technik s.r.o., Litvinov, Czech Republic 100.0 20,495 1,174
SIMONA-PLASTICS CZ, s.r.o., Prague, Czech Republic 100.0 105 –5
SIMONA POLSKA Sp. z o.o., Wrocław, Poland 100.0 1,082 164
DEHOPLAST POLSKA Sp. z o.o., Kwidzyn, Poland 51.0 575 100
OOO SIMONA RUS, Moscow, Russian Federation 100.0 -28 210
SIMONA AMERICA Inc., Hazleton, USA 100.0 34,886 –329
SIMONA ASIA Ltd., Hong Kong, China 100.0 4,306 106
SIMONA FAR EAST Ltd., Hong Kong, China 100.0 958 31
SIMONA INDIA PRIVATE LIMITED, Mumbai, India 99.99 251 –13
* Preliminary financial results ** Control and profit transfer agreement with SIMONA AG *** Financial year 2015

64 65104 105104 105
“We have audited the consolidated financial statements of SIMONA Aktiengesellschaft, Kirn, comprising the statement of financial position, the income statement, the statement of com-prehensive income, the statement of changes in equity, the state-ment of cash flows and the notes to the consolidated financial statements, together with the Group management report of SIMONA Aktiengesellschaft, Kirn, which has been combined with the management report of the Company, for the financial year from 1 January to 31 December 2016. The Management Board of the Company is responsible for the preparation of the consoli-dated financial statements and the combined management report in accordance with IFRS, as adopted by the EU, as well as in compliance with the additional provisions set out in Section 315a(1) of the German Commercial Code (Handelsgesetzbuch – HGB). Our responsibility is to express an opinion on the consoli-dated financial statements and the combined management report based on our audit.
We conducted our audit of the consolidated financial statements in accordance with Section 317 of the German Commercial Code and in compliance with German generally accepted standards for the audit of financial statements promulgated by the Institut der Wirtschaftsprüfer (IDW). Those standards require that we plan and perform the audit such that misstatements materially affect-ing the presentation of the net assets, financial position and results of operations in the consolidated financial statements in accordance with the applicable financial reporting framework and in the combined management report are detected with reason-able assurance. Knowledge of the business activities and the economic and legal environment of the Group and expectations as to possible misstatements are taken into account in the deter-mination of audit procedures. The effectiveness of the account-ing-related internal control system and the evidence supporting the disclosures in the consolidated financial statements and the combined management report are examined primarily on a test basis within the framework of the audit. The audit also includes assessing the annual financial statements of those entities included in consolidation, the determination of the entities to be included in consolidation, the accounting and consolidation prin-ciples applied and the significant estimates made by the Manage-ment Board, as well as evaluating the overall presentation of the consolidated financial statements and the combined manage-ment report. We believe that our audit provides a reasonable basis for our opinion.
Our audit has not led to any reservations.
In our opinion, based on the findings of our audit, the consoli-dated financial statements comply with IFRS, as adopted by the EU, and the additional requirements of German commercial law pursuant to Section 315a (1) HGB and give a true and fair view of the net assets, financial position and results of operations in accordance with these requirements. The combined manage-ment report is consistent with the consolidated financial state-ments, complies with statutory regulations, as a whole provides a suitable view of the Group’s position and suitably presents the opportunities and risks of future development.”
Frankfurt am Main, 5 April 2017
PricewaterhouseCoopers GmbHWirtschaftsprüfungsgesellschaft
Christian Kwasni ppa. Christopher SchligGerman Public Auditor German Public Auditor
REPRODUCTION OF THE AUDITOR’S REPORT
104 105104 105
DETAILS OF SHAREHOLDINGSOF SIMONA AG FOR THE FINANCIAL YEAR 2016
Company Ownership interest Equity Profit/loss of last financial year
% in € ’000 in € ’000
Indirectly
SIMONA IBERICA SEMIELABORADOS S.L., Barcelona, Spain 100.0 357 71
SIMONA S.A.S., Domont, France 100.0 4,017 958
SIMONA S.r.l. Società UNIPERSONALE, Cologno Monzese (MI), ltaly 100.0 314 144
SIMONA UK Ltd., Stafford, United Kingdom 100.0 2,148 –14
64 NORTH CONAHAN DRIVE HOLDING, LLC, Hazleton, USA 100.0 3,106 –337
Laminations Inc., Archbald, USA 100.0 15,992 781
Boltaron Inc., Newcomerstown, USA 100.0 19,729 9,685
DANOH, LLC, Akron, USA 100.0 202 159
CARTIERWILSON, LLC, Marietta, USA* 25.0 352 685
SIMONA ENGINEERING PLASTICS TRADING Co. Ltd., Shanghai, China 100.0 743 –334
SIMONA ENGINEERING PLASTICS (Guangdong) Co. Ltd., Jiangmen, China 100.0 4,333 –1,221
SIMONA INDIA PRIVATE LIMITED, Mumbai, India 0.01 251 –13
Directly
SIMONA Beteiligungs-GmbH, Kirn ** 100.0 1,834 0
SIMONA Sozialwerk GmbH, Kirn *** 50.0 12,413 –32
SIMONA Vermögensverwaltungsgesellschaft der Belegschaft mbH, Kirn *** 50.0 3,349 362
SIMONA Plast-Technik s.r.o., Litvinov, Czech Republic 100.0 20,495 1,174
SIMONA-PLASTICS CZ, s.r.o., Prague, Czech Republic 100.0 105 –5
SIMONA POLSKA Sp. z o.o., Wrocław, Poland 100.0 1,082 164
DEHOPLAST POLSKA Sp. z o.o., Kwidzyn, Poland 51.0 575 100
OOO SIMONA RUS, Moscow, Russian Federation 100.0 -28 210
SIMONA AMERICA Inc., Hazleton, USA 100.0 34,886 –329
SIMONA ASIA Ltd., Hong Kong, China 100.0 4,306 106
SIMONA FAR EAST Ltd., Hong Kong, China 100.0 958 31
SIMONA INDIA PRIVATE LIMITED, Mumbai, India 99.99 251 –13
* Preliminary financial results ** Control and profit transfer agreement with SIMONA AG *** Financial year 2015

66 67106 107
RESPONSIBILITY STATEMENT PURSUANT TO SECTIONS297(2), 315(1) HGB
“To the best of our knowledge, and in accordance with the applic-able reporting principles, the consolidated financial statements give a true and fair view of the assets, liabilities, financial position and profit or loss of the SIMONA Group, and the Group manage-ment report, which has been combined with the management report of SIMONA AG, includes a fair review of the development and performance of the business and the position of the SIMONA Group, together with a description of the principal opportunities and risks associated with the expected development of the SIMONA Group.”
Kirn, 31 March 2017SIMONA AktiengesellschaftThe Management Board
Wolfgang Moyses Dirk Möller Fredy Hiltmann
OTHER INFORMATION

66 67106 107
SHAREHOLDINGSOF SIMONA AG
SIMONA AG, KIRN
SIMONA Beteiligungs-GmbHKirn, Germany 100.0 % SIMONA-PLASTICS CZ, s.r.o.
Prague, Czech Republic 100.0 %
SIMONA S.A.S.Domont, France 100.0 % SIMONA Plast-Technik s.r.o.
Litvinov, Czech Republic 100.0 %
SIMONA S.r.l. Società UNIPERSONALECologno Monzese (MI), Italy 100.0 % SIMONA POLSKA Sp. z o.o.
Wrocław, Poland 100.0 %
SIMONA UK Ltd.Stafford, United Kingdom 100.0 % DEHOPLAST POLSKA Sp. z o.o.
Kwidzyn, Poland 51.0 %
SIMONA IBERICA SEMIELABORADOS S.L.Barcelona, Spain
100.0 % SIMONA AMERICA Inc.Hazleton, USA 100.0 %
SIMONA INDIA PRIVATE LIMITED Mumbai, India 0.01 % 64 NORTH CONAHAN DRIVE HOLDING, LLC
Hazleton, USA 100.0 %
Laminations Inc.Archbald, USA 100.0 %
SIMONA Sozialwerk GmbHKirn, Germany 50.0 % Boltaron Inc.
Newcomerstown, USA 100.0 %
SIMONA Vermögensverwaltungsgesellschaft der Belegschaft mbHKirn, Germany
50.0 % DANOH, LLCAkron, USA 100.0 %
CARTIERWILSON, LLCMarietta, USA 25.0 %
SIMONA FAR EAST LIMITED.Hong Kong, China 100.0 %
SIMONA ENGINEERING PLASTICS TRADING (SHANGHAI) Co. Ltd.Shanghai, China
100.0 %
SIMONA ASIA LIMITED.Hong Kong, China 100.0 %
SIMONA ENGINEERING PLASTICS (Guangdong) Co. Ltd.Jiangmen, China
100.0 %
OOO SIMONA RUSMoscow, Russian Federation 100.0 %
SIMONA INDIA PRIVATE LIMITED Mumbai, India 99.99 %
As at 31 Dec. 2016
106 107
RESPONSIBILITY STATEMENT PURSUANT TO SECTIONS297(2), 315(1) HGB
“To the best of our knowledge, and in accordance with the applic-able reporting principles, the consolidated financial statements give a true and fair view of the assets, liabilities, financial position and profit or loss of the SIMONA Group, and the Group manage-ment report, which has been combined with the management report of SIMONA AG, includes a fair review of the development and performance of the business and the position of the SIMONA Group, together with a description of the principal opportunities and risks associated with the expected development of the SIMONA Group.”
Kirn, 31 March 2017SIMONA AktiengesellschaftThe Management Board
Wolfgang Moyses Dirk Möller Fredy Hiltmann
OTHER INFORMATION

68 6968
Key Financials
STOCK PERFORMANCE
2016 2015 2014
Earnings per share € 32.48 28.78 18.63
Dividend € 12.00 10.00 8.00
Dividend yield % 2.7 2.7 2.5
P/E ratio* 13.5 12.7 17.4
based on price at 30. Dec. € 441.00 365.00 324.00
* Calculated on Group basis
SIMONA GROUP
2016 2015 2014
Revenue €m 366.7 360.3 336.6
Year-on-year change % 1.8 7.1 16.9
Staff costs €m 72.4 70.8 64.2
Earnings before taxes (EBT) €m 28.2 24.8 15.6
Profit for the year €m 19.5 17.3 11.2
Net cash from operating activities €m 42.2 37.3 30.9
EBIT €m 30.2 26.7 17.8
EBIT % 8.2 7.4 5.3
EBITDA €m 43.9 40.1 31.0
EBITDA % 12.0 11.1 9.2
Total assets €m 363.0 318.4 301.2
Equity €m 192.0 182.6 159.5
Property, plant and equipment €m 116.7 113.8 107.3
Investments in property, plant and equipment €m 15.5 16.0 22.4
Employees (annual average) 1,283 1,279 1,325
On IFRS basis
REVENUE BY REGION (in per cent)
Americas
Europe
Asia and Pacific
Allocated acc. to place of registered office of revenue-generating business unit
77 %
5 %
18 %
2014
72 %
5 %
23 %
2015
70 %
5 %
25 %
2016
REVENUE BY PRODUCT GROUP (in €m)
276.9
289.8(+ 4.7 %)
83.476.9
(– 7.9 %)
Pipes andFittingsProportion of revenue: 21.0 %
Semi-Finishedand Finished PartsProportion of revenue: 79.0 %
2015 2016 2015 2016

68 69
This document is published in German and as an English translation.
Only the German original shall be deemed authoritative.
SIMONA AGTeichweg 1655606 KirnGermany
Phone +49 (0)67 52 14-383Fax +49 (0)67 52 14-738