construction minerals - unep
TRANSCRIPT
Keymessages
• The construction sector is of significant importance in Latin America, both for its direct and indirect contribution to the region’s economy and for its indirect role in meeting basic needs, through its contribution to infrastructure. Given the expected increase in the rate of urbanization in Latin America (from around 80% today to around 90% in 2050), construction minerals will continue in importance, in order to meet housing and infrastructure needs.
• Material flows analysis suggests that changes in the extraction of construction minerals for building infrastructure does not always correspond to increases or decreases in the nation’s GDP.
• The formulation of policies and the application of best practices to promote the sustainability of this mining activity need to be directed to the different stages of the production cycle, from exploration to mine decommissioning and rehabilitation of the land.
1 Available at: http://www.ces.csiro.au/forms/form-mf-la-start.aspx UNEP
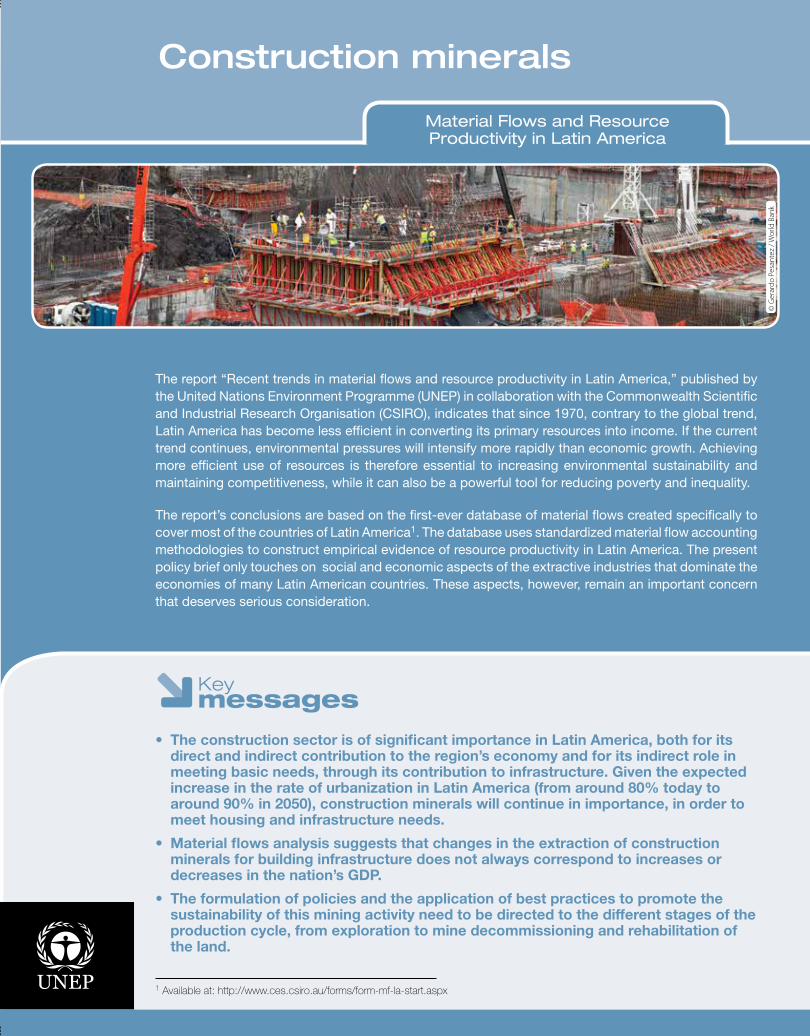
The report “Recent trends in material flows and resource productivity in Latin America,” published by the United Nations Environment Programme (UNEP) in collaboration with the Commonwealth Scientific and Industrial Research Organisation (CSIRO), indicates that since 1970, contrary to the global trend, Latin America has become less efficient in converting its primary resources into income. If the current trend continues, environmental pressures will intensify more rapidly than economic growth. Achieving more efficient use of resources is therefore essential to increasing environmental sustainability and maintaining competitiveness, while it can also be a powerful tool for reducing poverty and inequality.
The report’s conclusions are based on the first-ever database of material flows created specifically to cover most of the countries of Latin America1. The database uses standardized material flow accounting methodologies to construct empirical evidence of resource productivity in Latin America. The present policy brief only touches on social and economic aspects of the extractive industries that dominate the economies of many Latin American countries. These aspects, however, remain an important concern that deserves serious consideration.
Construction minerals
Material Flows and Resource Productivity in Latin America
© G
erar
do P
esan
tez
/ Wor
ld B
ank
Domestic consumption of construction minerals in Latin America
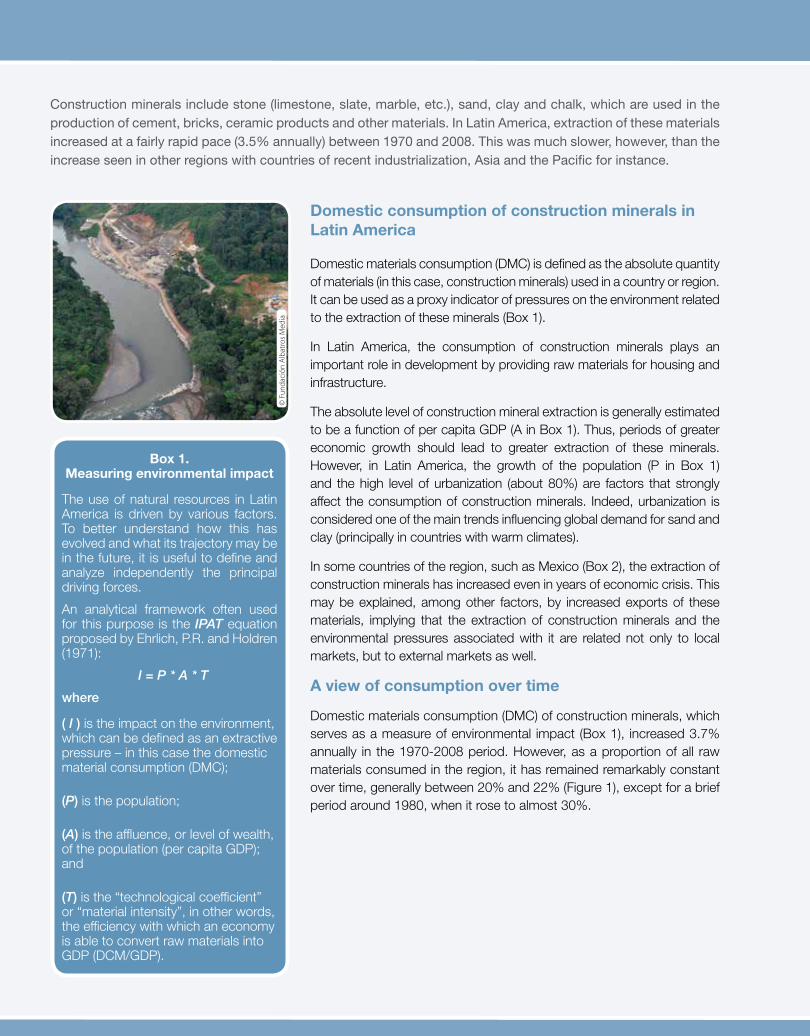
Domestic materials consumption (DMC) is defined as the absolute quantity of materials (in this case, construction minerals) used in a country or region. It can be used as a proxy indicator of pressures on the environment related to the extraction of these minerals (Box 1).
In Latin America, the consumption of construction minerals plays an important role in development by providing raw materials for housing and infrastructure.
The absolute level of construction mineral extraction is generally estimated to be a function of per capita GDP (A in Box 1). Thus, periods of greater economic growth should lead to greater extraction of these minerals. However, in Latin America, the growth of the population (P in Box 1) and the high level of urbanization (about 80%) are factors that strongly affect the consumption of construction minerals. Indeed, urbanization is considered one of the main trends influencing global demand for sand and clay (principally in countries with warm climates).
In some countries of the region, such as Mexico (Box 2), the extraction of construction minerals has increased even in years of economic crisis. This may be explained, among other factors, by increased exports of these materials, implying that the extraction of construction minerals and the environmental pressures associated with it are related not only to local markets, but to external markets as well.
A view of consumption over time
Domestic materials consumption (DMC) of construction minerals, which serves as a measure of environmental impact (Box 1), increased 3.7% annually in the 1970-2008 period. However, as a proportion of all raw materials consumed in the region, it has remained remarkably constant over time, generally between 20% and 22% (Figure 1), except for a brief period around 1980, when it rose to almost 30%.
Construction minerals include stone (limestone, slate, marble, etc.), sand, clay and chalk, which are used in the production of cement, bricks, ceramic products and other materials. In Latin America, extraction of these materials increased at a fairly rapid pace (3.5% annually) between 1970 and 2008. This was much slower, however, than the increase seen in other regions with countries of recent industrialization, Asia and the Pacific for instance.
Box 1. Measuring environmental impact
The use of natural resources in Latin America is driven by various factors. To better understand how this has evolved and what its trajectory may be in the future, it is useful to define and analyze independently the principal driving forces.
An analytical framework often used for this purpose is the IPAT equation proposed by Ehrlich, P.R. and Holdren (1971):
I = P * A * T
where
( I ) is the impact on the environment, which can be defined as an extractive pressure – in this case the domestic material consumption (DMC);
(P) is the population;
(A) is the affluence, or level of wealth, of the population (per capita GDP); and
(T) is the “technological coefficient” or “material intensity”, in other words, the efficiency with which an economy is able to convert raw materials into GDP (DCM/GDP).
© F
unda
ción
Alb
atro
s Med
ia

This profile suggests a gradual accumulation of infrastructure over time, more or less proportional to economic
growth. This contrasts clearly with the pattern in Asia and the Pacific, where construction minerals in 1970
represented 23% of DMC, growing decade by decade thereafter to account for nearly half of all materials
used by 2008. This suggests that the two regions are on quite distinct paths of development. In making these
comparisons, however, it must be borne in mind that there is a great diversity among Latin American countries,
as well as between different patterns of material flows in Asia and the Pacific. The latter have been dominated
in the last few years by China’s development, which has shown extremely strong growth, even compared with
other countries in that region. Again, population levels and pace of population growth in the two regions are
also key factors.
It is important to note that the analysis of material flow trends does not directly measure all of the environmental
and social impacts of mining. In the specific case of construction materials mining, the impacts on land use,
as well as topographic changes and loss of soil, even if temporary, can be significant, and thus merit detailed
studies of the associated effects.
Mining as a sustainable activity
Despite its importance for the region’s development, construction materials mining is considered a marginal activity, and thus receives limited economic support from governments (Cárdenas, M. and E. Chaparro, 2004). Furthermore, the significant presence of small and artisanal mining operations, the low value per unit of the material obtained and the considerable quantities that must be produced make it difficult to obtain the same economic benefits as other extractive sectors. For this reason, the industry may receive less attention in the countries’ sustainable development processes.
Most of the countries in the region have yet to implement sufficient measures to promote the efficiency of this industry. However, there have been some successful initiatives, such as Cuba’s measures, targeted specifically to the use of construction minerals (such as recycling and substituting renewable resources for non-renewable ones), along with regulations on mine closures; Colombia’s “integrated mineral-environmental management” of construction minerals; and Brazil’s green construction practices.
BiomassConstruction mineralsFossil fuelsMetal ores and industrial minerals
9.7%
7.6%
21.3%
61.4% 47.6%
23.0%
7.4%
22.0%
1970 2008
Figure 1. Percentage of domestic material consumption in Latin America, by principal categories of materials, 1970 and 2008

Ecuador
Ecuador’s per capita DMC was initially fairly low (5.1 tonnes/person in 1970) and grew at a compound annual rate of 1.7%, reaching 9.7 tonnes per capita in 2008, which is very close to the world average, although below the regional average (13.6 tonnes/person) (Figure 2a). The change in the country’s overall DMC during the 2007-2008 period is due to a great extent to growth in the mining of construction minerals (Figure 2c), which grew from 15% to 47% of overall DMC. In the last few years, the per capita consumption of construction minerals has been the highest in a group of 10 countries (Argentina, Plurinational State of Bolivia, Brazil, Chile, Colombia, Guatemala, Mexico, Peru, Bolivarian Republic of Venezuela being the other nine) in absolute number of tonnes, as well as in percentage terms. This should mean that the stocks of durable infrastructure are accumulating relatively rapidly. Nevertheless, the investment in infrastructure does not seem to increase the efficiency with which Ecuador’s economy converts raw materials into GDP (Figure 2b).
Figures 2a, 2b, 2c. Graphic overview of material flows and material intensity in Ecuador
Mexico
During the 1970-2008 period, the rise in Mexico’s DMC approached world trends, except on two occasions: the beginning of the 1980s and the beginning of the 1990s (Figure 3a). Mexico’s rise in DMC is related in part to the growth in construction minerals – from 28% to 40% of DMC – a phenomenon that may be explained by the process of industrialization and urbanization in Mexico. In 2003, construction minerals were the major material extracted in Mexico (Figure 3c). In contrast to the strong relationship between economic cycles and mineral extraction in various countries, the rise in construction mineral extraction in Mexico does not seem to follow fluctuations in the country’s economy. Indeed, the demand for construction minerals in Mexico increased even in years when the country’s economy was in crisis.
Figures 3a, 3b, 3c. Graphic overview of material flows and intensity in Mexico
Colombia
Colombia’s per capita DMC began the 1970-2008 period at a fairly low level (5.3 tonnes per capita), and then grew slowly in comparison with other countries (at less than a 0.8% compound annual rate), so that in 2008 it was only 69% of the world average and 52% of the regional average (Figure 4a). The breakdown by category of materials has shown little variation over time, except for a marked decline in the consumption of construction minerals at the beginning of the 2000 decade (Figure 4c). Construction minerals have a relatively long service life (compared with hydrocarbons or biomass), and their extraction is related mainly to the new construction phases of both infrastructure and buildings. Thus, the decline in construction minerals consumption that began in the 2000 decade could be the result of a stock of recently constructed buildings from the previous decades. The general pattern in Colombia is consistent with a relatively slow but steady process of industrialization.
Colombia is the only country (of the 10 countries analyzed) that achieved strong and steady improvement in the conversion of materials to national income through the period examined. In 1970, the material intensity (Figure 4b), at 3.7 kg/dollar, was more than 40% above the regional average, but it had dropped to 2.4 kg/dollar by 2008, which is 16% below the regional average (Figure 4b). The mechanism by which Colombia has achieved this steady improvement cannot necessarily
0.0
1.0
2.0
3.0
4.0
5.0
6.0
7.0
8.0
9.0
10.0
1970 1980 1990 2000
-2.0
-1.5
-1.0
-0.5
0.0
0.5
1970 1975 1980 1985 1990 1995 2000 2005
0.0
2.0
4.0
6.0
8.0
10.0
12.0
14.0
16.0
1970 1980 1990 2000
0.0
1.0
2.0
3.0
4.0
5.0
6.0
7.0
8.0
9.0
10.0
1970 1975 1980 1985 1990 1995 2000 2005
BiomassFossil fuelsMetal ores and industrial mineralsConstruction minerals
EcuadorLatin AmericaWorldRest of the world
Domestic material consumption per capita DMC/GDP (kg/dollar, at 2000 exchange rate)
Balanza comercial física/cápita
Tonn
es p
er c
apita
Tone
lad
as/c
ápita
Tonn
es p
er c
apita
kg
/dol
lar
Domestic material consumption per capita
0.0
1.0
2.0
3.0
4.0
5.0
6.0
7.0
8.0
9.0
10.0
1970 1980 1990 2000
-2.0
-1.5
-1.0
-0.5
0.0
0.5
1970 1975 1980 1985 1990 1995 2000 2005
0.0
2.0
4.0
6.0
8.0
10.0
12.0
14.0
16.0
1970 1980 1990 2000
0.0
1.0
2.0
3.0
4.0
5.0
6.0
7.0
8.0
9.0
10.0
1970 1975 1980 1985 1990 1995 2000 2005
BiomassFossil fuelsMetal ores and industrial mineralsConstruction minerals
EcuadorLatin AmericaWorldRest of the world
Domestic material consumption per capita DMC/GDP (kg/dollar, at 2000 exchange rate)
Balanza comercial física/cápita
Tonn
es p
er c
apita
Tone
lad
as/c
ápita
Tonn
es p
er c
apita
kg
/dol
lar
Domestic material consumption per capita
0.0
0.5
1.0
1.5
2.0
2.5
3.0
3.5
1970 1980 1990 2000
-1.6-1.4-1.2-1.0-0.8-0.6-0.4-0.20.00.20.40.6
1970 1975 1980 1985 1990 1995 2000 2005
0.0
2.0
4.0
6.0
8.0
10.0
12.0
14.0
16.0
1970 1980 1990 2000
0.0
2.0
4.0
6.0
8.0
10.0
12.0
14.0
1970 1975 1980 1985 1990 1995 2000 2005
BiomassFossil fuelsMetal ores and industrial mineralsConstruction minerals
MéxicoLatin AmericaWorldRest of the world
Domestic material consumption per capita DMC/GDP (kg/dollar, at 2000 exchange rate)
Balanza comercial física/cápita
Tonn
es p
er c
apita
Tone
lad
as/c
ápita
Tonn
es p
er c
apita
kg
/dol
lar
Domestic material consumption per capita
Box 2. Construction minerals in Ecuador, Mexico and Colombia:
contrasts and similarities
Next page

It is fundamental that mining of construction minerals be included in a broad sustainable development framework, in order to ensure that mining development also contributes to improving the quality of life and to the equitable social and economic development of mining regions.
The lack of regulation and planning instruments governing the siting of mining operations can have major consequences. A good example of this is unregulated extraction of sand for construction in coastal areas, as it can eliminate one of the most important natural defences against storms and hurricanes. Coastal development planning, construction of means of accessing dunes, rehabilitation of dunes, and initiatives for education and awareness building have been identified as effective measures to foster the sustainable use of coastal ecosystems (UNEP, 1998).
CO2 emissions from the production and transport of construction minerals also have considerable impact: the cement industry, for example, is responsible for 5% of the CO2 emitted into the environment by human activity, and for 10% of the mercury. Reducing these emissions requires developing a suitable policy framework which, among other things, encourages and facilitates the use of alternative fuels and the capture and storage of carbon, while encouraging additional energy efficiency measures. Similarly, substantial reduction of black carbon (soot), toxic substances and other pollutants could be achieved in brick production. Based on recent studies, the Climate and Clean Air Coalition to Reduce Short-Lived Climate Pollutants (CCAC) estimates that the development of more efficient technologies for brick production, principally in the firing phase, could
Looking toward the future: policy options
reduce the contaminants emitted by 10% to 50%, depending on the particular process, the scale and the type of fuel involved (UNEP and WMO, 2011).
be deduced from the material flow accounts. More research is needed to determine how this environmentally favourable trend can be replicated in other countries.
0.0
0.5
1.0
1.5
2.0
2.5
3.0
3.5
4.0
1970 1980 1990 2000
-2.0
-1.5
-1.0
-0.5
0.0
0.5
1970 1975 1980 1985 1990 1995 2000 2005
0.0
2.0
4.0
6.0
8.0
10.0
12.0
14.0
16.0
1970 1980 1990 2000
0.0
1.0
2.0
3.0
4.0
5.0
6.0
7.0
8.0
9.0
10.0
1970 1975 1980 1985 1990 1995 2000 2005
ColombiaLatin AmericaWorldRest of the world
BiomassFossil fuelsMetal ores and industrial mineralsConstruction minerals
Domestic material consumption per capita DMC/GDP (kg/dollar, at 2000 exchange rate)
Balanza comercial física/cápita
Tonn
es p
er c
apita
Tone
lad
as/c
ápita
Tonn
es p
er c
apita
kg
/dol
lar
Domestic material consumption per capita
0.0
0.5
1.0
1.5
2.0
2.5
3.0
3.5
4.0
1970 1980 1990 2000
-2.0
-1.5
-1.0
-0.5
0.0
0.5
1970 1975 1980 1985 1990 1995 2000 2005
0.0
2.0
4.0
6.0
8.0
10.0
12.0
14.0
16.0
1970 1980 1990 2000
0.0
1.0
2.0
3.0
4.0
5.0
6.0
7.0
8.0
9.0
10.0
1970 1975 1980 1985 1990 1995 2000 2005
ColombiaLatin AmericaWorldRest of the world
BiomassFossil fuelsMetal ores and industrial mineralsConstruction minerals
Domestic material consumption per capita DMC/GDP (kg/dollar, at 2000 exchange rate)
Balanza comercial física/cápita
Tonn
es p
er c
apita
Tone
lad
as/c
ápita
Tonn
es p
er c
apita
kg
/dol
lar
Domestic material consumption per capita
Figures 4a, 4b, 4c. Graphic overview of material flows and intensity in Colombia
Continued previous page
© G
erar
do P
esan
tez
/ Wor
ld B
ank
© G
erar
do P
esan
tez
/ Wor
ld B
ank

www.unep.orgUnited Nations Environment Programme
P. O. Box 30552 - 00100 Nairobi, KenyaTel.: + 254 20 762 1234Fax.: + 254 20 762 3927
e-mail: [email protected]
Box 3. Mining development and regional sustainability
Making the construction minerals mining industry part of a sustainable development framework should ensure that it operates within a life cycle that:
• Adds value to the natural resources involved, allows for recycling of resources and provides for appropriate disposal of its products and by-products.
• Ensures the participation of all actors involved in the mining cycle, with special attention to small and artisanal mining and to the private sector.
• Seeks patterns of production and use that meet basic needs and improve the quality of life, while minimizing the use of natural resources and the generation of wastes and pollutants. Among other things, this may include measures such as land use plans, public housing policies and policies to provide physical infrastructure in urban areas, and the development of new technologies.
References• Cárdenas, M. and E. Chaparro (2004). Industria minera de los materiales
de construcción. Su sustentabilidad en América del Sur. Economic Commission for Latin America and the Caribbean (ECLAC), Natural Resources and Infrastructure Division.
• Ehrlich, P.R. and Holdren, J.P. (1971). Impact of Population Growth. Science, 171, 1212 – 1217.
• European Commission (2013). Construction minerals, Enterprise and Industry. Official website. Online at: http://ec.europa.eu/enterprise/sectors/metals-minerals/non-energy-extractive-industries/construction-minerals/index_en.htm
• Giljum, S., A. Behrens, D. Jolli, K. Vogt, J. Kovanda, and S. Niza (2005), MOSUS. Material input data for the GINFORS model. Technical Report Project of the International Human Dimensions Programme (IHDP-IT).
• Gonzalez-Martinez, A.C. and H. Schandl (2007). The biophysical perspective of a middle income economy: Material Flows in Mexico. CSIRO Working Paper Series, 2007-10. 33 pp.
• International Energy Agency and the World Business Council for Sustainable Development (2009). Cement Technology Roadmap 2009: Carbon emissions reductions up to 2050. Online at: http://www.iea.org/publications/freepublications/publication/Cement.pdf
• Liu, J. and T. McDonald (2010). China: growth, urbanization and mineral resource demand. Economic Roundup (2), July 2010, 57-71 pp.
• UNEP (1998). Manual for sand dune management in the wider Caribbean. Caribbean Environment Programme, United Nations Environment Programme.
• UNEP (2011). Resource Efficiency in Latin America: Economics and Outlook. UNEP/Red Mercosur. Available at: www.pnuma.org/reeo
• UNEP (2012). GEO-5: Global Environmental Outlook. Available at: www.unep.org/geo
• UNEP (2013). Tendencias del flujo de materiales y productividad de recursos en América Latina. Available at: http://www.pnuma.org/MFA_espanol%20low%20res.pdf
• UNEP and International Resource Panel (2011). Decoupling natural resource use and environmental impacts from economic growth. A Report of the Working Group on Decoupling to the International Resource Panel.
• UNEP and International Resource Panel (2013). Environmental Risks and Challenges of Anthropogenic Metals Flows and Cycles.
• UNEP and WMO (2011). Integrated Assessment of Black Carbon and Tropospheric Ozone: Summary for Decision Makers. 30 pp. Online at: http://www.unep.org/dewa/Portals/67/pdf/Black_Carbon.pdf
• Weisz, H., F. Krausmann, C. Amann, N. Eisenmenger, K.H. Erb and K. Hubacek (2006). The physical economy of the European Union: Cross-country comparison and determinants of material consumption. Ecological Economics 58:676-698.
United Nations Environment Programme, Regional Office for Latin America and the Caribbean
This policy note is based on the UNEP publications “Recent Trends in Material Flows and Resource Productivity in Latin America”, authored by Heinz Schandl and Jim West, The Commonwealth Scientific and Industrial Research Organisation (CSIRO),
and “Resource Efficiency in Latin America: Economics and Outlook.”
Production team for this policy brief: Charles Davies, Silvia Giada, Suzanne Howard, Maia Leclerc and Andrea Salinas
Special thanks to Elisa Tonda for assistance in revising the text
December 2013
United Nations Environment ProgrammeRegional Office for Latin America and the CaribbeanAvenida Morse, Edificio 103. Clayton, Ciudad del Saber - Corregimiento de AncónPanama City, PanamaTel. (+507) 305-3100 Fax: (+507) 305-3105Internet site:: www.pnuma.org/deat1/ Email: [email protected]
UNEP