construction of the cable- stayed...
TRANSCRIPT

Client logo
Second International Seminar on the Design & Construction of the SECOND PENANG BRIDGE
CONSTRUCTION OF THE CABLE-STAYED BRIDGE
Dr. Robin Sham, Global Long Span and Specialty Bridges Director, AECOM
Dr. Frank Fan, Associate, AECOM
Mr. Liu Yu Feng, Project Chief Engineer, Section 4, CHEC

Client logo
Second Penang Bridge – in situ concrete cable-stayed
bridge
January 29, 2013 Presentation Title Page 2

Client logo Page 3
Introduction
AECOM is consultant to China Harbour Engineering Consultant (CHEC) in Second Penang Bridge • design, • specialist advice • construction supervision and • construction engineering. In the construction of the cable-stayed bridge, AECOM is responsible for construction engineering, including erection analysis, geometry control and temporary work design.

Client logo
CONSTRUCTION ENGINEERING
Page 4

Client logo Page 5
Construction Engineering
Three Main Objectives: 1.To establish a methodology for the construction of the bridge which does not cause overstress to any part of the permanent bridge structure during construction
2.To safeguard structural adequacy, integrity and stability throughout the erection stages including bridge completion
3.To achieve the reference states of the permanent works, including the permanent load geometry and force distribution defined by the Design

Client logo
General Arrangement
Page 6

Client logo
The Target Bridge Geometry
Target bridge geometry is determined for
the Reference Condition
1)under permanent loads only,
2)at a reference temperature of 30OC
3)at the time of 30 years after bridge completion
Page 7

Client logo
The Target Bridge Geometry
Page 8
Deck Segment Control Points
1) Edge Beam: H2
2) Slab: (H1 - 30mm thick asphalt)
Client logo
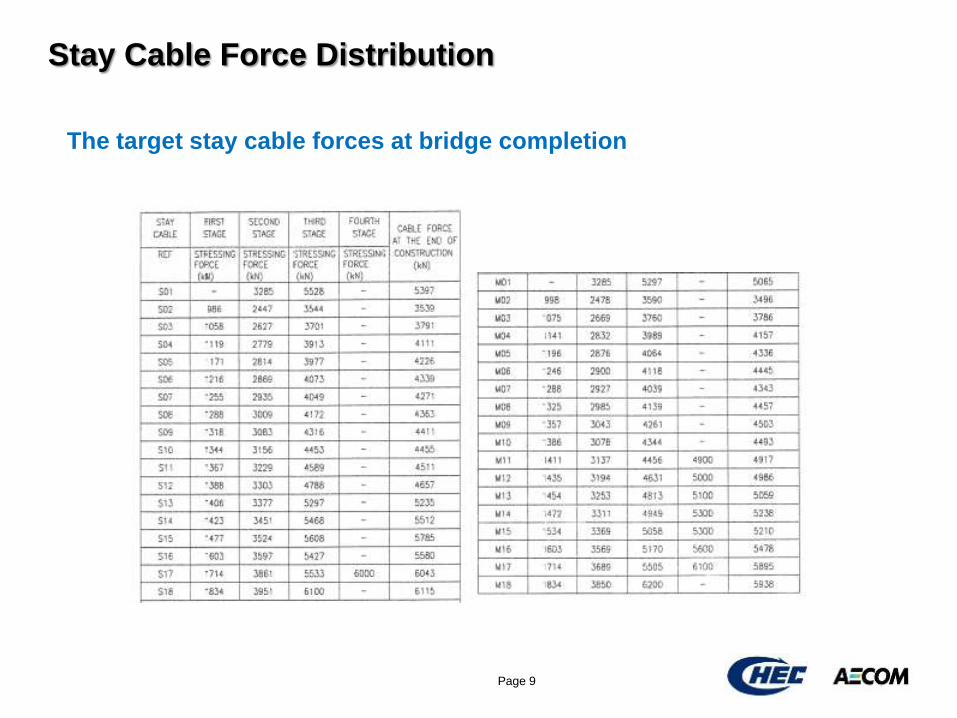
Stay Cable Force Distribution
The target stay cable forces at bridge completion
Page 9

Client logo
Stress Limits during Construction – BS5400
Prestressed concrete members
• Tensile Stress Limit = 1 MPa
• Compressive Stress Limit = 0.4 Fcu
• ULS – PM Interaction
Reinforced concrete members
• No stress limits for serviceability limit state
• DESIGN BRIEF, Revision 3, May 2010 specifies
Crack Width Limit =0.20 mm
• ULS - PM Interaction
Page 10

Client logo
Construction Manual provides the following data
1) Geometry Control Measures necessary for bridge construction
2) Pylon Setting-Out – Coordinates of Control Points
3) Deck Setting-out (edge beams and deck slabs) - Coordinates of Control Points
4) Stay Cables Setting-Out – Coordinates of Control Points, cable lengths, sags, initial and staged stay cable forces
5) Deck profiles at Various Stages – Bridge Completion, 30 Years after Bridge Completion and 120 Years after Bridge Completion
6) Stay Cable Forces at Various Stages – Bridge Completion, 30 Years after Bridge Completion and 120 Years after Bridge Completion
Page 11
Client logo
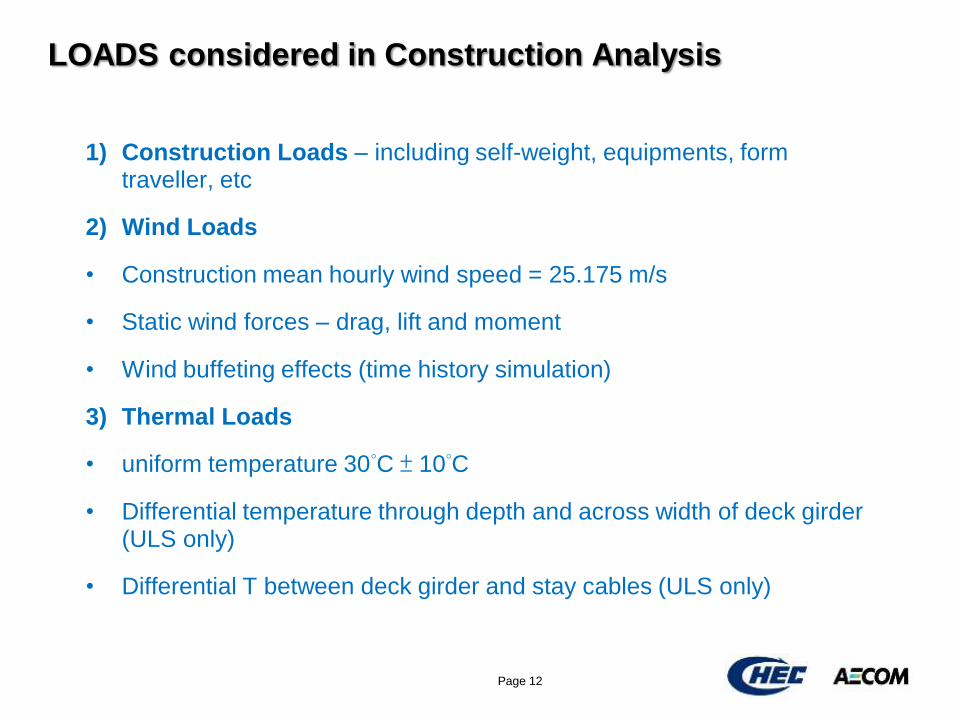
LOADS considered in Construction Analysis
1) Construction Loads – including self-weight, equipments, form traveller, etc
2) Wind Loads
• Construction mean hourly wind speed = 25.175 m/s
• Static wind forces – drag, lift and moment
• Wind buffeting effects (time history simulation)
3) Thermal Loads
• uniform temperature 30°C ± 10°C
• Differential temperature through depth and across width of deck girder (ULS only)
• Differential T between deck girder and stay cables (ULS only)
Page 12

Client logo
Construction Loads
1) Form traveller and formwork on each side = 1655 kN
2) Construction equipment load = 50 kN at the tip of cantilever (cantilever stressing platform)
3) Unbalanced a half segment weight = 1800 kN
4) Differential construction live loads = 5 kN/m on one side of cantilever
5) Differential dead load = one side of cantilever is heavier by 5%
6) Unbalanced weight due to loss of one form traveller = 1655 kN while form traveller moves forwards
7) Other miscellaneous construction loads
Page 13
Client logo
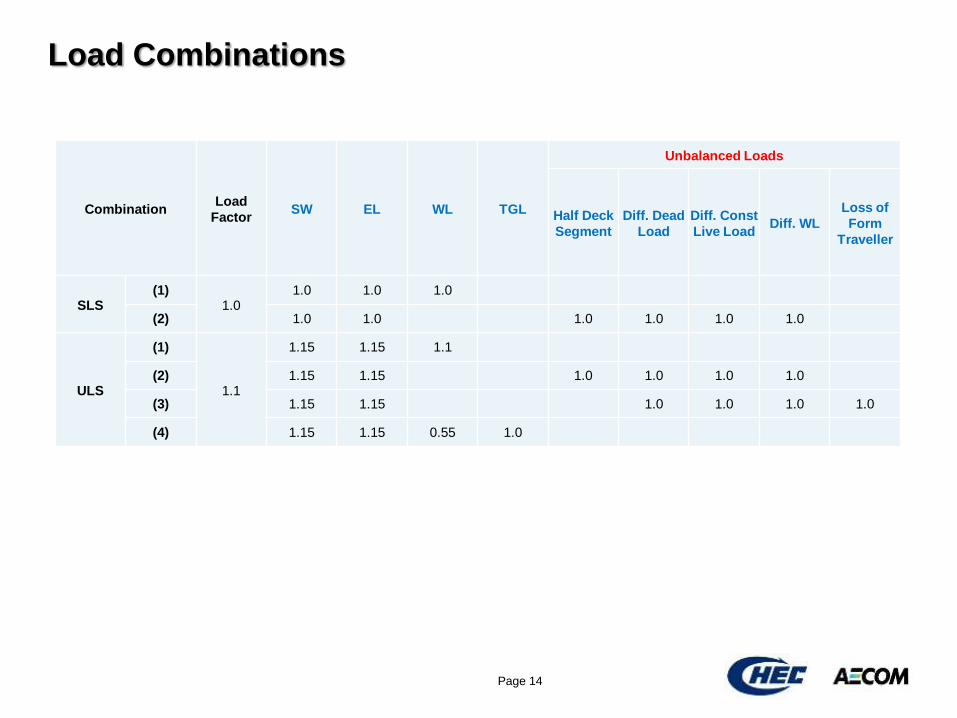
Load Combinations
Page 14
Combination Load
Factor SW EL WL TGL
Unbalanced Loads
Half Deck
Segment
Diff. Dead
Load
Diff. Const
Live Load Diff. WL
Loss of
Form
Traveller
SLS (1)
1.0 1.0 1.0 1.0
(2) 1.0 1.0 1.0 1.0 1.0 1.0
ULS
(1)
1.1
1.15 1.15 1.1
(2) 1.15 1.15 1.0 1.0 1.0 1.0
(3) 1.15 1.15 1.0 1.0 1.0 1.0
(4) 1.15 1.15 0.55 1.0

Client logo
MATERIAL PROPERTIES
Page 15

Client logo
Material Properties – Cube Compressive Strength, fcu
Page 16
Client logo
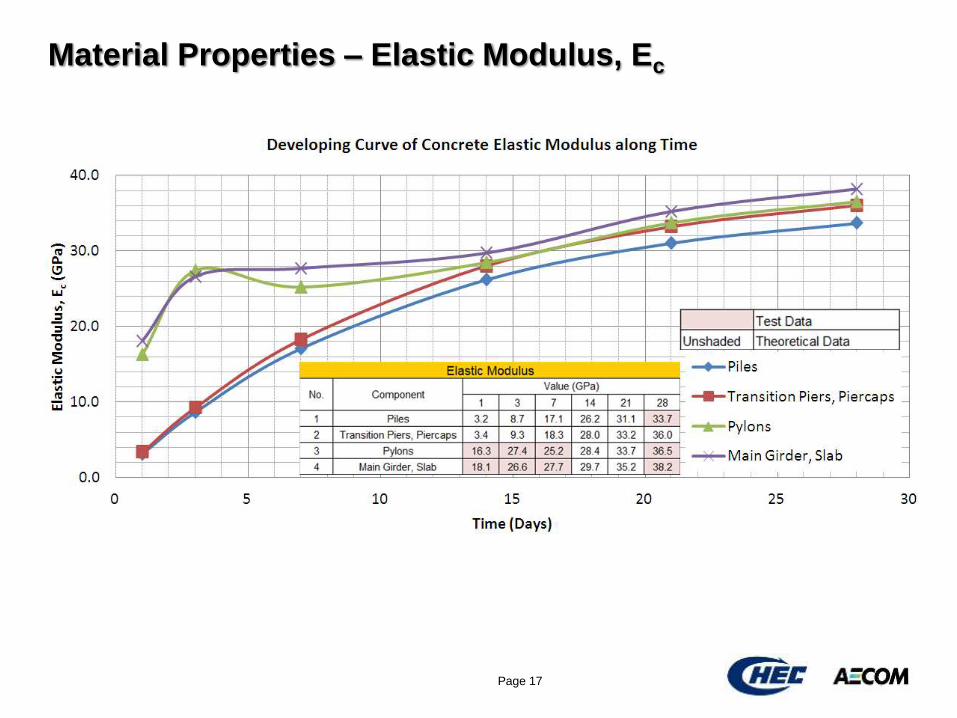
Material Properties – Elastic Modulus, Ec
Page 17

Client logo
Material Properties – Splitting Tensile Strength, fct
Page 18

Client logo
CONSTRUCTION TOLERANCE
Page 19

Client logo
Construction Tolerance - Specifications Section 22: In
Situ Segmental Construction
Page 20
Deck Profile

Client logo
Construction Tolerance
Page 21
Pylon Profile
Stay Cable Forces within 5%
Client logo
CONSTRUCTION METHOD AND
SEQUENCE
Page 22

Client logo
Construction Sequence Construction Drawing P2B/P1/VOL2-2/3001
Page 23
Client logo
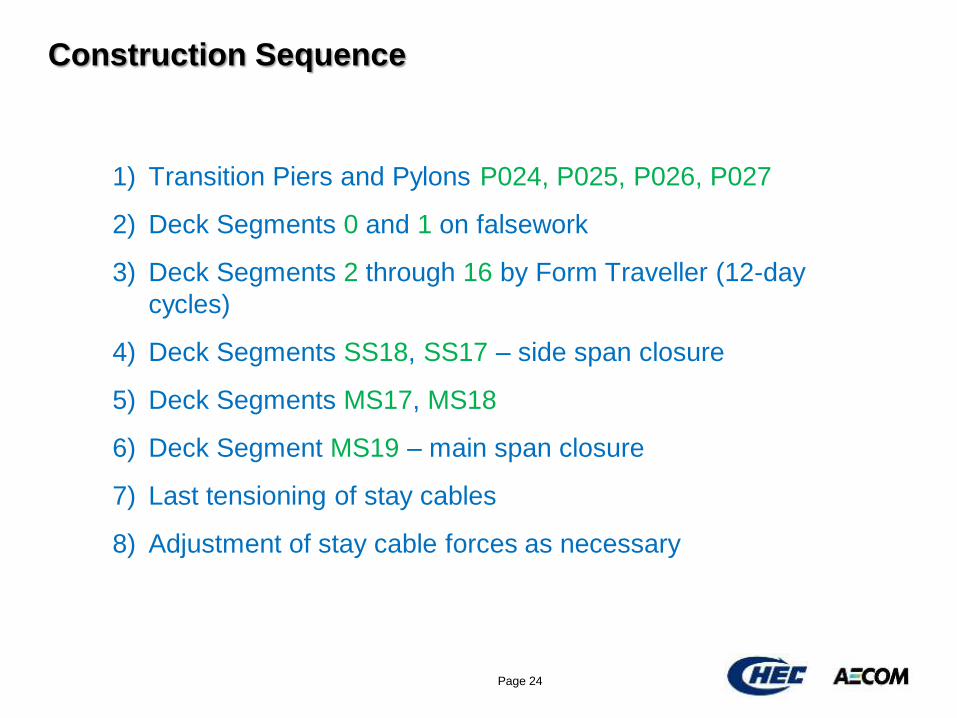
Construction Sequence
1) Transition Piers and Pylons P024, P025, P026, P027
2) Deck Segments 0 and 1 on falsework
3) Deck Segments 2 through 16 by Form Traveller (12-day
cycles)
4) Deck Segments SS18, SS17 – side span closure
5) Deck Segments MS17, MS18
6) Deck Segment MS19 – main span closure
7) Last tensioning of stay cables
8) Adjustment of stay cable forces as necessary
Page 24

Client logo
Form traveller for cable-stayed bridge erection
January 29, 2013 Presentation Title Page 25

Client logo
Typical Construction Cycle of One Deck Segment – 12 days
On the 1st Day
1) Cast the edge beams of Deck Segments N (N = 02 to 16).
On the 6th Day:
2) Stress the cantilever tendons in the edge beams of Deck Segments N upon the concrete reaching 47MPa.
3) Stress the transverse tendons N1, N3 in the diaphragms of Deck Segment N-1.
4) Stress the transverse tendons N2 in the diaphragms of Deck Segment N-2.
Page 26
Schematic Elevation of Form Traveller
Client logo
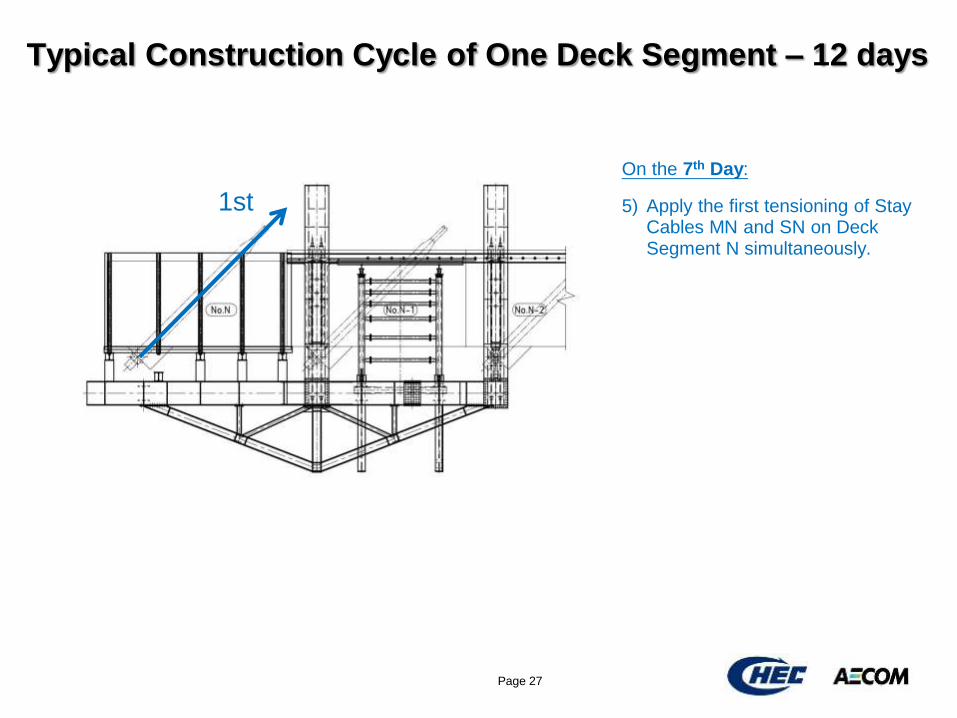
Typical Construction Cycle of One Deck Segment – 12 days
On the 7th Day:
5) Apply the first tensioning of Stay Cables MN and SN on Deck Segment N simultaneously.
Page 27
1st

Client logo
Typical Construction Cycle of One Deck Segment – 12 days
On the 8th Day
6) Fold down all the formworks (including edge beams, slabs and diaphragms)
7) Connect launching system to the front bogies and the launching rails.
Page 28
Client logo
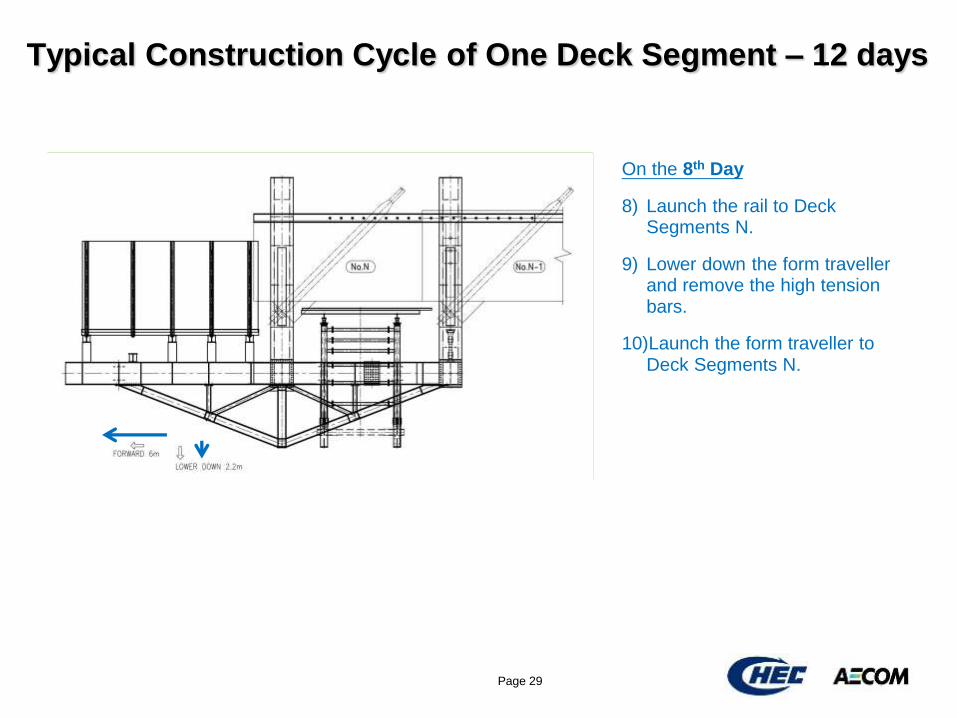
Typical Construction Cycle of One Deck Segment – 12 days
On the 8th Day
8) Launch the rail to Deck Segments N.
9) Lower down the form traveller and remove the high tension bars.
10)Launch the form traveller to Deck Segments N.
Page 29

Client logo
Typical Construction Cycle of One Deck Segment – 12 days
On the 9th Day:
11)Lift up the form traveller and install the high tension bars.
12)Fold up the formworks and install rebar cages (slabs and diaphragms).
13)Apply the second tensioning of Stay Cables MN and SN simultaneously.
On the 10th Day:
14)Cast the slabs and diaphragms of Deck Segments N on both main and side spans simultaneously.
Page 30
2nd

Client logo
Typical Construction Cycle of One Deck Segment – 12 days
On the 12th Day, for N = 02 to 15:
15)Apply the third tensioning of Stay Cables MN and SN simultaneously.
16)Fold up the formworks and install rebar cages (edge beams).
On the 15th Day, for N = 16
17)Stress the transverse tendons N1, N3 in the diaphragms of Deck Segment SS16.
18)Stress the transverse tendons N2 in the diaphragms of Deck Segment SS15.
19)Stress the transverse tendons N2 in the diaphragms of Deck Segment SS16.
Page 31
3rd

Client logo
Deck Segments SS18 and SS17 (side span closure)
Page 32
SS17 – Side Span Closure
Current Design for Temporary Support
SS17 – Side Span Closure
Client logo
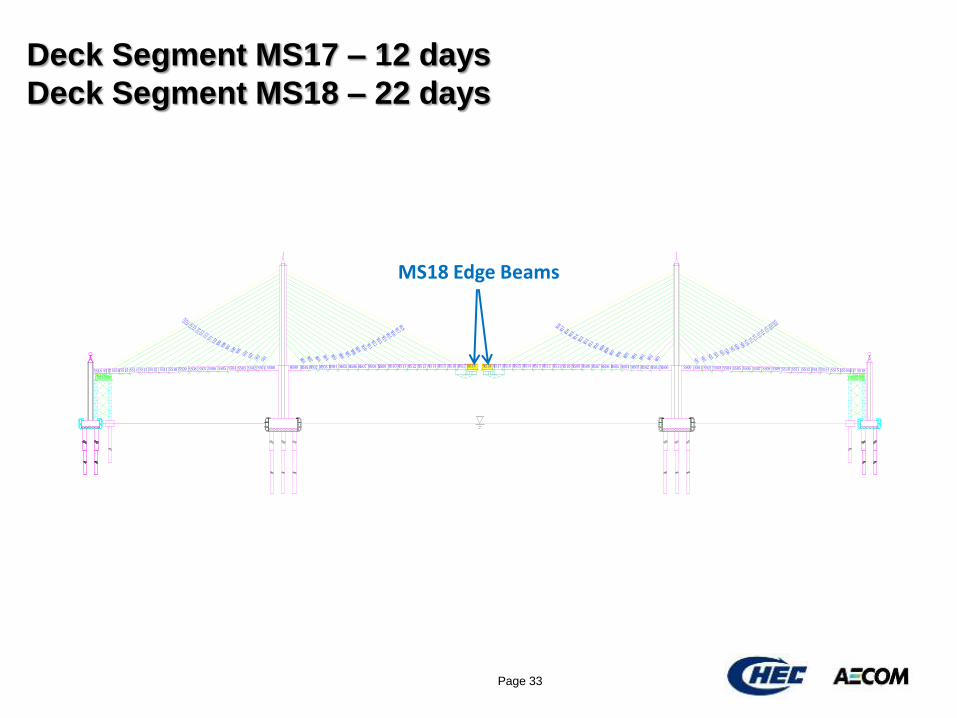
Deck Segment MS17 – 12 days
Deck Segment MS18 – 22 days
Page 33
MS18 Edge Beams

Client logo
Deck Segment MS18 – 22 days
Page 34
MS18 East - Slab and Diaphragm

Client logo
Deck Segment MS18 – 22 days
Page 35
MS18 West - Slab and Diaphragm

Client logo
Deck Segment MS19, Main Span Closure – 7 days
Page 36
MS19 – Main Span Closure

Client logo Page 37
Main Span Closure
1. Position cantilever tips at the same level
2. Install counter-weights and
3. Jacking cantilever tips toward pylons
4. Install strongbacks

Client logo
Stage-by-Stage Construction

Client logo
CONSTRUCTION OF PYLONS
Page 39
Client logo Page 40
Pylon Construction: Pre-camber and Setting-Out
Pre-camber values are given as the coordinates in the global coordinate system:
X – Longitudinal pre-camber of the pylon (Chainage)
Y – Transverse pre-camber of the pylon (Center line of the bridge = 0.000, North is positive, South is negative)
Z – Vertical pre-camber of the pylon (Elevation based upon Malaysia NGVD)
The pylons are cast to pre-cambered profile:
1) Leaning towards the transition piers for longitudinal (X) pre-camber
2) Leaning inwards, towards the bridge centerline for transverse (Y) pre-camber
3) Higher than the theoretical elevation for vertical (Z) pre-camber

Client logo Page 41
Control Points for Pylon Segment
CL PYLON AND CONTROL POINTS CL PYLON AND CONTROL POINTS
ELEVATION VIEW A-A ELEVATION VIEW B-B
E E
D D
SECTION E-E
SECTION D-D
CL OF BRIDGE
PILECAP TOP LEVEL
MAIN SPAN SIDE SPAN
CONTROL POINT 01
EL=2.680
CONTROL POINT 02
CONTROL POINT 03
EL=8.320
CONTROL POINT 04
EL=12.820
CONTROL POINT 05
CONTROL POINT 06
CONTROL POINT 07
EL=17.320
EL=21.820
EL=26.320
CONTROL POINT 08
CONTROL POINT 09
EL=39.820
CONTROL POINT 10
EL=44.320
CONTROL POINT 11
EL=48.820
CONTROL POINT 12
EL=53.320
CONTROL POINT 13
EL=57.820
CONTROL POINT 14
EL=62.320
CONTROL POINT 15
EL=66.820
CONTROL POINT 16
EL=71.320
CONTROL POINT 17
EL=75.820
CONTROL POINT 18
EL=80.320
CONTROL POINT 19
EL=84.820
CONTROL POINT 20
EL=89.320
CONTROL POINT 21
EL=93.820
EL=30.820
EL=35.320
CONTROL POINT 22
EL=96.280
CONTROL POINT
CONTROL POINT
• 24 Segments Per Pylon • 2 Control Points for Each Segment Pour, One at Each End Face
Client logo Page 42
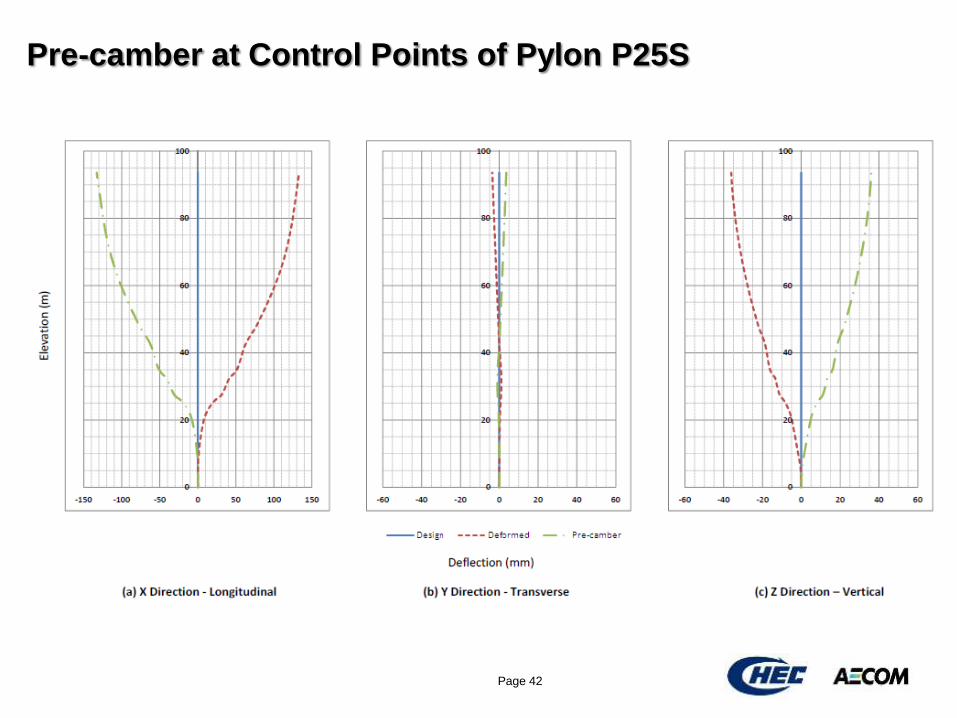
Pre-camber at Control Points of Pylon P25S

Client logo Page 43
Stress Envelopes for Pylon P025N

Client logo Page 44
Pylon Construction

Client logo Page 45
Transition Pier 027

Client logo Page 46
Pylon 026
Client logo Page 47
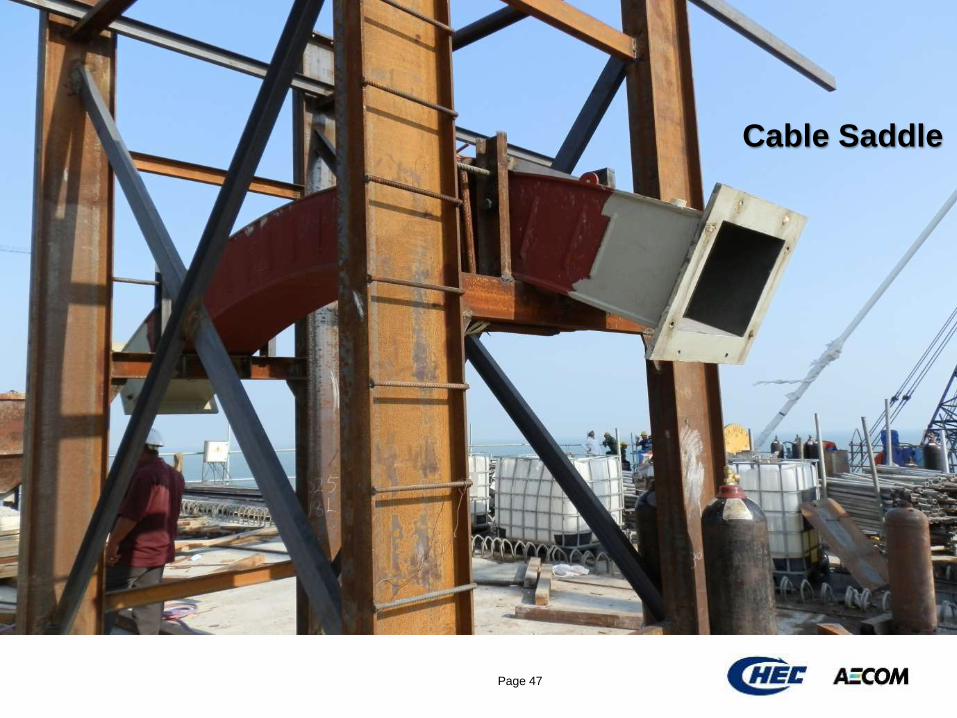
Cable Saddle

Client logo Page 48
Cable Saddle

Client logo
CONSTRUCTION OF DECK
SEGMENTS
Page 49
Client logo Page 50
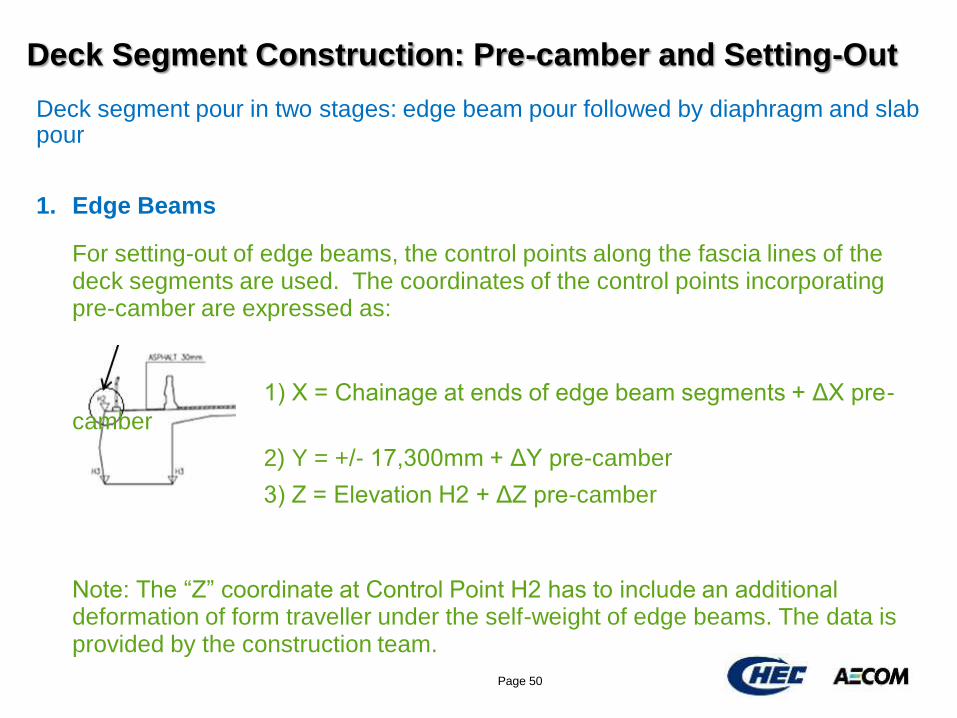
Deck Segment Construction: Pre-camber and Setting-Out
For setting-out of edge beams, the control points along the fascia lines of the deck segments are used. The coordinates of the control points incorporating pre-camber are expressed as:
1) X = Chainage at ends of edge beam segments + ΔX pre-
camber
2) Y = +/- 17,300mm + ΔY pre-camber
3) Z = Elevation H2 + ΔZ pre-camber
Note: The “Z” coordinate at Control Point H2 has to include an additional deformation of form traveller under the self-weight of edge beams. The data is provided by the construction team.
1. Edge Beams
Deck segment pour in two stages: edge beam pour followed by diaphragm and slab pour
Client logo Page 51
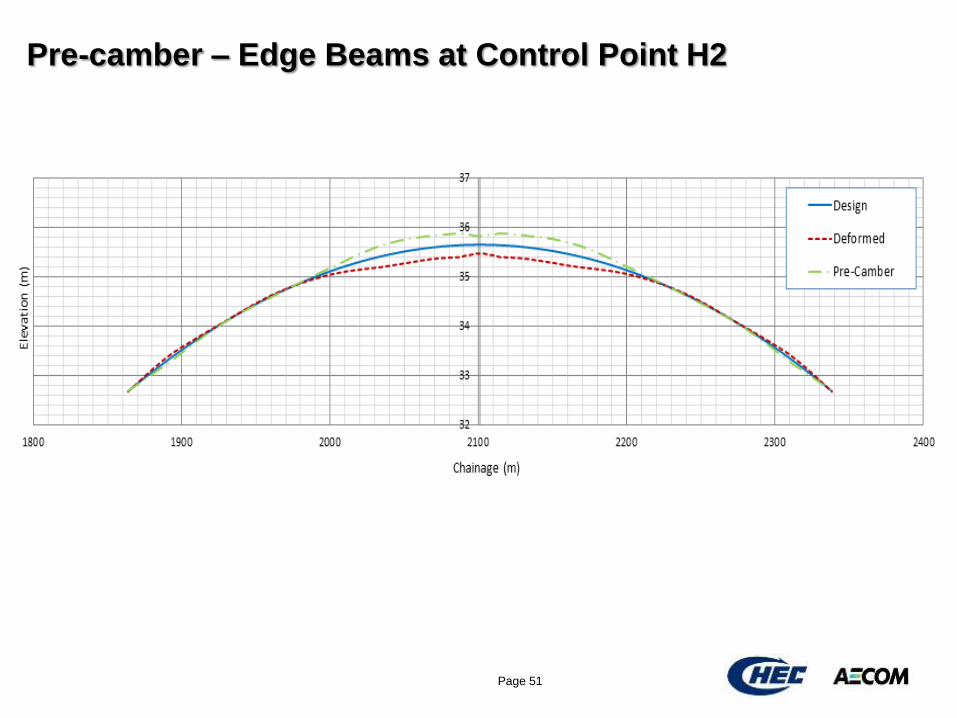
Pre-camber – Edge Beams at Control Point H2
Client logo Page 52
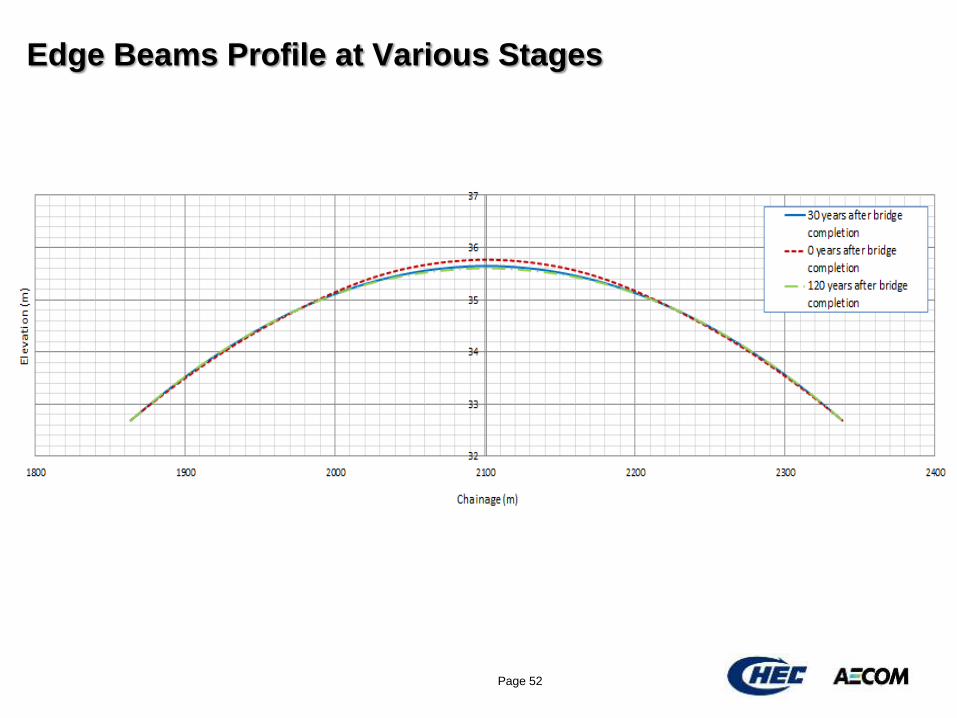
Edge Beams Profile at Various Stages
Client logo Page 53
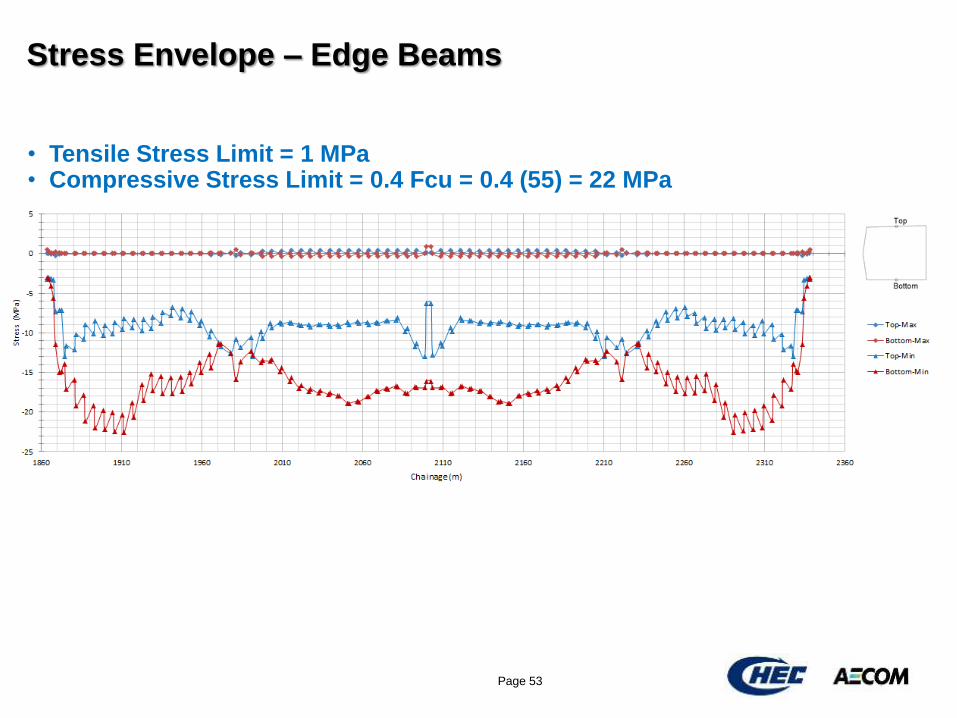
Stress Envelope – Edge Beams
• Tensile Stress Limit = 1 MPa • Compressive Stress Limit = 0.4 Fcu = 0.4 (55) = 22 MPa

Client logo
For setting-out of slab and diaphragm, control points along the center line of the deck are used. The coordinates of the control points are:
1) X = Chainage at ends of slab segments + ΔX pre-camber
2) Y = 0 mm + ΔY pre-camber
3) Z = Elevation H1 – 30mm asphalt thickness + ΔZ pre-camber
Note: The “Z” coordinate at Control Point (H1-30mm) has to include an additional deformation of formwork under the self-weight of deck slab. The data is provided by the construction team.
Page 54
Deck Segment Construction: Pre-camber and Setting-Out
2. Slabs

Client logo Page 55
Pre-camber – Slabs at Control Point (H1-30mm)
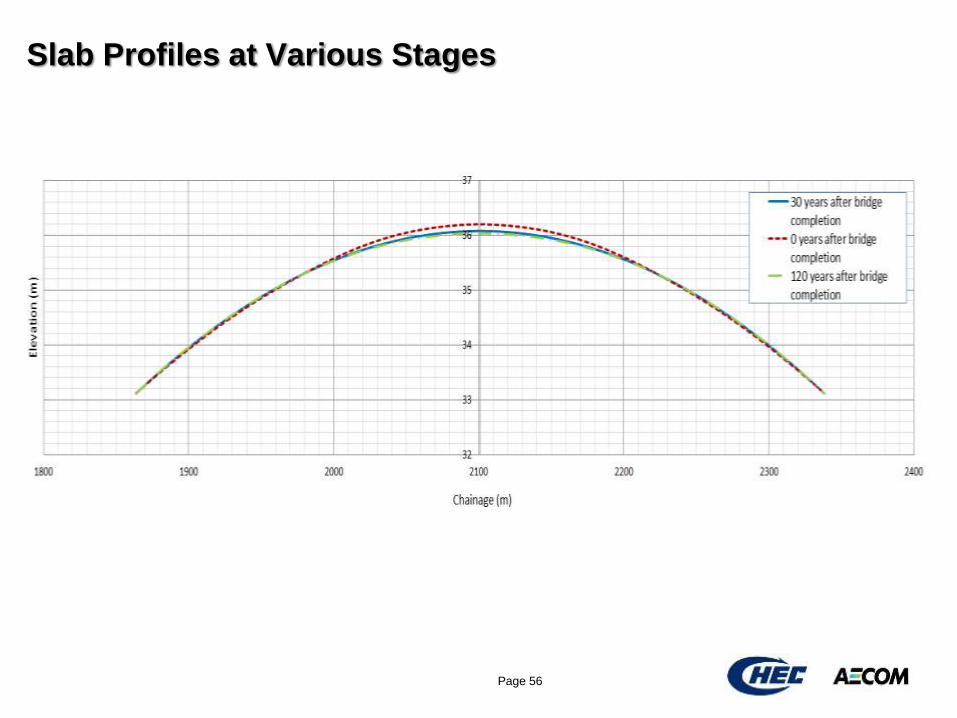
Client logo Page 56
Slab Profiles at Various Stages

Client logo Page 55
Stress Envelope – Slabs
• No stress limit under SLS. • Crack Width limit = 0.20 mm (Design Brief)

Client logo Page 58
Form Traveller
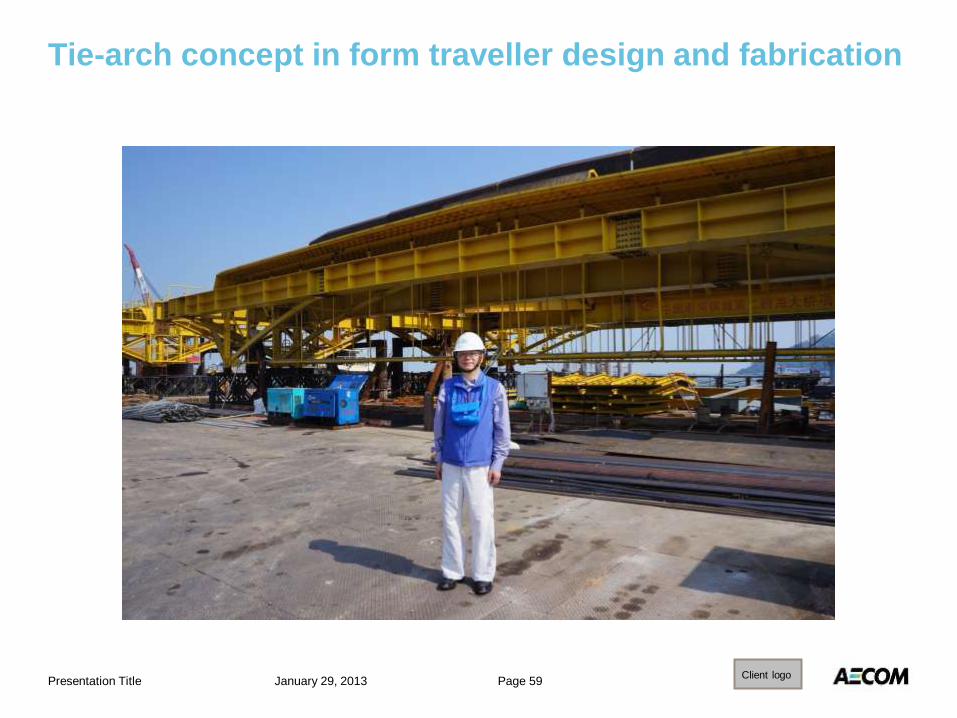
Client logo
Tie-arch concept in form traveller design and fabrication
January 29, 2013 Presentation Title Page 59

Client logo Page 60
Deck Segments 0 and 1
erection on falsework
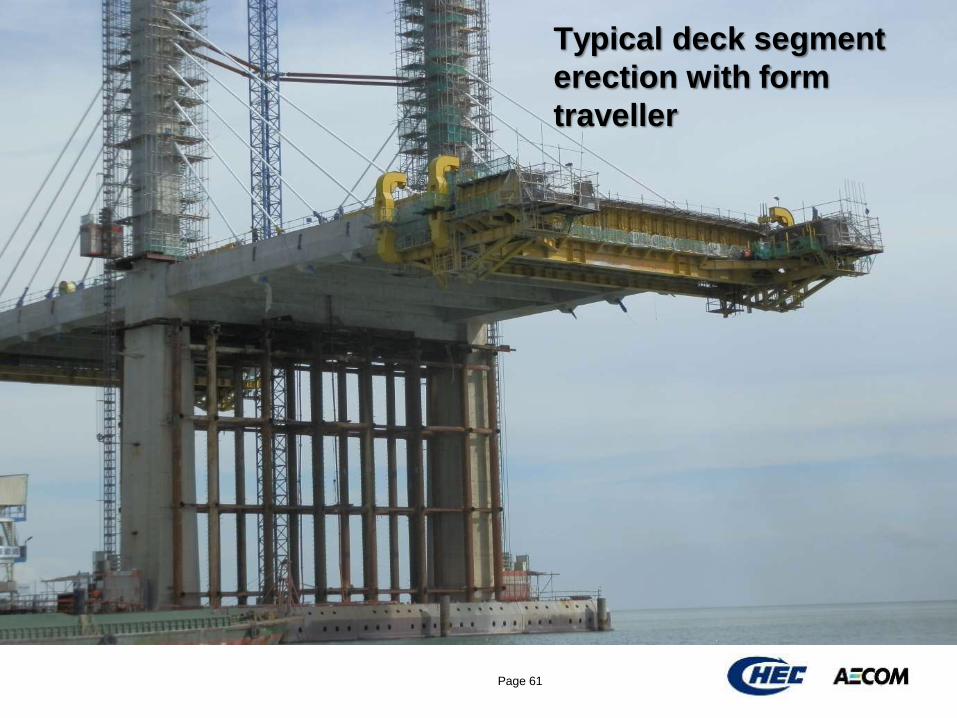
Client logo Page 61
Typical deck segment
erection with form
traveller
Client logo
INSTALLATION OF STAY CABLES
Page 62
Client logo Page 63
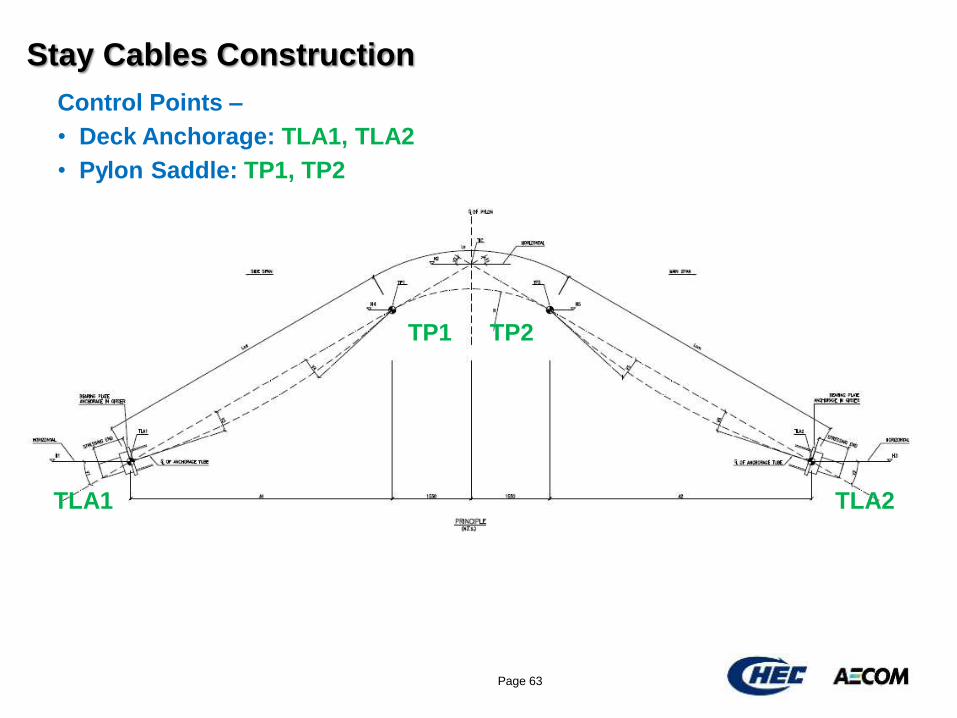
Stay Cables Construction
TLA1
TP1 TP2
TLA2
Control Points –
• Deck Anchorage: TLA1, TLA2
• Pylon Saddle: TP1, TP2

Client logo Page 64
Stay Cables Installation
Control Point Coordinates for Northwest Side Span
X— Chainage
Y— Transverse Direction (North Positive; South Negative)
Z— Elevation (Relative To Malaysia NGVD)
Chord
Length
Chord
Length
Elongation
∆L
Unstrained
Length
Lu
Total
Length
L = ∆L + Lu
Sag
X(m) Y(m) Z(m) X(m) Y(m) Z(m) (m) X'(m) Y'(m) Z'(m) X'(m) Y'(m) Z'(m) (m) (m) (m) (m) (m)
S01 1965.417 16.500 31.516 1979.338 16.500 48.422 21.899 1965.417 16.500 31.512 1979.337 16.498 48.420 21.901 0.044 21.857 21.901 0.014
S02 1959.414 16.499 31.411 1979.327 16.497 52.186 28.777 1959.413 16.500 31.419 1979.327 16.497 52.186 28.772 0.026 28.747 28.773 0.055
S03 1953.411 16.499 31.309 1979.321 16.497 54.892 35.036 1953.409 16.500 31.324 1979.321 16.497 54.892 35.027 0.033 34.994 35.027 0.076
S04 1947.408 16.499 31.203 1979.316 16.496 57.524 41.363 1947.405 16.500 31.227 1979.316 16.496 57.524 41.350 0.036 41.315 41.351 0.117
S05 1941.405 16.499 31.094 1979.311 16.496 60.116 47.740 1941.402 16.500 31.127 1979.311 16.496 60.116 47.722 0.043 47.680 47.723 0.149
S06 1935.403 16.499 30.979 1979.307 16.496 62.683 54.154 1935.400 16.500 31.022 1979.307 16.496 62.683 54.132 0.051 54.082 54.133 0.184
S07 1929.402 16.499 30.859 1979.303 16.495 65.235 60.596 1929.398 16.500 30.911 1979.303 16.495 65.235 60.570 0.059 60.513 60.571 0.223
S08 1923.401 16.499 30.726 1979.299 16.495 67.776 67.061 1923.396 16.500 30.788 1979.299 16.495 67.776 67.031 0.052 66.982 67.035 0.341
S09 1917.400 16.499 30.592 1979.296 16.495 70.309 73.542 1917.395 16.500 30.660 1979.296 16.495 70.309 73.510 0.058 73.456 73.514 0.401
S10 1911.399 16.499 30.452 1979.293 16.494 72.836 80.037 1911.393 16.500 30.526 1979.293 16.494 72.836 80.003 0.065 79.943 80.008 0.464
S11 1905.397 16.499 30.307 1979.289 16.494 75.359 86.543 1905.391 16.500 30.387 1979.289 16.494 75.359 86.507 0.072 86.442 86.513 0.533
S12 1899.397 16.499 30.157 1979.287 16.494 77.877 93.057 1899.390 16.500 30.244 1979.287 16.494 77.877 93.019 0.078 92.948 93.027 0.606
S13 1893.396 16.499 30.005 1979.284 16.493 80.394 99.579 1893.388 16.500 30.098 1979.284 16.493 80.394 99.537 0.085 99.462 99.547 0.685
S14 1887.393 16.499 29.866 1979.280 16.493 82.907 106.096 1887.385 16.500 29.967 1979.279 16.493 82.907 106.053 0.091 105.972 106.064 0.768
S15 1881.391 16.499 29.731 1979.275 16.492 85.419 112.616 1881.382 16.500 29.841 1979.275 16.492 85.419 112.569 0.101 112.481 112.582 0.833
S16 1875.389 16.499 29.599 1979.269 16.492 87.929 119.137 1875.379 16.500 29.720 1979.269 16.492 87.929 119.086 0.104 118.997 119.101 0.953
S17 1871.402 16.500 29.724 1979.392 16.491 90.427 123.881 1871.392 16.500 29.714 1979.326 16.491 90.425 123.837 0.097 123.761 123.858 1.149
S18 1867.407 16.500 29.637 1979.401 16.491 92.921 128.638 1867.398 16.500 29.632 1979.339 16.491 92.919 128.593 0.108 128.506 128.614 1.156
Control Point TLA1-Deck Control Point TP1-Pylon Control Point TLA1'-Deck Control Point TP1'-Pylon
Northwest Side Span - Prior To Tensioning of Stay Cables Northwest Side Span - After Tensioning of Stay Cables
Stay No
Client logo Page 65
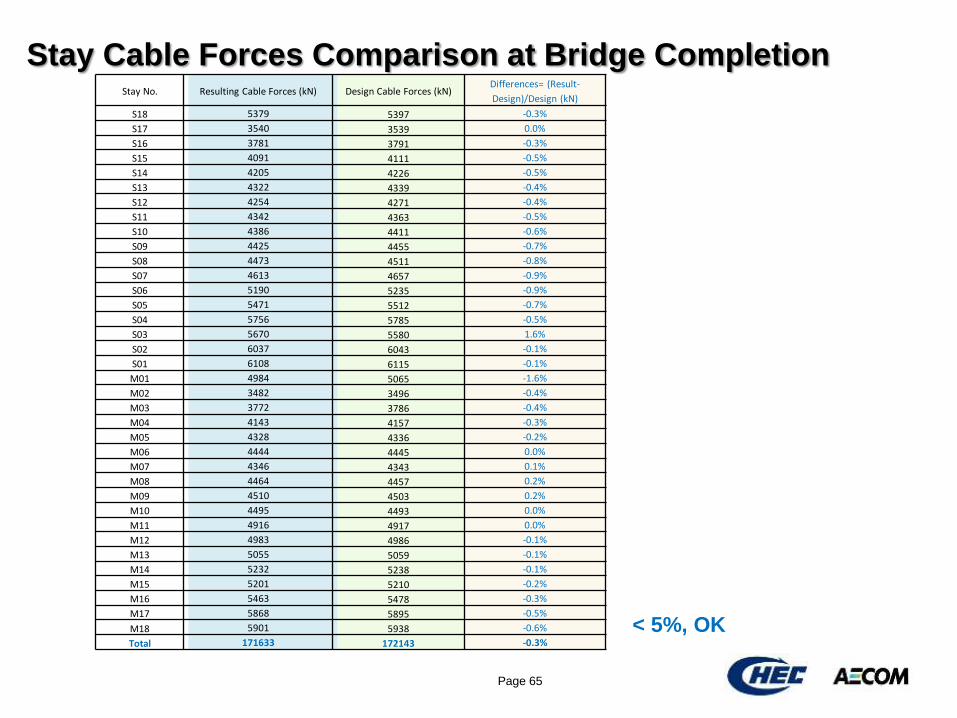
Stay Cable Forces Comparison at Bridge Completion
< 5%, OK
Stay No. Resulting Cable Forces (kN) Design Cable Forces (kN) Differences= (Result-
Design)/Design (kN)
S18 5379 5397 -0.3%
S17 3540 3539 0.0%
S16 3781 3791 -0.3%
S15 4091 4111 -0.5%
S14 4205 4226 -0.5%
S13 4322 4339 -0.4%
S12 4254 4271 -0.4%
S11 4342 4363 -0.5%
S10 4386 4411 -0.6%
S09 4425 4455 -0.7%
S08 4473 4511 -0.8%
S07 4613 4657 -0.9%
S06 5190 5235 -0.9%
S05 5471 5512 -0.7%
S04 5756 5785 -0.5%
S03 5670 5580 1.6%
S02 6037 6043 -0.1%
S01 6108 6115 -0.1%
M01 4984 5065 -1.6%
M02 3482 3496 -0.4%
M03 3772 3786 -0.4%
M04 4143 4157 -0.3%
M05 4328 4336 -0.2%
M06 4444 4445 0.0%
M07 4346 4343 0.1%
M08 4464 4457 0.2%
M09 4510 4503 0.2%
M10 4495 4493 0.0%
M11 4916 4917 0.0%
M12 4983 4986 -0.1%
M13 5055 5059 -0.1%
M14 5232 5238 -0.1%
M15 5201 5210 -0.2%
M16 5463 5478 -0.3%
M17 5868 5895 -0.5%
M18 5901 5938 -0.6%
Total 171633 172143 -0.3%

Client logo Page 66
On-Site Stay Cable Installation

Client logo
SITE SURVEY PROCEDURE
Page 67

Client logo Page 68
Site Survey Procedure
Setting-out is based on bridge profiles (deck and pylons) as modified by the pre-cambers provided in the Construction Manual. However, adjustments will be necessary for:
1) site temperature is different
2) construction loadings are not the same as the loads planned
3) correction for any deviations from theoretical profiles from earlier
construction stages
4) foundation settlement
5) falsework deflection and settlement
The survey procedures include generally:
1) pre-pour survey and setting-out
2) post-pour survey
and require geometry, temperature, wind direction and speed, weather condition and construction load mapping surveys.

Client logo
REFERENCE POINT
REFERENCE POINT Control Point
Page 69
Pylon Survey
Pre-Pour Survey
CHEC to measure site temperature, wind direction/speed
AECOM to provide setting-out information at Control Points
Post-Pour Survey
CHEC to measure site temperature, wind direction/speed, pylon concrete temperature, control point coordinates, foundation settlement
AECOM to establish pylon alignment at Control Points, to update/adjust finite element model as needed
Client logo Page 70
Deck Segment Survey
Pre-Pour Survey
CHEC to measure site temperature, wind direction/speed, construction load map
AECOM to provide setting-out information at Control Points (coordinates and/or break angles)
Post-Pour Survey
CHEC to measure site temperature, wind direction/speed, deck concrete temperature, control point coordinates
AECOM to establish deck alignment at Control Points (H1-30mm) for slabs and H2 for edge beams, to update/adjust the finite element model as needed
Client logo Page 71
Stay Cable Survey
Pre-Tensioning Survey
CHEC to measure site temperature, wind direction/speed, construction load map
AECOM to provide setting-out information at Control Points - saddles (TP1, TP2) and bearing plates (TLA1, TLA2)
Post-Tensioning Survey
CHEC to measure site temperature, wind direction/speed, stay cable temperature, as-built stay cable forces, Provide lift-off forces as requested
AECOM to establish stay cable force distribution, to update/adjust the finite element model as needed
Client logo Page 72
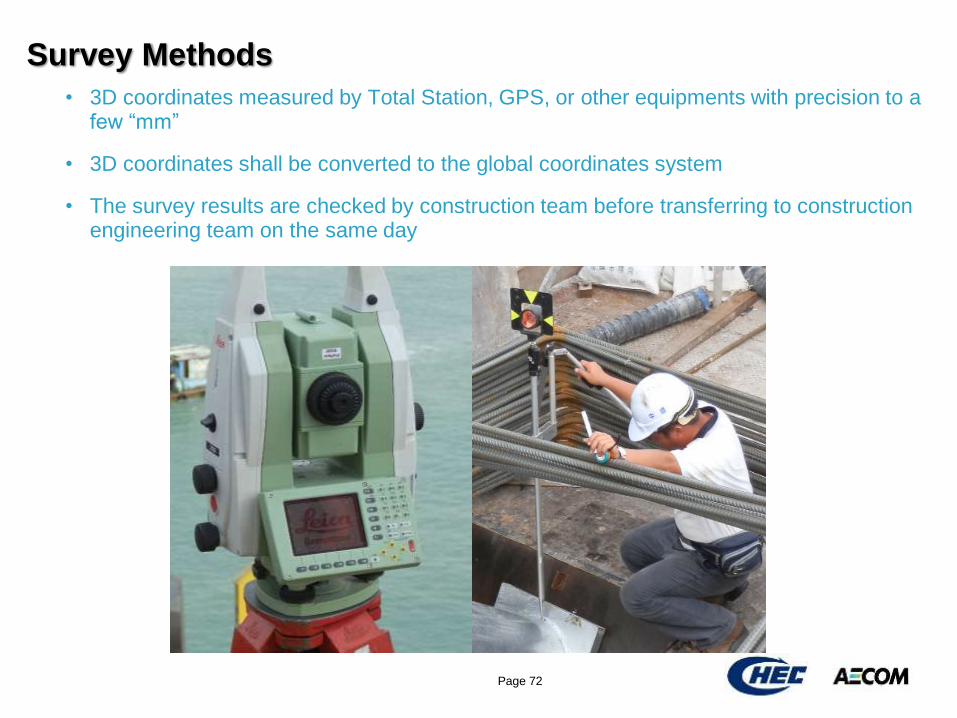
Survey Methods
• 3D coordinates measured by Total Station, GPS, or other equipments with precision to a few “mm”
• 3D coordinates shall be converted to the global coordinates system
• The survey results are checked by construction team before transferring to construction engineering team on the same day
Client logo Page 73
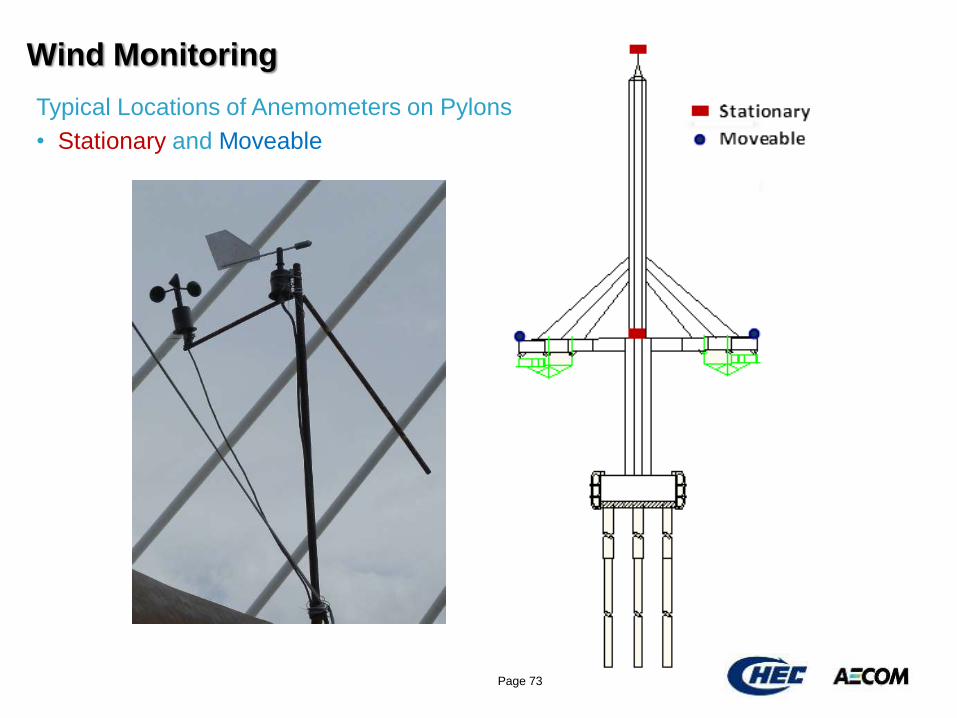
Wind Monitoring
Typical Locations of Anemometers on Pylons
• Stationary and Moveable
Client logo Page 74
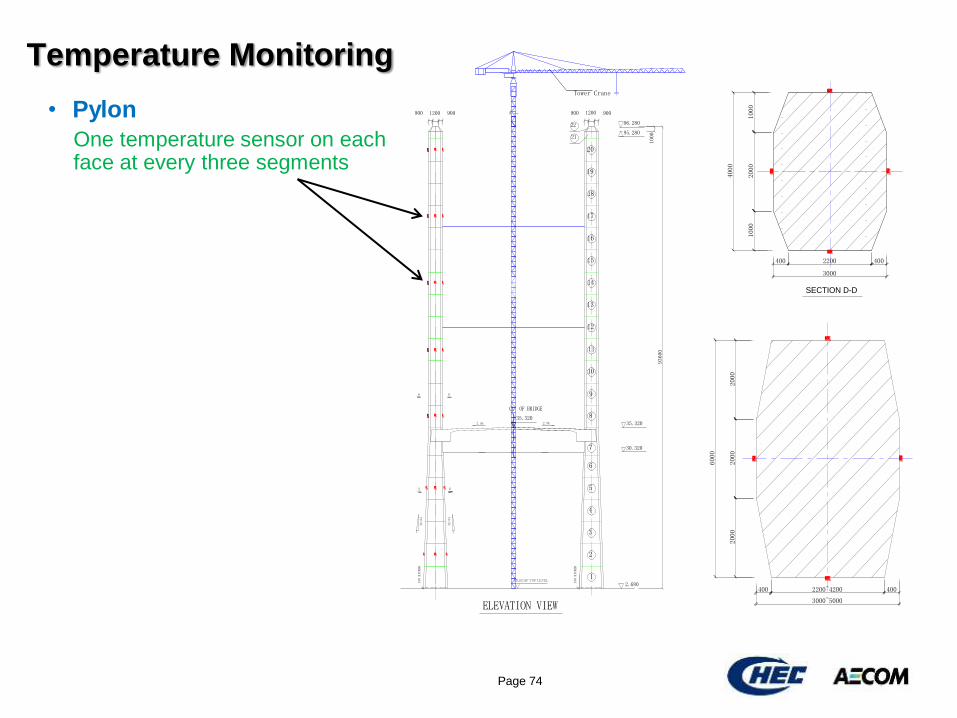
Temperature Monitoring
• Pylon
2.680
30.320
35.320
96.280
95.280
35.320
900900 900900
1
32.64
12001200
CL OF BRIDGE
PILECAP TOP LEVEL
2.5%2.5%
1000
93600
150 KICKER
150 KICKER
ELEVATION VIEW
1
2
3
4
5
6
8
9
10
11
12
13
14
15
16
17
18
19
20
21
7
22
2000
2000
2000
400 2200~4200 400
3000~5000
6000
1
32.64
1000
2000
1000
4000
400 2200 400
3000
SECTION D-D
Tower Crane
EE
D D
One temperature sensor on each face at every three segments
Client logo Page 75
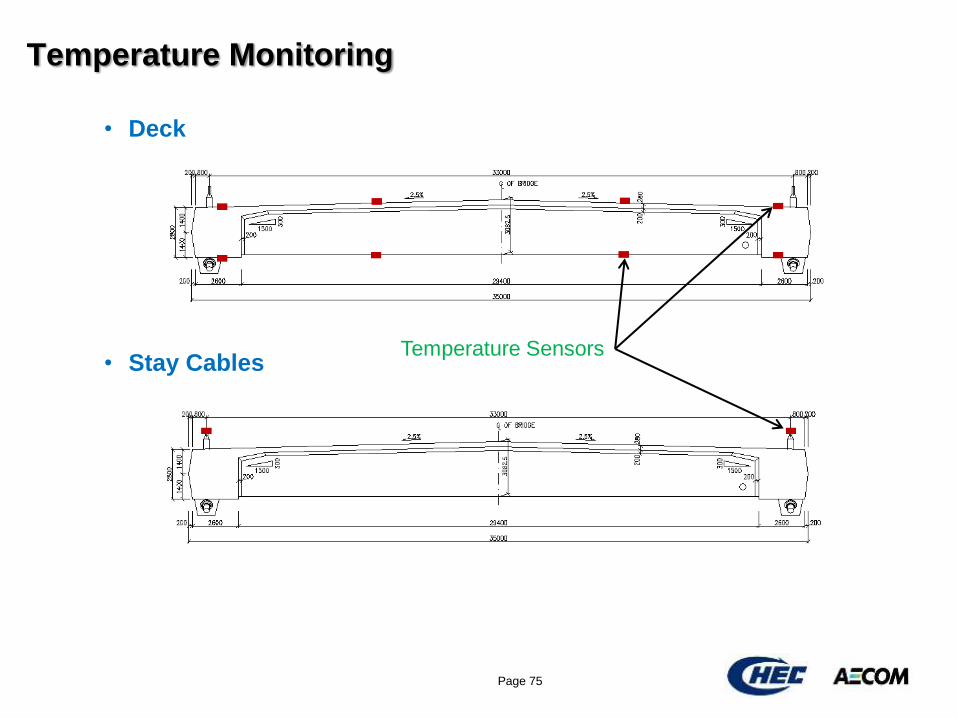
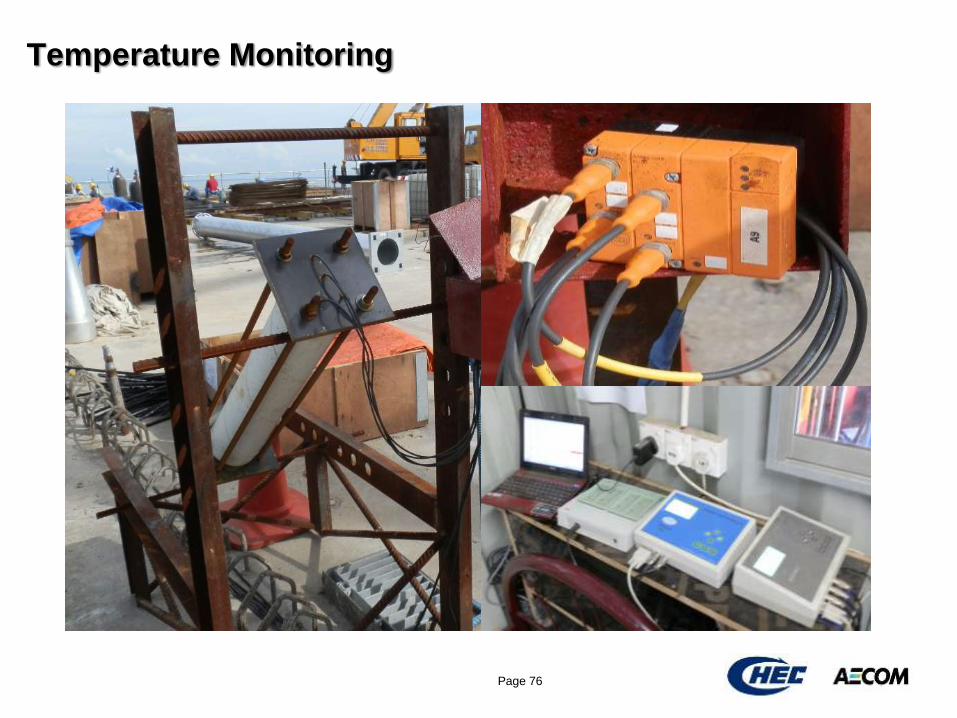
Temperature Monitoring
• Deck
• Stay Cables
Temperature Sensors
Client logo Page 76
Temperature Monitoring
Client logo Page 77
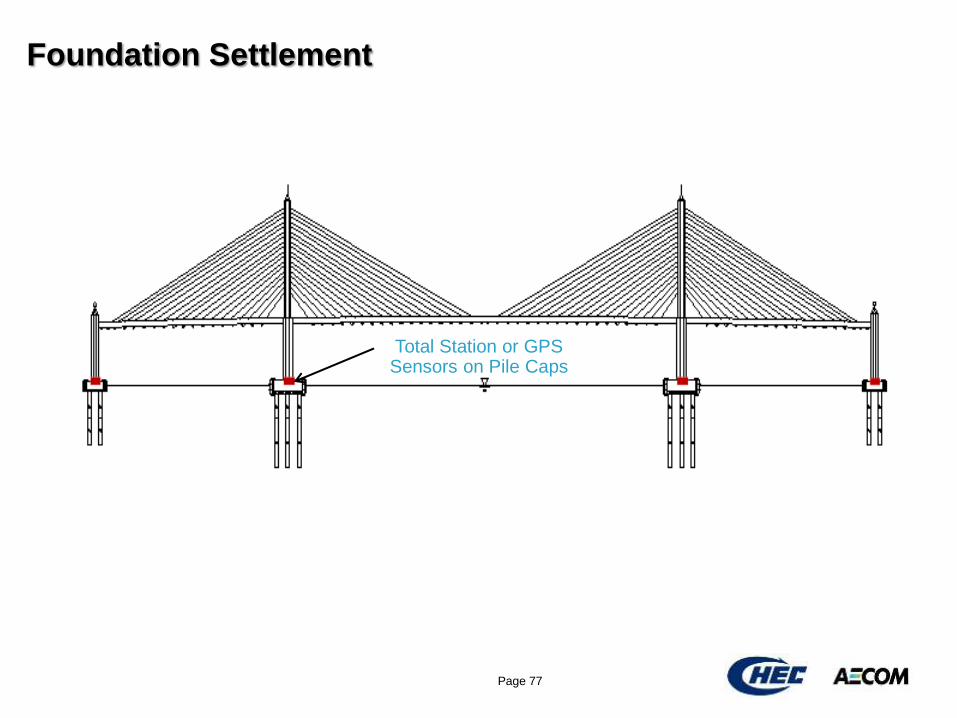
Foundation Settlement
Total Station or GPS Sensors on Pile Caps
Client logo
THANK YOU
Page 78