construction stage analysis for the nhat …istanbulbridgeconference.org/2014/isbn978-605... ·...
TRANSCRIPT

Istanbul Bridge Conference August 11-13, 2014
Istanbul, Turkey
CONSTRUCTION STAGE ANALYSIS FOR
THE NHAT TAN BRIDGE
V. Maina1, N. Taki1, T.Tokuchi2, K. Matsuno3 and T.Nishi4
ABSTRACT
The Nhat Tan Bridge is a 1500m long cable stayed bridge with 8 traffic lanes under
construction in Hanoi, Vietnam. The bridge has 4 main spans and 2 side spans of length
300m and 150m respectively.
The bridge girder is a continuous composite girder consisting of a 35.6m reinforced concrete
deck on 2 I-beam steel edge girders with 4m spaced I-beam steel floor beams.
Five A-shaped reinforced concrete pylons with embedded steel anchor boxes support the
deck via 220 New Parallel Wire Strands (PWS) stay cables. The stay cables are designed in a
fan arrangement with longitudinal spacing of 12m at deck level.
The Cantilever erection method was applied in the construction of the superstructure.
Construction Stage Analysis was utilized to evaluate the structural integrity of the bridge,
optimization of the construction steps and geometry control during the cantilever erection
process.
This paper describes the challenges faced in the development and application of construction
stage analysis. Solutions applied to overcome these challenges and the results are also
presented.
1Design Engineer, Nhat Tan Bridge Project, IHI Infrastructure Systems Co., Ltd. , 3-banchi, Ohama-nishimachi,
Sakai-ku, Sakai-shi, Osaka 590-0977 Japan 2 Deputy Design Manager, Nhat Tan Bridge Project, IHI Infrastructure Systems Co., Ltd.
3 Deputy Project Manager, Nhat Tan Bridge Project, IHI Infrastructure Systems Co., Ltd. 4 Project Manager, Nhat Tan Bridge Project, IHI Infrastructure Systems Co., Ltd.
Maina V., Taki N., Tokuchi T., Matsuno K., Nishi T. Construction Stage Analysis for the Nhat Tan Bridge.
Proceedings of the Istanbul Bridge Conference, 2014.

Istanbul Bridge Conference August 11-13, 2014
Istanbul, Turkey
Construction Stage Analysis for the Nhat Tan Bridge
V. Maina1, N. Taki1, T.Tokuchi2, K. Matsuno3and T.Nishi4
ABSTRACT
The Nhat Tan Bridge is a 1500m long cable stayed bridge with 8 traffic lanes under
construction in Hanoi, Vietnam. The bridge has 4 main spans and 2 side spans of length 300m
and 150m respectively.
The bridge girder is a continuous composite girder consisting of a 35.6m reinforced concrete
deck on 2 I-beam steel edge girders with 4m spaced I-beam steel floor beams.
Five A-shaped reinforced concrete pylons with embedded steel anchor boxes support the deck
via 220 New Parallel Wire Strands (PWS) stay cables. The stay cables are designed in a fan
arrangement with longitudinal spacing of 12m at deck level.
The Cantilever erection method was applied in the construction of the superstructure.
Construction Stage Analysis was utilized to evaluate the structural integrity of the bridge,
optimization of the construction steps and geometry control during the cantilever erection
process.
This paper describes the challenges faced in the development and application of construction
stage analysis. Solutions applied to overcome these challenges and the results are also
presented.
Introduction
The Nhat Tan Bridge is a 1500m long cable stayed bridge with 8 traffic lanes under
construction in Hanoi, Vietnam. The bridge has 4 main spans and 2 side spans of length
300m and 150m respectively.
1 Design Engineer, Nhat Tan Bridge Project, IHI Infrastructure Systems Co., Ltd. , 3-banchi, Ohama-nishimachi,
Sakai-ku, Sakai-shi, Osaka 590-0977 Japan 2 Deputy Design Manager, Nhat Tan Bridge Project, IHI Infrastructure Systems Co., Ltd. 3 Deputy Project Manager, Nhat Tan Bridge Project, IHI Infrastructure Systems Co., Ltd. 4 Project Manager, Nhat Tan Bridge Project, IHI Infrastructure Systems Co., Ltd.
Maina V., Taki N., Tokuchi T., Matsuno K., Nishi T. Construction Stage Analysis for the Nhat Tan Bridge.
Proceedings of the Istanbul Bridge Conference, 2014.

Figure 1. General Layout of the Nhat Tan Bridge
The bridge girder is a continuous composite girder consisting of a 35.6m reinforced
concrete deck on 2 I-beam steel edge girders and 4m spaced I-beam steel floor beams.
Figure 2. Typical Cross section of the Girder
The construction of the bridge utilized several advanced construction methods
including the use of self-supporting inclined bent system and balanced cantilever erection
method.
Construction Stage Analysis, as the name implies, involves the replication of the
dynamic structural properties and load distributions of the bridge during each step of the
construction. This analysis was used to confirm the structural integrity of the bridge during
erection and provide target values for geometry control.
Structural Modelling and Analysis
Modelling and Analysis was performed using proprietary software, MIDAS CIVIL 2013.
The software has a user friendly interface that provides an easy method for command input. It
also has various intuitive modelling tools that assist in the modelling of complex structure. In
addition, a text based command prompt allows for offline checking of the completed model,
thereby making it possible for several engineers to proof check the analysis model
concurrently.
Figure 3. Full Analysis Model
Challenges and Limitations in Modelling and Analysis
In the development of the structural model, challenges and limitations were encountered. By
utilizing past experiences, trial analyses among others, the challenges were overcome and
limitations satisfied, leading to the successful application of Construction Stage Analysis.
The major three challenges and limitations are as follows;
Model size
The Nhat Tan Bridge has 220 stay cables, 266 steel girder blocks and 376 floor beams. In
addition, the steel girders and the pylon legs have tapered sections resulting in variations of
rigidity.
From a structural design point of view, to produce a highly accurate response of the
structure, it is necessary to model these variations. However, modelling all these variations
would result in a very large model size which would hinder collaboration as the analysis can
only be performed on high performance computers. A large model would also increase the
time required for data evaluation, leading to a longer response time in the event that the
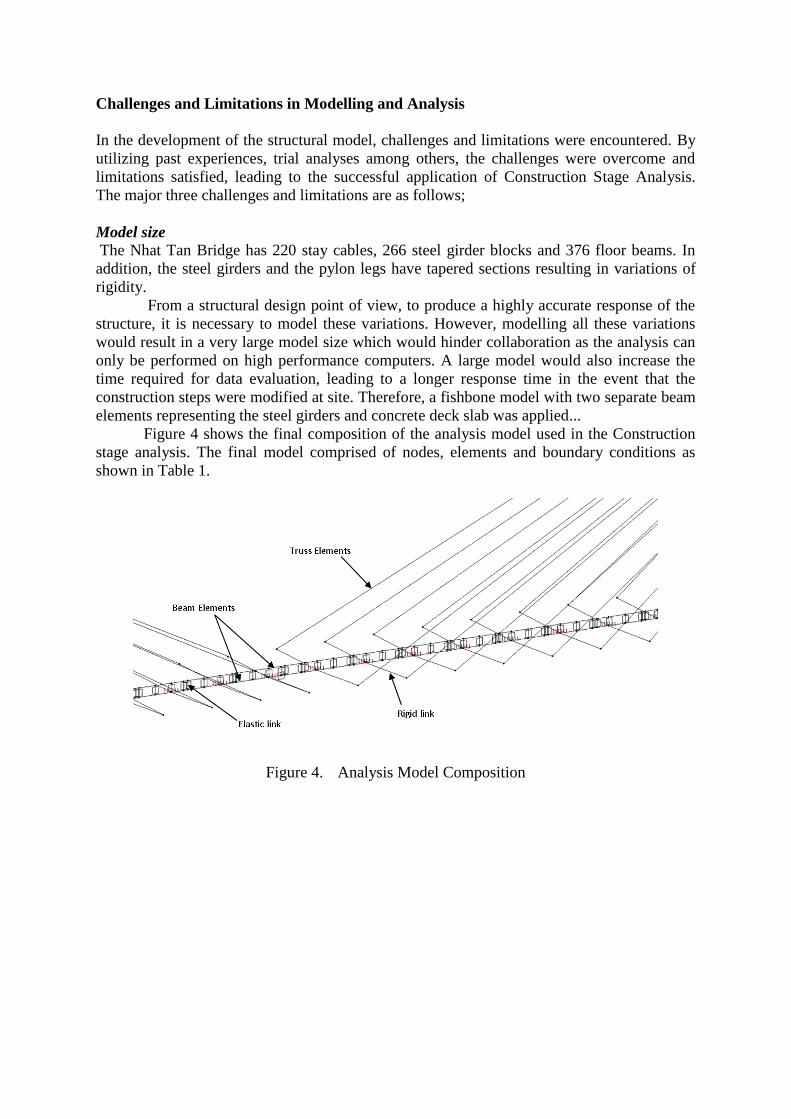
construction steps were modified at site. Therefore, a fishbone model with two separate beam
elements representing the steel girders and concrete deck slab was applied...
Figure 4 shows the final composition of the analysis model used in the Construction
stage analysis. The final model comprised of nodes, elements and boundary conditions as
shown in Table 1.
Figure 4. Analysis Model Composition

Nonlinear components
The stay cables can be modelled as either non-linear cable elements or linear truss elements.
In addition, the bridge elastomeric bearings can be modelled as non-linear springs or linear
springs. Using of non-linear elements would increase the accuracy of the analysis. However,
inclusion of non-linear features into the model would result in an increase in the computer
requirements and time required to perform the analyses. Therefore, the effects of non-
linearity were confirmed to be negligible on a static model before application of linear
elements.
Construction Steps
The cantilever erection of the Nhat Tan Bridge had many intricate steps for each cycle.
However, it was not technically feasible to replicate each and every step in analysis.
Therefore, it was necessary to identify the integral steps to analyze and achieve the aims of
confirming structural integrity and providing target values for geometry control during stay
cable tensioning works.
Evaluations of the effects in load distribution and structural composition resulted in 8
steps being selected as the integral and basic steps for each cantilever cycle. Additional steps
were added when required. The 4 main steps, girder erection, stay cable tensioning, precast
deck panel installation and joint concrete casting are shown below.
The final model had 120 steps from pylon construction to occurrence of creep and shrinkage
after bridge completion. The average analysis time was 30 minutes.
Working Platform
50t RC
South North
CYCLE 5 - STEP 1: ERECTION OF STEEL GIRDER SOUTH
Working Platform
Tower crane
50t RC
NorthSouth
Working Platform
CYCLE 5 - STEP 7: CASTING OF JOINT CONCRETE
Working PlatformWorking Platform
Tower crane
South North
Working Platform
CYCLE 5 - STEP 5: INSTALLATION OF 24PDPS SOUTH AND NORTH
50t RC
Working Platform
Tower crane
South North
50t RC
Working Platform
CYCLE 5 - STEP 4: INSTALLATION AND TENSIONING OF CABLES
Figure 5. Main Construction Stages

Structural Evaluation
Pylon
Sectional forces from the pylon legs were used to evaluate for stress levels during the
construction process. The stresses were confirmed to be below allowable compression values.
For the tensile stresses, the stress at which a 0.2mm crack appears was used as the maximum
allowable value. Figure 6 below shows the envelope curve of stresses during the construction
process...
Composite Girder
The flexural stress and axial stresses were evaluated for each construction stage in the
analysis
Calculations for stresses were performed taking into consideration the stresses build
up from when the girder is pre-composite and composite. Incremental sectional forces were
used to evaluate the stresses for the sections as shown in the table below.
Figure 6. Stress Envelope Curves of Pylon Leg
Non-composite Composite
Section
PropertiesIs, As Iv, Av
Sectional Forces
UsedNs,Ms
Nv, Mv where
Nv = Ns + Nc
Mv= Ms + Mc +δvs Ns - δvcNc
Stress Evaluation
where subscripts s, c and v stand for Steel, Concrete and Composite
sections respectively.
δvs : distance from center of equilibruim of composite section to COE of steel section
δvc : distance from center of equilibruim of composite section to COE of concrete deck slab
yI
M
A
N
s
s
s
s yI
M
A
N
v
v
v
v
Table 1. Evaluation of Girder stress

The maximum and minimum stress values were confirmed to be within allowable
values as shown in the following figures...
Figure 7. Stress Envelope Curves of Upper Surface of Concrete Deck
Figure 8. Stress Envelope Curves of Upper Flange of Steel Girders
Figure 9. Stress Envelope Curves of Lower Flange of Steel Girders
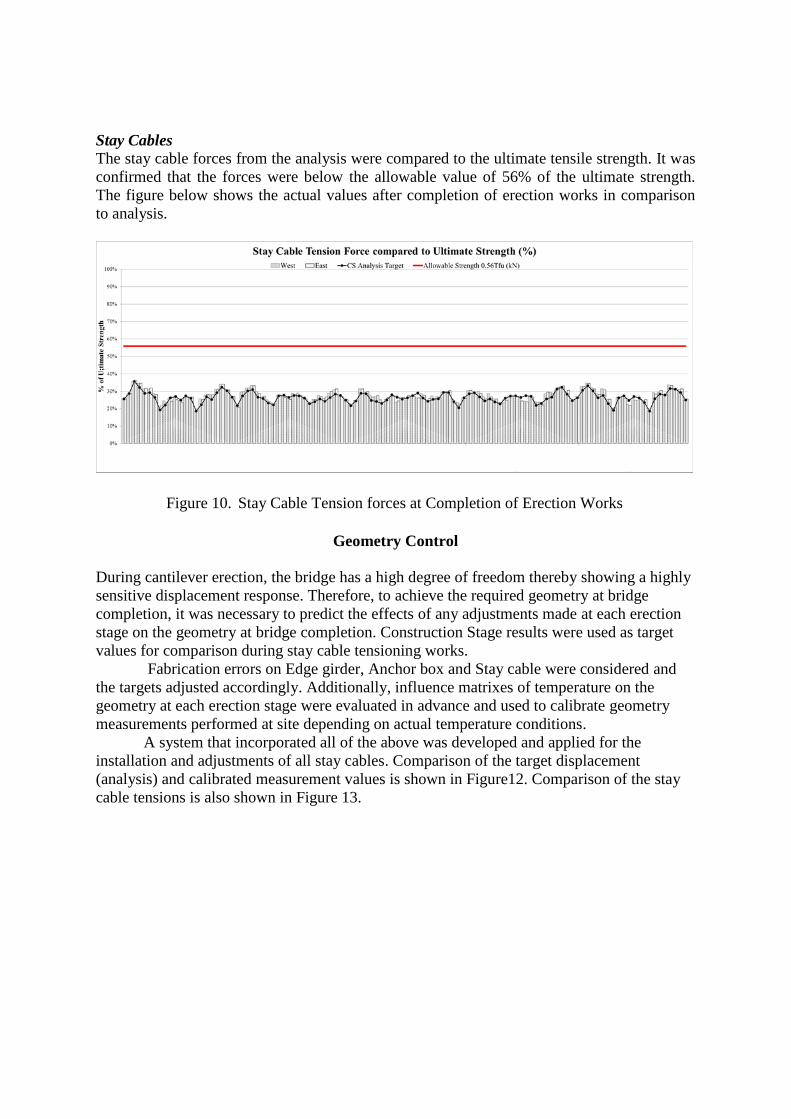
Stay Cables
The stay cable forces from the analysis were compared to the ultimate tensile strength. It was
confirmed that the forces were below the allowable value of 56% of the ultimate strength.
The figure below shows the actual values after completion of erection works in comparison
to analysis.
Geometry Control
During cantilever erection, the bridge has a high degree of freedom thereby showing a highly
sensitive displacement response. Therefore, to achieve the required geometry at bridge
completion, it was necessary to predict the effects of any adjustments made at each erection
stage on the geometry at bridge completion. Construction Stage results were used as target
values for comparison during stay cable tensioning works.
Fabrication errors on Edge girder, Anchor box and Stay cable were considered and
the targets adjusted accordingly. Additionally, influence matrixes of temperature on the
geometry at each erection stage were evaluated in advance and used to calibrate geometry
measurements performed at site depending on actual temperature conditions.
A system that incorporated all of the above was developed and applied for the
installation and adjustments of all stay cables. Comparison of the target displacement
(analysis) and calibrated measurement values is shown in Figure12. Comparison of the stay
cable tensions is also shown in Figure 13.
Figure 10. Stay Cable Tension forces at Completion of Erection Works

Figure 11. Comparison of Target and Actual Girder Displacement during Cantilever Erection
Figure 12. Comparison of Target and Actual Stay Cable Tension Forces during Cantilever
Erection
Following the application of the geometry control, the elevation after closure of all
spans satisfied the allowable deviations of -100 mm to 170 mm without requiring any
additional stay cable force adjustments
Conclusion
The Nhat Tan Bridge, a 6 span cable stayed bridge with a composite girder was erected using
the cantilever method. In the evaluation of the structural integrity of the bridge during
erection and to provide target values for geometry control, construction stage analysis was
applied.
Development of the analysis model was faced with challenges in determining model size,
inclusion or exclusion of non-linear components and setting the construction steps. These
challenges were overcome by a combination past experience, trial analyses and engineering
sense.
From the experience with the Nhat Tan Bridge, notwithstanding the current advances in
analysis software, it is crucial to balance between the need for accuracy and applicability of
construction stage analysis for checking structural integrity and geometry control.
The lessons learnt from the Nhat Tan Bridge will be used to refine the criteria for this
‘balance’.
Acknowledgements
The authors would like to acknowledge the commitment and support provided by the Nhat

Tan Bridge Project Resident Design Engineers in the implementation of the Construction
Stage Analysis.