consumer acceptance and willingness to pay for edible...
TRANSCRIPT
Consumer acceptance and willingness to pay for edible insects as food in Kenya: the case of white winged termites
Mohammed H. Alemu Søren B. Olsen Suzanne E. Vedel Kennedy O. Pambo Victor O. Owino
2015 / 10

IFRO Working Paper 2015 / 10 Consumer acceptance and willingness to pay for edible insects as food in Kenya: the case of white winged termites
Authors: Mohammed H. Alemu, Søren B. Olsen, Suzanne E. Vedel, Kennedy O. Pambo, Victor O. Owino
JEL-classification: D12, Q11, Q13, Q18, Q54, Q56
Published: September 2015
See the full series IFRO Working Paper here: www.ifro.ku.dk/english/publications/foi_series/working_papers/
Department of Food and Resource Economics (IFRO) University of Copenhagen Rolighedsvej 25 DK 1958 Frederiksberg DENMARK www.ifro.ku.dk/english/
1
Consumer acceptance and willingness to pay for edible insects as food in Kenya: the case of white winged termites Mohammed H. Alemua∗, Søren B. Olsena, Suzanne E. Vedela, Kennedy O. Pambob, Victor O. Owinoc a Department of Food and Resource Economics, University of Copenhagen, Rolighedsvej 25, 1958, Frederiksberg C Denmark b Department of Agricultural and Resource Economics, Jomo Kenyatta University of Agriculture and Technology, P.O.BOX 62000 – 00200, Juja, Kenya c International Atomic Energy Agency, P.O.BOX 100, 1400, Vienna, Austria
Abstract
Edible insects are receiving substantial attention because of their potential as a significant future
food source of high nutritional value and with important environmental benefits. As a result, there is
a focus on the supply side to establish and optimize the insect production sector and develop the
value chain. However, as the ultimate success of a product development depends on consumers'
product judgement and acceptance, acquiring information about potential demand is of paramount
importance for policy advice. In this paper, we aim to give a first insight into the potential demand
for termite-based food products (TBFPs) in Kenya. We assess the demand in terms of consumer
preferences and willingness to pay using a stated choice experiment method. A novel feature of this
paper is that it focuses on how the termites should be presented and introduced, either as whole or
processed, in a typical daily meal in order to increase consumer acceptance. Results from the latent
class model reveal that consumers prefer and are willing to pay more for TBFPs with high
nutritional value and when they are recommended by officials. In addition, results show that high to
a very high food safety control levels of the TBFPs are valued positively by most consumers.
Keywords: Stated Choice Experiment; Edible insects; Latent class model; Termite-based food
products; WTP
Introduction
The world, and in particular developing countries and emerging economies, is witnessing a
rapidly increasing demand for food, especially in terms of animal protein. With the world
∗ Corresponding author. Tel.: +4535331492. Email address: [email protected]
2
population projected to reach 9 billion people by the year 2050 the demand for protein, and in
particular animal protein, is expected to increase dramatically. There is no doubt that the world has
to provide food for its inhabitants, but how to meet the increasing demand in the future remains an
open and critical question. Furthermore, despite access to animal protein in many developing
countries being somewhat limited due to increasing prices and climate change related reduced
production of livestock, the continued general rise in income and living standards in some
developing countries and emerging economies is expected to lead to profound increases in the
demand for animal protein. Animal protein is however not a very sustainable source of protein
(Steinfeld et al. 2006; FAO, 2009; Aiking, 2011)
Recently, policy makers, scientists and public organizations including the United Nations
(UN) have called for diversification of the sources of food in the face of climate change and
increasing population. In this regard, edible insects may provide a valuable future source of food
(FAO, 2013). Insects contain nutrients such as protein, minerals and vitamins which are essential
for human consumption (DeFoliart, 1989; Bukkens, 1997; Ramos-Elorduy, 1997; Paoletti et al.
2003). Furthermore, due to their high food conversion levels, rearing of edible insects for human
consumption will emit much less greenhouse gasses (GHG) than compared to obtaining the
equivalent amount of protein from conventional livestock production (Oonincx et al. 2010; and
Oonincx and Boer, 2012). Today, livestock production is responsible for about 18% of the total
GHG emissions to the environment (Steinfeld et al. 2006), and if the increased demand for protein
in the future is to be met by animal protein, this environmental problem will only increase. If
instead a small- as well as large-scale edible insect production sector can be established, it might
cover the increasing demand for food while at the same time avoiding increasing GHG emissions.
Edible insects are used as food in some cultures mainly in developing countries (Bukkens,
1997; Ramos-Elorduy, 1997); however, they are mainly collected from harvesting in the wild
(Ramos-Elorduy, 1997; van Huis, 2013). For instance, in Kenya insect species such as Lake Flies,
Agolo termites, Black ants, and Grasshoppers have traditionally been consumed in some local areas
(Christensen et al. 2006; Ayieko and Oriaro, 2008; Ayieko et al. 2010, 2012; Kinyuru et al. 2010).
However, little is known about the role of insects in a particular economy, especially concerning
their contribution to food security (van Huis, 2003). In line with this, the socio-economic aspect of
embracing insects as food is a somewhat unexplored area of research. As the ultimate goal of
product development depends on consumers' judgment (Brown and Eisenhardt, 1995; van Kleef et
al. 2005; van Trijp and Fischer, 2011), information on the potential demand for edible insects as
3
food is of paramount importance because decision making without such information can be sub-
optimal. Essentially, developing a production of edible insects will be pointless if the consumers do
not want to eat the insects. In this regard, while assessing the potential of edible insects as food and
feed, van Huis (2013) and Rumpold and Schlüter (2013) emphasized the necessity of consumer
acceptance studies regarding insects as food. This may further facilitate the assessment of the
prospects and the challenges in relation to mass-rearing, quality control and trade, as well as
political and economic incentives for the production of edible insects.
While several studies have investigated various aspects of utilizing insects for food (see FAO,
2013), very few studies (Hartmann et al. 2015; Tan et al. 2015, Verbeke, 2015) focusing on the
acceptance of insects as food have emerged. However, these studies focused mainly on willingness
to eat as well as product liking rather than on the economic aspects, i.e. consumer preferences and
willingness to pay (WTP) for edible insects. Focusing specifically on these aspects, this paper
strives to give a first insight into the potential demand for TBFPs using individual level data in
Kenya. To investigate how the termites should be presented and introduced in a typical daily meal,
two products, i.e. whole and processed termites, are considered in this study. Since real market data
for insect-based products are not available, we use a stated choice experiment (SCE) method based
on hypothetical markets. The SCE is widely applied in consumer research for assessment of
consumer preferences and WTP for food attributes (e.g. Hu et al. 2004; Carlsson et al. 2007;
Kikulwe et al. 2011; Ortega et al. 2011).
The remainder of the paper is structured as follows. The next section presents the theoretical
framework and econometric specification followed by the section describing the data. The final two
sections present the results, and the discussion and conclusion, respectively.
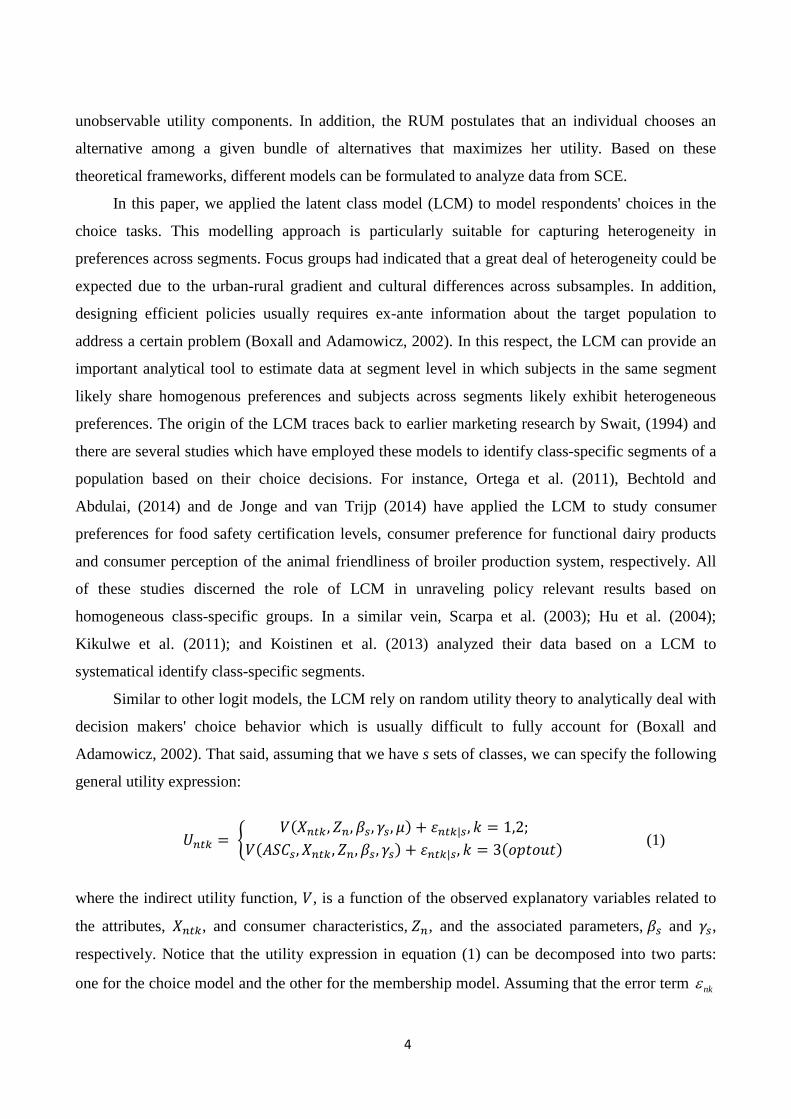
Theoretical framework and econometric specification
The SCE is used to an increasing extent to measure demand for goods and services in various
fields including marketing and food preferences (see e.g. Ewing and Sarigöllü, 2000; Jaeger and
Rose, 2008; Kikulwe et al. 2011). They are originally developed by Louviere and Hensher (1983)
and Louviere and Woodworth (1983) to forecast consumer demand in marketing research. SCE is
highly suited to measure and forecast demand for products which are absent in the market. In the
SCE setting, goods and services are described in terms of their attribute characteristics (Lancaster
1996). Furthermore, SCE is based on random utility theory (RUM) (McFadden, 1986) which
provides a theoretical framework for modelling choices based on observable as well as
4
unobservable utility components. In addition, the RUM postulates that an individual chooses an
alternative among a given bundle of alternatives that maximizes her utility. Based on these
theoretical frameworks, different models can be formulated to analyze data from SCE.
In this paper, we applied the latent class model (LCM) to model respondents' choices in the
choice tasks. This modelling approach is particularly suitable for capturing heterogeneity in
preferences across segments. Focus groups had indicated that a great deal of heterogeneity could be
expected due to the urban-rural gradient and cultural differences across subsamples. In addition,
designing efficient policies usually requires ex-ante information about the target population to
address a certain problem (Boxall and Adamowicz, 2002). In this respect, the LCM can provide an
important analytical tool to estimate data at segment level in which subjects in the same segment
likely share homogenous preferences and subjects across segments likely exhibit heterogeneous
preferences. The origin of the LCM traces back to earlier marketing research by Swait, (1994) and
there are several studies which have employed these models to identify class-specific segments of a
population based on their choice decisions. For instance, Ortega et al. (2011), Bechtold and
Abdulai, (2014) and de Jonge and van Trijp (2014) have applied the LCM to study consumer
preferences for food safety certification levels, consumer preference for functional dairy products
and consumer perception of the animal friendliness of broiler production system, respectively. All
of these studies discerned the role of LCM in unraveling policy relevant results based on
homogeneous class-specific groups. In a similar vein, Scarpa et al. (2003); Hu et al. (2004);
Kikulwe et al. (2011); and Koistinen et al. (2013) analyzed their data based on a LCM to
systematical identify class-specific segments.
Similar to other logit models, the LCM rely on random utility theory to analytically deal with
decision makers' choice behavior which is usually difficult to fully account for (Boxall and
Adamowicz, 2002). That said, assuming that we have s sets of classes, we can specify the following
general utility expression:
𝑈𝑈𝑛𝑛𝑛𝑛𝑛𝑛 = �𝑉𝑉(𝑋𝑋𝑛𝑛𝑛𝑛𝑛𝑛,𝑍𝑍𝑛𝑛,𝛽𝛽𝑠𝑠, 𝛾𝛾𝑠𝑠, 𝜇𝜇) + 𝜀𝜀𝑛𝑛𝑛𝑛𝑛𝑛|𝑠𝑠,𝑘𝑘 = 1,2;
𝑉𝑉(𝐴𝐴𝐴𝐴𝐴𝐴𝑠𝑠,𝑋𝑋𝑛𝑛𝑛𝑛𝑛𝑛,𝑍𝑍𝑛𝑛,𝛽𝛽𝑠𝑠, 𝛾𝛾𝑠𝑠) + 𝜀𝜀𝑛𝑛𝑛𝑛𝑛𝑛|𝑠𝑠, 𝑘𝑘 = 3(𝑜𝑜𝑜𝑜𝑜𝑜𝑜𝑜𝑜𝑜𝑜𝑜) (1)
where the indirect utility function, 𝑉𝑉, is a function of the observed explanatory variables related to
the attributes, 𝑋𝑋𝑛𝑛𝑛𝑛𝑛𝑛, and consumer characteristics, 𝑍𝑍𝑛𝑛, and the associated parameters, 𝛽𝛽𝑠𝑠 and 𝛾𝛾𝑠𝑠,
respectively. Notice that the utility expression in equation (1) can be decomposed into two parts:
one for the choice model and the other for the membership model. Assuming that the error term nkε

5
is Gumbel-distributed, the probability that an individual n chooses alternative k among R given
alternatives in choice situation t in class s can be represented as:
𝑃𝑃𝑛𝑛𝑛𝑛(𝑘𝑘) = 𝑒𝑒𝜇𝜇𝛽𝛽𝑠𝑠′𝑥𝑥𝑛𝑛𝑛𝑛𝑛𝑛
∑ 𝑒𝑒𝜇𝜇𝛽𝛽𝑠𝑠′𝑥𝑥𝑛𝑛𝑛𝑛𝑛𝑛𝐽𝐽
𝑛𝑛
(2)
where 𝛽𝛽′ is the vector of all betas estimated for the attributes, 𝜇𝜇 is the scale parameter which is
normalized to unity, and the alternative specific constant (ASC), which is specified following
Scarpa et al. (2005), and the error term are left out for ease of simplicity. The latent grouping of
subjects into different classes is a function of their characteristics such as socio-economic variables.
As a result, the probability that an individual belongs to class s can be given by:
𝑃𝑃𝑛𝑛𝑠𝑠 = 𝑒𝑒𝛾𝛾𝑠𝑠′𝑍𝑍𝑛𝑛
∑ 𝑒𝑒𝛾𝛾𝑠𝑠′𝑍𝑍𝑛𝑛𝑆𝑆𝑠𝑠=1
(3)
where 𝛾𝛾𝑠𝑠′ denotes the class-specific vector of estimated parameters, and 𝑍𝑍𝑛𝑛 represents the individual
characteristics. For the sake of model identification, the estimated parameters of the last class S are
usually normalized to zero and results from the other classes are compared relative to this class
(Boxall and Adamowicz, 2002). Combining equations (2) and (3) makes it possible to
simultaneously estimate both 𝛽𝛽𝑠𝑠 and 𝛾𝛾𝑠𝑠. Following Boxall and Adamowicz, (2002), the probability
becomes:
𝑃𝑃𝑛𝑛(𝑘𝑘) = ∑ � 𝑒𝑒𝛾𝛾𝑠𝑠′𝑍𝑍𝑛𝑛
∑ 𝑒𝑒𝛾𝛾𝑠𝑠′𝑍𝑍𝑛𝑛𝑆𝑆𝑠𝑠=1
∏ 𝑒𝑒𝛽𝛽𝑠𝑠′𝑥𝑥𝑛𝑛𝑛𝑛𝑛𝑛
∑ 𝑒𝑒𝛽𝛽𝑠𝑠′𝑥𝑥𝑛𝑛𝑛𝑛𝑛𝑛𝐽𝐽
𝑛𝑛
𝑇𝑇𝑛𝑛=1 �𝑆𝑆
𝑠𝑠=1 (4)
Equation (4) can be estimated using the maximum likelihood framework. And once parameters are
obtained, class-specific WTP values can be estimated using the equation:
𝑊𝑊𝑊𝑊𝑃𝑃 = 𝛽𝛽𝑠𝑠(𝑛𝑛𝑛𝑛𝑛𝑛 𝑝𝑝𝑝𝑝𝑝𝑝𝑝𝑝𝑒𝑒 𝑎𝑎𝑛𝑛𝑛𝑛𝑝𝑝𝑝𝑝𝑎𝑎𝑎𝑎𝑛𝑛𝑒𝑒)
𝛽𝛽𝑠𝑠(𝑝𝑝𝑝𝑝𝑝𝑝𝑝𝑝𝑒𝑒 𝑎𝑎𝑛𝑛𝑛𝑛𝑝𝑝𝑝𝑝𝑎𝑎𝑎𝑎𝑛𝑛𝑒𝑒) (5)
We refer the reader to Boxall and Adamowicz (2002); and Greene and Hensher (2003) for further
details regarding the maximum likelihood expression of the LCM models.
6
Data
Study Sites and Sampling design
Kenya is host to more than 42 distinct ethnic groups, and an incredibly varied demographical
distribution. No ethnic group constitutes a majority, but the five largest – Kikuyu, Luo, Luhya,
Kamba and Kalenjin – accounts for 70% of the population (OBG, 2014). To capture this diversity,
five counties, Kisumu, Siaya, Kakamega, Machakos and Nairobi were purposively selected for this
study. Entomophagy has traditionally been practiced by the communities in the western regions of
the country. In our sample, the counties of Kisumu, Siaya and Kakamega, with a total population of
2.5 million people (2009 census) represented this region. The counties of Machakos and Nairobi
represent eastern and central regions respectively, where consumption of edible insects is not
popular. Given that Nairobi and Kisumu counties host two out of the three cities in Kenya, the
choice of these five counties induces variation in the data.
Nairobi being the capital city is the most populated county in Kenya. According to the 2009
national population census (KNBS, 2009), the population of Nairobi County was estimated at 3.1
million people and possibly, has the highest number of consumers in the country. Furthermore, the
diversity in terms of ethnicity, demographic, cultural, and socioeconomic characteristics makes
Nairobi a representative county, of the whole country.
The target population included households residing in the five counties. Since internet
coverage was considered insufficient for an online survey, and a suitable sampling frame for a
phone survey was not available, the survey was conducted using face-to-face interviews. This
method of data collection was preferred because the respondents' concerns and questions could be
addressed at hand by the interviewers and further clarifications given instantly. It also enabled the
use of visual aids. Furthermore, this method was also instrumental in ensuring that only members of
the household who were responsible for food shopping (responsible for dietary decisions) were
asked to answer the questionnaire.
The survey was conducted between December 2014 and January 2015. The sample was
drawn using a multistage sampling procedure and stratified into rural and urban consumers, with
Nairobi County and parts of Kisumu and Machakos counties representing urban areas and the
remainder representing rural areas. A multistage sampling method was considered appropriate for
this study because a sampling frame with a complete list of all households in the study areas was
not available. The five counties were divided into smaller administrative units called sub-counties
7
(constituencies). To ensure greater sample representation within the selected counties, two sub-
counties were considered, except in Nairobi County where five sub-counties were involved. Within
each sub-county, a random sample of locations was drawn, from which a number of smaller
administrative units (sub-location) were drawn with regard to the distribution of consumers
(population) within each sub-county. A total of 28 locations were selected, with Nairobi County,
due to its high population and ethnic diversity, taking up larger share of selected locations at 7.
Within the sub-locations, smaller units (Villages in Kakamega, Machakos & Siaya counties
and Estates in Nairobi and Kisumu counties) were randomly selected, which formed the primary
sampling units. The secondary sampling units were the households, from which respondents were
drawn using a systematic random sampling criterion. More importantly, to select the households, a
line-sampling method was used; that is, a “line” was drawn on the village map and every 3rd
household along the “line” with a random start (either left or right) was interviewed. Where the
targeted respondent was unavailable or uninterested in participating, the next randomly selected
household on the list was chosen to ensure that the desired sample size was realized. Employing a
sampling proportionate to size criterion, a total sample size of 611 consumers was realized (140 in
Nairobi County, 134 in Kakamega County, 122 in Kisumu County, 110 in Siaya County and 105 in
Machakos County). The overall response rate was high (90%), largely due to the face-to-face nature
of the survey instrument. The data collection was conducted by six skilled interviewers who had
been specifically trained for this survey.
Survey instruments
Different edible insects are traditionally consumed in the western area and Lake Victoria
region of Kenya. These are grasshoppers, termites, black ants, lake flies and crickets (Christensen et
al. 2006; Ayieko and Oriaro, 2008; Ayieko et al. 2010; Ayieko et al. 2012; Kinyuru et al. 2012). In
this particular study, we chose to focus on termites following a focus group discussion which
indicated that termites were relatively popular among participants, even among those not used to
eating insects. In addition, termites are part of the traditional diet in western and Lake Victoria
region of Kenya (Kinyuru et al. 2013). Moreover, these insects contain protein and other important
nutrients that can help reduce nutritional deficiency (Ayieko et al. 2010; Nyukuri et al. 2014). As a
result, enriching low protein foods such as maize and sorghum with protein using alternative and
acceptable sources can be a crucial step in combating the shortage of protein in the region. This is

8
of particular importance when considering the fact that cereals are the most consumed food items in
eastern and southern African countries (Stevens and Winter-Nelson, 2008).
Insects can be eaten in three different forms; as whole insects, in powder or paste form, and as
protein extract (FAO, 2013). In order to investigate how the termites should be presented and
introduced in a typical daily meal to increase consumer acceptance, we identified two products for
our study and used photo representations to display them to respondents. They were: 1) whole
termites fried and salted (WTFS) and 2) termite powder (TP). The second product type is not
popular as residents in western Kenya (mainly in rural areas) traditionally eat whole termites after
boiling or sun-drying or roasting them. We informed respondents that the TP is mixed into Ugali
and the WTFS served on the side of it. Ugali (stiff porridge) is the staple daily food in Kenya and is
made from either Maize or Sorghum.
Next we identified relevant attributes of these products to be included in the SCE. Attributes
were identified following an extensive literature review and focus group and expert discussions.
Since the survey targeted consumers in both rural and urban areas of Kenya, effort was exerted to
ensure that all the attributes were simple and understandable by all the respondents so that they
could make informed choices. Originally, we identified five non-price quality attributes: nutritional
value, food safety control, shopping location, feedstock, and recommendation. However, results
from the focus group discussion indicated that the feedstock attribute appeared to be irrelevant for
this particular SCE study, and it was consequently dropped. Table 1 below summarizes the
description of attributes and their respective levels.
The recommendation and shopping location attributes were included to acknowledge that
consumer preference decisions can be affected by contextual factors in addition to product
attributes. As mentioned in Grisolia et al. (2012), the recommendation attribute is mostly used in
theater, cinema and hotel review services. While contextual factors can influence the choice and
preference of food items, they have been overlooked in most food preference studies (Stroebele et
al. 2004; and Jaeger and Rose, 2008). The attributes nutritional value, food safety control and
shopping location have three levels where as the recommendation attribute has four levels. To
enable calculation of marginal WTP estimates for the quality attributes, we included a cost attribute
in the choice design, which represents the cost of purchasing 200g of WTFS or 200g of TP. A pilot
survey was conducted to validate all the attributes and their levels.

9
Table 1 Attributes and their levels1 Attribute definition Attribute name Attribute levels Nutritional value of the TBFPs may differ depending on the production method (e.g. the feed quality they are fed on); processing methods (e.g. drying, boiling, and frying) and storage methods (e.g. whether stored appropriately in cool and dry conditions).
Nutritional value (NV) (effects coded)
Low (base) Average Very good
Food safety control indicates to what extent the TBFPs are controlled for their safety. Standard represents the traditional way of preparing termites for food, i.e. drying, boiling, frying or roasting. High represents the termites are fed based on a controlled feed quality and living conditions. Proper processing and handling strategies are applied to prevent hygienic and re-contamination problems during food preparation processes. The products are packed. Very high denotes that in addition to high food safety control, the products are inspected for specific food safety issues by the Kenyan bureau of standards to ensure that they are safe.
Food safety control (FSC) (effects coded)
Standard (base) High Very high
Shopping location indicates whether the TBFPs are available in local or street markets, kiosks, and big supermarkets.
Shopping location (SL) (effects coded)
local market (base) Kiosks Supermarkets
Recommendation represents whether people get recommendations from various sources to consume foods from TBFPs.
Recommendation (RC) (effects coded)
None (base) Friends and relatives (peers) Media Official recommendation
Price is the cost of 200g of the TBFPs in Kenyan Shillings (KShs)2
Price (PRICE)
50,60,70,85,105,120
Experimental design and the questionnaire
The paper adopts the SCE method to measure the preferences of consumers for TBFPs. We
used the Ngene software (ChoiceMetrics, 2012) to produce the experimental design. Using priors
from a pilot study, a D-efficient fractional factorial design with 36 choice sets were generated.
However, as 36 choice tasks were considered too demanding for a respondent to process, the
choices were blocked into three so that each respondent faced 12 choice tasks. Half of the choice
tasks concerned WTFS whereas the other half represented TP. We randomized the product order so
as to avoid product ordering effects in the SCE. Once the SCE design was produced, a questionnaire
was developed including questions on demographic and socio-economic information, familiarity
and experience with edible insect eating, attitudinal questions related to using edible insect as food,
and food neophobia.
1 Effects coding has been used in the choice experiment design to avoid the confounding effect between the base
level of the different attributes and the 'none of these' option. 2 1 US Dollar was around 90.50 KShs by the time of the field survey

10
Table 2: Example of the choice sets Option 1 Option 2 Nutritional value Low Average
None of these
Food safety control High Standard Recommendation Media Official recommendation Shopping location Kiosks Big supermarkets Price 70 85 Which option do you prefer? The main body of the questionnaire presented the scenario for the SCE, the description of attributes
used in the experiment and some background information as to why edible insects can be important
for consumption. Then, the sequence of choice sets was presented. The final design of the SCE and
the questionnaire was tested and validated using a sample of 43 respondents.
11
Results
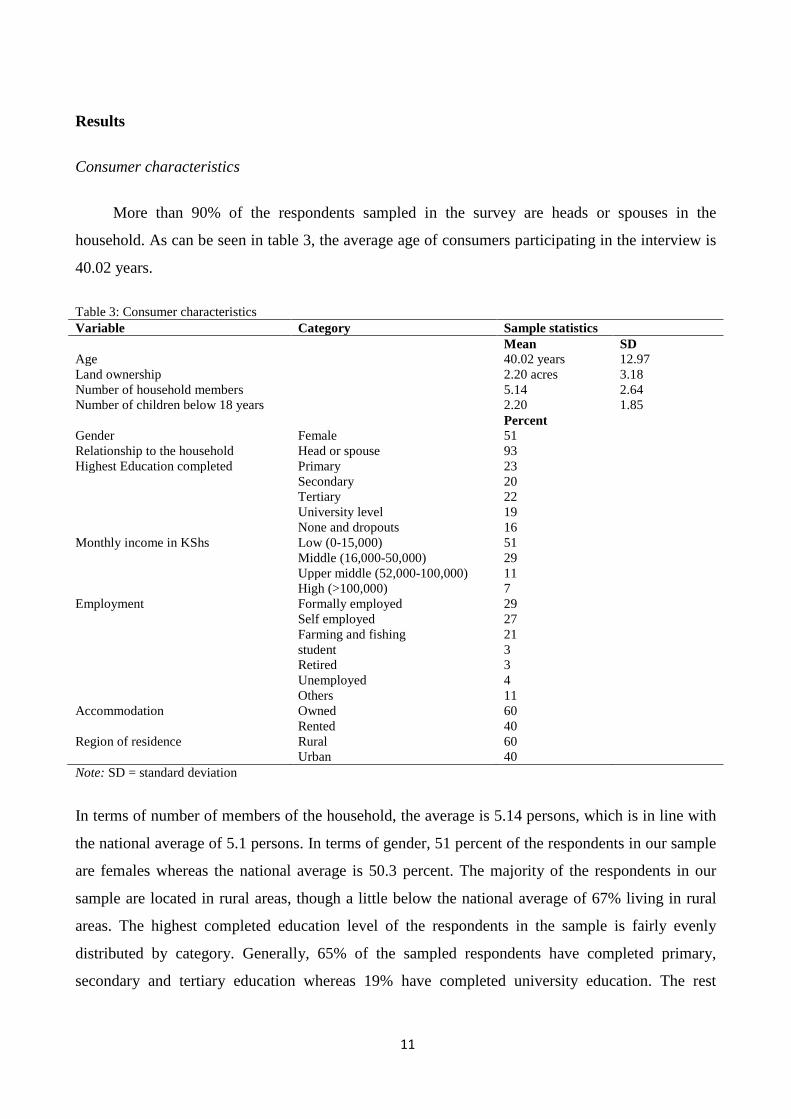
Consumer characteristics
More than 90% of the respondents sampled in the survey are heads or spouses in the
household. As can be seen in table 3, the average age of consumers participating in the interview is
40.02 years.
Table 3: Consumer characteristics Variable Category Sample statistics Mean SD Age 40.02 years 12.97 Land ownership 2.20 acres 3.18 Number of household members 5.14 2.64 Number of children below 18 years 2.20 1.85 Percent Gender Female 51 Relationship to the household Head or spouse 93 Highest Education completed Primary 23 Secondary 20 Tertiary 22 University level 19 None and dropouts 16 Monthly income in KShs Low (0-15,000) 51 Middle (16,000-50,000) 29 Upper middle (52,000-100,000) 11 High (>100,000) 7 Employment Formally employed 29 Self employed 27 Farming and fishing 21 student 3 Retired 3 Unemployed 4 Others 11 Accommodation Owned 60 Rented 40 Region of residence Rural 60 Urban 40 Note: SD = standard deviation
In terms of number of members of the household, the average is 5.14 persons, which is in line with
the national average of 5.1 persons. In terms of gender, 51 percent of the respondents in our sample
are females whereas the national average is 50.3 percent. The majority of the respondents in our
sample are located in rural areas, though a little below the national average of 67% living in rural
areas. The highest completed education level of the respondents in the sample is fairly evenly
distributed by category. Generally, 65% of the sampled respondents have completed primary,
secondary and tertiary education whereas 19% have completed university education. The rest
12
includes those who either do not have any education or who dropped out from primary and
secondary education. We classified our sample into four categories using income categories
following Kimenju and Groote (2008). Government and private sector employment are collapsed to
one variable as formally employed.
Latent class model results
The LCM enables incorporating socio-economic variables as well as attitudinal statements in
the membership function for specific classes. Table 4 presents the different explanatory variables
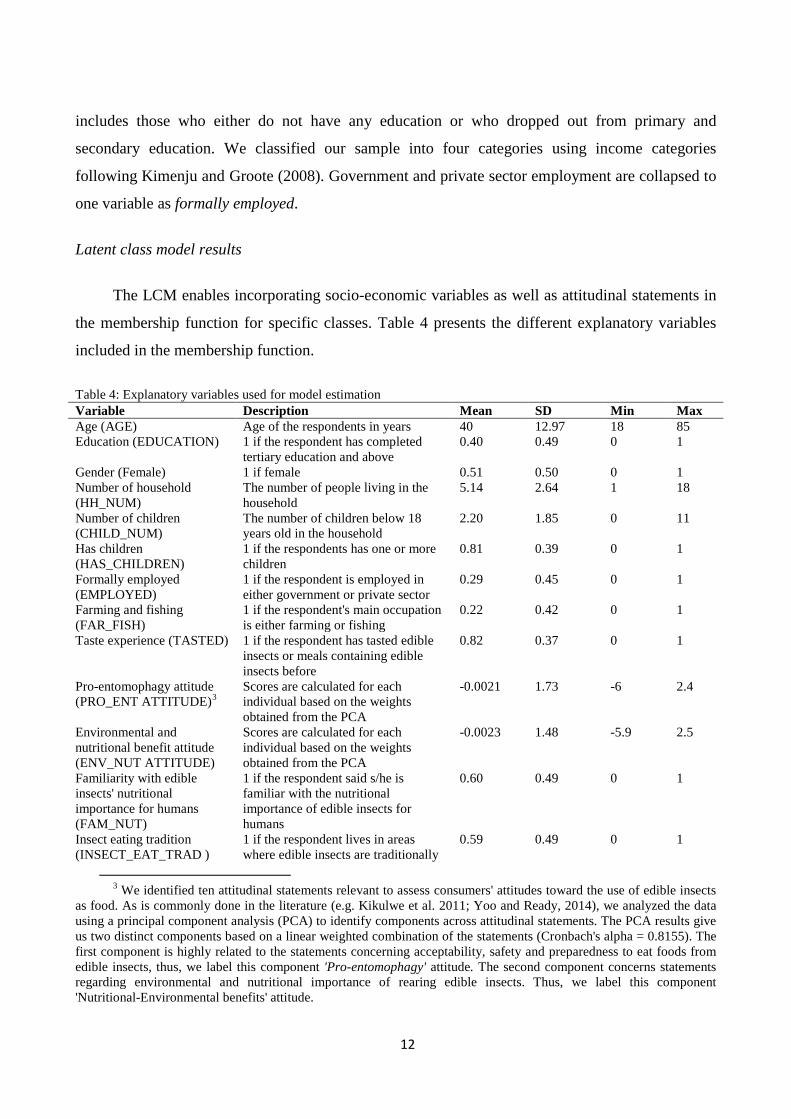
included in the membership function.
Table 4: Explanatory variables used for model estimation Variable Description Mean SD Min Max Age (AGE) Age of the respondents in years 40 12.97 18 85 Education (EDUCATION) 1 if the respondent has completed
tertiary education and above 0.40 0.49 0 1
Gender (Female) 1 if female 0.51 0.50 0 1 Number of household (HH_NUM)
The number of people living in the household
5.14 2.64 1 18
Number of children (CHILD_NUM)
The number of children below 18 years old in the household
2.20 1.85 0 11
Has children (HAS_CHILDREN)
1 if the respondents has one or more children
0.81 0.39 0 1
Formally employed (EMPLOYED)
1 if the respondent is employed in either government or private sector
0.29 0.45 0 1
Farming and fishing (FAR_FISH)
1 if the respondent's main occupation is either farming or fishing
0.22 0.42 0 1
Taste experience (TASTED) 1 if the respondent has tasted edible insects or meals containing edible insects before
0.82 0.37 0 1
Pro-entomophagy attitude (PRO_ENT ATTITUDE)3
Scores are calculated for each individual based on the weights obtained from the PCA
-0.0021 1.73 -6 2.4
Environmental and nutritional benefit attitude (ENV_NUT ATTITUDE)
Scores are calculated for each individual based on the weights obtained from the PCA
-0.0023 1.48 -5.9 2.5
Familiarity with edible insects' nutritional importance for humans (FAM_NUT)
1 if the respondent said s/he is familiar with the nutritional importance of edible insects for humans
0.60 0.49 0 1
Insect eating tradition (INSECT_EAT_TRAD )
1 if the respondent lives in areas where edible insects are traditionally
0.59 0.49 0 1
3 We identified ten attitudinal statements relevant to assess consumers' attitudes toward the use of edible insects
as food. As is commonly done in the literature (e.g. Kikulwe et al. 2011; Yoo and Ready, 2014), we analyzed the data using a principal component analysis (PCA) to identify components across attitudinal statements. The PCA results give us two distinct components based on a linear weighted combination of the statements (Cronbach's alpha = 0.8155). The first component is highly related to the statements concerning acceptability, safety and preparedness to eat foods from edible insects, thus, we label this component 'Pro-entomophagy' attitude. The second component concerns statements regarding environmental and nutritional importance of rearing edible insects. Thus, we label this component 'Nutritional-Environmental benefits' attitude.

13
consumed Food neophobia Scale (FNS)4
Measures the food neophobic trait of individuals
20.78 6.36 6 30
The application of LCM entails the determination of the optimal number of classes. This is
commonly done by relying on minimizing information criteria such as the Akaike Information
Criteria (AIC) and Bayesian Information Criteria (BIC) (e.g. Andrew and Currim, 2003; Scarpa and
Thiene, 2005). However, as suggested by Swait (1994); Scarpa and Thiene (2005, 2011); Ruto et al.
(2008); and Glenk et al. (2012), relying solely on these criteria can lead to very high number of
classes and possibly misleading preference and welfare estimates. Consequently, the selection of the
appropriate number of classes must also take the significance of parameters into account (Scarpa
and Thiene, 2005). In addition, model interpretability and the agreement of results with the accepted
theoretical foundations should also be considered (Ruto et al. 2008). For these reasons, we present
results from a specification of the LCM with four classes even if both the BIC and CAIC reached
their minimum when specifying five classes, as shown in table 5. Statistical Innovation's Latent
Gold Choice 5.0 (Vermunt and Magidson, 2014) was used to estimate the LCM.
Table 5: Number of classes and goodness-of-fit measures Number of classes Number of
parameters (npar) Log-likelihood (LL)
BIC (LL) AIC (LL) CAIC (LL)
1 11 -6632.195 13334.497 13286.391 13345.497 2 35 -5547.789 11318.645 11165.579 11353.645 3 59 -5334.458 11044.942 10786.916 10103.942 4 83 -5152.992 10834.969 10471.983 10917.969 5 107 -5000.619 10683.183 10215.238 10790.183 6 131 -4932.887 10771.638 10126.680 10830.585 Number of observations (N) = 7032, BIC(LL) = −2 LL+(logN) npar, AIC(LL) = −2 LL + 2 npar, CAIC(LL) = −2 LL+[(logN) + 1] npar
We estimated three different models. Model 1 represents the full model wherein data from
both products, i.e. WTFS and TP, are pooled and then estimated together. Model 2 uses data from
the WTFS whereas model 3 utilizes data from the TP meal. We have tested several models with
different combinations of membership variables5 and the best models with more significant
parameters that offer meaningful interpretations are presented.
4Respondents were asked to what extent they agree or disagree to six food neophobia statements. The food
neophobia scale (FNS), which was originally developed by Pilner and Hobden, (1992), contains 10 items; however, we selected six items following Ritchey et al. (2003) to include only items that were deemed culture suitable for Kenyan people. The FNS score was calculated by summing individual scores for each item. In line with Pilner and Hobden (1992), three positively worded items were reversed so that high scores reflect higher food neophobic behavior.
5 In line with Kikulwe et al. (2011), we used the variance inflation factor (VIF) to test for possible multicolinearity between variables used in the membership model by regressing each variable on the rest variables, i.e. using each variable as dependent and the rest as independent variables. We found no problem of multicolinearity.

14
All the LCM results show that the estimated price parameters are significant and negative in
all classes, which is in agreement with our expectation. In addition, the ASC parameter, which was
specified to represent the 'none of these' option is negatively significant in consistent with our prior
anticipation that consumers would favor either option 1 or option 2 over the 'none of these' option.
The LCM model enabled us to identify a small group of consumers (4-10% depending on the type
of the product) who are not sensitive to all the attributes in the SCE. Therefore, in what follows, we
disregard the interpretation of results on these segments of consumers.
The results in table 6 reveal that consumers behave differently when making their decision
concerning the choice of TBFPs. This justifies the application of the LC models to trace
heterogeneity in preferences. Table 6: Model 1 - Full model (standard errors in parenthesis) Class 1 Class 2 Class 3 Class 4
Price conscious consumers
Non-insect eating consumers
Pro-nutrition consumers
Random choosers
Choice model ASC (no choice) -5.013 (0.249)*** -0.227 (0.138)* -4.519 (0.514)*** 3.424 (5.982) NV_High 0.146 (0.031)*** 0.341 (0.056)*** 1.862 (0.169)*** 2.095 (2.180) NV_Average 0.013 (0.029) 0.113 (0.055)** 0.818 (0.121)*** -1.537 (2.958) FSC_Very_high 0.176 (0.029)*** -0.128 (0.058)** 0.565 (0.111)*** 1.021 (2.479) FSC_High -0.006 (0.029) 0.111 (0.056)** 0.276 (0.104)*** 0.813 (2.124) RC_Official 0.179 (0.028)*** 0.208 (0.069)*** 0.605 (0.178)*** 0.264 (2.859) RC_Media 0.059 (0.036)* -0.047 (0.073) -0.068 (0.131) -0.427 (3.786) RC_Peers 0.028 (0.037) 0.096 (0.071) -0.134 (0.099) 0.531 (2.595) SL_Supermarket -0.108 (0.029)*** 0.109 (0.056)* 0.033 (0.106) -1.682 (3.140) SL_Kiosks 0.040 (0.029) -0.157 (0.058)*** -0.251 (0.110)** 1.055 (1.799) PRICE -0.011 (0.001)*** -0.007 (0.002)*** -0.007 (0.002)*** -0.071 (0.095) Class membership model Constant 8.075 (2.139)*** 6.983 (2.157)*** 6.250 (2.246)*** AGE -0.063 (0.023)*** -0.056 (0.024)** -0.087 (0.025)*** EDUCATION -1.273(0.765)* -0.415 (0.768) -0.686 (0.804) FEMALE -0.559 (0.574) -0.552 (0.578) -1.076 (0.613)* HH_NUM 0.108 (0.118) 0.083 (0.123) 0.222 (0.124)* EMPLOYED -0.587 (0.672) -0.814 (0.667) -0.601 (0.717) TASTED 2.536 (0.745)*** 1.489 (0.751)*** 3.184 (0.870)*** FAM_NUT -0.175 (0.649) -0.073 (0.659) -1.008 (0.694)* FAR_FISH -0.905 (0.794) -1.556 (0.842)* -0.132 (0.837) FNS -0.109 (0.053)** -0.075 (0.053) -0.066 (0.055) PRO_ENT ATTITUDE 0.705 (0.197)*** 0.646 (0.199)*** 0.466 (0.211)** ENVNUT ATTITUDE -0.137 (0.213) -0.122 (0.218) 0.492 (0.241)** INSECT_EAT_TRAD -0.755 (0.704) -1.246 (0.712)* -1.077 (0.743) Class probability 0.562 0.205 0.189 0.043 Log-likelihood -5152.992 Number of observation 7032 Note: '*' denotes statistical significance at 10% level, '**' denotes statistical significance at 5% level, and '***' denotes statistical significance at 1% level. The first class (56%) accommodates consumers who are less educated and less food neophobic.
They are labeled as price conscious consumers as the absolute value of the estimated price

15
coefficient is relatively higher than the other groups. These consumers strongly prefer TBFPs which
are characterized by high nutritional value, recommended by officials and have a very high food
safety control level. However, their preference for supermarkets as shopping locations is negative.
Consumers in the second class (21%) are likely from areas of no insect consumption tradition. In
addition, farming and fishing is less likely to be their main occupation since those who are not
associated with entomophagy reside mostly in urban areas. Consistent with this result, the estimated
coefficient for the supermarket shopping location is positively significant as these consumers have
access to supermarkets particularly in Nairobi and Machakos counties. In terms of their utility for
the other attributes, they prefer TBFPs with average to high nutritional value and when
recommended by officials. In the third class (19%) consumers are likely to be males and with a
relatively high number of household members. They put more weight on the nutritional value
attribute levels than any other segments of consumers, and thus, they are labeled as pro-nutrition
consumers. In line with this, the membership probability model shows that these consumers are
strongly associated with pro-entomophagy, and environmental and nutritional benefits attitudes.
Moreover, these consumers strongly prefer TBFPs with high to a very high food safety control
levels, and when recommended by officials.
Table 7 reports results concerning the preferences for WTFS. The first class (48%) assembles
a group of consumers who are likely to have more children. They are less inclined to accept
recommendation from their peers but they would accept it from media and officials. We thus refer
this class as distrust peers. Their preference for the nutritional value of the specific product is
positive; however, they appear to favor local markets over the other shopping locations. Looking at
the results related to the second class (30%) shows that consumers in this class are likely to
originate from areas of insect eating cultures and they have a strong pro-entomophagy attitude.
These consumers prefer kiosks over local markets; thus, we label them as kiosk preferring.
Members in this class prefer TBFPs with moderate nutritional content and high level of food safety
control. Moreover, they tend to follow friends' and relatives' recommendation to consume TBFPs.
The third class (14%) is likely to contain group of respondents who are content with nutritional
value only. They show less sensitivity for food safety and shopping location attributes. One thing to
notice is that the coefficient of the ASC is close to zero, which might elucidate that these consumers
inclined to choose the 'none of these' alternative, which to some extent may explain their
insensitivity to the shopping location and food safety control attributes.
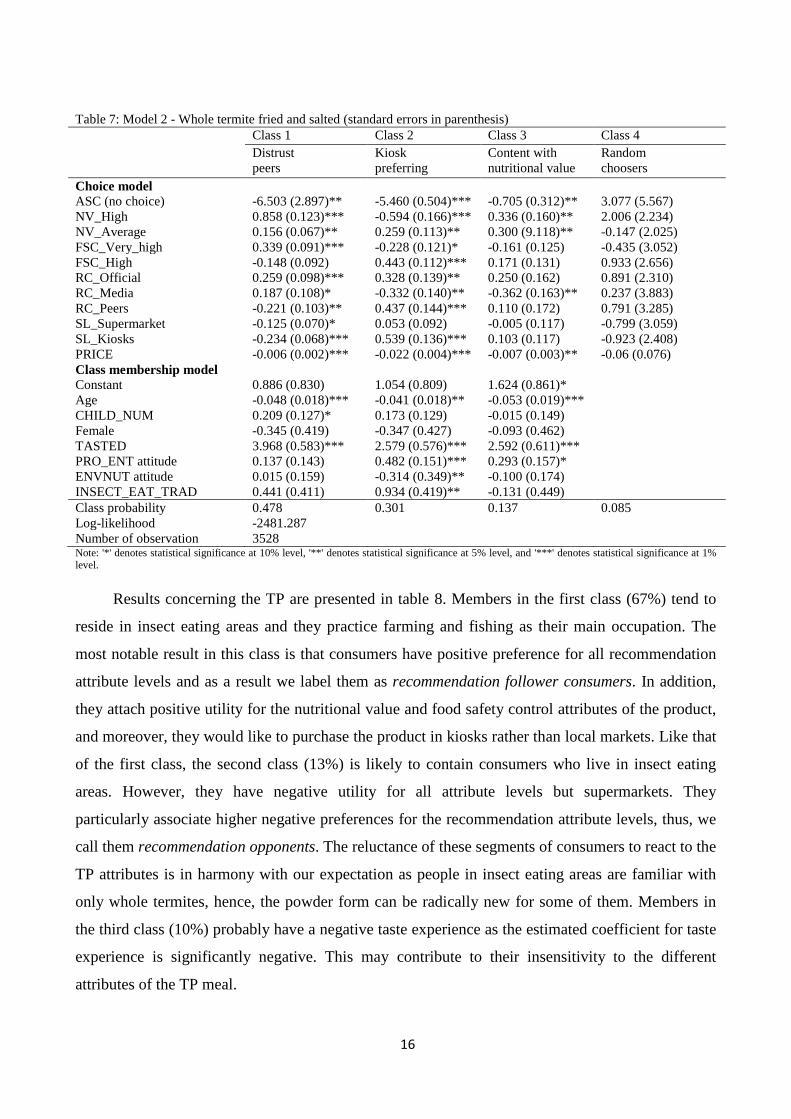
16
Table 7: Model 2 - Whole termite fried and salted (standard errors in parenthesis) Class 1 Class 2 Class 3 Class 4 Distrust
peers Kiosk preferring
Content with nutritional value
Random choosers
Choice model ASC (no choice) -6.503 (2.897)** -5.460 (0.504)*** -0.705 (0.312)** 3.077 (5.567) NV_High 0.858 (0.123)*** -0.594 (0.166)*** 0.336 (0.160)** 2.006 (2.234) NV_Average 0.156 (0.067)** 0.259 (0.113)** 0.300 (9.118)** -0.147 (2.025) FSC_Very_high 0.339 (0.091)*** -0.228 (0.121)* -0.161 (0.125) -0.435 (3.052) FSC_High -0.148 (0.092) 0.443 (0.112)*** 0.171 (0.131) 0.933 (2.656) RC_Official 0.259 (0.098)*** 0.328 (0.139)** 0.250 (0.162) 0.891 (2.310) RC_Media 0.187 (0.108)* -0.332 (0.140)** -0.362 (0.163)** 0.237 (3.883) RC_Peers -0.221 (0.103)** 0.437 (0.144)*** 0.110 (0.172) 0.791 (3.285) SL_Supermarket -0.125 (0.070)* 0.053 (0.092) -0.005 (0.117) -0.799 (3.059) SL_Kiosks -0.234 (0.068)*** 0.539 (0.136)*** 0.103 (0.117) -0.923 (2.408) PRICE -0.006 (0.002)*** -0.022 (0.004)*** -0.007 (0.003)** -0.06 (0.076) Class membership model Constant 0.886 (0.830) 1.054 (0.809) 1.624 (0.861)* Age -0.048 (0.018)*** -0.041 (0.018)** -0.053 (0.019)*** CHILD_NUM 0.209 (0.127)* 0.173 (0.129) -0.015 (0.149) Female -0.345 (0.419) -0.347 (0.427) -0.093 (0.462) TASTED 3.968 (0.583)*** 2.579 (0.576)*** 2.592 (0.611)*** PRO_ENT attitude ENVNUT attitude
0.137 (0.143) 0.015 (0.159)
0.482 (0.151)*** -0.314 (0.349)**
0.293 (0.157)* -0.100 (0.174)
INSECT_EAT_TRAD 0.441 (0.411) 0.934 (0.419)** -0.131 (0.449) Class probability 0.478 0.301 0.137 0.085 Log-likelihood -2481.287 Number of observation 3528 Note: '*' denotes statistical significance at 10% level, '**' denotes statistical significance at 5% level, and '***' denotes statistical significance at 1% level.
Results concerning the TP are presented in table 8. Members in the first class (67%) tend to
reside in insect eating areas and they practice farming and fishing as their main occupation. The
most notable result in this class is that consumers have positive preference for all recommendation
attribute levels and as a result we label them as recommendation follower consumers. In addition,
they attach positive utility for the nutritional value and food safety control attributes of the product,
and moreover, they would like to purchase the product in kiosks rather than local markets. Like that
of the first class, the second class (13%) is likely to contain consumers who live in insect eating
areas. However, they have negative utility for all attribute levels but supermarkets. They
particularly associate higher negative preferences for the recommendation attribute levels, thus, we
call them recommendation opponents. The reluctance of these segments of consumers to react to the
TP attributes is in harmony with our expectation as people in insect eating areas are familiar with
only whole termites, hence, the powder form can be radically new for some of them. Members in
the third class (10%) probably have a negative taste experience as the estimated coefficient for taste
experience is significantly negative. This may contribute to their insensitivity to the different
attributes of the TP meal.
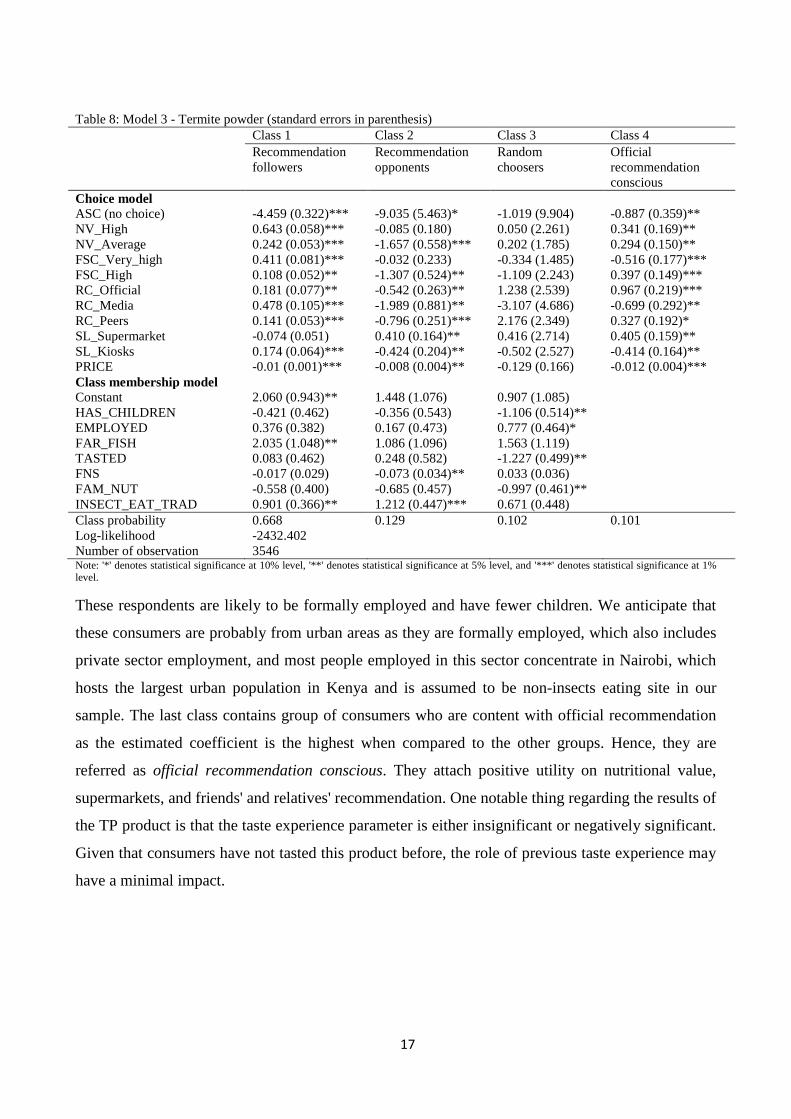
17
Table 8: Model 3 - Termite powder (standard errors in parenthesis) Class 1 Class 2 Class 3 Class 4 Recommendation
followers Recommendation opponents
Random choosers
Official recommendation conscious
Choice model ASC (no choice) -4.459 (0.322)*** -9.035 (5.463)* -1.019 (9.904) -0.887 (0.359)** NV_High 0.643 (0.058)*** -0.085 (0.180) 0.050 (2.261) 0.341 (0.169)** NV_Average 0.242 (0.053)*** -1.657 (0.558)*** 0.202 (1.785) 0.294 (0.150)** FSC_Very_high 0.411 (0.081)*** -0.032 (0.233) -0.334 (1.485) -0.516 (0.177)*** FSC_High 0.108 (0.052)** -1.307 (0.524)** -1.109 (2.243) 0.397 (0.149)*** RC_Official 0.181 (0.077)** -0.542 (0.263)** 1.238 (2.539) 0.967 (0.219)*** RC_Media 0.478 (0.105)*** -1.989 (0.881)** -3.107 (4.686) -0.699 (0.292)** RC_Peers 0.141 (0.053)*** -0.796 (0.251)*** 2.176 (2.349) 0.327 (0.192)* SL_Supermarket -0.074 (0.051) 0.410 (0.164)** 0.416 (2.714) 0.405 (0.159)** SL_Kiosks 0.174 (0.064)*** -0.424 (0.204)** -0.502 (2.527) -0.414 (0.164)** PRICE -0.01 (0.001)*** -0.008 (0.004)** -0.129 (0.166) -0.012 (0.004)*** Class membership model Constant 2.060 (0.943)** 1.448 (1.076) 0.907 (1.085) HAS_CHILDREN -0.421 (0.462) -0.356 (0.543) -1.106 (0.514)** EMPLOYED 0.376 (0.382) 0.167 (0.473) 0.777 (0.464)* FAR_FISH 2.035 (1.048)** 1.086 (1.096) 1.563 (1.119) TASTED 0.083 (0.462) 0.248 (0.582) -1.227 (0.499)** FNS -0.017 (0.029) -0.073 (0.034)** 0.033 (0.036) FAM_NUT -0.558 (0.400) -0.685 (0.457) -0.997 (0.461)** INSECT_EAT_TRAD 0.901 (0.366)** 1.212 (0.447)*** 0.671 (0.448) Class probability 0.668 0.129 0.102 0.101 Log-likelihood -2432.402 Number of observation 3546 Note: '*' denotes statistical significance at 10% level, '**' denotes statistical significance at 5% level, and '***' denotes statistical significance at 1% level. These respondents are likely to be formally employed and have fewer children. We anticipate that
these consumers are probably from urban areas as they are formally employed, which also includes
private sector employment, and most people employed in this sector concentrate in Nairobi, which
hosts the largest urban population in Kenya and is assumed to be non-insects eating site in our
sample. The last class contains group of consumers who are content with official recommendation
as the estimated coefficient is the highest when compared to the other groups. Hence, they are
referred as official recommendation conscious. They attach positive utility on nutritional value,
supermarkets, and friends' and relatives' recommendation. One notable thing regarding the results of
the TP product is that the taste experience parameter is either insignificant or negatively significant.
Given that consumers have not tasted this product before, the role of previous taste experience may
have a minimal impact.
18
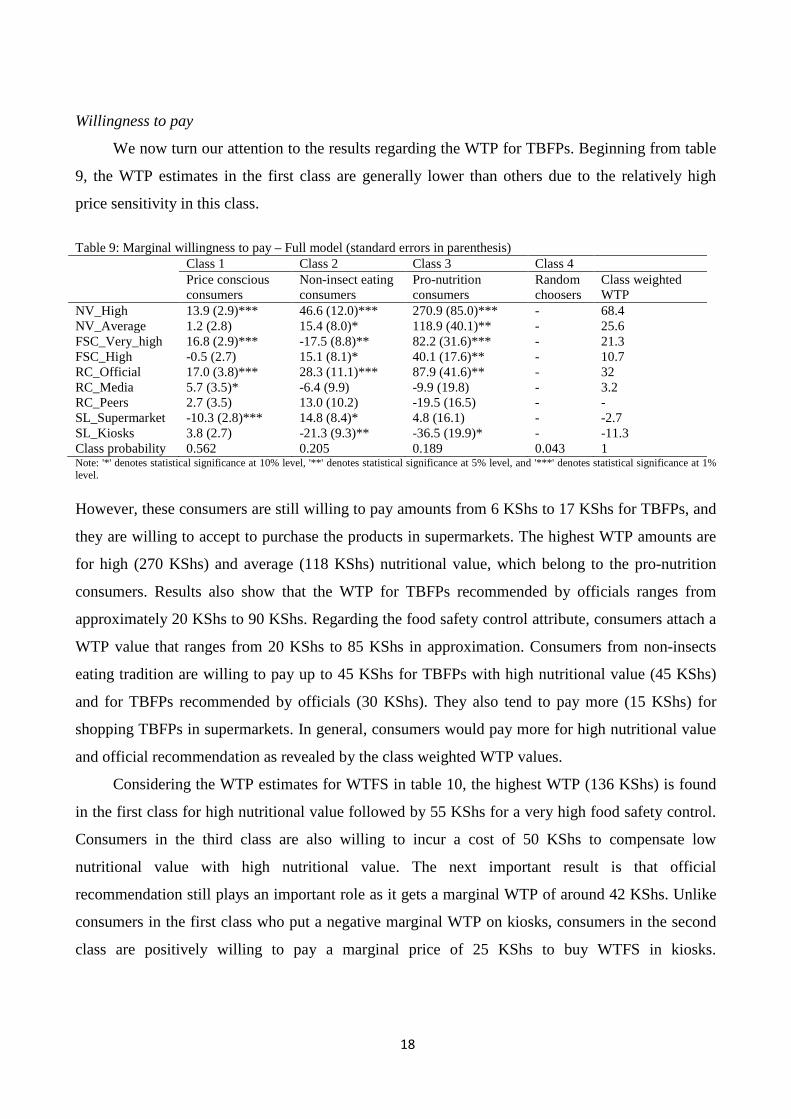
Willingness to pay
We now turn our attention to the results regarding the WTP for TBFPs. Beginning from table
9, the WTP estimates in the first class are generally lower than others due to the relatively high
price sensitivity in this class.
Table 9: Marginal willingness to pay – Full model (standard errors in parenthesis) Class 1 Class 2 Class 3 Class 4 Price conscious
consumers Non-insect eating consumers
Pro-nutrition consumers
Random choosers
Class weighted WTP
NV_High 13.9 (2.9)*** 46.6 (12.0)*** 270.9 (85.0)*** - 68.4 NV_Average 1.2 (2.8) 15.4 (8.0)* 118.9 (40.1)** - 25.6 FSC_Very_high 16.8 (2.9)*** -17.5 (8.8)** 82.2 (31.6)*** - 21.3 FSC_High -0.5 (2.7) 15.1 (8.1)* 40.1 (17.6)** - 10.7 RC_Official 17.0 (3.8)*** 28.3 (11.1)*** 87.9 (41.6)** - 32 RC_Media 5.7 (3.5)* -6.4 (9.9) -9.9 (19.8) - 3.2 RC_Peers 2.7 (3.5) 13.0 (10.2) -19.5 (16.5) - - SL_Supermarket -10.3 (2.8)*** 14.8 (8.4)* 4.8 (16.1) - -2.7 SL_Kiosks 3.8 (2.7) -21.3 (9.3)** -36.5 (19.9)* - -11.3 Class probability 0.562 0.205 0.189 0.043 1 Note: '*' denotes statistical significance at 10% level, '**' denotes statistical significance at 5% level, and '***' denotes statistical significance at 1% level. However, these consumers are still willing to pay amounts from 6 KShs to 17 KShs for TBFPs, and
they are willing to accept to purchase the products in supermarkets. The highest WTP amounts are
for high (270 KShs) and average (118 KShs) nutritional value, which belong to the pro-nutrition
consumers. Results also show that the WTP for TBFPs recommended by officials ranges from
approximately 20 KShs to 90 KShs. Regarding the food safety control attribute, consumers attach a
WTP value that ranges from 20 KShs to 85 KShs in approximation. Consumers from non-insects
eating tradition are willing to pay up to 45 KShs for TBFPs with high nutritional value (45 KShs)
and for TBFPs recommended by officials (30 KShs). They also tend to pay more (15 KShs) for
shopping TBFPs in supermarkets. In general, consumers would pay more for high nutritional value
and official recommendation as revealed by the class weighted WTP values.
Considering the WTP estimates for WTFS in table 10, the highest WTP (136 KShs) is found
in the first class for high nutritional value followed by 55 KShs for a very high food safety control.
Consumers in the third class are also willing to incur a cost of 50 KShs to compensate low
nutritional value with high nutritional value. The next important result is that official
recommendation still plays an important role as it gets a marginal WTP of around 42 KShs. Unlike
consumers in the first class who put a negative marginal WTP on kiosks, consumers in the second
class are positively willing to pay a marginal price of 25 KShs to buy WTFS in kiosks.
19
Furthermore, consumers in this class would pay more (20 KShs) for recommendation from their
peers.
Table 10: Marginal willingness to pay – Whole termite fried and salted (standard errors in parenthesis) Class 1 Class 2 Class 3 Class 4 Distrust peers Kiosk
preferring Content with nutritional value
Random choosers
Class weighted WTP
NV_High 136.4 (37.1)*** -27.7 (6.8)*** 50.0 (25.8)** - 63.8 NV_Average 24.8 (12.2)** 12.1 (4.6)*** 44.8 (28.9) - 15.4 FSC_Very_high 53.8 (21.2)*** -10.6 (5.4)** -24.0 (22.0) - 22.6 FSC_High -23.5 (16.7) 20.7 (5.9)*** 25.5 (23.5) - 6.2 RC_Official 41.2 (19.6)** 15.3 (6.6)** 37.3 (32.8) - 24.3 RC_Media 29.7 (18.2) -15.5 (6.3)** -53.9 (39.8) - -4.7 RC_Peers -35.1 (19.7)* 20.4 (5.9)*** 16.5 (26.6) - -10.7 SL_Supermarket -19.8 (12.4) 2.4 (4.2) 0.7 (17.4) - - SL_Kiosks -37.2 (14.2)*** 25.1 (4.7)*** 15.4 (19.3) - -10.2 Class probability 0.478 0.301 0.137 0.085 Note: '*' denotes statistical significance at 10% level, '**' denotes statistical significance at 5% level, and '***' denotes statistical significance at 1% level.
The final results regarding WTP concerns TP. As shown in table 11, more than 65%
consumers in the first class are willing to pay more for recommendation as opposed to 13% of
consumers in the second class, who are found to have decreasing utility for TP. Groups of
consumers in the fourth class are willing to sacrifice around 80 KShs and 30 KShs for official, and
friends' and relatives' recommendation, respectively. The WTP for the nutritional value goes up to
approximately 65 KShs. And consumers would pay up to 40 KShs for a very high food safety
control of the TP meal.
Table 11: Marginal willingness to pay – Termite powder (standard errors in parenthesis) Class 1 Class 2 Class 3 Class 4 Recommendation
followers Recommendation opponents
Random choosers
Official recommendation conscious
Class weighted WTP
NV_High 63.9 (8.1)*** -10.7 (25.6) - 27.9 (17.9) 42.7 NV_Average 24.1 (5.5)*** -208.2 (93.1)** - 25.2 (13.2)* -8.3 FSC_Very_high 40.9 (7.6)*** -4.0 (29.7) - -42.3 (19.5)** 23.1 FSC_High 10.8 (5.1)** -164.2 (76.1)** - 32.6 (15.1)** -10.7 RC_Official 18.0 (8.3)** -68.0 (40.9)* - 79.3 (28.7)*** 11.2 RC_Media 47.6 (9.9)*** -249.8 (126.2)** - -57.3 (26.9)** -6.2 RC_Peers 14.0 (5.3)*** -99.9 (48.3)** - 28.8 (16.5)* -0.6 SL_Supermarket -7.4 (5.1) 51.5 (28.0)* - 33.2 (17.5)* 10 SL_Kiosks 17.3 (5.9)*** 52.3 (40.7) - -33.9 (18.1)* 8.2 Class probability 0.668 0.129 0.102 0.101 Note: '*' denotes statistical significance at 10% level, '**' denotes statistical significance at 5% level, and '***' denotes statistical significance at 1% level.
20
Discussion and conclusion
The results reveal that most consumers are associated with pro entomophagy attitude and less
food neophobic traits which can be of great significance to facilitate the promotion of edible insects
as food in Kenya. Consumers in the sample, regardless of the tradition of consuming insects,
generally prefer TBFPs with high nutritional value signifying that this attribute is the most
important factor for most consumers. In particular, households with higher number of members and
children value higher nutritional value the highest, suggesting that these consumers may find edible
insects to be a viable source of protein.
Results concerning the two products, i.e. WTFS and TP, do not show stark differences in
preferences and WTP. However, most consumers value all recommendation attribute levels when
they are asked to make purchase decisions regarding the processed termite product. This implies
that when consumers are asked to buy and consume novel products which are processed, they may
tend to reduce the risk of new experience by seeking information, for example, through word of
mouth, from media or from their respective officials. The impact of recommendation on consumers'
decision to purchase products is well covered in the marketing literatures (e.g. Trusov et al. 2009).
When consumers face new products they will have to deal with a great deal of uncertainties
(Hoefler, 2003) and barriers to buy and consume new food products can be relaxed by acquiring a
learned experience from others. Apart from being a new product, consumers may potentially
distrust the processed alternative (TP) itself as they do not see what they eat and this may induce
additional uncertainty. The distrust can be related to food safety concerns as reported in other
studies (e.g. Ortega et al. 2011) and such elements of distrust could be reduced if recommendations
from other sources are provided for consumers.
Generally speaking, albeit differences in WTP magnitudes, most consumers have positively
reacted to the WTFS and TP, which suggests that consumers could accept and buy TBFPs
irrespective of how they are presented. This is likely attributable to the fact that most consumers are
familiar with termites being traditionally consumed as food in Kenya. In this respect, more than
80% of the consumers in our sample said that they have eaten termites before, and around 97% of
them reported that they have heard edible insects being consumed in Kenya. Such level of
familiarity may drive consumers in the sample to react positively to the two products. Moreover,
presenting the termite products with familiar and readily accepted foods (in this case Ugali) may
have increased the likelihood of acceptance of TBFPs no matter how they are presented. Related
results are found in Megido et al. (2014); and Tan et al. (2015).

21
Although it is difficult to draw a conclusion based solely on results presented here, future
commercialization of TBFPs in Kenya may benefit from introducing products which are either
presented as whole or as processed formats. However, introducing the processed products may
require further intervention from the food and health sectors in terms of some official
recommendation and labelling. Moreover, according to the results, most consumers gain positive
utility from shopping TP in either kiosks or supermarkets other than in local markets, which
suggests that there is demand for the processed termite products if they are brought to the
conventional food stores. As opposed to this, only 30% of consumers would like to shop the WTFS
in Kiosks, and none of them showed tendency to make supermarkets as their shopping destination
for WTFS. This may be tied to the fact that whole and roasted termites are usually sold in western
Kenya, and other consumers in other parts of the country are aware of this. As a result, consumers
may be reluctant to see WTFS in the conventional food stores, perhaps because they fear price
increases or because of less experience with purchasing whole and fresh products from
supermarkets. In addition, people usually catch termites during the rainy season and serve them
after drying and roasting them. This may also contribute to consumers' disinclination to buy such
kind of products in supermarkets.
In sum, most consumers in Kenya prefer and are willing to pay more for TBFPs characterized
by high nutritional value, with a high level of food safety control and an official recommendation.
This remains true irrespective of the presence of the tradition of consuming edible insects. Based on
the results so far, two policy implications can be drawn. First, promoting edible insects as food
would be effective in Kenya if officials in the health and food sectors take an active role in
engendering edible insects into the food chain. As discussed in FAO (2013), since edible insects do
not fall within the conventional food chain, national regulations in terms of, e.g. standardization to
control food safety and legalizing are scanty. Nevertheless, if insects are to be used as food,
administrative frameworks should come into play (FAO, 2013). This is consistent with our findings'
that consumers would trust and accept edible insects for consumption if they get information from
their respective officials. Second, the fact that consumers in our sample showed significant demand
for TBFPs would seem to be very policy relevant in relation to establishing an edible insects
production sector so as to facilitate commercialization in Kenya. In other words, the results
presented in this paper serve as initial guidance for policy development aimed at overcoming
potential challenges and barriers to start mass-rearing and subsequently promote quality control and
marketing for human consumption of insects.

22
References
Aiking, H., 2011. Future protein supply. Trends Food Sci. Technol. 22, 112-120.
Andrews, R.L., Currim,I.S., 2003. A Comparison of Segment Retention Criteria for Finite Mixture
Logit Models. J. Mark. Res. 40, 235-243.
Ayieko, M.A., Oriaro, V., 2008. Consumption, indigeneous knowledge, and clutural values of the
lakefly species within the Lake Victorial region. Afr. J. Environ. Sci. Technol. 2, 282-286.
Ayieko, M.A., Ndong'a, M.F.O., Tamale, A., 2010. Climate change and the abundance of edible
insects in the Lake Victoria region. J. Cell Anim. Biol. 4, 112-118.
Ayeiko, M.A., Kinyuru, J.N., Ndong’a, M.F.O., Kenji, G., 2012. Nutritional Value and
Consumption of Black Ants (Carebara vidua Smith) from the Lake Victoria Region in
Kenya. Adv. J. Food Sci. Technol. 3, 39-45.
Boxall, P., Adamowicz, W., 2002. Understanding Heterogeneous Preferences in Random Utility
Models: A Latent Class Approach. Environ. Resoure Econ. 23, 421-446.
Brown, S. L., Eisenhardt, K.M., 1995. Product development: past research, present findings, and
future directions. Acad. Manage. Rev. 20, 343-378.
Bukkens, S.G. F., 1997. The nutritional value of edible insects. Ecol. Food Nutr. 36, 287-319.
Bechtold, K.B., Abdulai, A., 2014. Combining attitudinal statements with choice experiments
to analyze preference heterogeneity for functional dairy products. Food Policy 47, 97-106.
Carlsson, F., Frykblom, P., Lagerkvist, C.J., 2007. Consumer Benefits of Labels and Bans on GM
Foods - Choice Experiments with Swedish Consumers. Am. J. Agric. Econ. 89, 152-161.
Christensen, D.L., et al., 2006. Entomophagy among the Luo of Kenya: a potential mineral source?
Int. J. Food Sci. Nutr. 57, 198-203.
ChoiceMetrics, 2012. Ngene 1.1.1 User Manual & Reference Guide, Australia.
DeFoliart, G.R., 1989. The Human Use of Insects as Food and as Animal Feed. Bull. Entomol. Soc.
Am. 35, 22-36.
de Jonge, J., van Trijp, H., 2014. Heterogeneity in consumer perceptions of the animal friendliness
of broiler production systems. Food Policy 49, 174-185.
de Boer, J., Hoogland, C.T., Boersema, J.J., 2007. Towards more sustainable food choices: Value
priorities and motivational orientations. Food Qual. Prefer. 18, 985-996.
Ewing, G., Sarigöllü. E., 2000. Assessing Consumer Preferences for Clean-Fuel Vehicles: A
Discrete Choice Experiment. J. Public Policy Mark. 19, 106-118.
23
FAO, 2009. The state of food and agriculture: Livestock in the balance. Food and Agriculture
Organisation. http://www.fao.org/docrep/012/i0680e/i0680e.pdf (accessed 13.01.15).
FAO, 2013. Edible Insects: future prospects for food and feed security. Food and Agriculture
Organization. http://www.fao.org/docrep/018/i3253e/i3253e.pdf (accessed 09.03.14).
Glenk, K., Hall, C., Liebe, U., Meyerhoff, J., 2012. Preferences of Scotch malt whisky consumers
for changes in pesticide use and origin of barley. Food Policy 37, 719-731.
Greene, W.H., Hensher, D.A., 2003. A latent class model for discrete choice analysis: contrasts
with mixed logit. Transport. Res. B-Meth. 37, 681-698.
Grisolía, J.M., López, M., de Dios Ortúzar, J., 2012. Sea urchin: From plague to market
opportunity. Food Qual. Prefer. 25, 46-56.
Hartmann, C., Shi, J., Giusto, A., Siegrist, M., 2015. The psychology of eating insects: A cross-
cultural comparison between Germany and China. Food Qual. Prefer. 44, 148-156.
Hoeffler, S., 2003. Measuring Preferences for Really New Products. J. Mark. Res. 40, 406-420.
Hu, W., Hünnemeyer, A., Veeman, M., Adamowicz, W., Srivastava, L., 2004. Trading off health,
environmental and genetic modification attributes in food. Eur. Rev. Agric. Econ. 31, 389-
408.
Jaeger, S.R., Rose, M.J., 2008. Stated choice experimentation, contextual influences and food
choice: A case study. Food Qual. Prefer. 19, 539-564.
KNBS, 2009. The 2009 Kenyan Population and Housing Census. Kenya National Bureau of
Statistics. http://www.knbs.or.ke/ (accessed 02.02.15).
Kikulwe, E.M., Birol, E., Wesseler, J., Falck-Zepeda, J., 2011. A latent class approach to
investigating demand for genetically modified banana in Uganda. Agric. Econ. 42, 547-560.
Kimenju, S.C., De Groote, H., 2008. Consumer willingness to pay for genetically modified food in
Kenya. Agric. Econ. 38, 35-46.
Kinyuru, J.N., et al., 2013. Nutrient composition of four species of winged termites consumed in
western Kenya. J. Food Compos. Anal. 30, 120-124.
Kinyuru, J.N., et al., 2012. Identification of Traditional Foods with Public Health Potential for
Complementary Feeding in Western Kenya. J. Food Res. 1, 148-158.
Koistinen, L., et al., 2013. The impact of fat content, production methods and carbon footprint
information on consumer preferences for minced meat. Food Qual. Prefer. 29, 126-136.
Lancaster, K.J., 1966. A new approach to consumer theory. J. Politic. Econ. 74, 132-157.

24
Louviere, J.J., Hensher, D.A., Swait, J.D., 2000. Stated choice methods: Analysis and applications.
Cambridge University Press, Cambridge.
Louviere, J.J., Hensher, D.A., 1983. Using discrete choice models with experimental design data to
forecast consumer demand for a unique cultural event. J. Consum. Res. 10, 348-361.
Louviere, J.J., Woodworth, G., 1983. Design and analysis of simulated consumer choice or
allocation experiments: an approach based on aggregate data, J. Mark. Res. 20, 350-367.
McFadden, D., 1986. The Choice Theory Approach to Market Research. Market. Sci. 5: 275-297.
Megido, R.C., et al., 2014. Edible Insects Acceptance by Belgian Consumers: Promising Attitude
for Entomophagy Development. J. Sens. Stud. 29, 14-20.
Nyukuri, R.W., Mwale, R.E., Kirui, S.C., Cheramgoi, E., Koskei, G.C., 2014. Food value of
termites (isoptera: termitidae) in Western Kenya: comparison with tilapia fish and red meat.
Int. J. Sch. Res. Gate 2, 176-181.
OBG., 2014. The report: Kenya 2014. Oxford Business Group. www.oxfordbusinessgroup.com
(accessed 10.02.15).
Oonincx, D.G.A.B., et al., 2010. An Exploration on Greenhouse Gas and Ammonia Production by
Insect Species Suitable for Animal or Human Consumption. PLOS ONE 5, 1-7.
Oonincx, D.G.A.B., de Boer, I.J.M., 2012. Environmental Impact of the Production of Mealworms
as a Protein Source for Humans – A Life Cycle Assessment. PLOS ONE 7, e51145.
Ortega, D.L., Wang, H.H., Wu, L., Olynk, N.J., 2011. Modeling heterogeneity in consumer
preferences for select food safety attributes in China. Food Policy 36, 318-324.
Paoletti, M.G., et al., 2003. Nutrient content of termites(syntermes soldiers) consumed bymakiritare
amerindians of the altoorinoco of Venezuela. Ecol. Food Nutr. 42, 177-191.
Pliner, P., Hobden, K., 1992. Development of a scale to measure the trait of food neophobia in
humans. Appetite 19, 105-120.
Ramos‐Elorduy, J., 1997. Insects: A sustainable source of food? Ecol. Food Nutr. 36, 247-276.
Ritchey, P.N., Frank, R.A., Hursti, H-K., Tourila, H., 2003. Validation and cross-national
comparison of the food neophobia scale (FNS) using confirmatory factor analysis. Appetite
40, 163-173.
Rumpold, B.A., Schlüter, O.K., 2013. Potential and challenges of insects as an innovative source of
food and feed production. Innov. Food Sci. Emerg. Technol. 17, 1-11.
Ruto, E., Garrod, G., Scarpa, R., 2008. Valuing animal genetic resources: a choice modeling
application to indigenous cattle in Kenya. Agric. Econ. 38, 89-98.

25
Scarpa, R., et al., 2003. Valuing genetic resources in peasant economies: the case of ‘hairless’
creole pigs in Yucatan. Ecol. Econ. 45, 427-443.
Scarpa, R., Thiene, M., 2005. Destination Choice Models for Rock Climbing in the Northeastern
Alps: A Latent-Class Approach Based on Intensity of Preferences. Land Econ. 81, 426-444.
Scarpa, R., Thiene, M., 2011. Organic food choices and Protection Motivation Theory: Addressing
the psychological sources of heterogeneity. Food Qual. Prefer. 22, 532-541.
Scarpa, R., Ferrini, S., Willis, K., 2005. Performance of Error Component Models for Status-Quo
Effects in Choice Experiments. Applications of Simulation Methods in Environmental and
Resource Economics. R. Scarpa and A. Alberini, Springer Netherlands. 6, 247-273.
Steinfeld et al., 2006. Livestock’s Long Shadow. Environmental issues and options. Rome, Italy.
Stevens, R., Winter-Nelson, A., 2008. Consumer acceptance of provitamin A-biofortified maize in
Maputo, Mozambique. Food Policy 33, 341-351.
Stroebele, N., De Castro, J.M., 2004. Effect of ambience on food intake and food choice. Nutr. 20,
821-838.
Swait, J., 1994. A structural equation model of latent segmentation and product choice for cross-
sectional revealed preference choice data. J. Retail. Consum. Serv. 1, 77-89.
Tan, H.S.G., et al., 2015. Insects as food: Exploring cultural exposure and individual experience as
determinants of acceptance. Food Qual. Prefer. 42, 78-89.
Trusov, M., Bucklin, R.E., Pauwels, K., 2009. Effects of Word-of-Mouth Versus Traditional
Marketing: Findings from an Internet Social Networking Site. J. Mark. 73, 90-102.
van Huis, A. 2003. Insects as Food in sub-Saharan Africa. Int. J. Trop. Insect Sci. 23, 163-185.
van Huis, A., 2013. Potential of insects as food and feed in assuring food security. Annu. Rev.
Entomol. 58, 563-83.
van Kleef, E., van Trijp, H.C.M., Luning, P., 2005. Consumer research in the early stages of new
product development: a critical review of methods and techniques. Food Qual. Prefer. 16,
181-201.
van Trijp, H.M., Fischer, A.H., 2011. Mobilizing consumer demand for sustainable development.
The TransForum Model: Transforming Agro Innovation Toward Sustainable Development.
H. van Latesteijn and K. Andeweg, Springer Netherlands: 73-96.J.K.
Vermunt, J.K., Magidson, J., 2014. Upgrade Manual for Latent GOLD Choice 5.0: Basic,
Advanced,and Syntax. Belmont Massachusetts: Statistical Innovations Inc.
Yoo, J., Ready, R.C., 2014. Preference heterogeneity for renewable energy technology. Energ. Econ. 42, 101-114.