consumer campaign impact assessment ayam dingin segar · demografi aida perilaku pembelian motivasi...
TRANSCRIPT

Consumer Campaign Impact Assessment
Ayam Dingin Segar
November 2017, Jos van den Puttelaar
Penilaian Dampak Kampanye Konsumen
Ayam Dingin Segar
November 2017, Jos van den Puttelaar
Contents
▪ Objective
▪ How did we measure?
▪ What did we measure?
● Demographics
● AIDA model
● Behaviour insights
● Campaign insights
▪ Conclusion
3

Isi
▪ Tujuan
▪ Bagaimana mengukurunya?
▪ Apa yang diukur?
● Demografi
● Model AIDA (Awareness Interest Desire Action)
● Wawasan tentang perilaku
● Wawasan terkait kampanye
▪ Kesimpulan
4

Objective
▪ Measure the impact of consumer campaign
▪ Targets:
5
4,324,58
3,74
5,62 5,49
4,49
1,00
2,00
3,00
4,00
5,00
6,00
7,00
Awareness Interest Desire
Goals for cooled chicken
Current Cooled chicken Goal
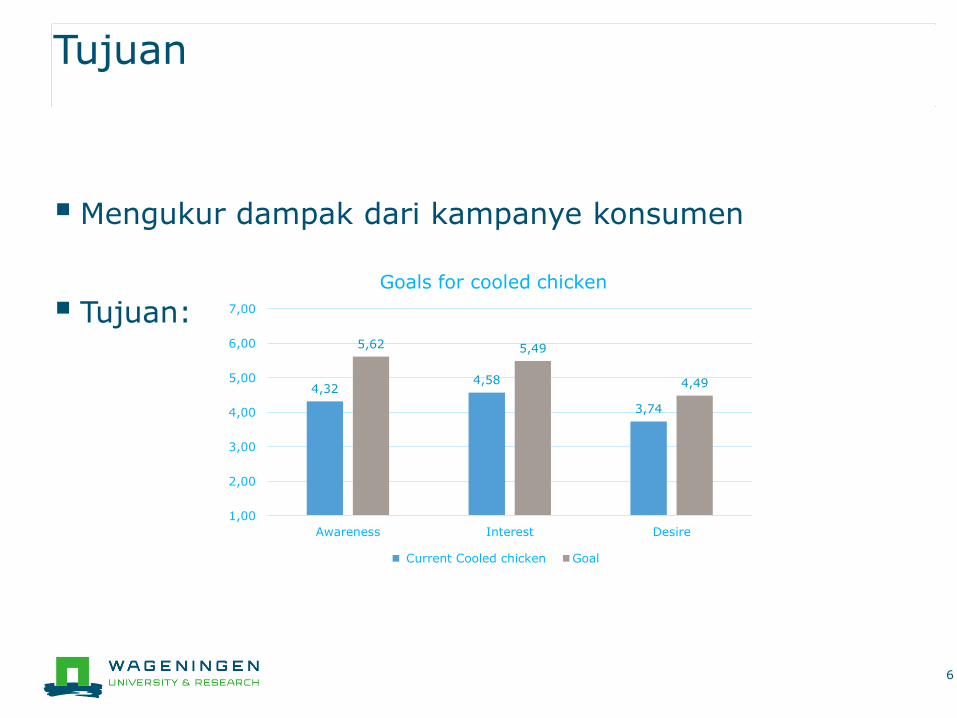
Tujuan
▪ Mengukur dampak dari kampanye konsumen
▪ Tujuan:
6
4,324,58
3,74
5,62 5,49
4,49
1,00
2,00
3,00
4,00
5,00
6,00
7,00
Awareness Interest Desire
Goals for cooled chicken
Current Cooled chicken Goal
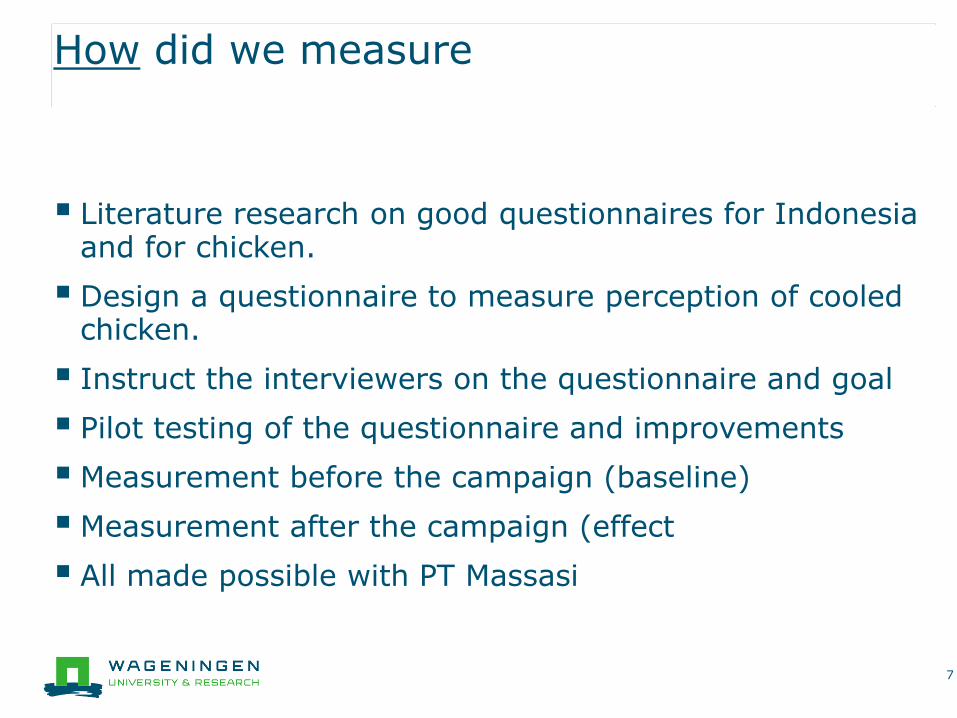
How did we measure
▪ Literature research on good questionnaires for Indonesia and for chicken.
▪ Design a questionnaire to measure perception of cooled chicken.
▪ Instruct the interviewers on the questionnaire and goal
▪ Pilot testing of the questionnaire and improvements
▪ Measurement before the campaign (baseline)
▪ Measurement after the campaign (effect
▪ All made possible with PT Massasi
7
Bagaimana kami mengukurnya?
▪ Melakukan studi literature tentang bagaimana kuesioneryang baik untuk Indonesia dan terkait ayam.
▪ Menyusun kuesioner untuk mengukur persepsi tentangayam dingin (cooled chicken)
▪ Melatih pewawancara tentang kuesioner dan tujuannya.
▪ Melakukan tes percobaan (pilot testing) terhadapkuesioner dan melakukan perkembangan.
▪ Melakukan pengukuran sebelum kampanye dilakukan(baseline)
▪ Melakukan pengukuran setelah kampanye dilakukan(dampak)
▪ All made possible with PT Massasi
8
How did we measure?
9
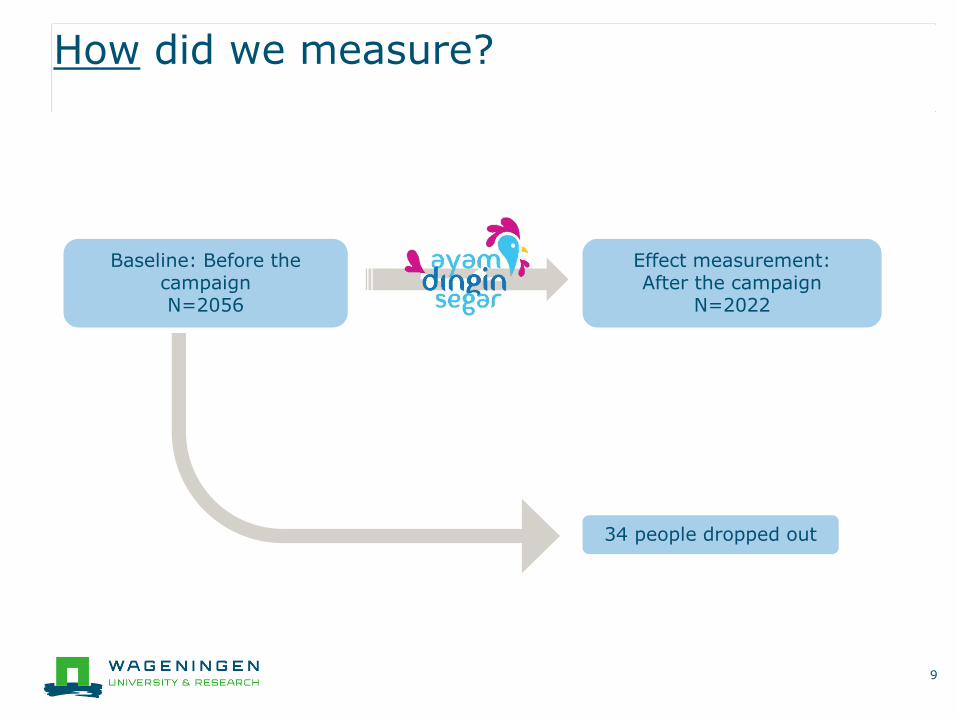
Baseline: Before the campaign N=2056
Effect measurement: After the campaign
N=2022
34 people dropped out

How did we measure?
10
Kondisi awal sebelumkampanyeN=2056
Setelah kampanye dilakukanN=2022
34 orang dikeluarkan
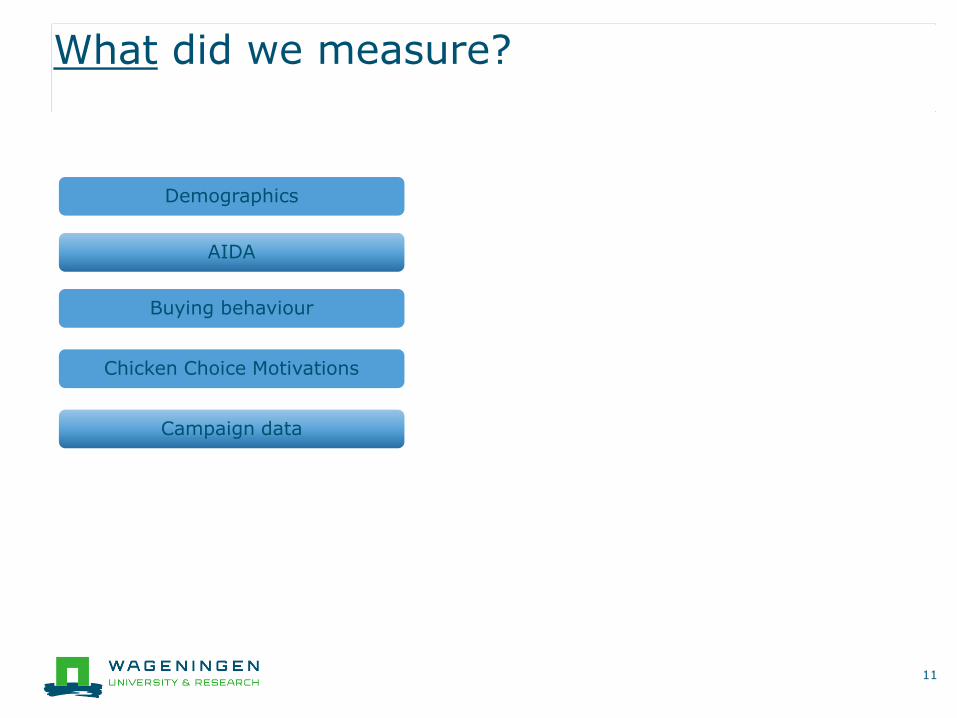
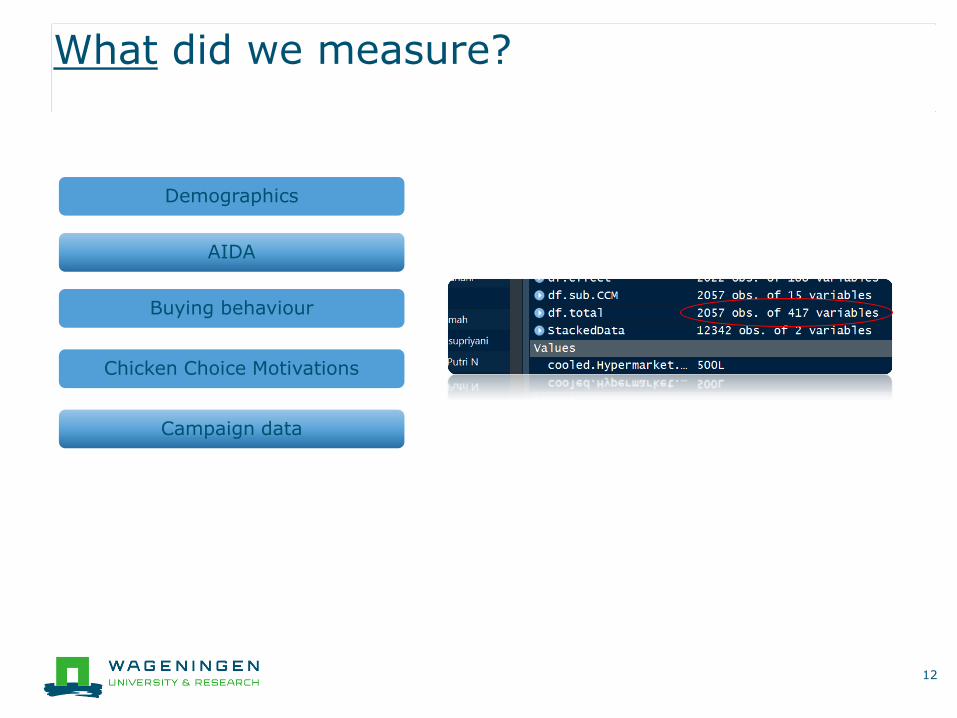
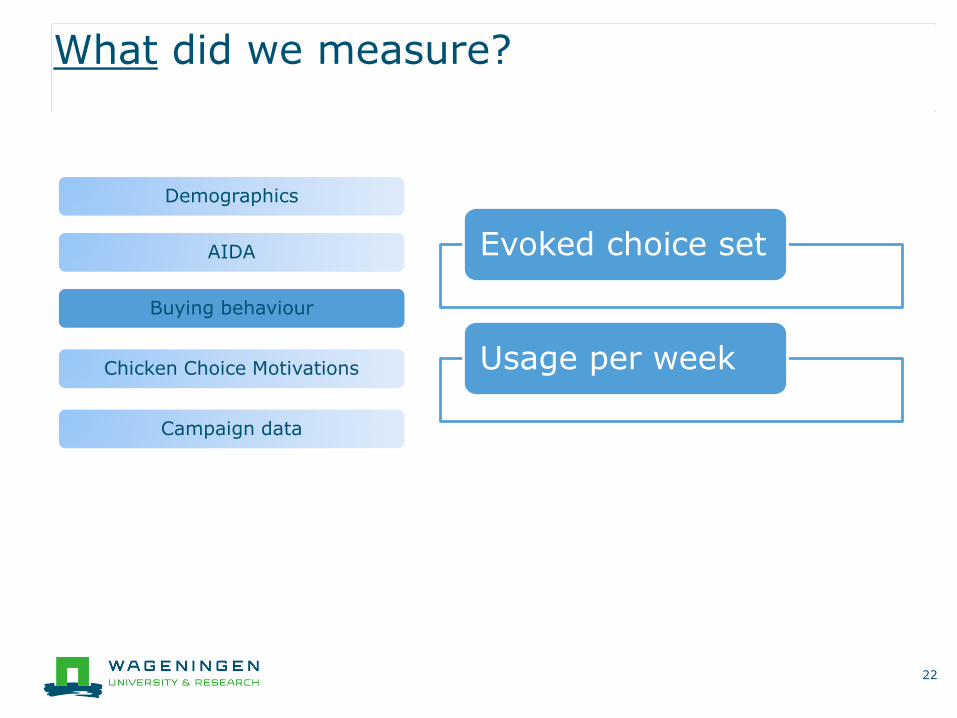
What did we measure?
11
Demographics
AIDA
Buying behaviour
Chicken Choice Motivations
Campaign data
What did we measure?
12
Demographics
AIDA
Buying behaviour
Chicken Choice Motivations
Campaign data

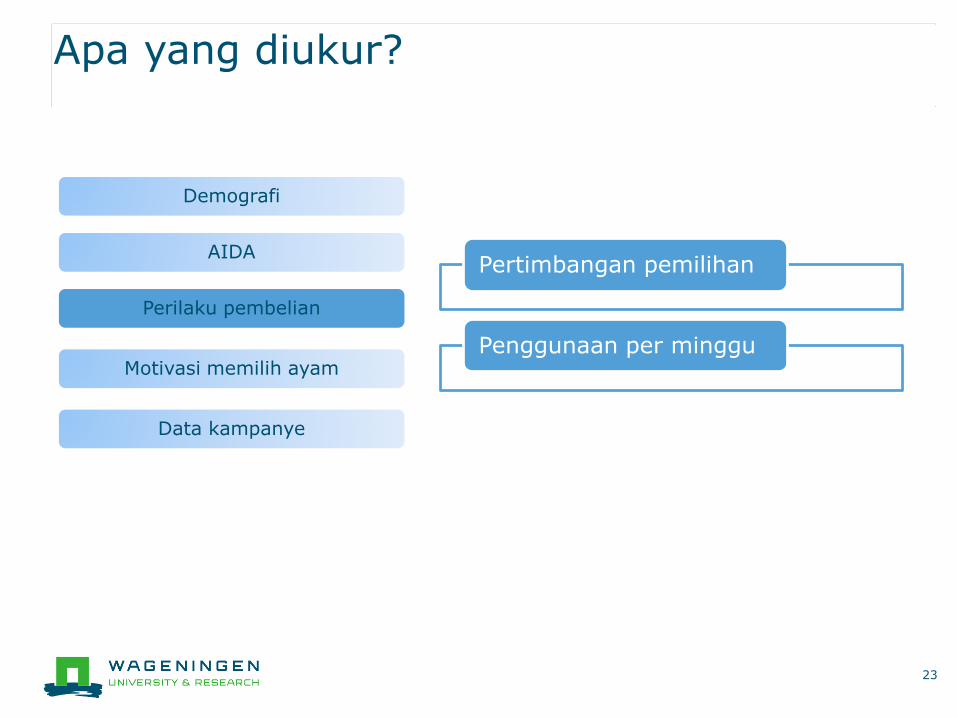
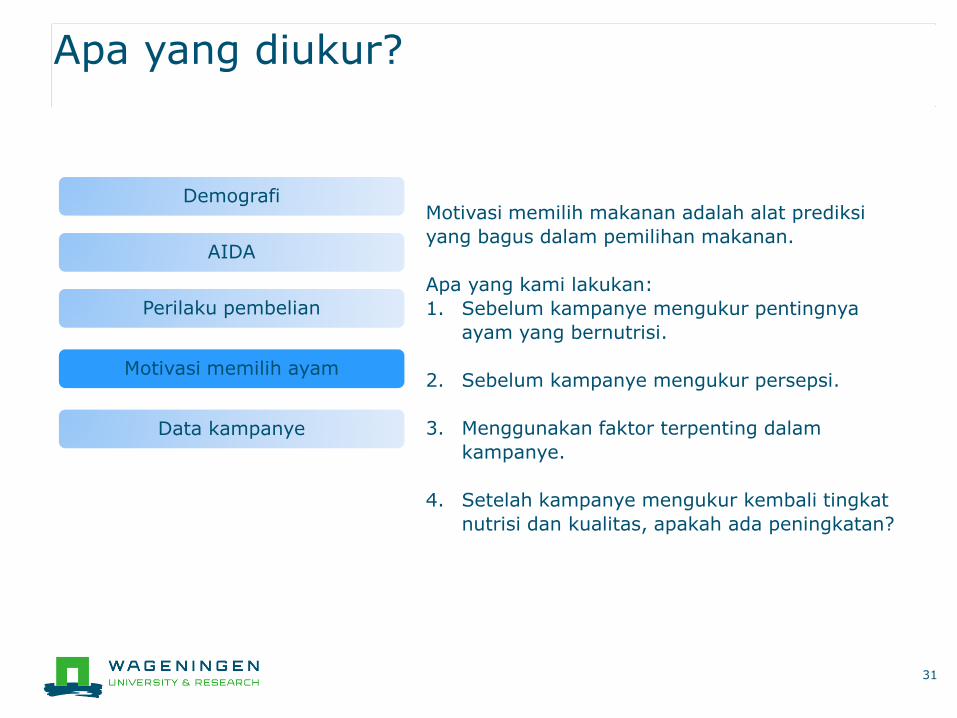
Apa yang diukur?
13
Demografi
AIDA
Perilaku pembelian
Motivasi memilih ayam
Data kampanye
What did we measure?
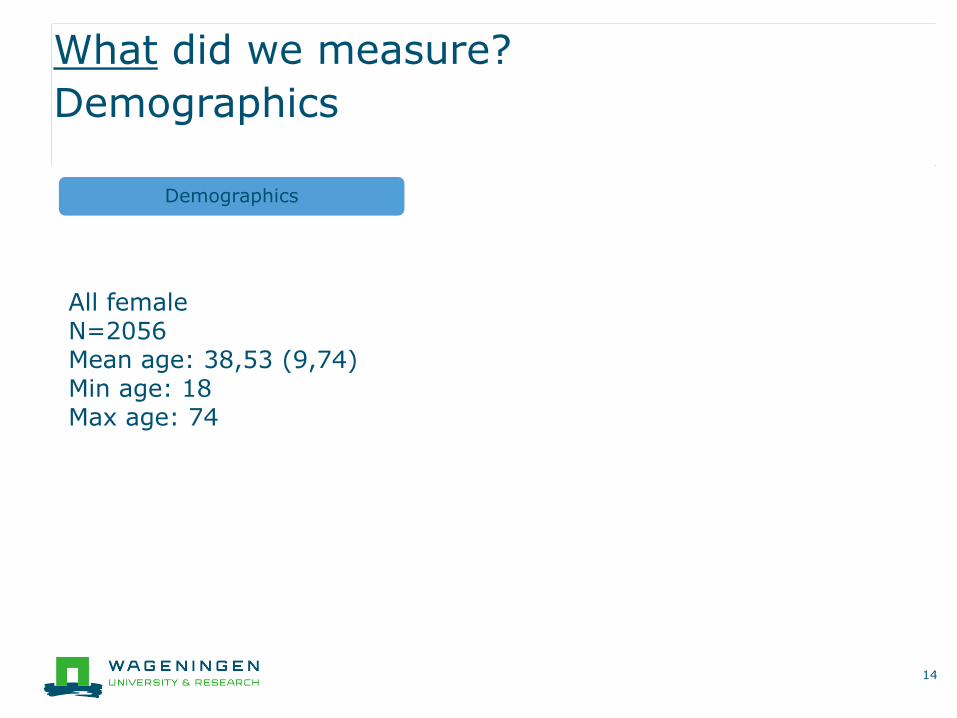
Demographics
14
Demographics
All femaleN=2056Mean age: 38,53 (9,74)Min age: 18Max age: 74
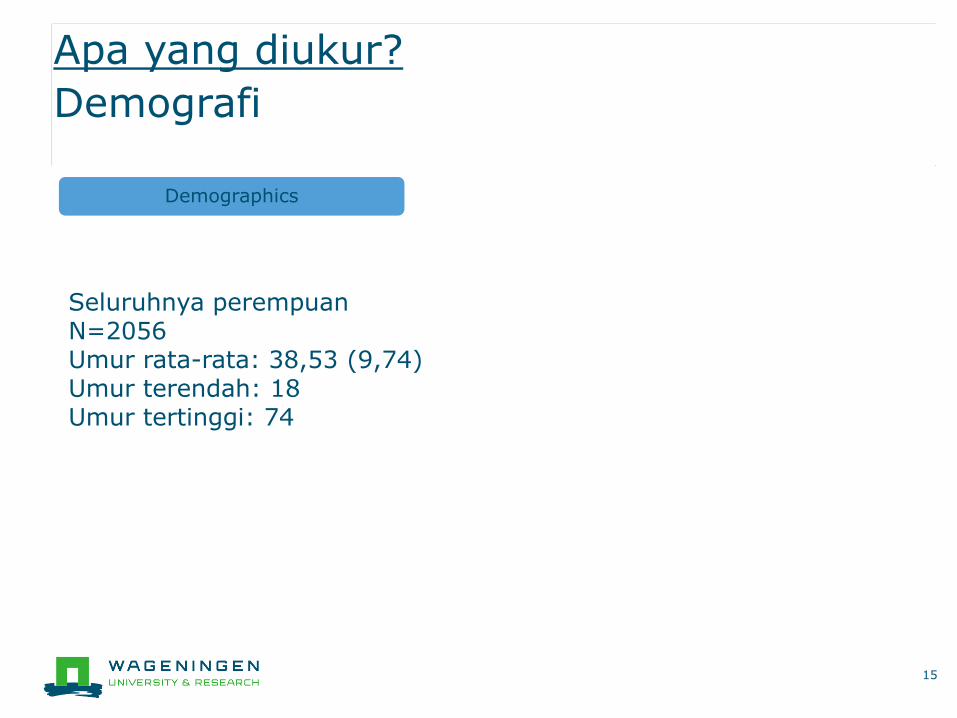
Apa yang diukur?
Demografi
15
Demographics
Seluruhnya perempuanN=2056Umur rata-rata: 38,53 (9,74)Umur terendah: 18Umur tertinggi: 74

What did we measure?
AIDA
16
Demographics
AIDA
Buying behaviour
Chicken Choice Motivations
Campaign data
Action
Desire
Interest
Awareness
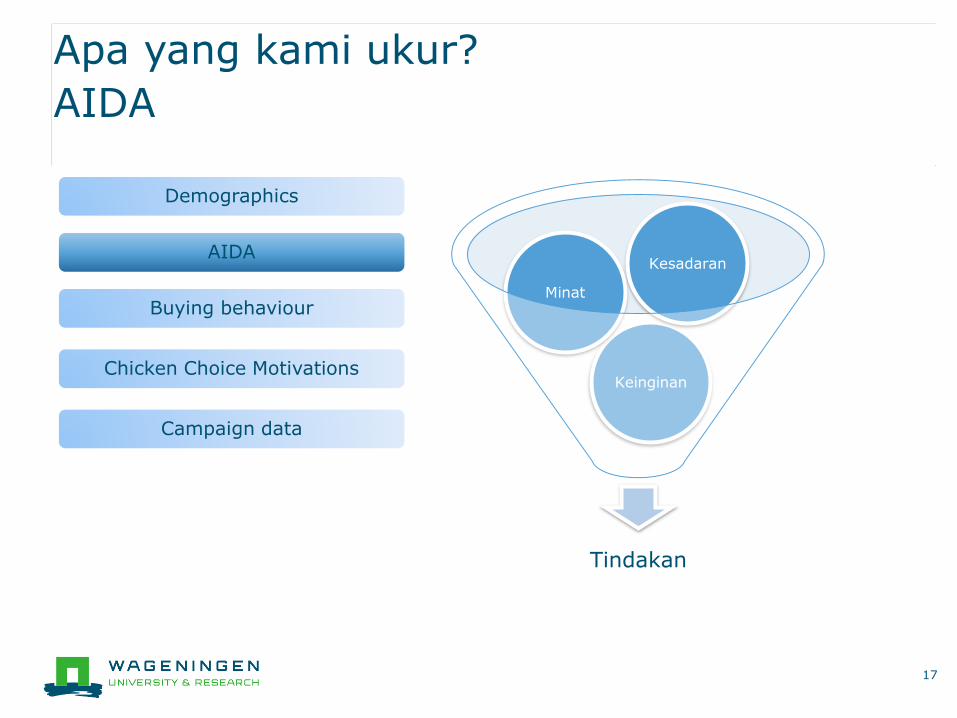
Apa yang kami ukur?
AIDA
17
Demographics
AIDA
Buying behaviour
Chicken Choice Motivations
Campaign data
Tindakan
Keinginan
Minat
Kesadaran
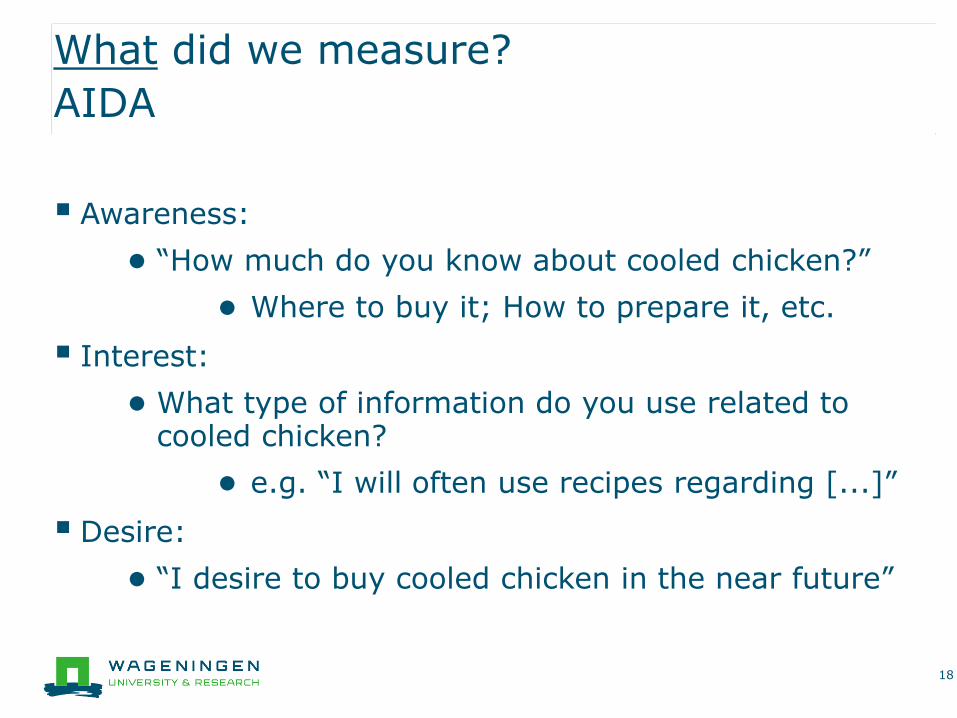
What did we measure?
AIDA
▪ Awareness:
● “How much do you know about cooled chicken?”
● Where to buy it; How to prepare it, etc.
▪ Interest:
● What type of information do you use related to cooled chicken?
● e.g. “I will often use recipes regarding [...]”
▪ Desire:
● “I desire to buy cooled chicken in the near future”
18
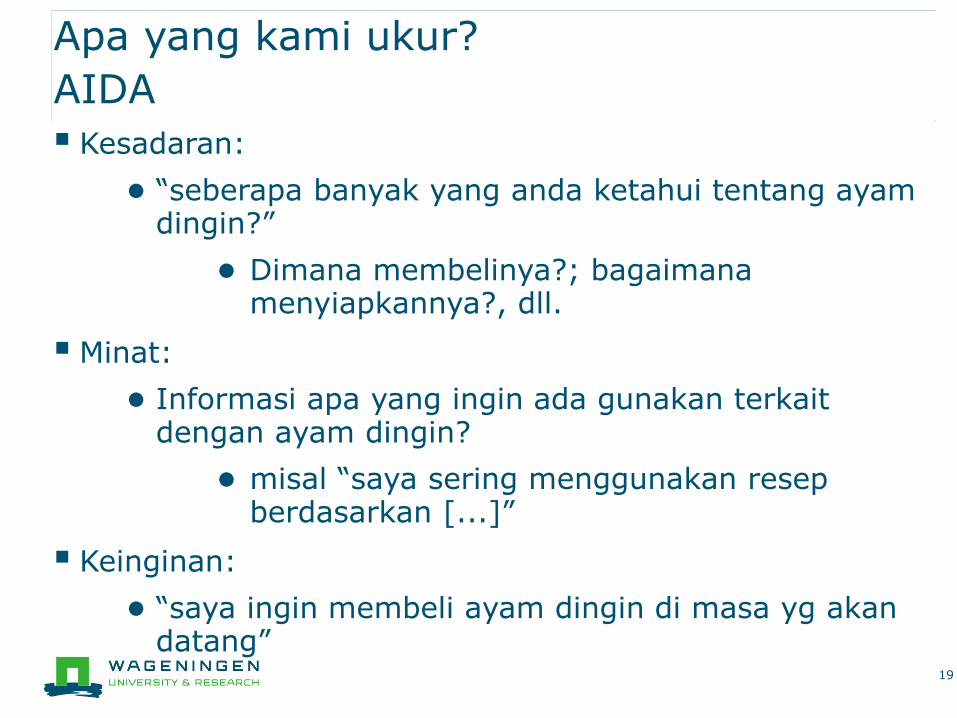
Apa yang kami ukur?
AIDA
▪ Kesadaran:
● “seberapa banyak yang anda ketahui tentang ayamdingin?”
● Dimana membelinya?; bagaimanamenyiapkannya?, dll.
▪ Minat:
● Informasi apa yang ingin ada gunakan terkaitdengan ayam dingin?
● misal “saya sering menggunakan resepberdasarkan [...]”
▪ Keinginan:
● “saya ingin membeli ayam dingin di masa yg akandatang”
19

AIDA model results
20
4,32
4,577
3,735
4,32
4,872
4,341
1
2
3
4
5
6
7
Awareness Interest Desire
AIDA
Baseline Effect
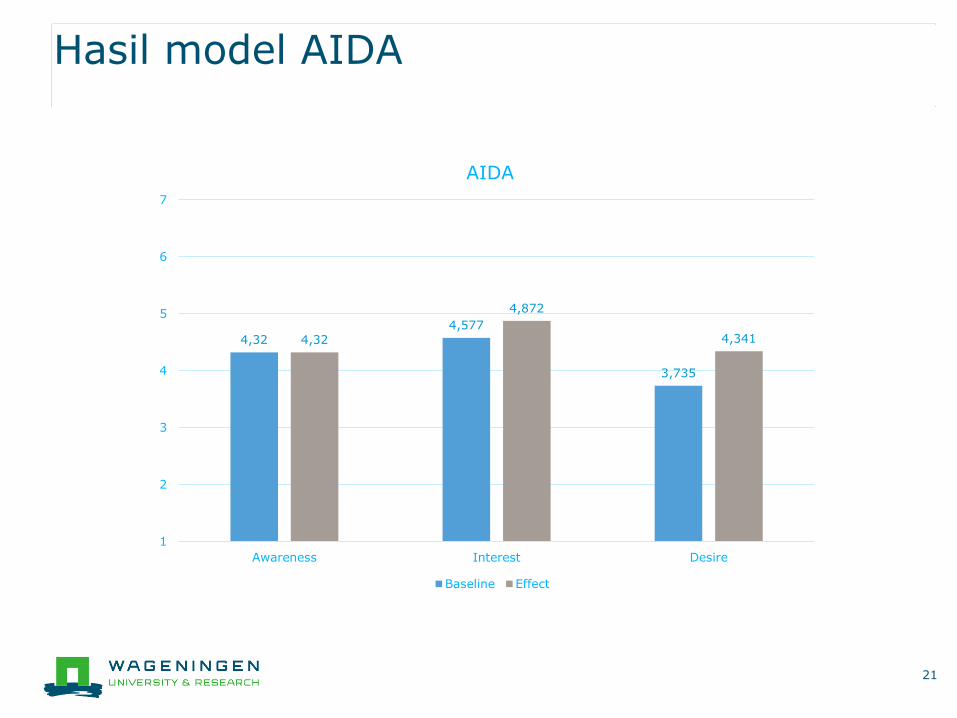
Hasil model AIDA
21
4,32
4,577
3,735
4,32
4,872
4,341
1
2
3
4
5
6
7
Awareness Interest Desire
AIDA
Baseline Effect
What did we measure?
22
Demographics
AIDA
Buying behaviour
Chicken Choice Motivations
Campaign data
Evoked choice set
Usage per week
Apa yang diukur?
23
Demografi
AIDA
Perilaku pembelian
Motivasi memilih ayam
Data kampanye
Pertimbangan pemilihan
Penggunaan per minggu
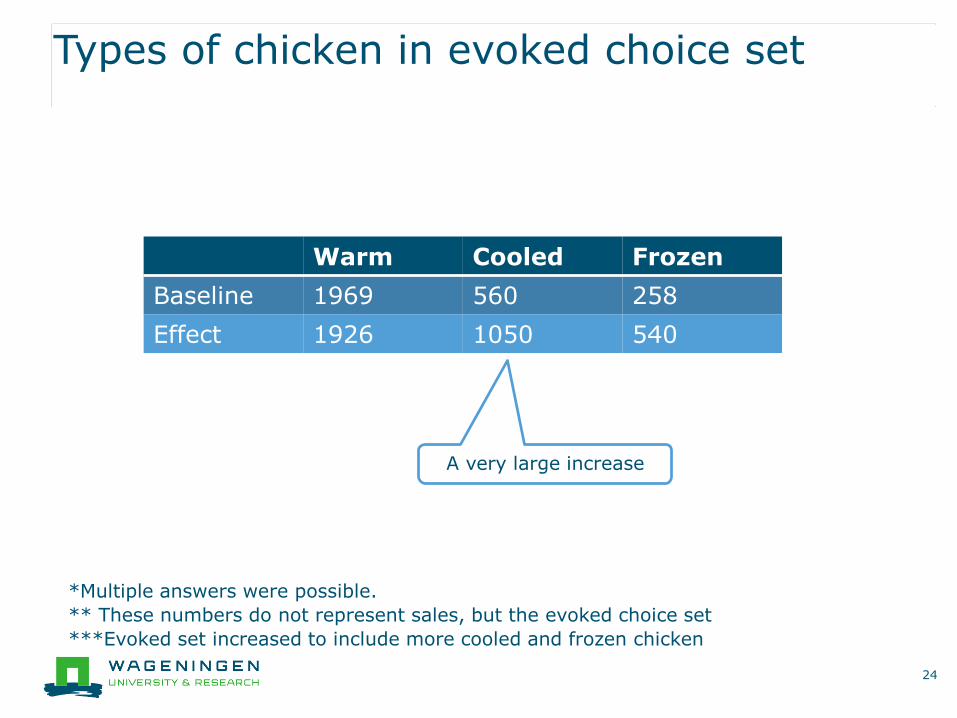
Types of chicken in evoked choice set
24
Warm Cooled Frozen
Baseline 1969 560 258
Effect 1926 1050 540
A very large increase
*Multiple answers were possible.
** These numbers do not represent sales, but the evoked choice set
***Evoked set increased to include more cooled and frozen chicken
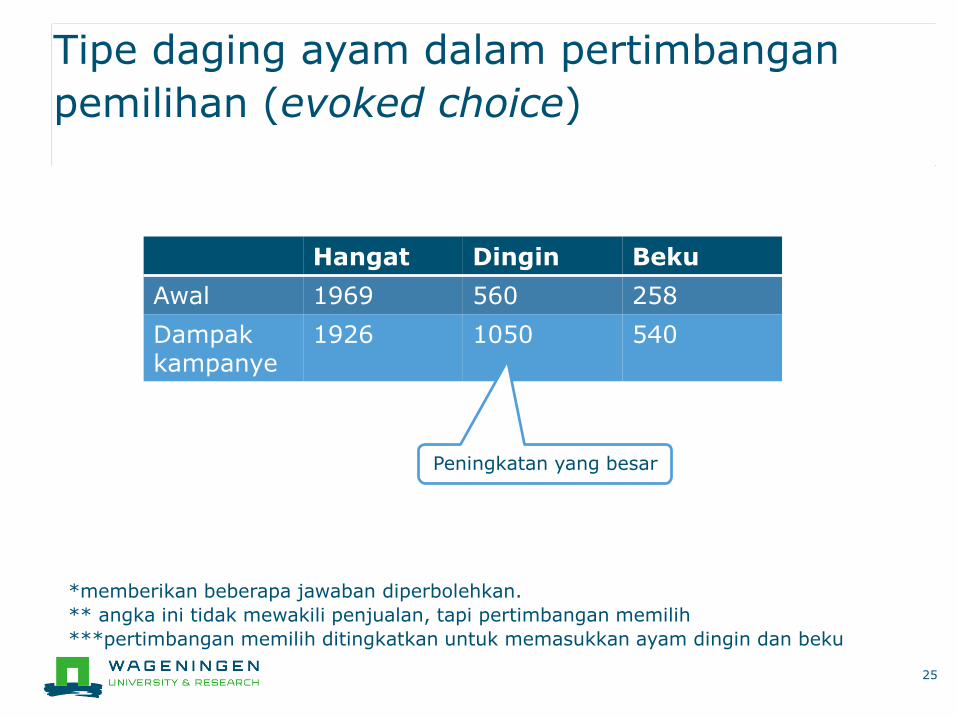
Tipe daging ayam dalam pertimbangan
pemilihan (evoked choice)
25
Hangat Dingin Beku
Awal 1969 560 258
Dampakkampanye
1926 1050 540
Peningkatan yang besar
*memberikan beberapa jawaban diperbolehkan.
** angka ini tidak mewakili penjualan, tapi pertimbangan memilih
***pertimbangan memilih ditingkatkan untuk memasukkan ayam dingin dan beku
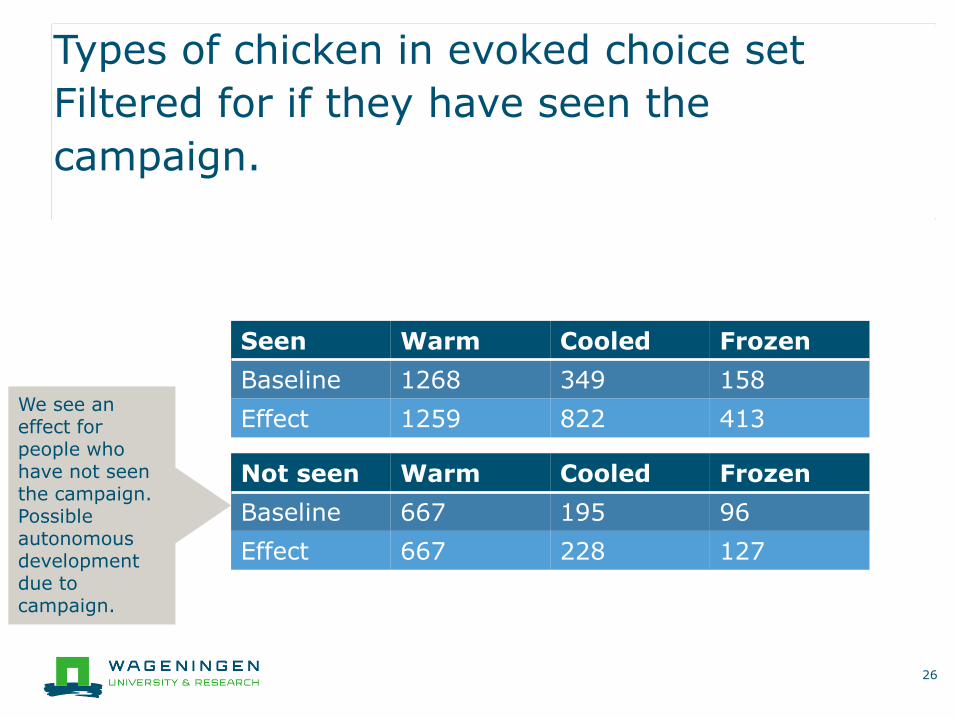
Types of chicken in evoked choice set
Filtered for if they have seen the
campaign.
26
Seen Warm Cooled Frozen
Baseline 1268 349 158
Effect 1259 822 413
Not seen Warm Cooled Frozen
Baseline 667 195 96
Effect 667 228 127
We see an effect for people who have not seen the campaign. Possible autonomous development due to campaign.
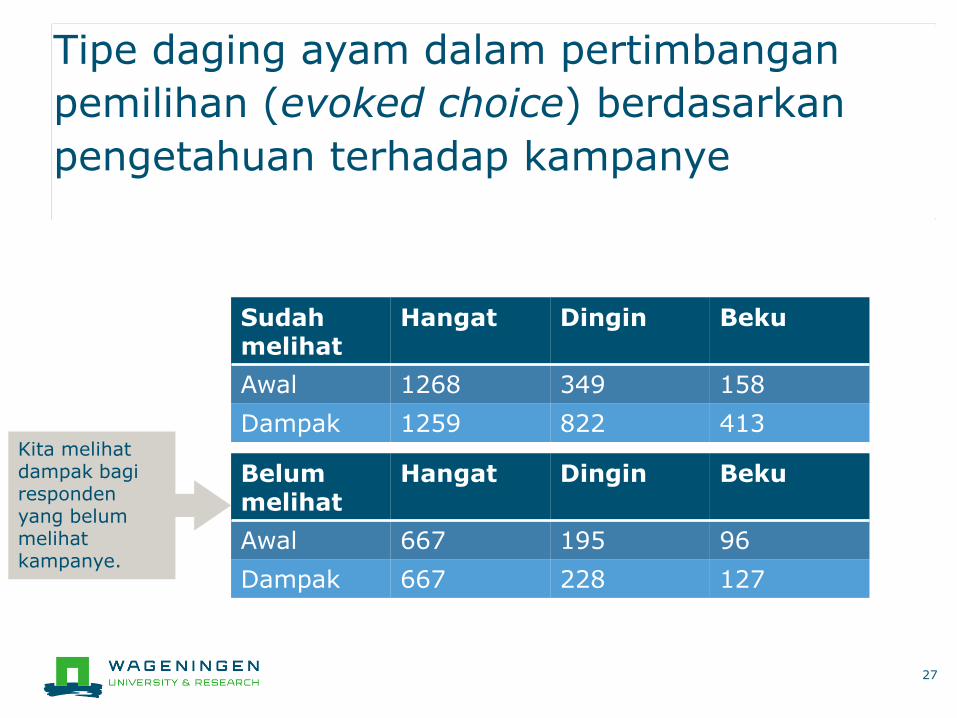
Tipe daging ayam dalam pertimbangan
pemilihan (evoked choice) berdasarkan
pengetahuan terhadap kampanye
27
Sudahmelihat
Hangat Dingin Beku
Awal 1268 349 158
Dampak 1259 822 413
Belummelihat
Hangat Dingin Beku
Awal 667 195 96
Dampak 667 228 127
Kita melihatdampak bagirespondenyang belummelihatkampanye.

How often do you use cooled chicken?
28
0
0,5
1
1,5
2
2,5
Cooled Warm Frozen
Use of chicken product in days per week
Baseline Effect
The differences between and effect measurement are
statistically significant at 95% confidence interval.
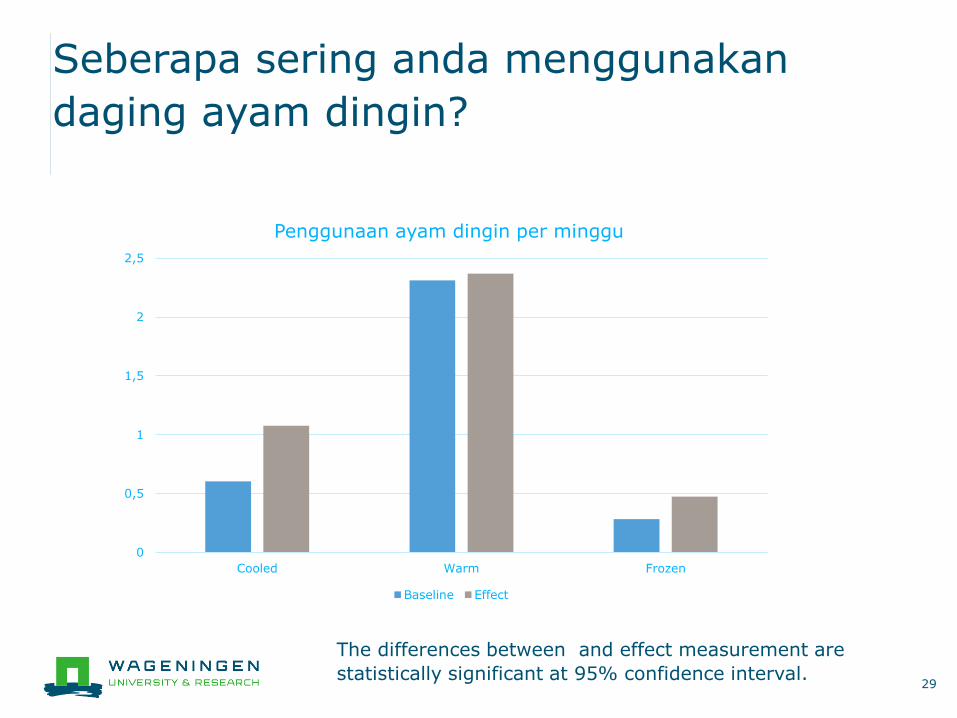
Seberapa sering anda menggunakan
daging ayam dingin?
29
0
0,5
1
1,5
2
2,5
Cooled Warm Frozen
Penggunaan ayam dingin per minggu
Baseline Effect
The differences between and effect measurement are
statistically significant at 95% confidence interval.

What did we measure?
30
Demographics
AIDA
Buying behaviour
Chicken Choice Motivations
Campaign data
Food Choice motivations are a strong predictor of
food choice.
What we did:
1. Before the campaign measure the importance
of chicken being nutritious etc.
2. Before the campaign measure the perception
3. Use the most important factors in the
campaign
4. After the campaign measure again the rating,
did we improve on nutrition and quality?
Apa yang diukur?
31
Demografi
AIDA
Perilaku pembelian
Motivasi memilih ayam
Data kampanye
Motivasi memilih makanan adalah alat prediksi
yang bagus dalam pemilihan makanan.
Apa yang kami lakukan:
1. Sebelum kampanye mengukur pentingnya
ayam yang bernutrisi.
2. Sebelum kampanye mengukur persepsi.
3. Menggunakan faktor terpenting dalam
kampanye.
4. Setelah kampanye mengukur kembali tingkat
nutrisi dan kualitas, apakah ada peningkatan?
What did we measure?
32
Demographics
AIDA
Buying behaviour
Chicken Choice Motivations
Campaign data
Importance:I find X important
PerceptionI give this product a
rating of 5
Apa yang kami ukur?
33
Demografi
AIDA
Perilaku pembelian
Motivasi membeli ayam
Data kampanye
Kepentingan:Saya merasa[..] penting
Persepsi:Saya memberikanproduk ini nilai 5
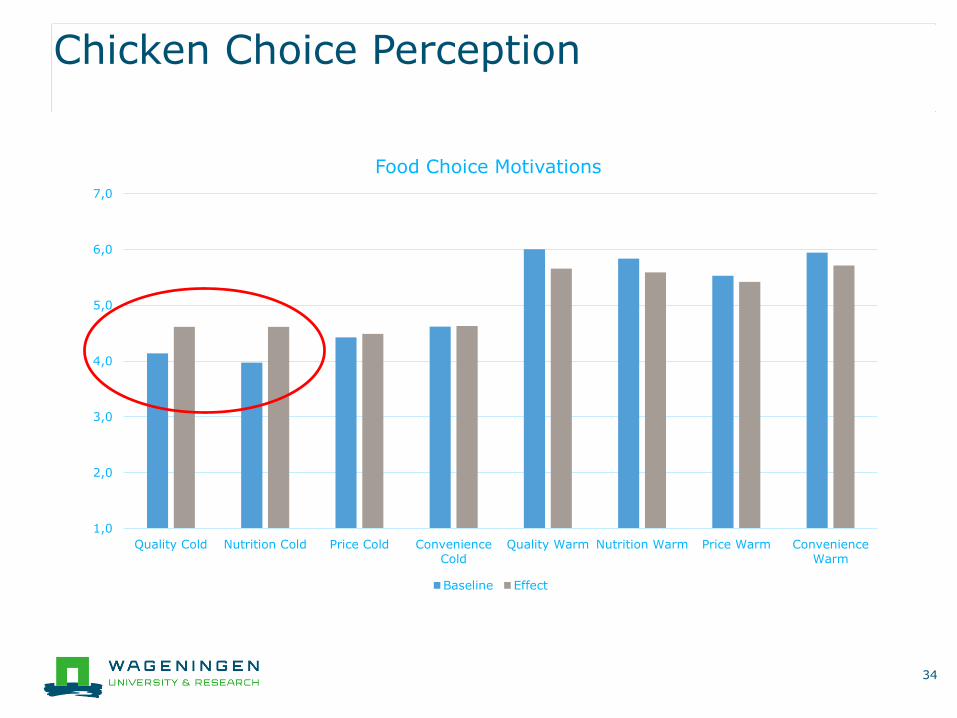
Chicken Choice Perception
34
1,0
2,0
3,0
4,0
5,0
6,0
7,0
Quality Cold Nutrition Cold Price Cold Convenience
Cold
Quality Warm Nutrition Warm Price Warm Convenience
Warm
Food Choice Motivations
Baseline Effect
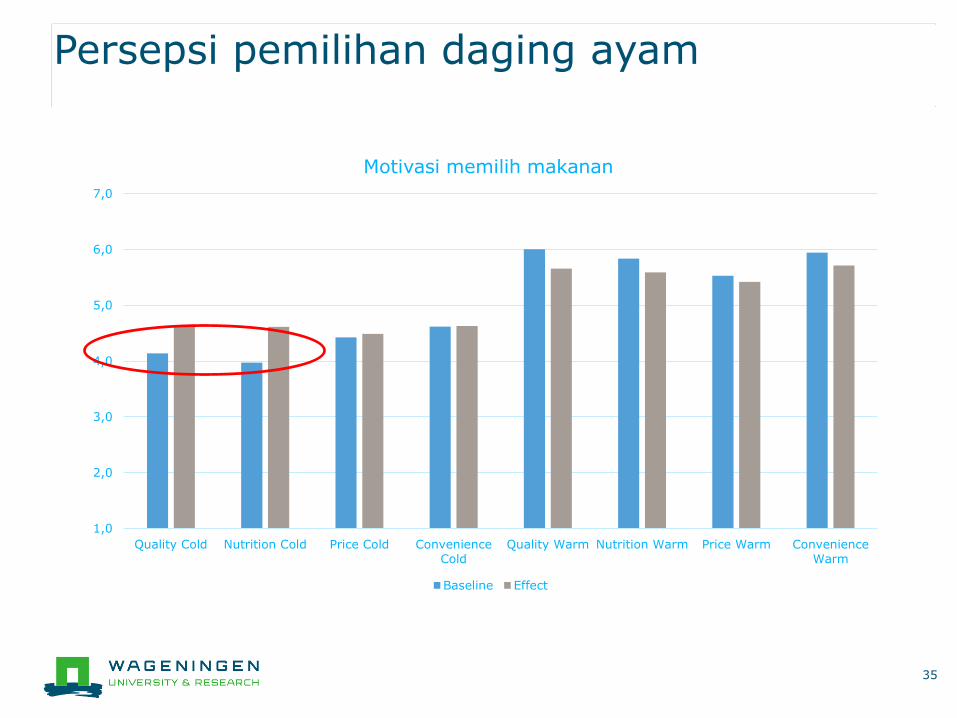
Persepsi pemilihan daging ayam
35
1,0
2,0
3,0
4,0
5,0
6,0
7,0
Quality Cold Nutrition Cold Price Cold Convenience
Cold
Quality Warm Nutrition Warm Price Warm Convenience
Warm
Motivasi memilih makanan
Baseline Effect
What did we measure?
36
Demographics
AIDA
Buying behaviour
Chicken Choice Motivations
Campaign data

Familiarity with the campaign
37
0
1
2
3
4
5
6
7
East Jakarta Bogor Tangerang South
Jakarta
North
Jakarta
Bekasi West Jakarta Central
Jakarta
Depok
How familair are you with the campaign?
Familiaritas terhadap kampanye
38
0
1
2
3
4
5
6
7
East Jakarta Bogor Tangerang South
Jakarta
North
Jakarta
Bekasi West Jakarta Central
Jakarta
Depok
Seberapa familiar anda dengan kampanye ini?
Have you seen the campaign
39

Apakah anda sudah melihat kampanye ini?
40

Aspects of the campaign
41
1
2
3
4
5
6
7
Blog Youtube Print Media Electronic media Edwin Lau
Familairity with parts of the campaign
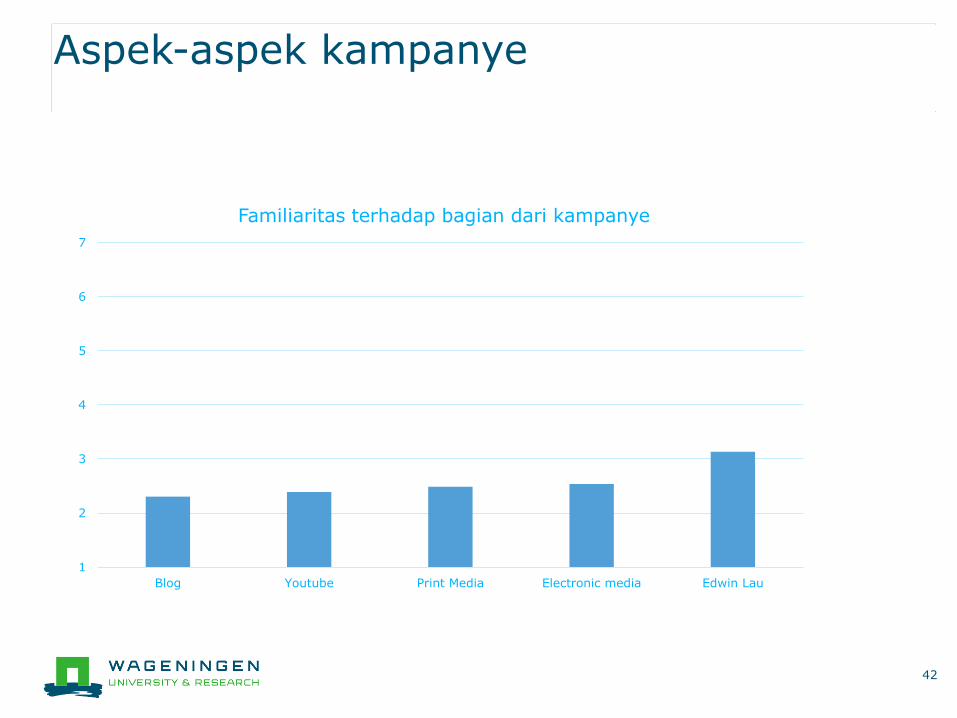
Aspek-aspek kampanye
42
1
2
3
4
5
6
7
Blog Youtube Print Media Electronic media Edwin Lau
Familiaritas terhadap bagian dari kampanye

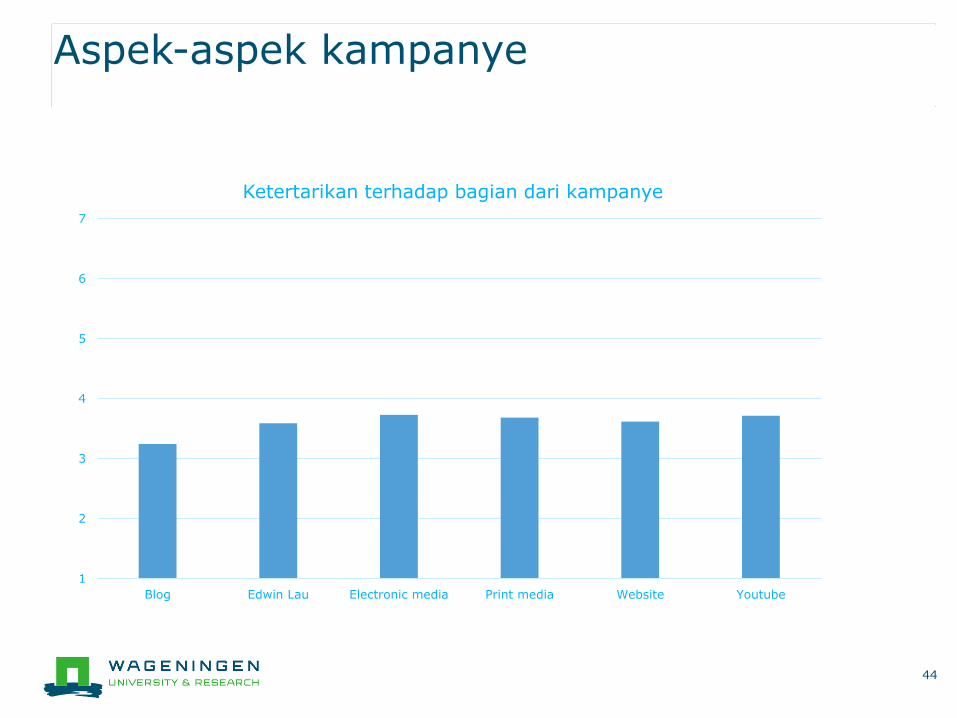
Aspects of the campaign
43
1
2
3
4
5
6
7
Blog Edwin Lau Electronic media Print media Website Youtube
Interest in parts of the campaign
Aspek-aspek kampanye
44
1
2
3
4
5
6
7
Blog Edwin Lau Electronic media Print media Website Youtube
Ketertarikan terhadap bagian dari kampanye

Facebook survey
▪ Why?
▪ Results
45
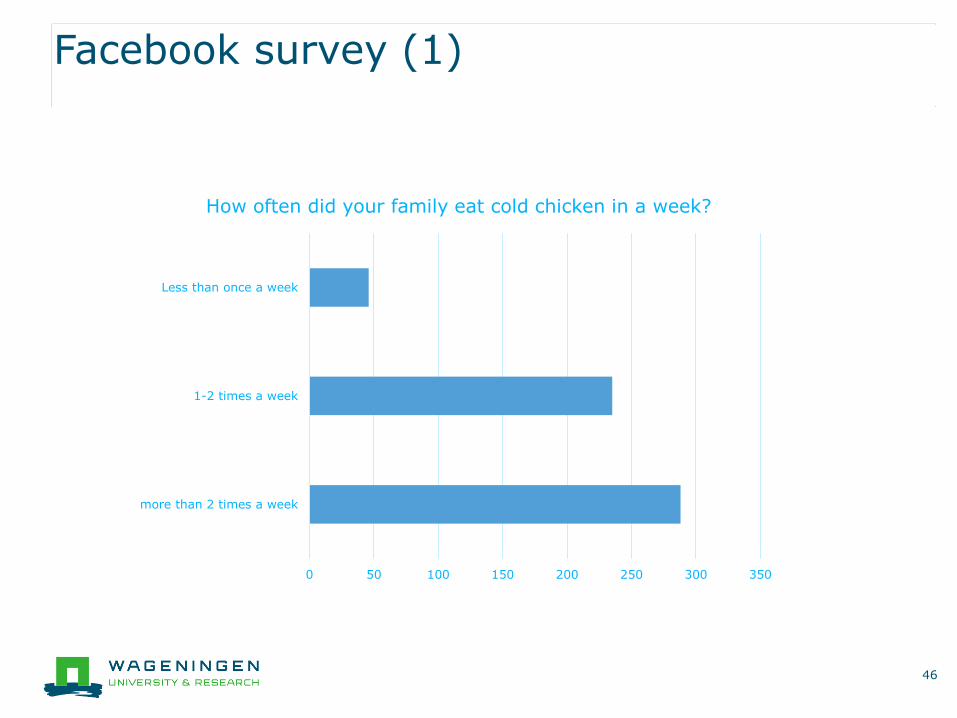
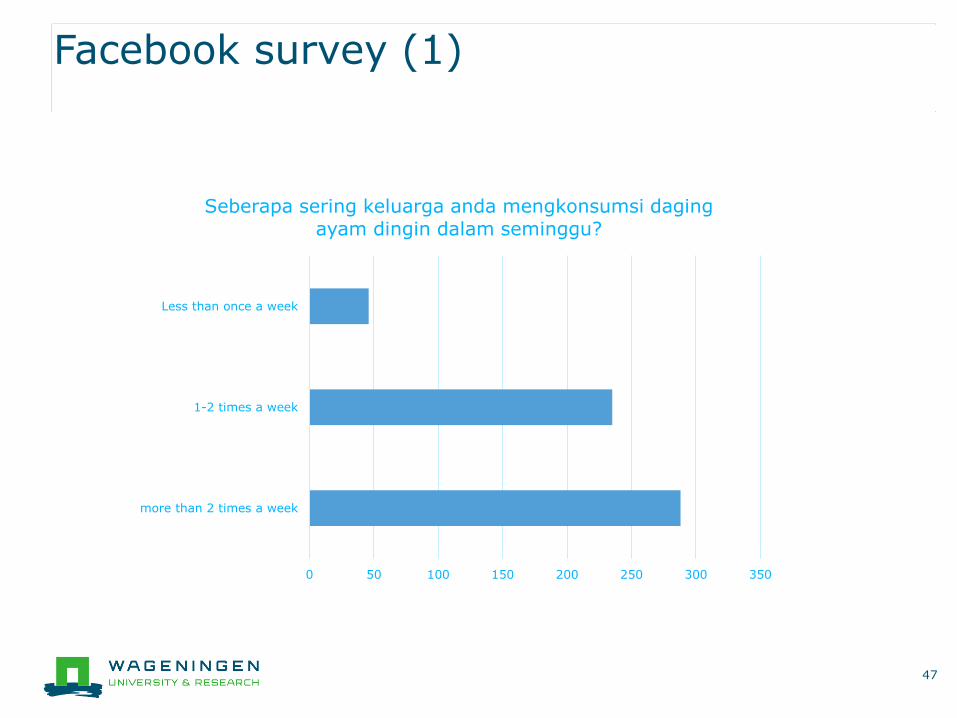
Facebook survey (1)
46
0 50 100 150 200 250 300 350
more than 2 times a week
1-2 times a week
Less than once a week
How often did your family eat cold chicken in a week?
Facebook survey (1)
47
0 50 100 150 200 250 300 350
more than 2 times a week
1-2 times a week
Less than once a week
Seberapa sering keluarga anda mengkonsumsi dagingayam dingin dalam seminggu?
Facebook survey (2)
48
0
100
200
300
400
500
600
The chicken is clean andhygienic
Seeing the process ofslaughter
Can be stored for long term
2. What are your considerations in buying chicken? (Can answer more than one)

Facebook survey (2)
49
0
100
200
300
400
500
600
The chicken is clean andhygienic
Seeing the process ofslaughter
Can be stored for long term
2. Apa pertimbangan anda dalam membeli dagingayam? (boleh memilih lebih dari 1)
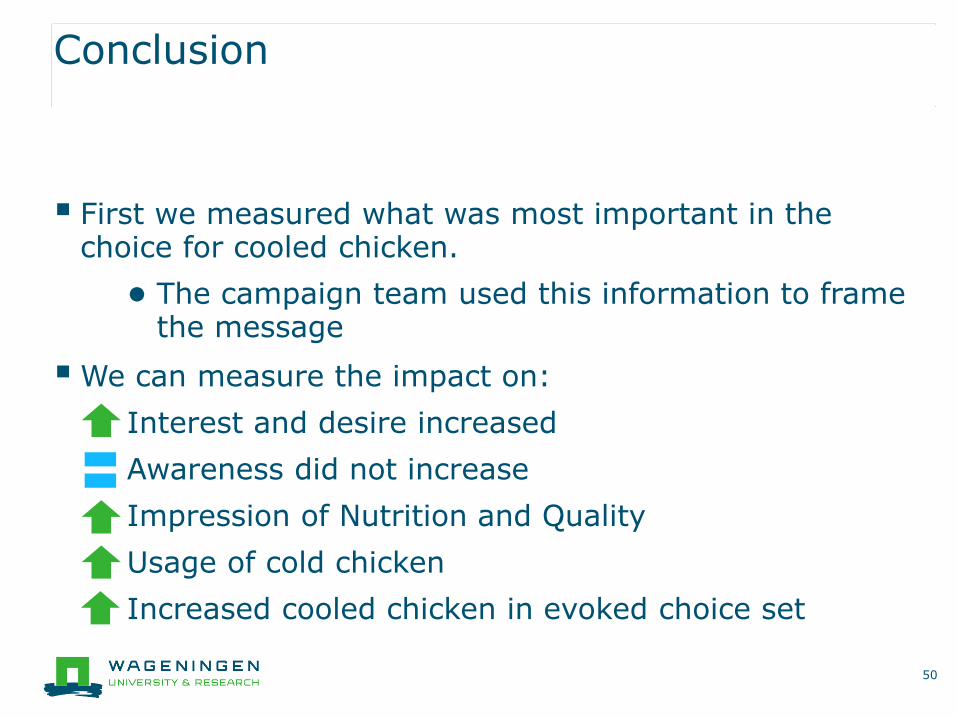
Conclusion
▪ First we measured what was most important in the choice for cooled chicken.
● The campaign team used this information to frame the message
▪ We can measure the impact on:
Interest and desire increased
Awareness did not increase
Impression of Nutrition and Quality
Usage of cold chicken
Increased cooled chicken in evoked choice set
50
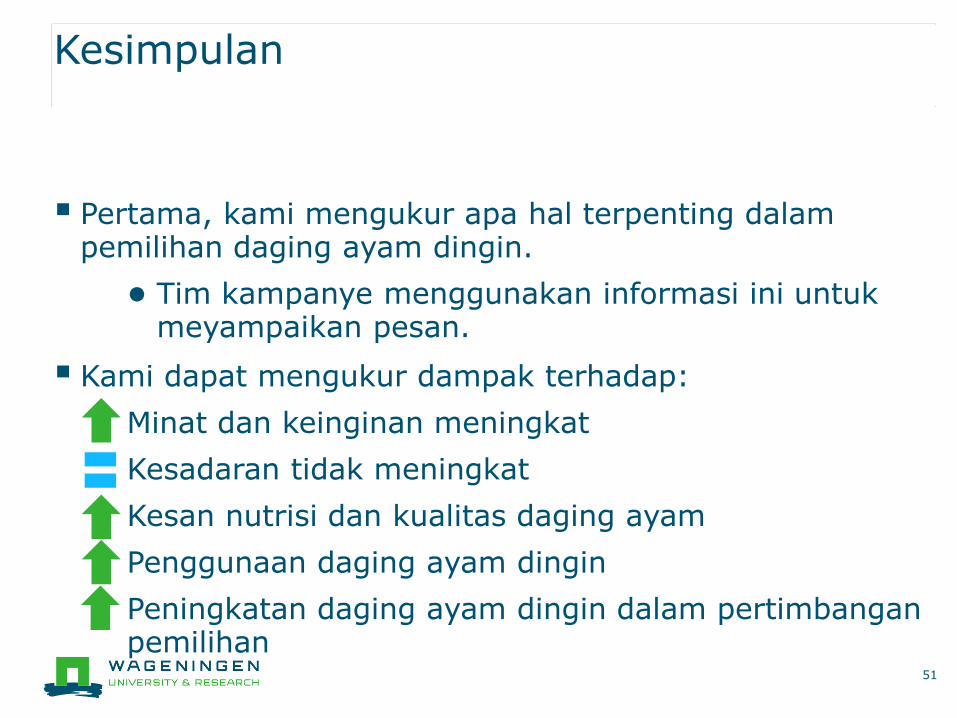
Kesimpulan
▪ Pertama, kami mengukur apa hal terpenting dalampemilihan daging ayam dingin.
● Tim kampanye menggunakan informasi ini untukmeyampaikan pesan.
▪ Kami dapat mengukur dampak terhadap:
Minat dan keinginan meningkat
Kesadaran tidak meningkat
Kesan nutrisi dan kualitas daging ayam
Penggunaan daging ayam dingin
Peningkatan daging ayam dingin dalam pertimbanganpemilihan
51
Conclusion: a personal note
Very well done!
52
Kesimpulan: catatan pribadi
Sangat memuaskan!
53
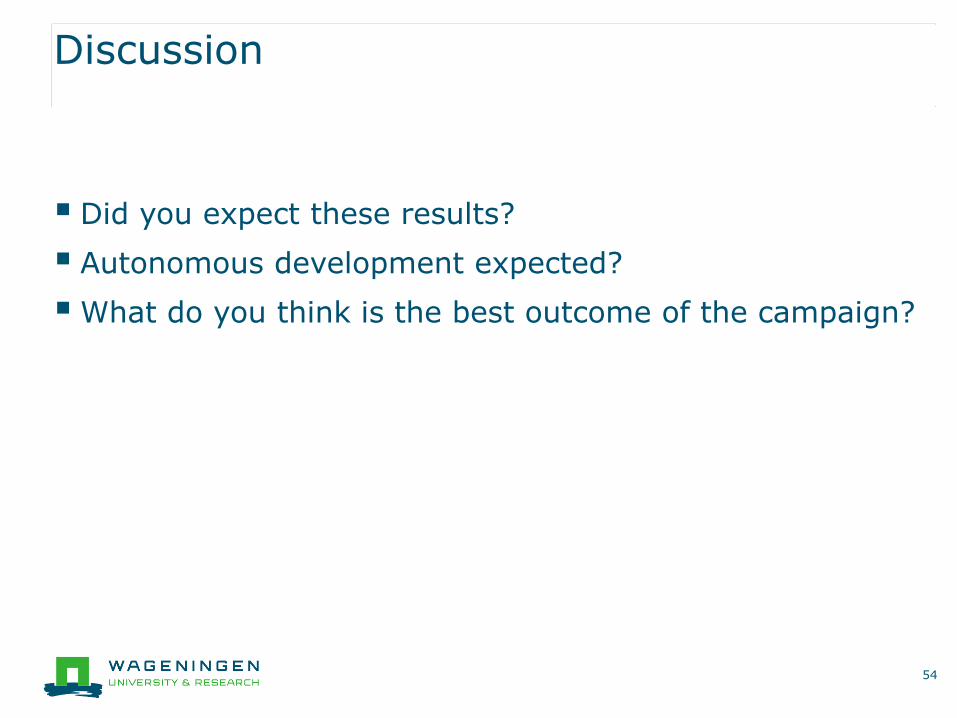
Discussion
▪ Did you expect these results?
▪ Autonomous development expected?
▪ What do you think is the best outcome of the campaign?
54

Diskusi
▪ Apakah anda mengharapkan hasil seperti ini?
▪ Apakah autonomous development diharapkan?
▪ Menurut anda apa hasil terbaik dari kampanye ini?
55
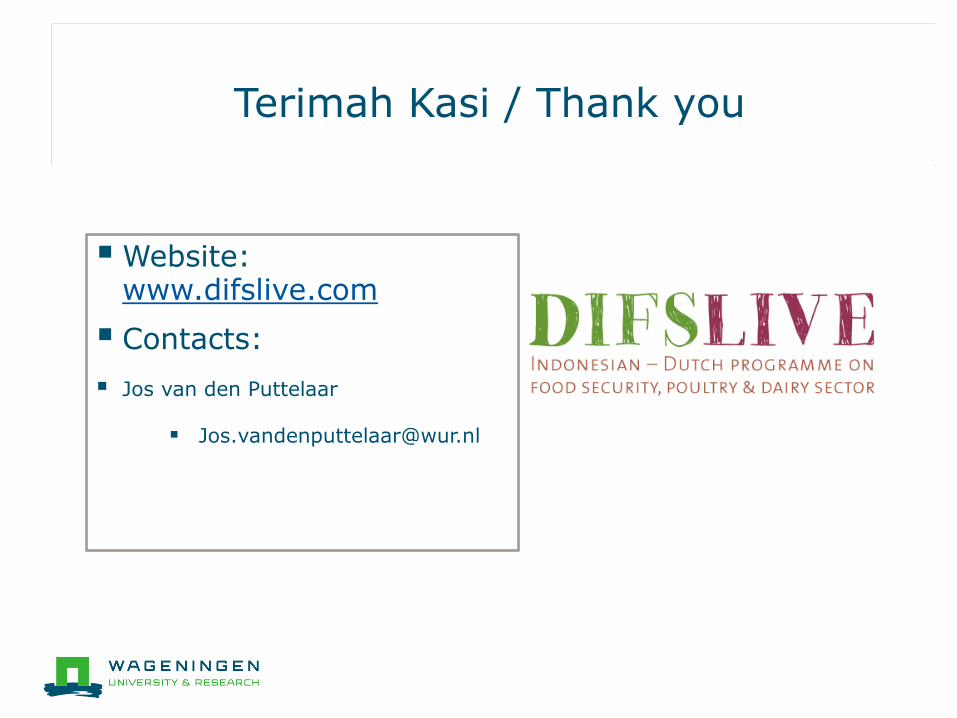
Terimah Kasi / Thank you
▪ Website: www.difslive.com
▪ Contacts:
▪ Jos van den Puttelaar