consumptive use of .water by peanuts and
TRANSCRIPT

CONSUMPTIVE USE OF .WATER BY PEANUTS AND
GRAIN SORGHUM IN OKLAHOMA, 1955
By
DWAYNE ALLEN 'SUTER 1.u
Bachelor of Science
Oklahoma,· Institute· of·. Technology
Stillwater, Oklahoma
Submitted to the fa.cul ty' of .. the Graduate School of the Oklahoma Agricultural and Mechanical College
in partial fulfillment of the requirements for the degree of ·MASTER OF SCIENCE
May; 1956 ·

CONSUMPTIVE USE OF WATE;R BY PEANUTS AND
GRAIN SQRGHUM, IN OKLAHOMA, 1955
Thesis Approved:
ea ,
�,f._, Dean oi �e
361705 ii

PREFACE
The experimental work of this thesis research project
was performed under the Agricultural Engineering Department,
Oklahoma A. and M. College, as a part of the irrigation
research of the Oklahoma Agricultural Experiment Station.
The soil moisture study method was used to determine the
consumptive use of peanuts and grain sorghum throughout the
growing season for El Reno, Oklahoma. The grain sorghum
experiments were a continuation of the irrigation research
conducted on an adjacent area in 1954 using a different
plot-layout design.
The results presented herein will permit more efficient
irrigation system design and -will' be ,benef ic±a.l ,. innimp.povi:ng_;
irrigation management practices for obtaining optimum yields
of the crops studied. The consumptive use data presented
may be used directly in irrigation system design by the
application of an irrigation efficiency factor.
This experimental work was conducted on the Oklahoma
Livestock Experiment Station, Fort Reno. The plots were
located 200 feet due south of irrigation well #2 in the
Canadian loam area.
The author wishes to express appreciation to Dwight F.
Stephens, Superintendent of Station, for his personal
assistance. and for makd.ng available the experimental area
iii

and the facilities and equipment of the station. Apprecia
tion is extended to James E. Garton; Associate Professor,
Irrigation and Ralphs. Matlock, Associate Professor,
Agronomy for their valuable suggestions in planning and
conducting the experiment, analyzing the data and writing
the report.
iv

I I
TABLE OF CONTENTS
Chapter Page
I. INTRODUCTION. 1
II. OBJECTIVES . . . 3
5 III. REVIEW OF LITERATURE.
Definition of Terms. 5 Conditions Affecting Consumptive Use . 8 Methods of·Determining Consumptive Use 9 Consumptive Use of Water by Peanuts. 12 Consumptive Use of Water by Grain
Sorghum. . . . . . . . . . . . . . . 13 Methods of Determining Soil Moisture 15
IV. METHOD AND PROCEDURE . . . . 18
v.
Location of Experimental Area. Equipme.nt Used . . . . . . . .
Plot Layout and Treatments Used. Crop Management Procedure . . . .Irrigation Procedure . .Soil Sampling Procedure . . . Study of Nylon Blocks. � . Aquaprobe Study . . . . .Crop Yield Sampling Procedure. Procedure for Calculations
RESULTS . . . . . . . . . . . .
Yield and Consumptive Use. for Peanuts. . . . Yield and Consumptive Use fqr Grain
Sorghum. . . . . . ·. . . . ; . . . . . Soil Moisture Extraction Patterns . . . Climatological Data . . . . . . . . . . Observations Made With Nylon Blocks and
Aquaprobe . . . .
VI. SUMMARY AND CONCLUSIONS
BIBLIOGRAPHY.
v
18 19 20 23 23 25 26 27 27 28
31
31
38
4:9 51
52
55
58

Chapter
APPENDIXES.
A. Irrigation Applications and Consumptive Use by Peanuts and Grain
Page
60
Sorghum. . . . . . . . . . 61 B. Soil Characteristics of Plot Area. 63 C. Climatological Data . . • . . . . . 64 D. Data Obtained with Nylon Blocks. 72 E. Aquaprobe Data . . . . . . . . . 74
vi

LIST OF TABLES
Table
I. Irrigated Acreage of Peanuts (Estimated for
Page
- 19 54) . . . . . . . . . . . . . . . . . . . . 13
II. Water Requirements for Dwarf Milo in the Sacramento and San Joaquin Valleys of California, 1910-22 . . . . . . . . . . . . . . . 14
III. Water Requirements for Grain Sorghum in theWitchita Valley of Texas, 1932-36 15
IV. Peanut Yields in Pounds Per Acre. . 32
V. Analysis of Variance of Peanut Yields 32
VI. Standard Error for Means, Standard Error forDifference Between the Means, and Coefficient of Variation for Water Treatments . . . . . 33
VII. Shelling Percentage of Peanut Yields Based onPercent by Weight of Sound Mature Kernels . 37
VIII. Summary of Consumptive Use of Water by Peanutsand Grain Sorghum . . . . . . . . . 40
IX. Grain Sorghum Yields in Bushels Per Acre. 41
X. Analysis of Variance of Grain Sorghum Yields. 41
XI. The New Multiple Range Test for SignificantDifference Between Water Treatment Means of Grain Sorghum at the 1% Level . . . . . . . 42
XII. Standard Error for Means, Sta�dat4 Erior·forDifference Between the Means, arid Coefficient of Variation for Water Treatments . . . . . 42
XIII. Relation of Soil Moisture .Usage by Peanuts at
XIV.
xv.
One Foot Intervals of the Root Zone . 50
Irrigation Applications and Consumptive Use of Water by Peanuts. . . . . . 61
Irrigation Applications and Consumptive Use of Water by Grain Sorghum ... . . . . 62
vii

Table Page
XVI. Soil Characteristics of Plot Area, CanadianLoam . . . .
XVII. Precipitation Data for Fort Reno, Oklahoma,
63
1955. . . . . 64
XVIII. Monthly Climatological Precipitation Datafor Fort Reno, Oklahoma, 1955 . . . . 66
IXX. Average Monthly Relative Humidity, Oklahoma City Airport, Oklahoma City, Oklahoma, May-November, 1955. . . . . . . . . 67
XX. Maximum and Minimum Daily Temperatures forEl Reno, Oklahoma, May-November, 1955 68
XXI. Daily Evaporation and Wind Velocity for LakeOverholser, Oklahoma, May-November, 1955. 69
XXII. Total Daily Solar Radiation in Gram-Calories Per Square Centimeter, May-November,
XX III.
XXIV.
Stillwater, Oklahoma, 1955. . . . . . . . 70
Bouyoucos Bridge Readings and Corresponding Soil Moisture Content . . . . . . 72
Aquaprobe Readings and Corresponding Soil Moisture Content. . . . . . . . . . 74
viii

LIST OF FIGURES
Figure
1. Electric Motor and Pump Unit, Orifice FlowMeter and Recorder, and Flow Regulating
Page
Gate Valve. . . 20
2. Layout of Peanut Plots. 21
3. Layout of Grain Sorghum Plots 22
4. Furrow Irrigation With Gated Pipe 24
5. Relation Between Water Treatment and Crop Yieldof Peanuts for Each Fertility Treatment 34
6. Relation Between Fertility Treatment and CropYield of Peanuts for Each Water Treatment 35
7. Peanut Plots During Growing Season. . . . . 36
8. Average Daily Consumptive Use Curves for Peanuts,Ft. Reno, Oklahoma, 1955. . . . . 39
9. Relation Between Water Treatment and Crop Yieldof Grain Sorghum for Each Fertility Treatment 43
10. Relation Between Fertility Treatment and CropYield of Grain Sorghum for Each Water Treat-ment. 44
11. Grain Sorghum Plots Near Maturity 46
12. Moisture Use - Yield Curve for Grain Sorghum,Ft. Reno, Oklahoma, 1955. . . . . . . . . . 47
13. Average Daily Consumptive Use Curves for GrainSorghum, Ft. Reno, Oklahoma, 1955 . . . . . . . 48
14. Relation Between Soil Moisture Content and Bridge
15.
Readings for Nylon Blocks . . . . . . . 53
Relation Between Soil Moisture Content and .Aquaprobe Dial Readings . . . . . . . . . 54
ix

CHAPTER I
INTRODUCTION
The availability of water during the crop growing sea-
son is of primary importance for obtaining the maximum econ-
omic yields in agricultural production. The lack of avail-
able water during the growing season has been found to be
one of the most limiting factors in maximum crop production
in Oklahoma and many other areas of similiar annual rain-
fall. Water that is not supplied by rainfall should be
supplied by some method of irrigation if optimum yields are
to be obtained. Due to the vast variability in rainfall
amounts and intensities, the water extraction pattern for a I
specific crop must be known and an adequate irrigation water
supply should be obtained to provide most or all of the
water. Where irrigation water is supplied from ground water,
receding water tables are causing alarm and increasing irri-
gation costs. In our increasing use of irrigation to meet
the growing demand for food and fibers, good utilization of
our limited water supply is increasing in importance.
In the normal process of growth, plants transpire water
into the atmosphere and utilize it in development of plant
tissue. Some water evaporates directly from the soil into
the atmosphere. The total utilized in transpiration, in
building plant tissue, and that evaporated from the adjacent
1

2
soil or from rainfall intercepted by plant foliage is called
consumptive use.
Significant reduction in crop yields may result if the
moisture level is held too high or too low. The knowledge
of the effect of the moisture level upon crop yield provides
a sound basis for scheduling irrigations to obtain the max
imum net return from the investment.
Considerable work is being done in many states to de
termine the consumptive use by the use of climatic factors
in an empirical relat�onship. Since soil moisture studies
conducted in field plots, as used in this experiment, are the
most accurate method of determining consumptive use, they are
valuable for developing and improving the accuracy of the
empirical method.
Previous studies have indicated that the moisture is
not extracted uniformly throughout the root zone. Also, the
fact that the moisture depletion varies throughout the grow
ing season has been established. Soil moisture extraction
patterns are desirable, therefore, for the purpose of deter
mining the consumptive use for optimum yields where the
water supply is limited.
f

CHAPTER II
OBJECTIVES
The objectives of this study were as follows:
1. Determine the consumptive use of water by peanuts
and grain sorghum for optimum yields at El Reno,
Oklahoma, 1955, by the field plot and soil moisture
depletion method.
a. Determine the seasonal transpiration
pattern.
b. Determine the peak average daily transpira
tion between irrigations.
c. Determine the peak monthly transpiration.
d. Determine the seasonal transpiration.
2. Determine the effect of varying the amount of
fertilizer application on the yield of each crop.
3. Determine the soil moisture extraction pattern for
each crop with relation to the depth of root zone.
4. Correlate the consumptive use data on grain sorghum
obtained the summer of 1955 in this project with
the data obtained by Jack Musick (13) in 1954;
using a similar type of soil in an adjacent area
with the same crop variety.
5, Note if an aquaprobe can be used as a quick method
3

of determining the soil moisture content.
6. Note if nylon blocks can be used for the deter
mination of soil moisture.
4

CHAPTER III
REVIEW OF LITERATURE
Definition of Terms
The following terms used in this report were defined
by Young (18) as follows:
Irrigation Requirement: The quantity of water, exclusive of precipitation, that is required for crop production. It includes surface evaporatlon and other economically unavoidable wastes. Usually expressed in depth for any given time,(�olume per unit area for a given time).
Water Requirement: The quantity of.water, regardless of its source, required by a crop in a given period of time, for its normal growth under field conditions. It includes surface evaporation and other economically unavoidable wastes. Usually expressed as depth (volume per unit area for a given time).
Consumptive Use (evapo-transpiration): The sum of the volumes of water used by the vegetative growth of a given area in transpiration and building of plant tissue and that evaporated from adjacent soil or intercepted precipitation on the area in any specified time, divided by the given area. The consumptive use may be expressed in acre-inches per acre or depth in inches, or acre-feet per acre or depth in feet.
Transpiration: The quantity of water absorbed by the crop that is transpired and used directly in the building of plant tissue in a specified time. It does not include soil evaporation. It is expressed as acre-feet or acreinches per acre or as depth in feet or inches.
Field Capacity: The moisture percentage, on a dry weight basis, of a soil_after rapid drainage has taken place following an application of water. This moisture percentage is reached approximately two days after irrigation.
Permanent Wilting Point: The moisture content of the soil at which the plants wilt and do not recover unless water is added. It is expressed as percentage of moisture based on the oven-dry weight of the soil.
5

6
Available Moisture: The quantity of water in the soil that is available f9r plant use, as limited by the field capacity and the permanent wilting percentage. It is expressed as percentage of the dry weight of the soil or as depth of water in inches per foot depth of soil.
Moisture Percentage: The percentage of moisture in the soil based on the dry weight of the oven-dry material.
Apparent Specific Gravity (volume weight): The ratio of the weight of a unit volume of oven-dry soil of undisturbed structure to that of an equal volume of water.
Real Specific Gravity: The ratio of the weight of a single soil particle to the weight of a volume of water equal in volume to the particle of soil.
Soil Moisture: The water in unsaturated soil. It is expressed as a percentage on a dry weight basis, or in inches per foot depth of soil.
Additional definitions used in this report are:
Temporary Wilting Point: The moisture content of the
soil at which the lower plant leaves begin to show signs of
wilting. The plant will fully recover during the night when
the transpiration rate is less than the rate of moisture
absorption by the plant roots.
Shelling Percentage: The percentage of sound mature
kernels in a sample expressed as percentage of the total
sample weight.
Sound Mature Kernels: Peanuts which are not described
as (1) small shriveled (15/64 inch by 3/4 inch perforations
were replaced by 14/64 inch by 3/4 inch perforations), (2)
small pieces of peanuts, (3) foreign material, (4) split pea-
nuts, or (5) damaged peanuts listed in the following report
issued by the United States Department of Agriculture, Agri
cultural Marketing Service (19):
1. "Small shriveled" peanuts in U. S. No. 1 means

peanuts which are shriveled and which will pass through a screen of the type customarily in use, having 15/64 inch by 3/4 inch perforations; and
7
in U. S. No. 2 peanuts which are shriveled and which will pass through a screen of the type customarily in use, having 16/64 inch round perforations.
2. "Small pieces of peanuts" means portions of peanutswhich will pass through a screen of the type customarily in use, having 16/64 inch round perforations.
3. "Foreign material" means sticks, stones, dirt,shells, portions of vines or any material otherthan peanut kernels.
4. "Split peanuts" means the separated halves of thepeanut kernel.
5. "Damaged peanuts" means:(a) Peanuts which are rancid or decayed to an
extent visible externally.(b) Moldy peanuts.(c) Peanuts showing sprouts over 1/8 inch long.
However, all sprouted peanuts, the separatedhalves of which show decay, shall be classedas damaged.
(d) Dirty peanuts where the surface is distinctly dirty and the dirt ground in. Thiscondition usually results when peanuts arerubbed in the machinery in the process ofhandling.
(e)' Wormy or worn injured peanuts-peanuts which show only slight and superficial worn injury with no frass around the injury shall not be considered as damaged.
(f) Peanuts shall not be considered as damagedwhich show a light yellow color or a slightyellow pitting of the flesh.
6. "Noticeably discolored skins." Peanuts which showdark brown discoloration, usually netted andirregular, affecting more than 25 percent of theskin, shall be classed as noticeably discolored.Peanuts which are paler or darker in color than isusually characteristic of the variety, but whichare not actually discolored, shall not be classedas noticeably discolored.
7. "Badly discolored skins." Peanuts which showbluish or black discoloration, affecting an areain excess of 1/2 of the surface in the aggregate,shall be classed as badly discolored.

I
I
, I ! !
I [
. I.
8
Conditions Affecting Consumptive Use
Many factors operate singly or in combination to influ-
ence the amount of water consumed by plants. These factors
are not necessarily constant but may fluctuate from year to
year as well as from place to place. The rate of consump-
tive use of water primarily depends upon the climate, soil
moisture supply, vegetation, and irrigation practices. A
summary of these conditions affecting consumptive use,
reported by Israelsen (11) is as follows:
The major factors included in climate that affect
consumptive use are precipitation, temperature, humidity,_
wind movement, and length of growing season. Differences
in temperature from year to year usually c,ause differences
in consumptive use; abnormally low temperatures may retard
plant development, and unusually high temperatures produce
dormancy. Increasing wind movement normally increases
evaporation; increased humidity and cloudiness reduce it.
Hail may damage crops and therefore reduce their rates of
transpiration.
The rate of transpiration depends upon the available
moisture supply. During the growing period of a crop, there
is a continuous movement of water from the soil into the
roots, up the stems, and out the leaves of the plant. If
the rate of evaporation at the leaves is for a brief period
greater than the rate of absorption by roots, wilting occurs
and the growth of the plant is impeded. On the other hand,
if the conditions are such as to stimulate excessive
transpiration, without also conveying substantial amounts

9
of plant food substances into the plant and favoring rapid
manufacture of food in the plant leaves, the available water
is not used efficiently. Evaporation from the soil surface
may be high if the surface is wet or if capillary water is
moving to the surface from a high ground water table. Depths
evaporated between successive irrigations during a particular
growing season decrease as the crop plants develop and the
shade increases in proportion to the soil surface.
The vegetative factors affecting consumptive use
include the type of vegetation, the stage of development of
the plant, its foliage, and the nature of its leaf. As the
leaf area of the pl�nts enlarges, the consumptive use
increases and reaches a maximum as the plants approach
maturity. The consumptive use drops rapidly as maturity
proceeds and the function of the plant is transferred from
vegetative growth to processes of ripening and reproductive
development.
Irrigation factors that influence consumptive use are
the size of the farm field irrigation layout, preparation
of the field for application, method of conveyance of the
water, and the method of water application. Plant diseases
and pests may reduce consumptive use by inhibiting plant
growth. Noxious weeds may affect consumptive use by increas
ing the foliage density or by reducing the area irrigated if
crops cannot be grown on infested areas.
Methods of Determining Consumptive Use
The principal methods of determining the consumptive
use of water by agricultural crops and natural vegetation

listed by Israelsen (11) are as follows: Tanks and
lysimeter experiments, field experimental plots, soil
moisture studies, analysis of climatological data, inte
gration method, and inflow-outflow for large areas.
A common method used to determine the consumptive use
10
of water is to grow the plants in lysimeters or tanks and
measure the quantity of water necessary to maintain desired
growth. Weighing is the precise means of determining the
consumptive use from tanks. The reliability of consumptive
use determinations by means of tanks or lysimeters is depend
ent on nearness of reproduction of natural conditions. Arti
fical conditions are caused by the limitations of soil, size
of tank, regulation of water supply and sometimes environment.
Measurements by soil moisture studies in field plots
are usually more dependable than measurements with tanks or
lysimeters. The procedure used is to measure the volume of
water applied to the plot at each irrigation and to measure
any appreciable runoff that may occur. Frequently the field
plots are bordered to prevent appreciable runoff and the
water is applied to shallow depths to prevent excessive
movement of water through the plant root zone.
Where the soil is fairly uniform and the depth to
ground water is such that it will not influence the soil
moisture fluctuations within the root zone, the consump
tive use of water by various crops may be determined by
intensive soil moisture studdes. This method consist of
taking representative soil samples by means of a standard
soil tube sampler before and after each irrigation with

I '
11
additional samples between irrigations. -If the area receives
no additional moisture between water content dete�minations
and the water movement in a vertical direction within the
soil is insignific�nt, the transpiration for each foot zone
of soil may be estimated. The water evaporation rates for a.
given period may be obtained by subtracting the transpiration
rate from the total water usage for the desired time interval.
The separation of transpiration and evaporation allows the
determination of a more accurate estimate of minimum con
sumptive use for each crop grown for maximum net return.
A method of determining consumptive use by the analysis
of climatological data is an empirical relationship adapted
to irrigation by Blaney and Criddle (2). It is expressed as
U = KF where U is.the consumptive use of the crop in inches
for a given time period, K is an empirical coefficient, and
Fis the sum of the monthly consumptive use factors for the
period-; (sum of the products of mean monthly temperature
and monthly percent of annual daytime hours). Measured
consumptive use studies permit a more accurate estimate of
the empirical coefficient K. The coefficient (K) for each
crop is based on the assumption that the crop receives a
full water supply throughout the growing season or frost
free period.
Harrold (10) reported that pan evaporation data corre
lated with consumptive use data determined by lysimeters may
be useful in developing soil moisture "bookkeeping" pro
cedures for farm use in scheduling the time and amount of
irrigation. Pruitt (15) has developed an "irrigation

12
scheduling guide'' by correlating pan-evaporation data with
consumptive use data for similar locality. The farm operator
would find the guide simple to operate once it was set up
for him by irrigation technicians.
Estimates of consumptive use for existing irrigation
projects are often made by the integration method. Briefly,
this method consists of adding the total quantities of water
consumed on different areas in the project and dividing by
the total area. To apply this method, data must be available
regarding total areas, acreages used in producing different
crops, areas of native vegetation, and areas of water and
bare land surfaces. Rates of evaporation and evapo
transpiration on the different areas also must be known.
When the rates of moisture consumption for different surfaces
have been determined by tank or field plot measurements,
estimates by the integration method are fairly reliable.
The consumptive use for large areas is often determined
by the inflow-outflow method. Applying the method, the con
sumptive use for the area is equal to the quantity of water
that flows into the area during a 12-month year, plus the
yearly precipitation on the area, plus the water in ground
storage at the beginning of the year, minus the water in
ground storage at the end of the year and the yearly out
flow. All volumes are measured in acre-feet.
Consumptive Use of Water by Peanuts
The only known report on the consumptive use of water
by peanuts is reported by Whitt and Van Bavel (20). Excerpts

13
from this report are as follows:
Most favorable climatic conditions for peanuts are moderate rainfall during the growing season and an abundance of sunshine and relatively high temperatures. Largest yields of good quality market peanuts are obtained on welldrained light sandy loam soils.
Ralph S. Matlock in studies at the Oklahoma Agricultural Experiment Station estimates that 25 inches of water are required in the growing season for optimum growth and yield of peanuts. W. J. Vinzant in �rials with farmers in Roosevelt County, New Mexico arrived at the same value. Measurements of daily water use have not been made. Workers at all experiment stations prefer to irrigate before the plants show signs of wilting. A good rule is to kee� the available moisture above 50 percent in the root zone . . .
Yield increases vary from state to state. In New Mexico and southwestern Oklahoma, irrigation means the difference between a crop and no crop. In Virginia, acre yield increases ranged from 944 pounds to 1365 pounds of nuts. Average production without irrigation was 1529 pounds compared with 2642 pounds per acre with supplemental water.
Depth of rooting estimates vary from two to four feet or more depending on the texture of the soil. Penetration to six feet has been reported of the light sandy soils of Georgia.
A summary of irrigated acreage of peanuts given in the
report by Whitt and Van Bavel is presented in Table I.
TABLE I
IRRIGATED ACREAGE OF PEANUTS (ESTIMATED FOR 1954)
State Acres Percent of Total
Oklahoma 10,000 7.2
New Mexico 5,600 100.0
Virginia 200 0.2
Consumptive Use of Water by Grain Sorghum
Bechett and Huberty (1) reported the seasonal water
requirements for Dwarf Milo for a four year period in the

Sacramento and San ,Joaquin Valleys of California. A sum-
mary of their results is presented in Table II.
TABLE II
·WATER REQUIREMENTS FOR DWARF MILO IN THE SACRAMENTOAND SAN JOAQUIN VALLEY OF CALIFORNIA 9 1910-1922
Year
1910
1911
1913
1922
Water Requirements for Maximum Yield (Inches)
17.4
28.8
26.7
30.2
Marr (12) reported that the water requirement for
14
Dwarf Milo grain sorghum in the Salt River Valley of Arizona
to be 27.3 inches for maximum yield. The average water
requir�ment for 21 fields tested was 25.5 inches.
Fortier (4) reported the water requirements of the
arid and semi-arid lands of the Missouri and Arkansas River
Basins. The water requirement of kafir corn was 21 inches
near Lawton, Oklahoma, in 1919. The water requirement was
determined to be 18 inches at Hays, Kansas, 1904. The
water requirement for Hays corresponded closely to the 17
inches determined from similar tests near Garden City,
Kansas. It was reported that the water requirement for
Garden City had increased to 30 inches in 1916.
The seasonal water requirements of the arid and semi-
arid lands of the Southwest was reported by Fortier and
Young (5). A summary of 16 tests on kafir corn determined
a range in the water requirements from 15.8 to 18.,5 inches

15
for maximum yield. In summarizing 35 tests with Milo grain --
sorghum i the water requirements for profitable yields were
found to range from 11.5 to 20.0 inches.
The most comprehensive experimentation to determine the
water requirements of grain sorghum was performed by
:McDowell (13) over a five year period in the Witchita Valley
of Texas. The water requirement for optimum yields for
conditions prevailing in the Wichi ts1 Valley was reported to
be 38 to 39 inches. The results reported by McDowell is
summarized in Table III.
TABLE III
WATER REQUIREMENTS FOR GRAIN SOHJJ&FGM LN 'Jl'HE W VALLE''.lr OF TEXAS 9 J.932-86
_ ter Requirement -·-·-·�- . Year ·�- -- "� ·� �--·Q12.t:bffsJ:�·� :z:i���+_d, (;[]Lci�es}i -··-----
1932 23,6 to 32.6
1933 27,6 to 33,6
1934 30.8
1935 33,3 to 37 ,3
19:36 5L8
Musick (14) reported the seasonal consumptive use by
grain sorghum for El Reno, Oklahoma, 1954 1 to be 21.91
inches, The 1954 growing season in Oklahoma was unusually
hot and dry,
One of the most important and difficult problems that
faces farmers, engineers, and scientists in irrigation
areas is to determine when and how :much water to a.pply

16
to the soils for best crop production. A measure of the
amount of available moisture in the soil at a given time is
essential in the scheduling of irrigations and determining
the amount of water to be applied.
Taylor (17) lists several methods of measuring the
soil moisture content. A comparison of those listed shows
that none of the presently available field methods are
completly satisfactory. The methods reported by Taylor are
(1) tensiometer studies, (2) the use of electrical resist-
ance units, (3) neutron method, and (4) gravimetric method.
Electrical resistance blocks have been made of various
kinds of plaster, nylon, fiberglass, and plaster blocks with
nylon and fiberglass around the electrodes.
Baise (8) discusses the use of nylon blocks in soil
mo1sture studies. A summary of this report is as follows:
Nylon blocks provide greater sensitivity in the higher
soil moisture ranges than do the previously used plaster of
paris blocks.
One objection to the use of nylon blocks in the field
arose from imperfect contact with the soil alternately wet
and dry. The outside metal apparently prevents intimate
contact between the moisture absorbing fiber and the soil
particles. The response of the unit to moisture. changes in
the soil is often erratic and unreliable under such con-
dJL tions.
Another method being tested in determining the soil
moisture content is the use of an Aquaprobe. Its principle
of operation is based on the relation between the soil

moisture content and the amount of electrical current the
soil wi.11 conduct,
17

CHAPTER IV
METHOD AND PROCEDURE
Location of Experimental Area
The Fort Reno Livestock Research Station, near El Reno,
Oklahoma, was selected as the location of the experimental
plots. The plots were located on a Canadian loam area.
The following soil description was made 700 feet south
and 300 feet west of the actual plot area. (Personal com
munication with Harry Galloway, USDA, Stillwater, Oklahoma):
Oto 15 inches: Grayish-brown loam which is finely
granular, friable, and permeable with a pH of 7.0. The upper
portion is slightly lighter in color than that below 6
inches. It grades to the layer below.
15 to 24 inches: Brown loam, which is like the layer
above, becomes slighfly lighter in color in the lower part
and grades to the layer below.
24 to 42 inches: Light brown weakly calcareous loam
slightly stratified with fine sandy loam and silt loam.
Below 42 inches: A reddish brown silty clay loam
layer which is moderate medium subangular blocky; finer and
less permeable than the layers above. It is streaked with
thin white seams of calcium carbonate. Lower layer varied
in depth and may be absent in places in adjacent field.
18

19
Equipment Used
Water was pumped from an irrigation well located 200
feet north of the plot area, piped to the area in a 6 inch
main line, and applied to the furrows by the use of gated
pipe. An orifice flow meter &nd recorder were used to mea
sure and record the rate of flow. A gate valve on the pump
discharge was used to regulate the flow. The electric motor
and pump unit, orifice plate flow meter and recorder, and
gate valve are illustrated in Figure 1. An official rain
gage located adjacent to the plots was used to measure the
rainfall.
Moisture samples were taken by the use of a standard
soil sampling tube and a post-hole auger sampler. The sam
ples were dried in an electric oven. Apparent specific grav
ity samples were taken with a sharpened cylindei soil
sampler.
Fertilizer was applied to the plots by the use of a
Planet Junior Fertilizer Applicator. A one-row tractor
cultivator was used to cultivate the plots.
The peanuts were dug for harvest by a semi-disk digger
mounted on a 'one-row tractor cultivator and threshed by the
use of a mechanical peanut picker modified for plot work.
Standard peanut grading sieves were employed in determining
the size of peanuts. The grain sorghum was threshed by a
small grain plot thresher.
Additional equipment used in this study was an Aqua�
probe, Bouyoucos bridge, and 54 nylon blocks.

Figure 1. Electric motor and pump unit, orifice flow meter and recorder, and flow regulating gate valve.
Plot Layout and Treatments Used
The peanut plots were laid out in a randomized block,
20
split-plot statistical design to permit statistical analy-
sis of the yield for the selection of optimum water and
fertility treatment. The plot layout of peanuts is shown
in Figure 2. Eight-row main plots, 50 feet long, and four-
row sub-plots, 25 feet in length, were selected for the
peanuts. The selection of eight-row plots permitted the
harvesting of the six center rows of the main plot without
significant border effects due to either water or fertilize�
Three replicates were selected and blocked in the layout.
Treatments were randomized within each block.
The grain sorghum plots were laid out in a completely
randomized statistical design. The layout of these plots is
illustrated in Figure 3. The size of the main plots and sub-
plots was the same as used for the peanuts. The four middle
rows of the main plot were selected for yield sampling.
f

21
R ep I R ep II R ep III
F Fl
FO
F3
FO
Fl 2
lA,� ... _
'IA ,
I� .1. IV
FoF3 F2
F1 - F2F3
F3 F2 Fl F2F2
F1
'IA , 'IA,� u,_
'""' IV
Fl
FO
FO
F3F
O F3
FlF3 Fo
I FlF2
FlJ.,'IA�
'IAI, v ·�
FoF2
F2 I F3 FoF3
i
F2 Fo FoI F3 F1 F2
'IA ..... Wn '!Al ....
Iv , .....
F1 F3 F2 I F1 Fo F3
Wo= No irrigation
Wl= Irrigate after plant has wilted one week
W2= Irrigate after plant has wilted 24 hours
W3 = Maintain soil moisture above 30 percent of available
moisture
Fo = No fertilizer
F1 = 50 pounds of 6-24-24 per acre
F2- 150 pounds of 6-24-24 per acre -
F3 = 300 pounds of 6-24-24 per acre
Figure 2. Layout of peanut p 1 ots.

Fo
F3
Fo
F3
Fo
Fl
F2
F3
WO
=
W1 =
W2 =
W3 --
Fo=
F1=
F2 =
f3 =
--..
F2 Fo F1 F1 Follr,., W- 11 -
v \]
F F F F F 1 2 3 2 3
Fl F2 Fo Fl F3
li - w,., v � ,&, J..
F2 F1 F3 F2 Fo
'�
F2 F3 Fo Fo FlWn \'fo.
,-
F3 FlF2
F3 F2
Fl F2
F3 F2 F3
Tilr ... Tllr
' 1 "l 3
FO
Fl
FO
Fl
I
FO
No irrigation
Irrig_ate after plants have wilted for one week
Irrigate after plants have wilted for 24 hours
Maintain soil moisture above 30 percent of availablemoisture
No
100
200
400
fertilizer
pounds of 13-13-13 per acre
pounds of 13-13-13 per acre
pounds of 13-13-13 per acre
Figure 3. Layout of grain sorghum plots.
22
Crop Management Procedure
The grain sorghum variety, Dwarf kafir 44-14 was
planted on June 6. The third planting of an experimental
peanut strain, Spanish 13-10, was made on June 27. Two
earlier attempts to establish a stand had failed due to
weather and mechanical difficulties.
The stand of peanuts was approximately 27,000 plants
per acre. The average plant spacing was 5.8 inches. The
grain sorghum was planted to a stand of 30,000 plants per
acre with an average plant spacing of 4.3 inches.
23
Fertilizer was applied in the same manner to both crops.
It was applied on the south side of each row, 2 to 4 inches
from the seed, and 1 to 2 inches below the ground surface.
All of the rows within the plots were fertilized. The
peanut plots were fertilized at various rates of 6-24-24 on
June 14, soon after the date of the first planting. The
grain sorghum plots were side dressed on July 13 with
various rates of 13-13-13.
Irrigation Procedure
Irrigation water was applied to the plots through gated
pipe. Furrow irrigation was used with borders built around
each plot. The method of water application is illustrated
in Figure 4. All water was held on the plots, except for
negligible losses that occasionally occurred as a result
of breakovers. Since the plots were located near the
irrigation well, only minor losses occurred due to leakage
in the main line. Three inches of water per application
were applied to each crop at the rate of 3 inches per hour.
v

Figure 4. Furrow irrigation with gated pipe.
A high rate of application was selected to minimize dif-
ferences in water penetration along the rows. The infil-
tration rate varied from 0.25 inch per hour early in the
growing season to 0.10 inch per hour in the latter part
of the season. The slope of the plots was negligible.
The time to irrigate the w3 plots was determined by
comparing the soil moisture percentage of the top foot of
24
soil depth with the permanent wilting point. The permanent
wilting percentage, determined by soil moisture sampling
when the grain sorghum plants in the check plots were in
the permanent wilting stage, was found to range from

25
6.5 to 7.5%. The soil water content in the peanut plots
was never sufficiently low to permit the determination of the
permanent wilting point for the peanuts.
Water was applied to the W2 plots 24 hours after
noticable temporary wilting occurred. Difficulty in main
taining plant wilt for a period of one week in the w1 plots
arose due to the occurrance of rainfall during the week when
the plants were wilting. If the rainfall during the week of
wilt was appreciable, the quantity of water, equal to three
inches minus the amount of rainfall, was applied one week
after the wilting period began.
Soil Sampling Procedure
Soil samples were taken before and after each irriga
tion. When the soil had approximately reached field capac
ity, usually two to four days after the water had been
applied, soil samples were taken to determine the amount of
water in the soil at each depth sa�pled. Additional samples
were taken between the date when field capacity was reached
and prior to the next irrigation as time permitted.
The two middle rows in each water treatment of the east
replicate were used as representative of the plot area for
soil moisture sampling. Soil samples taken within each
water treatment were offset approximately 5 feet from the
center of the water treatment. Rotation of the side of row
and direction from the center of the water treatment to be
used as the soil sampling site, was employed to minimize the
effect of the hole made in the soil adjacent to plants by
the soil tube sampler. Profile samples were taken with

26
either a soil tube sampler or a post-hole auger at the center
of 1 foot intervals to a depth of 3 feet at each site. Gray
(6) lists the feeder root depth for grain sorghum as 2.5 feet.
The same feeder root depth was estimated for the peanuts.
Soil samples were taken 1 to 2 inches to the side of the row
as the plant spacing within the row did not always lend
itself easily to sampling in the row.
Samples used in water content determinations were.
placed in airtight containers and weighed shortly after col
lection. Each sample was dried in an electric oven at 105
to 110 °c·for a minimum of eight hours and the dry weights
determined. The water content of each sample was expressed
as percentage of oven-dry weight of soil.
The undisturbed core samples for the appa.rent specific
gravity determinations were taken with a sharpened cylinder
sampler. Three samples were collected at approximately the
center of each foot depth of soil at each crop location.
The real specific gravity was determined by the use of a
150 ml. pycnometer bottle. The core samples used in the
apparent specific gravity determinations were also used for
the real specific gravity determinations. The real specific
gravity did not vary appreciably. A summary of the appar
ent specific gravity values, real specific gra¥ity, and the
calculated and estimated values of field capacity and tem
porary wilting point is presented in Table XVI of Appendix
B.
�tudy of Nylon Blocks
Nylon blocks were located in the row at the center of

27
each one foot interval to a depth of 3 feet. Each block was
located within one foot of a soil sampling location. A
small quantity of water was added to the soil at each block
location previous to the block placement. Water was added
to �rovide close contact between the blocks and the soil.
A time interval of three weeks between the placement of
the blocks and the bridge readings was allowed to permit
soil moisture equilibrium in the surrounding area.
The electrical resistance in each block was determined
· by th� use of a Bouyoucos bridge. Bridge readings were
observed soon after the soil moisture sample had been obtain
ed for each block location.
Aquaprobe Study
Aquaprobe readings were obtained at the soil moisture
sampling locations. Since the orientation of the instrument
affects the dial readings, it was oriented in the same
direction for each reading.
Crop Yield Sampling Procedure
Fifteen feet of each of three rows nearest the center
of the water treatment were taken from each peanut sub-plot
on December 1. The disc cut the peanut vines at a point on
the plant between the location of the peanuts and the lower
plint root development. After the peanut vines were cut,
most of the soil was removed from the peanuts by shaking the
vines. The vines from each 15 feet of row were tied into a
bundle and labeled.
The peanuts were threshed when adequate drying of the
vines had occurred. The vines in each bundle were counted

! 28
at the time of threshing. All sticks and other foreign
material were removed before weighing. The cleaned quantity
of peanuts was then placed in a paper bag, weighed, and 20
double-seeded peanut pods were taken at random from each
bag. These samples were used in determining the shelling
percentage of each 15 feet of row sampled. After the
peanuts of a sample were hulled, they were passed through
slotted peanut hand sieves. The number and weight of the
peanuts collected on each sieve were recorded. Also, the
number and weight of any peanuts which were discolored were
recorded. The shelling percentage of each sample was
expressed as the percentage of sound mature kernels, based
on the total weight of sample extracted (peanut hulls
included). Yield of peanuts was expressed as the weight in
P?unds per acre of sound mature kernels.
The grain sorghum heads were harvested from 15 feet of
each of three rows nearest the center of the water tre�tment
in each sub-plot on October 12. The samples were air-dried
for approximately two weeks, threshed by the use of a college
plot thresher, and weighed to the nearest 1/10 gram. Yields
were expressed as bushels p�r acre.
Procedure for Calculations
The average daily consumptive use of water between
irrigations for the three foot root zone was determined for
both the'pt?ann:ts !:!,nd'grain sorghum. Copsumptiv.e use for
each foot of soil could be determined only for the peanuts
due to difficulties encountered in properly determining the
time interval between soil samplings in the grain sorghum
plots. The basic formula, normally used in transpiration
29
calculations, was used in determining the moisture depletion
by peanuts from each foot of soil for the 3 foot root zone
depths. The formula used is as follows:
d = P As D "loO
where d = depth of soil moisture depletion in inches,
P = difference in percent of soil moisture between
two determinations,
As = apparent specific gravity of the soil, and
D = depth of soil sampled in inches.
This formula may be used in the determination of the
transpiration between two soil samplings only when no water
has been added between samplings to the depth of soil sam-
pled. The addition of water to this depth may occur as
gravity or capillary water. Since rainfall between soil
samplings in each crop nullified the transpiration data in
several instances, values for the consumptive use between
samplings were used. The spacing of the soil samplings in
the peanut plots was adequate to permit the estimation of
the percent moisture used from each foot of soil during the
growing season. The consumptive use between samplings
was determined by adding the moisture depletion from the 3 ·
feet of soil sampled to the amount of rainfall that occurred
for the time interval. Values of consumptive UE;le by peanuts
for each foot sampled were calculated using the percent
of seasonal moisture depleted from each foot of soil
sampled.

30
The yields were analyzed statistically for each crop
according to standard ana.lys is procedure, The new multiple
range test for significant difference between water treat-,,
ment means of grain sorghum yields was run at.the 1% level.

CHAPTER V
RESULTS
Yield and Consumptive Use for Peanuts
The peanut yields in pounds per acre for the water and
fertility treatments are summarized in Table IV. Also in
cluded in this table, is the yield increase per acre-inch of
irrigation water applied. A statistical analysis of the
yield to determine if significant differences existed be
tween water treatments, fertility treatments, and their in
teractions is presented in Table V. The only significant
difference that was obtained was the water and replication
interaction. This interaction was highly significant at the
0.1% level.
Standard error for means, standard error for difference
between the means, and coefficient of variation values are
listed in Table VI.
The relation between water treatment and crop yield for
each fertiljty treatment is illustrated in Figure 5. Figure
6 illustrates the relation between fertility treatment and
crop yield for each water treatment. Although no signifi
cant difference between the water treatments was obtained,
it should be noted that there was an increasing crop response
to fertilizer at the higher water level (Figure 5). Since
the results obtained in this experiment did not define the
31

32
TABLE IV
PEANUT YIELDS IN POUNDS PER ACRE
.l''ert i1 i ty Water Treatments Treatments
Wo W1 W2 W3 Means
Fo 932 963 835 811 885
Fl 895 867 686 1010 864
. F2 1106 852 780 1170 977
F3 946 708 696 1068 854
Means 970 847 749 1015 895
Irrigation Water Applied 0 8. 50 11. 50 17. 50
Inches Yield Increase Per Acre-Inch -14.5 -19.2 2.6 of Irrigation
---
Water Applied
TABLE V
ANALYSIS OF VARIANCE OF PEANUT YIELDS
Source d.f. M. s. F p
Replications 2 18,787
Water 3 425 1 697
Fertilizer 3 91., 766 1.93
Water x· Rep. interaction 6 684 1 616 14.4 .001
Water x Fert. interaction 9 86,024 1.80
Fert. x Rep, interaction 6 59,332 1.24
. x 18 47,702

TABLE VI
STANDARD ERROR FOR MEANS, STANDARD ERROR FOR DIFFERENCE BETWEEN MEANS, AND COEFFICIENT OF
VARIATION FOR WATER TREATMENTS
Statistic
Standard Error Mean 63.05
Standard Error Difference 89.16
Coefficient of Variation 15.6%
the peak crop response to water, higher levels of water
application are necessary to obtain the consumptive use of
water by peanuts for optimum crop yield.
33
The size of vine development during the latter portion
of the growing season is illustrated in Figure 7. The dif
ference in color between the plots shown is due to the dif
ference in e�posure of the film and not due to differences
in the effect of the water and fertility treatments upon the
plants. No apparent difference in vine growth between
treatments was noted at any time during the growing season.
The plants receiving the higher water level treatment were
not as green in appearance near maturity as were those in the
check plots.
The shelling percentage of the peanut yields based on
percent by weight of sound mature kernels is given in Table
VII.
Freezing temperatures in late October and early
November stopped the physiological growth of the plants. At
this time, many of the nuts had not fully matured. Late

6000
5600
� 5200 p::
t; •
e,.. 4800 lz.t i.r.,
p:: re 4400
� c,
:z. 4000 1-1
A
3600
3200
i i' I
2800
\ -----
---- ' \-�
\
\ '
'-, Fo' '
\__ F3 ---
WATER TREATMENT
34
Figure 5 ·. Relation be tween water treatment and crop yield of peanuts for each fertility treatment.

p::
� . E-t � lO
� p:: r:'.I llt rn
p:: c., z 1-1
r::<l 1-1
?-4
6000
5600
5200
4800
4400
4000
3600
3200
3000
/"'-,"'-)/ /
'-
, '�/ . " I "-
/
Wo /
I " ' ' / '
I " I
I "
I
-r , -------I
- ---ff' �wl
/
�
�
�
Fo
FERTILITY TREATMENT
Figure 6. Relation between fertility treatment and crop yield of peanuts for each water treatment.
35

Wo plot of Rep II in foreground
w3 plot of Rep I in background
w1
plot of Rep II in foreground
w2 plot of Rep I in background
Figure 7. Peanut plots during the latter portion of the growing season.
36

.
TABLE VII
SHELLING PERCENTAGE OF PEANUT YIELDS BASED ON
PERCENT BY WEIGHT OF SOUND MATURE KERNELS
Water
Fert1l-
Tr.eatment '
.
Replication izer Wo w1 W2 W3 Means Treat-ment i
FO l 71. 6 64.0 61.5 68. 7 ' 66.4
1 F1 I 71.0 61. 6 .59.3 67.9 64.9
F2 73 .8 59 .'l 6i. 7 71.6 66.5
i F3
70 .. 2 59 .6 63.8 73 .9 66.9
I,
71. 7 61.1 61.6 70 .1 66.1 Means I I
I FO
73.3 61.6 65.0 68.0 67.0 I
I
I
2 I F1 70.6 66.3 65.6 68.0 67.6
F2 77.2 66.5 61. 7 68.4 68.4
I F3 72.2 63. 6 65.4 68.9 67.5
Means 73.4 64.5 64.4 68·.3 67.6
Fo 't 66.4 74.0 71.4 64.8 69.2
3 F1 1. 68.5 66.6 73 .2 64:1 68.1
F2 64.7 70.7 69. 5 .6i .2 66.5
F3 66.3 70.4 72.4 63.9 68.2
Means 66.5 70.4 71. 6 63. 5· 68.0
Means 70. 5 65.3 65.9 67.3 67.2
37
,.
-

maturity was primarily due to the late establishment of an
adequate stand of peanuts.
38
Average daily consumptive use curves are presented in
Figure 8. Data on the consumptive use by peanuts and grain
sorghum are summarized in Table VIII. The net irrigation
requirement for the w3, w2, and w1 plots was 17.50 inches,
11.5 inches, and 8.5 inches respectively.
Yield and Consumptive Use for Grain Sorghum
The grain sorghum yields in bushels per acre for the
different water and fertility treatments are summarized in
Table IX. The yield increase per acre-inch of irrigation
water applied is also included in this table. A statistical
analysis of the yield to determine if significant differences
existed between water treatments, fertility treatments, and
their interactions is presented in Table X. The difference
in the mean yield for water treatments was highly signifi
cant at the 0.1% level. The new multiple range test for
significant difference between water treatment means at the
1% level is presented and explained in Table XI. Differences
between fertility treatments and the interaction of the water
and fertility treatments were not significant.
Standard error for means, standard error for difference
between the means, and coefficient of variation values are
given in Table XII.
The relation between water treatment and crop yield for
each fertility treatment and the relation between fertility
treatment and crop yield for each water treatment is illus
trated in Figures 9 and 10 respectively.

rm
go;: :;,.c 0< MA e-s, cr:i:r:n O Pi1! ,-n� �o �:z. P« 1-f. < :z. (;,;1
tJ 8 p;tgQ:�00.::>,
� ..... E-s Ill �en :z.0u:>i ..:le.....< �:
!:-.:+ 0 < i:t::. � <
.500
.400
.300
.200
� .100
/
11'3
e
--- .......... "" "' .,,,./ '\.
,// , \.,, \ /
\ /
� e ' /'/
---�, /
----� ,,/" ---
•1 "� / -----
-"� / ---- " ./ ----
'
::::,....� � ----- JC:
".;;: '9 6
July August September October
o1 I I I I i 11 I 1 11 l 11 21 31. 10 20
DATE
30 9 19 29. I 9
F'igure 8. Average dail.y consmapti:ve. use curves :for peanuts, Ft. Reno, Oklalloma, 1955. w
(0

Crop and Treatment
Peanuts
Grain Sorghum
TABLE VIII
SUMMARY OF CONSUMPTIVE USE OF WATER BY PEANUTS AND GRAIN SORGHUM
Peak Daily Date of Consumptive Peak
Use Consumptive Inches Use
W3 0.420 Aug. 25-Sept. 2
W2 0.215 Aug. 16-Sept. 2
Wl 0 .153 Aug. 25-Sept.16
W3 0.367 Aug. 16-Aug. 25
W2 0.281 Aug. 20-Sept. 2
W1 0.121 Aug. 12-Sept. 2
Average Daily Consumptive
Use for Irrigation
Season ( Inches) -
-
0.197
0.146
0.120
0.191
0.167
0.112*
Peak Monthly Consumptive
Use Inches
9.94
5.02
2.96
8.48
7,48
3,41
Seasonal Consumptive
Use Inches
23.21
17.25
14.17
24.07
21.07
16.95
*The consumptive use value between June 13 to 22 was deleted due to excessiverainfall for that period.
� 0

41
TABLE IX
GRAIN SORGHUM YIELDS IN BUSHELS PER ACRE
1''ert11i ty Treatments Water Treatments
Wo W1 W2 W3 Means
Fo 33.5 55.3 ·53. 5 46.8 47.3
Fl 30.9 47.3 48.1 48.7 43 .8
F2 27.2 50. 7 52.7 45.1 43.9
F3 38.2 49.9 53 .2 45.4 46.6
Means 32.4 50.8 51.9 46.5 45.3 Irr1gat1on Water Applied 0 3.38 7.50 13. 50
Inches Yield increase
I per acre-inch 5.44 2.60 1.04 of irrigation --
water applied :
TABLE X
ANALYSIS OF VARIANCE OF GRAIN SORGHUM YIELDS
Source d.f. M. s. F p
Water treatments 3 3,271,947 9.01 .001
Fertilizer treatments 3 137, 048
Water x Fertilizer 9 97,010 i r i �.,.-
Error 32 437,996

TABLE XI
THE NEW MULTIPLE RANGE TEST FOR SIGNIFICANT DIFFERENCE BETWEEN WATER TREATMENT MEANS OF GRAIN SOR-
GHUM YIELDS AT THE 1% LEVEL.
Water Treatments Wo W1 W2 W3
Means 1892 2713 2962 3027
Note: Any two means not underscored by the same line are significantly different at the 1 % level.
Any two means underscored by the same line are not significantly different at the 1% level.
TABLE XII
42
STANDARD ERROR FOR MEANS, STANDARD ERROR FOR DIFFERENCE BETWEEN THE MEANS, AND COEFFICIENT OF VAR-
IATION FOR WATER TREATMENTS
Statistic Grain Sorghum
Standard Error Mean 191.05
Standard Error Difference 270 .17
Coefficient of Variation 25.0%

� .
E-t l'z.t
i::c:
rn
c:.:,
z "'""
i:..:i
rn
z "'""
ffi
. I
10400
9600
·880
-
800
720
640
560
480
Wo
WATER TREATMENT
Figure 9. Relation between water treatment and crop yield of grain sorghum for each fertility treatment
43

-�i:i::�C)
•
i:i:: rz:I f:l4
. ::;!
i:::i
1-1
?of
� £3 � rlJ
z
�c,
44
10400
9600 W2
wl
8800 � - --,c
�
8000 �-
7200
/ 6400 / /
/ - WO
/
/-
...:..._ 560-0/
............ / ..........
............
/ ............
4800 "'--vi
4000·
Fo
FERTILITY TREATMENT
Figure 10. Relation petween fertility treatment and crop yield of grain sorghum for each water treatment.
0
I'

45
The appearance of the grain sorghum plots near
maturity is illustrated in Figure 11. No appreciable dif
ference was noted between the appearance of the w3 , W2, and
w1
plots as the plants approached maturity. However, con
siderable difference in plant growth and yield was present
between w0
and the other treatments.
Considering the results presented in the new multiple
range test and the appearance of the plots near maturity,
the W1 treatment was selected as the water treatment for
optimum yield of grain sorghum where the water supply is
limited. Temporary wilting of the plants for periods not
exceeding one week did not significantly decrease the yield.
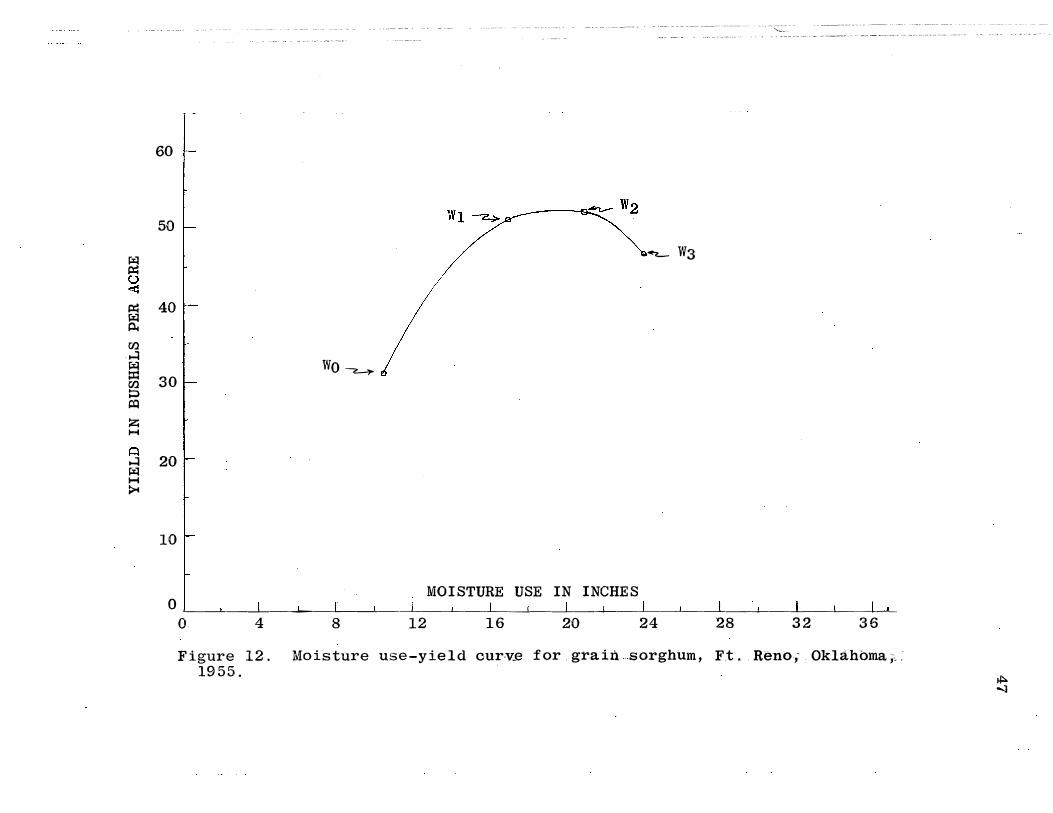
The slope of the moisture use-yield curve, Figure 12,
between treatments W1 and w2 also illustrates this fact.
The average daily consumptive use curves are presented
in Figure 13 . These curves illustrate the rate of consump
tive use for each water treatment throughout the growing
season. The peak daily consumptive use occurred during the
period of August 16 to 25 for W3 and between August 20 and
September 2 for w2. The peak daily consumptive use for the
W1 plots was not clearly defined as the rate of consumptive
use did not change appreciably throughout the growing season.
Data on the consumptive use by grain sorghum is summarized
in Table VIII. The peak daily consumptive use, average
daily use for irrigation season, monthly use, and the
seasonal use was calculated to be 0. 121 inch, 0 . 112 inch,
3.41 inches, and 16.95 inches respectively for optimum
yields for a limited water supply. The irrigation water

VJ ()
Vi�
i:·igure 11.
W1
Vv3
Grain sorghum plots near maturity
',. � O')
�i:i:::
60
50
i:t: 40 re ll.l . ...:i�� 30 p t:Q
z 1-4
..:i 20 � 1-4 >t
10
Wo�
MOISTURE USE IN INCHES
-----�-. "'---·-
,� W3
0�__._�_._�-4---������_,_������_,_������----�����---o. 4 8 12 16 20 24 28 32 36
Figure 12. Moi-sture use-yield O·ur-v.e for_ grain ,sorghum, Ft .. RE:�no,;, Oklahoma;,.: 1955.
ii::,.. -.}

rtJ z l>c
8 ;:§ e-i, < rtJCJ ra:1H::C:
��1-41-4
z ra:1
�E-t�(::1:1. rtJ l:)
�1-4
E-t
�rtJ z 0 Q
>c ..:I1-4
cS �iii g: <
.400
.300
.200
.100
JtJf
. f;y'
A\
W3 --&-.,,,,- -.......
/ . ......... ./ ""
.,,, ,,,.- W2
"'
./ --� " / � ............ " / ---- .. .......... '\,
// .,,,.,,,_... ............... " � �
___,,,� " -� ---
' ---"''
W1 1,�
June July.
�-A
August s�p;te)Jlne� ,·>
OJ.....--�__,..!-...L�--,;!;-�����----:::�..J._�-::��--:-::----:--�--:::::;----..1.-�-::-���::--��18 28 · 8 18 28 7 17 27 6 16 26
DATE
Figure 13. Average daily consumptive use curves for grain sorghum, Ft. R�no, Oklahoma 1 1955.
��

49
applied for this treatment was 6.38 inches. The wa�er was
applied in one 0.50 inch, one 1.00 inch, and ·two 3 inch
applications. The 0.50 inch and 1.00 inch applications were
applied early in the growing season.
A comparison of the consumptive use for.1955 and that
determined by Musick (13) for 1954 illustrates the effect of
climatic conditions on the consumptive use by grain sorghum.
Musick reported the consumptive use by grain sorghu� f�r
1954 as 21.91 inches. This value was determined for the
w-11.t 24 hours :treatment. Considerable difference ocqurred
in the total days of plant wilting in the Wo, W1, and the
W2 treatments between 1954 and 1955. This difference was
prima.rily due to vast differences in climatic conditions
between ·the .two growing seasons. The consumptive use of
wate� by grain sorgh�m, calculated by the empirical method
f:rom climatological data by G�rton and Criddle (6), was
21.12 inches .for Fort Reno, Okl�homa, 1955. The net irri-
gation requirement was 10.55 inche�.
Soil Moisture Extraction Pattern
The percent of total soil moisture depletion by peanuts
at one foot intervals is presented in Table XIII.
A study of moisture-extraction data was reported by
Shoc�ley (16). In the report of this study, Sho6kley
stated the following:
The study included such irrigated crops as alfalfa, cotto�, potatoes, sugar beets, corn, wheat, .barley, soighum, flax, soybeans,' guar, grapefruit, oranges, 'dates, and pears grown in soils varying in texture from loamy fine sands to silty clay loams, and varying in depth from. less than 3 feet to around 10 feet.

50
From an evaluation of all the available moistureextraction data, the conclusion was reached that practically all irrigated crops had a common moisture-extraction pattern even though the soil varied widely in texture or depth. The pattern which developed indicated that, of the total moisture extracted from the soil by the crops, about 40 percent came from the upper quarter of the root zone, 30 percent from the second quarter, 20 percent from the third quarter, and 10 percent from the bottom quarter (Fig. 1). Individual crop values in general were within 10 percent of the figures.
Using the data reported by Shockley, 50 percent of the
total moisture extracted from the soil by the crop came from
the upper third of the root zone, 33 percent from the
middle third, and 17 percent from the bottom third. The
results of the study on peanuts compare favorably with those
presented by Shockley.
TABLE XIII
RELATION OF SOIL MOISTURE USAGE BY PEANUTS AT ONE FOOT INTERVALS OF THE ROOT ZONE DEPTH
Soil Depth in Feet
0 - 1 I 1 - 2' 2 - 3' Treatment
0 0 %
63.6 21.6 14.8
46.4 32.6 21.0
58.1 31.0 10.9
Variation in the extraction pattern existed between
the different water treatments. One cause of this varia-
tion was the different depth of water penetration. The depth
of penetration depends upon the soil moisture content of
the soil when the water is applied. Another cause of
variation was probably due to the difference between treat-
ments in the water holding capacity of the soil.

51
Climatological Data
Climatic factors have considerable effect on the rate
of consumptive use of water by crops. These climatic
factors can either increase or decrease the rate of consump
tive use within hours after a change has occurred in the
climatic conditions surrounding the crop. It is estimated
that. the consumptive use for the 1955 growing season would
be a minimum since the temperatures during this season were
considerably lower than usual. Climatological data for the
1955 growing season are presented in the following tables
in Appendix C.
Table XVII. Precipitation data for Fort Reno,
Oklahoma experimental plots of peanuts
and grain sorghum, 1955.
Table XVIII. Monthly climatological precipitation data
for Fort Reno, Oklahoma, 1955.
Table XIX.
Table XX.
Table XXI.
Table XXII.
Average monthly relative humidity May
November, 1955, Oklahoma City Airport,
Oklahoma City, Oklahoma.
Maximum and minimum daily temperatures,
El Reno, Okiahoma, May-November, 1955.
Daily evaporation and wind velocity for
Lake Overholser, Oklahoma, May-November,
1955,
Total daily solar radiation in gram
calories per square centimeter, May
November, 1955, Stillwater, Oklahoma.

Observations Made'With Nylon Blocks and Aquaprobe
The data obtained with the nylon blocks and the &qua
probe gave inconsistent results.
Table XXIII of Appendix D ·gives the data collected on
the nylon blocks. Figure 14 illustrates the relation
between the bridge readings and the corresponding soil
moisture content determinations.
The Aquaprobe readings and soil moisture data is
presented in Table XXIV of Appendix E. The results of the
AquaprO'be study are shown.in Figure 15.
52

6
5
z 1-1
i:il 4
8 1-l
§3
� = E-1 �--1 i:r.::
t!:,
..:I
3
0
·Figureand
0
0
0
0
0 0
0
0
4 8
SOIL MOISTURE
0
0
0
0 0
0
0
0
0 0
0
00
0
0 'o 0
00
0
0
0
0
0
0
0
0
0
0 0
0
0
0
0
0 0
0
0
0 0
0 0 0 0
0 0 0 0 0
0 0 0 0 0 00 o O O
O o0 8 0 0 s,
oo 0 0 0 0
0 1)0 0 0 0 0 0 0
0 0
0 0 0
0 0
0 0
12 16
CONTENT IN PERCENT
53
O'
0
0
0
0
0
0
20
14. Relation between soi.1 moisture contentbridge readings for nylon blocks.

10
17.l
� 8 1-4
Q �
� < 1-l
Q 6
r.::f
�
� CY
. ' � 4
2
0
0
0 0 0
8
ogo ��"'
1' 0
0
12
00 00
°
16
�
SOIL MOISTURE CON'l'EN'f IN PERCENT
54
0
0
20
Figure 15. Relation between soil moisture content and Aquaprobe dial riaadings.
CHAPTER VI
SUMMARY AND CONCLUSIONS
The consumptive use data for optimum yields of peanuts
and grain sorghum for a limited water supply wa� determined
for Fort Reno, Oklahoma, 1955, by the field plot and soil
moisture depletion method. The effect of v&rying the amount
of fertilizer application upon the yield of each crop and
the soil moisture extraction pattern by peanuts with rela
tion to the depth of root zone were obtained.
A close correlation was obtained between the data
collected on the consumptive use of water by grain sorghum
for 1955 with that obtained in 1954 for the same area.
The following conclusions were made from this study for
investigation procedure and conditions previously stated.
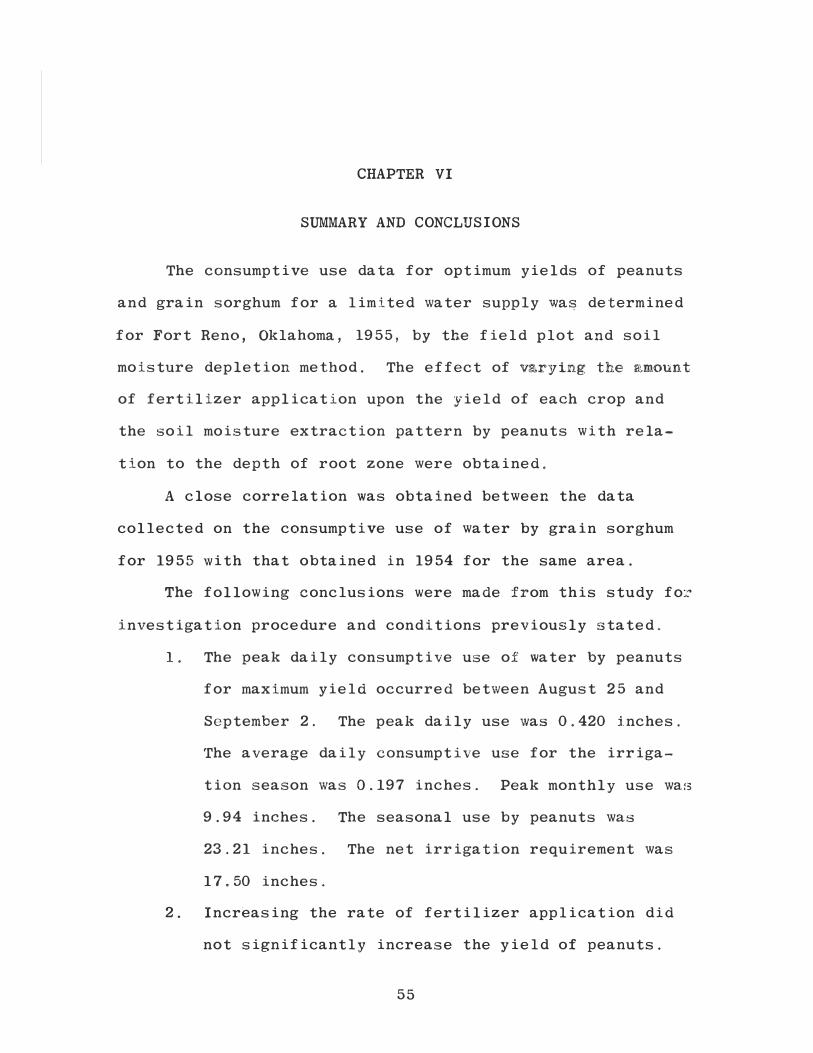
1. The peak daily consumptive use of water by peanuts
for maximum yield occurred between August 25 and
September 2. The peak daily use was 0.420 inches.
The average daily consumptive use for the irriga
tion season was 0.197 inches. Peak monthly use was
9.94 inches. The seasonal use by peanuts was
23.21 inches. The net irrigation requirement was
17.50 inches.
2. Increasing the rate of fertilizer application did
not significantly increase the yield of peanuts.
55

56
3. An increasing response to fertilizer by peanuts was
noted at the higher level.
4. The percent of total soil moisture extracted from
each foot of root zone by peanuts was as follows:
58.1 percent from first foot, 31.0 percent from the
second foot, and 10.9 percent from the third foot.
5. The peak daily consumptive use of water by grain
sorghum for optimum yield and limited water supply
occurred between August 12 and September 2. The
peak daily use was 0.121 inch. The average daily
consumptive use for the irrigation season was
0.112 inch. The peak monthly use was 3.41 inches
and the seasonal use was 16.95 inches. The net
irrigation requirement was 6.38 inches.
6. Moisture stresses in the peanuts and grain sorghum
for periods not exceeding one week did not sig
nificantly decrease the yield of each.
7. Increasing the rate of fertilizer application did
not significantly increase the yield of grain sor
ghum.
8. The data obtained with the nylon blocks and the
Aquaprobe gave inconsistent results.
9. The consumptive use of water by grain sorghum for
optimum yields is affected by variations in climatic
conditions.
10. Continuation of the study of the consumptive use of
water by peanuts and grain sorghum with variations in

climatic conditions and types of soils is recom-
mended to better define their usage.
�
57
The following changes in procedure are recommeded
for future study:
(a) Use sandy soil for peanut plots.
(b) Irrigate the wilt one week treatments
only when no rainfall has occurred
during the week of wilt.
(c) Use a higher soil moisture tre�tment to
obtain maximum yield of peants.

BIBLIOGRAPHY
1. Beckett, S. H. and M. R. Huberty. "Irrigation Investigations with Field Crops at Davis and Delhi, California, 1909-25." California Agricultural Experiment Station, Bulletin 450, (1928).
2. Blaney, Harry F. and Wayne D. Criddle. "Determining Water Requirements in Irrigated Areas from Climatological and Irrigation Data."· Division of Irrigation and Water Conservation, Soil Conservation Service-;-united States Departmento'f AgricuTture, SCS TP - 96, (Washington, D. �,---nr5'0).
3. Duncan, David B.Biometrics,
"Multiple Range and Multiple F Tests." (March, 1955) .
4. Fortier, Samuel. "Irrigation Requirements of. the Aridand Semi-Arid Lands of the Missouri and Arkansas River Basins." United States Department of Agriculture, Ter.hnical Bulletin 379, (1933). - --
5. Fortier, Samuel and Arthur A. Young. "IrrigationRequirements of the Arid and Semi-Arid Lands of the Pacific Slope Basins." United States Department of Agriculture, Technical Bulletin 185, "(193°3), pp. 29.
6. Garton, James E. and Wayne D. Criddle. '�onsumptiveWater Use and Requirements for Oklahoma." (unpub.).
7. Gray,. Alfred S. Sprinkler Irrigation Handbook, ( 4th ed., Glendora, California, 1952), pp. 22.
8. Haise, Howard R. "How to Measure the Moisture in theSoil." Water, The Yearbook of Agriculture, 1955, (The United. States Departmen-=r-of Agriculture-,--1955), pp. 362.
9. Harrold, Lloyd L. "Available Moisture for Crops." Agricultural Engineering, XXAV (February, 1954), pp. 99-101.
10. Harrold, Lloyd L. "Evapotranspiration Rates for Various Crops." Agricultural Engineering, XXXVI, (October, 1955), pp. 669-672.
58

11. Israelsen, Orson W. Irrigation Principles and Practices, (2nd ed., John Wiley & Sons, In� New York), pp. 295-316.
59
12. Marr, James C. "The Use and Duty of Water in the SaltRiver Valley." Arizona Agricultural Experiment Station, Bulletin 120, (1927).
13. McDowell, C. H. "Irrigation Requirements of Cottonand Grain Sorghum in the Wichita Valley of Texas." Texas Agricultural Experiment Station, Bulletin 543, (August, 1937).
14. Musick, J. T. "Consumptive Use of Water by Corn,Grain Sorghum, and Forage Sorghum in Oklahoma, 1954." (unpub. M. S. dissertation, Oklahoma A. and M. College, 1954).
15. Pruitt, W. O. "Irrigation Scheduling Guide." Agricultural Engineering, XXXVII, (March, 1956-y-;-pp. 180-181.
16. Shockley, Dale R. "Capacity of Soil to Hold Moisture."Agricultural Engineering, XXXVI, (February, 1955), pp. 109.
17. Taylor, Sterling A. "Field Determinations of SoilMoisture." Agricultural Engineering, XXXVI, (October, 1955), pp. 654.
18. Young, Arthur A. "Irrigation Requirements of California Crops." Division of Water Resources, California Department of Public Works, Bulletin No. 51, (1945).
19. United States Department of Agricultural MarketingService. "United States Standards for Shell.ed White Spanish Peanuts." (unpub., August 15, 1939).
20. Whitt, D. M. and C. H. M. Van Bavel, "Irrigation ofTobacco, Peanuts, and Soybeans." (unpub.) ·.

APPENDIXES
60

i i EXHIBIT 1
Date
June 28 July 6
Aug. 3 Aug. 16 Aug. 25 Sept. 2 Sept. 13
Totals
TABLE XIV
IRRIGATION APPLICATIONS AND CONSUMPTIVE USE OF WATER BY PEANUTS
Treatment - w3
61
Number Length IConsum- Daily Consumptive-Use of
I�riga-tion
1 2 3 4 5 6
7
. -··-·
Usage ptive Period · Use
Days Inches 1.90*
8 1.00 28 2.83 13 4.12
9 3.30 8 3.36
11 3.00 41 4.70
118 23.21
Between Irrigations Inches
0�3' O=lq · l'-2 1 '2-3' -----
0.125 0.073 0.039 0.014 0.101 0.059 0.031 0.011 0.317 0.184 0.098 0.03i 0.367 0.213 0.114 0.040 0.420 0.244. 0.130 0.046 0.273 0 .159 0.085 0.030 0.115 0.067 0.036 0.012
-----
-------··-------------- ·---------.-------·----·--
Treatment - w21.94•
. .
June· 28 1 8 1.00 0.125 July 6 2 41 3.95 0.096 Aug. . 16 3 17 3.66 0.215 Sept. 2 4 14 3.00 0.214 Sept. 16 5 38 4.70 0.124
Totals 118 17.25 ---·-----·--···- --------···-----------··
Treatment - w11.86�
June 28 1 8 1.00 0.125 July 6 2 50 4.25 0.085 Aug. 25 3 22 3.36 0.153 Sept. 16 4 38 4.70 0.124
Totals 118 14.17
0 .058 0.041 0.044 0.031 0.100 0.070 0.099 0.070 0 .058 0 .040
----·
0.080 0.027 0.054 0.018 0.097 0.033 0.079 0.027
.. 0 .026 0.020 0.045 0.045 0.026.
· · ·-· --·---
0.01 0.01 0.02 0.01
8.
3
3
8 -
* Differential soil moisture between June 14 and July 7.�
APPENDIX ... A

EXHIBJT 2 · 62
Date
June 8 July 2 July 14 Aug. 3
Aug. 16 Aug. 25
Totals
June 8 July 2 Aug. 5 Aug. 20 Sept. 2
Totals
June 8 July 9 Aug. 12 Sept. 2
Totals
TABLE XV
IRRIGATION APPLICATIONS AND CONSUMPTIVE USE OF WATER BY GRAIN SORGHUM
Treatment - w3
Len gt Cons ump- Daily Consumptive Usage tive Use Use Between Irrig-Period Inches at ions Inches
Pays.
1 24 6.26 0.261 2 12 1.00 0.083
3 20 4.33 0.216 4, 13 4.12. 0.317 5 9 3.30 0 .. 367 6 48 5.06 0 .105
126 24.07
Treatment - W2
1 24 6.26 0.261 2 34 2.33 0.068 3 15 4.1.2 0.275 4 13 3.66 0.281 5 40 4.70 0.117
126 21.07
Treatment - w
1 31 6.26 0:202 2 34 3.45 0.101 3 21 2.54 0.121 4 40 4.70 0.117
126 16.95
APPENDIX A

-63
TABLE XVI
SOIL CHARACTERISTICS OF PLOT AREA, CANADIAN. LOAM -
Calculated*
Estimated from sampling Grain Sorghum
Estimated from sampling Peanuts
Apparent
Soil Depth Feet
0-1
1-2
2-3
17.12
18-19
18-19
Specific
Peanuts
1. 52
1. 45
1.44
y' Wilting Point Percent
6.86
6.5-7.5
Gravity**
Grain Sorghum
1. 50
1. 44
1.48
Real Specific Gravity --------------------�
2.71
* Field capacity was calculated by use of ceramic platesfor 1/3 atmosphere tension. Wilting point was calculated b y use of pressure membrane apparatus for 15 atmospheres tension. Calculations were made by Walter Knisel,Graduate Fellow, Oklahoma A; and M .. College.
** Apparent specific gravity values are average values for three undisturbed core samples taken by a sharpened sampling cylinder.
APPENDIX B

! I ' ' : I
: I , I
: i ' I i ! ' '
EXHIBIT 1 64
TABLE XVII
PRECIPITATION DATA FOR FORT RENO, OKLAHOMA EXPERIMENTAL,
Month
PLOTS OF PEANUTS AND GRAIN SORGHUM, 1955 .
Day Rainfall iri l'nches
April 6 0.20
23 1.16
Total 1.36*
May 9 0. 50
10 1.00
12 2� 60
14 1. 60
17 0.2·5
19 3.75
21··. 0.25
Total 9 .95*
June 13 0.16
14 0. 50
15 0.10
16 0.05
17 3.20
18 o. 50
22 1.25 ·.
Total 5. 76*Continued on next page
APPENDIX C

EXHIBIT 2 65
TABLE XVII. (CONTINUED)
July 16 0.65
18 0.18
23 0. 50
Total 1.33
August 7 0.40
8 0.72
22 0.30
29 0.06
Total 1.48
September 1 0.30
24
25 1. 70**
26
Total 2.00
October 5
6 9. 25***
7
Total 9.25
November 0 0
*·Data for April, May, and June were taken f:rom..:precipat,,..i.G>n. da;ta�,;collec.ted:· a.t '..-F:Orx Renp · Expeniment . ..,Sta tion.
** A total of 1.70 inches of precipitation was collected for the three day period, September 24, 25, and. 26.
*** A total of 9.25 inches of precipitation was collected for the three day period October 5, 6, and 7.
APPENDIX C

'!
EXHIBIT 3
TABLE XVIII
MONTHLY CLIMATOLOGICAL PRECIPITATION DATA FOR FORT RENO, OKLAHOMA', 1955
66
Month 1955 Rainfall *Normal Rain- Deviation fromInches
'
April 1.36
May 9.95
June 5.76
July 1.33
August 1.48
September 2.00
October 9.25
November 0
Totals 31.13
fall Inches
3.17
4.67
4.21
2.24
2.74
2.65
2 .06
1.99
' '
23. 73
'
Normal Inches
-1.81
+5.28
+l. 55
-0.91
-1.26
-0.65
+7.19
-1.99
+7.40
* Normal 'rainfall represents average annual rainfall from1931 - 1954.
APPENDIX C

: '
_f
EXHIBIT 4··
TABLE XIX
AVERAGE MONTHLY RELATIVE HUMIDITY OKLAHOMA CITY AIRPORT, OKLAHOMA CITY, OKLAHOMA,
MAY - NOVEMBER, 1955
Month Relative Humidity Percent*
May 69
Ju�e 70
July 60
August 7�
September 74
October 62
November 48
* Relative humidity observations were made �t 6-hourintervals.
67
APPENDIX C

EXHIBIT
TABLE XX
MAXIMUM AND MINIMUM DAILY TEMPERATURES FOR EL RENO, OKLAHOMA MAY - NOVEMBER, 1955
ay o Month 1-Max I Min I Max I Min I Max I Min Max Min Max Min Max I Min Ma;x
7 7 72 5 72 1 75
2 89 66 84 69 94 74 97 69 89 57 71 64 61 40
3 89 67 83 67 93 72 92 70 85 67 66 62 56 20
4 93 56 87 64 94 73 94 72 96 63 76 66 69 34
5 90 67 81 58 96 73 96 72 92 60 85 67 76 44
6 89 62 82 55 97 74 100 72 95 58 80 64 69 45
7 98 62 87 57 98 76 99 75 97 59 71 44 51 30
8 86 55 84 62 100 77 97 73 97 62 73 49 50 22
9 80 60 68 55 99 76 97 75 97 66 75 50 65 25
10 75 60 68 48 98 73 90 70 89 64 76 48 70 32
11 71 62 73 48 98 69 90 69 80 62 82 58 75 43
12 75 58 80 49 100 68 91 64 85 57 77 59 77 38
13 87 57 88 61 99 74 91 66 91 62 74 42 74 51
14 83 57 87 64 99 68 90 60 94 65 70 43 67 32
15 80 61 86 63 100 71 92 61 95 69 79 47 78 52
16 77 61 83 65 94 72 93 69 94 71 73 48 52 15
17 80 60 84 64 90 67 97 62 92 71 66 44 47 18
18 75 60 88 60 89 66 91 63 85 71 77 38 57 39
19 67 57 84 61 92 68 91 63 95 70 82 50 68 28
20 65 59 87 62 93 70 90 69 96 69 85 56 72 38
21 76 61 90 59 95 68 98 73· 95 72 76 52 74 48
22 '84 58 91 64 99 72 97 75 88 68 82 47 76 55
23 83 63 89 62 98 70 95 72 81 69 75 54 71 32
24 82 58 92 68 94 72 100 75 82 63 68 32 57 21
25 81 65 94 72 95 72 99 77 74 62 80 38 55 30
26 80 61 97 70 96 74 96 69 68 55 79 44 66 32
27 88 57 91 72 97 74 96 68 85 66 79 54 62 25
28 81 55 87 69 98 72 93 68 89 67 74 49 36 15
29 79 52 93 73 99 75 100 69 89 72 64 34 37 14
30 83 55 94 74 100 74 91 69 75 62 65 33 37 20
31 85 68 100 74 89 56 78 44 m
eans 00
APPENDIX C

EXHIBIT 6
TABLE XXI
DAILY EVAPORATION AND WIND VELOCITY FOR LAKE OVERHOLSER, OKLAHOMA MAY - NOVEMBER, 1955
1ay of May June July august ::sept:emoer Month I Evap. I Wind I Evap. I Wind Evap. Wind Evap. Wind Evap. Win
. ·� lOJ .J� 111 .22 11 .19 1
2 .38 90 .12 73 .35 87 .26 14 .22 15 .10 18
3 .39 115 .26 70 .36 76 .28 15 .25 40 --- 55 4 .26 70 .24 88 .35 61 .15 14 .14 49 --- 66
5 .28 32 .27 87 .28 48 .16 29 .19 9 --- 97
6 .27 51 .11 42 .22 48 .22 62 .21 13 --- 126 7 .31 65 .23 70 .48 84 .36 14 .21 3 .28 193 8
' .32 74 .04 60 .45 107 .36 102 .22 1 .14 50
9 .20 74 .16 153 .47 104 .27 39 .32 32 .18 55 10 .17 66 .20 170 .41 78 .36 57 .37 71 .08 50 11 --- 35 .22 121 .37 46 .17 30 .09 18 .24 55 12 --- 62 .22 · 39 .31 26 .27 22 .19 23 .07 123 13 .13 52 .17 54 .34 30 .25 16 .18 20 .12 64 14 .25 36 .16 53 .32 45 .26 19 .26 65 .35 37
15 I
.25 66 --- 53 .28 28 .25 19 .25 65 .15 17 16 .19 72 .27 67 .32 35 .29 25 .23 53 .13 20 17 .11 36 .43 81 .30 41 .29 35 . 25 71 .10 101 18 .35 35 .39 64 .17 22 .30 21 .27 62 .18 83 19 --- 61 .15 38 .07 42 .26 24 .11 40 .20 19 20 --- 38 .15 20 .32 44 .29 40 .17 37 .20 65 21 .10 26 .37 16 .27 45 .24 54 .22 83 .30 90 22 .09 2 .31 50 .30 48 .36 87 .39 74 .10 28 23 .28 17 .28 36 .26 28 .24 51 .10 41 .19 93 24 .28 32 .41 129 .21 30 .12 40 .15 54 .23 167 25 * 19 .27 71 .25 36 .28 54 .12 95 .18 50 26 .30 93 .33 68 .41 19 .32 50 .17 46 .08 82 27 .29 93 .20 71 .38 124 .30 58 --- 37 .32 74 28 .36 112 .20 71 .29 39 .26 7 --- 35 .26 161 29 .35 127 .15 68 .29 33 .16 27 .41 85 - . 22 170
30 .26 90 .36 103 .30 31 .37 59 .20 76 .15 156
31 .30 81 .23 17 .29 31 .17 97 (j)
.25 61 .24 71 .Jl 52 .26 36 .zz 44 eans .
APPENDIX C

EXHIBIT 7
Day of Month·
1 2 3 4 5 6 7 8 9
10 11 12 13 14 15 16 17 18 19 20 21 22 23 24
TABLE
TOTAL DAILY SOLAR RADIATION* IN GRAM-CALORIES PER SQUARE CENTIMETER MAY - NOVEMBER, STILLWATER,· OKLAHOMA, 1955
May June July August September October
485.7 644.3 721.4 592. 8 651.3 171.3 485.8 577.2 721.2 ---- 595.2 43 .4 498.3 555.8 743 .4 399.0 418.2 87.0 690.9 656.6 --- 390.9 573.9 108.5 402.8 434.2 469.5 --- 583.8 483.9 642.7 686.7 761. 8 650 .1 602.4 389.7 604.2 569.1 730.8 451.2 575.0 527.7 444.1 163.8 714.3 529.2 551.1 508 .2 217.8 487.8 716.4 368.7 501. 7 507. 9305. 4 440. 7 747.0 501.9 43. 2 506.4204.0 582.0 657.3 647.4 501.3 385.8314.1 720.0 608.4 663.8 492.3 ---
700.8 533.0 679.4 664.5 534.9 468.0 686. 4.. , 516 .. 9 664.3 778.9 331.4 486.9 227.7 572.4 709.8 664.9 494.1 455.7 --- 665.4 456.6 568.8 500. 7 453 .3 --- 334.0 401.4 646.4 514.5 462.1 --- 686.8 561.9 587.7 366.0 448.2 32.7 526.2 327.6 585.4 255.1 445.5
120.5 747.6 748.8 568.8 515.0 409.6 --- 696.3 727.2 600.2 499.8 399.6
658.2 686.6 --- 419.4 183.6 400 .4 523 .1 745.3 --- 529.2 369 .o 375.6 723.9 669.0 --- 496.8 326.3 452.7
November
376.5 381.3 407 .3 393.3 386.4 123.0 191.4
. 401.1 283 .8 370.6 360. 5355. 5---
334.2 662.7 386.4 356.4 163. 8352.2 340 .8 325. 7-237 .3 331.2 276.0
pag
APPENDIX C
'1 0

EXHIBIT 7
TABLE CONTINUED
25 195.4 653 .1 --- 606.0 52.9 455.4 339.3 26 609. 6 684.8 720.1 596. 7 137 .4 429.3 293.7 27 754.9 503 .6 680.9 --- 333.6 375.6 263,1 28 775.2 565,6 702.3 --- 385.5 274.8 183. 2 29 779.1 683.7 670.3 601. 5 389.7 335. 7 320.1 30 708. 7 699.9 630.9 548.1 213.0 424.5 87.3 31 503 .4 607.9 638.9 400.8
Totals 13, 295. 4 17,688.4 16,880.9 15,297.2 12,491.9 11,673.5 9,284.1
Means 492.4 589.6 649.3 566,6 416.4 389.1 320.1
* Solar radiation values were determined wi.th an Eppley Type Phyrheliometer, horizontalsurface element, which measures total sky radiation (direct sky radiation plus dif�fuse s�y radiation).
APPENDIX C
'1 .....

Resistanceby Bridge
Ohms
400 395
3600 330 350 650 360 220
1100 600 340 300 170 160 440 240 240 800 270 520
1100 200 200
500,000 220 220
1380
TABLE XXIII
BOUYOUCOS BRIDGE READINGS AND CORRESPONDING SOIL MOISTURE CONTENT
Soil Moisture Resistance So11 Moisture IContent by Bridge Content
Percent Ohms Percent
I15.58 1920 14.00
I
I18.28 1620 7.11 I 14. 53 210 9. 50
13.16 330 10 .95 15.34 210 15.42 14.01 6SOO 14.51 16.85 100 17.45 14.75 3200 11.51 11.48 480 12.60 13 .47 160 17.30 16.79 41,300 12.38 12.73 555,000 13.81 15.15 3200 17.60 18.34 2870 10.72 13. 70 630 13.30 13. 73 110 16.58 18.27 320 13 .35 12.33 650 15.00 14.48
I * 21.80
15.42 440 14.30 11.80 I 180 13 .10
I 12. 50 I 180 17.15 16.67 26,000 10. 5013.66 490 13.88 I
I
15.15 460 17.42 '
17.45 4000 12.08 I I
13 .95 360 16.78'
:
Resistanceby Bridge
. Ohms . 1200
330 4,4000
650 10,000
340 2800 3000
400 1630
25,400 2500
390 450,000
140 190
455,000 · 330
40011,000
520 280 410
3200 540 200
2600 *
So 1 I Mens tureContent Percent
18.90 16.10 18.41 15.95 16.68 19.83 20.23
9.93 15.25 19.15 11.96 14.48 17.19
7.38 13. 5813.8010.3012.4014.7513.7615.9018 .9513.9219.6216. 5014.10
I 10.2312.15
on next page
APPENDIX D
...:i t\J

120 17.45 2500 11. 502000 12.80
500 17.102200 12.00
560 11.70100 15.45140 6.43
4020 11. 592100 9.25
110 8.92230 12.09
4600 11.04 230 6.91
TABLE XXIII CONTINUED
5200 500,000
960 360 340 160 *
280 120
4000 670 230 240
11,100
. . -
12.43 16.3$ 17.74 13.90 l� .83 13.76 15.49 15.10 14.00 16.91 16. 8·219.85
· 17. 00. 16. 40
* Resistance greater than.can:.be.measµred by. bridge.
-�-
2600 *
*
410. 100 *
1260 *
*
840 43,000
670 *
2460
� - .
17.55 11.93 15.99 17.45 12.15 13.80 17.20 12.J.813. 5016.9211.4211.0513.2012.0,:J:
APPENDIX D
....:] C;J

I :
i I ,
74
TABLE XXIV
AQUAPROBE READINGS AND CORRESPONDING SOIL MOISTURE CONTENT
_____ D_i.a! ___ Reading:s
9.4 9.6 9.4 9.9
9.4 9.2 9.6 9.5 9.5 9.7 9.4 9.2 9.6 9.2 9.5 9.6 9.4 9.6 9.5 9.5 9.6 9.5
9.5 9.4 9.5 9.6 9.6 9.4 9.5 9.3 9.4 9.6 9.2,
9.6 9.6
Percent Soil Moisture Content
12.30 14.46
11.90 18.87 11.95 19.08 10.65 11.89 15 .35 14.21 13.15 17.45 13 .15 16.70 11.55 13. 7216.10
9.05 16.55 14.35
9.94 13 .38 14.45 14.32 14.26 14.00 16.62 13. 8015.6813. 7513.3013. 5614.8414.3014.6014.49
APPENDIX E

VITA
Dwayne Allen Suter
Candidate for the Degree of
Master of Science
Tliesis: CONSUMPTIVE USE OF WATER BY PEANUTS AND GRAIN ; SORGHUM IN CKLAHOM.A j . 1955
Major Field: Agricultural Engineering
Biographical:
Pel:'."sonal data: Born near Eakly, Oklahoma, July 15, 1932, · the son of Russ�ll O. and Flora Minetta Suter.
Education:.· .Attended .grade school in Hopew�ll and Eakly, Oklahoma; graduated from Eakly High School in 1950; received the Bachelor of Science degree from the Oklahoma Agricultural and Mechanical College, with a major :i;-r
i
agricultural engineering, in May, 1955.
Pr.ofessional experience: Spent from June, 1954 to Jan-. uary, 1955 in Kidapawah, Cotabato, Philippine
Islands as an agricultural engineer assisting in the development of a Methodist Rural Health and Agricultural Center. Held a teaching fellowship in the Agricultural Engineering Department from September, 1955 to May, 1956, Associate member of the American Society of Agricultural Engineers and a member of the Philippine Society of Agricultural Engineers.