consumptive water use to feed humanity – curing a blind spot
TRANSCRIPT

Hydrology and Earth System Sciences, 9, 15–28, 2005www.copernicus.org/EGU/hess/hess/9/15/SRef-ID: 1607-7938/hess/2005-9-15European Geosciences Union
Hydrology andEarth System
Sciences
Consumptive water use to feed humanity – curing a blind spot
M. Falkenmark 1 and M. Lannerstad2
1Stockholm International Water Institute, Sweden2Department of Water and Environmental Studies, Linkoping University, Sweden
Received: 15 November 2004 – Published in Hydrology and Earth System Sciences Discussions: 23 November 2004Revised: 28 January 2005 – Accepted: 2 May 2005 – Published: 9 June 2005
Abstract. Since in large parts of the world it is getting dif-ficult to meet growing water demands by mobilising morewater, the discourse has turned its focus to demand man-agement, governance and the necessary concern for aquaticecosystems by reserving an “environmental flow” in the river.The latter calls for attention to river depletion which may beexpected in response to changes in consumptive water useby both natural and anthropogenic systems. Basically, con-sumptive use has three faces: runoff generation influencedby land cover changes; consumptive use of water withdrawn;and evaporation from water systems (reservoirs, canals, riverbased cooling). After demonstrating the vulnerability tochanges in consumptive use under savanna region conditions– representative of many poverty and hunger prone develop-ing countries subject to attention in the Millennium Devel-opment Goal activities – the paper exemplifies; 1) changesin runoff generation in response to regional scale land coverchanges; 2) consumptive use in large scale irrigation systems.It goes on to analyse the implications of seeing food as ahuman right by estimating the additional consumptive userequirements to produce food for the next two generations.Attention is paid to remaining degrees of freedom in termsof uncommitted water beyond an environmental flow reserveand to potential food trade consequences (so-called virtualwater). The paper concludes that a human-right-to-food prin-ciple will have major consequences in terms of altered con-sumptive water use. It will therefore be essential for human-ity to address river depletion to avoid loss of resilience of thelife support system. This will demand a deep-going cooper-ation between hydrology, ecology and water governance.
1 Introduction
Water scarcity has been a core interest of the senior authorsince the early 1970’s, and has in the late 1990’s been gath-ering increasing international interest. For a long time, the
Correspondence to:M. Falkenmark([email protected])
international debate had its focus on use-to-availability ratiorelating to a more or less finite resource. Today, however,different circumstances call for interest on water scarcity asseen from the perspective of the outcome of increasing riverdepletion. There is for instance repeated reference in litera-ture to the world’s decreasing water resources and that “lessand less water is available for human consumption” (Ambio,2004). This is a statement that is however inconsistent withthe general understanding that the amount of water circulat-ing in the water cycle remains the same.
What is it then that gives the impression that water is get-ting scarcer? This could be just an indication of increasingwater pollution. If it however refers literally to the amountof water, it may signify what we may call “river depletion”,also referred to as neo-arheism (Meybeck, 2003), which hasbeen described for a whole set of rivers; Yellow River, Indus,Colorado, Nile, Aral Sea tributaries, Indus, Ganges, Murray-Darling, Jordan, Lake Chad tributaries, Huai, Rio Grande,Chao Phraya rivers etc. (Lannerstad, 2002). There are al-ready signs that this depletion may generate societal effortsto reduce the water use by putting a “cap” on further waterwithdrawals for irrigation (MDBC, 2003).
Such river depletion is also focused in the results of thescoping phase of the global UNEP-project GIWA (Ambio,2004). The analysis of key causes of environmental prob-lems in the 66 coastal seas, studied in that project, concludesthat freshwater shortage is a dominating cause of the environ-mental problems experienced in at least 19 of the 66 coastalseas. This supports the need to put focus on freshwater short-age, especially flow modification and consumptive water usein irrigation.
Another scarcity related concern is the new concern for theenvironmental effects of over-appropriation of streamflow.While the environmental community has recently developedcriteria for minimum flow for protection of aquatic ecosys-tems (Dyson et al., 2003), a world map presented by IWMI,IUCN, WRI and University of Kassel (Smakthin et al., 2004)suggests that the environmental flow needs have already beenovercommitted in a broad belt across the continents from
© 2005 Author(s). This work is licensed under a Creative Commons License.
16 M. Falkenmark and M. Lannerstad: Consumptive water use to feed humanity – curing a blind spot
3
This paper has its focus on such consumptive/depletive water use, its relation to land cover change and socio-economic development, implications of feeding a growing humanity and environmental and ecological consequences of changes identified. 2 Consumptive water use 2.1 The concept Conventional statistics of water use offers data on water withdrawals for municipal, industrial and agricultural purposes. Since many of the water uses to which the withdrawn water is being put are through-flow based uses where the water after use returns to the water system, it is basically only the consumptive use component or “evapotranspiration during use” that is relevant from the perspective of impact on downstream users and aquatic and coastal ecosystems. The return flow represents a quantity that can principally be reused over and over again in the basin, unless it is drained directly to the sea or to e.g. a salt sink for evaporation.
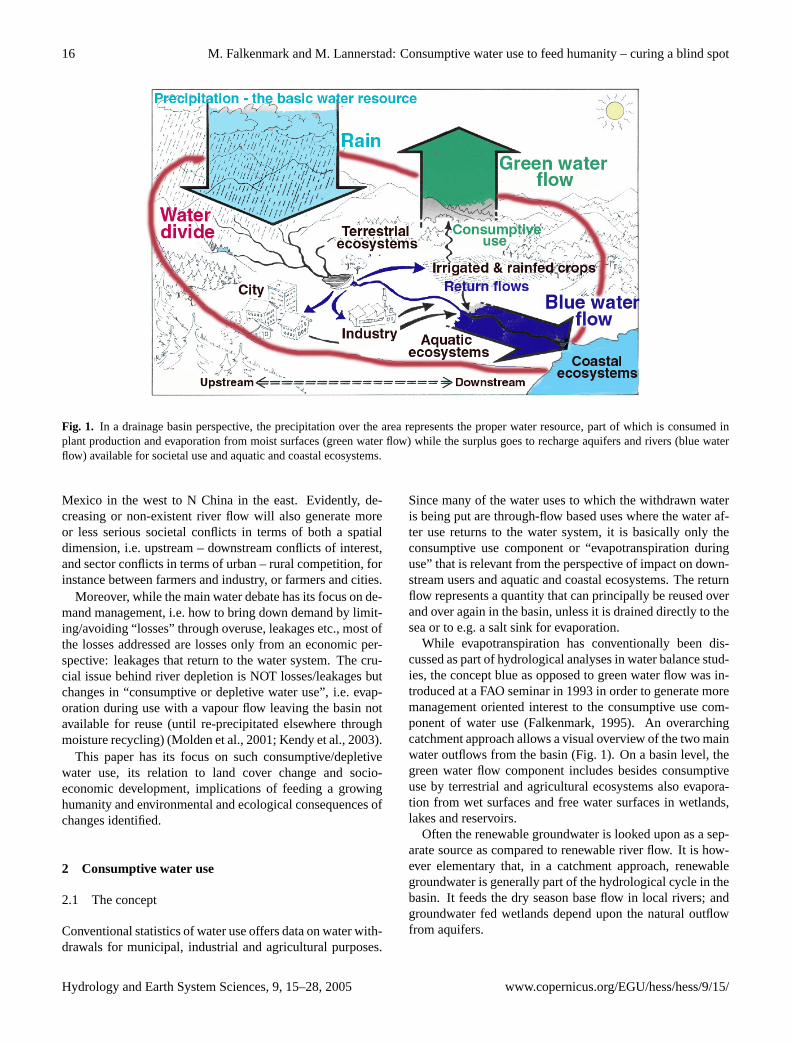
Fig. 1. In a drainage basin perspective, the precipitation over the area represents the proper water resource, part of which is consumed in plant production and evaporation from moist surfaces (green water flow) while the surplus goes to recharge aquifers and rivers (blue water flow) available for societal use and aquatic and coastal ecosystems. While evapotranspiration has conventionally been discussed as part of hydrological analyses in water balance studies, the concept blue as opposed to green water flow was introduced at a FAO seminar in 1993 in order to generate more management oriented interest to the consumptive use component of water use (Falkenmark, 1995). An overarching catchment approach allows a visual overview of the two main water outflows from the basin (Fig. 1). On a basin level, the green water flow component includes besides consumptive use by terrestrial and agricultural
Fig. 1. In a drainage basin perspective, the precipitation over the area represents the proper water resource, part of which is consumed inplant production and evaporation from moist surfaces (green water flow) while the surplus goes to recharge aquifers and rivers (blue waterflow) available for societal use and aquatic and coastal ecosystems.
Mexico in the west to N China in the east. Evidently, de-creasing or non-existent river flow will also generate moreor less serious societal conflicts in terms of both a spatialdimension, i.e. upstream – downstream conflicts of interest,and sector conflicts in terms of urban – rural competition, forinstance between farmers and industry, or farmers and cities.
Moreover, while the main water debate has its focus on de-mand management, i.e. how to bring down demand by limit-ing/avoiding “losses” through overuse, leakages etc., most ofthe losses addressed are losses only from an economic per-spective: leakages that return to the water system. The cru-cial issue behind river depletion is NOT losses/leakages butchanges in “consumptive or depletive water use”, i.e. evap-oration during use with a vapour flow leaving the basin notavailable for reuse (until re-precipitated elsewhere throughmoisture recycling) (Molden et al., 2001; Kendy et al., 2003).
This paper has its focus on such consumptive/depletivewater use, its relation to land cover change and socio-economic development, implications of feeding a growinghumanity and environmental and ecological consequences ofchanges identified.
2 Consumptive water use
2.1 The concept
Conventional statistics of water use offers data on water with-drawals for municipal, industrial and agricultural purposes.
Since many of the water uses to which the withdrawn wateris being put are through-flow based uses where the water af-ter use returns to the water system, it is basically only theconsumptive use component or “evapotranspiration duringuse” that is relevant from the perspective of impact on down-stream users and aquatic and coastal ecosystems. The returnflow represents a quantity that can principally be reused overand over again in the basin, unless it is drained directly to thesea or to e.g. a salt sink for evaporation.
While evapotranspiration has conventionally been dis-cussed as part of hydrological analyses in water balance stud-ies, the concept blue as opposed to green water flow was in-troduced at a FAO seminar in 1993 in order to generate moremanagement oriented interest to the consumptive use com-ponent of water use (Falkenmark, 1995). An overarchingcatchment approach allows a visual overview of the two mainwater outflows from the basin (Fig. 1). On a basin level, thegreen water flow component includes besides consumptiveuse by terrestrial and agricultural ecosystems also evapora-tion from wet surfaces and free water surfaces in wetlands,lakes and reservoirs.
Often the renewable groundwater is looked upon as a sep-arate source as compared to renewable river flow. It is how-ever elementary that, in a catchment approach, renewablegroundwater is generally part of the hydrological cycle in thebasin. It feeds the dry season base flow in local rivers; andgroundwater fed wetlands depend upon the natural outflowfrom aquifers.
Hydrology and Earth System Sciences, 9, 15–28, 2005 www.copernicus.org/EGU/hess/hess/9/15/
M. Falkenmark and M. Lannerstad: Consumptive water use to feed humanity – curing a blind spot 17
5
Fig. 2. (a) The blue/green rainfall partitioning in the semiarid zones for different amounts of net annually infiltrated rainfall (modified from L’vovich, 1979, p. 198).
Fig. 2. (b) A particularly vulnerable zone in terms of future river depletion is the savanna zone (regions 10 and 11 on the map of the main biomes of the world) (modified from Falkenmark and Rockström, 2004, p. 87). in the tropics plus the fact that it is in these areas where large land use changes are generated due to population growth and development efforts, suggests that the savanna zone is especially vulnerable. This zone includes many of the top and high priority countries now focused on in the Millennium Project with its efforts to meet the UN launched Millenium Development Goals (MDGs), many of which are directly water-related (poverty, hunger and unhealth alleviation) (Fig. 2b).
500 mm
1 000 mm
1 500 mm
Evaporation
Ground Water Runoff
Net Precipitation
(a)
5
Fig. 2. (a) The blue/green rainfall partitioning in the semiarid zones for different amounts of net annually infiltrated rainfall (modified from L’vovich, 1979, p. 198).
Fig. 2. (b) A particularly vulnerable zone in terms of future river depletion is the savanna zone (regions 10 and 11 on the map of the main biomes of the world) (modified from Falkenmark and Rockström, 2004, p. 87). in the tropics plus the fact that it is in these areas where large land use changes are generated due to population growth and development efforts, suggests that the savanna zone is especially vulnerable. This zone includes many of the top and high priority countries now focused on in the Millennium Project with its efforts to meet the UN launched Millenium Development Goals (MDGs), many of which are directly water-related (poverty, hunger and unhealth alleviation) (Fig. 2b).
500 mm
1 000 mm
1 500 mm
Evaporation
Ground Water Runoff
Net Precipitation
(b)
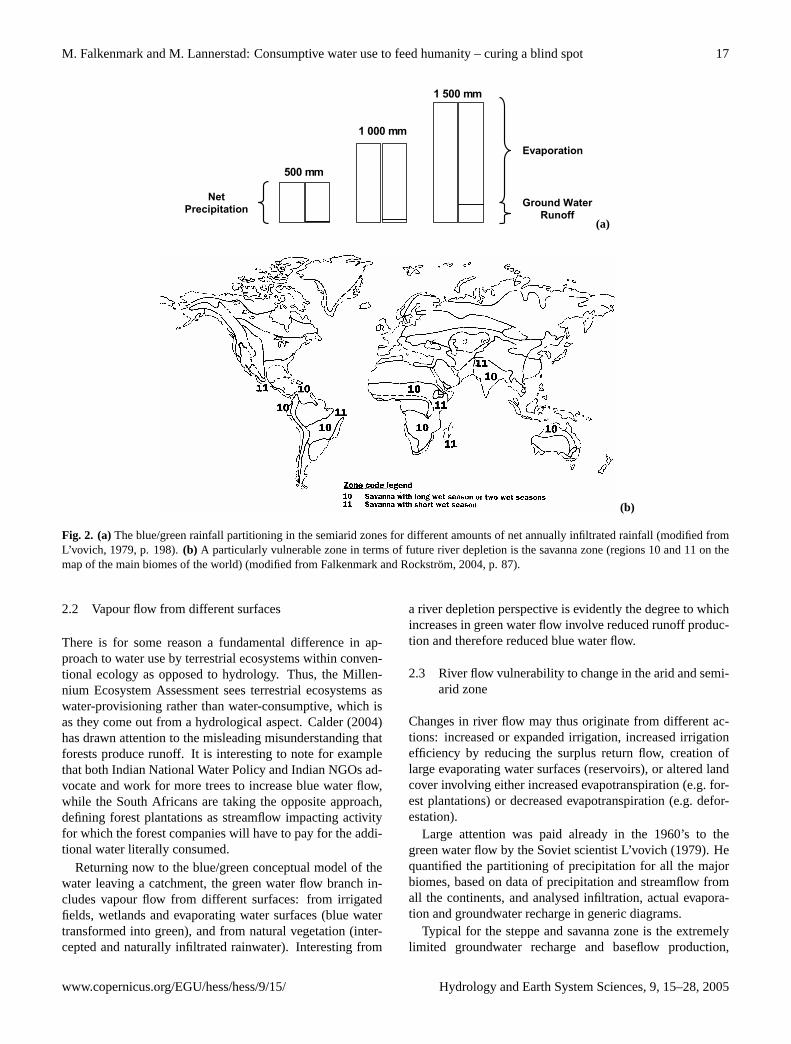
Fig. 2. (a)The blue/green rainfall partitioning in the semiarid zones for different amounts of net annually infiltrated rainfall (modified fromL’vovich, 1979, p. 198).(b) A particularly vulnerable zone in terms of future river depletion is the savanna zone (regions 10 and 11 on themap of the main biomes of the world) (modified from Falkenmark and Rockstrom, 2004, p. 87).
2.2 Vapour flow from different surfaces
There is for some reason a fundamental difference in ap-proach to water use by terrestrial ecosystems within conven-tional ecology as opposed to hydrology. Thus, the Millen-nium Ecosystem Assessment sees terrestrial ecosystems aswater-provisioning rather than water-consumptive, which isas they come out from a hydrological aspect. Calder (2004)has drawn attention to the misleading misunderstanding thatforests produce runoff. It is interesting to note for examplethat both Indian National Water Policy and Indian NGOs ad-vocate and work for more trees to increase blue water flow,while the South Africans are taking the opposite approach,defining forest plantations as streamflow impacting activityfor which the forest companies will have to pay for the addi-tional water literally consumed.
Returning now to the blue/green conceptual model of thewater leaving a catchment, the green water flow branch in-cludes vapour flow from different surfaces: from irrigatedfields, wetlands and evaporating water surfaces (blue watertransformed into green), and from natural vegetation (inter-cepted and naturally infiltrated rainwater). Interesting from
a river depletion perspective is evidently the degree to whichincreases in green water flow involve reduced runoff produc-tion and therefore reduced blue water flow.
2.3 River flow vulnerability to change in the arid and semi-arid zone
Changes in river flow may thus originate from different ac-tions: increased or expanded irrigation, increased irrigationefficiency by reducing the surplus return flow, creation oflarge evaporating water surfaces (reservoirs), or altered landcover involving either increased evapotranspiration (e.g. for-est plantations) or decreased evapotranspiration (e.g. defor-estation).
Large attention was paid already in the 1960’s to thegreen water flow by the Soviet scientist L’vovich (1979). Hequantified the partitioning of precipitation for all the majorbiomes, based on data of precipitation and streamflow fromall the continents, and analysed infiltration, actual evapora-tion and groundwater recharge in generic diagrams.
Typical for the steppe and savanna zone is the extremelylimited groundwater recharge and baseflow production,
www.copernicus.org/EGU/hess/hess/9/15/ Hydrology and Earth System Sciences, 9, 15–28, 2005
18 M. Falkenmark and M. Lannerstad: Consumptive water use to feed humanity – curing a blind spot
7
Fig. 3. (a) The columns show the historic change in km3/year of consumptive water use (CU) from total global area cultivated in 1980 compared to natural vegetation (virgin lands) with: CU from natural vegetation; CU from stepwise increased cultivation; and change in CU, i.e. blue water flow increase (modified from L’vovich and White, 1990, p. 247).
Fig. 3. (b) Total blue water withdrawals 1680–1980 and consumptive use component divided into irrigation and non-irrigation (modified from L’vovich and White, 1990, p. 242 and 245).
1200 1700
3300 3800 3600600
800
1600
2200 2900
6500
47004000
1600500
VirginLands
1680 1800 1900 1950 1980
Change in CU,
i.e. Runoff Increase
CU Natural Vegetation
CU Agricultural
Vegetation
km3/year
Year
0
1000
2000
3000
4000
1680 1800 1900 1950 1980Year
CU Irrigation
CU Non-Irrigation
Return Flow
Total Withdrawals
km3/year
(a)
7
Fig. 3. (a) The columns show the historic change in km3/year of consumptive water use (CU) from total global area cultivated in 1980 compared to natural vegetation (virgin lands) with: CU from natural vegetation; CU from stepwise increased cultivation; and change in CU, i.e. blue water flow increase (modified from L’vovich and White, 1990, p. 247).
Fig. 3. (b) Total blue water withdrawals 1680–1980 and consumptive use component divided into irrigation and non-irrigation (modified from L’vovich and White, 1990, p. 242 and 245).
1200 1700
3300 3800 3600600
800
1600
2200 2900
6500
47004000
1600500
VirginLands
1680 1800 1900 1950 1980
Change in CU,
i.e. Runoff Increase
CU Natural Vegetation
CU Agricultural
Vegetation
km3/year
Year
0
1000
2000
3000
4000
1680 1800 1900 1950 1980Year
CU Irrigation
CU Non-Irrigation
Return Flow
Total Withdrawals
km3/year
(b)
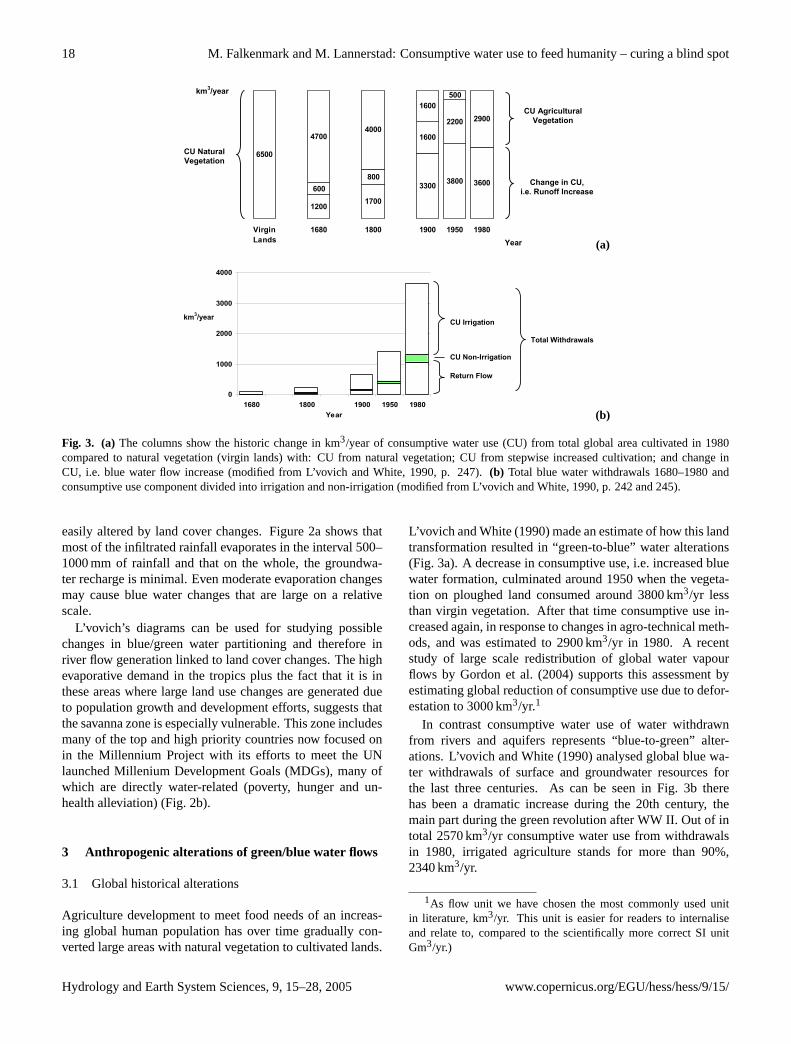
Fig. 3. (a) The columns show the historic change in km3/year of consumptive water use (CU) from total global area cultivated in 1980compared to natural vegetation (virgin lands) with: CU from natural vegetation; CU from stepwise increased cultivation; and change inCU, i.e. blue water flow increase (modified from L’vovich and White, 1990, p. 247).(b) Total blue water withdrawals 1680–1980 andconsumptive use component divided into irrigation and non-irrigation (modified from L’vovich and White, 1990, p. 242 and 245).
easily altered by land cover changes. Figure 2a shows thatmost of the infiltrated rainfall evaporates in the interval 500–1000 mm of rainfall and that on the whole, the groundwa-ter recharge is minimal. Even moderate evaporation changesmay cause blue water changes that are large on a relativescale.
L’vovich’s diagrams can be used for studying possiblechanges in blue/green water partitioning and therefore inriver flow generation linked to land cover changes. The highevaporative demand in the tropics plus the fact that it is inthese areas where large land use changes are generated dueto population growth and development efforts, suggests thatthe savanna zone is especially vulnerable. This zone includesmany of the top and high priority countries now focused onin the Millennium Project with its efforts to meet the UNlaunched Millenium Development Goals (MDGs), many ofwhich are directly water-related (poverty, hunger and un-health alleviation) (Fig. 2b).
3 Anthropogenic alterations of green/blue water flows
3.1 Global historical alterations
Agriculture development to meet food needs of an increas-ing global human population has over time gradually con-verted large areas with natural vegetation to cultivated lands.
L’vovich and White (1990) made an estimate of how this landtransformation resulted in “green-to-blue” water alterations(Fig. 3a). A decrease in consumptive use, i.e. increased bluewater formation, culminated around 1950 when the vegeta-tion on ploughed land consumed around 3800 km3/yr lessthan virgin vegetation. After that time consumptive use in-creased again, in response to changes in agro-technical meth-ods, and was estimated to 2900 km3/yr in 1980. A recentstudy of large scale redistribution of global water vapourflows by Gordon et al. (2004) supports this assessment byestimating global reduction of consumptive use due to defor-estation to 3000 km3/yr.1
In contrast consumptive water use of water withdrawnfrom rivers and aquifers represents “blue-to-green” alter-ations. L’vovich and White (1990) analysed global blue wa-ter withdrawals of surface and groundwater resources forthe last three centuries. As can be seen in Fig. 3b therehas been a dramatic increase during the 20th century, themain part during the green revolution after WW II. Out of intotal 2570 km3/yr consumptive water use from withdrawalsin 1980, irrigated agriculture stands for more than 90%,2340 km3/yr.
1As flow unit we have chosen the most commonly used unitin literature, km3/yr. This unit is easier for readers to internaliseand relate to, compared to the scientifically more correct SI unitGm3/yr.)
Hydrology and Earth System Sciences, 9, 15–28, 2005 www.copernicus.org/EGU/hess/hess/9/15/

M. Falkenmark and M. Lannerstad: Consumptive water use to feed humanity – curing a blind spot 19
9
Fig. 4. (a) Human generated streamflow reduction in Incomati River Basin, Southern Africa. Blue green rainfall partitioning with virgin land use; by year 2002; and according to future implementation of the Triparty Interim Agreement. Three different types of water impacting activities are distinguished: entirely rainfed exotic tree plantations transpire more soil moisture than natural vegetation and thus decrease runoff formation; consumptive use of withdrawn quantities in domestic, municipal, industrial and agriculture sectors; and out of basin transfers (data from Van der Zaag and Carmo Vaz, 2003).
Fig. 4. (b) Water balance for the Bhakra irrigation scheme, NW India, 1995/1996. The command area is 1,5 Mha and height of the staples “In” and “Out” are equivalent to 18 000Mm3/yr. Consumptive water use, mainly crops, evaporates the entire precipitation over the area and more than half of the surface inflow. Downstream water demands, here environmental concerns, are considered within “committed” outflows, accordingly “uncommitted outflows” is a resource still to be used and evaporated within the irrigation project (data Molden et al., 2001).
"In" "Out"
Storage Change
River Depletion
Outflow
Surface Inflow
Precipitation
CU Crops
Uncommitted Outflow
Committed OutflowEnvironment
CU Cities & Industry
CU Fallow & WaterLogged Lands
Out of Basin Transfers
CU Dom. Mun. Ind. Livestock
33000
34000
35000
0
1000
2000
3000
4000
Precipi. VirginLand
2002 TIATreaty
CU Exotic Tree Plantations
p
CU Natural Vegetation
Precipitation
Mm3/yr
CU Irrigation
Outflow
RiverDepletion
Outflow
(a)
9
Fig. 4. (a) Human generated streamflow reduction in Incomati River Basin, Southern Africa. Blue green rainfall partitioning with virgin land use; by year 2002; and according to future implementation of the Triparty Interim Agreement. Three different types of water impacting activities are distinguished: entirely rainfed exotic tree plantations transpire more soil moisture than natural vegetation and thus decrease runoff formation; consumptive use of withdrawn quantities in domestic, municipal, industrial and agriculture sectors; and out of basin transfers (data from Van der Zaag and Carmo Vaz, 2003).
Fig. 4. (b) Water balance for the Bhakra irrigation scheme, NW India, 1995/1996. The command area is 1,5 Mha and height of the staples “In” and “Out” are equivalent to 18 000Mm3/yr. Consumptive water use, mainly crops, evaporates the entire precipitation over the area and more than half of the surface inflow. Downstream water demands, here environmental concerns, are considered within “committed” outflows, accordingly “uncommitted outflows” is a resource still to be used and evaporated within the irrigation project (data Molden et al., 2001).
"In" "Out"
Storage Change
River Depletion
Outflow
Surface Inflow
Precipitation
CU Crops
Uncommitted Outflow
Committed OutflowEnvironment
CU Cities & Industry
CU Fallow & WaterLogged Lands
Out of Basin Transfers
CU Dom. Mun. Ind. Livestock
33000
34000
35000
0
1000
2000
3000
4000
Precipi. VirginLand
2002 TIATreaty
CU Exotic Tree Plantations
pCU Natural Vegetation
Precipitation
+
Mm3/yr
CU Irrigation
Outflow
+
RiverDepletion
Outflow
(b)
Fig. 4. (a) Human generated streamflow reduction in Incomati River Basin, Southern Africa. Blue green rainfall partitioning with virginland use; by year 2002; and according to future implementation of the Triparty Interim Agreement. Three different types of water impactingactivities are distinguished: entirely rainfed exotic tree plantations transpire more soil moisture than natural vegetation and thus decreaserunoff formation; consumptive use of withdrawn quantities in domestic, municipal, industrial and agriculture sectors; and out of basintransfers (data from Van der Zaag and Carmo Vaz, 2003).(b) Water balance for the Bhakra irrigation scheme, NW India, 1995/1996. Thecommand area is 1.5 Mha and height of the staples “In” and “Out” are equivalent to 18 000 Mm3/yr. Consumptive water use, mainly crops,evaporates the entire precipitation over the area and more than half of the surface inflow. Downstream water demands, here environmentalconcerns, are considered within “committed” outflows, accordingly “uncommitted outflows” is a resource still to be used and evaporatedwithin the irrigation project (data Molden et al., 2001).
Consumptive water use from man-made freshwater stor-age is another “blue-to-green” alteration. Reservoirs for irri-gation, hydropower etc. today have an estimated total vol-ume of around 6000 km3 and cover an area of more than500 000 km2. Global reservoir consumptive use is estimatedto around 200 km3/yr (L’vovich and White, 1990; Shiklo-manov, 2000). In arid regions reservoirs can make a con-siderable contribution to surface water evaporation. An-nual consumptive use from Lake Nasser/Nubia behind HighAswan Dam is estimated to as much as 11% of the lake vol-ume (L’vovich and White, 1990). As the dam can store twoyear’s inflow (Postel, 1999, p. 54) more than 20% of theyearly inflow might be lost to evaporation every year.
3.2 Three basin illustrations of blue/green interactions
An estimate of regional green-to-blue transformations wasmade by Gordon et al. (2003) for the Australian continent.During the last 200 years European settlers have made ex-tensive clearance of perennial deep rooted forest vegeta-tion. The estimated reduction of consumptive water useis almost as large as the present annual natural blue wa-ter flow from the continent. In Murray-Darling Basin 12to 20 billion trees were replaced by short rooted grassesand seasonal crops. This vegetation change resulted inamplified blue water formation, with rising groundwater lev-els and increased river flow. The past 100 years a parallel
www.copernicus.org/EGU/hess/hess/9/15/ Hydrology and Earth System Sciences, 9, 15–28, 2005

20 M. Falkenmark and M. Lannerstad: Consumptive water use to feed humanity – curing a blind spot
development of construction of river regulatory and waterstorage structures have enabled large scale diversions, todaymounting over 11 000 Mm3. Through increased consumptiveuse, yearly outflow to the sea today has thus decreased froman average of 12 300 Mm3 to 4900 Mm3 (MDBC, 2004).
Another illustrative case is offered by the changes in theIncomati river basin in Southern Africa (Van der Zaag andCarmo Vaz, 2003) (Fig. 4a), where the net virgin runoff(3587 Mm3/yr) has been reduced step by step by altogether1800 Mm3/yr till 2002, and can be predicted to decrease byanother 500 Mm3/yr in line with the recent riparian TripartyInterim Agreement. Interesting to notice is the increasedconsumptive water use by exotic tree plantations, almost550 Mm3/yr. These plantations are entirely rainfed and areanother example of how land use changes can alter naturalhydrology and reduce blue water formation. The final out-come of increased green water flow from both rainfed andirrigated areas will in other words be a reduction of primaryblue water flow by 2300 Mm3/yr, leaving only 35% of theoriginal streamflow for freshwater and downstream coastalecosystems.
Another carefully researched illustration of blue-to-greenredirection is offered by IWMI’s water accounting analy-sis of the water balance of the Bhakra sub-basin irrigationproject of 1.5 Mha in northwest India, visualising the con-sumptive use and river depletion (Molden et al., 2001). Theentire precipitation falling in the area and around 55% of theblue water inflow to this huge irrigation project was trans-formed into green water flow, above all by crops (Fig. 4b).
3.3 Modern world signals in terms of increasing blue waterscarcity
As a consequence of increase in consumptive blue water use(Fig. 3b), a disturbing trend of large scale river depletion andfalling groundwater levels have become evident in the aridand semi arid zone (Postel, 1999; Plate 3 in Kijne et al.,2003). A whole set of hot spots have already developed inregions which are at the same time hunger prone, droughtvulnerable and with increasing populations.
3.3.1 River depletion
River depletion is characterised by reduced river flow relativelong time average; some rivers have changed from perennialto intermittent. The major reason is consumptive water useby irrigation (Lannerstad, 2002). As the trend is prevalent af-ter 1950, Meybeck (2003) designated a river flow reductionof at least 50% as “neo-arheism”, “new absence of flow”.Considerably reduced river flow in many basins imperils so-cietal development, increases the competition between up-stream and downstream users and threatens water dependentterrestrial, freshwater and coastal ecosystems.
The most evident example is the Aral Sea where largescale irrigation along the tributaries Amu Darya and Syr
Darya has reduced this inland water body, once the fourthlargest, by half it’s area and three quarters of it’s volume.Disappearing delta areas cause the extinction of habitats andendemic species. A collapsed fishing industry and seri-ous human health problems are some of the societal effects(Glantz, 1998).
Along the Colorado River successful reservoir construc-tion during the last century today enable a total storage ofalmost five times average yearly flow. The Colorado Riversupports irrigation of 800 000 ha and supplies drinking wa-ter to 25 million people, 16 million “out of basin” in southernCalifornia. Since 1960 there have not been almost any dis-charges to the Californian Gulf and the last measuring sta-tion, El Meritimo in Mexico, closed down in 1968 (Postel,1995).
The naturally perennial Indus River today irrigates morethan 14 million ha in Pakistan. After completion of a numberof large scale reservoirs the days of zero outflows to the Ara-bian Sea during the last 25 years have reached an average of81 days during dry season and 26 days during wet season.On average only 21% of historical dry season flow now reachthe delta and coastal ecosystems (Asiancs, 2000).
In 1972 the lower course of the Yellow River dried upfor the first time in history. In 1997 the dry-up lasted for226 days and reached 700 km up-stream. Reduced dilutionof industrial effluents threatens human health of millions inthe river valley. Periods of little or no flow leave the fertiledelta plains without irrigation water and cause extensive sil-tation of the main canal, posing a threat to river dikes duringflooding (Ren and Walker, 1998).
In the Rio Grande/Rio Bravo Basin, New Mexico, Texasand Mexico are competing for scarce water resources. In2001 the river for the first time failed to reach the Gulf ofMexico (Economist, 2001). Economic expansion with pro-duction of cash-crops for the U.S. market, following theNorth America Free Trade Treaty, together with several yearsof drought forced Mexico to exceed its river flow share andin 2000 thus owed the U.S. 1.2 km3. The population in thearea is projected to double by 2020 (Economist, 2000).
3.3.2 Groundwater overdraft
Since 1950 a number of concurrent development steps asgeological knowledge, well drilling, pump technology andrural electricity infrastructure have opened up for extensivegroundwater exploitation (Foster and Chilton, 2003). Roseg-rant et al. (2002, p. 157) estimate total groundwater use in1995 to more than 800 km3, out of which as much as 200 km3
is overdraft of non-recharged groundwater contributing tolong-term groundwater depletion (Postel, 1999, p. 80). Pos-tel suggests that this equals around 180 tons of grain or about10% of global harvest. The major groundwater depletingnations (mid 1990 s) are 104 km3/yr, China 30 km3/yr andUS 14 km3/yr (Postel, 1999, p. 80).
Hydrology and Earth System Sciences, 9, 15–28, 2005 www.copernicus.org/EGU/hess/hess/9/15/
M. Falkenmark and M. Lannerstad: Consumptive water use to feed humanity – curing a blind spot 21
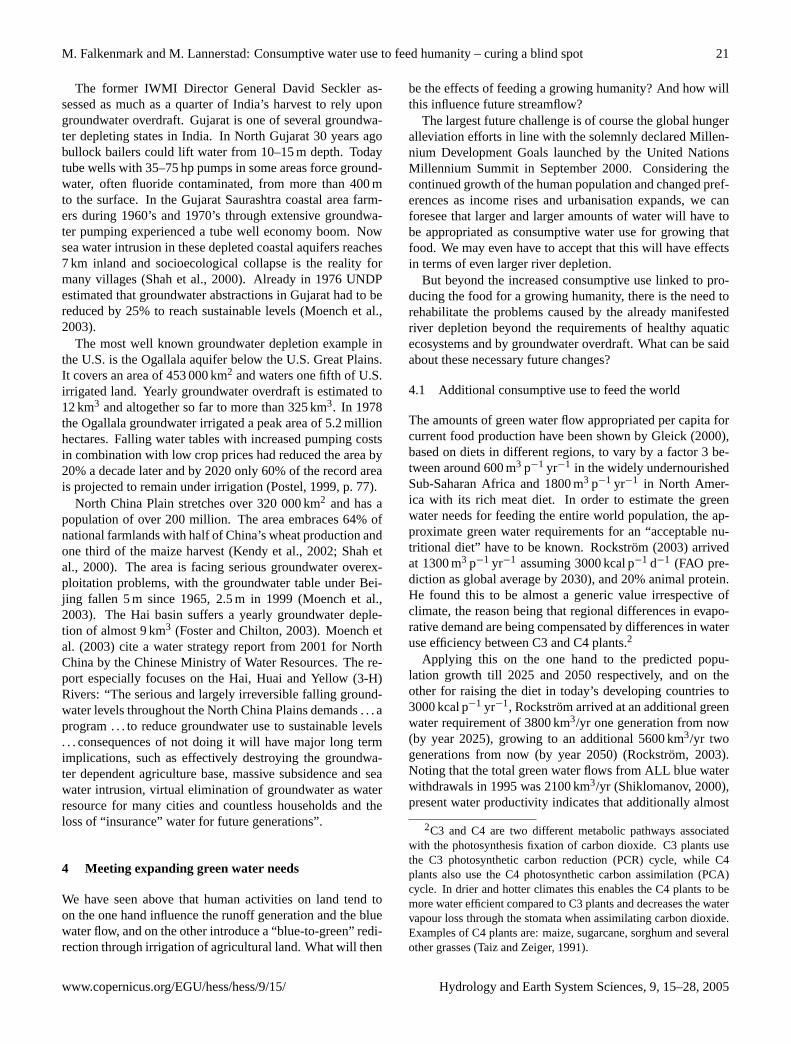
The former IWMI Director General David Seckler as-sessed as much as a quarter of India’s harvest to rely upongroundwater overdraft. Gujarat is one of several groundwa-ter depleting states in India. In North Gujarat 30 years agobullock bailers could lift water from 10–15 m depth. Todaytube wells with 35–75 hp pumps in some areas force ground-water, often fluoride contaminated, from more than 400 mto the surface. In the Gujarat Saurashtra coastal area farm-ers during 1960’s and 1970’s through extensive groundwa-ter pumping experienced a tube well economy boom. Nowsea water intrusion in these depleted coastal aquifers reaches7 km inland and socioecological collapse is the reality formany villages (Shah et al., 2000). Already in 1976 UNDPestimated that groundwater abstractions in Gujarat had to bereduced by 25% to reach sustainable levels (Moench et al.,2003).
The most well known groundwater depletion example inthe U.S. is the Ogallala aquifer below the U.S. Great Plains.It covers an area of 453 000 km2 and waters one fifth of U.S.irrigated land. Yearly groundwater overdraft is estimated to12 km3 and altogether so far to more than 325 km3. In 1978the Ogallala groundwater irrigated a peak area of 5.2 millionhectares. Falling water tables with increased pumping costsin combination with low crop prices had reduced the area by20% a decade later and by 2020 only 60% of the record areais projected to remain under irrigation (Postel, 1999, p. 77).
North China Plain stretches over 320 000 km2 and has apopulation of over 200 million. The area embraces 64% ofnational farmlands with half of China’s wheat production andone third of the maize harvest (Kendy et al., 2002; Shah etal., 2000). The area is facing serious groundwater overex-ploitation problems, with the groundwater table under Bei-jing fallen 5 m since 1965, 2.5 m in 1999 (Moench et al.,2003). The Hai basin suffers a yearly groundwater deple-tion of almost 9 km3 (Foster and Chilton, 2003). Moench etal. (2003) cite a water strategy report from 2001 for NorthChina by the Chinese Ministry of Water Resources. The re-port especially focuses on the Hai, Huai and Yellow (3-H)Rivers: “The serious and largely irreversible falling ground-water levels throughout the North China Plains demands . . . aprogram . . . to reduce groundwater use to sustainable levels. . . consequences of not doing it will have major long termimplications, such as effectively destroying the groundwa-ter dependent agriculture base, massive subsidence and seawater intrusion, virtual elimination of groundwater as waterresource for many cities and countless households and theloss of “insurance” water for future generations”.
4 Meeting expanding green water needs
We have seen above that human activities on land tend toon the one hand influence the runoff generation and the bluewater flow, and on the other introduce a “blue-to-green” redi-rection through irrigation of agricultural land. What will then
be the effects of feeding a growing humanity? And how willthis influence future streamflow?
The largest future challenge is of course the global hungeralleviation efforts in line with the solemnly declared Millen-nium Development Goals launched by the United NationsMillennium Summit in September 2000. Considering thecontinued growth of the human population and changed pref-erences as income rises and urbanisation expands, we canforesee that larger and larger amounts of water will have tobe appropriated as consumptive water use for growing thatfood. We may even have to accept that this will have effectsin terms of even larger river depletion.
But beyond the increased consumptive use linked to pro-ducing the food for a growing humanity, there is the need torehabilitate the problems caused by the already manifestedriver depletion beyond the requirements of healthy aquaticecosystems and by groundwater overdraft. What can be saidabout these necessary future changes?
4.1 Additional consumptive use to feed the world
The amounts of green water flow appropriated per capita forcurrent food production have been shown by Gleick (2000),based on diets in different regions, to vary by a factor 3 be-tween around 600 m3 p−1 yr−1 in the widely undernourishedSub-Saharan Africa and 1800 m3 p−1 yr−1 in North Amer-ica with its rich meat diet. In order to estimate the greenwater needs for feeding the entire world population, the ap-proximate green water requirements for an “acceptable nu-tritional diet” have to be known. Rockstrom (2003) arrivedat 1300 m3 p−1 yr−1 assuming 3000 kcal p−1 d−1 (FAO pre-diction as global average by 2030), and 20% animal protein.He found this to be almost a generic value irrespective ofclimate, the reason being that regional differences in evapo-rative demand are being compensated by differences in wateruse efficiency between C3 and C4 plants.2
Applying this on the one hand to the predicted popu-lation growth till 2025 and 2050 respectively, and on theother for raising the diet in today’s developing countries to3000 kcal p−1 yr−1, Rockstrom arrived at an additional greenwater requirement of 3800 km3/yr one generation from now(by year 2025), growing to an additional 5600 km3/yr twogenerations from now (by year 2050) (Rockstrom, 2003).Noting that the total green water flows from ALL blue waterwithdrawals in 1995 was 2100 km3/yr (Shiklomanov, 2000),present water productivity indicates that additionally almost
2C3 and C4 are two different metabolic pathways associatedwith the photosynthesis fixation of carbon dioxide. C3 plants usethe C3 photosynthetic carbon reduction (PCR) cycle, while C4plants also use the C4 photosynthetic carbon assimilation (PCA)cycle. In drier and hotter climates this enables the C4 plants to bemore water efficient compared to C3 plants and decreases the watervapour loss through the stomata when assimilating carbon dioxide.Examples of C4 plants are: maize, sugarcane, sorghum and severalother grasses (Taiz and Zeiger, 1991).
www.copernicus.org/EGU/hess/hess/9/15/ Hydrology and Earth System Sciences, 9, 15–28, 2005

22 M. Falkenmark and M. Lannerstad: Consumptive water use to feed humanity – curing a blind spot
twice this quantity will have to be appropriated in the nexthalf century for alleviating hunger.
The degrees of freedom in terms of water available formeeting these water requirements are however limited sinceexperience from the past suggests that increased consumptiveuse in a river basin will reduce streamflow, impacting bothdownstream water users and their livelihoods and aquaticecosystems. A minimum flow, i.e. “environmental flow”, hasto remain in the river for protection of aquatic ecosystemsand downstream coastal ecosystems. This minimum flow hasbeen determined by different methods (Tharme, 2003). Thesimplest thumb rule estimates this amount to some 30% ofthe natural streamflow in the tropics (where aquatic life isalready adapted to a dry season), and some 50% in the tem-perate zone (with precipitation all year round) (Smakthin etal., 2004).
4.2 Options and global orders of magnitude
The question is therefore what the options are for meeting theadditional green water need for food production. There areprincipally three options: 1) reduced non-productive greenwater losses, i.e. increased agricultural productivity per dropof water evaporated (both irrigated and rainfed cropping sys-tems); 2) expanded irrigation; 3) horisontal expansion ofrainfed agriculture. Let us try to quantify at least the ordersof magnitude of these respective options.
As regards the first option, the basic question is howmuch of the current green water flow that can be redi-rected through “vapour shift” from non-productive evapora-tion (sometimes also called “white water”) into productivetranspiration (Rockstrom, 2003). According to Shiklomanov(2000), out of the 2500 km3/yr withdrawn globally in 1995for agriculture, 1750 km3/yr represents consumptive use. Ir-rigated agriculture has however generally been quite waste-ful in water use. Not only are the blue water losses con-siderable but part of the green water flow is non-productive.If we – as a very coarse first approximation – assume thatas a global average only say 40% of the water withdrawnreaches the plants, then 1000 km3/yr represents the produc-tive component of the consumptive use, while 1750–1000 or750 km3/yr represents non-productive component that maybe principally “regainable” by increased water productivityin terms of production per drop evapotranspired. Also rain-fed agriculture involves large non-productive losses. Out ofan assessed 5000 km3/yr of green water use (Rockstrom etal., 1999), a careful analysis of what might be achievable by2050 from increased productivity in rainfed crop productionsuggests that 1500 km3/yr might be “regainable”, i.e. reducefuture consumptive use demands by 1500 km3/yr (Falken-mark and Rockstrom, 2004). We therefore find – being asoptimistic as possible – that out of the required 3800 km3/yrby 2025 (5600 by year 2050), a maximum of 750+1500 or2250 km3/yr might possibly be regained from today’s green
water flow by productivity increase, i.e. a maximised “cropper evaporated drop” policy.
This leaves a global minimum of 3800–2250 or1550 km3/yr by year 2025 (3350 by 2050) to be covered byeither increased irrigation or expansion of rainfed agricultureinto other areas. According to optimistic assessments basedupon FAO projections (Falkenmark and Rockstrom, 2004,p. 61) we might only expect an irrigation expansion of some600 km3/yr – this is the part of the green water that will haveevident blue water consequences. Even these very optimistic“guesstimates” leaves at least 1000 km3/yr by 2025 (2800 by2050) to be covered by horizontal expansion into grasslandsand forests.
4.3 The blue water perspective: conflict with environmen-tal flow
What these approximations suggest is that feeding human-ity involves the risk that globally river depletion rises fromcurrent 2100 km3/yr (Shiklomanov’s estimate of consump-tive blue water use) to 2700 km3/yr by a moderately expand-ing irrigation. (Whether irrigation is based on surface or re-newable groundwater has limited relevance since consump-tive groundwater use is equivalent to transforming blue lowflow recharge to green water flow). Increased river depletionwill aggravate both the societal water stressed situation andfurther hurt already degraded aquatic ecosystems.
The current over-appropriation of streamflow has beenhighlighted by Smakthin et al. (2003) who analysed stream-flow in relation to minimum requirements for healthy aquaticecosystems (30% in dry climate regions). They showedthat more than 70% of the flow is already being withdrawnin a broad belt from Mexico through North Africa, WestAsia, Central Asia to North China. Considering the un-derlying data, which are withdrawal data that do not dis-tinguish consumptive from non-consumptive water use, themap, however, fortunately exaggerates the impression ofover-commitment.
Evidently, the basic river depletion conflict of interest isbetween more consumptive use for feeding humanity andmore baseflow in the rivers for environmental flow protec-tion. Figure 5 gives an idea of the situation by 1995 for anumber of river basins in India, China, U.S., and for recentyears for a couple of African basins. The vertical scale showswithdrawal-to-availability ratio, where maximum 70% is ac-ceptable since the remaining 30% have to be left uncom-mitted for environmental flow requirements. The horizontalscale shows water crowding level.
5 Degrees of freedom in terms of consumptive water use
5.1 Over-appropriated regions
The diagram (Fig. 5) shows that in S and E Asia, the 70%withdrawal level was surpassed in a whole set of large basins
Hydrology and Earth System Sciences, 9, 15–28, 2005 www.copernicus.org/EGU/hess/hess/9/15/
M. Falkenmark and M. Lannerstad: Consumptive water use to feed humanity – curing a blind spot 23
14
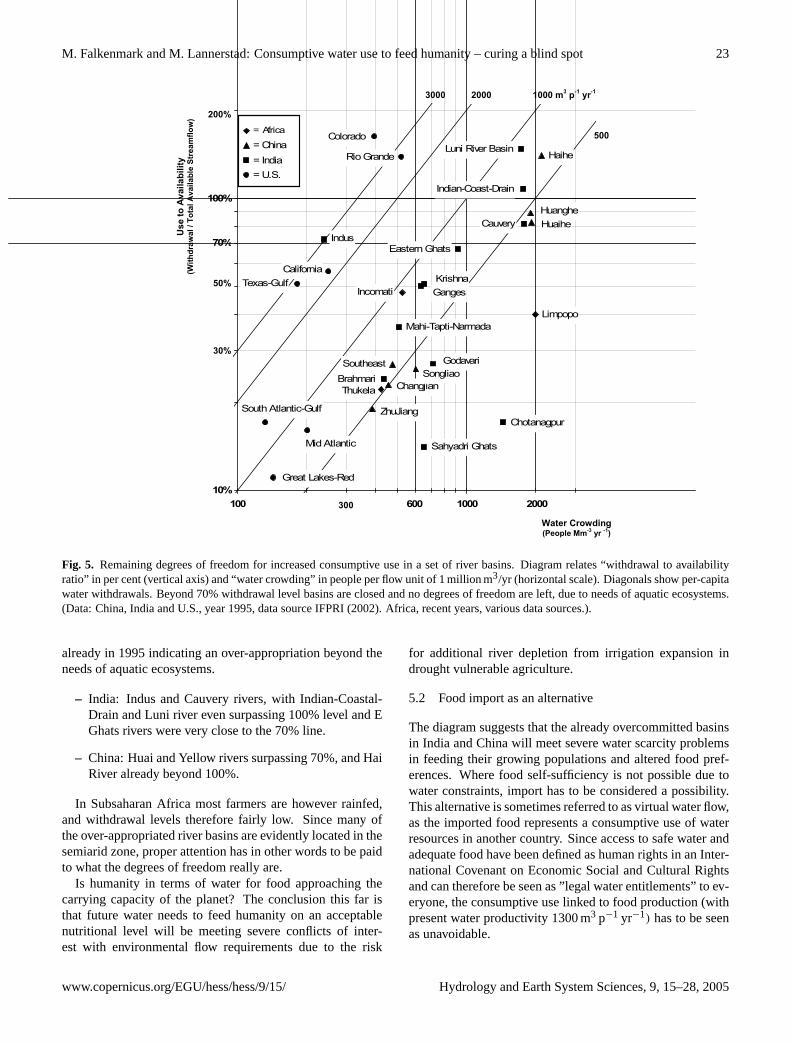
Fig. 5. Remaining degrees of freedom for increased consumptive use in a set of river basins. Diagram relates “withdrawal to availability ratio” in per cent (vertical axis) and “water crowding” in people per flow unit of 1 million m3/yr (horizontal scale). Diagonals show per-capita water withdrawals. Beyond 70% withdrawal level basins are closed and no degrees of freedom are left, due to needs of aquatic ecosystems. (Data: China, India and U.S., year 1995, data source IFPRI (2002). Africa, recent years, various data sources.). 5 Degrees of freedom in terms of consumptive water use 5.1 Over-appropriated regions The diagram (Fig. 5) shows that in S and E Asia, the 70% withdrawal level was surpassed in a whole set of large basins already in 1995 indicating an over-appropriation beyond the needs of aquatic ecosystems.
Haihe= China= India= U.S.
= Africa
Limpopo
Sahyadri Ghats
Eastern Ghats
Cauvery
Godavari
Krishna
Indian-Coast-Drain
Chotanagpur
Brahmari
Luni River Basin
Mahi-Tapti-Narmada
Indus
Ganges
70%
600 2000
Rio Grande
Colorado
California
Mid Atlantic
Great Lakes-Red
South Atlantic-Gulf
Texas-Gulf
HuaiheHuanghe
ChangjianSongliao
ZhuJiang
Southeast
Thukela
Incomati
10%
100%
100 1000
2000 3000 1000 m3 p-1 yr-1
Water Crowding (People Mm-3 yr -1)
200%
30%
50%
300
Use
to A
vaila
bilit
y (W
ithdr
awal
/ To
tal A
vaila
ble
Stre
amflo
w)
500
Fig. 5. Remaining degrees of freedom for increased consumptive use in a set of river basins. Diagram relates “withdrawal to availabilityratio” in per cent (vertical axis) and “water crowding” in people per flow unit of 1 million m3/yr (horizontal scale). Diagonals show per-capitawater withdrawals. Beyond 70% withdrawal level basins are closed and no degrees of freedom are left, due to needs of aquatic ecosystems.(Data: China, India and U.S., year 1995, data source IFPRI (2002). Africa, recent years, various data sources.).
already in 1995 indicating an over-appropriation beyond theneeds of aquatic ecosystems.
– India: Indus and Cauvery rivers, with Indian-Coastal-Drain and Luni river even surpassing 100% level and EGhats rivers were very close to the 70% line.
– China: Huai and Yellow rivers surpassing 70%, and HaiRiver already beyond 100%.
In Subsaharan Africa most farmers are however rainfed,and withdrawal levels therefore fairly low. Since many ofthe over-appropriated river basins are evidently located in thesemiarid zone, proper attention has in other words to be paidto what the degrees of freedom really are.
Is humanity in terms of water for food approaching thecarrying capacity of the planet? The conclusion this far isthat future water needs to feed humanity on an acceptablenutritional level will be meeting severe conflicts of inter-est with environmental flow requirements due to the risk
for additional river depletion from irrigation expansion indrought vulnerable agriculture.
5.2 Food import as an alternative
The diagram suggests that the already overcommitted basinsin India and China will meet severe water scarcity problemsin feeding their growing populations and altered food pref-erences. Where food self-sufficiency is not possible due towater constraints, import has to be considered a possibility.This alternative is sometimes referred to as virtual water flow,as the imported food represents a consumptive use of waterresources in another country. Since access to safe water andadequate food have been defined as human rights in an Inter-national Covenant on Economic Social and Cultural Rightsand can therefore be seen as ”legal water entitlements” to ev-eryone, the consumptive use linked to food production (withpresent water productivity 1300 m3 p−1 yr−1) has to be seenas unavoidable.
www.copernicus.org/EGU/hess/hess/9/15/ Hydrology and Earth System Sciences, 9, 15–28, 2005
24 M. Falkenmark and M. Lannerstad: Consumptive water use to feed humanity – curing a blind spot
What we may refer to as the future minimum virtual watertrade can be estimated from the fact that the environmentalflow reserve allows maximum 70% of the natural streamflowto be allocated to food production. Basins close to or be-yond that level will have to import the surplus from betterendowed regions. Some indications of the relation betweenfood trade and blue water scarcity can be gathered from thestudies of Yang et al. (2003), showing that, statistically, foodimport tends to increase with growing water crowding belowa threshold of 1500 m3 p−1 yr−1 (Yang et al., 2003). Thiscorresponds to 670 people per flow unit on the water crowd-ing scale in Fig. 5.
Let us now assume that from the 1300 m3 p−1 yr−1, or forsimplicity say 1000 m3 p−1 yr−1, half is met by infiltratedrainfall and that the remaining half has to be met by irriga-tion. This gives a blue water need of 500 m3 p−1 yr−1. Fig-ure 5 shows that a vertical line through 670 p/flow unit onthe horizontal scale meets the 500 m3 p−1 yr−1 water use di-agonal at the level 35% use-to-availability ratio on the ver-tical scale. This suggests that food import to a particularcountry may start far below availability a withdrawal levelof 70%. The 2025 population living in countries beyonda threshold level of 600 p/flow unit has earlier been esti-mated at some 3 billion (Falkenmark, 1993). If, say, halfof their food would have to be imported, this would corre-spond to some 500 Mton/yr, implying an approximate dou-bling of the present inter-country food trade in only just be-yond 20 years in line with the warning issued in the early1990’s by A. McCalla, former chairman of CGIAR.
5.3 The example of China
China accommodates one fifth of the world’s population andis undergoing rapid economic growth, large scale urbanisa-tion and has a yearly population increase of more than 9 mil-lion (UN, 2003). This rushed development will increase thedemand for more and different food items. The progres-sively more prosperous Chinese are expected to “move upthe food chain” and consume larger quantities of water con-sumptive items as fruits, vegetables and grain-fed livestockproducts as pork, poultry and eggs (Brown, 2004). At thesame time, China is suffering from extensive blue water de-pletion in terms of both river depletion and severe ground-water overdraft. It is therefore an informative case to analysewhen considering water scarcity in relation to food securityand future global food trade (Rosegrant et al., 2002; Brown,2003a, b, 2004; Bange, 2004).
Rosegrant et al. (2002) have estimated food and agricul-tural development for China from 1995 to 2025 in line withcurrent food-water trends, a “business as usual scenario”.According to this depiction total cereal demand in China willincrease by more than 50% in that period, with a 15% in-crease of food cereals, and a 140% escalation in feed grains.The boost in feed cereal demands reflects the expected rise
in meat demand, an increase representing 39% of expectedtotal world meat demand growth. Since Chinese grain pro-duction is not expected to keep pace with demand, Rosegrantet al. picture an annual import of around 40Mton grains by2025.
Brown (2003a, b, 2004) points out that grain production inChina from 1998 till 2003 plummeted by 70 Mton – a dropthat exceeds Canada’s entire grain harvest! Several factorscontribute: decrease in grain harvested land, loss of irriga-tion water, shift to higher value crops, conversion of crop-land to other use (e.g. urban) and farm labour deficiency dueto migration to urban areas. China has so far covered pro-duction deficit by reduction of earlier huge grain reserves butwill in the near future have to rely on food production out-side its borders and need to import 30–50 Mton per year. Thisfood trade demand will dramatically change food prices onthe world market. As U.S. stands for around 50% of worldgrain export Brown anticipates a “huge umbilical cord” withseveral grain loaded ships leaving U.S. for China every day.
But strong economic growth in China since numerousyears has increased demands also for agriculture-producedraw materials such as cotton. Efforts are also ongoing totransform China’s agriculture into a market-based systemwith allocation of scarce land and water resources based onhighest value, prioritising cotton, soybeans and horticulturalcrops. Considerable trade changes are therefore emerging.Looking beyond 2004/2005 income rises and diets change inChina will on one hand reduce rice consumption and againmake China become a net rice exporter. Altered food pref-erences will on the other hand make China remain a majorwheat importer and turn China into a significant maize im-porter, for meat production and industrial uses. Protein de-mand will increase globally and China will be the most im-portant driver behind this development, projected to dependon imports for 70% of its soybean needs (Bange, 2004).
These trends have now turned China into a net-grain im-porter affecting world prices. Bange (2004) points out thatgrain stocks in China, and thus globally, have fallen dramat-ically the last years. To reduce imports recent China policydecisions therefore try to motivate farmers to switch backfrom cash-crops to staple food production. Whether success-ful or not is difficult to foresee. As pointed out by Bange:the “over-riding concern is the continuing problem of waterscarcity that may constrain China’s ability to expand cropproduction”.
5.4 Future outlook
We have now seen that expected alterations in consump-tive water use, mainly in agriculture, will be a crucial issuefor both human and ecological security already in the nearfuture. But also forest plantations, needed to replace fos-sil fuels by renewable energy to moderate climate changewill be part of the overall water equation and be involving
Hydrology and Earth System Sciences, 9, 15–28, 2005 www.copernicus.org/EGU/hess/hess/9/15/

M. Falkenmark and M. Lannerstad: Consumptive water use to feed humanity – curing a blind spot 25
18
Fig. 6. Changes over time in water partitioning in a typical basin from un-disturbed to present. The height of the figure equals the yearly precipitation over the basin. The figure shows how this water quantity “leaves the basin” (see also Fig. 1) as a green or a blue water flow and how this partitioning changes over time. (A) Virgin land has evolutionary optimised vegetation, with large green water flow. (B) Forest clearance to gain pasture and crop lands, with less green water flow from seasonal and short rooted vegetation, increase blue water flow. Green-to-blue redirection. (C) Improved agricultural techniques and crop improvement increase green water flows again, with reduced runoff, blue water, formation. Streamflow reducing land use. (D) Consumptive water use, mainly for irrigation, from river flow and groundwater together with evaporation from reservoirs directly reduce river flow and increase the amount of precipitation leaving the basin as a green water flow. Blue-to-green redirection. (not to scale) infrastructures, with intensive blue water use, together with crop and agricultural technique improvements have increased consumptive use again. Figure 6 shows a schematic visualisation of general consequences over time in a river basin in terms of green-blue partitioning caused by vegetation alterations and water resource development. The figure has a blue water perspective with the aim to show how green water flow changes affect the outflow from the basin, and thus cause river depletion. In addition to analysing changes in blue versus green flows it is from a consumptive water use basin productivity perspective also important to notice that the relation between productive and non-productive green water flows change over time. As improvements in irrigation management and agricultural practices have resulted in a gradual “vapour shift” towards a higher relative part as productive transpiration, the basin productivity increase might be much higher than the actual total green water increase implies. Blue water flows can thus be altered in three ways: 1) by vegetation changes, with increased or decreased evapotranspiration, altering runoff formation, 2) by consumptive use of renewable groundwater, reducing aquifer outflows to rivers and wetlands, or 3) consumptive water use of
(C)
Virgin land Today
GREEN WATER
BLUE WATER
Total precipitation over the basin
(A)
(B)
(D)
Time
Fig. 6. Changes over time in water partitioning in a typical basin from un-disturbed to present. The height of the figure equals the yearlyprecipitation over the basin. The figure shows how this water quantity “leaves the basin” (see also Fig. 1) as a green or a blue waterflow and how this partitioning changes over time.(A) Virgin land has evolutionary optimised vegetation, with large green water flow.(B) Forest clearance to gain pasture and crop lands, with less green water flow from seasonal and short rooted vegetation, increase bluewater flow. Green-to-blue redirection.(C) Improved agricultural techniques and crop improvement increase green water flows again, withreduced runoff, blue water, formation. Streamflow reducing land use.(D) Consumptive water use, mainly for irrigation, from river flow andgroundwater together with evaporation from reservoirs directly reduce river flow and increase the amount of precipitation input leaving thebasin as a green water flow. Blue-to-green redirection (not to scale).
consumptive water use challenges of a similar order ofmagnitude as agricultural production, according to Berndes(2002).
Also climate may be causing alterations in consumptivewater use. Such changes have not been taken into account inour study. Climate change effects are a question of time andscale: it appears to be difficult also for experts in this field toquantify and geographically locate changes in precipitationand evaporation. Most certainly climate change will influ-ence global, regional and local hydrological cycles and thedistribution of precipitation that follows increases and de-creases in evapotranspiration. Some research indicates thatthe occurrence of extreme weather conditions is increasing.If so, this will increase the difficulties for successful agri-cultural production in many areas. Sub Saharan Africa isespecially vulnerable in this respect since this area is alreadysuffering from recurrent drought years and dry spells.
In this study we have not paid attention to regional effectsof moisture recycling and the destiny of the evaporated wa-ter due to our focus on consumptive water needs. There arehowever studies on the effects of green flow alterations: fromdeforestation both on the Sahel region drought by Savenije(1996), and in terms of the savannisation of the Amazonbasin (Oyama and Nobre, 2003).
Evidently, the direct link between green and blue waterflows makes it essential to address the future from both agreen and a blue water perspective in order to be able to high-light also the trade offs involved between environmental flowand river depletion risks.
6 Conclusions and discussion
6.1 Changes in green water flow
Increase of water scarcity in many catchments is often ex-plained by decreased precipitation. The explanation in mostbasins is however NOT a reduced water input, but instead asignificant increase in consumptive water use. In this paperwe have analysed the consumptive water use as the key de-terminant affecting blue water flows, causing river depletionand groundwater overdraft.
Through a number of examples, at global and basin lev-els, different kinds of human alterations and their impacts ofgreen and blue water partitioning have been presented in thetext. According to a general trajectory seen in many semi-arid basins initial agricultural development starts with clear-ance of natural vegetation to gain farming lands, resulting ina decrease in green water flows from the basin. Later, espe-cially during last century, construction of reservoirs and irri-gation infrastructures, with intensive blue water use, togetherwith crop and agricultural technique improvements have in-creased consumptive use again. Figure 6 shows a schematicvisualisation of general consequences over time in a riverbasin in terms of green-blue partitioning caused by vegeta-tion alterations and water resource development. The figurehas a blue water perspective with the aim to show how greenwater flow changes affect the outflow from the basin, andthus cause river depletion. In addition to analysing changesin blue versus green flows it is from a consumptive water usebasin productivity perspective also important to notice thatthe relation between productive and non-productive greenwater flows change over time. As improvements in irrigation
www.copernicus.org/EGU/hess/hess/9/15/ Hydrology and Earth System Sciences, 9, 15–28, 2005
26 M. Falkenmark and M. Lannerstad: Consumptive water use to feed humanity – curing a blind spot
management and agricultural practices have resulted in agradual “vapour shift” towards a higher relative part as pro-ductive transpiration, the basin productivity increase mightbe much higher than the actual total green water increase im-plies.
Blue water flows can thus be altered in three ways:
1) by vegetation changes, with increased or decreasedevapotranspiration, altering runoff formation,
2) by consumptive use of renewable groundwater, reduc-ing aquifer outflows to rivers and wetlands, or
3) by consumptive water use of river flow, through directuse, e.g. irrigation, and through indirect use as evapora-tion from storage surfaces.
The analysis shows the importance, when discussing wa-ter use, of properly distinguishing between the consump-tive, evaporative, component of water use and the non-consumptive component, returning to the system. The latteris traditionally often perceived as “losses”, but principallyconstitutes a return flow that can be used again downstream.Moreover, the consumptive component also includes lossesin terms of excessive non-productive vapour flow from farm-lands (unnecessary evaporation).
6.2 Future
Most studies, e.g. FAO study 2015/2030 (FAO, 2003), offuture food production involve a “projection” of foresee-able changes in food consumption and production, basedupon plausible assumptions of irrigation and market develop-ment. Our study differs from these studies by being a “back-casting” estimate that aims at demonstrating the water impli-cations of taking seriously the need to feed humanity on anacceptable nutritional level (3000 kcal p−1 d−1 as predictedby FAO as an average for developing countries by 2030, outof which 20% animal protein).
In meeting future food needs large changes in green wa-ter flows can be foreseen. When taking a global perspectiveto reach proper nutrition in developing countries and of the3 billion unborn further increases in global agricultural con-sumptive water use will be requested. Based upon presentwater productivity additional future consumptive water useequals almost twice the present consumptive water use fromall withdrawals.
In the paper the order of magnitude for three options hasbeen assessed; 1) better use of present consumptive wateruse (regaining non-productive green water losses by waterproductivity increase, i.e. “vapour shift”); 2) additional waterfor irrigation to be appropriated from renewable blue waterresources; 3) horizontal expansion of rainfed agriculture intoterrestrial biomes, presently not used for agriculture, such asgrasslands and forests.
In water scarce areas food import will be a fourth option.A number of countries already to large degree rely on food
imports, such as North Africa with half their grain use basedupon imports, while other countries will most probably be-come import dependent. The most important example ofthe latter category is China. An increased taste for water-intensive food products by a growing population will exceednational production and turn China into a major player on theinternational food market, with increasing prices as a possi-ble consequence.
In areas where water resources already appear to be over-appropriated the scope for further blue water developmentappears to be limited. Many basins are approaching a with-drawal of 70% and some even go beyond 100%. To safe-guard aquatic and coastal ecosystems an environmental flowreserve of the order 30% of natural streamflow must remainin arid or semi-arid zone rivers. Already over-appropriatedrivers can thus be restored (through reduction of present con-sumptive use) by freeing water part of today’s agriculturaland societal development. In basins still open for further bluewater development environmental minimum levels will limitthe degrees of freedom. Groundwater overdrafts, with fallingwater levels, also constitute a water quantity that sooner orlater must be replaced as deepening of aquifers becomes eco-nomically unfeasible or water quality deteriorates. Reducedgroundwater use implies a need for increased river flow with-drawals with further considerations regarding environmentalflow.
Change in diet preferences towards more meat is a fac-tor that strongly influences future consumptive water needsin agriculture. There is however a major difference in live-stock/meat production: whether it is based on non-arablerangeland grazing and agriculture biomass residues, or itis based upon feed production that competes for water re-sources with food production. If feed is grown on lands thatcan produce vegetarian food for humans, the consumptivewater use on these lands, irrigated or rainfed, to produce feedcalories could instead be used for vegetarian food calories.Since efficiency in converting feed protein into meat proteinis low compared to a vegetarian diet, meat from these areasaccordingly implies a more water intensive diet.
According to FAO (2003) a quarter of the world’s landsare used for grazing and extensive pasture, and provides 30%of total beef production and 23% of mutton. As rangelandsare decreasing as a result of conversion into arable land, landdegradation etc. the opportunity for increasing the numberof animals in these systems is small. Present trends point atincreasing intensive large-scale industrial live stock produc-tion with a substantial rise in cereal based feeds. Nierenberg(2003) estimates that 43% of today’s world beef productioncomes from feedlots. Industrial enterprises globally alreadystand for 74% of poultry production, 68% of egg productionand 40% of pig meat (FAO 2003).
Hydrology and Earth System Sciences, 9, 15–28, 2005 www.copernicus.org/EGU/hess/hess/9/15/
M. Falkenmark and M. Lannerstad: Consumptive water use to feed humanity – curing a blind spot 27
6.3 Final remarks
Future human development when seen in relation to con-sumptive water use can as shown in Fig. 6, be characterisedas “Living with change, both in terms of efforts to inten-sify local production and increased water productivity on thefield and of expansion to virgin lands”. In the future furthermassive changes can be foreseen linked to human food se-curity. Already today warning signals are evident showingthat water use development has been unsustainable, with toofar reaching river depletion and falling groundwater levels.This situation seriously complicates the necessary future ex-pansion of food production and makes it a really challengingtask. Reduced streamflow evidently also reduces the quan-tity available for dilution of pollution load, influencing waterquality.
Many experts addressing local problems of socio-economic development under increasing water scarcity sug-gest transition out of agriculture as a solution. Howeveras seen globally food must be regarded as a human right.Hence maintained and expanded global food production cannot be avoided. As pointed out by Postel (1999, p. 12) citinga speech to the U.S. Senate by the Harvard anthropologistT. Weiskel “There is no such thing as a post-agricultural so-ciety”, adding “To act as if there were, is a recipe for societalcollapse”.
World future in terms of ability to feed humanity dependson many different factors and will be a choice of route limitedby the development of coping capability. Agriculture is by nomeans a static activity, new modes will develop. Adjustmentto an escalating water scarcity situation will take time. Tran-sition time will be needed for agricultural modernisation andcrop-per-drop improvement, even green houses. Food tradedevelopment is limited by purchasing power, infrastructure,trade barriers etc. Present food preferences point at moreand more water intensive food consumption patterns, but ifreversed, a less animal protein diet could be a tool towardsreducing future consumptive water use demands.
In the long term a fully developed food trade system willopen for global maximisation of comparative advantages ac-cording to regional differences in hydro-climate and hydro-logical preconditions.
Acknowledgements.Special thanks are due to A. Montanari andP. van der Zaag for valuable comments.
Edited by: H. H. G. Savenije
References
Ambio: Special Issue, Transboundary issues of shared waters, Am-bio, 23, 1–2, 2004.
Asiancs Agro-Dev. International (Pvt) Ltd.: Tarbela Dam and re-lated aspects of the Indus River Basin, Pakistan, AWCD casestudy prepared as an input to theWorld Commission on Dams,Cape Town, South Africa, 2000.
Bange, G. B.: The outlook for world grain and oilseed markets,presentation to Agricultural Outlook Conference, organised byChina’s National Grain and Information Centre, Beijing, 17–18July 2004, 2004.
Berndes, G.: Bioenergy and water: The implications of large-scalebio energy production for water use and supply, Global Environ-mental Change, 12, 253–271, 2002
Brown, L.: World Creating Food Bubble Economy Based on Un-sustainable Use of Water, Update 22: 13 March 2003-2, EarthPolicy Institute,http://earth-policy.org, 2003a.
Brown, L.: Wakeup Call on the Food Front, Update 31: 16 De-cember 2003-11, Earth Policy Institute,http://earth-policy.org,2003b.
Brown, L.: Chinas shrinking grain harvest – How its growing grainimports will affect world prices, Update 36: 10 March 2004-5,Earth Policy Institute,http://earth-policy.org, 2004.
Calder, I. R.: Forests and water – Closing the gap between publicand science perceptions, Proceedings Stockholm Water Sympo-sium 2003, Water Science & Technology, 2004.
Dyson, M., Bergkamp, G., and Scanlon, J. (Eds.): Flow, The essen-tials of environmental flows, IUCN, Gland, Switzerland, 2003.
Economist: IOU H2O, The Economist, 27 May 2000, 355, 8172,31, 2000.
Economist: Pay up or dry up, The Economist, 26 May– 1 June 2001,359, 8223, 33, 2001.
Falkenmark, M.: Landscape as life support provider, Water re-lated limitations, In: Population – the complex reality, edited by:Graham-Smith, F., The Royal Society, London, 103–116, 1993.
Falkenmark, M.: Land-water linkages: a synopsis, Land and WaterIntegration and River Basin Management, FAO Land and WaterBulletin, Rome, 1, 15–16, 1995.
Falkenmark, M. and Rockstrom, J.: Balancing humans and nature,The new approach in ecohydrology, Earthscan, London, UK,2004.
Foster, S. S. D. and Chilton, P. J.: Groundwater: the processes andglobal significance of aquifer degradation, Philosophical Trans-actions Royal Society London B, 358, 1935–1955, 2003.
Glantz, M. H.: Creeping environmental problems in the Aral Seabasin, in: Central Eurasian water crisis: Caspian, Aral and deadseas, edited by: Kobori, I. and Glantz, M. H., New York, USA,United Nations University Press, 1998.
Gleick, P. H.: The world’s water – The biennial report on freshwa-ter resources 2000–2001, Washington, D.C., USA, Island press,2000.
Gordon, L., Dunlop, M., and Foran, B.: Land cover change and wa-ter vapour flows: learning from Australia, Philosophical Trans-actions Royal Society London B, 358, 1973–1984, 2003.
Gordon, L., Jonsson, B. F., Johannessen,A., Steffen,W., Falken-mark, M., and Folke, C.: Largescale redistribution of global wa-ter vapour flows by deforestation and irrigation, in: Land use,freshwater flows and ecosystem services – In and era of globalchange, Gordon, L., 2003, Doctoral Thesis in Natural ResourcesManagement, Department of Systems Ecology, Stockholm Uni-versity, Sweden, 2004.
IFPRI: Data through personal communication with M. Rosegrantand from the book: World Water and Food to 2025, by Roseg-rant, M. V., Cai, X., and Cline, S. A., International Food PolicyResearch Institute (IFPRI), Washington, D.C., 2002.
Kendy, E., Molden, D., Steenhuis, T. S., and Liu, C.: Policies drain
www.copernicus.org/EGU/hess/hess/9/15/ Hydrology and Earth System Sciences, 9, 15–28, 2005
28 M. Falkenmark and M. Lannerstad: Consumptive water use to feed humanity – curing a blind spot
the North China Plain – Agricultural policy and groundwater de-pletion in Luancheng County, 1949–2000, Research Report 71,International Water Management Institute, Colombo, Sri Lanka,2003.
Kijne, J. W., Barker, R., and Molden, D.: Water Productivity inAgriculture – Limits and opportunities for improvement, CABIPublishing, Wallingford, UK, 2003.
L’vovich, M. I. and White, G. F.: Use and transformations of terres-trial water systems, in: The Earth as transformed by human ac-tion: Global and regional changes in the biosphere over the past300 years, edited by: Turner II, B. L., Cambridge, UK, Cam-bridge University Press, 1990.
L’vovich, M. I.: World water resources and their future, Englishtranslation, edited by: Nace, R. N., (Russian edition 1974, editedby: Mysl’, P. H., Moscow), Washington, D.C., USA, AmericanGeophysical Union, 1979.
Lannerstad, M.: Consumptive Water Use Feeds the World andMakes Rivers Run Dry, MSc Thesis, Royal Institute of Tech-nology (KTH), Stockholm, Sweden, 2002.
MDBC: Review of Cap Implementation 2001/2002 – Report of theindependent audit group, March 2003, Murray Darling BasinCommission, Canberra, Australia, 2003.
MDBC: The Impacts of Water Regulation and Storageon the Basin’s Rivers, Murray Darling Basin Com-mission, Canberra, Australia, retrieved 11 August2004, http://www.mdbc.gov.au/education/encyclopedia/water regulation/waterregulationimpact.htm, 2003.
Meybeck, M.: Global analysis of river systems: from Earth systemcontrols to Anthropocene syndromes, Philosophical TransactionsRoyal Society London B, 358, 1935–1955, 2003.
Moench, M., Burke, J., and Moench, Y.: Rethinking the approachto groundwater and food security, FAO Water Report 24, FAO,Rome, 2003.
Molden, D., Sakthivadivel, R., and Habib, Z.: Basin-level use andproductivity of water: Examples from South Asia, Colombo, SriLanka: International water management institute, IWMI researchreport 49, 2001.
Oyama, M. D. and Nobre, C. A.: A new climate-vegetation equi-librium state for Tropical South America, Geophysical ResearchLetters, 30, 23, 2199–2203, 2003
Postel, S.: Pillar of sand: Can the irrigation miracle last? New York,USA, W. W. Norton & Co., 1999.
Postel, S.: Where have all the rivers gone? Worldwatch, 8:9–19,World Watch Institute, Washington, D.C., U.S., 1995.
Ren, M. and Walker, H. J.: Environmental consequences of humanactivity on the Yellow River and its Delta, China. Physical Geog-raphy, 19, 5, 421–432, 1998.
Rockstrom, J.: Water for food and nature in drought-prone tropics:vapour shift in rain-fed agriculture, Philosophical TransactionsRoyal Society London B, 358, 1997–2009, 2003.
Rockstrom, J., Gordon, L., Folke, C., Falkenmark, M., and Engwall,M.: Linkages among water vapor flows, food production, andterrestrial ecosystems services, Conservation Ecology, 3, 2, 5,1999.
Rosegrant, M. V., Cai, X., and Cline, S. A.: World Water and Foodto 2025 International Food Policy Research Institute (IFPRI),Washington, D.C., 2002.
Savenije, H. H. G.: Does moisture feedback affect rainfall signifi-cantly?, Phys. Chem. Earth 20, 507–513, 1996.
Shah, T., Molden, D., Sakthivivadivel, R., and Seckler, D.: Theglobal groundwater situation: Overview of opportunities andchallenges, International Water Management Institute (IWMI),Colombo, Sri Lanka, 2000.
Shiklomanov, I. A.: Appraisal and assessment of world water re-sources, Water International, 25, 1, 11–32, 2000.
Smakthin, V., Revenga, C., and Doll, P.: Taking into AccountEnvironmental Water Requirements in Global-scale Water Re-sources Assessments, Comprehensive Assessment Research Re-port 2, Colombo, Sri Lanka, Comprehensive Assessment Secre-tariat, 2004.
Taiz, T. and Zeiger, E.: Plant physiology, Benjamin/CummingsPublishing Company, Redwood City, California, U.S., 1991.
Tharme, R. E.: A global perspective on environmental flow assess-ment: Emerging trends in the development and application of en-vironmental flow methodologies for rivers, Rivers research andapplications, 19, 397–441, 2003.
UN: World Population Prospects – The 2002 Revision, United Na-tions, 2003.
USDA: World Agricultural Supply and Demand Estimates,WASDE-412, 12 July 2004, U.S. Department of Agriculture, Of-fice of the chief economist, retrieved 16 July 2004,sasmehttp://www.usda.gov/oce/waob/wasde/latest.pdf, 2004.
Van der Zaag, P. and Carmo Vaz,A.: Sharing the Incomati wa-ters, cooperation and competition in the balance, Water Policy,5, 349–368, 2003.
Yang, H., Reichert, P., Abbaspour, K. C., and Zehnder, A. J. B.: Awater resources threshold and its implications for food security,in: Virtual water trade, Proceedings of the international expertmeeting on vitural water trade, Delft, The Netherlands, editedby: Hoekstra, A. Y., Value of Water, Research Report Series No.12, 2003.
Hydrology and Earth System Sciences, 9, 15–28, 2005 www.copernicus.org/EGU/hess/hess/9/15/