consumptive use of water by sugarcane paul c. ekern
TRANSCRIPT

CONSUMPTIVE USE OF WATER BY SUGARCANE
IN HAWAII
Paul C. Ekern
Technical Report No. 37
July 1970
Project Completion Report
of
EVAPOTRANSPIRATION BY SUGARCANE
OWRR Project No. A-014-HI, Grant Agreement No. 14-01-0001-1630
Principal Investigator: Paul C. Ekern
Project Period: July 1967 to September 1969
The programs and activities described herein were supported in partby funds provided by the United States Department of the Interior asauthorized under the Water Resources Act of 1964, Public Law 88-379.


ABSTRACT
Water use by sprinkler irrigated sugaroane under flat-bed culture
was measured in four 100 ft 2 by 5 ft deep hydraulioally weighed lysi
meters at the Kunia substation of the Hawaiian Sugar Planters' Assooia
tion. Nine-week-old one-eye oane transplants were set into a 5-foot
grid in Molokai Low Humio Latosol on 27 Ootober~ 1968. Water use
approaohed a 1:1 ratio with a oonventional olass A pan by late Maroh~
1969 for a 3.5 leaf area index. Average values were 0.25 in/day for
the midsummer months. The oane was ratooned on 10 May~ 1969 and water
use was reduoed to a 0.33 fraotion of pan evaporation. The oane re
grew rapidly and water use was again equivalent to pan evaporation
by July~ 1969. Neither gypsum resistanoe blooks nor the neutron
probe gave aooeptable measurements of water withdrawal from Molokai
Low Humio Latosol. Clear day net radiation over the oanopy with a
mid-day refleotanoe of 0.21 was:
net radiation = (1- refleotanoe) sunlight -0.15 ly/min.
Consumptive use by oane or pan often equalled or exoeeded the
net radiation~ indioating strong positive adveotion of heat from the
surroundings. JJuping the early stages of oane growth~ peroolate from
heavy winter rains oontained as great as 225 ppm nitrate~ but as the
oane matured~ the peroolate had less than 1 ppm nitrate though the
oontent of other solutes suoh as ohloride~ sulfate~ and silioa remained
high.
iii


CONTENTS
LIST OF FIGURES v
LIST OF TABLES"..............................................•••vii
INTRODUCTI ON 1
FIELD LOCATION AND LYSIMETER DESIGN 4
Site: Hawaiian Sugar Planters' Association Kunia Substation ... 4Constructi on Detail s ........................................•. 15
RESULTS ....................•....................................25
Lys imeter Cali bra ti on 25Water Use by Cane 32
Assessment of Water Status ..............................•..... 44Perco1ate Ana 1yses 53
DISCUSSION AND SUMMARy 58
BIBL IOGRAPHY 60
APPENDICES ....................................................•. 65
FIGURES
1. The ratio between water use by sugarcane and pan eva-poration at different growth stages 2
2. Scatter diagram of the relation between pan evaporation and percolate 1ysimeter evaporation bysugarcane 2
3. Aerial photograph of the Kunia substation, HSPA 54. Diagram of Kunia substation field I showing the
1ysimeter area 65. Roadside cut immediately adjacent to the 1ysi-
meters 8
6a. Laboratory desorption curve for disturbed sample ofMo1okai Low Humic Latoso1, 0-6 inches 9
6b. Laborato~y desorption curve for disturbed sample ofMo1okai Low Humic Latoso1, 6-12 inches 9
6c. Laboratory desorption curve for disturbed sample ofMo1okai Low Humic Latoso1, 12-18 inches 10
v

6d. Laboratory desorption curve for disturbed sample ofMo10kai Low Humic Latoso1, 18-24 inches 10
7. Laboratory calibration of Boyoucos blocks in Mo10kaisoil 11
8. Laboratory calibration of Troxler 104 probe in Mo10kaisubsoil 11
9. Laboratory calibration of P19 Nuclear Chicago probein Mo10kai and Lei1ehua soi1 13
10. Lysimeter pit during preparation of foundation 1611. Hydraulic load cells in p1ace 1812. Copper leads from load cells are encased in poly-
vinyl pipe for conveyance to edge of fie1d 1913. Styrofoam tower with insulated reservoir topped
by float recorder 2014. Three of the 1ysimeter boxes set in place on load
cells 21
15. P19 Nuclear Chicago probe in place on an access tubeand the scaler used to obtain neutron density are inoperation on the 1ysimeter 22
16. Twelve-volt sump pumo used to withdraw the perco-late 23
17. One-eye seed pieces just orior to transplantinginto field 26
18. Lysimeter area immediately after planting, 28Oc tober, 1968 27
19. Tipping bucket raingage and gasoline pump forirri ga ti on 28
20. Manometer response to successive additions ofweight on 1ysimeter IV 30
21. Daily values of water use by sugarcane duringApri 1 and May 1969 33
22. Daily evaporation values of conventional surface-levelpan compared with water use by sugarcane with fullcane canopy in April, May, July and August 1969 34
23. Cane growth just prior to harvest in early May1969 35
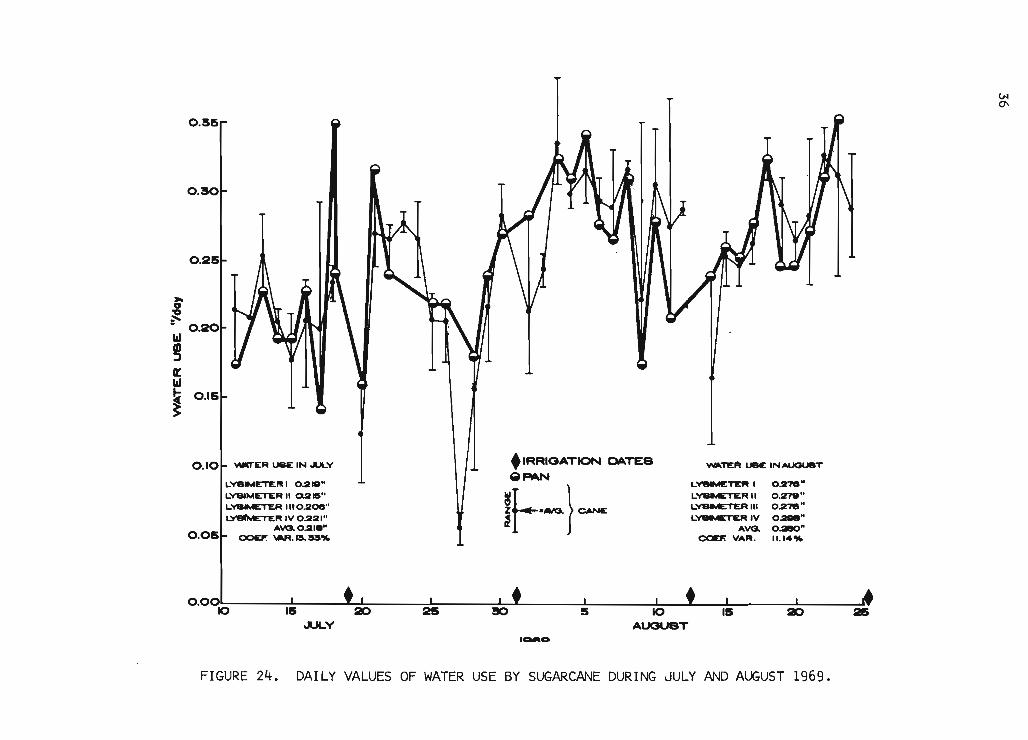
24. Daily values of water use by sugarcane during Julyand Augus t 1969 36
25. Monthly averages of water use by sugarcane, pan evaporation from conventional surface-level pan andfraction sunlight used in evaporation 37
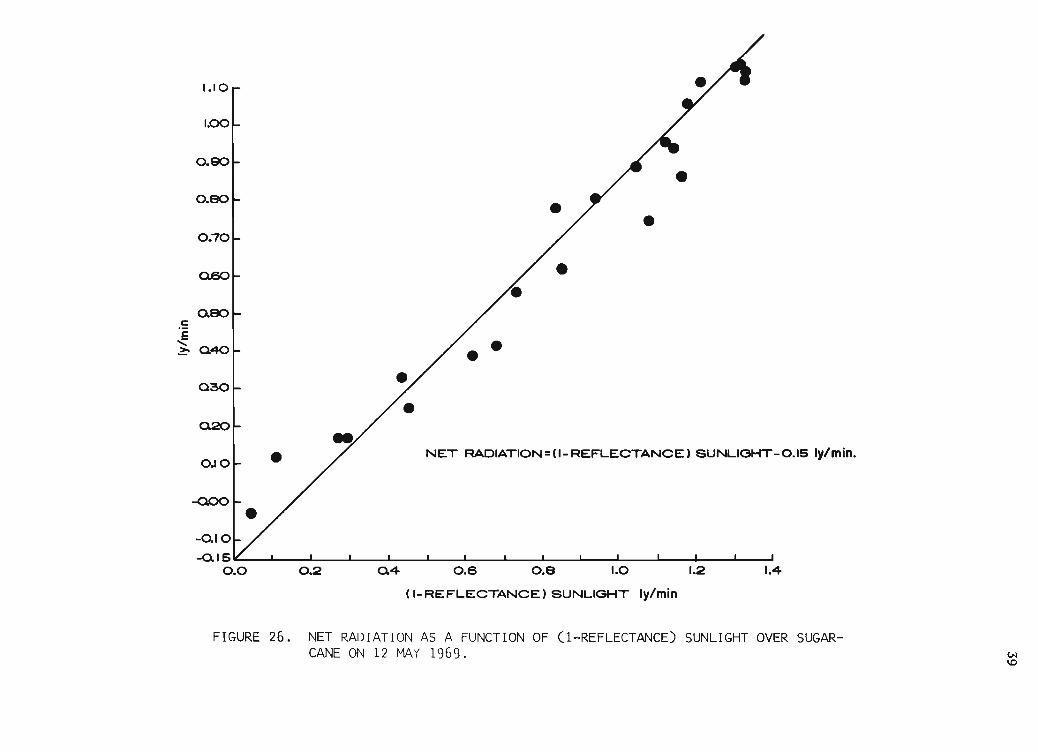
26. Net radiation as a function of (1-ref1ectance)sunlight over sugarcane on 12 r~ay 1969 39
27. Reflectance over sugarcane canopy on 1ysimeters atKunia on 24-28 April 1969 41
vi

28a.
28b.
29.
30a.
3Ob.
30e.
30d.
3l.32.
33.
34.
35.
Subsoil temperature, 1ysimeter I, January throughJuly, 1969 42
Subsoil temperature in 1ysimeter II and averagemonthly air temperature during January to July1969 43
Neutron probe measurements of volumetric waterchange in lysimeter I 46
Volumetric water content by neutron probe compared with resistance block measurements of soilmoisture content: lysimeter I, 9 March 1969 ........•.•... 47Volumetric water content by neutron probe com-pared with resistance block measurements of soilmoisture content: lysimeter I, 19 April 1969 ...•.....•... 48Volumetric water content by neutron probe com-pared with resistance block measurements of soilmoisture content: lysimeter II, 9 March 1969 49Volumetric water content by neutron probe com-pared with resistance block measurements of soilmoisture content: lysimeter II, 9 March 1969 .........••.• 50
Hysteresis loop for Mo10kai subsoil ...........•...•.•..... 51Resistance bloCK readings as a function of depth inlysimeter I 52
Cumulative loss of nitrate in percolate from alllysimeters during the winter of 1968-69 .......•.....•..... 54Chloride and nitrate concentrations in percolatefrom lysimeter I during the winter of 1968-69••...•..••... 55Concentration of the solution removed in the averagepercolate from all the lysimeters ..................•.•••.. 57
TABLES
1. Rainfall at field 26, Oahu Sugar Co. for the 26-yearperiod originating in 1926 .•...................•.......•.... 4
2. Class A pan evaporation at the Kunia substation, HSPA1963 through 1967 4
3. Sunlight recorded by Eppley pyrheliometer at Kuniasubstation, HSPA 1964 through 1968 7
4. Ratio probe/standard for P19 Nuclear Chicago instrument in Molokai soil and the corresponding volumetricand gravimetric water content and stress for surfaceand subsoi 1........................................•.....•. 14
5. Chemical analysis of 4 Molokai soils 156. Bulk densities from triplicate core samples in lysi-
meters after completion 24
vii

7. Composition of irrigation waters applied to 1ysimeters .•... 258. Uniformity of sprinkler irrigation over 1ysimeter
area 29
9. Sprinkler irrigation application rates on 1ysimetersat Kuni a...........................................•.......31
10. Reflectance over sugarcane 1ysimeters at Kunia ...•..••.••.. 3811. Net radiation as a fraction of solar radiation 4012. Contrast between neutron probe and 1ysimeter assess-
ments of water use and irrigation•......................•.. 4413. Volumetric field capacity of 1ysimeter surface soil
determined from neutron probe reading at the 9-inchdepth after irrigation or rainfall .....••..•.......•....... 45
14. Fertilization 5515. Chemical analyses of 1ysimeter surface soi1s 5616. Chemical composition of mi11ab1e cane and green
leaves harvested from 1ysimeters at the Kuniasubstation, field I, variety H 50-7209 .............•.....•. 58
APPENDICES
A. Description of Mo10kai soi1s ............................•..67B. Monthly weather reports 71C. Water use rates for individual 1ysimeters ...•.......•...... 77D. Percolate composition for individual 1ysimeters 83E. Percolate volumes for individual 1ysimeters 91
viii

INTRODUCTION
Of the total distributed water in the Hawaiian Islands for 1957,
74.5 percent was used for irrigation. On Oahu, 72.5 percent or 141,835
of the distributed 195,761 million gallons, was used for irrigation,
predominantly for sugarcane (Hawaii Water Authority, 1959).
The efficiency of furrow irrigation application in Hawaii is
only between 30 to 40 percent, in part, because of the very high infil
tration rates of the soils (Shaw and Swezey, 1937). However, the
efficiency of sprinkler application is reputedly double this (Campbell,
1963). The future of extensive use of sprinkler irrigation in Hawaiian
sugarcane agriculture demands more precise definition of the efficiency
of sprinkler operation (Blewitt, 1961 and Baver 1963).
Consumptive use of water by mature sugarcane under furrow irri
gation was measured by percolate lysimeters on Maui (Fig. 1) (Campbell,
et at., 1959, Robinson, et at., 1963, Chang, et at., 1967). However,
the precision and validity of the 1:1 use/pan ratio from these studies
has been seriously questioned (Fig. 2) (Ewart, 1967). Weighed lysi
meters in Natal also gave a 1:1 ratio between sugarcane use and pan
evaporation (Thompson and Boyce, 1967). Bermuda grass sod grown at
Wahiawa, Oahu, had a 1:1 ratio but only when the sod was kept well
watered (Ekern, 1966a).
Large hydraulic lysimeters were designed in 1967 and constructed
and planted to sugarcane under flat bed culture and sprinkler irri
gation in 1968 as a cooperative endeavor of the Water Resources Re
search Center and the Agronomy and Soils Department of the University
of Hawaii and the Hawaiian Sugar Planters' Association (HSPA) at the
HSPA Kunia substation (Ekern, 1967, 1968). These lysimeters were used
to obtain the primary measurements of the water use of sugarcane.
Other methods were explored as checks upon the moisture budget
measured by the lysimeters. The sugar industry has made extensive use
of the gypsum resistance blocks (Boyoucos blocks), hence these devices
were installed within the lysimeters to assess soil-moisture status
(Robinson, 1963a). The possible discrepancies caused by block hy
steresis were recognized for the very porous Hawaiian soils (Tanner
and Hanks, 1952). The neutron probe was used for the measurement of
soil-moisture status within the lysimeters despite the mixed success

2
18 20IS10 12 14
MONTHS
....."...J AVERAGE OF RATIOS FROM THREE FIELD
V MAXIMUM AVERAGE RATIO IN ANY ONE FIELD
1:::& MINMUM II """""
NOTE:DATA FROM LYS/METER NO.5OMITTE.
4 S 8
CANE AGE
2
La
1.4
0L2-.-
~a: 1.0
Z
~ 0.8
"a: OSw.-W
0.4~-C/)
~ 0.2
00
FIGURE 1. THE RATIO BETWEEN WATER USE BY SUGARCANE ATDIFFERENT GROWTH STAGES AND PAN EVAPORATION(AFTER CAMPBELL? ET AL., 1959).
• 100 r 2 .. 15
~ 0 ....0
~I: 0.50
~~ 0.20III
I:III 0.10
~1- 0.00 L-...........~--I_L.-..i-.......__--II_.....-~ 0 0.10 0.20 0.50 0 ....0 0.50.J PAN EVAPoRATION UN./DAY)
~"~ 0 .•0-
FIGURE 2. SCATTER DIAGRAM OF THE RELATION BETWEEN PAN EVAPORATION AND PERCOLATE LYSIMETER EVAPORATION BYSUGARCANE (AFTER EWART, 1967, CURVE WAS DEVELOPED AND REPORTED BY HSPA, IRRIGATION REPORT NO.28, TECHNICAL SUPPLEMENT #2).

\
3
of past attempts (Robinson, 1963b, Shirazi, et aZ. 3 1967, Sharma, 1968,
Yoshida, 1969). The extremely high clay and iron contents of the
Molokai soil profile make the neutron-probe calibration for this soil
markedly different from the factory standard adapted for temperate la
titude soils (Fernandez and Sherman, 1963, Holmes and Jenkinson, 1959).
The neutron probe has been used in other soils to estimate evapotrans
piration with success (Bowman and King, 1965, van Bavel and Stirk, 1967
and McGuiness, et aZ. 3 1961). The net radiation, artd thus the poten
tial evapotranspiration, over the Latosol and cane in subtropical lati
tudes is uniquely great (Ekern, 1965a). Even though the cane was
transplanted, the exposed soil causes low rates of water loss during the
early stages (Ekern, 1966b). The aerodynamic features of extreme rough
ness from the height of the mature cane canopy favor rapid evapotrans
piration, particularly when strong positive advection of heat occurs
(Chang, 1961). However, the reflectance from the full cane canopy under
conventional planting systems is relatively high and the net radiation
correspondingly less than that for bare soil or for a standard class A
pan (Ekern 1965b, 1966a, and 1966b).
Percolate waters used to assess the water budget provided means
to measure the loss of solutes in the leachate. Nitrate accumulations
in return irrigation waters on Oahu suggest that materials move readily
through the Latosols (Mink, 1962). The large supplies of mineralizable
nitrogen in the Molokai soil (Stanford, Ayres and Doi, 1965) and the
ready movement of anions (Chao and Okazaki, 1965) support the possibi
lity of extensive leaching occurring from the over-irrigation caused
by the low efficiency of furrow irrigation. Losses in the leachate
have been high when the soil is fallow (Magistad, 1934, Ayres and Ha
gihara, 1963, Takahashi, 1968). The economics of nitrogen fertili
zation as well as the pollution of ground water hinge upon percolate
amounts and quality (Stewart, et al' 3 1968, Power, 1968).
The principal objectives for this project were:
1. Measurement of consumptive use of water by sugarcane.
2. Correlation of the measured rate of use with parameters
suitable for the prediction of irrigation interval
scheduling.
3. Collection of seepage waters for the detection of the
movement of water and solutes through the soil profile.

4
FIELD LOCATION AND LYSIMETER DESIGN
Site: Hawaiian Sugar Planters· AssociationKunia Substation
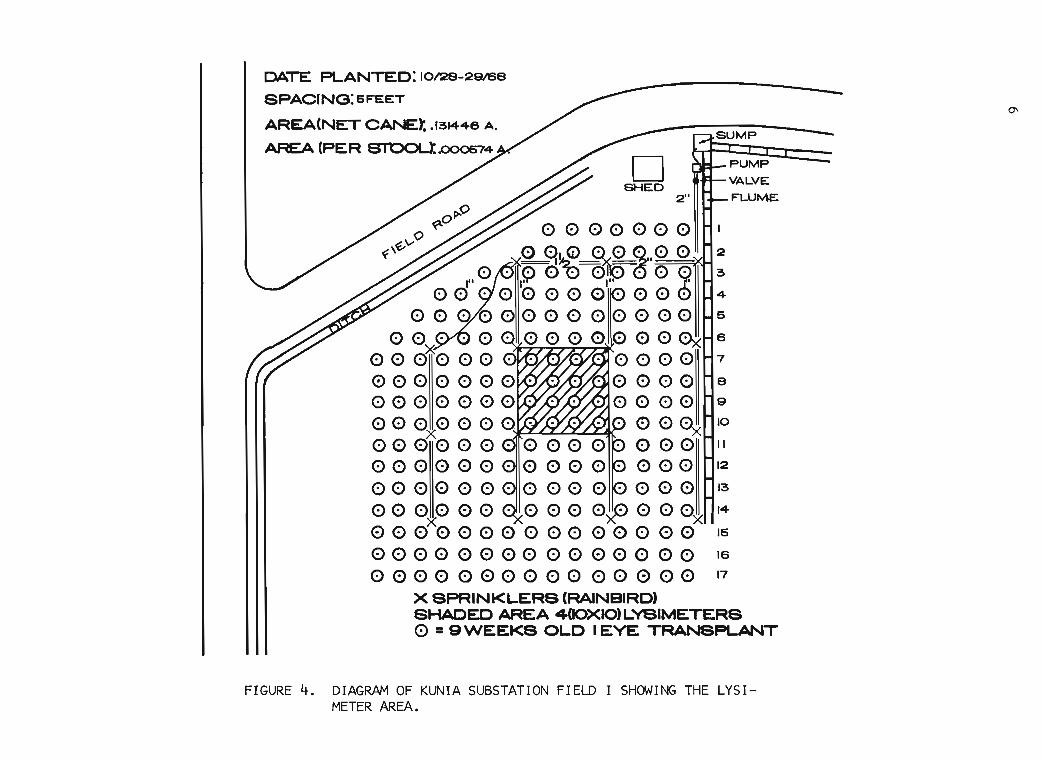
Four 10 ft x 10 ft x 5 ft deep lysimeter boxes (Ekern, 1967) were
installed in field I at the Kunia substation of the HSPA (Fig. 3). This
leeward station (Hawaiian Meteorological Index No. 740.4) has an ele-
vation of 285 feet at 21 0 23' N latitude, 158 0 2.4' W longtitude (Taliaferro,
1961). The four lysimeters are adjacent to one another, with a gap of
approximately 2 inches between them so that they form a continuum of
20' x 20' square (Fig. 4). The annual rainfall for this Kunia station was
31.30 inches for 1964-1967. The rainfall at field 26 of the Oahu Sugar
Co. (Hawaiian Meteorological Index No. 640.3), which is immediately ad
jacent to the Kunia substation, had a maximum of 46.7 inches, upper
quartile of 32.7 inches, median of 28.3 inches, lower quartile of 20.2
inches, and a minimum of 9.9 inches for the 26-year period originating in
1926. A winter rainfall maximum also occurred at this station (Table 1).
Class A pan evaporation for this site had an annual value of 70.34 inches
for 1963 through 1967, with a summer maximum (Table 2) and daily mid
summer values of 0.25 inches. Sunlight measured by an Eppley pyrhelio
meter averaged 480 1y/day with a June maximum (Table 3).
TABLE 1. RAINFALL AT FIELD 26, OAHU SUGAR CO. (INDEX 640.3) FORTHE 26-YEAR PERIOD ORIGINATING IN 1926 (IN INCHES) .:~
MONTH JAN. FEB. MM. APR. MAY JUNE JULY AUG. SEPT. OCT. NOV. DEC.
MAX. 17.2 12.6 19.4 6.1 3.6 2.1 2.3 3.7 9.9 11. 8 12.5 6.7
MEDIAN 3.7 3.7 1.9 1.0 0.9 0.3 0.4 0.9 0.9 1.2 2.0 2.6
MIN. 0.6 0.2 0.2 0.0 0.0 0.0 0.0 0.0 0.0 0.0 0.0 0.0
x TALIAFERRO. 1959. RAINFALL OF THE HAWAIIAN ISLANDS. HAWAI I WATER AUTHORITY.
TABLE 2. CLASS A PAN EVAPORATION AT THE KUNIA SUBSTATION, HSPA(INDEX 740.4) 1963 THROUGH 1967 (IN INCHES).
t'ONTH JAN. FEB. MAR. APR. MAY JUNE JULY AUG. SEPT. OCT. NOV. DEC. ANN.
4.41 4.62 5.19 5.59 6.55 7.73 7.74 7.50 6.79 5.78 4.49 3.97 70.34

. i
FIGURE 3. AERIAL PHOHSPA TOGRAPH OF• LYSIMETER PITST~~C~RUCNIA SUBSTATIONLED. '
5
0'
PUMP
VALVE
FLUME:2"
DSHED
0000000.0 ql <U ~~ ~"0 0 II 2
o . t:\ 0~ ~ ~ 0 ~ 3'" I:T' I" I
00·00000·00· 4
00<:)0000000000 5
00· ·0· 00000000X 6
o 0 0'><:0 0 0 . . . - . 0 0 0 011 7
000 0 000 .... 0 000 ~80000000· .. ·0000 9
o 0 0x0 0 0 0· . . . . 0 0 ~ 10
00 0 0 0 0 . 0 0 0 0 . 0 0 0 ~"00000000000- 000 12
000000·0000·00013o 0 0 0 0 0 . 0 0 0 0 11(.) 0 0 <:> 14
X ~ Xo 0 0 0 0 0 0 0 0 0 0 00 0 0 15
o 0 0 0 0 0 0 0 0 0 0 0 0 0 0 16
000000000000000 17
X SPRINKLERS (RAtNBIRD)SHADED AREA 400xIO)LYSIMETERSo =9WEEKS OLD I EYE TRAt'ooJSPLANT
DATE PLANTED: 10128-29188
SPACING: 6 FEET
AREA(NET CANEt. .131446 A.
AREA (PER STOOU:.Q00574
FIGURE 4. DIAGRAM OF KUNIA SUBSTATION FIELD I SHOWING THE LYSIMETER AREA.

7
TABLE 3. SUNLIGHT RECORDED BY EPPLEY PHYRHELIOMETER AT KUNIASUBSTATION, HSPA (INDEX 740.4) 1964 THROUGH 1968.
AVG. LY/DAY
~TH JAN. FEB. I'AR. APR-. MAY JL.NE JULY ALG. SEPT. OCT. t-,OV. DEC. A!>I'J.
MAX. 391 468 566 561 634 641 596 594 530 542 429 384 518MIN. 315 373 388 457 461 496 490 549 488 431 331 298 426
AVG. 364 432 462 509 548 577 565 567 511 463 375 349 482
SOIL. The Molokai soil at the site is residual on the upper part of a
cliff cut into Koolau basalt by a 95-foot (Yarmouth) sea stand (Ruhe,
et al., 1965, Swindale and Uehara, 1966, Juang and Uehara, 1968). The
official soil profile description indicates the well-structured nature
of the materials (Appendix A). The large boulders in the subsoil
(Fig. 5) presented a formidable barrier to the excavation for the ly
simeters. Electrical resistivity, seismic, and direct probings failed
to reveal the precise location of these boulders within field I, and the
arbitrary site finally chosen for the pit was liberally endowed with
such boulders. The subsoil, over-excavated to remove the boulders, was
recompacted in the pit bottom to form a firm foundation for the lysi
meters.
Desorption moisture release curves for the Molokai soil from
Kunia show the effects of the aggregation of this heavy clay soil
(Figs. 6a, b, c, and d). The curves resemble those for sand, though
the total water retained is great since the aggregates remain near
saturation until moisture stress of 100 to 200 bars (Sharma and Uehara,
1968a and Ekern, 1966b).
The response to moisture stress for the gypsum blocks determined
in the laboratory for Kunia soil material repeats the abrupt habit of
water release with stress by the Molokai soil (Fig. 7). Controlled
calibration of a Troxler 104 neutron probe in specially packed samples
of Kunia soil indicated a net soil effect equivalent to 7 or 8-percent
water (Fig. 8). The slope varied slightly from the factory standard,
only the intercept seemed changed (Shirazi, et al.,1967). Field and
laboratory calibration of a P 19 Nuclear Chicago probe in the Kunia
soil indicated a changed intercept as well as a marked departure from

FIGURE 5. ROADSIDE CUT IMv1EDIATELY ADJACENT TO THE LYSIMETERS. NOTE THE VERYLARGE BOULDERS EMBEDDED IN THE SUBSOIL.
00

.ig= I I I I I I I I I I I~I I I Ie,19201 2~4587a9~1 2~45
GRAVIMETRIC WATER CONTENT (0/0)
2012~4567a9~12~45
GRAVIMETRIC WATER CONTENT (%)
15 15
14 14
I~ I~
12 12
II ..I/)
10
I/)
II::II:: 10
« «m m
9
ZZ
9
0 a
0
l-I- a
00
:J 7:J
(J)(J) 7
W6
WII:: 8
II:: :J:J ~I- 5(J)
5
05
~~
4
~
2
FIGURE 6a. LABORATORY DESORPTION CURVE FOR DISTURBED SAMPLE OF MOLOKAI LOW HUMICLATOSOL, 0-6 INCHES.
FIGURE 6b. LABORATORY DESORPTION CURVE FOR DISTURBED SAMPLE OF ttOLOKAI LOW HUMICLATOSOL, 6-12 INCHES. \0

201234667893:)123
GRAVIMETRIC WATER CONTENT (%)
20123456789301234
GRAVIMETRIC WATER CONTENT (%)
~
0
15.- • 15
:[ I14
13
Q[ 12
II "~ 10
CD0::«10m
Z 9 Z 9
Q Ql- I-o 8 o 8
:J :JCD CD
7 7
W W0:: 0:::J 6 :J 6
l- I-CD CD
06 (5 6
~~
4
3
2
FIGURE 6c. LABORATORY DESORPTION CURVE FOR DISTURBED SAMPLE OF MOLOKAI LOW HUMICLATOSOL, 12-18 INCHES.
FIGURE 6d. LABORATORY DESORPTION CURVE FOR DISTURBED SAMPLE OF MOLOKAI LOW HUMICLATOSOL, 18-24 INCHES.

150 .. I
I• I
140~ • I•• I•I!O~
. If. I.. I• I120~ ... I.. I.
0 110 . I
a I100
Iz I
~ ICD 110
IIL I0 I-:t 10 I!!..(/) I~ IZ 70 I:) I00 eo I
~I
I
~ 50 II
.J Iw I0: 40
II
!OI- II • • • • • •• MOLOKAI 8UB8OIL
I --- MOLOI<AJ 8URP'ACE &OIL
ftJ I- I___ FACTORY CAUIlAATlON
III
10
0II 20 !O 40 50 eo 70 10 eo 100
-/_ MOISTURE BY VOLUME
12 13 14 15
10·' , I I I I I I I , I I I I , I ,
o I 2 3 4 5 6 7 8 9 10 IISOIL MOISTURE TENSION (BARS)
102
10'
CIl I:::E 10:z:o~
1LIUZ
~CIlu;1LI
a:: 100
az<l:CIl::>o:z:t:
FIGURE 7. LABORATORY CALIBRATION OF BOYOUCOSBLOCKS IN MOLOKAI SOIL CO" - 12").
FIGURE 8. LABORATORY CALIBRATION OF TROXLER104 PROBE IN MOLOKAI SUBSOIL(AFTER SHIRAZI, ET AL., 1967).
..........

12
the slope of the factory standard so that the response was identical
with the factory standard for intermediate moisture contents only
and was equivalent in the dry range (20 percent volumetric water) to
a +5.5 percent departure and to a -2 percent departure for moisture
contents near field capacity (40 percent volumetric water) (Fig. 9).
The empirical equation,
volumetric water percent = 27.1 ratio -5.0,
was used to construct Table 4 for the transformation of probe ratios
into volumetric water content. The very high clay and iron contents of
the Molokai soil would be responsible for a marked departure from the
relationships of the more nearly inert temperate latitude soil materials
(Table 5.) (Cotecchia, et aZ., 1968).
The aggregation of Molokai soil into apparent sand or gravel tex
ture causes high infiltration rates and rapid drainage from the profile.
The unsaturated capillary conductivity drops abruptly with increase in
soil suction (and concommittent decrease in soil water) so that the
effective field capacity of the soil after two days of drainage from
ring infiltration studies or field determinations is 0.1 to 0.15 bars
(Ekern, 1966b, Sharma and Uehara, 1968b, and Yokoyama, 1969). Drainage
from the profile has been sufficiently complete in the 1ysimeters so that
the subsidiary tensiometer system was not used. This agrees with earlier
experiences with similar soil materials.
AUXILIARY METEOROLOGICAL PARAMETERS. HSPA maintains a meteorological
station at Kunia about 600 feet from the 1ysimeters with rainfall, temp
erature, humidity, wind direction, and velocity as routine measurements
(Appendix B). Class A pan evaporation in a conventional installation
and in a pan elevated 5 feet above the ground are recorded daily. Sun
light is measured by an Eppley pyrheliometer, serial no. 1339, with a
calibration of 7.22 mv/ly. Weekly radiation measurements by photo
chemical tubes and by a WigWag are also made (Brodie, 1964). A
Monteith solarimeter, calibration: 3.32 mv/ly, has been inverted for
reflectance measurements. Two Thornthwaite miniature net radiome-
ters, serial no. 412 at 3.64 mv/1y and serial no. 413 at 3.34 mv/ly,
were used to determine the net radiation. A tipping bucket recording
raingage, model no. 595, is used on the site for rainfall measurement.

5040
•••••
- VOL.UIVIETRIC WATER 4Y•• 27.1 RATIO -5.0
- - FACTORY CALIBRATION
• MOL.Ot<AI SOIL
• LEILEHUA SOIL
/
•t:c.-ft•
//
2.0
1.9
o~~ 1.3
o 1.2.JIIIf 1.1fD" 1.0...m
f
V~ETRIO \'VATER %
FIGURE 9. LABORATORY CALIBRATION OF PI9 MJCLEAR CHICAGO PROBE IN t-()LOKAI AND LEILEHUASOIL. ....
c...l
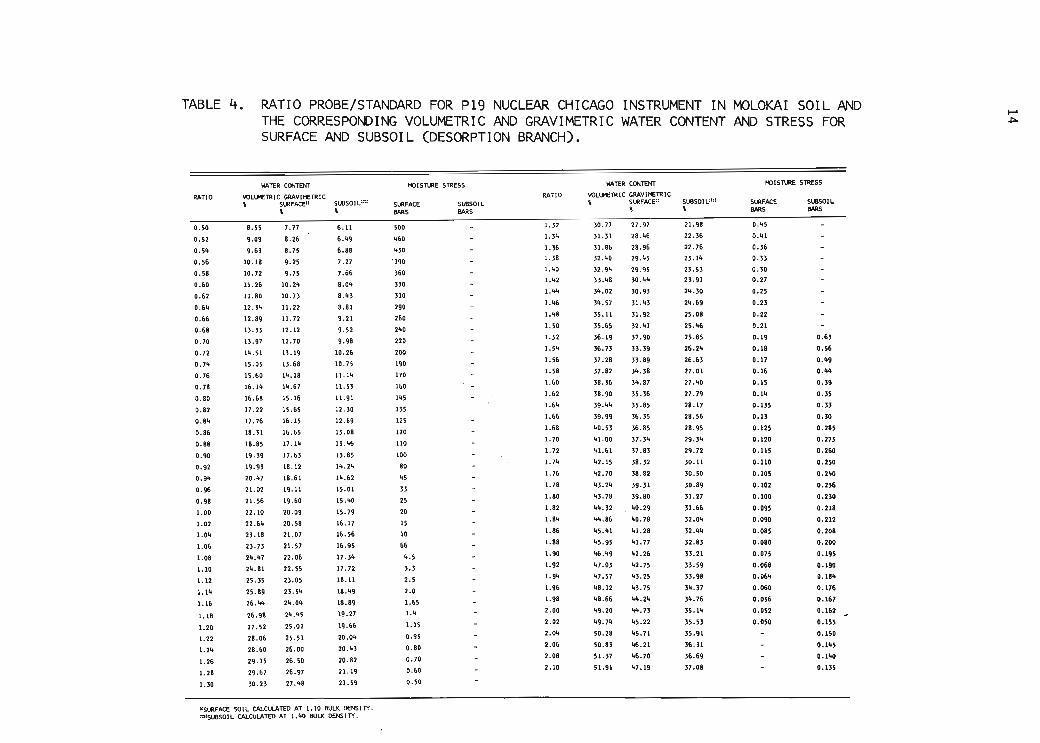
TABLE 4. RATIO PROBE/STANDARD FOR P19 NUCLEAR CHICAGO INSTRUMENT IN MOLOKAI SOIL AND ....THE CORRESPONDING VOLUMETRIC AND GRAVIMETRIC WATER CONTENT AND STRESS FOR ~
SURFACE AND SUBSOIL (DESORPTION BRANCH).
WATER CONTENT P'OIS~E STRESS WATER CCliTENT P'OIS~ STRESS
RATIO I/OlLf'ETRIC GRAVI"ETRIC RATIO I/OlLf'ETRIC GRAVI"ETRIC, SLRFACE:: SlAlSOIl"" SLRFACE SUBSOIL , SLRFACE:: SUBSOI L:::: SURFACE SlAlSOll, ,BARS BARS
, , BARS BARS
0.50 8.55 7.77 6.11 500 1.32 30.77 27.97 21.98 0.45
0.52 9.09- 8.26 6.49 460 1. 34 31.31 28.46 22.36 0.41
0.54 9.63 8.75 6.88 430 1.36 31.86 28.96 22.76 0.36
0.56 10.18 9.25 7.27 '390 1.38 32.40 29.45 23.14 0.33
0.58 10.72 9.75 7.66 360 LitO 32.94 29.95 23.53 0.30
8.04 1.42 33.48 30.44 n.91 0.270.60 11.26 10.24 330
8.43 310 1.44 34.02 30.93 24.30 0.250.62 11.80 10.73
8.81 290 1.46 34.57 31.43 24.69 0.230.64 12.34 11. 22
0.66 11.72 9.21 260 1.48 35.11 31.92 25.08 0.2212.89
0.68 13.33 12.12 9.52 240 1.50 35.65 32.41 25.46 0.21
12.70 9.98 220 1.52 36.19 32.90 25.85 0.19 0.630.70 13.97
14.51 13.19 10.26 200 1.54 36.73 33.39 26.24 0.18 0.560.72
0.74 15.05 13.68 10.75 190 I. 56 37.28 33.89 26.63 0.17 0.49
14.18 11.14 170 1.58 37.82 34.38 27.01 0.16 0.440.76 15.60
0.78 16.14 14.67 11.53 160 1.60 38.36 34.87 27.40 0.15 0.39
16.68 15.16 11.91 145 1.62 38.90 35.36 27.79 0.14 0.350.80
15.65 12.30 135 1.64 39.44 35.85 28.17 0.135 0.330.82 17.22
17.76 16.15 12.69 125 1.66 39.99 36.35 28.56 0.13 0.300.84
18.31 16.65 13.08 120 1.68 40.53 36.85 28.95 0.125 0.2850.86
18.85 17.14 13.46 110 1.70 41.00 37.34 29.34 0.120 0.2750.88
17.63 13.85 100 1.72 41.61 37.83 29.72 0.lI5 0.2600.90 19.39
14.24 80 1.74 42.15 38.32 30.11 0.110 0.2500.92 19.93 18.12
18.61 14.62 45 I. 76 42.70 38.82 30.50 0.105 0.2400.94 20.47
19.11 15.01 33 I. 78 43.24 39.31 30.89 0.102 0.2360.96 21.02
21.56 19.60 15.'+0 25 1.80 43.78 39.80 31.27 0.100 0.2300.98
15.79 20 1.82 44.32 40.29 31.66 0.095 0.2181.00 22.10 20.09
22.64 20.58 16.17 15 1.84 44.86 40.78 32.04 0.090 0.2121.02
1.04 23.18 21.07 16.56 10 1.86 45.41 41.28 32.44 0.085 0.208
1.06 23.73 21. 57 16.95 66 1.88 45.95 41. 77 32.83 0.080 0.200
1.08 24.47 22.06 17.34 4.5 1.90 46.49 42.26 33.21 0.075 0.195
1.10 24.81 22.55 17.72 3.3 1.92 47.03 42.75 33.59 0.068 0.190
25.35 23.05 18.11 2.5 1.94 47.57 43.25 33.98 0.064 0.1841.12
1.14 25.89 n.54 18.49 2.0 1.96 48.12 43.75 34.37 0.060 0.176
1.16 26.44 24.04 18.89 1.65 1.98 48.66 44.24 34.76 0.056 0.167
2l4.t.5 19.27 1.4 - 2.00 49.20 44.73 35.14 0.052 0.1621.18 26.98
25.02 19.66 1.15 2.02 49.74 45.22 35.53 0.050 0.1551.20 27.52
20.04 0.95 2.04 50.28 45.71 35.91 0.1501.22 28.06 25.51
26.00 20.43 0.80 - 2.06 50.83 46.21 36.31 - 0.1451.24 28.60
26.50 20.82 0.70 2.08 51. 37 46.70 36.69 0.1401.26 29.15
26.97 21.19 0.60 2.10 51.91 47.19 37.08 - 0.1351.28 29.67
1.30 30.23 27.48 21. 59 0.50
)CSLRFACE SOIL CALCULATED AT 1.10 BULK DENSITY.~SU8SOIL CALCULATED AT 1.40 BULK DENSITY.

15
TABLE 5. CHEMICAL ANALYSIS OF 4 MOLOKAI SOILS (AFTER FERNANDEZAND SHERMAN, 1963).
DEPTHINCHES
LOI" Si02 Ti02
MOLOKAI
P20S MnO CaO MgO Na20 K20
0-4
4-15
15-33
33-42
42-54
12.61
11.69
11.50
11.20
12.03
29.73
28.30
30.97
31.08
30.97
26.75
27.98
25.83
25.88
24.31
25.70
23.82
26.18
26.14
26.45
3.53
5.95
5.20
4.64
6.30
PAMOA
0.01
0.01
0.01
0.02
0.02
0.04 0.20
0.02 0.20
0.01 0.20
0.01 0.21
0.01 0.25
1.28 0.14 0.01
1.47 0.12 0.00
0.94 0.12 0.00
1.04 0.14 0.00
1.10 0.08 0.00
0-5
5-20
20-26
26-40
14.63
13.17
12.91
12.87
25.69
29.52
29.83
31.98
25.22
29.83
28.05
27.99
31.22
23.97
26.48
25.26
2.66
3.03
3.55
3.10
WAIPAHU
0.03
0.02
0.02
0.02
0.03 0.24
0.01 1.05
0.01 0.69
0.01 0.10
1.07 0.07
0.64 0.07
0.72 0.13
0.60 0.08
0.02
0.01
0.00
0.00
0-10
10-25
25-43
43-78
78-106
106 +
13.49
13.13
12.19
12.14
13.50
11. 32
31.03
31. 71
31.64
31.91
32.20
37.53
31.45
29.76
29.52
30.36
29.62
26.99
21.89
24.58
24.48
23.66
22.85
20.97
2.61
1.83
3.29
3.03
2.72
3.10
MAMALA
0.04
0.04
0.05
0.05
0.01
0.01
0.03
0.03
0.03
0.02
0.02
0.02
0.78 0.94 0.15 0.00
0.37 0.94 0.13 0.00
0.40 0.86 0.07 0.00
0.44 0.93 0.06 0.00
0.39 1.10 0.08 0.00
0.34 1.20 0.08 0.00
0-5
5-10
14.95
14.25
31.99
33.84
27.33
28.23
19.19
18.89
2.35
2.01
0.04
0.03
0.02
0.02
1.00
1.12
1.09
1.02
0.10
0.20
0.02
0.02
"LOSS ON IGNITION.
Construction Details
LYSIMETER INSTALLATION. The pit for the lysimeters was excavated on 15
January 1968. The sides were braced against the winter rains with
burlap bags of ready-mix concrete, placed dry so they later set into
a wall when wetted (Fig. 10). Final adjustment of the pit walls for
the 2-inch clearance about the boxes was made with poured concrete walls.
The pit bottom was thoroughly tamped with a pneumatic hammer. A
six-inch step was made so that the two mauka (mountainward) boxes were
higher than the two makai (seaward) boxes. This step was needed to
offset the I-foot drop across the 20-foot lysimeter pit caused by the 5
percent slope of the field. Concrete foundation blocks set in the
compacted soil supported railroad rails just level with the compacted
bottom. World War II landing strip grids placed across the rails and
compacted soil were overlain with 1/4-inch thick fiber-glass reinforced

FIGURE 10. LYSIMETER PIT DURING PREPARATION OF FOUNDATION. NOTE THE TEMPORARY WALLS OFSACKED CONCRETE, THE CEMENT BLOCK STEP, AW THE FOUWATION BLOCKS SUPPORTINGTHE RAILROAD RAILS.
....0\

17
polyester panels to form a smooth stable base for the hydraulic load
cells (Fig. 11). The 1/4-inch copper leads from the load cells were
brought to the eastern midpoint of the pit and carried in a trench
3 feet below the ground surface to the edge of the field where it was
connected to the open-end manometers and reservoirs used for the
pressure measurements (Fig. 12).
The manometers were mounted in a styrofoam-insulated tower 12 feet
tall. Insulated reservoirs were connected parallel to the manometers,
so that either or both devices could be used. Float recorders were
used on the reservoirs to monitor the water levels (Fig. 13).
The lysimeter boxes were set in place 1-15 June 1968 (Fig. 14).
A framework of 2 x 4's supported the aluminum neutron probe access
tubing while the lysimeters were filled. One access tube was placed
in the center of each quarter of the lysimeter boxes to coincide with
each of the cane stools and a fifth tube was put in the center of each
box. The tops of the tubes were 18 inches above the final soil level in
the lysimeters (Fig. 15). The network of perforated 3/4-inch diameter
polyvinyl drainage pipes was laid on the bottom of the box and covered
with a 4-inch layer of 5/16-inch basaltic gravel. The pipe was brought
tq the surface, connected by flexible rubber pressure hose to other
plastic pipes which extended to the edge of the field. Sump pumps,
operated by l2-volt DC current, were used to remove accumulated per
colate (Fig. 16). The pumps are capable of developing a 10-foot lift,
and easily overcame the 7-foot lift from the lysimeter bottom to the
field edge. A 3-inch layer of sieved subsoil was placed on the gravel,
then the PORVIC tensiometers, and finally a 6-inch layer of sieved sub
soil. The loose soil was wetted to cause settlement about the ten
siometers and 150 gallons (equivalent to 2.4 inches) of percolate was
pumped from the perforated drainage pipes of each lysimeter.
A grid of 6 gypsum resistance blocks was placed 52 inches below
the upper rim of the boxes immediately above the level of the tensiome
ters. Subsoil, no longer sieved, was filled and compacted with a
pneumatic hammer to bulk densities between 1.35 and 1.45 to simulate
the original dense subsoil (Table 6). These densities are sufficient
to preclude root entry and keep the root zone within the lysimeters
about the same as that in the surrounding field (Trouse and Humbert, 1961).

18
uJ
50-
Z....

", ... .,.J'
!'# ') ~
',~ ~::~ ',,-,",.;....,'.... .'
/;.':i ~,~..·i·;)
, ',;;3~(i(:~«. - ~ I " . ...,'.~".. j .. 'j. >~. . . '" 'i'" . \'..' . , .~..'. '.. .'\
/' • . i·J,.. ,":'"'.''' •
'/ t", :\ ~, . /,
' , "o(h l '."1 \:' k""" _ ;~,:.. ,,' '\.~..~ . "
I, • t'" \ "t, ""I,.
'. ",,'. ~':';"": -< (.~,' ;; , .'" ''I.~ ".>=·,1..1"' '. • f' h • ';" '\ ;,'\ ' ...... : I.' '•...; ~JI '~':-< ,;..... ":. I', "'~ ~.:..:~ J.~~' , ','" , ,~ ;' ~. •-. • '110• 'C', ~"" '~. ,,,,; -)~ ~., ••. t ~.,
" ·~·"":~~';-:/." :.~ ''::''~f_.'..,._~_~t -~~ .. '~4'.~. ,.,,;~.,L,;
<',
... ..
FIGURE 12. COPPER LEADS FRO'-1 LOAD CELLS ARE ENCASED INPOLYVINYL PIPE FOR CONVEYANCE TO EDGE OF FIELD.
.....\0

20
FIGURE 13. STYROFOAM TOWER WITH INSULATED RESERVOIRTOPPED BY FLOAT RECORDER.

FIGURE 14. THREE OF THE LYSIMETER BOXES SET IN PLACE ON LOAD CELLS. THE PERMANENT POUREDCONCRETE RETAINING WALL HAS BEEN INSTALLED. THE UPPER GALVANIZED PORTION ANDTHE SUPPORTING MEMBERS FOR THE NEUTRON PROBE ACCESS TUBES (ARROW POINTS TO ONE)ARE ALSO PICTURED.
N....

22
FIGURE 15. P19 NUCLEAR CHICAGO PROBE IN PLACE ON AN ACCESS TUBE ANDTHE SCALER USED TO OBTAIN NEUTRON DENSITY ARE IN OPERATIONON THE LYSIMETER.

23
FIGURE 16. TWELVE-VOLT SUMP PUMP USED TO WITHDRAW THE PERCOLATE.

24
TABLE 6. BULK DENSITIES FROM TRIPLICATE CORE SAMPLES INLYSIMETERS AFTER COMPLETION.
Glcc
LYSIMETER
SURFACE 3-6"
SUBSOIL 21-24"
1.120
1.325
II
1.090
1.380
III
1.050
1.480
IV
MSG
1.550
No large boulders were incorporated, but rock fragments as much as 6
inches in diameter were present in the filled subsoil. Additional sets
of blocks were emplaced and compacted within the subsoil, 6 of them 36
inches below the upper rim and 12 of them 24 inches below the lysimeter
rim. Sets of two thermistor units for measurement of subsoil tempera
tures were placed in each box at 48, 36, and 24 inches below the rim.
The upper 18 inches of fill was loosely placed, to simulate tillage.
Within this layer, a grid of 12 blocks was placed at 18 and 12 inches
below the rim and sets of three thermistors were also placed at these
depths.
Although the undisturbed Latosol stands in a vertical face, the
wetted soil, unconsolidated, has not such strength. The horizontal
wooden ribs of the original lysimeter design had to be reinforced
with a vertical aluminum channel brace at the center of each side,
chained across the center for mutual support. excessive rains
(greater than 50 year expectancy) flooded the lysimeters in late Decem
ber and again in early January and put extreme strain on the supports.
Future design of lysimeter boxes should include such a vertical brace
to prevent bowing between the ribs and incorporate the cross-tie for
internal support.
The gaps surrounding the boxes were covered with 10-mil black
polyethylene. This did not form a complete vapor barrier but was used
to prevent debris and rodents from getting into the pit. Rat baits
were placed within the pit during construction as a precaution. The
surrounding field was graded smoothly to the edges of the walls of the
pit.

25
IRRIGATION EQUIPMENT. Nine-week old one-eye transplants of variety
H 50-7209 grown by the HSPA method were set 28-29 October, 1968, in a
5-ft grid with flat bed culture (Fig. 17). This meant that a stool
developed in the center of each quarter of each lysimeter box. Rain
bird sprinkler nozzles were mounted on l5-ft high supports, set on a
20 ft grid so that one sprinkler was placed at each corner of the
combined 20' x 20' lysimeter area (Fig. 18).
Water from the Oahu Sugar Company reservoir regularly supplied to
the Kunia station' was used for irrigation. This water in the early
season was surface water, later, mixed with various amounts of pumped well
water. The composition of the water changes with the varying nature of
its source (Table 7). A gasoline-powered pump was used for distribution
TABLE 7. COMPOSITION OF IRRIGATION WATERS APPLIED TO LYSlMETERS.
DATE COMPONENTS (PPM)
1969 NITRATE CHLORIDE SULFATE SILICA POTASSILM
28 JANUARY 1.05 13.5 6.5 36.5 1.6
13 FEBRUARY 3.0 43.5 18.0 37.3 4.4
26 FEBRUARY 3.0 73.0 13.2 44.0 4.4
10 MAACH 1.1 23.5 20.0 m 4.4
26 MAACH 5.9 90.0 21.5 m m
9 APRIL 5.0 113.0 28.0 m m
21 APRIL 6.2 161.0 40.0 64.0 m
12 JUNE 3.2 172.0 37.5 66.0
to the individual sprinkler heads. Pressures of 60 psi delivered
a nominal 6 to 7 inches of water to the area during a 6-hour period
(Fig. 19). Strong gusty trade winds often prevailed during the irri
gation and application uniformity as low as 20 percent, with an
average of 61.7 percent occurred on the lysimeters (Table 8). The rates
of actual application on the lysimeters did not exceed about 1/2 in/hr.
RESULTS
Lysimeter Calibration
The calibration coefficient for the lysimeters depended upGn both
the hydraulic magnification and the recorder-leverage system. Several
different devices were explored in search of a workable compromise

I~
~,
-...
~v..J"
'"-
FIGURE 17. ONE-EYE SEED PIECES JUST PRIOR TO TRAN.SPLANTIf\G INTO FIELD.NOTE THE TRICKLE IRRIGATORS FOR EACH (ONE OF THEM 15 CIRCLED).
NC]\
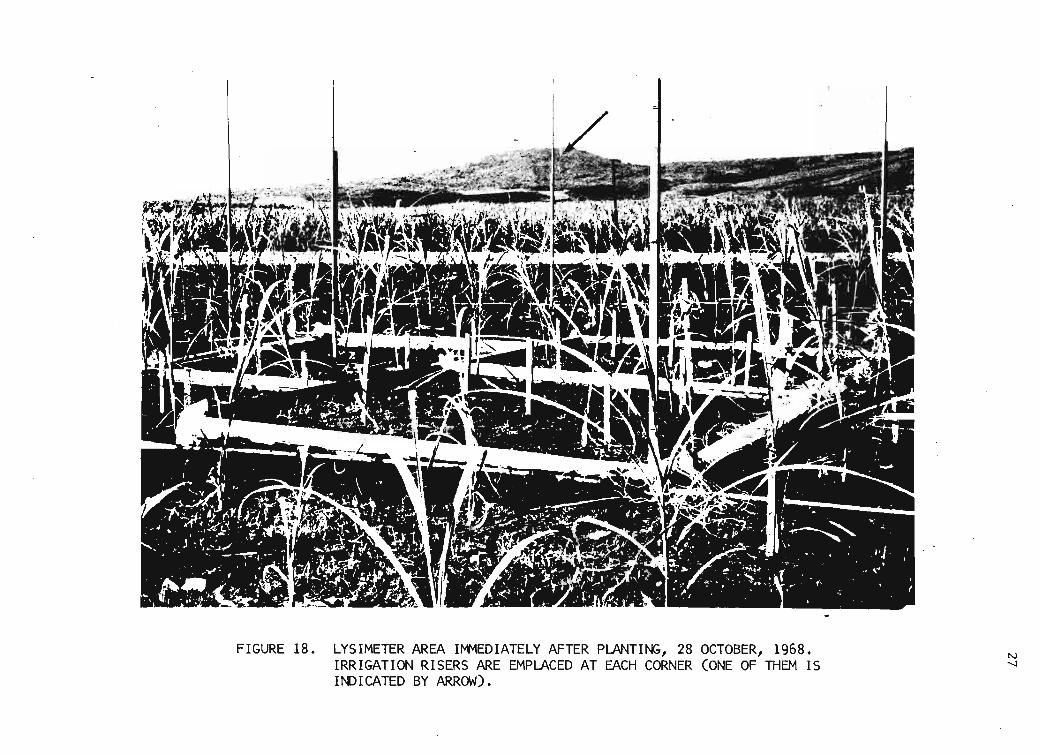
FIGURE 18. LYSIMETER AREA IMMEDIATELY AFTER PLANTING, 28 OCTOBER, 1968.IRRIGATION RISERS ARE EMPLACED AT EACH CORNER (ONE OF THEM ISIt-OICATED BY ARROW).
N-...J

FIGURE 19. TI PP ING BUCKET RAI NGAGE AND GASOLI NE PUMP FOR IRRIGATION. THE CONCRETESIDEWALL OF THE IRRIGATION DITCH IM'v1EDIATELY BEHIND THE PUMP Sti0WS THEPROXIMITY OF THE WATER SUPPLY.
N00

29
TABLE 8. UNIFORMITY OF SPRINKLER IRRIGATION OVER LYSIMETER AREA.
WIf\I)S DURINGDATE GROSS APPLICATI~: FRACTION RECEIVED ON APPLICATION
(1969) (INCHES) If\I)IVIDUAL LYSIMETERS MI/HR. @30'
27 FEB. 3.47 .694, .504 11, 13, 13, 16, 15, 14
10 MAR. 5.79 .660 3, 7, 8, 6, 6, 9, 8, 10
26 MAR. 3.28 .601 8, 9, 10, 10, 9, 12, 10, 13
9 APRIL 3.73 .536 6, 8, 9, 12, 11, 12, 12, 12
21 APRIL 5.60 .245 11, 13, 13, 14, 12, 11, 13, 15
22 MAY 3.86 .614, .910, .20 4, 8, 10, 10, 10, 10, 10
21 MAY 5.02 .474, .737, .876 M
12 JUNE 5.40 .591, .842, .857 2, 3, 2, 8, 6, 7, 8, 9
2 JULY 1.54 .974, .922, .701 9, 8, 10, 12, 10
18 JULY 3.86 .648, .518, .523 6, 8, 10, 11, 10, 10
30 JULY 4.54 .650, .500, .341 9, 12, 12, 12, 12, 12, 11, 11
::GROSS APPLICATION CALCULATED FOR 50 PSI AT HEAD, OR 3.22 GAL/MIN/SPRINKLER.
between rapidity of response and total daily sweep of the magnified
manometer level. A reservoir with a cross section sufficient to
accomodate a 4-in diameter float was needed to insure positive drive
of the recorder needle. Two 8" x 8" square insulated reservoirs were
tried but they required 3 hours to adjust to a sudden addition of
weight equivalent to a day's evaporation. Reservoirs as small as 3
inches in diameter, which responded within minutes, were tried but the
float would not drive the pen arm satisfactorily even with an auxilliary
tapping system. Galvanized 5" x 5" square reservoirs, with a 2-in
insulation of styrofoam, proved a reasonable compromise.
The ratio between the lysimeter bottom and the contact area on the
tubes was designed to be approximately 2.0, so that hydrostatic pressures
of only 15 feet of water (.5 bar) could be used. The lysimeters were
calibrated periodically by the addition of known weights near the center
of the boxes. With only the manometer connected, response was complete
within 5 minutes. Lysimeter II magnified 2.0l-fold and lysimeter IV,
1.98-fold. The near linearity of response indicates only minor differences
in the moments caused by weights placed slightly off center of the lysi
meters (Fig. 20, Table 9). Calibration based on the volumes of percolate

1.2 MANOMETER ALOI'JE. DAYTIME L.OAOING
AVERAGE HYDRAULIC MAGNIFICATION::: 2.0
~
o
0:W...~h.oc
...ZW.J
~5
"w~
~~w~a
8oc(
0.8
0.4
0.4
e///
e .........,.,././
0.8
.,.,.e ........
........................
1.2 1.6
]V
~........
........
MANOMETER READING IN In. OF WATER
FIGURE 20. MANOMETER RESPONSE TO SUCCESSIVE ADDITIONS OF WEIGHT ON LYSIMETER IV.

TABLE 9. SPRINKLER IRRIGATION APPLICATION RATES ON LYSlMETERSAT KUNIA.
31
CUMULATIVE Afv'OUNTINCHES
DATE, 1969 12, JUNE 2 JULY 18 JULY 26 AUGUST
TIM: ACCUMULATED
START
1/8
1/4
3/8
1/2
5/8
3/4
7/8
1.0
1 1/8
1 1/4
1 3/8
1 1/2
1 5/8
1 3/4
1 7/8
2
2 1/8
2 1/4
2 3/8
2 1/2
2 3/4
2 3/8
AVERAGE FOR PERIOD, IN/HR
0735
0810
0830
0846
0901
0917
0933
0946
1002
1018
1038
1100
1116
1130
1147
1208
1235
1300
1330
1347
0.44
0735
0848
0856
0905
0915
0921
0930
0.78
0720
0757
0820
0830
0845
0900
0918
0940
0956
1011
1025
1048
1056
110
1127
1141
1151
1206
1215
1229
0.485
0735
0804
0834
0855
0910
0936
0953
1014
1040
1100
1118
1138
1157
1219
1239
1258
1319
1353
1420
0.333
pumped from the lysimeters gave hydraulic magnification of 1.96 for
lysimeter I, 1.98 for lysimeter III, and 2.03 for lysimeter IV.
A number of different lever ratios was used for the several float
recorders. A 1:1 ratio provided too little amplification to determine
conveniently the differences in daily-use rates. One group of instru
ments with pen arms of 5.5 inches and levers from 1.18 inches to 3.07
inches had mechanical amplifications from 1.8 to 4.7-fold. A second
group with 7.68-in pen arms and levers from 0.79 to 4.1 inches had
mechanical magnifications from 1.86 to 9.7s-fold. The gross amplifica
tion of the combined hydraulic and mechanical systems measured by
known weights ranged from 3.5 to 19.s-fold. Expediency dictated that
the 3.s-fold overall amplification be used most frequently since it
32
allowed a 7-day average use of 0.2 in/day to be recorded on standard
charts 5 inches wide.
Water Use by Cane
The daily water use among the individual lysimeters with full
cane canopy varied surprisingly (Appendix C, Fig. 21). The average
consumptive use from 4 April· through 4 May was four percent greater
than the standard class A pan evaporation. A plot of cane use versus
pan evaporation for daily values resembles the scatter described for
the longer periods measured by the percolate lysimeters (compare Fig.
22 and Fig. 2). However the longer term cane use for 6-month old cane
in late April and early May was nearly identical with that of the con
ventional class A pan. The cane had a leaf area index of 3.5 with
the tips of the leaves reaching 14 feet (Fig. 23). In general, the
days during which pan exceeded the cane use were marked by wind which
continued at night so that the stored heat in the pan was more effective
for evaporation than for re-radiation.
The cane was harvested on 8 May 1969 to preclude lodging and to
bring the cane into the same growth stage as the newly planted field
upwind. The water use dropped abruptly from 0.207 in/day to 0.059
in/day, or from a ratio of 1.00 with pan to a ratio of 0.33 of pan.
The cane regrew rapidly, and within two months water use was again
nearly equivalent to pan evaporation (Fig. 24). The ratoon cane
averaged 20 tillers per stool, double that for the initial plant
crop. The initial tillering was in November while the ratoon was
tillered in May. There were variations in water use rate despite the
more numerous tillers of the ratoon growth. However the variations
of an individual lysimeter, which was about the mean of the entire
group, seemed random. As a consequence, the long-term averages such
as the monthly use rates were nearly identical for each lysimeter
despite the presence of the short-term fluctuations.
COMPARISON OF USE WITH SUNLIGHT AND PAN EVAPORATION. The average monthly
values for water use by the cane as the canopy closed equalled that for
the conventional surface-level pan but fell short of that for the pan
elevated 5 feet above the ground (Fig. 25). The fully canopied cane

AFTER HARVESTCANE / PAN 0.330
BEFORE HARVEST CANE/PAN 1.0OSMAYS
0.&>0
0.250
>-.g 0.200;--
zoF: 0.150
it~c(([ .
~ 0.100oQ.
~I&l
0.0503.5 LEAF AREA INDEX
• IRRIGATION DATES
~PAN
VARIETY: H 50-7209
~t--} CANE
1
2015100.000' I ' , I ' , , , , ,
10 15 20 25 &) 5
APRIL MAYIS8S
FIGURE 21. DAILY VALUES OF WATER USE BY SUGARCANE DURING APRI~ AND MA~
1969. PAN VALUES GIVEN WERE TAKEN FROM A CONVENTIONALSURFACE-LEVEL P.~.
toNtoN

0.35 •
0.30_• ••USE =0.093+ 0.808 PAN • •• ••
r 8 -O.S ... • •• •0.25L • •• • •• •• • •
•• •O.~/ ••
• • ,
•>- I , • •.g
..... 0.151 / •• • •Id
~
~0.10
0.05
•
VI~
0.05 0.10 0.15 0.20 0.25 O.&> 035
SUGAR CANE USE "/day
FIGURE 22. DAILY EVAPORATION VALUES OF CONVENTIONAL SURFACE-LEVEL PAN COMPARED WITH WATER USE BY SUGARCANE WITH FULL CANE CANOPY IN APRIL,MAY, JULY A~D AUGUST 1969.

FIGURE 23. CANE GROWTH JUST PRIOR TO HARVEST IN EARLY MAY 1969.
35
\/\oIt.'T1!:A USE INAIJOU8T
0.36
0.30
0.25
a:III~ 0.15~
O.IO~ WIOrER USE IN .AA.Y
LY8IMETEIlt I 0.218"LY8lMETER II 021l5"L't1IlMETER 1110.208"IY8fMETE:R IV 0.221"
""vo.O.2I8"0.05~ OOEP: ...... I&55'1lo
tlRRIGATION DATESQPAN
U--}CA>EL\"lIlMETEf' ILYSlMETER IILY81tlf11E:TEA III
LYaCTERIVAlYO.
CCIa" VAl...
0.278"0.278"0.278"
0 ..."0.-0"1l.14'1lo
~C1'
0.00' , Y , , , y , I y' , 'Y10 15 20 25 ~ 5 10 15 20 215
AUOUSTla-O
FIGURE 24. DAILY VALUES OF WATER USE BY SUGARCANE DURING JULY AND AUGUST 1969.

0.7
0.6
0.5II:l
.21ie-c:i 0.4.....i..0
0.3
i.....wen:J 0.2
0::W
~~
0.1
~~CD
...WATER USE BY SUGARCANE IN HAWAII ffi
>~I
_______ NET
RADIATION
5' PAN
CANE
.,~I'PAN
0.01 I , I I I I I I
1969.JAN. FEB. MAR. APR. MAY. .JUNE .JLLY AUG.
FIGURE 25. MONTHLY AVERAGES OF WATER USE BY SUGARCANE, PAN EVAPORATION FROM CONVENTIONALSURFACE-LEVEL PAN AND FRACTION SUNLIGHT USED IN EVAPORATION. Vl
'I

38
used a 0.55 to 0.58 fraction of the sunlight to evaporate water in
April and July, but a 0.718 fraction in August.
COMPARISON OF USE WITH NET RADIATION. Measured short-term radiation
over the cane had the relationship:
net radiation = (1- reflectance) sunlight -0.15 lyfmin (Fig. 26).
The measured reflectance as a fraction of the sunlight recorded by an
adjacent Eppley was 0.21 for mid-day (Table 10). The early morning
TABLE 10. REFLECTANCE OVER SUGARCANE LYSIMETERS AT KUNIA.
DATE REFLECTANCE Sl..t4LIGHT REFLECTANCE COVER
1969 LY/OAY LY/DAY % Sl..t4LIGHT
APRIL25 104.55 417.9 25.3 FULL CANE CAJ'.K)pY
26 105.15 437.0 23.1 FULL CANE CAJ'.K)pY
27 115.65 481.0 24.05 FULL CANE CAJ'.K)pY
28 123.15 598.9 20.6 FULL CANE CAJ'.K)pY
29 117.90 690.5 17.0 FULL CANE CAJ'.K)pY
30 M
MAY
3 133.11 572.1 23.3 FULL CANE CN¥JPY
4 150.66 729.0 21.5 FULL CANE CN¥JPY
5 85.48 352.8 24.2 FULL CANE CANOPY
6 75.8 317.1 23.9 FULL CANE CN¥JPY
7 141. 25 648.9 21.8 FULL CANE CAJ'.K)pY
8 93.24 436.5 21.4 FULL CANE CAJ'.K)pY
9 70.08 305.2 22.9 HARVESTED, TRASH
10 99.45 .. .. ON S~FACE
11 126.36 1053.4 22.8 HARVESTED, TRASHON SURFACE
12 171. 5 709.2 24.2 HARVESTED, TRASHON S~FACE
13 117.7 472.3 24.9 HARVESTED, TRASHON SURFACE
14 131.27 529.6 24.8 HARVESTED, TRASHON S~FACE
16 53.8 592.2 9.1 BARE LATOSOL
17 56.7 :: :: BARE LATOSOL
18 51.6 1008.3 10.8 BARE LATOSOL
19 68.0 624.2 10.9 BARE LATOSOL
JULY
2 110.9 630.8 17.55 RATOON It-ri CANE
22 102.7 667.6 15.40 RATOON It-ri CANE
31 126.0 697.7 18.05 RATOONING CANE
AUGUST
1 103.5 512.2 20.2 RATOON It-ri CANE
2 112.0 568.9 19.7 RATOONING CANE
3 114.5 577.6 19.8 RATOON It-ri CANE
4 116.3 574.8 20.2 RATOON It-ri CANE
5 104.0 547.1 19.0 RATOON It-ri CANE
6 112.5 637.3 17.65 RATOONIt-ri CANE
NET RADIATION=(I-REFLECTANCE) SUNLIGHT-O.IS Iy/min.
••
1.41.2
••
1.00.8O.s0.40.2
1.10
1.00
0.90
0.80
0.70
QSO
o.SO.:~~ 040
Q30
020
OJ0 1 •-aoo
(I-REFLECTANCE) SUNLIGHT Iy/min
FIGURE 26. NET RADIATION AS A FUNCTION OF (I-REFLECTANCE) SUNLIGHT OVER SUGARCANE ON 12 MAY 1969. (,N
I.D

40
Lnd late afternoon sunlight values recorded by the Eppley when the sun
was low in the sky are too low, whereas the values recorded for reflec
tance by the Monteith are probably still valid, thus the apparently
high fractional reflectances in the early morning and late afternoon
are likely spurious (Fig. 27). The 24-hour net radiation over cane
is a 0.50 fraction of the incident sunlight (Table 11). Both the pan
TABLE 11. NET RADIATION AS A FRACTION OF SOLAR RADIATION.
DATE NET RADIATION SLiNUGHT NET RADIATION/SUNLIGHT SURFACE COVER
1969APRIL LY/DAY LY/DAY RATIO
26 242.3 457.0 0.555 FULL CANE CANOPy
27 242.9 481.0 0.502 FULL CANE CANOPy
28 200.6 581. 2 0.345 FULL CANE CANOPy
29 280.3 598.9 0.468 FULL CANE CANOPy
30 359.0 690.5 0.520 FULL CANE CANOPy
MAY
1 353.4 648.6 0.545 FULL CANE CANOPY
4 414.0 729.0 0.568 FULL CANE CANOPY
7 317.5 648.9 0.490 FULL CANE CANOPY
12 353.2 709.2 0.497 CANE TRASH
16 366.8 592.2 0.608 BARE LATOSOL
17 292.0 v .. BARE LATOSOL
18 270.2 108.3 0.562 BARE LATOSOL
19 392.0 624.2 0.634 BARE LATOSOL
20 424.6 669.3 0.627 BARE LATOSOL
31 406.1 585.5 0.696 BARE LATOSOL
JUNE
3 345.3 702.8 0:492 RAroON ING CANE
4 333.6 592.4 0.561 RATOONING CANE
5 336.2 619.2 0.543 RArOON ING CANE
evaporation and cane use often equal or exceed this net radiation.
The indicated importation of advected heat is similar to that for
Bermuda grass and pan evaporation at nearby Wahiawa (Ekern, 1965b).
The temperature gradient from the subsoil was directed upward from
January until May, hence the soil served as a heat source for eva
potranspiration during this time (Fig. 28a, b). The gradient re-

4
30
~!..
woz~o 20W...JILW0:
• •~
o 0
* *• •
SUNLIGHT
6S7.81y 24April417.9 ty 2SAprii437.01y 26Ap"i14Sl.oIy 27 AprilS81.21y 28ApriI
18171615141312II10I I II I II I I10" , I
LOCAL TIME
FIGURE 27. REFLECTANCE OVER SUGARCANE CANOPY ON LYSIMETERS AT KUNIA ON 24-28 APRIL 1969. +:I-"

42
4.od'
~6 a.oo
U12.00
1.001212 10 ao 10 20
JAN "'E. MAR
50 10 ao 50 10JUNE ,JUl..Y
\1\ 1
i,"l'iiIi• e 45 INCH CE:PTH
o aa INCH DEPTH
• 21 INCH OEPTH
• AVERAOE CAlLYAIR TEMPERATURE
6i5"\--=22:---JL..----:!�O==---::!ao::::--....L.--:!1o::--~20::---;l;50~---:IO!::---::ao!:::--L.----:!IO==--=ao'::--;l;50~---:IO!::---::ao!:::----::50~--'!IO,JAN~. MAR APRIL MAY JUNE JULY
IBee
FIGURE 28a. SUBSOIL TEMPERATURE, LYSIMETER I, JANUARY THROUGHJULY, 1969. SOIL TEMPERATURES MEASURED 0800.

/70~ /ee~
/I
eel- I67' /
JAN FEB JULYJUNE
• 21 INCH DEPTH
o 33 NCH DEPTH
e 45 INCH DEPTH
• AVERAGE DAILY
AIR TEMPERATURE
MAY
.J2e...... •,/' /"
~////..'7
J'/7
;'/
/;'
;';'
~ .J!_ .-e"
APRILMAR
---- ...........-- ..........
9,9--_,__ ,y ...~~------&--Q 'O'-~\
e,,,
eo
76
76
79
W 73a:::J
~ 72a:wn. 71~Wt-
IL.o
TIME/Ieee
FIGURE 28b. SUBSOIL TEt1PERATURE IN LYSIMETER II AND AVERAGE MONTHLY AIR TEMPERATURE DURINGJANUARY TO JULY 1969. SOIL TEMPERATURES MEASURED 0800. ~
(;l

44
versed in May nearly coincidentally with the cane harvest and the sub
soil became a heat sink. If the soil is presumed to have a 0.5 cal/cc
heat capacity (Ekern, 1965b), the 5.4°F shift in temperature from Jan
uary to July represents a total heat storage of only 572 ly, equivalent
to a single day's sunlight. This amount of heat stor~ge could give little
acceleration to the winter and spring rates of water loss and would sub
tract only slightly from the net radiation available for evapotranspira
tion in July and August.
Assessment of Water Status
NEUTRON PROBE. Major discrepancies occur in the water budget if
the standard factory curve or a slope parallel to it is used to assess
water changes by the neutron probe. As much as 3/4 inch or 37 percent
of the removal or replenishment of 2 inches was missed if the initial
reading of the probe was taken at the 9-in depth. The effective sphere
of the probe at 9 inches extends to within 3 inches of the surface.
In order to account for the missing water, the water content of the
surface soil must be reduced to values 25 percent below that at the
6-in depth. Such withdrawal is not reasonable. Even when the probe
indications were adjusted for the proper slope, the unseen surface
layer constitutes such a large fraction of the water budget that it
cannot be ignored. This discrepancy was particularly noted when the
surface was rewetted. For example, the probe-indicated gains for ly
simeter I were less than 50 percent of the irrigation waters applied
on 26 February, 26 March, and 9 April (Table 12). The restricted
TABLE 12. CONTRAST BETWEEN NEUTRON PROBE AND LYSIMETERESTIMATES OF SOIL WATER CHANGES IN EVAPOTRANSPIRATION AND IRRIGATION.
ESTIMIITES OF WATER USE (IN INCHES)
PER 100 10 - 19 APRIL
LYSIM I LYSIM I I LYSIM III LYSIM IV
WATER USE 1.848 1.985 2.184 2.021
RAI!'I'ALL 0.160 0.160 0.160 0.160
PR06E ES TI MIlTE 1.645 1. 700 1. 200 0.906
0.043 DEFICIT 0.125 DEFICIT 0.824 DEFICIT 0.955 DEFICIT
IRRIGATIONS (IN INCHES)
PER 100 19 - 22 APRIL
LYSIM I LYS1M It LYSIM III LYSIM IV
IRRIGATION 1.260 1. 700 1.200 1.080
PR06E ESTIMIITE 0.888 1.390 1.095 1. 245
0.372 DEfICIT 0.310 DEFICIT 0.105 DEFICIT 0.165 EXCESS

45
depth of moisture withdrawal measured by the neutron probe indicated the
successful containment of the depth of root penetration by the compacted
subsoil (Fig. 29). The subsoil remained moist, near field capacity, with
a sharp discontinuity near the compacted subsoil. A tensiometer set in
lysimeter II with the cup at the 24-inch depth averaged 0.12 to 0.15 bar
and was never greater than 0.25 bar.
RESISTANCE BLOCK. The blocks do not respond well to the soil suction indi
cated by the moisture content measured by the neutron probe (Figs. 30a, b,
c, and d). They apparently must perch and fail to respond to soil suction,
particularly if the expected soil-moisture suction relation is interpreted
from the desorption branch of the hysteresis loop (Fig. 31). Even inter
preted on the sorption branch, the blocks do not respond properly unless
set directly within the active root zone of the plant (Fig. 32). When
the rates of water application by the sprinklers are well below the po
tential intake rates of the Latosol, and not even incipient ponding occurs,
the sorption branch of the rewetting curve should prevail (Rubin, 1963
and Topp and Miller, 1966). The very low rates of unsaturated capillary
conductivity and the hysteresis of this property with water content fur
ther strengthens the suspicion that the water content of the Latosol under
sprinkler irrigation is sorption based.
The in situ field capacity measured by the neutron probe the day
after sprinkler irrigation had a volumetric content of 34 percent (Table
13) .
TABLE 13. VOLUMETRIC FIELD CAPACITY OF LYSIMETER SURFACE SOILDETERMINED FROM NEUTRON PROBE READING AT THE 9-INCHDEPTH AFTER IRRIGATION OR RAINFALL.
LYSI/oETER II 111 IV AVERAGE EVENT
DATE1969
27 FEBRUARY RATIO 1. 36 1.47 1.47 1.42 1.43 2.411 IRRIGATIC)\/ ONWATER 31.9 35.0 35.0 33.5 33.7 26 FEBRUARY
11 W\RCH RATIO 1. 39 1. 54 1.62 1.47 1.51 3.75" IRRIGATICl'I Cl'IWATER 32.5 36.7 38.9 35.0 36.0 10 W\RCH
13 W\RCH RATIO 1. 31 1.45 1.48 1.41 1.41 0.5 TO 1.0" PERCOLATEWATER 30.5 34.3 35.1 32.2 32.2 PlWED~ 12 W\RCH
20 W\RCH RATIO 1.26 1. 32 1.44 1.40 1. 36WATER 29.7 30.8 34.0 32.9 31.9 1. 211 RAIN C)\/ 19 MAACH
27 W\RCH RATIO 1. 36 1. 50 1. 5 1 1.40 1.44 2~Oll IRRIGATICfIl ()'.IWATER 31.9 35.7 36.0 32.9 34.0 26 W\RCH
10 APRIL RATIO I. 33 1.51 I. 50 1.45 1.45 2.0" IRRIGATI(JI,I ()I,I
WATER 31.0 lG.u 35.6 34.3 34.3 9 APRIL
22 APRIL RATIO I. 36 1.48 1.47 1.47 1.45 1.25" IAAIGATIC)\/ ONWATER 31.9 35.2 35.0 35.0 34.3 21 APRIL
AVERAGE WATER 31.3 34.8 35.7 33.7 34.0

~0\
A S.B2" IRRIO.
S I.O"PUMPEO
C 1.20" RR
0 0.47" PUMPEO
E 2.0" IRRICJ.
F O.OS" PUMPEO
G 0.22"RR
..H 0.924" OEFICIT)
1 20"IRRIG.
J O.OS"RR.. I< (2.1 IS" OEFICIT)
L. O.OI"RRM I.S7"IRRIG.
N O.05"RR0 0.74"RRP O.I20"RR
Q 0.270"RR..R O.'70S" OEFICIT)
MAY
EF 0coAB
l8e8
H I J I<L.MN 0 PQR It DEJrlCIT8 INDICATE"Tl-lE .......OUNT 01" SOIL.
20 I , , , , .., .. , , .. I :~~R,.':.'i:~~~~~~;=,"IR"'T1ON10 20 ~ 10 20 ~ 10
MARCH APRIL.
60
ISO'
'/.46 L 33"
~ZIaI~
~4000:
~~:360it~IaI1d~>
215
FIGURE 29. NEUTRON PROBE MEASUREMENTS OF VOLUMETRIC WATER CHANGE IN LYSIMETER I.

ISO
A---Ii. LABORATORY CALIBRATION
• MEAN FOR DEPTH
HORIZONTAL BAR INDICATES RANGE OF
PROBE VALUES
VERTICAL BAR INDICATES RANGE OF
BLOCK VALUES
~Eo
~
ozo<{wa:~
8ill
180
110
160
160
140
130
NEUTRON PROBEDEPTH 8"
_--....,6---4 NEUTRON PROBE
It DEPTH 21"
NEUTRON PROBE/ DEPTH 15"
II
II,
I,Ii.,IIIIII
faI,
III,I,II
Ii.
"
40353025120' , I I ,
20
VOLUMETRIC WATER CONTENT %
FIGURE 30a. VOLUMETRIC WATER CONTENT BY NEUTRON PROBE COMPARED WITH RESISTANCEBLOCK MEASUREMENTS OF SOIL MOISTURE CONTENT: LYSIMETER I, 9 MARCH 1969. ~
--J

190
~00
NEUTRON PAOBEDEPTH US"
_---A--NEUTRON PROBE - - NE\1TRON PROBE
EEf"TH a:" A~ t"- EEPTH 55"
I. ',6
f'I
I,NEU'TRON PROBE
DEPTH 8"
170
l80
IIII
AII,
•a.Ec
~
oza~w0:
~o9m
160
160
140
130
,,,f',,,,
A,,,,,,A
A- --A LABORATORY CALIBRATION• MEAN FOR DEPTH
HORIZONTAL BAR INDICATES
OF PROBE VALUES
VERTICAL BAR INDICATES
OF BLOCK VAUJES
RANGE
RANGE
120' I I I ,
20 2S 30 36 40
VOUJMETRIC WATER CONTENT ~.
FIGURE 30b. VOLUMETRIC WATER CONTENT BY NEUTRON PROBE COMPARED WITH RESISTANCE BLOCKMEASUREMENTS OF SOIL MOISTURE CONTENT: LYSIMETER I, 19 APRIL 1969.

190...
1801-NEUTRON PROBE I NEl.JTRON PROBE
DEPTH 15" A DEPTH 21"------.....
NEUTRON PROBE
DE~
1'701-
f1c(
~ 1601-
0Z
~~ 1501-
~g.:Jm 1401-
1301-
NEUTRON PROBE
DEPTH- 9"
J.II,,
I,tIII,,,,
IA
...."..,.
/'
"JIt!I
II
II
~ - ~ LABORATORY CALIBRATION
• MEAN FOR DEPTH
HORIZONTAL BAR INDICATES RANGE OF
PROBE VALUES
VERTICAL BAR INDICATES RANGE OF
BLOCK VALUES
1201 I I I I I I25 ~ 36 40 45
VOLUMETIVE WATER (tV.)
FIGURE 30c. VOLUMETRIC WATER CONTENT BY NEUTRON PROBE COMPARED WITH RESISTANCE BLOCKMEASUREMENTS OF SOIL MOISTURE CONTENT: LYSIMETER II, 9 MARCH 1969. ...
ID

6- _ -A LABORATORY CALIBRATION
• MEAN FOR DEPTH
HORIZONTAL BAR INDICATES RANGE
OF PROBE VALUES
VERTICAL BAR INDICATES RANGE
OF BLOCK VALUES
NEUTRONPROBE DEPTH IS"
........"
170/
~f I
NEUTRON PROBE
1 OEPTH goo
~ I~ ISO I
I
0 IZ ~
9 II
W 160 I[[I
8 I
~ ~m 140IIII
1301-I,I,I
A120L-....=
25 30
_-----"l!.NE~PlDEPTH 21"
35 40
~N~DE~H.· I
46
VIo
VOLUMETRIC WATER CONTENT %
FIGURE ·30d. VOLUMETRIC WATER CONTENT BY NEUTRON PROBE COMPARED WITH RESISTANCE BLOCK MEASUREMENTS OF SOIL MOISTURE CONTENT; LYSIMETER II,9 MARCH 1969.

eo
66
I ~SUI-I< OE......eITY • 1.17
I ~ ~SPECIFIC GRAVlTV • 2.e5
l-S
ZI&JI-Z0 460ItI&J
~~
040
~9 as
50' _' , I I , , '_ .... 'A 'o. '.
TENSION eARS
FIGURE 31. HYSTERESIS LOOP FOR MOLOKAI SUBSOIL (AFTER SHARMA , 1968).lJ1....

U1N
~..
6"
1~
I/)
a.e 150o
~
oz~WII
~
§m
II()I .0 ~ Ik I;' rA. AI .1 ;I, J_FEB MAR APRIL. MAV
1989
FIGURE 32. RESIST.A.NCE BLOCK READINGS p.s A FUNCTION OF DEPTH IN LYSIMETER I.

53
The desorption volumetric water content at 0.15 bars (field capacity) for
this soil from laboratory determinations at a bulk density of 1.10 was
38.4 percent. The volumetric content at 2 bars was 25.9 percent. The
water available between 0.15 and 2 bars would be (38.4-25.9) or 12.5
percent. The probe-determined upper limit of 34.0 percent gives only
8.1 percent available. The apparent reduction in the water stored above
the 2 bar point would be (12.5-8.1)/12.5 or 35 percent. A similar re
duction of between 30 and 50 percent in the available water has been
noted for·Wahiawa soil wetted by light rain or boom sprinklers as
opposed to soil wetted by very heavy rainfall. It is pertinent to
speculate what effect this reduction (if real) might have on cane
growth and water use as a consequence of the shortened interval necessary
between irrigations and the deeper penetration of sprinkler as opposed
to flood irrigation waters. A growing body of literature supports
the contention that the rate of wetting plays an important role in the
storage of soil water (Bresler, Kemper and Hanks, 1969).
Percolate Analyses
Prior to the installation of the lysimeters, Field I had last
been planted to sorghum. The field was fallow during the installation
of the lysimeters from late 1967 until the planting in October, 1968.
Large amounts of nitrate w~re leached by percolate in the monthsI
immediately after planting (Appendices C &D and Fig. 33). Intense!
rains caused over 20 inches of percolate during the winter months.
At times the concentration of nitrate in the percolate was well abov~
200 ppm. Periodically the nitrate concentration was reduced to 15
or 20 ppm by this winter-time excessive leaching, but rose again to
more than 100 ppm during the first several months while the cane was
still small. As the cane matured, it formed an increasingly effec
tive nitrate sink which was able to remove even the nitrate from the
5 to 6 ppm concentration in the irrigation water so that the percolate
contained less than 1 ppm nitrate. Nitrate equivalent to 430 pounds
per acre was removed from lysimeter I by mid-January, an amount greater
than the 332 pounds per acre added in November as fertilizer (Table 14),
Fig. 34). Removal of materials in the harvested cane crop of 82.5
tons fresh weight in lysimeter I far outweighed the materials removed in

5
..~CDEi,40,0'
ort)zW~300
~.J
~020
10
LYSIMETERS
• ID II
A m. ~
480
384e~:errz
28e~
j3
le~ a
VI~
FIGURE 33. CUMULATIVE LOSS OF NITRATE IN PERCOLATE FROM ALL LYSIMETERS DURINGTHE WINTER OF 1968-69.

5S
• CI• N~
, ,20 12 19
MAR
lee9
.JAN.25 30 5 I
NOV. DEC1ge8
250
50
l2lL
o~o 150
IIIt-:J.Jo(/)100
FIGURE 34. CHLORIDE AND NITRATE CONCENTRATIONS IN PERCOLATE FROM LYSIMETERI DURING THE WINTER OF 1968-69.
TABLE 14. FERTILIZATION.
POUNDS/ACRE
DATE NITROGEN AS: AM1'ONIUM AMVONIUM PHOSPHORUS POTASSIU:1SULFATE PHOSPHATE PENTOXIDE OXIDE
25 NOVEMBER 1968 75 100
26 FEBRUARY 1969 75 100
7 JULY 1969 99 250 200
TOTALS: 249 250 400

56
leachates or added by the fertilizers (Table 15). Chemical analysis
TABLE 15. CHEMICAL COMPOSITION OF MILLABLE CANE (M) AND GREENLEAVES (GL) HARVESTED FROM LYSIMETERS AT THE KUNIASUBSTATION, FIELD I, VARIETY H 50 7209 (MAY, 1969).
lAB NO. PLOT NO. H2O N P K Ca Mg Si S C1 Na% % % % % % % % % %
2747 1 M 85.0 0.44 0.078 1.07 0.04 0.021 0.478 0.146 0.61
48 1 GL 78.5 .97 .141 1.88 .27 .060 2.927 .307 .98
49 2 M 84.0 .44 .085 1.23 .05 .018 .453 .133 .63
50 2 GL 79.0 1.09 .147 1.92 .26 .051 2.721 .259 1.13
51 3 M 84.7 .42 .073 1.17 .05 .021 .464 .161 .62
52 3 GL 78.5 .94 .128 1. 86 .25 .058 2.853 .293 .99
53 4 M 84.3 .38 .071 1. 23 .05 .022 .507 .159 .64
54 4 GL 79.0 .94 .130 1. 92 .25 .054 3.069 .294 1.00
ANALYSES: M. DOl, HSPA. 10 AUGUST, 1969.
HARVEST WEIGHTS: LYSIMETER I 55 CANES AT 6~/CANE EQUIVALENT TO 82.5 TONS/AII 58 6.25 88.125
I I I 50 6.37 79.62IV 57 6.10 86.925
of soil samples taken prior to fertilization indicated a fair supply of
phosphorus and this element was not added in the November or February
fertilizations (Table 16). The 50 ppm of water soluble silica in
equilibrium with the soil though slightly greater than the 30 ppm in
the percolate, did not reach the 65 ppm in the Kunia well waters or
the May and June 1969 irrigation water.
Contrary to the great reduction in the nitrate concentration of
the percolate as the cane matured, little change occurred in the chlo
content, which remained greater than 100 ppm, or the sulfate, which
increased to 150 ppm, or the silica content, which persisted near 30 ppm
(Fig. 35). Upon harvest of the cane in early May, the nitrate levels
increased abruptly from near zero to 10 to 15 ppm, values double the
content in the irrigation waters. The percolate induced from deliberate
over irrigation in April and May was meager and only very small total
amounts of nitrate were removed.
DISCUSSION AND SUMMARY
The first of the primary objectives, measurement of water use
by sprinkler irrigated cane, shows that cane, like other well-watered

..
OVER ALL AVGS..~• 804e CI
.-. Si
300
~ 2000.
~ l -r jl~~ -~
III
If",!~ ~\.x/
1...::J.J0CD
100
0 ' , .., I , ~ I ,
lJ1-..J
MAYAPRIL.JAN.DEC. FEB. MAR.
1ge8-1969
FIGURE 35. CONCENTRATION OF THE SOLUTION REt-'OVED IN THE AVERAGEPERCOLATE FROM ALL THE LYSIMETERS.
Nov.

58
TABLE 16. CHEMICAL ANl\LYSES OF LYSlMETER SURFACE" SOILS.
SAMPLED IN OCTOBER, 1968 PRIOR TO FERTILIZATION
SAMPLE NO. pHI PHOSPHORUS 2 SILICA3 ELECTRICAL CONDUCTIVITy 4PPM PPM MI LLIt+lOS/CM
1 6.6 45.9 53.3 0.142 6.6 45.4 49.2 0.123 6.8 32.4 55.3 0.1184 6.6 27.6 53.3 0.095 (SUBSOIL) 6.8 2.80 12.0 0.55
SAMPLED IN JANUARY, 1969 AFTER FERTILIZATION IN t\OVEMBER 1968
LYSIM I 6.8 48.3 59.3 0.80LYSIM II 6.8 58.4 48.0 0.88LYSIM III 6.8 45.0 48.4 0.87LYSIM IV 6.8 34.0 49.1 0.78
IpH, GLASS ELECTRODE.
2PHOSPHORUS MODIFIED TRUOG EXTRACTION (AYRES, A. S. AND HAGlHARA, H. H. 1952.HAWAIIAN PLANTER'S RECORD. 54:81-99).
3WATER EXTRACTABLE SILICA, 10:1 DILUTION, 4 HOURS EXTRACTION TLME (KILMER, V. J.1965. IN METHODS OF SOIL ANALYSIS. BLACK, C. A., et al. PART 11:959-962).
4ELECTRlCAL CONDUCTIVITY SATURATED EXTRACT (BOWER, C. A. AND WILCOX, C. V. 1965.IN METHODS OF SOIL ANALYSIS. BLACK, C. A., et al. PART 11:933-951. AMERICANSOCIETY OF AGRONOMY.
grasses, evaporates water freely and approximates a free-water surface.
Water use of 0.25 in/day is an average for midsummer use at this Kunia
site. The coefficient of variability of about 10 percent among the
four lysimeters indicates a marked lack in uniformity of the cane canopy
as an evaporating surface. Strong positive advection of heat from the
unirrigated surroundings makes evaporation equivalent or greater than
the full net radiation.
Pan evaporation alone seems to fit the second of the objectives
for a suitable parameter for estimating water use. However such short
term estimates as daily use rates determined from pan evaporation can
be quite misleading. Monitoring soil-water status with resistance
blocks is successful only when the blocks are within the active plant
root zone. Successful utilization of the neutron probe to monitor
soil-water status requires careful in situ calibration of the probe

59
and separate knowledge of the water content of the immediate surface
soil layers. Water use from the bare Latosol or from newly planted
cane is about 1/3 that of a class A pan. The cane quickly develops
a canopy equivalent to a free water surface, such as a conventionally
exposed class A pan. Poor distribution of sprinkler irrigation does not
allow the use of the percolate for estimation of the water budget, but
does allow monitoring of solute removal under the third primary objective.
After heavy winter rains, percolate from fallow or newly planted cane
can remove in excess of 500 pounds/acre of nitrate with solute concentra
tions as great as 200 ppm. The growing cane plant forms a most effec
tive sink which reduces the nitrate loss to near zero. However, losses
of other solutes such as chloride, sulfate, and silica remain rela
tively unchanged.
Sprinkler irrigation at rates less than the unusually high infil
tration rates (1 to 2 in/hr) of these well aggregated latosols rewets
the soil on the sorption branch of the moisture-suction curve. The
extreme hysteresis of the wetting-drying curve for the Molokai soil
could make the available water stored for plants under sprinkler
irrigation substantially less than that stored under furrow irrigation
and thus increase the depth of penetration of sprinkler applied waters.
ACKNOWLEDGEMENTS
The wholehearted cooperation of the HSPA Kunia staff, particu
larly to Mr. Robert Wiemer and Jose Bumanglag, and most directly to
Lester Nakatsuka is gratefully acknowledged. The crew which helped
in the installation and maintenance of the lysimeters especially during
my enforced rest in the hospital must also be remembered: Larry
Gordon, Gary Okimoto, Munna Sharma, Terry Huck, Innocient Abiaka, Dennis
Koyama, Muhammad N. Gazdar, Jack Atnip, Prem Prasad, Gong-Yuh Linn,
Tzo-Chuan Juang, Rashid Khalid, and Pedro Tenorio. All photographs
included in this report were taken by Larry Gordon.
60
BIBLIOGRAPHY
Anonymous. 1959. Water resouraes in Hawaii. Hawaii Water AuthorityReport.
Ayres, A. S., H. H. Hagihara.nitrogen and potassiwn.56(4):255-275.
1963. A Lysimeter study of Losses ofHawaiian Sugar Planters' Record
Baver, L. D. 1963. A deaade of researah progress 1950-1959. HawaiianSugar Planters' Record. 57(1):60-67.
Blewitt, R. I. 1961. Present day irrigation in Hawaii. Journal ofSoil and Water Conservation. 16(6):270-273.
Bowman, D. H., K. M. King. 1965. Determination of evapotranspirationusing the neutron saattering method. Canadian Journal of SoilScience. 45(2):117-126.
Bresler, E., W. D. Kemper, and R. J. Hanks. 1969. InfiLtration, redistribution and aonsequent evaporation of water from soiL asaffeated by wetting rate and hysteresis. Soil Science SocietyAmerican Proceedings. 33:832-840.
Brodie, H. W. 1964. Instrwnents for measuring so"lar radiation:researah and evaLuation by the Hawaiian sugar industry. 1928-1962.Hawaiian Sugar Planters' Record. 57(2):159-197.
Campbell, oR. B. 1963. Redistribution of surfaae fLow from highappUaation rate sprinkLers. Hawaiian Sugar Planters' Record.56(4):277-287.
Campbell, R. B., J. H. Chang, and D. C. Cox. 1960. EVapotranspiration in Hawaii as measured by in-fieLd Lysimeters in reLation toaLimate. Proceedings of the 10th Congress of the InternationalSociety of Sugar Cane Technologists. pp. 645-673.
Chang, J. H.Record.
1961. MiaroaUrru.te of 3ugar aane.56(3) :195-225.
Hawaiian Sugar Planters'
Chang, J. H., R. B. Campbell, H. W. Brodie, and L. D. Baver. 1967.Evapotranspiration researah at the HSPA experiment station.Proceedings of the 12th Congress of the International Societyof Sugar Cane Technologists, Puerto Rico 1965. pp. 10-25.
Chao, T. T. and E. Okazaki. 1965. The baLanae of bromide ions insoiL systems. Unpublished Pineapple Research Institute ResearchReport. 115:1-16.
Cotecchia, V., A. Inzaghi, E. Pirastu, and R. Ricchena. 1968. Influenae of the physiaaL and ahemiaaL properties of soiL in measurements of water aontent using neutron probes. Water ResourcesResearch. 4(5): 1023-1028.

61
Ekern, P. C. 1965a. The fraction of sunlight retained as net radiationin Hawaii. Journal of Geophysical Research. 70(4)785-793.
Ekern, P. C. 1965b. Disposition of net radiation by a free watersurface in Hawaii. Journal of Geophysical Research. 70(4):795-800.
Ekern, P. C. 1966a. Evapotranspiration by Bermuda grass sod rCynodondactylon L. Pers.) in Hawaii. Agronomy Journal. 58:387-390.
Ekern, P. C. 1966b. Evaporation from Low Humic Latosol in Hawaii.Journal of Applied Meteorology. 5(4):431-435.
Ekern, P. C. 1967. pilot evapotranspiration study: lysimeter design.Water Resources Research Center. University of Hawaii. TechnicalReport No. 13. 26 p.
Ekern, P. C. 1968. Consumptive use of water by sugarcane. Report ofthe 27th Annual Conference Hawaiian Sugar Cane Technologists.pp. 58-60.
Ewart, G. Y. 1967. Consumptive use and replenishment standards inirrigation. Proceedings.of the 12th Congress of the InternationalSociety of Sugar Cane Technologists, Puerto Rico 1965. pp. 34-51.
Fernandez, N. C. and G. D. Sherman. 1963. Certain morphological~
mineralogical and chemical properties of four soils of the Molokaifamily. The Philippine Agriculturalist. 47(3-4):168-182.
Holmes, J. W. and A. F. Jenkinson. 1959. Techniques for using theneutron moisture meter. Journal of Agricultural EngineeringResearch. 4:100-109.
Juang, T. C. and G. Uehara. 1968. Mica genesis in Hawaiian soils.Soil Science Society American Proceedings. 32(1):31-35.
Magistad, O. C. 1934. Lysimeter results.Research Institute Report. PRI News.
Unpublished Pineapple8:272-273.
McGuinness, J. L., F. R. Dreibelbis, and L. L. Harrold. 1961.Soil moisture measurements with the neutron method supplementweighing lysimeters. Soil Science Society American Proceedings.25(5):339-342.
Mink, J. F. 1962. Excessive irrigation and the soils and groundwater of Oahu~ Hawaii. Science. 135:672-673.
Power, J. F. 1968. What happens to fertilizer nitrogen in the soil?Journal of Soil and Water Conservation. 23(1):10-12.
Robinson, F. E. 1963a. Soil moisture tension~ sugar cane stalkelongation and irrigation interval control. Agronomy Journal.55:481-484.
62
Robinson, F. E. 1963b. Results obtained with light-weight rate meterfor neutron soil-moisture measurements. Soil Science. 96(3):218-219.
Robinson, F. E., R. B. Campbell, and J. H. Chang. 1963. Assessingthe utility of pan evaporation for irrigation of sugarcane.Agronomy Journal. 55(5):444-446.
Rubin, J., R. Steinhardt, and P. Reiniger. 1964. Soil water relationsduring rainfall infiltration: II. moisture content profilesduring rains of low intensities. Soil Science Society AmericanProceedings. 28(1):1-5.
Ruhe, R. V., J. M. Williams, R. C. Schuman, and E. L. Hill. 1965.Nature of soil parent materials in Ewa-Waipahu area.. Oahu.. Hawaii.Soil Science Society American Proceedings. 29(3):282-287.
Sharma, M. L. 1968. Effect of bulk density on neutron probe calibration in two Hawaiian soils. Unpublished manuscript. HSPAReport. 15 p.
Sharma, M. L. and G. Uehara. 1968a. Influence of soil structure onwater relations in Low Humic Latosols: 1. water retention.Soil Science Society American Proceedings. 32(6):765-770.
Sharma, M. L. and G. Uehara. 1968b. Influence of soil structure onwater relations in Low Humic Latosols: 2. water movement.Soil Science Society American Proceedings. 32(6):770-773.
Shaw, H. R. and,J. A. Swezey. 1937. Scientific irrigation management.Hawaiian Sugar Planters' Record. 41(3):199-279.
Shirazi, G. A., D. S. Judd, and M. Isobe. 1967. Calibration of neutronprobe for soil moisture measurements in Hawaiian soils. Unpublished manuscript. HSPA. 46 p.
Stanford, G., A. S. Ayres, and M. Doi. 1965. Mineralizable soil nitrogen in relation to fertilizer needs of sugarcane in Hawaii.Soil Science. 99(2):132-137.
Stewart, B. A., F. G. Viets Jr., and G. L. Hutchinson. 1968. Agricultures' effect on nitrate pollution of ground water. Journal ofSoil and Water Conservation. 23(1):13-15.
SWinda1e, L. D. and G. Uehara. 1966. Ionic relationships in the pedogenesis of Hawaiian soils. Soil Science Society American Proceedings. 30(6):726-730.
Takahashi, D. T. 1968. Fate of ammonium and nitrate fertilizers inlysimeter studies with N1S
• Hawaiian Sugar Planters' Record.58(1) :1-11.
Taliaferro, W. J. 1959. Rainfall of the Hawaiian islands. HawaiiWater Authority. 394 p.
63
Tanner, C. B. and R. J. Hanks. 1952. Moisture hysteresis in gypsummoisture blocks. Soil Science Society American Proceedings.16(1):48-51.
Thompson, G. D. and J. P. Boyce. 1967. Daily measurements of potential evapotranspiration from fully canopied sugarcane. Agricultural Meteorology. 4:267-279.
Topp, G. C. and E. E. Miller. 1966. Hysteretic moisture characteristicsand hydraulic conductivities for glass-bead media. Soil ScienceSociety American Proceedings. 30(2):156-162.
Trouse, A. C. and R. P. Humbert. 1961. Some effects of soil compactionon the development of sugar cane roots. Soil Science. 91(3):208-217.
van Bavel, C. H. M. and G. B. Stirk. 1967. Soil water measurementwith an Am2~1-Be neutron source and an application to evaporimetry. Journal of Hydrology. 5:40-46.
Yokoyama, J. S. 1969. Soil-air-water relationships in Hawaiian soils.Unpublished M. S. thesis. University of Hawaii. Department ofSoil Science. 81 p.
Yoshida, R. S. 1969. The determination of effective soil moisturestoreage by use of the neutron probe. HSPA Project Ir-ld-A.Unpublished summary report. 22 p.


APPENDICES


APPENDIX A. DESCRIPTION OF MOLOKAI SOILS.


APPENDIX A. DESCRIPTION OF MOLOKAI SOILS.
69
THE ~LOKAI SERIES IS A MEMBER OF THE FINE-SILTY, HALLOYSITIC, ISOHYPERTHERMIC FAMILY OF TROPEPTIC HAPLUSTOXS. TYPICALLY, THESE SOILS.HAVE DARKREOOISH BROWN, FRIABLE A HORIZONS THAT HAVE WEAK GRAl'lJLAR STRUCTURE, DARK REDOISH BROWN B HORIZONS THAT HAVE WEAK COARSE PRISMtlTIC STRUCTURE IN THEUPPER PART AI'lJ fWERATE FINE AI'lJ VERY FINE SUBANGULAR BLOCKY STRUCTURE IN THE LOWER PART, AND FINE BLACK CONCRETIONS THAT EFFERVESCE WITH HYDROGENPEROX IDE THROUGHOUT.
TYPIFYING PEDON: ~LOKAI SILTY CLAY LOAM - PINEAPPLE(COLORS ARE FOR ~IST SOIL UNLESS OTHERWISE NOTED.)
API -- 0-7" -- DARK REDOISH BROWN (2.5YR 3/4) SILTY CLAY LOAM, DARK RED (2.5YR 3/6) DRY; WEAK VERY FINE, FINE AND MEDIUM GRANULAR STRUCTURE; SLIGHTLYHARD, FRIABLE, SLIGHTLY STICKY, PLASTIC; MANY ROOTS; MtlNY INTERSTITIAL PORES; MANY VERY FINE BLACK CONCRETIONS THAT EFFERVESCE WITHHYDROGEN PEROXIDE; STRONG EFFERVESCENCE WITH HYDROGEN PEROXIDE; EXTREMELY ACID (pH 4.4); CLEAR WAVY BOUNDARY. (6 TO 7 INCHES THICK.)
AP2 -- 7-15"-- DARK REDDISH BROWN (2.5YR 3/4) SILTY CLAY LOAM, DARK RED (2.5YR 3/6) ORY; WEAK !"CDIUM AI'lJ COARSE SUBANGULAR BLOCKY STRUCTURE BREAKINGTO MOOERATE FINE AI'lJ VERY FINE GRANULAR STRUCTURE; SLIGHTLY HARD, FRIABLE, STICKY, PLASTIC; COM"ON ROOTS; CO"MlN VERY FINE TUBULARAI'lJ INTERSTITIAL PORES; COM"ON FINE BLACK CONCRETIONS; VIOLENT EFFERVESCENCE WITH HYDROGEN PEROXIDE; VERY STRONGLY ACID (pH 4.6);CLEAR SMOOTH BOUNOARY. (8 TO 9 INCHES THICK,)
B21 --15-35"-- DARK REDOISH BROWN (2.5YR 3/4) SILTY CLAY LOAM, RED (2.5YR 4/6) DRY; WEAK COARSE PRISMtlTIC STRUCTURE BREAKING TO WEAK COARSE SUBANGULAR BLOCKY STRUCTU<E; SLIGHTLY HARD, FRIABLE, STICKY, PLASTIC; MANY VERY FINE ANO FINE TUBULAR PORES; FEW SHINY PATCHY FACES ONPRISMS; COM"ON FINE BLACK CONCRETIONS; STRONG EFFERVESCENCE WITH HYDROGEN PEROXIDE; SLIGHTLY ACID (pH 6.5); GRADUAL WAVY BOUNDARY.04 TO 22 INCHES THICK.)
B22 --35-64"-- DARK REDDISH BROWN (2.5YR 3/4) SILTY CLAY LOAM, RED (2.5YR 4/6) DRY; WEAK COARSE PRISMtlTIC STRUCTURE BREAKING TO STRONG VERY FINEAND FINE SUBANGULAR BLOCKY STRUCTURE; MOOERATELY COf'of'ACT m PLACE, SLIGHTLY H'lRD, FIRM, STICKY, PLASTIC; MANY VERY FINE AND COM"ONTUBULAR PORES; COM'lJN PATCHY PRESSURE FACES ON PEDS; COM'lJN PATCHY CLAY FILMS ON PED FACES; FEW VERY FINE BLACK CONCRETIONS; ~DERATE
EFFERVESCENCE WI TH HYDROGEN PEROXIDE; NEUTRAL REACTION (pH 6.6); GRADUAL WAVY BCYJNDARY. (27 TO 30 INCHES THICK.)
B3 --64-72"-- DARK REDOISH BROWN (5YR 3/3) CLAY LOAM, DARK REDDISH 9ROWN (5YR 3/4) DRY; ~DERATE FINE AND VERY FINE SUBANGULAR BLOCKY AND ANGULARBLOCKY STRUCTURE; SLIGHTLY HARD, FRIABLE, SLIGHTLY STICKY, PLASTIC; COM'lJN VERY FINE AND FINE TUBULAR PORES; THIN PATCHY CLAY FILMSON PEDS; RED (2.5YR 4/6) CLAY FILMS ON THE WALLS OF LARGER PORES; COM'lJN HARD EARTHY LUMPS; FEW VERY FINE BLACK CONCRETIONS; SLIGHTEFFERVESCENCE WITH HYDROGEN PEROXIDE; NEUTRAL REACTION (pH 6.6).
TYPE LOCATION: ISLAND OF ~LOKAI, MtlUI COUNTY, HAWAII; NORTHEAST CORNER OF BLOCK 39, FIELD 305, CALIFORNIA PACKING CORPORATION, KUALAPUU, ~LOKAI,
ABOUT 4.7 MILES WEST OF KAUNAKAKAI PCYST OFFICE AI'lJ 0.35 MILE NORTH OF JUNCTION OF HIGHWAYS 46 AMl 47, AND ABOUT 200 FEET WEST OFHIGHWAY 47.
RANGE IN CHARACTERISTICS: THE NUMBER ANO SIZE OF BLACK CONCRETIONS THAT EFFERVESCE WITH HYDROGEN PEROXIDE DECREASE WITH DEPTH. SOME WEATHERED ROCKFRAGMENTS ARE THROUGHOUT THE SOIL, BUT THEY ARE ~STLY BELOW DEPTHS OF 40 INCHES. MEAN ANNUAL SOIL TEMPERATURE IS ABOUT73°F. TEXTURES SHOWN ARE "APPARENT FIELD TEXTURES." HUE OF THE A HORIZON IS 5YR, 2.5YR OR lOR, ~IST VALUE IS 2 OR 3,~IST CI'ROMt\ IS 4 OR 5, AI'lJ ORY CHROMt\ IS 4 THROUGH 6. THE HUE OF THE B2 HORIZON IS 2.5YR OR lOR, ~IST VALUE IS 2 OR 3,DRY CI'ROMt\ IS 4 THROUGH 6 AI'lJ MOIST CHROMtI IS 3 OR 4.
COMPETING SERIES AND THEIR DIFFERENTIAE: THESE ARE THE EWA, HOLC\"IUA, KEAHUA, LAHAINA, UWALA, AI'lJ WAIKAPU SOILS. THE EWA SOILS HAVE STRONG EFFERVESCENCE WITH HYDROGEN PEROXIDE THROUGHOUT AI'lJ LACK PRISMtlTIC STRUCTURE IN THE UPPER PART OF THE B HORIZONS.~LOMJA SOILS HAVE SILT LOAM UPPER B HORIZONS AI'lJ BURIED B HORIZONS WITHIN 40 INCHES OF THE SURFACE.KEAHUA SOILS HAVE 5YR OR YELLOWER HUE, AI'lJ THE UPPER PART OF THE B HORIZON HAS MOOERATE TO STRONG STRUCTURE.LAHAINA SOILS HAVE SUBANGULAR BLOCKY STRUCTURE IN THE UPPER PART OF THE B HORIZON AND NEARLY CONTINUOUSSTRESS FACES IN THE B2 HORIZON. UWALA SOILS HAVE 5YR OR YELLOWER HUE THROUGHOUT. WAIKAPU SOILS HAVEMOOERATE TO STRONG SUBANGULAR BLOCKY STRUCTURE IN THE UPPER PART OF THE B HORIZON AMl SLICKENSIDES IN THELOWER PART OF THE B HORIZON.
SETTING: THE MOLOKAI SOILS ARE ON NEARLY LEVEL TO fWERATELY STEEP UPLANOS AT ELEVATIONS FROM NEAR SEA LEVEL TO 1,500 FEET. THE SOILS FORMED INRESIDUUM WEATHERED FROM BASIC IGNEOUS ROCKS. !"CAN A/'oI'oIUAL RAINFALL IS 20 TO 25 INCHES. THE AVERAGE JANUARY TEMPERATURE IS ABOUT 71°F.,AVERAGE JULY TEMPERATURE ABOUT nOF., AM) !"CAN A/'oNJAL TEMPERATURE ABOUT 73°F.
PRINCIPAL ASSOCIATED SOILS: THESE ARE THE COMPETING EWA, HOL<MJA, LAHAINA, lAoIALA AI'lJ WAIKAPU SOILS.
DRAINAGE AI'lJ PERMEABILITY: WELL DRAINED. RUNOFF IS !"CDIUM. PERl"EABILITY IS MODERATE.
USE AI'lJ VEGETATION: USED FOR PINEAPPLE, PASTU<E, WILDLIFE, AI'lJ IRRIGATED SUGAR CANE. NATURAL VEGETATION IS KIAWE (PROSOPIS CHILENSIS), PITTEDBEAROGRASS (ANDROPOGON PERTUSUS), FEATHER FINGERGRASS (CHWRIS VIRGATA), LANTANA (LANTANA CAMARA), ILiMtI (SIDA FALLAX), AI\{)
BUFFELGRASS (PENNISETUM CILIARE).
DISTRIBUTION AI'lJ EXTENT: THIS SOIL IS ON THE ISLANDS OF ~LOKAI, LANAI, MtlUI, AI'lJ OAHU, OF HAWAII. THE EXTENT IS ABOUT 35,000 ACRES.
SERIES ESTABLISHED: THE ~LOKAI SERIES WAS CLASSIFIED AS LOW HUMIC LATOSOLS IN THE 1955 SOIL SURVEY OF HAWAI I


APPENDIX B. MONTHLY WEATHER REPORTS.


APPENDIX B. MONTHLY WEATHER REPORTS.
73
HSPA Kl.NIA SUB-STATION: NOVEMBER, 1968HSPA Kl.NIA SUB-STATICt'I: DECEMBER, 1968
TEMPERATURE I RAIN2
PYROH PHOTOCHEM2
EVAPORATl0N2
WIND3
TE"f'ERATURE I RAIN 2 PYROH PHOTOCHEM2 EVAPORATION 2WIND 3
DAY PAN (INCHES) CUM. DAY PAN CI NCHES) CUM.MAX MIN INCHES GRAM CAL/CH' 5 ' I' MILES MAX MIN INCHES GRAM CAL/CH' 5 ' I' MILES
86.0 67.0 .00 513.6 2744.5 .222 .206 140 I 72.5 71.0 142.6
85.5 69.0 .00 455.4 .220 .199 149 2 77 .0 68.0 1.45 168.8 .109 .074 243
85.0 68.0 .03 494.7 .160 .134 171 3 78.5 69.0 .03 337.6 1972.8 .051 .051 161
86.0 68.0 .00 467.1 .208 .18'7 147 4 79.0 67.5 .06 436.5 .129 .115 267
5 87.0 67.5 .00 493.2 3842.2 .197 .176 143 5 76.0 62.5 .00 379.8 .209 .185 302
6 86.0 65.5 .00 516.5 .211 .187 1096 79.5 61.5 .00 392.9 .132 .115 143
7 81.0 63.0 .00 417.6 .127 .108 2627 85.0 68.5 .00 497.6 .198 .180 222
8 84.0 64.0 276.58 85.5 65.5 .00 459.8 .219 .200 120
63.5 423.49 82.0 .73 .287 .245 2669 86.0 68.0 10 84.0 65.0 .00 411.8 3181.2 .134 .119 94
10 84.0 67.5 749.3 " :;11 84.0 65.5 .00 423.4 .141 .127 93
11 86.0 68.0 .02 502.0 .473 .403 435 12 84.0 66.5 .00 341.9 .141 .128 123
12 85.5 69.0 .00 382.7 3632.2 .187 .152 101 13 80.5 67.5 .00 352.1 .173 .152 238
13 85.0 70.0 .07 .272.1 .163 .146 94 14 75.0 67.0 .00 403.0 .206 .175 247
14 83.0 73.0 .49 164.4 .055 .026 113 15 79.0 65.5 .00 123.7
15 77 .5 67.5 .56 398.7 .023 .018 62 16 76.0 66.0 .12 155.7 .170 .136 243
16 84.0 66.0 .. 17 76.0 67.0 1.11 68.4 2530.6 .039 .028 62
17 82.5 66.5 .. 883.2 :: ;: 18 72.5 65.0 .28 225.5 .000 .000 66
18 86.0 65.5 .00 424.9 .491 .452 41419 77 .5 65.0 1.48 317.2 .100 .060 95
20 79.0 66.0 .88 333.2 .088 .054 9719 84.5 69.5 .04 295.4 2843.2 .096 .090 147
21 81.5 63.0 .00 314.3 .134 .130 10320 80.0 69.0 .07 438.0 .120 .108 274
22 81.0 64.0 .02 439.4 .096.101 17721 84.5 67.5 .00 483.1 .206 .184 140 23 82.0 64.0 .00 309.9 .130 .115 10822 82.5 66.0 .00 420.5 .217 .193 184 24 80.0 65.0 .00 317.2 2527.9 .089 .065 10423 84.0 69.0 .. .. " " 25 80.0 68.0 2.81 299.2 OVERFLOW OVERFLOW 239
24 84.0 68.5 746.4 .. " 26 76.0 58.0 .03 472 .9 .107 .092 243
25 84.0 68.5 T 394.3 .509 .443 527 27 76.0 59.0 .00 256.1 .163 .147 162
26 84.0 69.() .03 355.0 3426.5 .123 .102 125 28 79.0 62.5 .22 243.0 .074 .052 83
27 83.5 66.5 .00 420.5 .129 .115 119 29 75.5 60.0 .02 491.8 .066 .058 153
28 85.5 67.0 .00 321.6 .146 .133 125 30 74.0 58.5 .00 422 .0 .211 .190 216
29 81. 5 69.0 .85 213.9 .072 .060 25031 78.0 59.0 .00 407·4 2827.4 .139 .116 122
30 76.0 67.0 2.51 183.3 OVERFLOW OVERFLOW 118AVG 78.7 64.4 326.0 384.3 .111 .095 152
AVG 84.0 67.9 398.2 468.4 .160 .141 148
1Ml\XIMUM .AND MINIMUM TEMPERATURES, 24 HOURS PRIOR TO PERIOD OF OBSERVATION.
2ACCUMULATION AT 0700 ON DATE OF OBSERVATION FROM NOVEMBER 3, 1968 TO Ml\RCH23, 1969 AND AT 0630 ON DATE OF OBSERVATION FROM Ml\RCH 24, 1969 TO AUGUST31, 1969.
3CUMULATIVE MILES AT 0700 ON DATE OF OBSERVATION FROM NOVEMBER 3, 1968 TOMARCH 23, 1969 AND AT 0630 ON DATE OF OBSERVATION FROM Ml\RCH 24, 1969 TOAUGUST 31, 1969...INDICATES LONGER THAN 24 HOUR PERIOD OF ACCUMULATION.

74
APPENDIX B. MONTHLY WEATHER REPORTS (CONT'D).
HSPA KLNIA SUB-STATI<>-l: J>NJAA.Y, 1969 H5PA KLNIA SUB-STATI(JII: FEBRlJQ.RY, 1969
TeoPERATLREIRAIN' PYROH PHOTOCI-£M2f:VAPfIAATlrJ'il WI 1'.03 T'EJoPERATLRE l RAIN2 PYRD< PHOTOCt£M
2EVAPORATlOO2 WIt>D'
DAY PAN C1NQ£S) c..... DAYGRAM CALIa-?
PAN CI~I-£S) c.....
""" "IN INCHES GRAM CAL/CM25' l' MILES """ "IN INCHES 5' I' MILES
I 78.0 63.0 .00 241.4 .138 .IlS 76 78.5 65.0 .156
2 78.0 68.0 1.52 101.9 .042 .015 209 76.5 66.5 560.2 .156
3 76.0 66.0 9.13 138.2 OVERflOW OVERFLaw 109 71t.O 67.5 1.79 3%.3 OVERFLO'lfII OVERFLCW 485
4 73.0 63.0 1.59 11.t2.6 .070 .053 52 76.0 61.5 .00 494.7 2403.4 .18lt .168 218
5 12.5 61t.a .37 321.6 .014 .013 116 5 78.0 63.0 .00 293.9 .179 .155 179
6 76.5 61.0 .08 378.3 .096 .082 132 6 79.0 65.5 .00 472.9 .106 .084 131
7 77.0 60.0 .00 181.7 1870.0 .122 .095 106 7 83.0 63.0 .00 lit'." .168 .151 122
8 75.0 62.0 .47 lIO.6 .012 .002 63 8 81.5 64.0
9 72.5 65.0 1.68 125.1 OVERFLCM OVERFlOoi 52 9 81.5 69.0 705.7
10 71.0 59.0 .35 ItSl.lt .007. .005 81 10 82.0 65.5 .00 248.9 .326 .304 290
11 78.0 60.0 11 81.0 65.5 .00 328.8 27%.8 .091 .079 110
12 80.5 60.8 800.' 12 80.0 67.0 .00 456.9 .105 .091 96
13 76.5 61.5 .01 245.9 .377 .328 261 13 S.... O 64.0 .00 388.5 .163 .lltS 132
14 75.0 61.5 .09 438.0 2126.3 .046 .036 84 14 82.0 65.5 .06 472.9 .116 . . 115 262
15 77.5 58.5 .00 408.9 .155 .139 95 15 77.0 64.0
16 74.5 58.0 .03 480.1 .098 .094 151 16 72.5 64.0 745.0
17 73.5 ~6.0 .00 415.8 .179 .167 127 17 n.o 66.5 ".00 266.3 .606 .538 791
18 72.0 ".0 18 14.0 65.5 .00 379.8 2181.8 .141 .113 226
19 76.0 58.0 1008.' 19 77.0 66.0 .00 330.3 .137 .121 184
20 72.0 51.0 .02 462.7 .lt97 .lt39 528 20 19.0 68.0 .00 nO.3 .188 .169 227
21 75.0 54.5 .08 459.8 3531.2 .182 .161 175 21 77·5 68.0 .00 373.9 .232 .184 354
22 13.0 55.0 .00 1t1fO.9 .161t .1ltO 124 22 76.5 68.0
23 72.5 51t.O .00 501t.9 .137 .115 190 23 15.5 67.0 983.6
24 13.0 53.5 .00 Itllt.3 .173 .162 191 24 78.5 63.5 .01 471.4 .682 .573 923
25 75.0 52.0 .00 25 77.0 61.5 .00 381.2 2784.9 .166 .llt3 220
26 75.5 H.O .00 1047.6 26 73.5 62.5 .03 375.1t .112 .098 208
27 14.5 53.5 .00 3.23.0 .552 .484 502 27 14.0 65.5 .00 541.3 .217 .180 29028 14.0 57.5 .00 410.3 3591.8 .111 .092 158 28 76.0 58.5 .00 595.1 .219 .234 263
29 15.5 61.& .00 212.5 .16l.t .139 169
30 73.5 66.0 .00 387.0 .099 .072 218 AVO 77.8 65.0 388.9 387.5 .168 .1% 20431 77.0 68.0 .00 381.2 .182 .156 241
AVO 15.0 59.3 361.4 397:1 .111 .100 136
HSPA KLNIA SLe-STATlCN: MARC><, 1969 HSPA KlNIA StAJ-STATICN: APRIL, 1969
TEJoPERAT\.RE 1 RAIN 2 PYRD< PHOTOCHE.M2
EVAPORATlCN 2 WIN>3 TEI'f'ERATlREI RAIN2 PYRD< PHOTOOiEH2 EVAPORATICN2 WIt.c3
DAY PAN (INCHES) c..... DAY PN< (INCHES) c.....
""" "IN INCHES GRAM CAL/CM2 5' I' HILES """ MIN INO£S GRAM CAL/00115' I' HILES
78.0 63.5 .00 I 18.5 65.5 .17 384.1 H50.8 .144 .118 197
78.5 63.0 .00 1132.0 2 16.0 65.0 .00 385.6 .180 .161 224
79.0 65.0 .00 536.9 .683 .593 660 3 74.5 63.5 .00 474.3 .177 .152 198
80.0 63.0 .00 600.9 H60.3 .212 .193 192 4 76.0 62.0
5 79.0 61.0 .00 532.5 .224 .197 198 5 76.0 59.5
6 81.0 61.5 .00 531.1 .200 .178 180 6 78.0 61.0 1641.2
7 78.0 61.5 .00 561.6 .193 .175 236 7 16.0 60.0 632.9 .853 .777 906
8 80.5 64.0 .00 8 78.0 61.0 .00 566.0 3440.5 .282 .251 241
9 80.5 63.0 .00 1178.6 9 77.0 60.0 558.7 .249 .209 215
10 19.0 60.0 .00 500.5 .722 .653 570 10 78.0 63.5 .00 273.6 .216 .198 178
11 82.0 58.0 .00 550.0 3968.8 .180 .162 148 11 15.5 65.0 .02 %3.8 .on .064 149
12 82.0 58.5 .00 468.5 .185 .167 134 12 78.0 66.0
13 82.5 59.5 .00 616.9 .151 .141 139 13 78.5 65.5 10"6.1
14 86.0 60.5 .00 304.1 .228 .205 177 14 80.0 66:0 .08 583.6 .718 .645 735
15 79.0 64.0 15 82.0 63.5 .00 555.8 3509.6 .232 .210 202
16 80.5 64.5 621.3 16 80.5 67.5 .00 647.5 .252 .229 214
17 73.5 65.0 1.10 323.0 .216 .199 436 17 80.5 68.5 .00 587.8 .Hl .296 2%
18 76.5 65.0 .13 576.2 2838.8 .102 .086 167 18 81.0 66.0 .01 554." .28" .243 239
19 79.0 63.0 .00 539.8 .221 .20" 187 19 80.0 65.5
20 79.0 67.0 .00 497.6 .270 .241 224 20 79.5 64.5 1193.1
21 81.0 61.0 .00 487.4 .285 .2"5 259 21 78.5 63.5 .03 510.7 .704 .614 792
22 79.5 60.5 .00 22 78.0 65.5 .00 596.6 3876.5 .244 .215 277
23 81.0 60.5 .00 985.0 23 78.0 60.5 .00 603.8 .262 .227 243
24 80.0 6".0 .00 382.7 .533 .%2 509 24 80.5 60.5 .00 667.8 .2lt9 .23" 192
25 15.5 63.0 .00 5itl.3 3778.6 .162 .145 245 25 83.0 61t.5 .00 417 .9 .244 .225 130
26 76.0 59.5 .00 500.5 .206 .191 227 26 8it.0 63.5
27 76.5 60.0 .00 590.7 .199 .184 197 27 81.0 63.5 918.1
28 77.5 57.0 .00 "90.3 .228 .212 19628 82.0 61t.O .00 581 .. 2 .5ltl .489 %0
29 75.0 58.5 29 82.5 65.0 .00 598.9 3724.2 .217 .200 171
30 75.5 60.0 695.530 82.0 64.0 .00 690.5 .204 .180 200
31 76.0 65.0 .03 470.0 .420 .357 525..~VG 79.1 63.8 529.4 H8.3 .222 .198 214
AVO 78.9 61.9 490.8 500.2 .188 .167 187-

APPENDIX B.
HSPA K\.J'IIIA SUB-STATION: Mll.Y I 1969
MONTHLY WEATHER REPORTS (CONT'D).
HSPA KLNIA SUB-STATI()\l: JI..I'.E, 1969
7S
DAYTEMPERATURE I
"'AX MIN INCHES
PYROH Pt'K>TQO-lEM2
EVAPOAATIalPAN (lflOiES)
GRAM CAL!~2 5' 1 •
WIK:J3
C'-"'.MilES
DAYTEfoPERATURE 1
r-'AX MIN INCHES
PYR{)-f PHOTOCHEH2 EVAPORATI()'II2PAN (INCHES)
GRJI,M CAl/CM2 5' I'
81.0 61.0
81.0 63.5
79.0 66.0
80.0 61t.O
82.0 62.5
82.0 62.5
80.0 62.0
83.5 59.5
82.0 61.0
10 78.0 61.5
11 80.5 62.5
12 83.0 63.0
13 86.5 62.5
lit 85.0 66.5
15 82.0 65.0
16 80.5 63.0
17 78.0 05.0
18 82.0 62.0
19 81.0 61.5
20 84.0 62.0
21 84.0 61.5
22 83.0 flit. a23 85.0 67.0
24 82.5 65.0
25 ,83.5 67.5
26 82.0 65.0
27 84.0 66.0
28 85.0 66.0
29 83.0 67.0
]0 85.0 67.0
31 84.5 65.0
.00
.68
.00
.00
.10
.37
.00
.00
.10
.00
.00
.00
.00
.00
.00
.00
.00
.00
.07
.00
·.00
.00
.13
648.6 3559.2
610.8
572.1
719.0
352.8
317.1 4152.3
61+8.9
1+36.5
305.2
lOB.lt
709.2
1+71.3 3412.3
529.6
632.9
592.2
1008.3
621+.2
669.3 3825.3
498.2
554.1t
S96.6
1037.4
474.3
388.5 4055.'"
347.7
545.6
395.8
S83.S
.278 .264
.264 .242
.229 .191
.229 .191
.576 .549
.063 .O:H
.051 .037
.226 .219
.151t .141
.378 .333
.280 .251
.152 .170
.240 .220
.272 .254
.660 .602
.HO .218
.236 .224
.160 .146
.247 .245
.815 .7lt8
.237 .216
.183 .166
.146 .137
.408 .393
212
213
213
213
'00
109
100
138
108
3"201
166
186
227
'70
137
138
117
176
S80
ISS
106
82
209
I 84.5 65.0
2 84.0 62.0
3 83.0 66.0
4 83.0 67.0
5 85.0 63.0
6 86.0 62.5
7 84.5 63.5
8 81t.5 63.5
9 85.5 64.0
10 85.0 65.5
11 79.0 66.5
12 81.5 62.5
13 79.0 63.0
lit 85.0 65.0
IS 86.0 68.0
16 85.0 65.0
17 85.5 66.5
18 87.0 66.5
1'9 86.0 69.0
20 86.0 66.0
21 86.0 65.0
22 86.5 69.0
H 84.0 66.0
24 86.0 67.0
25 83.0 65.5
26 86.0 67.5
27 8S.0 66.s
28 85.0 67.5
29 84.0 67.0
30 85.5 72.0
.00
.00
.00
.00
.00
.00
.00
.06
.10
.00
.00
.00
.01
.00
.00
T
.00
.00
.06
.00
.11
.00
.00
.00
552.2
512.0
702.8 3615.1
592.1t
619.2
517.0
938.7
570.6
404.9 4043.8
522.1
431.7
528.8
652.6
488.6
SH.7
600.6 3560.5
656.0
560.5
485.3
473.6
S90.6
547.2
316.3 4078.6
592.1t
584.0
568.9
597.3
555.6
S77.3
.441 .429
.225 .199
.28li .255
.263 .255
.251
.Hl
.619 .555
.232 .217
.llli .109
.219 .196
.163 .153
.190 .187
.406 .383
.233 .222
.260 .239
.270 .253
.242 .227
.222 .201
.H7 .353
.253 .237
.105 .087
.2lt2 .230
.196 .172
.223 .216
.498 .468
209
283
17S
169
177
129
353
142
200
163
116
110
2S3
119
ISO
179
149
140
281
lSI
123
167
162
16'
36'
AVG 82.3 63.8 526.9 550.1 .209 .193 ISSAVG 84.5 65.8 542.4 551.3 .217 .202 147
HSPA KLNIA SU6-STATI~: JULY, 1969 HSPA K~IA Sl.6-STATlCJ'.l: AlXiUST, 1969
TEMPERATURE 1DAY
Mo;X MIN INCHES
PYROi Pt-«>TootEM2
EVAPOlATlcrlPAN (INOiES)
GRAM CAL/CM2 5' I'
TEt-'l'fRATLRE IDAY
MAX MIN
RAIN2
PYRCH PHOTOCHEP'12
EVAPORATlCJ'.l22 PAN (INCHES)
INCHES GR.A.M CAL/CM 5 I I'
WI/lD3C'-"'.MILES
I 85.0 71.0
2 84.5 67.0
3 83.5 65.5
It 85.0 66.0
5 85.0 66.0
6 84.5 68.0
7 86.0 71.0
8 85.5 7l.0
9 85.0 68.0
10 84.0 69.0
1.1 85.0 67.5
12 86.0 72.5
13 85.0 73.0
lli 86.0 71.0
15 84.5 69.0
16 85.5 69.0
17 83.0 68.0
18 83.5 66.0
19 85.0 69.0
20 83.0 72.0
21 85.0 69.5
22 85.5 68;5
23 85.0 68.0
24 86.0 67.0
25 85.0 66.5
26 87.0 69.0
27 87.0 66.5
28 88.0 67.5
29 88.0 67.0
30 86.5 68.0
31 86.0 69.0
.00
.00
.03
.03
.08
.01
.00
.00
.00
.01
.04
.02
.01
.00
.11
.00
.01
.00
.00
.03
.01
.09
.00
.00
.00
510.4
630.8
650.9
650.9
650.9
1932.6
401.6
609.0
587.3
368.1
523.7
547.2
570.6
602.li
627.4
446.8
532.1
503.7
488.6
635.8
625.8
667.6
659.3
406.6
S77.3
341.3
493.6
492.0
632.5
630.8
697.7
3926.9 .293 .274
.25li .226
.249 .231
l.080 1.010
1t258.1 .201t .188
.)45 .304
.262 .240
.186 .171
.312 .277
.670 .578
3825.7 .270 .240
.318 .290
.156 .151
.233 .207
.164 .148
.542 .502
3977.1t .316 .291
.318 .298
.313 .282
.163 .148
.273 .262
.270 .247
3771.3 .200 .184
.300 .268
.285 .261
20S
187
179
704
173
235
179
162
268
515
2S7
239
193
176
140
443
22'
20'
188
142
152
190
134
19'
191
86.0 68.0
85.0 67.5
85.5 67.0
86.0 68.0
86.0 67.5
87.0 67.0
86.0 68.5
87.5 67.0
86.0 66.0
10 87.5 66.5
II 86.0 70.5
12 86.5 69.0
13 86.0 68.0
14 85.0 69.0
15 84.0 70.0
1& 86.0 69.0
17 87.0 69.5
18 86.0 67.5
19 86.0 66.0
20 85.0 65.5
21 85.0 67.0
22 85.5 65.5
23 87.0 66.0
24 86.5 66.5
25 85.0 68.0
26 85.5 69.0
27 86.0 67.0
28 87.0 68.5
29 86.0 67.5
30 85.0 67.0
31 81t.0 68.0
.00
.02
.03
.00
.00
.00
.00
.00
.04
.00
.04
.00
.00
.00
.00
.00
.00
.00
.00
.00
.00
.00
.02
.00
.00
.00
.00
512.2
568.9
577 .6
57li.8
51+7.1 li5)li.l
637.3
6li8.9
1+07.4
61li.0
576.2
602.4
663.5 4004.4
611.1
542.7
506.5
li97.6
568.9
708.6
628.7 liOS9.9
526.7
570.4
696.9
659.3
609.6
496.2
6li3.1
519.4 li207.1
SSl.3
612.6
574.7
587.8
.338 .310
.282 .2S2
.&36 .571+
.325 .292
.300 .281
.298 .261
.300 .276
.189 .169
.547 .488
.3liO .306
.307 .267
.290 .264
.288 .234
.278 .238
.li8) .45li
.322 .297
.270 .255
.21+3 .227
.281 .235
.374 .346
.593 .535
.267 .231
.25) .228
.230 .207
.305 .280
.301 .210
.250 .229
210
203
399
203
199
179
IS7
119
3'8
218
222
231
21S
167
35'
188
177
166
165
181
'06
240
18Q
162
201
202
192
AVG 85.3 68.6 561.1 56S.3 .257 .235 189 AVG 85.9 67.6 582.8 596.5 .287 .258 190


APPENDIX C. WATER USE RATES FOR INDIVIDUAL LYSIMETERS.


APPENDIX C. WATER USE RATES FOR INDIVIDUAL LYSIMETERS.
JANUARY, 1969FEBRUARY, 1969
WATER USE 1/1000" \vATER USE 1/1000"
DATE I II III IV AVG. DATE I II II! IV AVG..m m 094 m 094 1m m 100 094 m 097
2m m m 034 m 034 2 m m m m
3 m m m m m 3 m m m m
4 m m m m m 4 100 085 m 093
5 m m 051 m 051 5 120 155 m 138
6 m m m m m 6 090 076 m 083
7 m m m m m 7 160 136 m 148
8 m m m m m 8 095 127 m III
9 m m m m m 9 105 m m 105
10 m m m m m 10 100 102 m 101
11 m m m m m 11 060 076 m 068
12 m m m m m 12 m m m m
13 m 070 059 m 065 13 230 221 m 226
14 m 170 m m 170 14 m m i40 140
15 m m m m m 15 090 m 170 130
Hi m 140 102 m 121 Hi 080 m 130 105
17 m 140 123 m 132 17 110 m 110 110
18 m m 170 m 170 18 070 m m 070
19 m 100 059 m 078 19 110 m 130 120
20 m 190 157 m 174 20 080 m 095 088
21 m 100 059 m 078 21 110 m 150 130
22 m 110 118 m 114 22 190 m 220 205
23 m 210 179 m 195 23 120 m 140 130
24 m 150 102 m 126 24 190 m 190 190
25 m 150 085 m 122 25 130 m 170 150
25 m 150 102 m 126 25 m m m m
27 m 130 102 m 116 27 m m m m
28 m 070 068 m 069 28 110 m 150 130
29 m m m m m
30 m 040 034AVG. 128/22m 037
31 119/9 .....:Jm 130 102 m 115 \0
150/12
AVG. m 129/15 096/19 m 109/20 124.7/23

APPENDIX C. WATER USE RATES FOR INDIVIDUAL LYSIMETERS (CONT'D).
M6.RCH, 1969 APRIL, 1969000
WATER USE 1/1,000" WATER USE 1/1000"
DATE I I! II! IV AVG. DATE I II III IV AVG.
m 120 m 140 130 1 107 m m m 107
2 130 m 160 145 2 :~ 100 m m 100
3 130 m 145 138 3 302 110 m m 206
4 145 150 148 4 207 m 228 m 218
5 190 150 170 5 187 160 240 m 196
6 185 160 173 6 176 170 240 m 195
7 .. 190 190 7 214 250 252 m 239
8 .. 145 145 8 258 096 m m 177
9 .. 190 190 9 m 096 m m 096
10 620 290 290 10 m m m m m
11 .. m .. 11 m m m m m
12 230 145 230 12 165 163 204 163 174
13 m m m 13 181 201 276 m 219
14 m 200 200 14 148 137 204 m 163
15 m 075 075 15 165 182 216 m 188
16 m 070 070 16 231 234 228 208 225
17 m m m 17 236 260 276 312 271
18 m m m 18 220 299 252 228 250
19 m 090 090 19 172 221 240 252 221
20 m 150 150 20 231 319 228 300 270
21 m m m 21 147 182 168 276 193
22 150 165 158 22 078 181 m .. 135
23 140 142 141 23 m m m .. m
24 160 190 175 24 203 208 276 432 229
25 140 150 145 25 220 214 204 240 220
26 170 190 180 26 187 195 216 m 199
27 m m m 27 176 169 240 208 198
28 m m m 28 154 156 216 208 184
29 090 m 090 29 220 208 204 252 221
30 090 m 090 30 255 260 180 180 219
31 070 m 070
AVG. 138/20 156/21 143/25 AVG. 198/26 195/25 228/21 217/15 196/27

APPENDIX C. WATER USE RATES FOR INDIVIDUAL LYSIMETERS (CONT'D).
MAY, 1969 JUNE, 1969
WATER USE 1/1000" WATER USE 1/1000"
DATE 1 II III IV AVG. DATE I II III IV AVG.
1 236 286 276 300 275 1 m 110 096 168 124
2 m m 276 300 288 2 m m 036 132 084
3 m 110 240 192 181 3 m m m m m
4 220 234 .. 252 235 4 m m m m m
5 209 260 .. 276 248 5 m m m m m
6 m 104 684 108 106 6 m m m m m
7 m m 048 m 048 7 m m 084 m 084
8 148 201 300 276 231 8 m 102 084 096 094
9 115 084 084 084 092 9 m m 121 084 103
10 038 149 024 024 059 10 m m 072 m 072
11 049 065 024 m 046 11 m m 048 m 048
12 055 072 048 m 058 12 m m m m m
13 049 032 060 m 047 13 m m m m m14 011 097 012 m 040 14 m m m m m15 m m m m m 15 m m m m m16 055 m 096 m 076 16 m m m m m17 044 052 096 m 064 17 m 117 264 m 191
18 039 065 060 096 065 18 m m 180 m 180
19 039 058 060 084 060 19 280 238 144 m 221
20 027 052 060 060 050 20 224 m 204 m 214
21 m m 072 156 114 21 224 177 120 m 17422 m m m m m 22 132 084 144 m 120
23 m m m m m 23 192 162 120 m 15824 165 208 204 264 210 24 208 162 238 m 20325 115 084 144 180 131 25 m 062 m m 06226 228 m m 108 168 26 m m m m m27 m m 108 084 096 27 m m m m m28 m m m 048 048 28 m m m m m29 m m m 036 036 29 250 m m m 25030 m m m 072 072 30 190 m m m 19031 126 m 084 144 118 00
~
AVG. 104/19 123/18 128/24 150/21 116.5/28 AVG. 213/8 135/9 130/15 120/4 143/18

APPENDIX C. WATER USE RATES FOR INDIVIDUAL LYSIM~TERS (CONT'D).00
JULY, 1969 AlX;U5T, 1969 N
. ,
WATER USE 1/1000" WATER USE 1/1000'"
DATE I II III IV AVG. DATE I II III IV AVG.
1 m m m m m 1 238 286 117 m .214
2 330 m m m 330 2 255 m 234 m 245
3 153 m 176 m 165 3 323 325 312 383 336
4 238 311 332 m 294 4 289 312 293 293 297
5 263 256 195 m 238 5 323 344 293 320 320
6 246 214 176 m 212 6 289 279 312 297 294
7 195 m 127 m 161 7 272 267 332 285 289
8 m m m m m 8 323 312 312 320 317
9 272 227 176 284 240 9 204 175 351 222 238
10 221 214 176 258 217 10 306 279 293 347 306
11 187 175 254 240 214 11 246 208 371 267 273
12 204 m m 213 209 12 m m 293 285 289
13 255 227 283 249 254 13 IRRIGATED IRRIGATED m m m
14 212 194 215 204 206 14 136 241 117 m 165
15 212 194 156 142 176 15 272 260 234 249 254
16 238 227 156 .. 207 16 255 253 234 240 246
17 161 143 293 435 199 17 255 279 254 258 262
18 246 240 234 222 236 18 340 325 312 320 324
19 m m m m m 19 306 247 312 303 292
20 093 162 088 151 124 20 280 247 273 257 264
21 246 318 254 266 271 21 340 272 234 287 284
22 272 240 273 275 265 22 323 312 m 347 327
23 272 m 283 284 280 23 238 357 312 347 31424 238 m 293 266 266 24 255 8m 283 329 28925 170 220 215 226 208 25 m m m m m
26 204 220 176 222 206 26 ·m m m m
27 068 045 056 053 056 27 112 m m m 11228 178 181 098 169 157 28 m m m 184 18429 229 240 176 226 218 29 350 m m 168 25930 306 272 293 266 284 30 350 m m 128 23931 m m m m m 31 126 m m 232 179
AVG. 219/27 215/21 206/25 221/21 218/27 AVG. 269/26 279/20 276/22 278/24 265/28

APPENDIX D. PERCOLATE COMPOSITION FOR INDIVIDUAL LYSIMETERS.


APPENDIX D. PERCOLATE COMPOSITION FOR INDIVIDUAL LYSIMETERS (CONT'D).
pH NO, Cl so, K SiOz HCO, PO", (aCO,000\
pH NO, Cl so, K SiOz HeOl PO .. (aCO,OECEMlER 4, 1968
NOVEMBER 25, 1968
NOVEMBER 26, 1968
44.5 159
44.5 162
44.5 163
OECEMlER 5, 1968
86
84
96
88
23.5 102
25.6 84
23.0 100
27.5 124
27.0 130
49.5 170
44.5 128
22.5
22.5
25.5
23.5
3.0
3.2
3.2
3.8
4.0
4.1
4.1
3.0
3.3
4.0
4.0
120
101
132
146
146
146
132
116
132
132
146
OECEMBER 18, 1968
227
230
229
245
227
236
235
238
242
229
233
17
24
52
10
24
7
30
170
116
52
167
7.0
7.85
7.3
6.8
6.8
6.7
6.9
6.75
7.1
6.8
6.8
IV
II
III
III
III
344
344
346
372
368
364
338
348
352
352
320
322
320
0.16
0.16
0.16
0.04
0.04
0.04
0.01
0.06
0.06
0.06
0.08
0.12
0.10
122
132
134
112
113
114
109
94
96
96
42
44
44
39
40
40
4242
42
44
3.0
3.1
3.1
4.0
4.0
4.2
3.5
3.5
3.5
3.5
2.9
3.3
3.3
146
146
146
132
132
132
132
146
132
116
II6
132
116
228
233
235
234
231
228
232
231
231
231
230
231
233
244
182
228
173
179
242
165
156
161
220
205
200
189
7.30
7.15
7.15
7.30
7.30
7.10
7.30
7.25
7.05
7.50
7.40
7.40
7.20
II
III
OECEI1lER 2, 1968
OECEMBER 19, 1968
IV 7.30
7.15
7.15
244
182
228
234
231
228
146
146
146
4.0
4.0
4.2
44.5 159
44.5 162
44.5 163
0.16
0.16
0.16
372
368
364IV 7.05
7.05
138
131
227
225
130
130
4.0
3.9
52.5 182
51.5 180
OECEMBER 3, 1968
OECetlER 23, 1968
DECetlER 24, 1968
IV
II "I
II I "I
2
3
4
IV Xl
7.4
7.2
7 2
7.15
7.2
7.05
7.1
7.1
7.1
7.1
7.1
6.9
7.1
7.05
7.0
7.1
7.0
7.0
6.9
202
220
202
224
165
274
189
185
226
220
209
218
179
147
161
172
157
173
162
242
236
237
237
224
226
224
224
239
237
237
235
237
228
241
236
229
229
229
100
lOS
110
110
130
125
125
129
105
105
105
105
120
125
115
125
115
125
115
3.7
3.6
3.5
3.7
3.7
3.9
3.9
4.0
3.8
3.5
3.5
3.6
3.7
3.8
3.0
2.9
2.8
3.0
3."1
46.5 104
51.0 106
46.5 102
43.0 98
54.5 142
52.0 136
46.5 130
46.5 128
~.5 88
~.5 ~
~.5 86
~.O ~
~.O 88
43.0 108
43.0 106
43.0 104
40.5 96
52.0 122
46.0 124
0.06
0.06
0.08
0.24
0.48
0.20
0.24
0.04
0.04
0.04
0.06
0.08
0.06
0.03
0.06
0.06
0.03
0.10
0.11
360
360
350
350
360
348
348
340
II
III
IV
II
III
7.35
7.1
7.1
7.1
7.0
7.05
7.0
6.85
7.05.
7.0
7.15
6.8
6.8
6.8
6.9
6.9
6.8
148
ISO
134
166
162
120
156
198
134
148
134
197
158
162
192
157
139
230
232
233
223
222
251
247
247
243
243
250
253
247
241
253
230
233
115
120
101
120
120
120
115
120
129
130
125
132
132
132
253
132
146
3.6
3.7
3.3
3.1
3.3
2.8
2.9
4.2
3.8
3.8
3.7
3.8
4.3
3.1
3.2
2.8
3.1
44.5 132
44.5 130
44.0 120
45.3 104
45.6 104
39.5 116
41.0 124
39.5 124
49.5 162
48.0 156
42.5 110
25.5 110
24.5 110
27.0 110
100
22.0 100
29.0 112
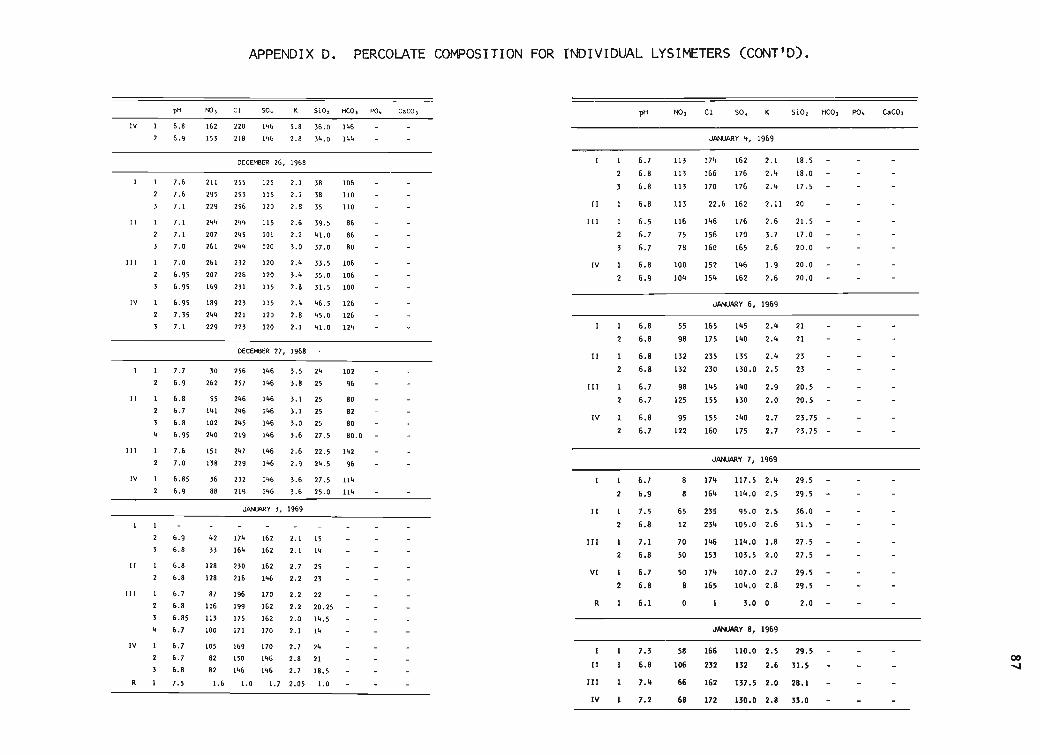
APPENDIX D. PERCOLATE COMPOSITION FOR INDIVIDUAL LYSIMETERS (CONT'D).
pH 'fJ, C1 50, Si02 Heo , PO .. CaCO] pH NO, C1 so, K SiOz HC03 PO,. CaCa,
IV &.8
&.9
1&2
153
220
218
14&
14&
3.8 3&.0 14&
2.8 34.0 144 JANUARy 4, 1969
O€CEIilER 27, 19&8
JANJ'\RY 3, 19&9
DECEMBER 2&, 19&8
170 2.7 24
14& 2.8 21
1% 2.7 18.5
1.7 2.05 1.0
00-...I
20.5
20.5
23.75
23.75 -
21
21
23
23
20.0
20.0
20
2.0
27.5
27.5
29.5
29.5
29.5
29.5
36.0
31.5
21.5
17.0
20.0
18.5
18.0
17.5
29.5
31.5
28.1
2.4
2 ••
2.6
3.7
2.6
1.9
2.6
2.1
2 ••
2 ••
2.11
3.0
145
140
1.0 2.7
175 2.7
135 2.4
130.0 2.5
1.0 2.9
130 2.0
130.0 2.8 33.0
176
170
165
1.6
162
117.5 2••
11•• 0 2.5
lIO.O 2.5
132 2.6
137.5 2.0
95.0 2.5
105.0 2.6
114.0 1.8
103.5 2.0
107.0 2.7
104.0 2.8
JPNJAAY 6,1969
JPNJAAY 8, 1969
JPNJAA~ 7, 1969
165
175
235
230
172
145
155
155
160
152
154
174
164
17. 162
166 176
170 176
22.6 162
166
232
162
1.6
156
160
235
234
1%
153
174
165
70
50
50
8
65
12
55
98
66
68
113
116
75
78
95
122
58
106
100
104
113
113
113
132
132
98
125
6.8
6.8
7.2
7.3
6.8
7.4
6.8
6.8
6.7
6.7
6.8
6.7
7.1
6.8
6.7
6.8
6.8
6.8
6.5
6.7
6.7
6.8
6.9
6.7
6.8
6.1
7.5
6.8
6.7
6.9
IV
IV
R
IV
Il
II
Il
VI
III
III
III
I
II
III
8&
8&
80
80
82
80
80.0
102
9&
10&
110
110
24
25
38
38
35
25
25
25
27.5
2.4 33.5 10&
3.4 35.0 10&
2.8 31.5 100
2.4 4&.5 12&
2.8 45.0 12&
2.1 41.0 124
2.1
2.1
2.8
2.& 39.5
2.2 41.0
3.0 37.0
2.& 22.5 142
2.9 24.5 9&
3.& 27.5 114
3.& 25.0 114
3.5
3.8
3.1
3.1
3.0
3.&
2.7 25
2.2 23
2.1 15
2.1 14
2.2 22
2.2 20.25
2.0 14.5
2.1 14
14&
14&
14&
14&
14&
14&
14&
14&
115
120
120
115
101
120
120
120
115
14&
14&
125
115
120
1&2
1&2
1&2
14&
170
1&2
1&2
170
223
221
223
232
22&
231
255
253
25&
25&
257
24&
24&
245
219
247
229
244
245
244
232
219
230
21&
174
1&4
19&
199
175
171
1&9
150
14&
1.0
42
33
151
138
30
2&2
55
141
102
240
211
295
229
244
207
2&1
3&
88
2&1
207
1&9
189
244
229
128
128
87
11&
113
100
105
82
82
1.&
7.&
7.&
7.1
7.0
&.95
&.95
&.95
7.35
7.1
7.&
7.0
7.1
7.1
7.0
7.7
&.9
&.8
&.7
&.8
&.95
&.85
&.9
&.9
&.8
&.8
&.8
&.7
&.8
&.85
&.7
&.7
&.7&.8
7.5
II
IV
IV
II
II
IV
III
III
III
~~'l-~1I·__.........""........ ........ _

APPENDIX D. PERCOLATE COMPOSITION FOR INDIVIDUAL LYSIMETERS' (CONT'D).0000
pH NO, C1 so, K SiO. HCO, PO, CaCO, pH t-ll, CI 50, K Si02 HCO, PO, CaCO)
-- MARCH 10, 1969"JANUARy 10, 1969
IRRI- I 7.2 1.2 22 100 3.77.1 50 162 147.5 2.3 29.5 - - - GATlON
II 1 6.9 40 230 140.0 2.4 30.5 - - - 2 7.1 1.0 25 20.0 J..I
III 1 7.1 0 142 150.0 1.8 27.5 - - - MARCH 11, 1969
IV 1 7.1 0 143 157.5 2.6 32.5 - - -III 1 7.5 4.0 152 160 2.2
R 1 5.5 1.2 3 1.27 0.0 1.0 - - - ? 7.5 4.6 150 145 2.0
7.8 12.4 138 145 1.8
J_Y 11, 1969 4 7.6 16.0 138 170 1.8
8.2 15 170 152.5 2.3 28.5 - - - >'ARCH 12, 1969
II 1 7.5 107 224 137.5 2.5 29.5 - - - 150 180 2.2I I 7.5 0.0
III 1 7.5 50 137 180.0 1.7 27.5 - - - 2 7.5 0.0 142 185 2.2
3 7.5 0.0 206 180 2.3IV 1 7.2 36 170 155.0 2.7 31.5 - - -
MARCH 19, 1969J_Y 14, 1969
7.2 0.0 140 1607.1 24 190 152.5 2.5 34.0 - - - 2 7.1 0.0 112 145
II 1 7.7 86 250 152.5 2.4 34.0 - - - 3 7.1 0.0 118 140
III 1 6.9 50 165 140.0 1.9 31. 5 - II I 7.1 29.0 208 140- -2 8.2 36.0 202 145
IV 1 7.1 82 190 142.5 2.7 35.0 - - -III 1 7.2 11.4 132 145
7.1 78 190 153.5 3.0 36.0 - - - 6.6 124 1357.2
8.3 19.0 134 125JANUARy 17, 1969
6.0RR 7.1
II 1 6.9 - 226 152.5 2.5 36.0>'ARCH 20, 1969
IV 1 7.1 - 154 145.0 2.7 39.0 - - -II I 7.1 32.4 206 140
JANUARy 28, 1969 III 1 7.1 11.4 12~ 135
2 7.0 4.0 132 1301mg 1 7.4 1.3 134 6.5 1.6 31.5 - - -
7.3 0.8 186 1.6 34.0 - IV 1 7.2 0.0 154 120- - -7.4 2.8 158 130
FEBRUARY 13, 1969 Hl\RCH 26, 1969
IRRI- 1 7.5 3.0 44 18.0 4.4 37;0 - - - IRRI- 1 7.6 5.7 84 22GATlON GATlON
2 7.4 3.0 43 - - 37.5 - - - 2 7.5 6.0 96 21
FEBRUARY 26, 1969 MARCH 27, 1969
IRRI- 1 7.3 3.0 73 13.2 4.4 44.0 - - - I 1 7.2 0.6 126 125
GAllON
7.4 3.0 73 - - 44.0
------ 4------ - --- -

APPEt-VIX D. PERCOLATE COMPOSITION FOR INDIVIDUAL LYSIMETERS (CONT'D).
pH N0 3 C1 SO.. K Si0 2 HC03 PO .. CaC03
II 1 7.1 2 188 155
2 7.2 19.0 202 155
III 1 7.1 2 112 125
2 7.0 19 114 130
3 7.1 19 120 123
IV 1 7.1 2 154 160
2 7.2 2 208 123
APRIL 9, 1969
IRRI- 1 7.8 5.0 112/114 29GATION
2 8.1 5.0 118/112 27
APRIL 10, 1969
II 1 7.2 0.0 182 150
2 7.0 2.0 192 150
I I I 1 6.9 1.5 116 135
2 6.9 0.0 124 130
IV 1 7.2 0.0 158 140
APRIL 21, 1969
IRRI- 1 7.9 32GATION
2 7.8 31
APRIL 23, 1969
III 1 7.0 140
THE METHODS OF ANALYSES USED BY THE WATER QUALI TY LABORATORY AREBASED ON:
RAINWATER, F. H. & THATCHER, LL. 1960.METHODS FOR COLLECTION AND ANALYSIS OF WATER SAMPLES.USGS WATER SUPPLY PAPER 1454. 301 PP.
AND STANDARD METHODS FOR THE EXAMINATION OF WATER ANDWASTE WATER INCLUDII\k; BOTTOM SEDIMENTS AND SLUDGES. AMERICANPUBLIC HEALTH ASSOCIATION INC., 1790 BROADWAY, NEW YORK.12TH ED. 1965.
89

APPENDIX E. PERCOLATE VOLUM::S FOR INDIVIDUAL LYSIt-ETERS.


APPENDIX E. PERCOLATE VOLUMES FOR INDIVIDUAL LYSIMETERS.
93
DATE LYSIM VOLU'E OF PERCOLATE DATE LYSIM VOLU'E OF PERCOLATELITERS LITERS
25 tf:N. I 190 III 190
II 133 IV 133
26 rfJV. III 133 30 DEC. 57
IV 152 II 11'+
2 DEC. 361III 11'+
IV 228IV 76
3.DEC. I 30'+3 JAN. 1102
II 228II 380
III 3'+2I!I 1131
IV 190IV 361
'+ DEC. 152'+ JAN. 30'+
III 209I! 228
II! 2665 DEC. 76 IV 190
I! 228
III 956 JAN. I 228
IV 133I! 266
I!I 1526 DEC. 19 IV 11'+
II 76
IV 157 JAN. I 228
II 1909 DEC. 11 III 228
II 57 IV 152III 95
8 JAN. I 15218 DEC. I 11'+ II 152
III 133 III 152
19 DEC. IV 190 IV 11'+
23 DEC. I 2'+7 10 JAN. 228
II 152 II 190
III 228 III 228
IV 76 IV ll'+
2'+ DEC. I 209 11 JAN. I 190
I! 190 II 152
III 192 III 209
IV 152 IV 152
26 DEC. I 380 1'+ JAN. 11'+
II 285 II 152
III 361 III 11'+
IV 2'+7 IV 11'+
27 DEC. I 190 17 JAN. II 95
II 152 IV '+8