content-based image retrieval using low-dimensional shape ...bgprasad/ncdar.pdf · 1 content-based...
TRANSCRIPT
1
Content-Based Image Retrieval using Low-Dimensional Shape Index
Abstract
Low-level visual features like color, shape, texture, etc are being used
for representing and retrieving images in many Content-Based Image
Retrieval systems. Generally such methods suffer from the problems of high-
dimensionality leading to more computational time and inefficient indexing
and retrieval performance. This paper focuses on a low-dimensional shape
based indexing technique for achieving efficient and effective retrieval
performance. We present a simple index based on shape features of regions
that are segmented out of images based on color. A new shape similarity
measure conforming to human perception is applied and shown to be
effective.
Images are segmented to obtain homogeneous color regions that are
dominant and similar images form an image cluster stored in a hash
structure. Each region within an image is then indexed by a region-based
shape index. The shape index is invariant to translation, rotation and
scaling. A JAVA based query engine supporting query-by-example is
developed for retrieving images by shape. The retrieval performance is
studied and compared with that of a region-based shape-indexing scheme.
Keywords: Shape representation, Shape similarity measure, Image retrieval,
Content-based image retrieval, Query-by-example.

2
1. Introduction
The past few years have seen many advanced techniques evolving in Content-
Based Image Retrieval (CBIR) systems. Applications like art, medicine, entertainment,
education, manufacturing, etc. make use of vast amount of visual data in the form of
images. This envisages the need for fast and effective retrieval mechanisms in an
efficient manner.
A major approach directed towards achieving this goal is to use low-level visual
features of the image data to segment, index and retrieve relevant images from the image
database. Recent CBIR systems based on features like color, shape, texture, spatial
layout, object motion, etc., are cited in [gr95], [mcl97]. Of all the visual features, color
is the most dominant and distinguishing one in almost all applications. Hence, our
approach is to segment out prominent regions in the image based on color and pick out
their features. We then use shape features of these regions to obtain shape index used for
retrieving based on shape matching.
1.1 Past work in CBIR
Current CBIR systems such as IBM's QBIC [flick95], [nib93] allow automatic
retrieval based on simple characteristics and distribution of color, shape and texture. But
they do not consider structural and spatial relationships and fail to capture meaningful
contents of the image in general. Also the object identification is semi-automatic. The
Chabot project [os95] integrates a relational database with retrieval by color analysis.
Textual meta-data along with color histograms form the main features used. VisualSEEK
[sc96] allows query by color and spatial layout of color regions. Text based tools for
annotating images and searching is provided. A new image representation that uses the
concept of localized coherent regions in color and texture space is presented by Chad
3
Carson etal. [chad97]. Segmentation based on the above features called ``Blobworld'' is
used and query is based on these features.
Some of the popular methods to characterize color information in images are
color histograms [sb91], [haf95], color moments [sd96] and color correlograms
[huang97]. Though all these methods provide good characterization of color, they have
the problem of high-dimensionality. This leads to more computational time, inefficient
indexing and low performance. To overcome these problems, use of SVD [haf95],
dominant color regions approach [zhang95], [rpgb99] and color clustering [wk98] have
been proposed.
1.2 Shape-based CBIR
Shape is an important feature for perceptual object recognition and classification
of images. Shape description or representation is an important issue both in object
recognition and classification. Many techniques such as chain code, polygonal
approximations, curvature, fourier descriptors, radii method and moment descriptors
have been proposed and used in various applications [gw87]. Recently, techniques using
shape measure as an important feature have been used for CBIR. Features such as
moment invariants and area of region have been used in [flick95], [msi95], but do not
give perceptual shape similarity. Cortelazzo [cor94] used chain codes for trademark
image shape description and string matching technique. The chain codes are not
normalized and string matching is not invariant to shape scale. Jain and Vailaya [jv95]
proposed a shape representation based on the use of a histogram of edge directions. But
these are not normalized to scale and computationally expensive in similarity measures.
Mehrotra and Gary [mg95] used coordinates of significant points on the boundary as
shape representation. It is not a compact representation and the similarity measure is
4
computationally expensive. Jagadish [jag91] proposed shape decomposition into a
number of rectangles and two pairs of coordinates for each rectangle are used to
represent the shape. It is not rotation invariant.
A region-based shape representation and indexing scheme that is translation,
rotation and scale invariant is proposed by Lu and Sajjanhar [ls99]. It conforms to human
similarity perception. They have compared it to Fourier descriptor model and found their
method to be better. But, the images database consists of only 2D planar shapes and they
have considered only binary images. Moreover, shapes with similar eccentricity but
different shapes are retrieved as matched images. Our aim is to extend this method on
color images and also to improve efficiency and effectiveness in retrieval. We segment
out color image regions from images using dominant colors [rpgb99] and apply shape
indexing to retrieve images based on shape features. Our shape indexing feature and
similarity measure is different and shown to be effective in retrieval compared to the
measure used in [ls99].
The paper is organized as follows: Section 2 describes the color and shape
features used in the segmentation and indexing process. Section 3 describes the shape
representation used for the indexing process. The indexing scheme, querying and
similarity measure is explained in section 4. Section 5 highlights the experimental
results of our approach and sample outputs. A comparison of performance with the
scheme employed in [ls99] is also covered in this section.
2. Color and Shape Features
The initial step in our approach is to segment images into regions based on
dominant colors [rpgb99]. Image regions thus obtained after segmentation are used as
input to the shape module. The region-based shape representation proposed in [ls99] is

5
modified to calculate the shape features required for our proposed shape indexing
technique and similarity measure. It is simple to calculate and robust. We show that the
retrieval effectiveness is better compared to the method in [ls99].
2.1 Color segmentation approach
To segment images based on dominant colors, a color quantization in RGB space
using 25 perceptual color categories is employed [rpgb99]. From the segmented image
we find the enclosing minimum bounding rectangle (MBR) of the region, its location,
image path, number of regions in the image, etc., and all these are stored in a metafile for
further use in the construction of an image index tree.
2.2 Color Space Categorization
The entire RGB color space is described using a small set of color categories that
are perceptual to humans. This is summarized into a color look-up table as depicted in
table 1. A smaller set is more useful since it gives a coarser description of the color of a
region thus allowing it to remain same for some variations in imaging conditions. We
have taken a table of 25 perceptual colors chosen from the standard RGB color palette
table.
Color R G B Color R G B Black 0 0 0 Plum 146 109 0 Sea green 0 182 0 Teal 146 182 170 Light green 0 255 170 Brown 182 0 0 Olive green 36 73 0 Magenta 182 73 170 Aqua 36 146 170 Yellow green 182 182 0 Bright green 36 255 0 Flour green 182 255 170 Blue 73 36 170 Red 219 73 0 Green 73 146 0 Rose 219 146 170 Turquoise 73 219 170 Yellow 219 255 0 Dark red 109 36 0 Pink 255 36 170 Blue gray 109 109 170 Orange 255 146 0 Lime 109 219 0 White 255 255 255 Lavender 146 0 170
Table 1: Color look-up table
6
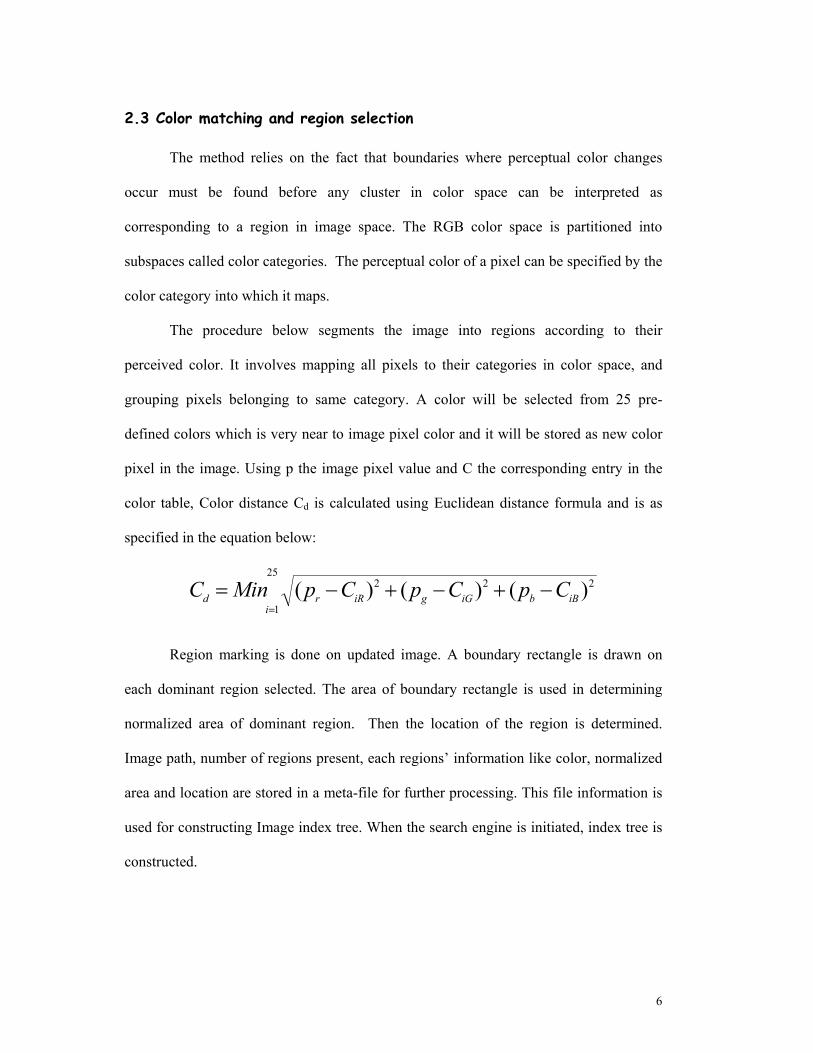
2.3 Color matching and region selection
The method relies on the fact that boundaries where perceptual color changes
occur must be found before any cluster in color space can be interpreted as
corresponding to a region in image space. The RGB color space is partitioned into
subspaces called color categories. The perceptual color of a pixel can be specified by the
color category into which it maps.
The procedure below segments the image into regions according to their
perceived color. It involves mapping all pixels to their categories in color space, and
grouping pixels belonging to same category. A color will be selected from 25 pre-
defined colors which is very near to image pixel color and it will be stored as new color
pixel in the image. Using p the image pixel value and C the corresponding entry in the
color table, Color distance Cd is calculated using Euclidean distance formula and is as
specified in the equation below:
22225
1)()()( iBbiGgiRr
id CpCpCpMinC −+−+−=
=
Region marking is done on updated image. A boundary rectangle is drawn on
each dominant region selected. The area of boundary rectangle is used in determining
normalized area of dominant region. Then the location of the region is determined.
Image path, number of regions present, each regions’ information like color, normalized
area and location are stored in a meta-file for further processing. This file information is
used for constructing Image index tree. When the search engine is initiated, index tree is
constructed.

7
2.4 Steps involved in segmentation and boundary detection
Read the image and create an image array that contains the RGB components of each
pixel in the image.
1. For each pixel in the image do
• Search color-look-up-table for the nearest color by finding the distance
between the pixel color (I) and the color in the color-lookup-table (C) using
the distance formula D given below.
222 )()()( bbggrr CICICID −+−+−=
• Assign RGB components of color look-up table to the pixel whose distance D
is minimum. Determine color response of each color in modified image and
store them in frequency table. Sort the frequency table in descending order.
2. Determine the first occurrence of a pixel that has the same RGB value as in the
sorted frequency table.
3. Assign the pixel location to horizontal and vertical seeds viz: iseed, jseed.
4. Following iseed and jseed, mark the entire region using 8-connected neighboring
region growing method.
5. Obtain (x,y) co-ordinates of boundary of marked region.
6. Determine normalized size r(R) of bounding rectangle using:
r(R) = sizeimage
yyxx−
−− ||*|| 2121
where x1, x2, y1, y2 are x and y coordinates of bounding rectangle and if the
Normalized size r(R) > T only then consider the region as dominant region, where T
is a threshold for dominance.
7. Repeat steps 3 to 7 till three dominant regions are found.
8
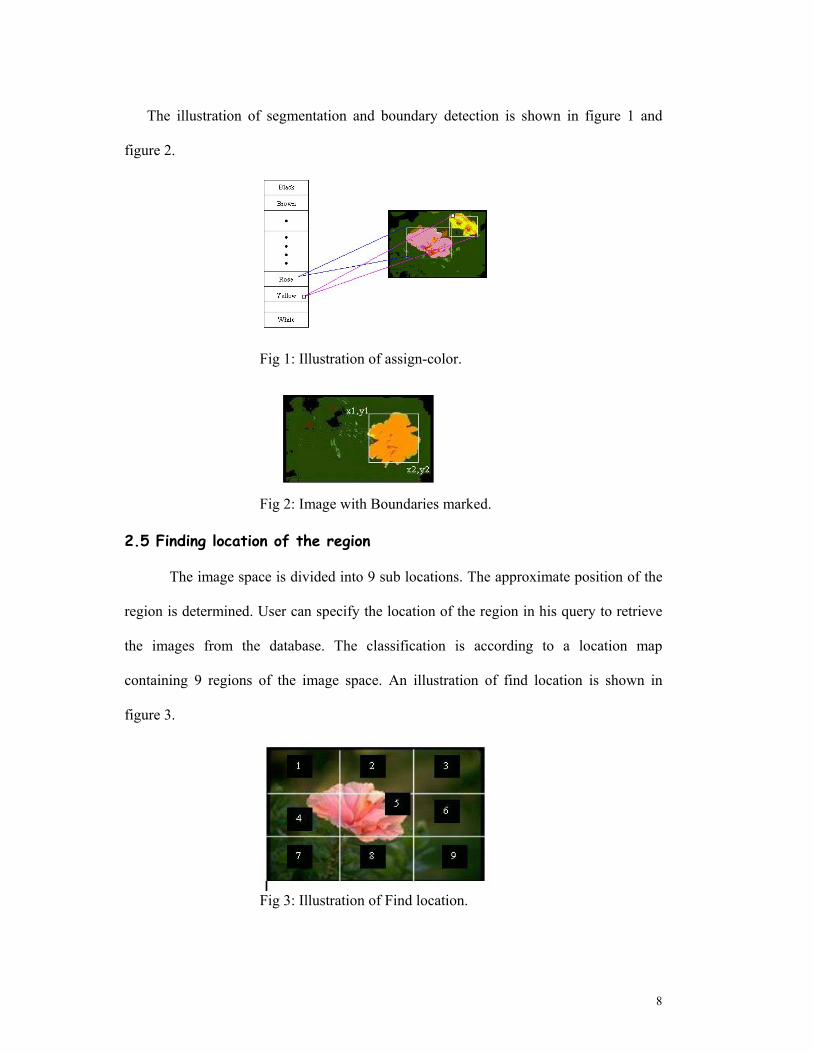
The illustration of segmentation and boundary detection is shown in figure 1 and
figure 2.
Fig 1: Illustration of assign-color.
Fig 2: Image with Boundaries marked.
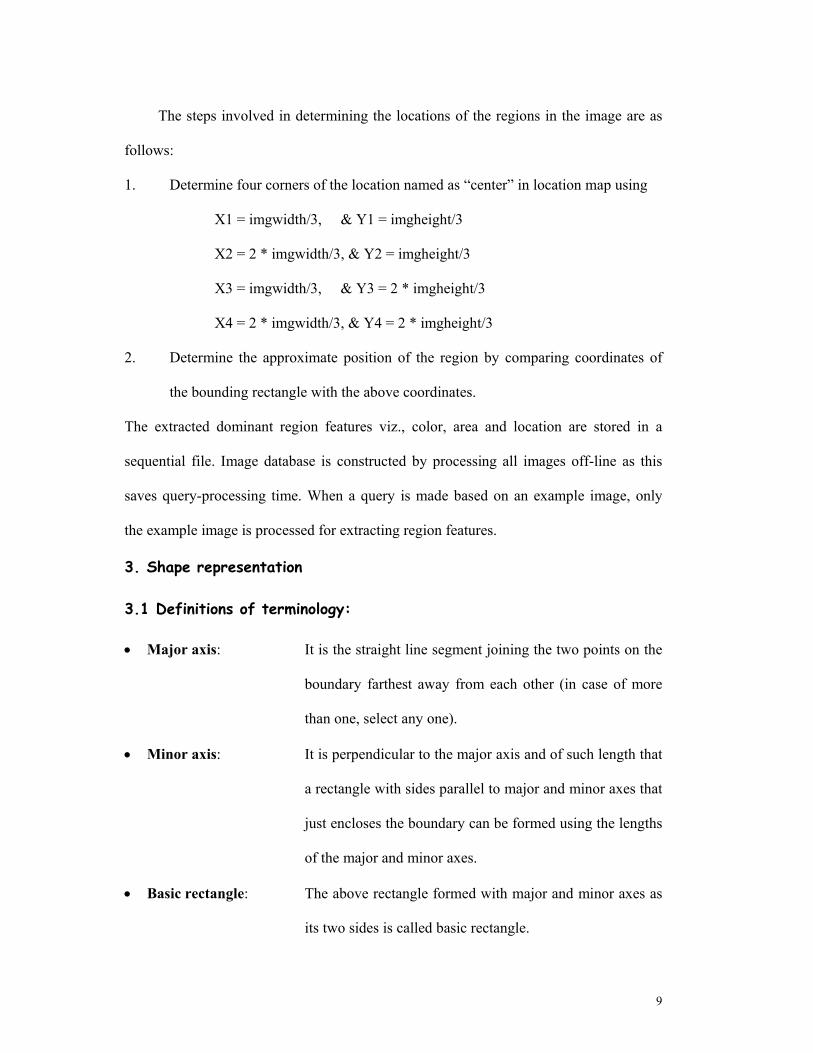
2.5 Finding location of the region
The image space is divided into 9 sub locations. The approximate position of the
region is determined. User can specify the location of the region in his query to retrieve
the images from the database. The classification is according to a location map
containing 9 regions of the image space. An illustration of find location is shown in
figure 3.
Fig 3: Illustration of Find location.
9
The steps involved in determining the locations of the regions in the image are as
follows:
1. Determine four corners of the location named as “center” in location map using
X1 = imgwidth/3, & Y1 = imgheight/3
X2 = 2 * imgwidth/3, & Y2 = imgheight/3
X3 = imgwidth/3, & Y3 = 2 * imgheight/3
X4 = 2 * imgwidth/3, & Y4 = 2 * imgheight/3
2. Determine the approximate position of the region by comparing coordinates of
the bounding rectangle with the above coordinates.
The extracted dominant region features viz., color, area and location are stored in a
sequential file. Image database is constructed by processing all images off-line as this
saves query-processing time. When a query is made based on an example image, only
the example image is processed for extracting region features.
3. Shape representation
3.1 Definitions of terminology:
• Major axis: It is the straight line segment joining the two points on the
boundary farthest away from each other (in case of more
than one, select any one).
• Minor axis: It is perpendicular to the major axis and of such length that
a rectangle with sides parallel to major and minor axes that
just encloses the boundary can be formed using the lengths
of the major and minor axes.
• Basic rectangle: The above rectangle formed with major and minor axes as
its two sides is called basic rectangle.
10
• Eccentricity: The ratio of the major to the minor axis is called
eccentricity of the region.
• Centroid/Center
of gravity: A single point of an object/region towards which other
objects/regions are gravitationally attracted. For 2D
shapes, the coordinates (Xc,Yc) of the centroid are defined
as:
Xc = ∑ ∑∑ ∑x yx y
yxfxyxf ),(/*),(
Yc = ∑ ∑∑ ∑x yx y
yxfyyxf ),(/*),(
where (x,y) are pixel coordinates and f(x,y) is set to 1 for points within or on the shape
and set to 0 elsewhere.
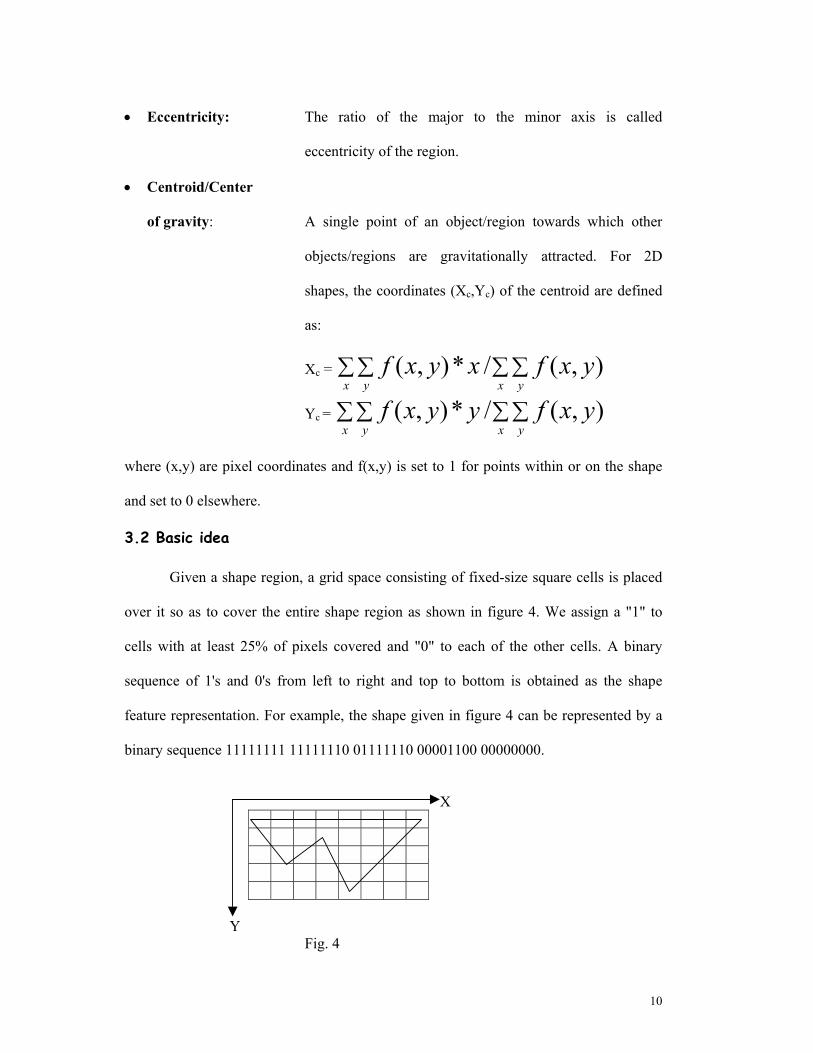
3.2 Basic idea
Given a shape region, a grid space consisting of fixed-size square cells is placed
over it so as to cover the entire shape region as shown in figure 4. We assign a "1" to
cells with at least 25% of pixels covered and "0" to each of the other cells. A binary
sequence of 1's and 0's from left to right and top to bottom is obtained as the shape
feature representation. For example, the shape given in figure 4 can be represented by a
binary sequence 11111111 11111110 01111110 00001100 00000000.
X
Y
Fig. 4
11
The smaller the grid size, the more accurate the shape representation is and more
the storage and computation requirements. The representation is compact, easy to obtain
and translation invariant. Hence, a scale and rotation normalization is carried out to make
it invariant to scale and rotation.
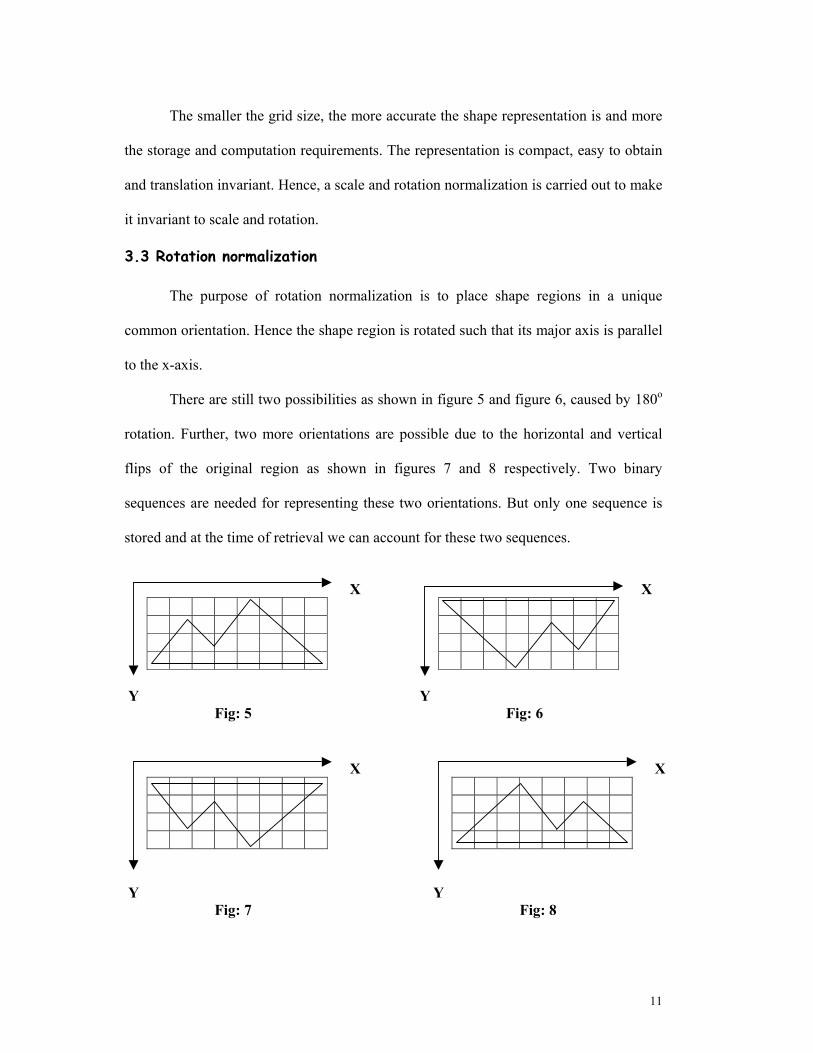
3.3 Rotation normalization
The purpose of rotation normalization is to place shape regions in a unique
common orientation. Hence the shape region is rotated such that its major axis is parallel
to the x-axis.
There are still two possibilities as shown in figure 5 and figure 6, caused by 180o
rotation. Further, two more orientations are possible due to the horizontal and vertical
flips of the original region as shown in figures 7 and 8 respectively. Two binary
sequences are needed for representing these two orientations. But only one sequence is
stored and at the time of retrieval we can account for these two sequences.
X
Y Fig: 5
X
Y Fig: 6
X
Y Fig: 7
X
Y Fig: 8
12
3.4 Scale normalization
To achieve scale normalization, we proportionally scale all the shape regions so that
their major axes have the same length of 96 pixels.
3.5 Shape index
Once the shape region has been normalized for scale and rotation invariance, using a
fixed size of grid cells (say 8x8), we obtain a unique sequence for each shape region. The
grid size in our proposed method is kept as 96 x 96 pixels. Each sub-grid cell is of size 12x12
pixels giving a binary sequence of length 64 bits per shape region. Using this sequence, we
find both the row and column totals of the 8x8 grid and store them as our shape index, which
is more robust and gives a better perceptual representation to the coverage of the shape. A
suitable shape similarity measure using this index is employed for matching images at query
time.
4. Indexing Scheme and Retrieval Process
4.1 Unique Shape Index
For each color region processed above, we compute the shape descriptor as follows:
• Compute the major and minor axes of each color region.
• Rotate the shape region to align the major axis to X-axis to achieve rotation normalization
and scale it such that major axis is of standard fixed length (96 pixels).
• Place the grid of fixed size (96x96 pixels) over the normalized color region and obtain the
binary sequence by assigning 1's and 0's accordingly.
• Using the binary sequence, compute the row and column total vectors. These along with
the eccentricity form the shape index for the region.
13
4.2 Querying
Given a query image, we apply the same process on the query image to obtain the
color and shape features. The shape matching module supports Query-by-example. Based on
color, the query image is segmented to obtain homogeneous regions. Then the shape
descriptors of these regions are used to find matching images in the image database to
retrieve the final images that match on the shape features.
The query process is as follows:
• The query image is processed to obtain a segmented image giving at most
three dominant regions.
• For each region in the query image, the shape representation of each region is
evaluated. To take care of the problem of 180o rotation and vertical and
horizontal flips, we need to store 4 sets of the shape index.
• Compare the shape index of regions in the query image to those in the list of
image database matching on shape index.
• Regions with only matching eccentricity within a threshold (t) are compared
for shape similarity.
• The matching images are ordered depending on the difference in the sum of
the difference in row and column vectors between query and matching image.
4.3 Similarity Measure
Let R and R' represent the row vectors of test image and query image respectively.
Similarly, C and C' represent the column vectors of the test image and query image
respectively. The similarity measure is computed as follows:
14
• Calculate the row and column vectors of all regions segmented out in the query image.
• Find the row and column difference between query image regions and regions in the
image to be tested using the equation:
Rd = )|'(|∑ −i
ii RR
Cd = ∑ −i
ii CC |)'(|
where Rd and Cd are the row and column differences between the test image and
query image region, Ri and Ci are the ith bit of row and column vectors in image and
R'i and C'i are the ith bit of row and column vectors in the query image.
• If (Rd + Cd) < T (threshold), then the images match.
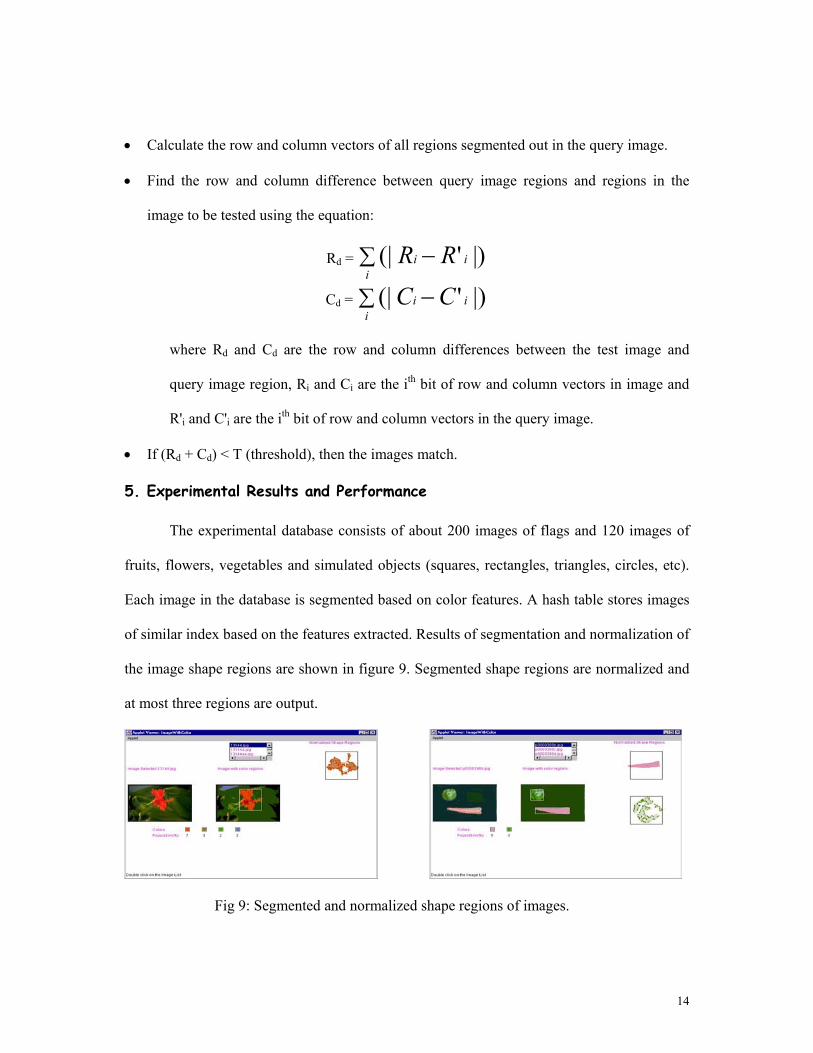
5. Experimental Results and Performance
The experimental database consists of about 200 images of flags and 120 images of
fruits, flowers, vegetables and simulated objects (squares, rectangles, triangles, circles, etc).
Each image in the database is segmented based on color features. A hash table stores images
of similar index based on the features extracted. Results of segmentation and normalization of
the image shape regions are shown in figure 9. Segmented shape regions are normalized and
at most three regions are output.
Fig 9: Segmented and normalized shape regions of images.
15
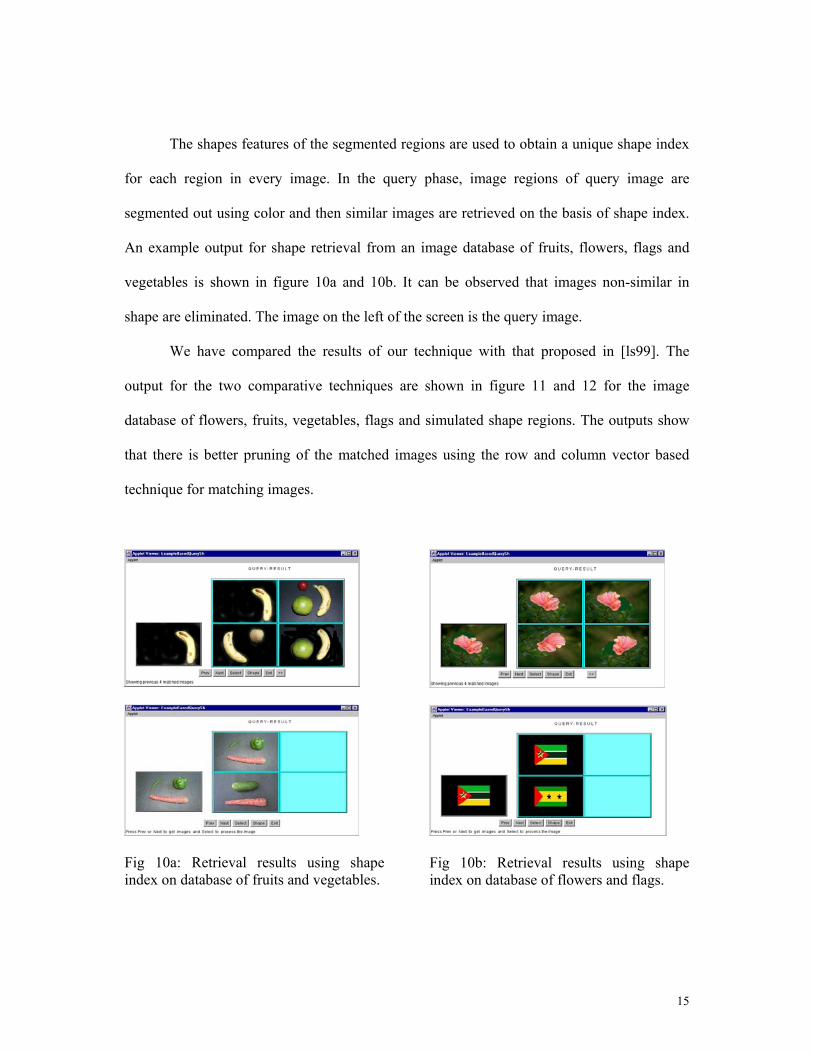
The shapes features of the segmented regions are used to obtain a unique shape index
for each region in every image. In the query phase, image regions of query image are
segmented out using color and then similar images are retrieved on the basis of shape index.
An example output for shape retrieval from an image database of fruits, flowers, flags and
vegetables is shown in figure 10a and 10b. It can be observed that images non-similar in
shape are eliminated. The image on the left of the screen is the query image.
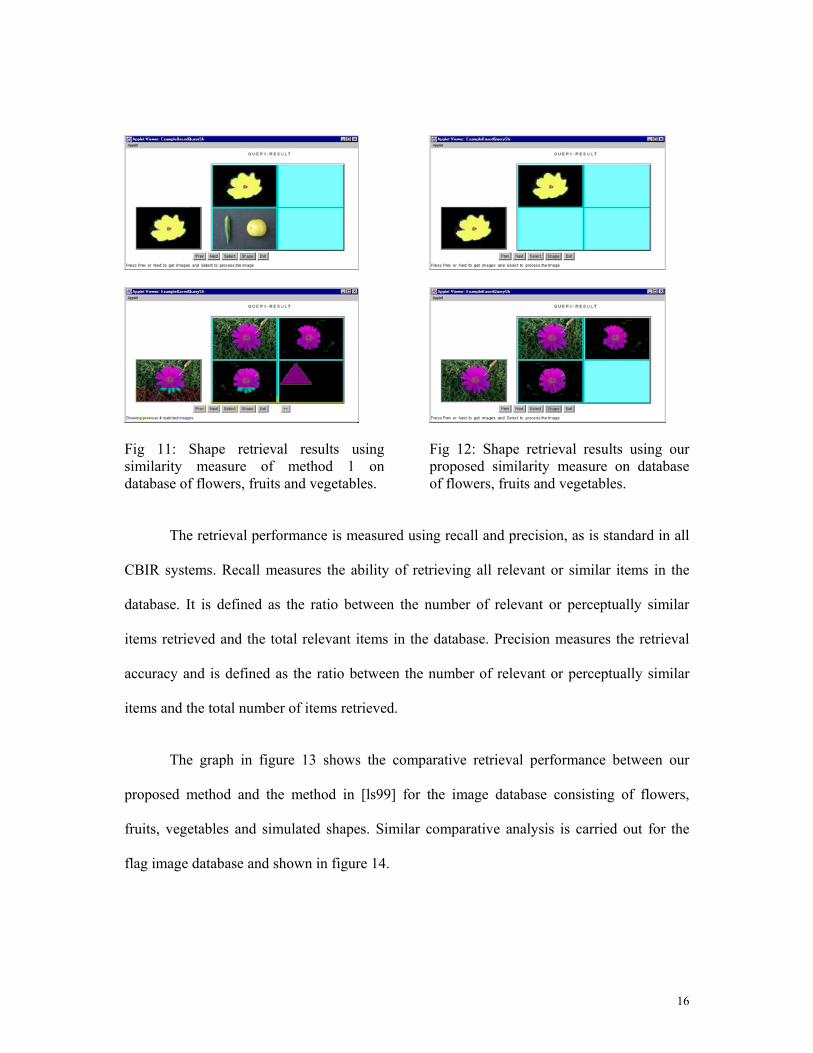
We have compared the results of our technique with that proposed in [ls99]. The
output for the two comparative techniques are shown in figure 11 and 12 for the image
database of flowers, fruits, vegetables, flags and simulated shape regions. The outputs show
that there is better pruning of the matched images using the row and column vector based
technique for matching images.
Fig 10a: Retrieval results using shape index on database of fruits and vegetables.
Fig 10b: Retrieval results using shape index on database of flowers and flags.
16
Fig 11: Shape retrieval results using similarity measure of method 1 on database of flowers, fruits and vegetables.
Fig 12: Shape retrieval results using our proposed similarity measure on database of flowers, fruits and vegetables.
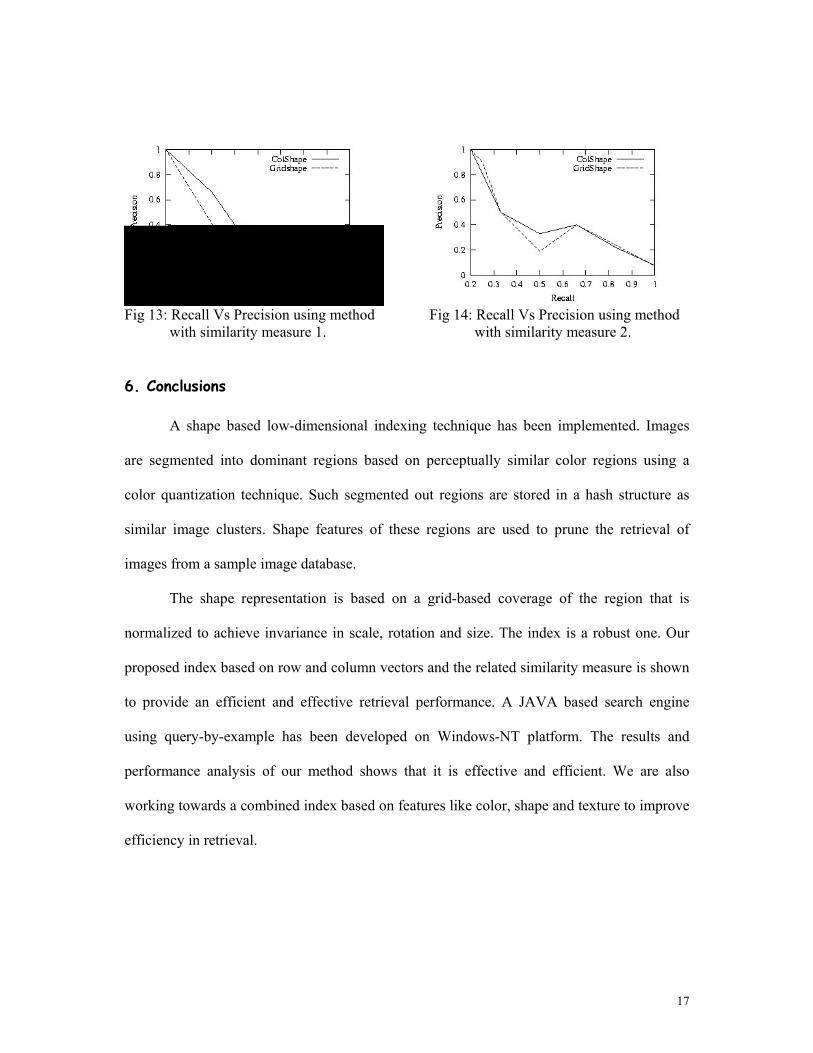
The retrieval performance is measured using recall and precision, as is standard in all
CBIR systems. Recall measures the ability of retrieving all relevant or similar items in the
database. It is defined as the ratio between the number of relevant or perceptually similar
items retrieved and the total relevant items in the database. Precision measures the retrieval
accuracy and is defined as the ratio between the number of relevant or perceptually similar
items and the total number of items retrieved.
The graph in figure 13 shows the comparative retrieval performance between our
proposed method and the method in [ls99] for the image database consisting of flowers,
fruits, vegetables and simulated shapes. Similar comparative analysis is carried out for the
flag image database and shown in figure 14.
17
Fig 13: Recall Vs Precision using method
with similarity measure 1.
Fig 14: Recall Vs Precision using method
with similarity measure 2.
6. Conclusions
A shape based low-dimensional indexing technique has been implemented. Images
are segmented into dominant regions based on perceptually similar color regions using a
color quantization technique. Such segmented out regions are stored in a hash structure as
similar image clusters. Shape features of these regions are used to prune the retrieval of
images from a sample image database.
The shape representation is based on a grid-based coverage of the region that is
normalized to achieve invariance in scale, rotation and size. The index is a robust one. Our
proposed index based on row and column vectors and the related similarity measure is shown
to provide an efficient and effective retrieval performance. A JAVA based search engine
using query-by-example has been developed on Windows-NT platform. The results and
performance analysis of our method shows that it is effective and efficient. We are also
working towards a combined index based on features like color, shape and texture to improve
efficiency in retrieval.

18
Bibliography
1. [gr95] V.N.Gudivada and V.V.Raghavan.: Special issue on content-based image
retrieval systems - guest eds. IEEE Computer. 28(9) (1995) 18-22
2. [mcl97] M.De Marsicoi, L.Cinque, and S.Levialdi.: Indexing pictorial documents by
their content: a survey of current techniques. Image and Vision Computing. 15(2)
(1997) 119-141
3. [flick95] M.Flickner etal.,: Query by image and video content: the QBIC system. IEEE
Computer. 28(9) (1995) 23-32
4. [nib93] W.Niblack etal.,: The QBIC project: Querying images by content using color,
texture and shape. In Storage and Retrieval for Image and Video Databases (SPIE). Vol
1908 (1993) 173-187
5. [os95] V.E.Ogle and M.Stonebaker.: Chabot: Retrieval from a relational database of
images. IEEE Computer. 28(9) (1995) 40-48
6. [sc96] J.R.Smith and S.F.Chang.: Visualseek: A fully automated content-based image
query system. ACM Multimedia. (1996) 87-98
7. [chad97] C.Carson etal.,: Region-based image querying.: In CVPR'97 Workshop on
Content-based Access to Image and Video libraries (CAIVL'97) (1997)
8. [sb91] M.J.Swain and D.H.Ballard.: Color indexing. Intl. Journal of Computer Vision.
Vol. 7 No. 1 (1991) 11-32
19
9. [haf95] J.Hafner etal.,: Efficient color histogram indexing for quadratic form distance
functions. PAMI. Vol. 17 No. 7 July. (1995) 729-736
10. [sd96] M.Stricker and A.Dimai.: Color indexing with weak spatial constraints.
Proceedings of SPIE Storage and Retrieval of Still Image and Video Databases IV. Vol.
2670 (1996) 29-40
11. [huang97] J.Huang etal.,: Image indexing using color correlograms. Proceedings of
CVPR. (1997) 762-768
12. [zhang95] H.Zhang etal,.: Image retrieval based on color features: an evaluation
study. Proceedings of SPIE. Vol. 2606 (1995) 212-220
13. [rpgb99] K.C.Ravishankar, B.G.Prasad, S.K.Gupta and K.K.Biswas.: Dominant Color
Region Based Indexing Technique for CBIR. Proceedings of the International
Conference on Image Analysis and Processing (ICIAP'99). Venice. Italy. Sept. (1999)
887-892
14. [wk98] X.Wan and C.J.Kuo.: A multiresolution color clustering approach to image
indexing and retrieval. Proceedings of ICASSP. (1998)
15. [gw87] R.C.Gonzalez and P.Wintz.:Digital Image Processing. 2nd Edition.Addison-
Wesley. Reading. Mass. (1987)
16. [msi95] D.Mohamad, G.Sulong and S.S.Ipson.: Trademark Matching using Invariant
Moments. Second Asian Conference on Computer Vision. 5-8 Dec, Singapore. (1995)
20
17. [cor94] Cortelazzo etal.,:Trademark Shapes Description by String-Matching
Techniques. Pattern Recognition. 27(8) (1994) 1005-1018
18. [jv95] A.K.Jain and A.Vailaya.:Image Retrieval using Color and Shape. Second Asian
Conference on Computer Vision. 5-8 Dec.Singapore. (1995) 529-533
19. [mg95] R.Mehrotra and J.E.Gary.: Similar-Shape Retrieval in Shape Data
Management. IEEE Computer. 28(9) (1995) 57-62
20. [jag91] H.V.Jagadish.: A Retrieval Technique for Similar Shapes. Proceedings of ACM
SIGMOD. Colorado. ACM. New York. May (1991) 208-217
21. [ls99] G.Lu and A.Sajjanhar.: Region-Based Shape Representation and Similarity
Measure Suitable for Content-Based Image Retrieval. Multimedia Systems. (7) (1999)
165-174