contents - nasfund · front: lady mina siaguru, william lamur (board chairman), lata milner, hulala...
TRANSCRIPT


NASFUND Annual Report 2014 “Your Partner in Superannuation”
3
Corporate Information
Vision, Mission and Value Statement
Board of Directors and Management Team
Chairman’s Statement
Chief Executive Officer ’s Statement.
Performance Breakdown
Corporate Governance
Risk Management
Our Work Culture
Our People
Our Community
Independent Auditors’ Report to the Members
Report of the Trustees of the Fund
Trustee’s Declaration to the Members
Management Declaration to the Members
Statement of Financial Position
Statement of Profit or Loss and other Comprehensive Income
Statement of Changes in Members’ Funds
Statement of Cash Flows
Notes to & forming part of the financial statements
Notes
Directory
4
5
6
7-8
9-12
13-15
16-17
18-19
22
20-21
23-24
25-26
27
28
29
30
31
32
33
34-80
81-82
83
CONTENTS
The rocks and bamboo depict NASFUND as an organization that is built on a solid foundation of good governance, transparency and accountability. Like the bamboo NASFUND must be flexible to adapt to changein the face of heightenedregulatory requirements,technology advancement and increasing memberexpectations.
National Superannuation Fund Limited (“Fund”, “NASFUND” hereinafter) is a registered trust in accordance with the Superannuation (General Provisions) Act 2000 and is incorporated and domiciled in Papua New Guinea. Principal Place of Business Level 4 , BSP House Harbour City Port Moresby, N.C.D. Papua New Guinea Trustee National Superannuation Fund Limited Directors of the Trustee Company Mr. William Lamur - Chairman (appointed 18 December 2014) Mr. Hulala Tokome - Deputy Chairman (appointed 18 December 2014) Mr. Graham Ainui, MBE Mr. Melchior Togolo, CBE Lady Mina Siaguru, CSM Mr. Murray Woo Mr. Reginald McAllister (resigned 1 July 2014 ) Mr. Vera Raga Mrs. Lata Milner, MBE Mr. David Doig (appointed 04 September 2014) Secretary Mr. Seno Wekina (resigned 1 December 2014) Mr. Jack Parina (appointed 1 December 2014) Auditors Deloitte Touche Tohmatsu Level 12 Deloitte Tower Douglas Street Port Moresby, N.C.D. Papua New Guinea Fund Administrators Aon Hewitt (PNG) Limited Investment Manager PacWealth Capital Limited Bankers Australia & New Zealand Banking Group (PNG) Limited Bank South Pacific Limited Lawyers Ashurst Lawyers Gadens Lawyers Posman Kua Aisi (PKA) Lawyers Warner Shand Lawyers Professional Indemnity Insurance American Home Insurance
NASFUND Annual Report “Your Partner in Superannuation”
4
FUND INFORMATION

Vision Statement
The first choice provider of Superannuation Services in Papua New Guinea.
Mission Statement
Safeguarding the retirement income of our Members in Papua New Guinea. To this end the Fund attempts to optimise growth and minimise risk by using the balanced portfolio approach. The Fund endeavours to credit an interestrate of minimum CPI + 2% over a rolling 5 year period. The Fund regards compliance to its Strategic Asset Allocation asparamount to acheiving this outcome.
Value Statement
Customer service is our first priority.
We rely on teamwork to achieve our goal.
We will treat each other with trust, respect, consideration and courtesy.
We will operate with honesty and integrity.
We will never turn a blind eye to corruption of any kind.
The efficient use of time will be encouraged.
Skill level, progress and contribution will be encouraged and rewarded.
We will be responsible for our actions.
We will provide necessary training and equipment.
We will provide necessary people in decision making.
We will empower people to make and carry out decisions.
There will be opportunities to learn the whole superannuation philosophy and processes.
We learn from mistakes so that we can improve NASFUND and grow.
We will communicate NASFUND activities and results.
We will do what we can to support community without impacting on members’ funds.
We will always protect the reputation of NASFUND by ethical behaviour.
NASFUND Annual Report 2014 “Your Partner in Superannuation”
5
VISION, MISSION & VALUE STATEMENT

The Board of Directors from left to right: Front: Lady Mina Siaguru, William Lamur (Board Chairman), Lata Milner, Hulala Tokome (Deputy Board Chairman).Back: Vera Raga, Graham Ainui, Murray Woo, David Doig, Mel Togolo.
NASFUND Annual Report 2014 “Your Partner in Superannuation”
6
BOARD OF DIRECTORS & MANAGEMENT TEAM
The Management Team from left to right: Front: Warwick Vele - Chief Operating Officer, Ian Tarutia - Chief Executive Officer, Rajeev Sharma - Chief Financial Officer, Back: Dominic Beange - Investment Consultant, Sitiveni Weleilakeba - Change Consultant, Charles Lee - Chief Investment Officer, Seno Wekina - Chief Legal Officer, John Topal - Chief Risk Officer, Jack Parina - Company Secretary.

NASFUND Annual Report 2014 “Your Partner in Superannuation”
9
CHIEF EXECUTIVE OFFICER’S STATEMENT
Mr.IanTarutia,MBEChief Executive Officer
2013 2014Net Asset Value K3.356 billion K3.719 billion Net Profit K332.25 million K258.46 millionReserves (% of NAV) 2.1% (K71 million) 1.72% (K64 million)Management Expense Ratio 1.38% 1.43%New Members Registered 61,441 51,179Members withdrawing under Section 90 66,680 76,984 Total Membership 461,085 488,346Active Membership 173,799 175,992Active Employer Base 2,389 2,150Contribution Receipts K443 million K459 millionWithdrawal Payment (Kina) K268 million K354 millionEducational and Public relation presentations 662 736 Interest credited to member accounts 11% 8.5%Amount of Interest credited (kina) K301 million K265 million
Dear Members,
We expected 2014 to be a challenging year, for reasons articulated in the Chairman’s opening statement. Not withstanding this we continued our endeavours to grow the membership, maintain effective client servicing, continously promote a savings culture and achieve the Board’s investment objective of delivering members a return equivalent to CPI plus 2%.
I am pleased to inform that through the collective efforts of our team we continued toproduce positive results, that I am sure, is appreciated by our valued members. A comparative analysis of the main highlights is presented in the following table:
Main contribution to net profit of K258.46 million was attributed to direct investment income of K227.503 million, movement in net value of investments of K77.512 million as well currency movement of K0.210 million before property costs of K17.1 million, admin expenses of K50.6 million and income tax expense tax of K29.5 million.
It should be noted that K56 million was written back into P & L out of an earlier provisioning taken up previously in2011 and 2012 relating to the impairment of the Sovereign Community Infrastructure Treasury Bill (SCITB) investment.Management expense ratio increased on the back of implementing new regulatory requirements and recruitment of keypersonnel in the Risk, Finance and Investment divisions.
On the back of this financial outcome, an 8.5% interest rate equating to over K265 million was approved by the Board tobe paid to members. This was credited into individual member accounts on the 27th February 2015.
Active membership remained static, due to high exiting members negating new member registrations. As reportedin 2013 the high withdrawals were mainly attributed to downsizing of the labour workforce associated with the LNGconstruction wind down. Unemployment and housing advances continued to be the largest category of withdrawals andreflect the unavailability of new jobs and high demand for housing needs. Total member accounts, however, inclusive ofinactive members increased by 6% to over 488,000 contributors. Our employer base decreased by 10% as a result of alarge number of establishments falling into inactive status and fewer registrations of new businesses in light of slowingeconomic growth. Despite this constraint, our marketing and employer services team continued their efforts to extendour coverage over a wider segment of the working population especially in the agricultural and informal sectors.
NASFUND Annual Report 2014 “Your Partner in Superannuation”
10
CHIEF EXECUTIVE OFFICER’S STATEMENT
Investment Summary
The Board’s investment objective is to achieve a return equal to or better than CPI plus 2% over a rolling 5 yearperiod and is now implementing its Strategic Asset Allocation which it adopted in in August 2013.
Our current asset allocation is as follows:
By 2017 the Board is expecting to be compliant with the new guidelines and is working closely with the Licensed Investment Manager, PacWealth Capital to achieve this objective.
New Investments made in 2014 were:
1. K320 million of Government Inscribed Stock and Treasury Bills as part of our defensive strategy to capitalise on long term high yielding government securities.2. K10 million recapitalising of Airlines PNG. 3. K28.5 million convertible note to Harbour City Developments.4. K10 million for 20% equity in Capital Life Insurance Limited.
Member Services Summary A key activity initiated in 2014 was the successful identification of a service provider to deliver a Enterprise ResourcePlanning (ERP) System for the Fund. Our objective is to have an integrated Management Information system that enables smarter decision making, provide better visibility / accountability over our internal business processes and facilitate error free transactions. In addition our network security systems were upgraded together with our networkconnections to our 15 branches throughout the country.
Asset Class Dec-14 SAA DifferencefromSAA High
Equities PNG Equities 31.1% 22% 9% 27%
Real Estate PNG Property 21.2% 17% 4% 25%
Off Shore Property 1.8%
Fixed Income PNG Bonds 24.3% 16% 9% 19%
PNG Loans 0% 0% 0%
PNG Cash 14.6% 10% 3.4% -
International Equities Global Defensive Equities 8.8% 11% -2% 14%
Asia ex Japan Equities 0 11% -11% 14%
Total International Equities 8.8% 22% -13%
International Fixed Income Asian Hard Currency Bonds 0 6% -6% 9%
Emerging Market Local 0 7% -7% 10% Currency Bonds
Total International FI/Cash 0% 13% -13%
Total 100% 100%

NASFUND Annual Report 2014 “Your Partner in Superannuation”
11
CHIEF EXECUTIVE OFFICER’S STATEMENT
Other highlights for the year were: 1. Client Services – Face Book Enquiries
Our Facebook Page continues to be a popular means of communication for our members. Since inception in 2013 wenow have 17,048 followers which is an increase of 19% over the previous year. Common queries are account balances and withdrawal enquiries. The Facebook Page is monitored by our Communications Centre and Media Relations Unit.
2. Revamped Website
Our website www.nasfund.com.pg was refreshed and launched in November 2014. Aside from serving as a cyber office, the new look website is more user friendly and portrays the Fund in a more professional light. Members are able to download withdrawal forms for housing purposes for example or check their balances. The website is also compatiblefor smart phones and provides members another option to conveniently access information about the Fund at theirfingertips. 3. New Branch Offices
We successfully opened a second client service in Port Moresby CBD and a new branch office in Lorengau, Manus Province. In Lae, home to our second largest member base, we will be extending our current office to better accommodate the increasing foot traffic through our office chambers. The same strategy of establishing a presence in provinces or sub districts where there is a large pool of existing as well aspotential members backed by sufficient telecommunication, transportation and banking infrastructure will be continuedin the new year. 4. Member Communication – Talk Back Show
The FM100 Talk Back is supported by NASFUND as major sponsor. Radio is an effective means of communicationbecause of its wide reach. Over the year 12 appearances were made to educate the public on the Funds benefits. In particular sessions focused on promoting a savings culture, updating beneficiaries, date of births and unpaid contributions from defaulting employers.
5. Unallocated Contributions
The timely receipt of contributions and efficient allocation into individual member accounts is an important KPI. It means members are able to access updated balances at any point in time, keeps employers compliant with remittances and enables members to plan their future as they see their savings grow. Our KPI is to keep aged unallocated contributions > 90 days below K5 million per month. This has been consistently below K5 million especially in the second half of the year, reflecting the effective workings of our Employer Services department and Aon Hewitt (PNG) Limited, our back office Fund Administrator.
6. Education, Public Awareness & Marketing.
Interaction and direct communication with employers and members through regional conferences, and employer shopfloor presentations is another important KPI and is conducted by our Business Development Unit. This activity ensuresmembers and potential new contributors are kept abreast of all issues pertaining to the Fund, in addition to the benefitsand services offered. Four regional employer conference were held in Port Moresby, Lae, Mt Hagen and Kokopo over2014 and 736 shop floor presentations conducted throughout the country.

NASFUND Annual Report 2014 “Your Partner in Superannuation”
12
CHIEF EXECUTIVE OFFICER’S STATEMENT
People
A number of key appointments were necessary during the year to cover the departure of senior personnel as well as ensuring critical functions of the Fund continued to be performed with the highest level of diligence and competency.We were saddened by the departure of Mr Andrew McGrath, former General Manager Finance & Investments for personal reasons but were pleased to welcome the addition of 5 senior executives into specialist roles.
Mr Rajeev Sharma, a well qualified and experienced accountant was appointed Chief Financial Officer, Mr Charles Leewas promoted from Manager Investments to Chief Investment Officer, Mr John Topal, formerly of Bank of Papua New Guinea was appointed Chief Risk Officer, Mr Dominic Beange was appointed Investment Consultant and Mr Jack Parina was appointed Board Secretary.
Regulatory & Governance
The regulator, Bank of Papua New Guinea introduced 3 new prudential standards on Governance (PS 7/2012), Investments (PS 1/2014) and Risk (PS 8/2014) which now govern the Fund in terms of regulatory compliance.
In July 2014, an onsite review was conducted on our Investment Portfolio and a number of findings were highlighted whichwe are now addressing as an opportunity for improvement. We have since made adjustments to systems, processes andthe organizational structure to accommodate these changes.
Focus 2015
Our focus for 2015 will be to address the findings of the regulator as well as roll out a successful implementation of ourERP project. We acknowledge that organic growth factors, especially member growth and contribution inflow will continue to be affected by the increased volume of withdrawal applications on unemployment grounds. Our challengewill be to ensure our service capacity is meeting these demands as well as ensuring we have a sufficient liquidity attimes to make these payments. We are confident we can meet this challenge.
I would like to acknowledge the many people and organizations that contributed to the positives of 2014. Firstly, to ourvalued members, thank you for your unwavering support and patronage. Our regulator and the State are important players in our industry and their role is acknowledged. I also wish to thank our key service providers,Aon Hewitt (PNG)Limited and Pacwealth Capital for their timely back office services and professional investment advice.
Finally, a special thank you to the Board, fellow EXCOM members and all the hardworking staff of the Fund. Well done and I look forward to your commitment and support once more in 2015.
IanA.Tarutia,MBEChief Executive Officer.
NASFUND Annual Report 2014 “Your Partner in Superannuation”
13
PERFORMANCE BREAKDOWN
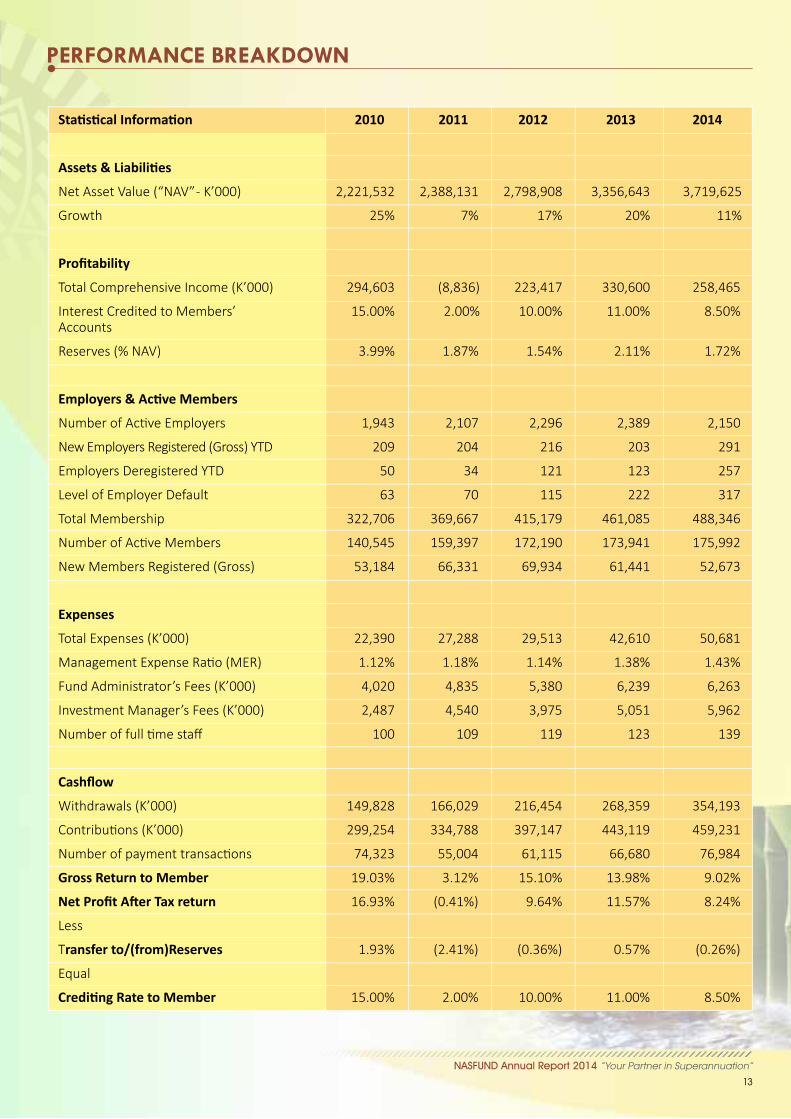
StatisticalInformation 2010 2011 2012 2013 2014
Assets&Liabilities
Net Asset Value (“NAV” - K’000) 2,221,532 2,388,131 2,798,908 3,356,643 3,719,625
Growth 25% 7% 17% 20% 11%
Profitability
Total Comprehensive Income (K’000) 294,603 (8,836) 223,417 330,600 258,465
Interest Credited to Members’ 15.00% 2.00% 10.00% 11.00% 8.50% Accounts
Reserves (% NAV) 3.99% 1.87% 1.54% 2.11% 1.72%
Employers&ActiveMembers
Number of Active Employers 1,943 2,107 2,296 2,389 2,150
New Employers Registered (Gross) YTD 209 204 216 203 291
Employers Deregistered YTD 50 34 121 123 257
Level of Employer Default 63 70 115 222 317
Total Membership 322,706 369,667 415,179 461,085 488,346
Number of Active Members 140,545 159,397 172,190 173,941 175,992
New Members Registered (Gross) 53,184 66,331 69,934 61,441 52,673
Expenses
Total Expenses (K’000) 22,390 27,288 29,513 42,610 50,681
Management Expense Ratio (MER) 1.12% 1.18% 1.14% 1.38% 1.43%
Fund Administrator’s Fees (K’000) 4,020 4,835 5,380 6,239 6,263
Investment Manager’s Fees (K’000) 2,487 4,540 3,975 5,051 5,962
Number of full time staff 100 109 119 123 139
Cashflow
Withdrawals (K’000) 149,828 166,029 216,454 268,359 354,193
Contributions (K’000) 299,254 334,788 397,147 443,119 459,231
Number of payment transactions 74,323 55,004 61,115 66,680 76,984
Gross Return to Member 19.03% 3.12% 15.10% 13.98% 9.02%
NetProfitAfterTaxreturn 16.93% (0.41%) 9.64% 11.57% 8.24%
Less
Transfer to/(from)Reserves 1.93% (2.41%) (0.36%) 0.57% (0.26%)
Equal
CreditingRatetoMember 15.00% 2.00% 10.00% 11.00% 8.50%
NASFUND Annual Report 2014 “Your Partner in Superannuation”
14
PERFORMANCE BREAKDOWN
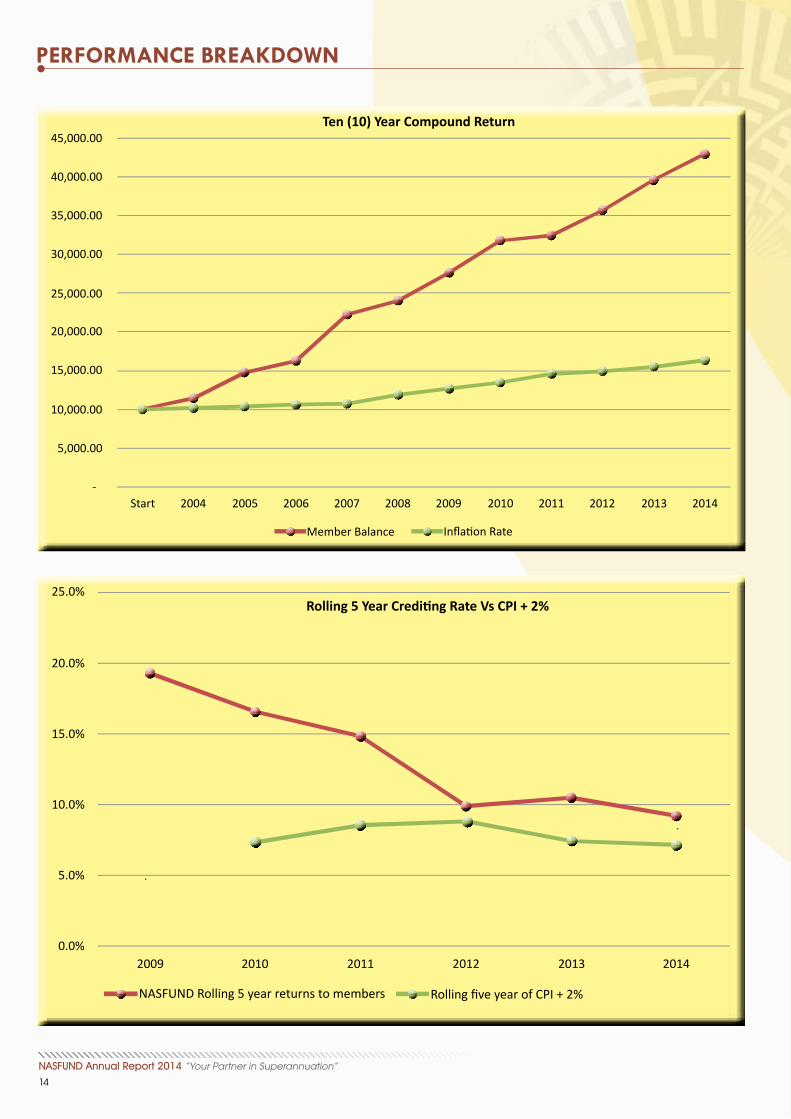
45,000.00
40,000.00
35,000.00
30,000.00
25,000.00
20,000.00
15,000.00
10,000.00
5,000.00
-Start 2004 2005 2006 2007 2008 2009 2010 2011 2012 2013 2014
Member Balance Inflation Rate
Ten (10) Year Compound Return
0.0%2009
NASFUND Rolling 5 year returns to members
Rolling5YearCreditingRateVsCPI+2%
5.0%
10.0%
15.0%
20.0%
25.0%
2010 2011 2012 2013 2014
Rolling five year of CPI + 2%
NASFUND Annual Report 2014 “Your Partner in Superannuation”
15
PERFORMANCE BREAKDOWN
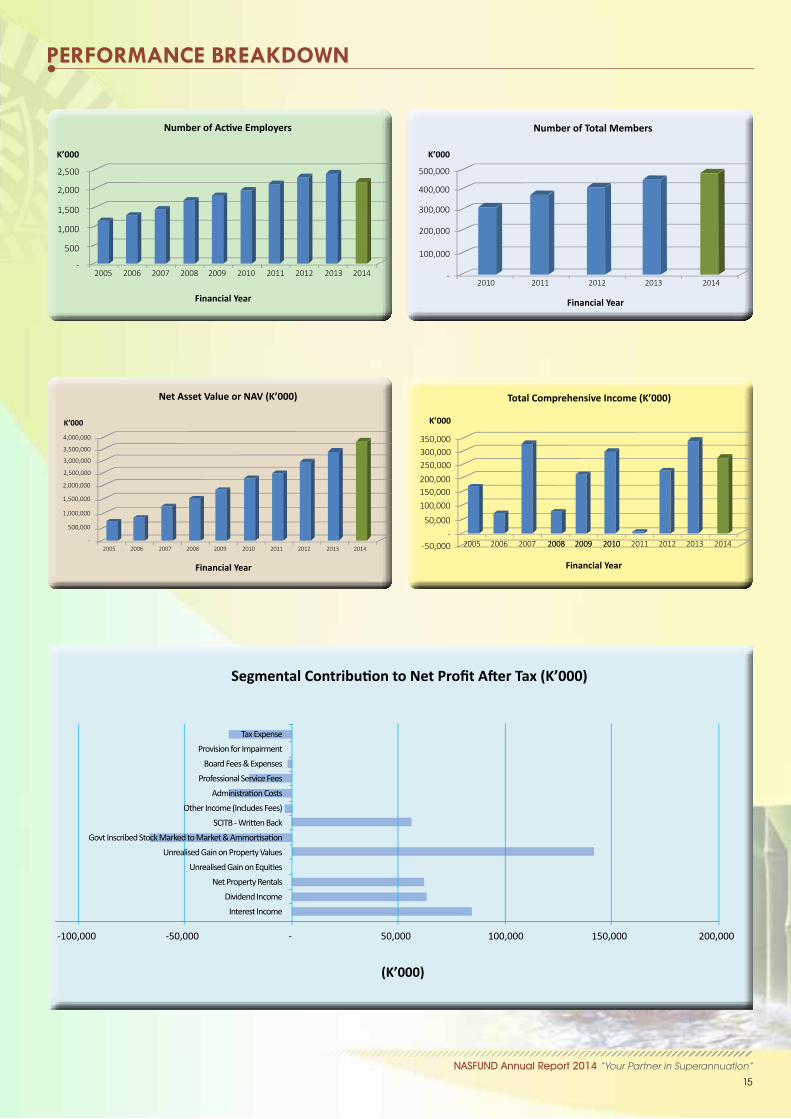
SegmentalContributiontoNetProfitAfterTax(K’000)
Tax ExpenseProvision for Impairment
Board Fees & ExpensesProfessional Service Fees
Administration CostsOther Income (Includes Fees)
SCITB - Written BackGovt Inscribed Stock Marked to Market & Ammortisation
Unrealised Gain on Property ValuesUnrealised Gain on Equities
Net Property Rentals Dividend Income
Interest Income
-100,000 -50,000 50,000 100,000 150,000 200,000
(K’000)
-
NumberofActiveEmployers
Financial Year
K’000
2,500
2,000
1,500
1,000
500
-2005 2006 2007 2008 2009 2010 2011 2012 2013 2014
Total Comprehensive Income (K’000)
Financial Year
K’000
350,000300,000250,000200,000150,000100,000
50,000-
-50,000 2008 2009 2010 2011 2012 2013 2005 2006 2007 2008 2009 2010 2014
Net Asset Value or NAV (K’000)
Financial Year
K’000
3,500,000
3,000,000
2,500,000
2,000,000
1,500,000
1,000,000
500,000
-2008 2009 2010 2011 2012 2013 2005 2006 2007 2014
4,000,000
Number of Total Members
K’000
300,000
400,000
500,000
200,000
100,000
-
Financial Year
2010 2011 2012 2013 2014

NASFUND Annual Report 2014 “Your Partner in Superannuation”
16
CORPORATE GOVERNANCE
In 2014 the Bank of Papua New Guinea as the Regulator of the Superannuation industry in PNG introducedSuperannuation Prudential Standard 7/2012 on Corporate Governance applying to Authorised Superannuation Funds(ASFs). The purpose of PS7/2012 is as follows:
a) This Standard prescribes standards of corporate governance conduct and administration for Licence Holders and its officers to ensure that Licence Holders are prudently managed and that reasoned, informed and impartial decisions are made in the best interests of the members of the ASFs.
b) The ultimate responsibility for the sound and prudent management of an institution regulated by the Bank of PNG rests with its Board of Directors. It is essential that a Licence Holder has a sound governance framework and conducts its affairs with a high degree of integrity. A Culture that promotes good governance at that benefits all stakeholders of a Licence Holder and helps maintain public confidence in the institution
PS7/2012 prescribes requirements on ASF, including:
Governance Framework; Board Composition; Licensed Service Providers; Fitness and Propriety of directors and officers; Board Procedures; Tenure of appointments of members of the Board of Directors; Conflicts of Interest; Whistleblowing; Audit Committee; Internal Audit; Board Renewal and Succession Planning for members of the Board; Performance Assessment and Review of the Board; Delegated Authority; Independent Directors; Remuneration Policy, Committee and Disclosure; Investment Committee; The formulation and implementation of a Risk Management Framework.
As part of its compliance with PS7/2012 a number of actions were taken by the FUND as follows:
Resignation of all officers from Boards of entities that the FUND has a major interest in; Appointment of Independent Directors to investee company Boards; Creation and filling of the position of Chief Risk Officer; Addition of staff in the Investment, Finance and Legal divisions; Engagement of an independent investigator to examine allegations of fraud; Review and Implementation of the Whistleblower Policy; Introduction of awareness sessions with staff to highlight areas of risk and good governance.
In 2012 the Fund’s Board initiated a programme of self-governance. A number of areas were identified coveringdirectors’ personal development and a process of performance review, to be conducted by a qualified, independentparty. Each director must undergo an accredited training course with the Papua New Guinea Institute of Directors, AustralianInstitute of Company Directors, as well as a number of targeted training sessions run by the Australian SuperannuationFunds Association (ASFA). Both institutions provide a very high level of accredited director education and are leaders inthe region, giving members confidence that their Fund Trustees are well informed to discharge their duties properly.

NASFUND Annual Report 2014 “Your Partner in Superannuation”
17
CORPORATE GOVERNANCE
Board and Committee Attendance Name of Director Status Board Meeting Com. Meeting Mel Togolo, CBE Continuing 9/11 4/6 William Lamur Continuing 11/11 6/6 Reginald McAlister Ceased (1 July 2014) - - Graham Ainui, MBE Continuing 11/11 7/7 David Doig Appointed (4 September 2014) 4/4 1/1 Vera Raga Continuing 10/11 4/4 & 6/6 Murray Woo Continuing 10/11 6/6 & 6/6 Hulala Tokome Continuing 9/11 5/6 Mina Siaguru, CSM Continuing 10/11 6/7 Lata Milner, MBE Continuing 10/11 4/7 & 5/6
For the assessment of board performance, Mr. Ray Clark of Board Assessment and Evaluation Ltd was engaged to provide these services entailing observing board meetings and conducting interviews with each director. At the conclusion of the assessment, each director is furnished with an individualized report advising their personal level of performance and any areas of improvement. A consolidated report containing individual directors’ performance assessments, plus an overallassessment of the board is then submitted to the Regulator, Bank of PNG for their review. The above engagements are an important step in ensuring the FUND’s directors are well equipped to discharge theirduties in an evolving regulatory environment.
Annual regional Employer Conference, Port Moresby.
NASFUND Annual Report 2014 “Your Partner in Superannuation”
18
RISK MANAGEMENT
Risk Management Framework NASFUND’s comprehensive Risk Management Framework (RMF) fully complies with requirements of the Superannuation Prudential Standard 8/2014 Risk Management issued by the Bank of PNG. The RMF practically coversapproach to risk, responsibility of risk management across the organisation, determination of Risk Appetite Statement(RAS), the Risk Management Strategy (RMS), the Material Risk Register, risk management principles, policies, approach,management and monitoring arrangements in respect of adequate human, technical and financial resources.
ObjectivesofRiskManagement
The objective of Risk Management at NASFUND is to ensure:
• Appropriate internal processes are in place for identifying, rating, managing and reporting on material risks; • Appropriate internal processes are in place for ensuring the material risk profile remains up to date and relevant to NASFUND;• Risk appetite is clearly articulated and regularly reviewed;• An appropriate risk aware culture is embedded within and throughout NASFUND;• Available resources to execute controls are used optimally to manage material risks and have regard to the ratings assigned to risks;• Appropriate controls are in place for material risks and that the residual risk (after considering controls in place to manage the risks) are consistent with the risk appetite of NASFUND and of the Board (which may vary from time to time); and• NASFUND takes informed and considered risks.
TheRiskAppetiteStatement(RAS) Two key elements, the RAS and RMS, comprise the RMF. The RAS outlines NASFUND’s risk appetite, which is the amountof risk the Board considers is acceptable to expose the Fund to, in the pursuit of its strategic objectives and considersboth value creation (upside) and value preservation (downside). The Risk Management Strategy (RMS)
The RMS comprises the systems and processes used to identify, assess, manage, mitigate, monitor and control all Material Risks that the Board has identified. NASFUND’s RMF is consistent with the most recent International Standardon Risk Management (currently ISO 31000). Importantly, this framework provides NASFUND with the flexibility to adaptquickly to the changing needs of the business. Processes relating to establishing the context, identifying risks, analysingrisks, evaluating risks, treating risks, monitoring and reviewing risk mitigation plans and communicating and consultingwithin and externally, underpin NASFUND’s RMS.
TheBoardandAudit&RiskCommittee
NASFUND Board is ultimately responsible for the RMF and more broadly for the sound and prudent management of risks. Whilst the oversight of risk is delegated to the Audit & Risk Committee (A & RC), this does not in any way abrogate the Board’s ultimate responsibility for ensuring that Management have in place appropriate risk frameworks.
NASFUND’sRiskManagementFunction
As required by PS 8/2014, NASFUND has an in-house risk management function led by the Chief Risk Officer (CRO) andincludes in-house support resources to assist in the management and monitoring of risks including periodic compliancetesting. The CRO is responsible for assisting the Board, A & RC and Management in developing and maintaining the RMF.
NASFUND Annual Report 2014 “Your Partner in Superannuation”
19
RISK MANAGEMENT
The Risk Management Function is also supported by the outsourced internal audit function and external audit in respect to providing assurance over the design and operating effectiveness of internal controls and the RMF. Importantly however, all people involved in the achievement of NASFUND’s objectives have some role to play in themanagement of risk and these collectively form NASFUND’s Risk Management Function. Those roles are broadly outlined below.
TheBoardandAudit&RiskCommittee
The Board is responsible for instilling a strong risk culture throughout the organisation and for ensuring that an effectiveprocess of risk management and internal compliance and control is in place. The Board oversights the risk managementprocess including the risk assessment process and the effectiveness and status of risk mitigation actions through its sub-committee, the A & RC.
Management
Management is responsible for the implementation of organisational policies to achieve effective risk management, and for ensuring adherence to policies by employees. Members of management are responsible for identifying andevaluating risks within their area of responsibility and implementing agreed actions to manage risk.
Review,AuditandReporting
NASFUND regularly reviews and monitors the RMF to ensure it remains appropriate, effective and adequate. NASFUND undertakes a comprehensive independent review by Internal Audit at least once every 3 years, ensures an Annual Review is undertaken at least once a year (for each year during which a comprehensive review does not take place) and undertake other reviews outside of the review arrangements set out above, where NASFUND identifies institutional, operational or other developments that materially affect the size, business mix and complexity of its business operations. Audit of RMF External audit and internal audit is required to be undertaken regularly to ensure appropriate compliance testing coverage is maintained and to enable the Board to attest annually that the RMF is appropriately designed and operating effectively. RiskManagementDeclarationReporting
NASFUND will provide Bank of PNG with an Annual Declaration on Risk Management signed by two Directors. BreachReporting
The CRO will be responsible for reporting to the Board, A & RC and Bank of PNG when a material deviation from, or materialbreach of the RMF occurs. RiskReporting
Management reporting of risk information underpins the effectiveness of the Board’s Risk Management governancestructure and ensures the transparency of risks that face NASFUND’s business. The quarterly risk report to A&RC is themeans of communicating risk activities, significant risks, and incidents, which is then consolidated for reporting to theBoard on a quarterly basis by the CRO.

NASFUND Annual Report 2014 “Your Partner in Superannuation”
20
OUR WORK CULTURE
Providing a work environment that is safe, team oriented, encouraging of ambition and that recognises and rewardsachievement is extremely important for NASFUND.
Employment Culture
NASFUND is proud of the development and retention of its staff, recognizing that “people are our most important asset”. Boasting one of the lowest staff turnover rates in the country we believe in training, supporting and empowering ourstaff to carry out their respective roles in an environment that fosters teamwork, leadership and recognizesand rewards high performance. Through workshops to identify SWOT (Strengths, Weaknesses, Opportunities, Threats),create and review the Strategic Plan and formulate the upcoming year’s budget, NASFUND staff at multiple levels aregiven the opportunity to contribute to the strategic direction of the company. These workshops are the precursor to theacceptance and ratification by the Board of the 5 Year Strategic Plan.
BeatingtoOneDrum
Staff are encouraged to recognize that they are part of a team at NASFUND. Individual staff objectives and KeyPerformance Indicators (KPIs) are formulated through an interactive process between management and staff. This process ensures that the sum of individual KPIs cascade up and are aligned with the objectives set by the Board inits Strategic Plan. It also ensures that staff, management and the Board are in concert and work towards a commonobjective. A balanced Scorecard is used to provide an objective measure of progress against the Strategic Plan and isreviewed on a regular basis by staff and management.
The Level Playing Field NASFUND promotes an open culture that fosters equal opportunity and mutual respect, where diversity is celebratedand where all members of staff can contribute equally to the success of the organization. Career development is basedon the input and application of staff rather than on arbitrary classifications.
Empowerment Staff are encouraged to take ownership of their areas of responsibility. As an organization that values its staff, NASFUNDbelieves that as its people are empowered in their respective roles, they will take more ownership of the desiredoutcomes, reaping the rewards not only for themselves but for the organization.
Rewarding Performance NASFUND recognises that people do not work in a vacuum. A bonus structure that creates an incentive for staff to achieve or exceed properly articulated objectives is an important part of staff motivation. In 2014 three CEO awardswere introduced, identifying champions in the areas of Customer Service, Risk Reduction and Value Enhancement. These champions are celebrated in monthly “town hall” briefing sessions to staff and recognizes staff around thecountry.
Zero Tolerance of Misbehaviour NASFUND has a zero tolerance towards sexual harassment, workplace bullying, theft, fraud and other forms of anti-socialand unwanted behavior. Depending on the nature of the behavior in question, the appropriate authority (internal orexternal) will be engaged to investigate and provide an independent determination of the facts and the appropriateaction to be taken, including penalties if any. Staff are encouraged to report transgressions in this area. NASFUND will haveno hesitation in referring people for prosecution for breaches of a criminal nature.

NASFUND Annual Report 2014 “Your Partner in Superannuation”
21
OUR WORK CULTURE
Discrimination NASFUND is an equal opportunity employer and does not discriminate on the basis of sex, race, colour, or religion. A comprehensive staff employment Policies and Procedures Manual has been compiled and is reviewed by the Audit andRisk Committee annually. Staff are encouraged to report any incident where they feel they have been subject to this sortof behavior, include going directly to the Board if the personnel carrying out this behavior is at a higher level of authority.
EducationStaff are encouraged to strive for higher learning and are able to access educational advancement through professionaltraining with NASFUND’s support. Training not only encompasses their current roles but also future roles that they areaiming for.
HIV The incidence of HIV/AIDS in the community is increasing at an alarming rate. While the Board and management areunaware of any staff member with HIV, discrimination against any staff member with the disease will not be tolerated.A comprehensive policy has been adopted at NASFUND that proactively considers the care, treatment and positivesupport for any staff member and immediate family who contracts HIV & AIDS. NASFUND through its outreach programplays an integral role in the PNG Business Coalition on HIV & AIDS (BAHA).
Communication
To keep staff informed and up to date with developments within the organization, the Fund employs a number ofmethods to disseminate information. Nastok is a regular newsletter containing items of interest and photos highlightingstaff milestones and achievements, whilst monthly townhall meetings are hosted by the CEO at which he presentshis monthly CEO awards to celebrate the hard work of staff. This is also an opportunity for EXCOM member to provideupdates or highlight areas of concern for their respective divisions.
Participants of 2014 NASFUND Branch OICs Conference, Port Moresby

NASFUND Annual Report 2014 “Your Partner in Superannuation”
22
OUR PEOPLE
Throughout we saw the continuation of the staff development programme initiated in 2012 and commenced in 2013.FUND staff attended development and training programmes at a number of domestic and international institutions,exposing them to a variety of training and learning methods and environments.
Training & Development Recognising staff as its most important asset, NASFUND continues to invest in their development. In 2014 thefollowing programmes were attended by staff:
Mt Eliza Business School, Australia Institute of Business Studies PNG IBBM Divine Word University Aila Consulting WINGS Education ETK Risk Consultants
University Scholarship
The Fund continued its University Scholarship Scheme in 2014. This scheme was implemented as a Capacity Building initiative forming part of our Corporate Social Responsibility program.
Under the scheme, the company invited interested applicants from Students entering their 3rd Year of studies in 2013 at the local Universities; University of Papua New Guinea, University of Technology, Pacific Adventist University and Divine Word University; studying in the fields of Business, Accounting and Computer Science. This year saw the graduation of Bradley Bonjui from UPNG and his commencement of full-time employment withinthe IT Department at NASFUND.
The NASFUND Scholarship program invites applicants every 2 years, meaning that the next set of applicants willbe selected in 2015 for graduation in 2016.
Workplace Diversity
We pride ourselves as an Equal Opportunity Employer, recognising the importance of a balanced workforce. The FUND’sgender ratio at the end of 2014 was 73 female to 66 male staff.
NASFUND awareness conducted at SP Brewery

NASFUND Annual Report 2014 “Your Partner in Superannuation”
23
OUR COMMUNITY
At CFC we aim to make a positive difference through working with three tiers of society - the political, business andcommunity levels. We seek to change the attitudes of individuals so that women and children are treated with respectand dignity.
CFC’spriorityafteritwasformedwastoseeklegislativeandpolicyreformtocurbdomesticviolence. On 18th September 2013 our efforts over the five years was rewarded when the draft Family Protection Billwe proposed to Government was passed by Parliament. The Family Protection Act makes domestic violence a criminaloffence. It also provides victims of domestic violence the legal avenue to seek protection under it. The other feature ofthe Act is that it is gender neutral; which means either spouse or partner in an intimate relationship is entitled to seekprotection under its provisions.
On 11th March 2014, the Family Protection Act was certified by the Speaker of Parliament which generally makes theAct come into operation. Work is now underway with CFC and its partners in the Department of Justice & AttorneyGeneral, PNG Law & Justice Sector Program and other stakeholders to organise the Awareness roll out of the Act and itsimplementation.
Apart from this milestone achievement, CFC also runs general awareness and advocacy programs targetingcommunities, schools and workplaces.
One of its major awareness campaigns is the White Ribbon Campaign done each year on 25th November - The International Day for the Elimination of all forms of Violence Against Women and Girls - where activities arestaged including media coverage to raise awareness.
CFC also participates in other organised forums and meetings organised by other like-minded organisations, NGO’s andstakeholders through workshops, forums, speaking engagements and so forth where CFC is also represented.
NASFUND supports the work of CFC by providing office space for their head office.
Buk bilong Pikinini “Education is the most powerful weapon which you can use to change the world.”- Nelson Mandela
Buk bilong Pikinini (books for children) is an independent not-for-profit organisation based in Port Moresby, Papua New Guinea, which aims to establish children’s libraries and foster a love of reading and learning. In PNG thereare few functioning libraries outside the school system and most children do not have access to books at all. The purpose of Buk bilong Pikinini is to focus on early childhood learning as a key to literacy. Only half of school-agechildren go to school and the literacy rate in PNG is well under the 50% officially claimed - in some areas as low as 5%. We aim to bring the books to the children via the creation of small Buk bilong Pikinini libraries in community basedlocalities such as near settlements, clinics and market places.
We collect books from private individuals and publishing houses and seek to obtain funding for our libraries throughvarious fundraising efforts as well as through corporate sponsorships. Buk bilong Pikinini was established in 2007 and has so far set up 16 children’s libraries with many more to come. Buk Bilong Pikinini libraries are not like normal libraries. We employ trained teacher-librarians who implement acomprehensive early childhood development programme in the mornings and a literacy and numeracy syllabus forschool children in the afternoons.
NASFUND supports the work of Buk bilong Pikini by providing office space for their head office.
CoalitionforChangePNGInc.(CFC). CFC is a community based not-for-profit advocacy group launched in November 2007 to address theissue of gender based violence, particularly violence in the home.Coalition for Change
Papua New Guinea Inc.
ABC
Buk bilong Pikinini

NASFUND Annual Report 2014 “Your Partner in Superannuation”
24
OUR COMMUNITY
Young Trainee Directors Program
The private sector has had long standing concerns about the lack of quality directors in Papua New Guinea with appropriate skill sets and experience to sit on Boards. In 2008 NASFUND initiated the NASFUND Young Trainee Director Program aimed at young professional Papua New Guineans aspiring to be Board Directors in future years. The program is as follows:
• The Board appoints 3 candidates by way of open invitation or nomination from the Business Council of PNG, PNG Chamber of Commerce and Rotary Club. The eligibility criteria is that candidates must:
I. Be between 25 and 35 years old;
II. Be a contributing member of NASFUND;
III. Have no Board experience;
IV. Have track record in current job and recognised by their employer;
V. Have written endorsement from employer to attend up to 6 meetings a year and a directors training course funded by NASFUND; VI. Sign a confidentiality agreement; and
VII. Have no criminal conviction and be able to pass a fit and proper test.
• A trainee director will be allocated a NASFUND director a mentor/coach for two years; and
• Trainee directors have the right to receive Board papers, participate in Board and Committee meetings but they are not entitled to vote on any Board resolution.
The program is a first hand experience of observing board protocols, board room dynamics and understanding the roleof a director. At the end of the two years the young directors are handed a certificate confirming their participation.
The next phase of the program entails successful candidates to be invited to sit on investee company boards at the discretion of the NASFUND Board.
Since inception the program has accommodated 9 young promising professionals with 7 successfully completing the program. The last batch commenced in 2011 with two candidates completing the program at the end of 2012. In 2013the Board appointed Christopher Elphick, Sarah Ilave-Richards and Vanessa Asivo. It is expected the three will completetheir training program at the end of 2015.
Christopher ElphickK. K. Kingston
Vanessa AsivoPNG Law Society
Sarah Ilave-RichardsPricewaterhouse Coopers

NASFUND Annual Report 2014 “Your Partner in Superannuation”
25
INDEPENDENT AUDITORS’ REPORT TO THE MEMBERS
Scope
We have audited the accompanying financial statements of National Superannuation Fund (the “Fund”), which comprisethe statement of financial position as at 31 December 2014, and the statement of comprehensive income, statementsof changes in equity and statement of cash flows for the year then ended, and a summary of significant accounting policies and other explanatory notes.
This report is made solely to the Fund’s members, as a body, in accordance with the Superannuation(General Provisions) Act 2000. Our audit work has been undertaken so that we might state to the Fund’s membersthose matters we are required to state to them in an auditor’s report and for no other purpose. To the fullest extent permitted by law, we do not accept or assume responsibility to anyone other than the Fund and the Fund’s members asa body, for our audit work, for this report, or for the opinions we have formed. Trustees and Management’s Responsibility for the Financial Statements The Trustees and Management are responsible for the preparation and fair presentation of these financial statementsin accordance with International Financial Reporting Standards and the Superannuation (General Provisions) Act 2000and the Superannuation Prudential Standards issued by the Bank of Papua New Guinea. This responsibility includes:designing, implementing and maintaining internal control relevant to the preparation and fair presentation of financialstatements that are free from material misstatements, whether due to fraud or error; selecting and applying appropriateaccounting policies; and making accounting estimates that are reasonable in the circumstances. Auditors’ Responsibility Our responsibility is to express an opinion on these financial statements based on our audit. We conducted our auditin accordance with International Standards on Auditing. Those standards require that we comply with relevant ethicalrequirements and plan and perform the audit to obtain reasonable assurance whether the financial statements are freeof material misstatement. An audit involves performing procedures to obtain audit evidence about the amounts and disclosures in the financialstatements. The procedures selected depend on the auditor’s judgement, including the assessment of the risks of material misstatement of the financial statements, whether due to fraud or error. In making those risk assessments, the auditor considers internal controls relevant to the entity’s preparation of the financial statements that gives a true andfair view in order to design audit procedures that are appropriate in the circumstances, but not for the purpose of expressing an opinion on the effectiveness of the entity’s internal control. An audit also includes evaluating the appropriateness of accounting policies used and reasonableness of accounting estimates made by the directors, as wellas evaluating the overall presentation of the financial statements.
We performed procedures to assess whether in all material respects the financial statements presents fairly in accordance with the International Financial Reporting Standards and the Superannuation (General Provisions) Act 2000and the Superannuation Prudential Standards, a true and fair view which is consistent with our understanding of theCompany’s and Group’s financial position and their performance.
We believe that the audit evidence we have obtained is sufficient and appropriate to provide a basis for our opinion. Audit opinion
In our opinion: (a) the accompanying financial statements give a true and fair view of the financial position of the Fund as at 31 December 2014 and of its financial performance and its cash flows for the year then ended in accordance with International Financial Reporting Standards, Superannuation (General Provisions) Act 2000 and the Superannuation Prudential Standards; and (b) proper accounting records have been kept by the Fund as far as appears from our examination of those records.

NASFUND Annual Report 2014 “Your Partner in Superannuation”
26
INDEPENDENT AUDITORS’ REPORT TO THE MEMBERS
OtherMatters Relevant ethical requirements for auditor independence are set out in IFAC’s Code of Ethics for ProfessionalAccountants. Due to certain audit team staff being members of the Fund, some of the relevant ethical requirements arenot met. We have implemented appropriate safeguards to address the resulting threats to our independence. The Boardof Trustees of the Fund, the Bank of PNG, and CPA PNG have confirmed to us their agreement that the safeguards aresufficient to enable us to issue our independent auditors’ report to the members.
DATED at PORT MORESBY this 26th day of February 2015. DeloitteToucheTohmatsu
Suzaan TheronAudit PartnerRegistered under the Accountants Act 1996
NASFUND Annual Report 2014 “Your Partner in Superannuation”
27
REPORT OF THE TRUSTEES OF THE FUND
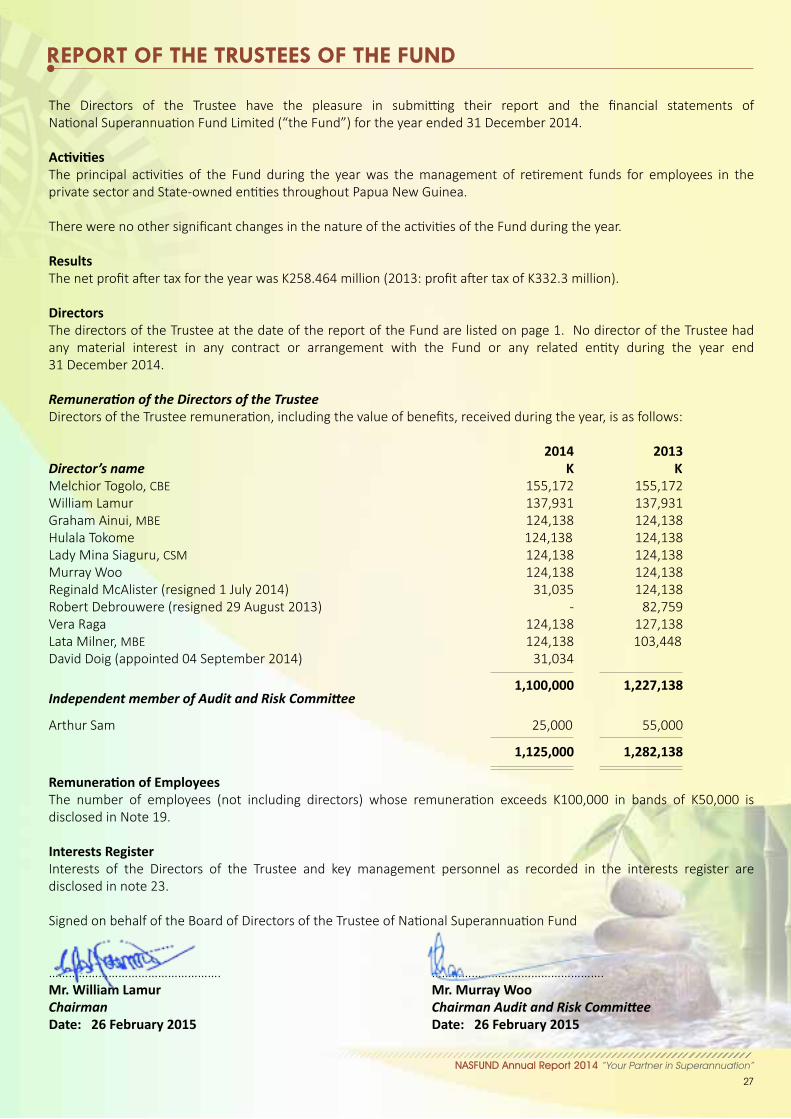
The Directors of the Trustee have the pleasure in submitting their report and the financial statements of National Superannuation Fund Limited (“the Fund”) for the year ended 31 December 2014. Activities The principal activities of the Fund during the year was the management of retirement funds for employees in theprivate sector and State-owned entities throughout Papua New Guinea. There were no other significant changes in the nature of the activities of the Fund during the year. Results The net profit after tax for the year was K258.464 million (2013: profit after tax of K332.3 million). Directors The directors of the Trustee at the date of the report of the Fund are listed on page 1. No director of the Trustee hadany material interest in any contract or arrangement with the Fund or any related entity during the year end 31 December 2014. Remuneration of the Directors of the Trustee Directors of the Trustee remuneration, including the value of benefits, received during the year, is as follows: 2014 2013Director’s name K K Melchior Togolo, CBE 155,172 155,172 William Lamur 137,931 137,931 Graham Ainui, MBE 124,138 124,138 Hulala Tokome 124,138 124,138 Lady Mina Siaguru, CSM 124,138 124,138 Murray Woo 124,138 124,138 Reginald McAlister (resigned 1 July 2014) 31,035 124,138 Robert Debrouwere (resigned 29 August 2013) - 82,759 Vera Raga 124,138 127,138 Lata Milner, MBE 124,138 103,448 David Doig (appointed 04 September 2014) 31,034 1,100,000 1,227,138 Independent member of Audit and Risk Committee
Arthur Sam 25,000 55,000 1,125,000 1,282,138 RemunerationofEmployees The number of employees (not including directors) whose remuneration exceeds K100,000 in bands of K50,000 is disclosed in Note 19. Interests Register Interests of the Directors of the Trustee and key management personnel as recorded in the interests register are disclosed in note 23. Signed on behalf of the Board of Directors of the Trustee of National Superannuation Fund
……………………………………………. ……………………………………………. Mr. William Lamur Mr. Murray Woo Chairman Chairman Audit and Risk Committee Date:26February2015 Date:26February2015

NASFUND Annual Report 2014 “Your Partner in Superannuation”
28
TRUSTEES’ DECLARATION TO THE MEMBERS
In our opinion, the financial statements set out on pages 30 to 80 are drawn up so as to give a true and fair view of thestate of affairs as at 31 December 2014 and the surplus before distribution for the year ended on that date of the National Superannuation Fund in so far as they concern members of the National Superannuation Fund. The Trustees have satisfied themselves that the National Superannuation Fund Board has: 1) Identified the key financial and operational risks;
2) Established systems to control and monitor those risks including adherence to prudent policies and procedures, reasonable operating limits and adequate and timely reporting processes;
3) Satisfied itself that the risk management systems are operating effectively and are adequate in regards to the risk they are designed to control; and
4) There are no apparent conflicts of interest with respect to National Superannuation Fund’s engagement of an external auditor which may compromise the independence of the auditor’s performance. The Financial Statements have been drawn up in accordance with the requirements of the Superannuation (General Provisions) Act 2000 and requirements of the Trust Deed of the National Superannuation Fund dated 31 May 2002. DATED at PORT MORESBY this 26th day of February 2015. For and on behalf of the Board of Directors of the Trustee of National Superannuation Fund: …………………………………….......... …………………………………………….Mr. William Lamur Mr. Murray Woo Chairman ChairmanAuditandRiskCommittee

NASFUND Annual Report 2014 “Your Partner in Superannuation”
29
MANAGEMENT DECLARATION TO THE MEMBERS
In our opinion, the financial statements set out on pages 30 to 80 are drawn up so as to give a true and fair view of thestate of affairs as at 31 December 2014 and the surplus before distribution for the year ended on that date of the National Superannuation Fund in so far as they concern members of the National Superannuation Fund. The Management have satisfied themselves that the National Superannuation Fund Board has: 1) Identified the key financial and operating risks; 2) Established systems to control and monitor those risks including adherence to prudent policies and procedures, reasonable operating limits and adequate and timely reporting processes; 3) Satisfied itself that the risk management systems are operating effectively and are adequate in regards to the risk they are designed to control; and 4) There are no apparent conflicts of interest with respect to National Superannuation Fund’s engagement of an external auditor which may compromise the independence of the auditor’s performance. The Financial Statements have been drawn up in accordance with the requirements of the Superannuation(General Provisions) Act 2000 and requirements of the Trust Deed of the National Superannuation Fund dated 31 May 2002.
DATED at PORT MORESBY this 26th day of February 2015. For and on behalf of the National Superannuation Fund management: …………………………………………….... …………………………………… Mr.IanTarutia,MBE Mr. Rajeev Sharma Chief Executive Officer Chief Financial Officer
NASFUND Annual Report 2014 “Your Partner in Superannuation”
30
STATEMENT OF FINANCIAL POSITION
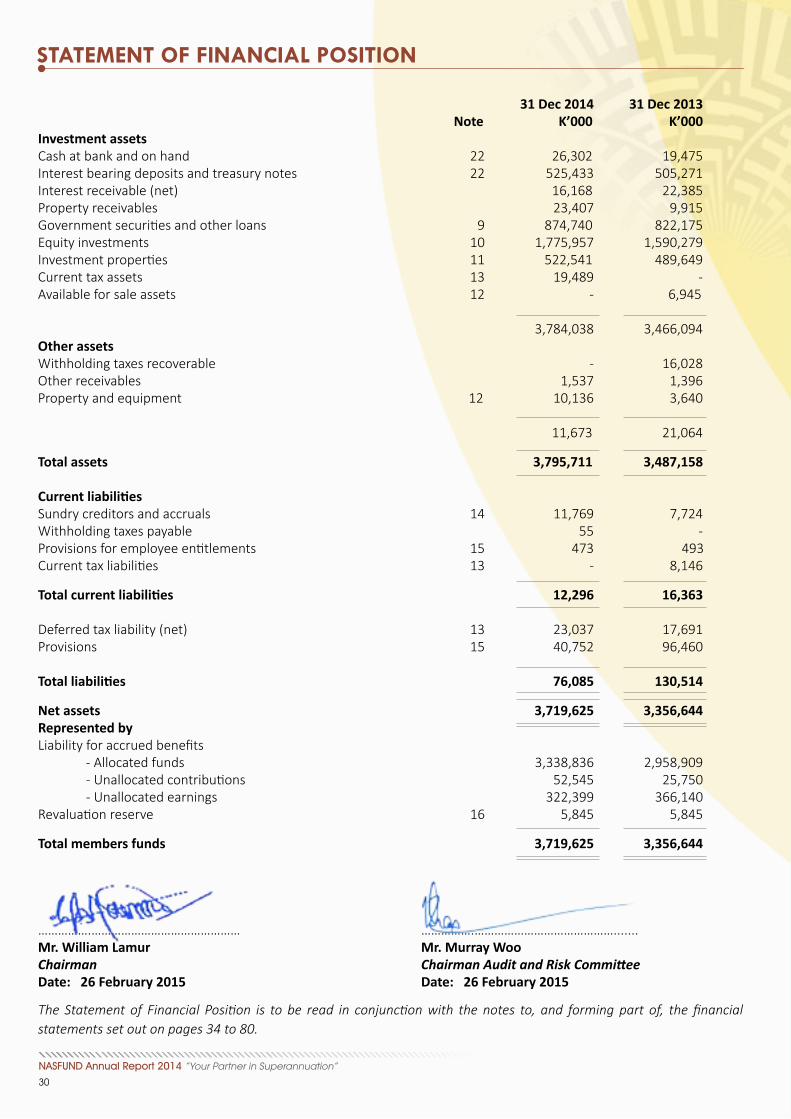
31 Dec 2014 31 Dec 2013 Note K’000 K’000 Investment assets Cash at bank and on hand 22 26,302 19,475 Interest bearing deposits and treasury notes 22 525,433 505,271 Interest receivable (net) 16,168 22,385 Property receivables 23,407 9,915 Government securities and other loans 9 874,740 822,175 Equity investments 10 1,775,957 1,590,279 Investment properties 11 522,541 489,649 Current tax assets 13 19,489 - Available for sale assets 12 - 6,945 3,784,038 3,466,094 Other assets Withholding taxes recoverable - 16,028 Other receivables 1,537 1,396 Property and equipment 12 10,136 3,640 11,673 21,064 Total assets 3,795,711 3,487,158
Currentliabilities Sundry creditors and accruals 14 11,769 7,724 Withholding taxes payable 55 - Provisions for employee entitlements 15 473 493 Current tax liabilities 13 - 8,146
Totalcurrentliabilities 12,296 16,363
Deferred tax liability (net) 13 23,037 17,691 Provisions 15 40,752 96,460 Totalliabilities 76,085 130,514
Net assets 3,719,625 3,356,644 Represented by Liability for accrued benefits - Allocated funds 3,338,836 2,958,909 - Unallocated contributions 52,545 25,750 - Unallocated earnings 322,399 366,140 Revaluation reserve 16 5,845 5,845
Total members funds 3,719,625 3,356,644
…………….……………………………………… …………….……………………………………....... Mr. William Lamur Mr. Murray Woo Chairman Chairman Audit and Risk Committee Date:26February2015 Date:26February2015 The Statement of Financial Position is to be read in conjunction with the notes to, and forming part of, the financial statements set out on pages 34 to 80.

NASFUND Annual Report 2014 “Your Partner in Superannuation”
31
STATEMENT OF PROFIT OR LOSS & OTHER COMPREHENSIVE INCOME
2014 2013 Note K’000 K’000Investment income Interest income 84,718 79,092 Dividend income 63,432 64,701 Property rentals 79,353 55,894 Movement in net fair value of investments 17 77,512 205,585 Net foreign exchange gain / (loss) 210 823 305,225 406,095 Less: property costs (17,117) (17,420) Net investment income 288,108 388,675 Other income and expenses Sundry income 1,502 1,627 Loss on disposal of shares (6,908) - Profit / (Loss) on disposal of fixed assets (42) 2 (5,448) 1,629 Expenditure Provision for bad and doubtful debts 9(e) 56,000 (8,813)Provision for bad and doubtful debts - rent - (640)Staff related expenses 19 (13,040) (12,030)Fund administration fee (6,263) (6,239)Investment manager’s fee (5,962) (5,051)Advertising (717) (768)Depreciation (623) (420)Board expenses (1,614) (1,465)Bank of PNG regulatory fees (2,670) (1,392)Donations (20) (46)Other administration expenses (19,772) (14,559) 5,318 (51,423)
“Operatingprofitbeforeimpairmentofgovernment securities” 18 287,977 338,881 Less: provision for impairment of government securities 21 - - Profitbeforetax 287,977 338,881 Income tax expense 13 (29,513) (6,631) Profitfortheyear 258,465 332,250 Other comprehensive income Items that will never be reclassified to profit or loss Revaluation (loss) / gain of property 16 - (1,650) Total comprehensive income for the year 258,465 330,600 The Statement of Comprehensive Income is to be read in conjunction with the notes to, and forming part of, the financialstatements set out on pages 34 to 80.
NASFUND Annual Report 2014 “Your Partner in Superannuation”
32
STATEMENT OF CHANGES IN MEMBERS’ FUNDS
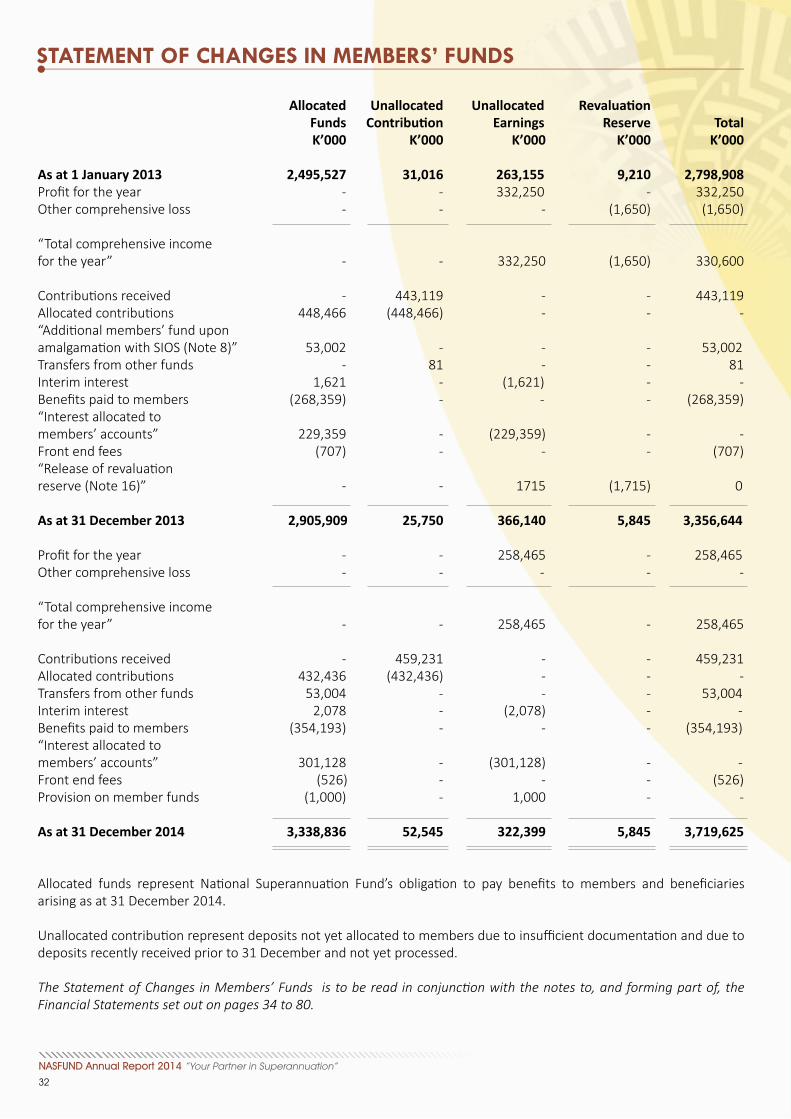
Allocated Unallocated Unallocated Revaluation Funds Contribution Earnings Reserve Total K’000 K’000 K’000 K’000 K’000 As at 1 January 2013 2,495,527 31,016 263,155 9,210 2,798,908Profit for the year - - 332,250 - 332,250 Other comprehensive loss - - - (1,650) (1,650) “Total comprehensive income for the year” - - 332,250 (1,650) 330,600 Contributions received - 443,119 - - 443,119Allocated contributions 448,466 (448,466) - - - “Additional members’ fund upon amalgamation with SIOS (Note 8)” 53,002 - - - 53,002 Transfers from other funds - 81 - - 81 Interim interest 1,621 - (1,621) - - Benefits paid to members (268,359) - - - (268,359)“Interest allocated to members’ accounts” 229,359 - (229,359) - - Front end fees (707) - - - (707)“Release of revaluation reserve (Note 16)” - - 1715 (1,715) 0 As at 31 December 2013 2,905,909 25,750 366,140 5,845 3,356,644 Profit for the year - - 258,465 - 258,465 Other comprehensive loss - - - - - “Total comprehensive income for the year” - - 258,465 - 258,465 Contributions received - 459,231 - - 459,231 Allocated contributions 432,436 (432,436) - - - Transfers from other funds 53,004 - - - 53,004 Interim interest 2,078 - (2,078) - - Benefits paid to members (354,193) - - - (354,193)“Interest allocated to members’ accounts” 301,128 - (301,128) - - Front end fees (526) - - - (526)Provision on member funds (1,000) - 1,000 - - As at 31 December 2014 3,338,836 52,545 322,399 5,845 3,719,625 Allocated funds represent National Superannuation Fund’s obligation to pay benefits to members and beneficiaries arising as at 31 December 2014. Unallocated contribution represent deposits not yet allocated to members due to insufficient documentation and due todeposits recently received prior to 31 December and not yet processed. The Statement of Changes in Members’ Funds is to be read in conjunction with the notes to, and forming part of, theFinancial Statements set out on pages 34 to 80.
NASFUND Annual Report 2014 “Your Partner in Superannuation”
33
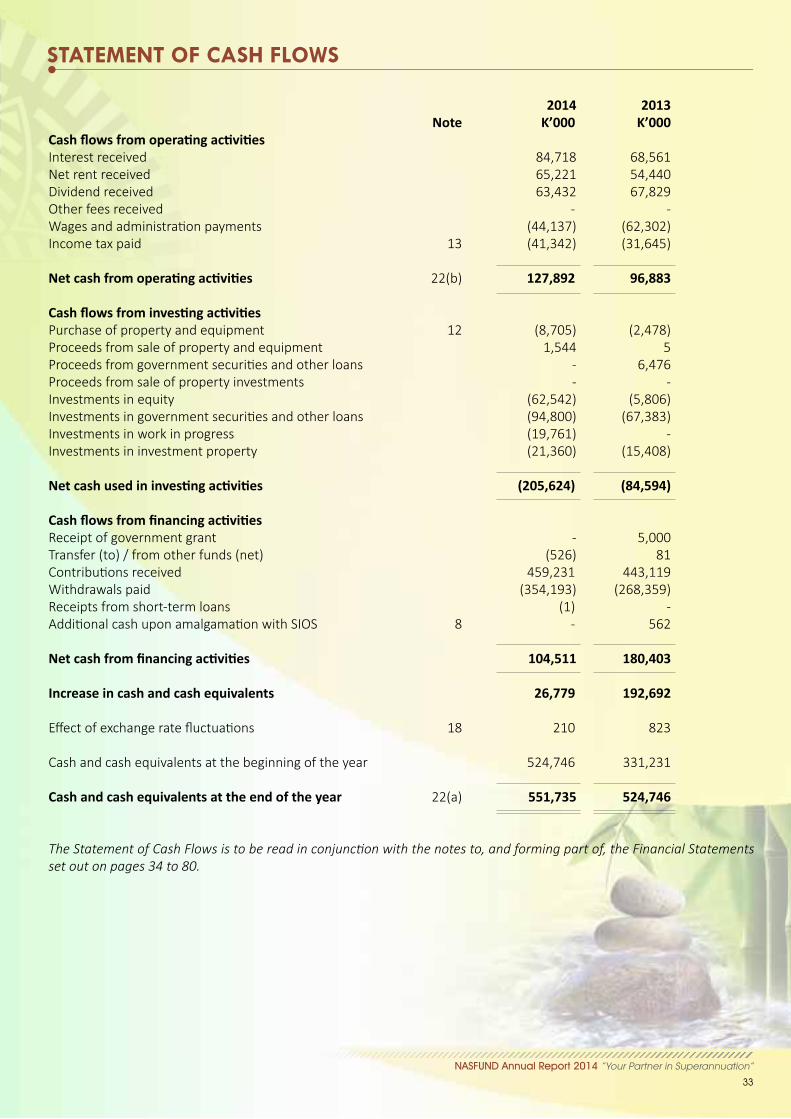
STATEMENT OF CASH FLOWS
2014 2013 Note K’000 K’000CashflowsfromoperatingactivitiesInterest received 84,718 68,561 Net rent received 65,221 54,440 Dividend received 63,432 67,829 Other fees received - - Wages and administration payments (44,137) (62,302)Income tax paid 13 (41,342) (31,645)
Netcashfromoperatingactivities 22(b) 127,892 96,883
Cashflowsfrominvestingactivities Purchase of property and equipment 12 (8,705) (2,478)Proceeds from sale of property and equipment 1,544 5 Proceeds from government securities and other loans - 6,476 Proceeds from sale of property investments - - Investments in equity (62,542) (5,806)Investments in government securities and other loans (94,800) (67,383)Investments in work in progress (19,761) - Investments in investment property (21,360) (15,408)
Netcashusedininvestingactivities (205,624) (84,594)
CashflowsfromfinancingactivitiesReceipt of government grant - 5,000 Transfer (to) / from other funds (net) (526) 81 Contributions received 459,231 443,119 Withdrawals paid (354,193) (268,359)Receipts from short-term loans (1) - Additional cash upon amalgamation with SIOS 8 - 562
Netcashfromfinancingactivities 104,511 180,403
Increase in cash and cash equivalents 26,779 192,692
Effect of exchange rate fluctuations 18 210 823
Cash and cash equivalents at the beginning of the year 524,746 331,231
Cash and cash equivalents at the end of the year 22(a) 551,735 524,746
The Statement of Cash Flows is to be read in conjunction with the notes to, and forming part of, the Financial Statementsset out on pages 34 to 80.

NASFUND Annual Report 2014 “Your Partner in Superannuation”
34
NOTES TO & FORMING PART OF THE FINANCIAL STATEMENTS
1. Reportingentity National Superannuation Fund (”the Fund” or ”NASFUND”) is a defined contribution superannuation fund domiciled in Papua New Guinea. The address of the Fund’s registered office is Level 4, BSP House, Harbour City, Port Moresby, Papua New Guinea. The Fund primarily is involved in the management of retirement funds for employees in the private sector and State Owned Entities throughout Papua New Guinea.
Under the Trust Deed number 220228, National Superannuation Fund Limited is the Trustee of the Fund. 2. Basisofpreparation
Statement of compliance The financial statements of the Fund have been prepared in accordance with International Financial Reporting Standards (IFRSs) as adopted by the Accounting Standards Board of Papua New Guinea (ASB) and the requirements of the Papua New Guinea Companies Act 1997, the Superannuation (General Provisions) Act 2000 and the Superannuation Prudential Standards issued by the Bank of Papua New Guinea.
The financial statements were authorised for issue by the Board of Directors of the Trustee, on 26th February 2015.
Basisofpreparation The financial statements have been prepared primarily on the historical cost basis except for the following material items in the Statement of Financial Position which are measured at fair value: ● financial instruments at fair value through profit or loss measured at fair value; ● available-for-sale financial assets measured at fair value; ● certain financial instruments carried at amortised cost; ● certain property, plant and equipment carried at revalued amounts; ● investment property measured at fair value; and ● investment in subsidiary and associates measured at fair value. Functionalandpresentationcurrency The financial statements are presented in the currency of Papua New Guinea, the Kina, which is the Fund’s functional currency and amounts are rounded to the nearest thousand.
Investmentsincontrolledandassociatedentities The Fund’s interest in controlled entities and entities in which it holds significant influence are treated as plan investments of the Fund and these investments are measured at fair value.
Useofestimatesandjudgments In the application of the Fund’s accounting policies, management is required to make judgments, estimates and assumptions about the carrying amounts of assets and liabilities that are not readily apparent from other sources. The estimates and associated assumptions are based on the historical experience and other factors that are considered to be relevant. Actual results may differ from these estimates.
The estimates and underlying assumptions are reviewed on an ongoing basis. Revisions to accounting are recognised in the period in which the estimate is revised and in future periods if affected.

NASFUND Annual Report 2014 “Your Partner in Superannuation”
35
NOTES TO & FORMING PART OF THE FINANCIAL STATEMENTS
2 Basisofpreparation(continued)
Useofestimatesandjudgments(continued)
Judgments The following are the critical judgments, apart from those involving estimations, that management has made in the process of applying the entity’s accounting policies and that have the most significant effect on the amounts recognised in financial statements.
Classification of investments The Fund’s management decides on acquisition of an investment whether it should be classified as a trading investment or available-for-sale. Classification of investments as trading investments depends on how management monitor the performance of these investments. These investments have readily available reliable fair values and the changes in fair values are reported as part of the statement of comprehensive income in the financial statements. All other investments are classified as available-for-sale.
Impairment of equity investments held at cost The Fund’s management reviews its investments for impairment. The assessment is carried out when there has been a significant or prolonged decline in the fair value of an equity investment below its cost or where objective evidence of impairment exists.
Estimationuncertainty The key assumptions concerning the future and other key sources of estimation uncertainty at the date of the statement of financial position, that have a significant risk of causing a material adjustment to the carrying amount of assets and liabilities within the next financial year are discussed below: Valuation of investment properties The Fund has adopted the fair value approach in determining the carrying value of its investment properties. While the Fund has opted to rely on independent appraisers’ advice to determine the fair value of its investment properties, such fair value was determined based on recent prices of similar properties, with adjustments to reflect any changes in economic conditions since the date of the transactions that occurred at those prices. The amounts and timing of recorded changes in fair value for any period would differ if the Fund made different judgments and estimates or utilised different basis for determining fair value.
The fair value methodology and any unobservable inputs that would would applicable to estimation for investment properties are considered in notes 4 (ii) and 11.
Valuation of financial assest and liabilities The Fund carries most of its financial assets and liabilities at fair value, which requires extensive use of accounting estimates and judgment. In addition, certain liabilities acquired through debt exchange and restructuring are required to be carried at fair value at the time of the debt exchange and restructuring. While significant components of fair value measurement were determined using verifiable objective evidence, i.e., foreign exchange rates, interest rates, volatility rates, the amount of changes in fair value would differ if the Fund utilised different valuation methodology. Any changes in fair value of these financial assets and liabilities would affect profit or loss and equity. The fair value methodologies and unobservable inputs used in calculating the financial assets and liabilities of the Fund are considered in notes 4 (iii) to (vi), 9, 10 and 24.

NOTES TO & FORMING PART OF THE FINANCIAL STATEMENTS
NASFUND Annual Report 2014 “Your Partner in Superannuation”
36
2 Basisofpreparation(continued) Contingent liabilities The Fund is currently involved in various legal proceedings as disclosed in note 21. Estimates of probable costs for the resolution of these claims has been developed in consultation with outside counsel handling the defence in these matters and is based upon an analysis of potential results. The Fund currently does not believe these proceedings will have a material adverse effect on the statement of financial position. It is possible, however, that future results of operations could be materially affected by changes in the estimates on in the effectiveness of the Fund’s strategies relating to these proceedings. ApplicationofnewandrevisedInternationalFinancialReportingStandards In the current year, the Fund has applied a number of amendments to IRFRs and a new Interpretation issued by the international Accounting Standars Board ( IASB) that are mandatorily effective for an accountin g period that begins on or after 1 January 2014. FRS 10, IFRS 12, and IFRS 27 Investment entities AS 32 Offsetting Financial Assets and Financial Liabilities
NewandRevisedIFRSsinissuebutnotyeteffective The Group has not applied the following new and revised IFRSs that have been issued but are not yet effective: IFRS 9 Financial instruments (4)
Amendments to IAS 16 Clarification of Acceptable Methods of Depreciation and and IAS 38 amortisation (3)
Amendments to IAS 19 Defined Benefits Plans: Employee Contributions (1) Amendments to IFRSs Annual Improvements to IFRSs 2010-2012 Cycle (2) Amendments to IFRSs Annual Improvements to IFRSs 2011-2013 Cycle (3)
1. Effective for annual periods beginning on or after 1 July 2014, with earlier application permitted. 2. Effective for annual periods beginning on or after 1 July 2015, with limited exceptions. Earlier application is permitted 3. Effective for annual periods beginning on or after 1 January 2016, with earlier application. 4. Effective for annual periods beginning on or after 1 January 2018, with earlier application.
IFRS 9 Financial Instruments
FRS 9, issued in November 2009, introduced new requirements for the classification and measurement of financial assets. IFRS 9 was subsequently amended in October 2010 to include requirements for the classification and measurement of financial liabilities and for derecognition, and in November 2013 to include the new requirements for general hedge accounting. Another revised version of IFRS 9 was issued in July 2014 mainly to include a) Impairment requirements for financial assets and b) Limited amendments to the classification and measurement requirements by introducing a ‘fair value through other comprehensive income’ (FVTOCI) measurement category for certain simple debt instruments.

NASFUND Annual Report 2014 “Your Partner in Superannuation”
37
NOTES TO & FORMING PART OF THE FINANCIAL STATEMENTS
2 Basisofpreparation(continued) Key requirements of IFRS 9: All recognised financial assets that are within the scope of lAS 39 Financial Instruments: Recognition and Measurement are required to be subsequently measured at amortised cost or fair value. Specifically, debt investments that are held within a business model whose objective is to collect the contractual cash flows, and that have contractual cash flows that are solely payments of principal and interest on the principal outstanding are generally measured at amortised cost at the end of subsequent accounting periods. Debt instruments that are held within a business model whose objective is achieved both by collecting contractual cash flows and selling financial assets, and that have contractual terms of the financial asset give rise on specified dates to cash flows that are solely payments of principal and interest on the principal amount outstanding, are measured at FVTOCI. All other debt investments and equity investments are measured at their fair value at the end of subsequent accounting periods. In addition, under IFRS 9, entities may make an irrevocable election to present subsequent changes in the fair value of an equity investment (that is not held for trading) in other comprehensive income with only dividend income generally recognised in profit or loss. With regard to the measurement of financial liabilities designated as at fair value through profit or loss, IFRS 9 requires that the amount of change in the fair value of the financial liability that is attributable to changes in the credit risk of that liability is presented in other comprehensive income, unless the recognition of the effects of changes in the liability’s credit risk in other comprehensive income would create or enlarge an accounting mismatch in profit or loss. Changes in fair value attributable to a financial liability’s credit risk are not subsequently reclassified to profit or loss. Under lAS 39, the entire amount of the change in the fair value of the financial liability designated as fair value through profit or loss is presented in profit or loss. In relation to the impairment of Financial Assets, IFRS 9 requires an expected credit loss model, as opposed to an incurred credit loss model under IAS 39. The expected credit loss model requires an entity to account for expected credit losses and changes in those credit losses at each reporting date to reflect changes in credit risk since initial recognition. In other words, it is no longer necessary for a credit event to have occurred before credit losses are recognised. The new general hedge accounting requirements retain the three types of hedge accounting mechanisms currently available in IAS 39. Under IFRS 9, greater flexibility has been introduced to the types of transactions eligible for hedge accounting, specifically broadening the types of instruments that qualify for hedging instruments that qualify for hedging instruments and the types of risk components of non-financial items that are eligible for hedge accounting. In addition, the effectiveness test has been overhauled and replaced with the principle of an “economic relationship”. Retrospective assessment of hedge effectiveness is also no longer required. Enhanced disclosure requirements about an entity’s risk management activities have also been introduced. The Directors of the Company anticipate that the application of IFRS 9 in the future may have a material impact on amounts reported in respect of the group’s financial assets and financial liabilities. However, it is not practicable to provide a reasonable estimate of the effect of IFRS 9 until the Group undertakes a detailed review.
AmendmentstoIAS16andIAS38ClarificationofacceptableMethodsofDepreciationandAmortisation The amendments to IAS 16 prohibit entities from using a revenue-based method for items of property, plant and equipment. The amendments to IAS 38 introduce a reputable presumption that revenue is not an appropriate basis for amortisation of an intangible asset. This presumption can only be rebutted in the following two limited circumstances: a) when the intangible assets is expressed as a measure of revenue; or b) when it can be demonstrated that revenue and consumption of the economic benefits of the intangible asset are highly correlated
NASFUND Annual Report 2014 “Your Partner in Superannuation”
38
NOTES TO & FORMING PART OF THE FINANCIAL STATEMENTS
2. BasisofPreparation(Continued) The amendments apply prospectively for annual periods beginning on or after 1 January 2016. Current, the Group uses the straight-line method for depreciation and amortisation for its property, plant and equipment, and intangible assets respectively. The directors of the Company believe that the straight-line method is the most appropriate method to reflect the consumption of economic benefits inherent in the respective assets and accordingly, the directors of the Company do not anticipate that the application of these amendments to IAS 16 and IAS 38 will have a material impact on the group’s consolidated financial statements. AmendmentstoIAS19DefinedBenefitsPlans:employeeContributions The amendments to IAS 19 clarify how an entity should account for contributions made by employees or third parties to defined benefit plans, based on whether those contributions are dependent on the number of years of service provided by the employee. For contributions that are independent of the number of years of service, the entity may either recognise the contributions as a reduction in the service cost in the period in which the related service is rendered, or to attribute them to the employees’ periods of service using the projected unit credit method; whereas for contribution that are dependent on the number of years of service, the entity is required to attribute them to the employees’ periods of service. The Directors of the Company do not anticipate that the application of these amendments to IAS 19 will have a significant impact on the Fund’s financial statements. Annual Improvements to IFRSs 2010-2012 Cycle The annual improvements to IFRSs 2010-2012 Cycle include a number of amendments to various IFRSs, which are summarised below: The amendments to IFRS 2 (i) change the definition of ‘vesting condition’ and ‘market condition’; and (ii) add definitions for performance condition’ and ‘service condition’ which were previously included within the definition of ‘vesting condition’. The amendments to IFRS 2 are effective for share-based payment transactions for which the grant date is on or after 1 July 2014. The amendments to IFRS 3 clarify that contingent consideration that is classified as an asset or a liability should be measured at fair value at each reporting date, irrespective of whether the contingent consideration is a financial instrument within the scope of IFRS 9 or IAS 39 or a non-financial asset or liability. Changes in fair value (other than measurement period adjustments) should be recognised in profit or loss. The amendments to IFRS 3 are effective for business combinations for which the acquisition date is on or after 1 July 2014. The amendments to IFRS 8 (i) require an entity to disclose the judgments made by management in applying the aggregation criteria to operating segments, including a description of the operating segments aggregated and the economic indicators assessed in determining whether the operating segments have ‘similar economic characteristics’; and (ii) clarify that a reconciliation of the total of the reportable segments’ assets to the entity’s assets should only be provided if the segment assets are regularly provided to the chief operating decision-maker. The amendments to the basis for conclusions of IFRS 13 clarify that the issue of IFRS 13 and consequential amendments to IAS 39 and IFRS 9 did not remove the ability to measure short-term receivables and payables with no stated interest rate at their invoice amounts without discounting, if the effects of discounting is immaterial. As the amendments do not contain any effective date, they are considered to be immediately effective.
NASFUND Annual Report 2014 “Your Partner in Superannuation”
39
NOTES TO & FORMING PART OF THE FINANCIAL STATEMENTS
2. Basisofpreparation(Continued)
The amendments to IAS 16 and IAS 38 remove perceived inconsistencies in the accounting for accumulated depreciation/amortisation when an item of property, plant and equipment or an intangible asset is revalued. The amended standards clarify that the gross carrying amount is adjusted in a manner consistent with the revaluation of the carrying amount and the carrying amount after taking into account accumulated impairment losses. The amendments to IAS 24 clarify that a management entity providing key management personnel services to a reporting entity is a related party of the reporting entity. Consequently, the reporting entity should disclose as related party transactions that amounts incurred for the service paid or payable to the management entity for the provision of key management personnel services. However, disclosure of the components of such compensation is not required. The Directors of the Company do not anticipate that the application of these amendments will have a significant impact on the Fund’s financial statements. Annual Improvements to IFRSs 2011-2013 Cycle The annual improvements to IFRS 3 clarify that the standard does not apply to the accounting for the formation of all types of joint arrangement in the financial statements of the joint arrangement itself. “The amendments to IFRS 3 clarify that the standard does not apply to the accounting for the formation of all types of joint arrangement in the financial statements of the joint arrangement itself.“
The amendments to IFRS 13 clarify that the scope of the portfolio exception for measuring the fair value of a group of financial assets and financial liabilities on a net basis includes all contracts that are within the scope of, and accounted for in accordance with, IAS 39 or IFRS 9, even if those contracts do not meet the definitions of financial assets or financial liabilities within IAS 32. The amendments to IAS 40 clarify that IAS 40 and IFRS 3 are not mutually exclusive and application of both standards may be required. Consequently, an entity acquiring investment property must determine whether: (a) the property meets the definition of investment property in terms of IAS 40; and (b) the transaction meets the definition of a business combination under IFRS 3. The Directors of the Company do not anticipate that the application of these amendments will have a significant impact of the Funds’s financial statements.
3 Significantaccountingpolicies The accounting policies set out below have been applied consistently to all periods presented in these financial statements and have been applied consistently by the Fund. (a) Members accounts
Contributions are accounted for, and members’ accounts credited with their contributions, on a cash basis based on the receipt of reconciled contributions schedules.
Accounting for interest credited to members’ accounts is in accordance with Section 8 of the National Superannuation Trust Deed and is as follows:
1. Interest credited to members is on the basis of the period to which contributions relate; and 2. The rate of interest is determined by the Board of Directors of the Trustee every year and is calculated on the daily balance of the members’ accounts.

NASFUND Annual Report 2014 “Your Partner in Superannuation”
40
NOTES TO & FORMING PART OF THE FINANCIAL STATEMENTS
3 Significantaccountingpolicies(continued)
(b) Investment assets In accordance with IFRS investments assets including investment properties and equity investments are included in the Statement of Financial Position at fair value as at the balance sheet date and movement in fair value of investment assets are recognised in the statement of comprehensive income in the period in which they occur. The Fund’s interest in controlled entities and associated investments are treated as plan assets or investments of the Fund available for sale and therefore not consolidated or equity-accounted in these financial statements. (c) Foreigncurrencytransactions Transactions in foreign currencies are translated to the functional currency of the Fund at the exchange rate at the date of the transactions. Monetary assets and liabilities denominated in foreign currencies at the reporting date are translated to the functional currency at the exchange rate at that date. The foreign currency gain or loss on monetary items is the difference between amortised cost in the functional currency at the beginning of the period, adjusted for effective interest and payments during the period, and the amortised cost in foreign currency translated at the exchange rate at the reporting period. Non-monetary assets and liabilities denominated in foreign currencies that are measured at fair value are translated to the functional currency at the exchange rate at the date that the fair value was determined. Non-monetary items that are measured in terms of historical cost in a foreign currency are translated using the exchange rate at the date of the transaction. (d) Deferred expenditure All staff housing subsidies advanced are amortised over a five-year period at 20% per annum. (e) Financial instruments (i) Non-derivative financial assets The Fund initially recognises loans and receivables and deposits on the date that they have originated. All other financial assets (including assets designated at fair value through profit or loss) are recognised initially on the trade date at which the Fund becomes a party to the contractual provisions of the instrument. The Fund derecognises a financial asset when the contractual rights to the cash flows from the assets expire, or it transfers the right to receive the contractual cash flows on the financial asset in a transaction in which substantially all the risks and rewards of ownership of the financial assets are transferred. Any interest in transferred financial assets that is created or retained by the Fund is recognised as a separate asset or liability. Financial assets and liabilities are offset and the net amount presented in the statement of financial position when, and only when, the Fund has a legal right to offset the amounts and intends either to settle on a net basis or to realise the asset and settle the liability simultaneously. The Fund has the following non-derivative financial assets: financial assets at fair value through profit or loss, held-to-maturity financial assets, loans and receivables and available-for-sale financial assets. Financial assets at fair value through profit or loss A financial asset is classified at fair value through profit or loss if it is classified as held for trading or is designated as such upon initial recognition. Financial assets are designated at fair value through profit or loss if the Fund manages such investments and makes purchase and sale decisions based on their fair value in accordance with the Fund’s documented risk management or investment strategy. Upon initial recognition attributable transaction costs are recognised in profit or loss as incurred.

NASFUND Annual Report 2014 “Your Partner in Superannuation”
41
NOTES TO & FORMING PART OF THE FINANCIAL STATEMENTS
3 Significantaccountingpolicies(continued)
(e) Financial Instruments (continued)
Financial assets at fair value through profit or loss are measured at fair value, and changes therein are recognised in profit or loss.
Government Securities Government securities are recognised initially at fair value plus any directly attributable transaction costs. Subsequent to initial recognition, government securities market to market using a simple pricing model driven by current comparable yields. In 2012 government securities were recorded at amortised cost using the effective interest method. Due to there being no secondary market for these securities and the Fund’s intention to hold these investments to maturity, the amortised cost of these investments was considered to approximate their fair value. Loans and Receivables Loans and receivables are financial assets with fixed or determinable payments that are not quoted in an active market. Such assets are recognised initially at fair value plus any directly attributable transaction costs. Subsequent to initial recognition loans and receivables are measured at amortised cost using the effective interest method, less any impairment losses. Cash and Cash Equivalents Cash and cash equivalents comprise cash balances and call deposits with original maturities of three months or less. Bank overdrafts that are repayable on demand and form an integral part of the Fund’s cash management are included as a component of cash and cash equivalents for the purpose of the statement of cash flows. (i) Non-derivative financial assets Available-for-sale financial assets are non-derivative financial assets that are designated as available-for- sale and that are not classified in any of the previous categories. Subsequent to initial recognition, they are measured at fair value and changes therein, other than impairment losses and foreign currency differences on available-for-sale equity instruments, are recognised in other comprehensive income and presented within equity in the fair value reserve. When an investment is derecognised, the cumulative gain or loss in other comprehensive income is transferred to profit or loss. (ii) Non-derivative financial liabilities The Fund is restricted by the Superannuation (General Provisions) Act 2000 to borrow. All other financial liabilities (including liabilities designated at fair value through profit or loss) are recognised initially on the trade date at which the Fund becomes a party to the contractual obligations. The Fund derecognises a financial liability when its contractual obligations are discharged or cancelled or expired. Financial assets and liabilities are offset and the amount presented in the statement of financial position when, and only when, the Fund has a legal right to offset the amount and intends either to settle on a net basis or to realise the asset and settle the liability simultaneously. The Fund’s non-derivative financial liabilities include trade and other payables. Trade and other payables are carried at cost, which is the fair value of the consideration to be paid in the future for goods and services received, whether or not billed to the Fund.

NASFUND Annual Report 2014 “Your Partner in Superannuation”
42
NOTES TO & FORMING PART OF THE FINANCIAL STATEMENTS
3 Significantaccountingpolicies(continued)
(f) Property, plant and equipment (i) Recognition and measurement Items of property, plant and equipment are measured at cost less accumulated deprecation and accumulated impairment losses. Cost include expenditure that is directly attributable to the acquisition of the asset. The cost of self-constructed assets includes the cost of material and direct labour, any other costs directly attributable to bringing the assets to a working condition for their intended use, the cost of dismantling and removing the items and restoring the site on which they are located, and capitalised borrowing costs. Cost also may include transfers from other comprehensive income of any gain or loss on qualifying cash flow hedges of foreign currency purchase of property, plant and equipment. Purchased software that is integral to the functionality of the related equipment is capitalised as part of that equipment. When parts of an item of property, plant and equipment have different useful lives, they are accounted for as separate items (major components) of property, plant and equipment. Gains and losses on disposal of an item of property, plant and equipment are determined by comparing the proceeds from disposal with the carrying amount of property, plant and equipment, and are recognised net within other income in profit or loss. When revalued assets are sold, the amounts included in the revaluation reserve are transferred to retained earnings. (ii) Reclassification into investment property When the use of a property changes from owner-occupied to investment property, the property is re-measured to fair value and reclassified as investment property. Property that is being constructed for future use as investment property is accounted for at fair value. Any gains arising on re-measurement is recognised in profit or loss to the extent the gain reverses a previous impairment loss on the specific property, with any remaining gain recognised in other comprehensive income and presented in the revaluation reserve in equity. Any loss is recognised in other comprehensive income and presented in the revaluation reserve in equity to the extent that an amount had previously been included in revaluation reserve relating to the specific property, with any remaining loss recognised immediately in profit or loss. (iii) Subsequent costs The cost of replacing a part of an item of property, plant and equipment is recognised in the carrying amount of the item if it is probable that the future economic benefits embodied within the part will flow to the Fund, and its cost can be measured reliably. The carrying amount of the replaced part is derecognised. The costs of the day-to-day servicing of property, plant and equipment are recognised in profit or loss as incurred. (iv) Depreciation Depreciation is calculated over the depreciable amount, which is the cost of an asset, or other amount substituted for cost, less its residual value. Depreciation is recognised in profit or loss on a straight-line basis over the estimated useful lives of each part of an item of property, plant and equipment, since this most closely reflects the expected pattern consumption of the future economic benefits embodied in the asset. Leased assets are depreciated over the shorter of the lease term and their useful lives unless it is reasonably certain that the Fund will obtain ownership by the end of the lease term. Land is not depreciated.
NASFUND Annual Report 2014 “Your Partner in Superannuation”
43
NOTES TO & FORMING PART OF THE FINANCIAL STATEMENTS
3. Significantaccountingpolicies(continued)
(f) Property, plant and equipment (continued)
The estimated useful lives for the current and comparative periods are as follows: Building 40 years Plant and equipment 5-12 years Fixtures and fittings 5-10 years Motor vehicles 3-5 years Depreciation methods, useful lives and residual values are reviewed at each financial year-end and adjusted if appropriate.
(g) Investment property Investment property is property held either to earn rental income or for capital appreciation or for both, but not for sale in the ordinary cause of business, use in the production or supply of goods or services or for administrative purposes. Investment property is measured at fair value with any change therein recognised in profit or loss. When the use of a property changes such that it is reclassified as property, plant and equipment, its fair value at the date of reclassification becomes its cost for subsequent accounting. (h) Impairment (i) Financial assets (including receivables) A financial asset not carried at fair value through profit or loss is assessed at each reporting date to determine whether there is objective evidence that it is impaired. A financial asset is impaired if objective evidence indicates that a loss event has occurred after the initial recognition of the asset, and that the loss event had a negative effect on the estimated future cash flows of that asset that can be estimated reliably. Objective evidence that financial assets (including equity securities) are impaired can include default or delinquency by a debtor, restructuring of an amount due to the Fund on terms that the Fund would not consider otherwise, indication that a debtor or issuer will enter bankruptcy, the disappearance of an active market for a security. In addition, for an investment in an equity security, a significant or prolonged decline in its fair value below its cost is objective evidence of impairment. The Fund considers evidence of impairment for receivables and held-to-maturity investment securities at both a specific asset and collective level. All individually significant receivables and held-to-maturity investment securities are assessed for specific impairment. All individually significant receivables and held-to-maturity investment securities found not to be specifically impaired are then collectively assessed for any impairment that has been incurred but not yet identified. Receivables that are not individually significant are collectively assessed for impairment by grouping together receivables with similar risk characteristics. In assessing collective impairment the Fund uses historically trends of the probability of default, timing of recoveries and the amount of loss incurred, adjusted for management’s judgment as to whether current economic and credit conditions are such that the actual losses are likely to be greater or less than suggested by historical trends.
NASFUND Annual Report 2014 “Your Partner in Superannuation”
44
NOTES TO & FORMING PART OF THE FINANCIAL STATEMENTS
3 Significantaccountingpolicies(continued)
(h) Impairment (continued) An impairment loss in respect of a financial asset measured at amortised cost is calculated as the difference between its carrying amount and the present value of the estimated future cash flows discounted at the asset’s original effective interest rate. Losses are recognised in profit or loss and reflected in an allowance account against receivables. Interest on the impaired asset continues to be recognised through the unwinding of the discount. When a subsequent event causes the amount of impairment loss to decrease, the decrease in impairment loss is reversed through profit or loss. Impairment losses on available-for-sale investment securities are recognised by transferring the cumulative loss that has been recognised in other comprehensive income, and presented in the fair value reserve in equity, to profit or loss. The cumulative loss that is removed from other comprehensive income and recognised in profit or loss is the difference between the acquisition cost, net of any principal repayment and amortisation, and the current fair value, less any impairment loss previously recognised in profit or loss. Changes in impairment provisions attributable to time value are reflected as a component of interest income. If, in a subsequent period, the fair value of an impaired available-for-sale debt security increase and the increase can be related objectively to an event occurring after the impairment loss was recognised in profit or loss, then the impairment loss is reversed, with the amount of the reversal recognised in profit or loss. However, any subsequent recovery in the fair value of an impaired available-for-sale equity security is recognised in other comprehensive income.
(ii) Non-financial assets The carrying amount of the Fund’s non-financial assets, other than investment property, inventories and deferred tax assets, are reviewed at each reporting date to determine whether there is any indication of impairment. If any such indication exists, then the asset’s recoverable amount is estimated. For good will, any intangible assets that have indefinite useful lives or that are not yet available for use, the recoverable amount is estimated each year at the same time. An impairment loss is recognised if the carrying amount of an assets exceeds its estimated recoverable amount. Impairment losses are recognised in profit or loss. An impairment loss in respect of goodwill is not reversed. In respect of other assets, impairment losses recognised in prior periods are assessed at each reporting date for any indications that the loss has decreased or no longer exists. An impairment loss is reversed if there has been a change in the estimates used to determine the recoverable amount. An impairment loss is reversed only to the extent that the asset’s carrying amount does not exceed the carrying amount that would have been determined, net of depreciation or amortisation, if no impairment loss had been recognised.
(i) Employeebenefitplans (i) Defined contribution plans The Fund is a defined contribution plan and as part of its post-employment benefit plan for its employees the Fund pays fixed contribution into the Fund. The Fund has no legal or constructive obligation to pay further amounts to each employees. The obligation for contributions are recognised as an employee benefit expense in profit or loss in the periods during which services are rendered by employees.

NASFUND Annual Report 2014 “Your Partner in Superannuation”
45
NOTES TO & FORMING PART OF THE FINANCIAL STATEMENTS
3 Significantaccountingpolicies (continued)
(i) Employeebenefitplans (continued)
(ii) Other long-term employee benefits The Fund’s obligations in respect of long-term employee benefits other than pension plans is the amount of benefit that employees have earned in return for their services in the current and prior periods as required by law. That benefit is accrued each period and the increase taken to profit and loss account.
(iii) Short-term employment benefits. Short-term employment benefits obligations are measured on an undiscounted basis and are expensed as the related service is provided.
A liability is recognised for the amount expected to be paid under short-term cash bonus or profit-sharing plans if the Fund has a present legal or constructive obligation to pay this amount as a result of past service provided by the employee, and the obligation can be estimated reliably.
(j) Provisions
A provision is recognised if, as a result of a past event, the Fund has a present legal or constructive obligation that can be estimated reliably, and it is probable that an outflow of economic benefits will be required to settle the obligation. Provisions are determined by discounting the expected future cash flows at a pre-tax rate that reflects current market assessments of the time value of money and the risks specific to the liability. The unwinding of the discount is recognised as finance cost.
(k) Revenue
Revenue is recorded on an accrual basis. To the extent in which it is probable that the economic benefits will flow to the Fund and the revenue can be reliably measured, revenue is recognised. The following recognition criteria relates to the different revenues the Fund has recognised.
Dividend revenue Revenue from dividends is recognised on the date the shares are quoted ex-dividend and if not received at balance date, is reflected in the statement of financial position as a receivable. Interest revenue Revenue on money market and fixed interest securities is recognised using the effective interest rate method, if not received at balance date, is reflected in the statement of financial position as a receivable. Movement in net market value of investments Changes in the net market value of investments are recognised as income and are determined as the differences between the net market value at year end or consideration received (if sold during the year) and the net market value as at the prior year end or cost (if the investment was acquired during the period). Rent Rent from property is recognised in accordance with the rental agreement on an accrual basis. (l) Expenses Fees, commission and other expenses are recognised in profit or loss on an accrual basis.

NASFUND Annual Report 2014 “Your Partner in Superannuation”
46
NOTES TO & FORMING PART OF FINANCIAL STATEMENTS
3 Significantaccountingpolicies(continued)
(m) Income taxes Income tax expense comprises current and deferred tax. Current and deferred tax are recognised in profit or loss except to the extent that it relates to a business combination, or items recognised directly in equity or in other comprehensive income. Current tax is the expected tax payable or receivable on the taxable income or loss for the year, using tax rates enacted or substantively enacted at the reporting date, and any adjustment to tax payable in respect of previous years. Deferred tax is recognised in respect of temporary differences between the carrying amounts of assets and liabilities for financial reporting purposes and the amount used for taxation purposes. Deferred tax is not recognised for the following temporary differences: the initial recognition of assets or liabilities in a transaction that is not a business combination and that affects neither accounting nor taxable profit or loss, and differences relating to investments in subsidiaries and jointly controlled entities to the extent that it is probable that they will not reverse in the foreseeable future.
In addition, deferred tax is not recognised for taxable temporary differences arising on the initial recognition of goodwill. Deferred tax is measured at the tax rates that are expected to be applied to temporary differences when they reverse, based on the law that have been enacted substantively enacted by the reporting date. Deferred tax assets and liabilities are offset if there is a legally enforceable right to offset current tax liabilities and assets, and they relate to income taxes levied by the same tax authority on the same taxable entity, or on different tax entities, but they intend to settle current tax liabilities and assets on a net basis or their tax assets and liabilities will be realised simultaneously. A deferred tax is recognised for unused tax losses, tax credits and deductible temporary differences, to the extent that it is probable that future taxable profits will be available against which they can be utilised. Deferred tax is reviewed at each reporting date and are reduced to the extent that it is no longer probable that the related tax benefit will be realised. 4 Determinationoffairvalues A number of the Fund’s accounting policies and disclosures require the determination of fair value, for both financial and non-financial assets and liabilities. Fair values have been determined for measurement and / or disclosure purposes based on methods discussed in the following sections. When applicable, further information about the assumptions made in determining fair values is disclosed in the notes specific to that assets or liability. The Fund has an established control framework with respect to the measurement of fair values. The overall responsibility for overseeing all significant fair value measurements, including Level 3 fair values, rests upon the General Manager for Finance and Investments. The General Manager for Finance and Investments reviews the valuation reports and assesses the reasonableness of the significant unobservable inputs. The key items in the valuation reports are reported to the Audit and Risk Committee. When measuring the fair value of an asset or a liability, the Fund uses observable data as far as possible. Fair values are categorised into different levels in a fair value hierarchy based on inputs used in the valuation techniques as follows: Level 1 fair value measurements are those derived from quoted prices (unadjusted) in active markets for identical assets or liabilities;

NASFUND Annual Report 2014 “Your Partner in Superannuation”
47
NOTES TO & FORMING PART OF THE FINANCIAL STATEMENTS
4 Determinationoffairvalues(continued)
Level 2 fair value measurements are those derived from inputs other than quoted prices included within Level 1 that are observable for the asset or liability, either directly (i.e. as prices) or indirectly (i.e. derived from prices); and Level 3 fair value measurements are those derived from valuation techniques that include inputs for the asset or liability that are not based on observable market data (unobservable inputs). If the inputs used to measure fair value of an asset or a liability might be categorised in different levels of the fair value hierarchy, then the fair value measurement is categorised in its entirety in the same level of the fair value hierarchy as the lowest input that is significant to the entire measurement. The Fund recognises transfers between levels of the fair value hierarchy at the end of the reporting period during the change has occurred. The following is a summay of significant fair values determined in preparing the notes to the Fund’s financial statements. (i) Property plant and equipment The fair value of property, plant and equipment recognised as a result of a business combination is based on market values. The market value of property is the estimated amount for which a property could be exchanged on the date of valuation between a willing buyer and a willing seller in an arm’s length transaction after proper marketing wherein the parties had each acted knowledgeably and willingly. The fair value of items of plant, equipment, fixtures and fittings is based on the market approach and cost approaches using quoted market prices for similar items when available and replacement cost when appropriate.
(ii) Investment property Investment property is initially recorded at cost. Individual property assets are externally valued at a minimum of every three years. An external valuation will also be required where the Directors of the Trustee believe that the value of the asset has changed by the greater of K5 million or 10% from the previous external valuation. An external, independent valuer, having appropriate recognised professional qualifications and recent experience in the location and category of property being valued, then values the Fund’s investment properties as required. Directors’ valuations are required for all other years. The fair values are based on market values, being the estimated amount for which a property could be exchanged on the date of the valuation between a willing buyer and a willing seller in an arm’s length transaction after proper marketing wherein the parties had each acted knowledgeably and willingly. In the absence of current prices in an active market, the valuations are prepared by considering the aggregate of the estimated cash flows expected to be received from renting out the property. A yield that reflects the specific risks inherent in the net cash flows then is applied to the net annual cash flows to arrive at the property valuation. Valuations reflect, when appropriate, the type of tenants actually in occupation or responsible for meeting lease commitments or likely to be in occupation after letting vacant accommodation, the allocation of maintenance and insurance responsibilities between the Fund and the lessee, and the remaining economic life of the property. When rent reviews or lease renewals are pending with anticipated reversionary increases, it is assumed that all notices, and when appropriate, counter-notices, have been served validly and within the appropriate time. The sensitivity analysis on investment property revaluations was disclosed in Note 11.
(iii)Investmentinequityanddebtsecurities The fair value of financial assets at fair value through profit or loss and available-for-sale financial assets is determined by reference to their quoted closing bid price at the reporting date.

NASFUND Annual Report 2014 “Your Partner in Superannuation”
48
NOTES TO & FORMING PART OF THE FINANCIAL STATEMENTS
4. Determinationoffairvalues(continued)
Government Inscribed Stock (“GIS”) are booked at fair value using a pricing formula and comparable market yields as at 31 December 2013. The GIS were previously held at amortised cost as management believed it approximated their fair value due to there being no secondary market and the Fund’s intention to hold these investments to maturity. As management believe the market in Papua New Guinea is becoming more transparent and liquid, and there is now the possibility of these government securities being able to be traded, management believe the change in methodology when fair valuing the GIS is appropriate. (iv) Unquoted equity investments Unquoted equity investments are initially recorded at cost. Individual unquoted equity investments are externally valued at a minimum of every three years. An external valuation will also be required where the Directors of the Trustee believe that the value of the asset has changed by the greater of K5 million or 10% from the previous external valuation. When an external valuation is required, an external independent valuer, having appropriate recognised professional qualifications and recent experience of unquoted companies being valued, values the Fund’s unquoted equity investments. Directors’ valuations are required for all other years. The fair values are based on either the cumulative multiple earnings, net assets, discounted cash flows, dividend discount model, or liquidation method. The method adopted is applied consistently from year to year. The sensitivity analysis on unquoted equity investments is disclosed in Notes 10(f) and 24.
(v) Trade and other receivables The fair value of trade and other receivables, excluding construction work in progress, but including service concession receivables, is estimated as the present value of future cash flows, discounted at the market rate of interest at the reporting date. This fair value is determined for disclosure purposes. (vi)Non-derivativefinancialliabilities Fair value, which is determined for disclosure purposes, is calculated based on the present value of future principal and interest cash flows, discounted at the market rate of interest at the reporting date. In respect of the liability component of convertible notes, the market rate of interest is determined by reference to similar liabilities that do not have a conversion option. For finance leases the market rate of interest is determined by reference to similar lease agreements. 5 Financial risk management The Fund has exposure to the following risks from its use of financial instruments: ● Credit risk ● Liquidity risk ● Market risk ● Operational risk This note presents information about the Fund’s exposure to each of the above risks, the Fund’s objectives, policies and processes for measuring and management risks, and the Fund’s management of capital. Further quantitative disclosures are included throughout these financial statements. Risk management framework The Board of Directors of the Trustee company has overall responsibility for the establishment and oversight of the Fund’s risk management framework. The board has established the Audit and Remuneration Committee, which is responsible for developing and monitoring the Fund’s risk management policies. The committee reports regularly to the Board of Directors of the Trustee company on its activities.

NASFUND Annual Report 2014 “Your Partner in Superannuation”
49
NOTES TO & FORMING PART OF THE FINANCIAL STATEMENTS
5 Financial risk management (continued)
The Fund’s risk management policies are established to identify and analyse the risks faced by the Fund, to set appropriate risk limits and controls, and to monitor risks and adherence to limits. Risk management policies and systems are reviewed regularly to reflect changes in market conditions and the Fund’s activities. The Fund, through its training and management standards and procedures, aims to develop a disciplined and constructive control environment in which all employees understand their roles and obligations. The Board of Directors of the Trustee company oversees how management monitors compliance with the Fund’s risk management policies and procedures, and reviews the adequacy of the risk management framework in relation to the risks faced by the Fund.
(i) Credit risk Credit risk is the risk of financial loss to the Fund if a customer or counterparty to a financial instrument fails to meet its contractual obligations, and arises principally from the Fund’s receivables from customers and investment securities.
Trade and other receivables Trade and other receivables relate mainly to the Fund’s rental debtors. Customers that are graded as “high risks” are place on a restricted customer list and monitored by the property managers and management of the Fund.
The Fund establishes an allowance for impairment that represents its estimates of incurred losses in respect of trade and other receivables and investments. The main components of this allowance are a specific loss component that relates to individually significant exposures.
Investments The Fund manages its exposure to credit risk by ensuring that adequate return is priced for the Fund taking on the specified credit risk. The fund actively monitors its investments for changes in credit risk. (ii) Liquidity risk Liquidity risk is the risk that the Fund will encounter difficulty in meeting the obligations associated with its financial liabilities that are settled by delivering cash or another financial asset. The Fund’s approach to managing liquidity is to ensure, as far as possible, that it will always have sufficient liquidity to meet its liabilities when due, under both normal and stressed conditions, without incurring unacceptable losses or risking damage to the Fund’s reputation.
(ii) Liquidity risk Typically the Fund ensures that it has sufficient cash on demand to meet expected operational expenses for a period of 90 days, including the servicing of repayments of members balances, withdrawals and loans; this exclude the potential impact of extreme circumstances that cannot reasonably be predicted, such as natural disasters.
(iii) Market risk Market risk is the risk that changes in market prices, such as foreign exchange rates, interest rates and equity prices will affect the Fund’s income or the value of its holdings of financial instruments. The objective of market risk management is to manage and control market risk exposures within acceptable parameters, while optimising the return. (iv) Operational risk Operational risk is the risk of direct or indirect loss arising from a wide variety of causes associated with the Fund’s processes, personnel, technology and infrastructure, and from external factors other than credit, market and liquidity risks such as those arising from legal and regulatory requirements and generally accepted standards of corporate behaviour.
NASFUND Annual Report 2014 “Your Partner in Superannuation”
50
NOTES TO & FORMING PART OF THE FINANCIAL STATEMENTS
5 Financial risk management (continued)
The Fund’s objective is to manage operational risk so as to balance the avoidance of financial losses and damage to the Fund’s reputation with overall cost effectiveness and to avoid control procedures that restrict initiative and creativity.
The primary responsibility for the development and implementation of controls to address operational risk is assigned to senior management. This responsibility is supported by the development of overall Fund standards for the management of operational risk in the following areas:
● requirements for appropriate segregation of duties, including the independent authorisation of transactions; ● requirements for the reconciliation and monitoring of transactions; ● compliance with regulatory and other legal requirements; ● documentation of controls and procedures; ● requirements for the periodic assessment of operational risks faced, and the adequacy of controls and procedures to address the risks identified; ● requirements for the reporting of operational losses and proposed remedial action; ● development of contingency plans; ● training and professional development; ● ethical and business standards; and ● risk mitigation, including insurance where this is effective.
Compliance with Fund standards is supported by a programme of periodic reviews undertaken by management. The results of internal reviews are discussed with management with summaries submitted to the Audit and Remuneration Committee and Board of Directors. 6 Funding arrangements The employers have contributed to the Fund during the current financial year at a rate of 8.4% of the gross salaries of those employees who were members of the Fund (2013: 8.4%). Employees contributed to the Fund during the year at a rate of 6.0% of the gross salaries (2013: 6.0%). 7 Fund requirements To qualify as an investment entity, certain criteria have to be met. Specifically, an entity is an investment entity when it: ● Obtains funds from one or more investors for the purpose of providing them with professional investment management services; ● Commits to its investor(s) that its business purpose is to invest funds solely for returns from capital appreciation, investment income, or both; ● Measures and evaluates performance of substantially all of its investments on a fair value basis. Consequential amendments to IFRS 12 and IAS 27 have been made to introduce new disclosure requirements for investment entities. In general, the amendments require retrospective application, with specific transitional provisions.

NASFUND Annual Report 2014 “Your Partner in Superannuation”
51
NOTES TO & FORMING PART OF THE FINANCIAL STATEMENTS
8 AmalgamationofSIOSWorkersRitaiaFund Effective 1 January 2013, SIOS Workers Ritaia Fund (“SIOS”), a superannuation fund based in Papua New Guinea, was transferred to the Fund. All members of SIOS became full members of the Fund effective as at that date. No consideration has been provided for the amalgamation. The fair value of the assets, liabilities and member funds of SIOS transferred to the Fund are presented below. The balances are based on the audited financial statements of SIOS as at 31 December 2012. As a superannuation fund, the balances presented in those financial statements were presented at their fair value. The Fund noted no differences in their fair value when evaluated upon transfer. At the date of transfer, the Fund owed SIOS K6,041,396, which represented cash assets transferred to NASFUND held in trust for SIOS prior to the amalgamation. The receivable in SIOS and the payable in the Fund have been eliminated upon amalgamation. Fair value recognised on amalgamation Assets K ‘000 Cash at bank and on hand 562 Rental and other receivables 564 Income tax recoverable 520 Government securities and other loans 9,872 Equity Investments 13,472 Investment properties 27,326 Fixed assets 66 Total assets 52,382 Liabilities Trade and other payables 2,961 Due to terminated members 1,291 Deferred tax liability 1,160 Provisions 9 Total liabilities 5,421 Net assets acquired upon transfer 46,961 Receivables from Nasfund eliminated against payable in Fund upon transfer 6,041 Net assets and liabilities of SIOS 53,002 Member Funds liable upon transfer 53,002 During the prior financial year the assets transferred from SIOS generated revenue of K8.3 million and profit before tax of K8.1 million to the Fund. Previous administrative expenses incurred by SIOS have been absorbed by the Fund. No income was earned by SIOS during the current financial year.
NASFUND Annual Report 2014 “Your Partner in Superannuation”
52
NOTES TO & FORMING PART OF THE FINANCIAL STATEMENTS
9 Governmentsecuritiesandotherloans 31 Dec 2014 31 Dec 2013 Note K’000 K’000 Government Inscribed Stock (a) 566,707 554,458 Sovereign Community Infrastructure Treasury Bill (SCITB) (b) 125,000 125,000 State Grant (c) 6,000 15,000 Notes and other loans (d) 177,033 93,170 874,740 787,628 (a) Government Inscribed Stock Government Inscribed Stock (GIS) are recorded net of unamortised discounts and premiums on acquisition which are amortised over the life of the stock. The GIS have coupon rates ranging from 9% to 14% and yield rates ranging from 6.19% to 14% with a total face value of K567.1 million (2013: K472.3 million). The bonds will mature between 2015 and 2027. For 2014, Government Inscribed Stock has been marked to market using a pricing formula driven by recent comparable market yields. The change in fair value for the year recorded in the statement of income was a loss of approximately K66.4 million. The yields used when fair valuing the GIS are derived from the most recently GIS issued by the State of Papua New Guinea. Yields are not directly comparable in all cases as there may not have been any GIS issued with the exact remaining life as the GIS held by the fund. As such yields may be estimated using, where possible a yield curve, or when not possible, the weighted average of yields observable. If there was a decrease of 25 bps in the estimated yields as at 31 December 2014, this would have resulted in an approximate increase in value of K12.3 million to the GIS held by the Fund. A similar decrease of 25 bps would result in an equal but opposite effect. Previously, GIS were recorded at amortised cost which the Fund believed, for practical purposes, approximated their fair value as there is no secondary market to trade the securities and members would not be able to realise any fair value fluctuations. The Fund has changed its methodology in light of the introduction of IFRS 13 and based on their belief that the market in Papua New Guinea is becoming more transparent and liquid, and it is now more likely that the Fund may be able to trade government securities in the foreseeable future. As such, management believe the valuation model implemented is now more appropriate. (b) Sovereign Community Infrastructure Treasury Bill (SCITB) 31 Dec 2014 31 Dec 2013 Note K’000 K’000 SCITB 125,000 125,000 Interest receivable from SCITB 35,250 35,250 Provision for impairment 8(e) (35,250) (35,250) 125,000 125,000
NASFUND Annual Report 2014 “Your Partner in Superannuation”
53
NOTES TO & FORMING PART OF THE FINANCIAL STATEMENTS
9 Governmentsecuritiesandotherloans(continued)
(b) Sovereign Community Infrastructure Treasury Bill (continued) The SCITB was issued by the Treasurer under the Treasury Bill Act using National Capital Limited as the Agent, Register and holder of monies raised. The Treasury Bill was guaranteed by the State in line with all Treasury Bills. The Fund had the option to elect at the end of the 364 day period to redeem the bill or roll over the bill for a further 12 months. Certain factions of the government are questioning the legality of the issue of the bill due to its linkage with unappropriated Government expenditure. The Fund however maintains that the issue of the bill was a legal transaction and believes the amount should be fully recovered. A provision for this and other matters has been taken into consideration in notes 21 and 15. The yield on the bill is 7.05%. Interest relating to the bill of K8.8 million (2013: K8.8 million ) has not been included in interest revenue. The interest has been recognised as the Fund believes the transaction to be a legal bill and it should continue to earn interest under the terms of the bill until it is repaid. However, the interest receivable has been provided for due to the uncertainty of recovery of the amount. (c) State Grant In December 2000, the government passed the National Provident Fund (Financial Reconstruction) Act 2000. Under Section 4, the State shall make quarterly payments to the Fund of K1 million commencing 31 May 2001 and ending 28 February 2016 indexed to consumer price inflation. The yield on the state grant is 6.67% (2013: 6.67%). (d) Notes and other loans Maturity Average 31 Dec 2014 31 Dec 2013 Note (years) yield K’000 K’000 PNG Power 3 to 4 10.2% 24,469 30,295 Airlines of PNG promissory notes 2 to 3 8.0% 25,000 25,000 Panamex Limited 5 12.0% 19,698 19,698 TDC Samoa (i) up to 6 7.0%+ 39,819 13,177 Boroma Piggery 3 to 4 +2.0% 5,000 5,000 Tawaili Resort - - 4,057 4,057 Harbour City Dev. Ltd - 28,500 - Heritage Park Hotel 12.5% 34,548 34,548 181,091 131,776 less: provision for impairment (ii) (4,057) (4,057) 177,034 127,719 All loans are subject to fixed interest rates except Boroma Piggery and Taumeasina Development Corporation (Samoa) Limited (‘TDC - Samoa’). The average yield rate for the Boroma Piggery loan is the 182-day Treasury Bill rate plus 2%. The interest rate on notes payable by TDC Samoa is based on effective interest rate with minimum yield of 7%. The loan granted by the Fund has embedded derivatives and is further discussed on the next page.
NASFUND Annual Report 2014 “Your Partner in Superannuation”
54
NOTES TO & FORMING PART OF THE FINANCIAL STATEMENTS
9 Governmentsecuritiesandotherloans(continued) (d) Notes and other loans (continued) (i) The loan to TDC Samoa is a convertible note arrangement to undertake a joint development of a hotel complex with 80 rooms and 25 villas in Taumesina Island, Apia, Western Samoa (the “Project”) with Lamana Development (Samoa) Limited. The terms and conditions of the convertible note provides the Fund with an option to convert the loan to ordinary shares on a one for one basis subject to the IRR minimum hurdle requirement of 15% in the Project at any time and at their absolute discretion up until the maturity date on August 2019. The number of shares will be determined based on the value of the share at the date of conversion. In addition, interest is receivable monthly at a minimum rate of 7% per annum and the loan is repayable at maturity in the event the Notes are not converted to equity. The right to convert the loan is fair valued using the Effective Interest Rate (EIR) method with an instrinsic value of Nil at inception. As at 31 December 2014, the right to convert the loan was valued at K51,000. (ii) In 2012 the Fund provided for the loan to Tawaili Resort of K4.06 million as there is doubt regarding its recoverability. (e)Themovementintheprovisionforimpairmentinrespectofgovernmentsecuritiesandotherloansisas follows: 31 Dec 2014 31 Dec 2013 K’000 K’000 Opening balance 39,307 30,494 Provision for impairment on SCITB interests (note 9(b)) - 8,813 Provision for impairment loan to Tawaili Resort (note 9(d)) - - Closing balance 39,307 39,307 Provision for impairment is comprised of the following: 31 Dec 2014 31 Dec 2013 K’000 K’000 Tawaili Resort (note 9(d)) 4,057 4,057 Interest receivable on SCITB (note 9(b)) 35,250 35,250 39,307 39,307 For further provisions associated with the disputes, refer to notes 21 and 15.
NASFUND Annual Report 2014 “Your Partner in Superannuation”
55
NOTES TO & FORMING PART OF THE FINANCIAL STATEMENTS
10 Equity investments 31 Dec 2014 31 Dec 2013 Note K’000 K’000 Quoted investments - domestic (a) 627,039 687,128 Quoted investments - international (a) 262,594 245,808 Unquoted investments (b) 885,858 657,343 1,775,491 1,590,279 (a) Quoted investments Summary of revaluation of quoted investments is as follows: Other 2013 Revaluation movements 2014 K’000 K’000 K’000 K’000
Quotedsharesdomestic Airlines PNG 7,350 (5,250) 10,000 12,100 Bank of South Pacific Limited 415,014 (44,975) (46,465) 323,574 City Pharmacy Limited 67,776 (17,981) - 49,795 Credit Corporation (PNG) Limited 155,248 6,210 - 161,458 New Britain Palm Oil Limited 41,740 38,372 - 80,112 687,128 (23,624) (36,465) 627,039 Quotedsharesinternational Highlands Pacific Limited 6,145 (318) - 5,827 New Britain Palm Oil Limited 15,297 12,753 - 28,050 New Guinea Energy Limited 89 (47) 42 Oil Search Limited 104,239 (1,308) 102,931 Steamships Trading Company Limited 120,038 5,706 - 125,744
245,808 16,786 - 262,594 Reconciliation of movement in quoted investments is as follows: 31 Dec 2014 31 Dec 2013 Note K’000 K’000 Opening balance 932,936 872,777 Addition upon amalgamation with SIOS - 13,465 Disposal during the year (36,465) - Loss on disposal (6,768) - Fair value gain / (loss) 17 (70) 46,694 Closing balance 889,633 932,936
NASFUND Annual Report 2014 “Your Partner in Superannuation”
56
NOTES TO & FORMING PART OF THE FINANCIAL STATEMENTS
10 Equity investments (continued) (b) Unquoted investments at fair values Summary of revaluation of unquoted investments is as follows: 2014 2013 Other Percentage Valuation Valuation Market 2013 Revaluation movements 2014 Unquotedinvestments Note Holding Model Model Multiple K’000 K’000 K’000 K’000 Amalgamated Packaging Limited 30.00% (i) (i) 1,050 -
Boroma Piggery 25.00% (ii) (i) (100) -
Hornibrooks NGI 21.10% (ii) (iii) (7,650) -
Nas Aviation 40.00% (iii) (iii) 900 -
Nasmel Limited (b (i)) 100.00% (ii) (ii) 64,104 (318)
Turumu Holdings Limited 20.00% (v) (v) 24,440 -
The Edge Limited 70.00% (ii) (ii) (8,483) -
Port Services Limited 5.00% (iii) (iii) 3.5x - 4.2 x (610)
City Centre Developments Limited (b (ii)) 65.00% (ii) (ii) 5,462 (2,781)
South Pacific Brewery Limited 0.70% (iii) (iii) 6X - 7X 1,400 -
Pacific Balance Fund 22.00% (i) (i) 34,250 -
Post Courier Limited 0.10% (iii) (iii) 2.8x - 3.5 x 2 -
Toyota Tsusho (PNG) Limited 0.61% (iii) (iii) 3.6x - 4.25 x 988 -
Westpac Bank PNG Limited 1.25% (iii) (iii) 6.8x - 7.65 x (4,700) -
Hillside Garden 50.00% (ii) (ii) 44
Panamex Limited 46.30% (iii) (iv) 11,963 -
Heritage Park Hotel 60.00% (ii) (i) - -
Malagan Limited (c) 35.71% (iv) (iv) - -
Carpark Limited (c) 33.33% (iv) (iv) - -
Grand Pacific Hotel Ltd (c) 50.00% (iv) (iv) -
Gewani ltd (c) 50.00% (iv) - 61,600
Hitron Ltd (c) 40.00% (iv) - 36,968
Capital Insurance Group Ltd (c) 19.00% (iv) - 9,987
Total unquoted investments 657,342 123,060 105,456 885,858
Unobservable inputs of valuation models are discussed in note (e). The valuation models as indicated above are as follows: (i) Orderly Realisation of Assets (ii) Net Assets on a Going Concern Basis (iii) Capitalisable Maintainable Earnings (“CME”) (iv) Cost (v) Sum of Parts - see note (e) for further breakdown of valuation. (vi) Discounted cash flows (vii) Observable market
NASFUND Annual Report 2014 “Your Partner in Superannuation”
57
NOTES TO & FORMING PART OF THE FINANCIAL STATEMENTS
10 Equity investments (continued) (b) Unquoted investments at fair values (continued) Reconciliation of movement in unquoted investments is as follows: 31 Dec 2014 31 Dec 2013 Note K’000 K’000 Opening balance 657,342 577,263 Additions during the year 108,555 8,188 Additions upon amalgamation with SIOS 8 - 7 Transfers from WIP - - Fair value gain 17 123,060 70,389 Other adjustments (iii) (3,099) 1,495 Closing balance 885,858 657,342
The above unquoted investments are stated at fair value, which have been determined by the Board of Directors based on external valuations performed by KPMG PNG (by Troy Stubbings - KPMG PNG Partner, Bachelor of business ( Accounting ) , USQ, Graduate diploma of applied finance and investment , Member institute of Chartered Accountants , Australia as at 31 December 2014. The main methodologies in determining the fair value of unlisted equities are usually based on future maintainable earnings, dividend yields, net tangible assets or cash flows. It is appropriate to consider all of the above methods in arriving at a fair value. (i) Nasmel Group (100% owned by the Fund) holds 63% of Mainland Holdings - a diversified agricultural company with interests in chicken production and processing, eggs, flour and crocodile skins. Nasmel is also the holding company for the construction of “Burns Philp Haus” and “The Face”. The investment balance includes long term capital contributions of K127 million (2013: K127 million). See note 23 for further details. (ii) City Centre Developments Limited is 65% owned by Nasfund with its two primary assets being NCDC Haus and Sumsuma Complex, Cameron Road Waigani. (iii) Other adjustments relate to the transactions by the Fund with Nasmel Limited and City Centre Developments Limited arising from advances and repayments of short-term working capital requirements. Refer to Note 23 for details.
(c) Unquoted investments at cost
For investments held at cost, due to the early stage and nature of these investments, cost is considered an appropriate fair value approximate for these investments. The below table includes values only while the investment is held at cost. 31 Dec 2014 31 Dec 2013 Note K’000 K’000 Malagan Limited (i) 25,113 25,113 Carpark Limited (ii) 8,188 8,188 Grand Pacific Hotel Limited (iii) 38,425 38,425 Gewani ltd (v) 61,600 - Hitron Ltd (v) 36,968 - Capital Insurance Group Ltd (v) 9,987 - 180,282 71,726

NASFUND Annual Report 2014 “Your Partner in Superannuation”
58
NOTES TO & FORMING PART OF THE FINANCIAL STATEMENTS
10 Equity investments (continued) (c) Unquoted investments at cost (continued) (i) The Fund acquired 35.71% of Malagan Limited in October 2012 for the consideration of K27.4 million (inlcuding a K2.3 million receivable). Malagan Limited owns Malagan Haus in Konedobu, NCD. The company is in its construction phase and management believes that cost approximates the company’s fair value as at 31 December 2013 and 2012. There have been no market indicators that would suggest any significant difference to cost approximating fair value existing. (ii) TThe Fund acquired 33.33% of Carpark Limited who owns and operates a carpark building in Konedobu, NCD. Due to the recent acquisition of the company, management believe cost is a reasonable approximate of its fair value. (iii) Grand Pacific Hotel Limited is a hotel in Suva, Fiji owned 50% by the Fund. This is a 120 room commercial development that is currently being constructed.The company is in its construction phase and management believes that cost approximates the company’s fair value as at 31 December 2013 and 2012. There have been no market indicators that would suggest any significant difference to cost approximating fair value existing. (v) All these investments were purchased during the 2014 financial year, and as such has been shown at cost. During the 2015 financial year a fair valuation will be performed on these assets. (d) Equity investments that are over 5% of the net asset value of the Fund Bank of South Pacific Limited 8.5% Nasmel Limited 6.5% (e)Fairvaluemodelandsignificantunobservableinputs Set out below are the fair valuation models used and the significant unobservable inputs that may effect the valuation. (i) Orderly Realisation of Assets Orderly Realisation of Assets (ORA) is a valuation model based on the identifiable net assets of the investee. Intangible assets such as customer lists, management, supply arrangements, and goodwill are ignored where not already recorded. The individual assets of the company are discounted for costs that would be incurred to realise those assets. Significant key unobservable input used in this valuation model is the fair value adjustment for the realisation costs, ranging from 10% to 30%. This valuation method assumes that the company is wound up in an orderly manner. As the investments are not expected to be wound up, the final valuation is generally taken at the higher end of the provided valuation range.
Accordingly, an increase in the discounts for the realisation costs will decrease the estimated fair value of the equity investment. A decrease in the fair value adjustments for the realisation costs will increase the estimated fair value of the equity investment.
(ii) Net Assets on a Going Concern Basis Net assets approach is a valuation model similar to the orderly realisation of assets. Under this model, fair value is based on the identifiable net assets of the investee. Intangible assets such as customer lists, management, supply arrangements, and goodwill are likewise ignored. The difference lies in the treatment of realisation costs, where under this valuation model, these costs are ignored as the investee is assumed to continue its operations for the foreseeable future. This method is used where the underlying asets and liabilities approximate their fair value and management do not believe there is any intangible value in the company.
NASFUND Annual Report 2014 “Your Partner in Superannuation”
59
NOTES TO & FORMING PART OF THE FINANCIAL STATEMENTS
10 Equity investments (continued) (e)Fairvaluemodelandsignificantunobservableinputs(continued)
(iii) Capitalisable Maintainable Earnings (“CME”) Capitaliseable maintainable earnings (CME) approach is a valuation model based on market multiples derived from quoted prices of companies comparable to the investee and the maintainable earnings of the investee. The fair value estimate is adjusted for the effect of the non-marketability of the equity securities. Significant key unobservable input used in this valuation model are the maintainable earnings of the investee and the adjusted market multiples ranging from 3.4x to 14.5x. Accordingly, an increase in the maintainable earnings of the investee and / or an increase in the adjusted market multiple will increase the estimated fair value of the equity investment. A decrease in the maintainable earnings of the investee and / or a decrease in the adjusted market multiple will decrease the estimated fair value of the equity investment. (iv) Cost Due to the early stage nature of these investments, cost is considered to be an appropriate fair value approximation for the investments. (v) Sum of Parts Turumu Holding Limited (“Turumu”), which apart from its own operations, is also a holding company for a number of other companies. Turumu is valued using the sum of parts approach. The investments held by the holding company are fair valued individually using either the ORA, Net Assets, or CME approach. The percentage of the fair valued of the parts attributable to the holding company is added to come up with a fair value of the holding company. Presented below is the investment portfolio of Turumu Holdings Limited and the valuation model used to value each investment: “EntitiesofTurumu Percentage Valuation Market InvestmentsLimited(Group)” Status shareholding model multiple Turumu Investments Limited (Company) Operating 100.00% Net Assets - Donnybrook Limited* Operating 100.00% CME 7.3x Aloga No. 2 Limited* Dormant 100.00% ORA - Yuwai No. 67 Limited* Dormant 100.00% ORA - Brian Bell & Co. Limited (Group)* Dormant 66.47% Sum of parts - *Except for Brian Bell & Co. Limited, these companies are 100% owned by Turumu Investments Limited. Brian Bell & Co. Limited has 2 subsidiaries as detailed in the following section.
NASFUND Annual Report 2014 “Your Partner in Superannuation”
60
NOTES TO & FORMING PART OF THE FINANCIAL STATEMENTS
10 Equity investments (continued) (e)Fairvaluemodelandsignificantunobservableinputs(continued) “EntitiesofBrianBell&Co. Percentage Valuation Market Limited(Group)” Status shareholding model multiple Brian Bell & Co. Limited (Company)** Operating 100.00% CME 5.8x Esco Limited** Operating 100.00% CME 9.8x Beltek Chemicals Limited** Operating 100.00% CME 8.5x **These companies are 100% owned by Brian Bell & Co. Limited. Brian Bell & Co. Limited is 66.47% owned by Turumu Investments. (vi) Discounted cash flows The discounted cash flow (“DCF”) method estimates market value by discounting a company’s future cash flows to their present value. These methods are appropriate where a projection of future cash flows can be made with a reasonable degree of confidence. Discounted cash flow methods are commonly used to value early stage companies or projects with a finite life. Significant key unobservable input used in this valuation model are the cash flows projection of the investee and the adjusted discount rate. (vii) Observable market An observable market was available during the time of the fair value estimation of Pacific Balanced Fund (PBF) investment units during 2012. In 2013, the observable market for such equity securities was no longer available which triggerred the transfer of fair value hierarchy from Level 2 to Level 3. (f)Sensitivityanalysis The following is a sensitivity analysis of significant unobservable inputs: Effectonprofitorloss increase / (decrease) 31 Dec 2014 31 Dec 2013 K’000 K’000 Increase of 1 in market multiples 47,665 22,755 10% increase in earnings 35,449 20,349 Increase of 5% in discount rates (18,603) (8,856) A decrease in any of the above unobservable inputs would have the opposite but similar effect to profit or loss.

NASFUND Annual Report 2014 “Your Partner in Superannuation”
61
NOTES TO & FORMING PART OF THE FINANCIAL STATEMENTS
11 Investmentpropertiesandworkinprogress 31 Dec 2014 31 Dec 2013 Note K’000 K’000 Investment properties (a) Residential properties 82,531 82,131 Industrial properties 32,755 31,261 Commercial properties 392,853 361,740 Land 14,402 14,517 522,540 489,649 Work in progress (c) - - 522,540 489,649 (a)Investmentproperties(atmarketvalue) Summary of movement in revaluation of investment properties as follows: Other Valuation Capitalisation 2013 Revaluation Movements 2014 Model Rates K’000 K’000 K’000 K’000 Residentialproperties Peacehaven Apartments MC 11.00% (18) 131 Ramu Sugar Properties DMA - - - Sol Wara Apartments MC 10.50% - - Cross Street Apartments MC 11.00% 115 - Parer Street Property DMA - 39 - Lot 18 Sect. 69 House Property MC 11.00% - - Fifth Street Lae House Property MC 11.00% 60 - Lot 3 Sect. 2 Madang Property DMA - 20 - Lot 11 Sect. 13 KBB Property DMA - 2 - Siroi Panu Units MC 11.00% 16 - Airways Avenue Apartments MC 11.00% 35 - 82,131 269 131 82,531
NASFUND Annual Report 2014 “Your Partner in Superannuation”
62
NOTES TO & FORMING PART OF THE FINANCIAL STATEMENTS
11 Investmentpropertiesandworkinprogress(continued) (a)Investmentproperties(atmarketvalue)(continued) Other Valuation Capitalisation 2013 Revaluation movements 2014 Note Model Rates K’000 K’000 K’000 K’000 Industrialproperties API MC 11.00% 215 - Gerehu DMA - 1,279 - Gordons - Cameron Road MC 10.00% (64) 64 31,261 1,430 64 32,755 Commercialproperties Ravalian Haus MC 11.00% 1,311 49 Able Computing Madang MC 10.00% 265 82 ANZ Haus MC 11.00% 1,370 - Westpac Head Office Building (iv) Cost - - BSP Douglas Street (iv) Cost - 12,868 Luship Voco Point Lae DMA 235 - Malahang Shed Regina St. Lae DMA (1) - Madang Slipway DMA 361 - Deloitte Tower MC 12.00% 13,228 552 Nasfund Haus Lae MC 11.50% (83) 487 NCSL Head Office (iii) DMA 116 16 IPA Haus MC 12.00% 48 - The Factory MC 12.00% 209 - Boroko - Old Head Office (6,945) 6,945 361,740 10,114 20,999 392,853 Land Section 69, Lae Cost - - - 8 Mile and 9 Mile (ii) DMA - (281) 166 Lawes Rd DMA - - - Vacant Land, Lae DMA - - - 14,517 (281) 166 14,402
NASFUND Annual Report 2014 “Your Partner in Superannuation”
63
NOTES TO & FORMING PART OF THE FINANCIAL STATEMENTS
11 Investmentpropertiesandworkinprogress(continued) Reconciliation of movement in investment properties is as follows: 31 Dec 2014 31 Dec 2013 Note K’000 K’000 Opening balance 489,649 410,454 Additions (ii) - 13,978 Improvements to properties 14,414 1,430 Additions upon amalgamation with SIOS 8 - 27,326 Transfers from property, plant and equipment (i) - 4,964 Disposals of properties - - Fair value gain 17 18,477 31,497 Closing balance 522,540 489,649 Investment properties are stated at fair value, which have been determined by the Board of Directors based on valuations performed by L.J. Hooker (by Leo Digori, PNG Registered Valuer No. 65) as at December 2014. (i) NCSL Head Office represents a transfer from property, plant and equipment (Note 12) to investment property. The historical cost of NCSL Head Office is K900 thousand. The property was transferred at its fair value during the prior financial year. (ii) During the prior year, the Fund acquired the Westpac Head Office and the neighbouring BSP property on Douglas Street in Port Moresby town centre. The Fund is currently considering re-development possibilities for the properties. (b)Measurementoffairvalue,fairvaluemodelandsignificantunobservableinputs Information about how the fair values of the Fund’s investment properties are determined (in particular, the valuation method(s) and inputs used) is detailed as follows: (i) Direct market approach (DMA) is a market-based valuation technique which considers the most recent completed sales transactions and quoted market prices (when available) of similar properties in the location adjusted for the certain market factors such as the physical deterioration of the property and its location (prime vs secondary). (ii) Market capitalisation (MC) is a fair valuation model which considers the present value of net cash flows to be generated from the property. The expected net cash flows are discounted using risk-adjusted market capitalisation rates adjusted for the certain market factors such as the physical deterioration of the property and its location (prime vs secondary). Key unobservable input includes the risk-adjusted market capitalisation rates and market lease rates.
(iii) Certain properties are valued at cost either due to the recent acquisition of these investments. Management believes that the cost of these properties approximates their fair value.
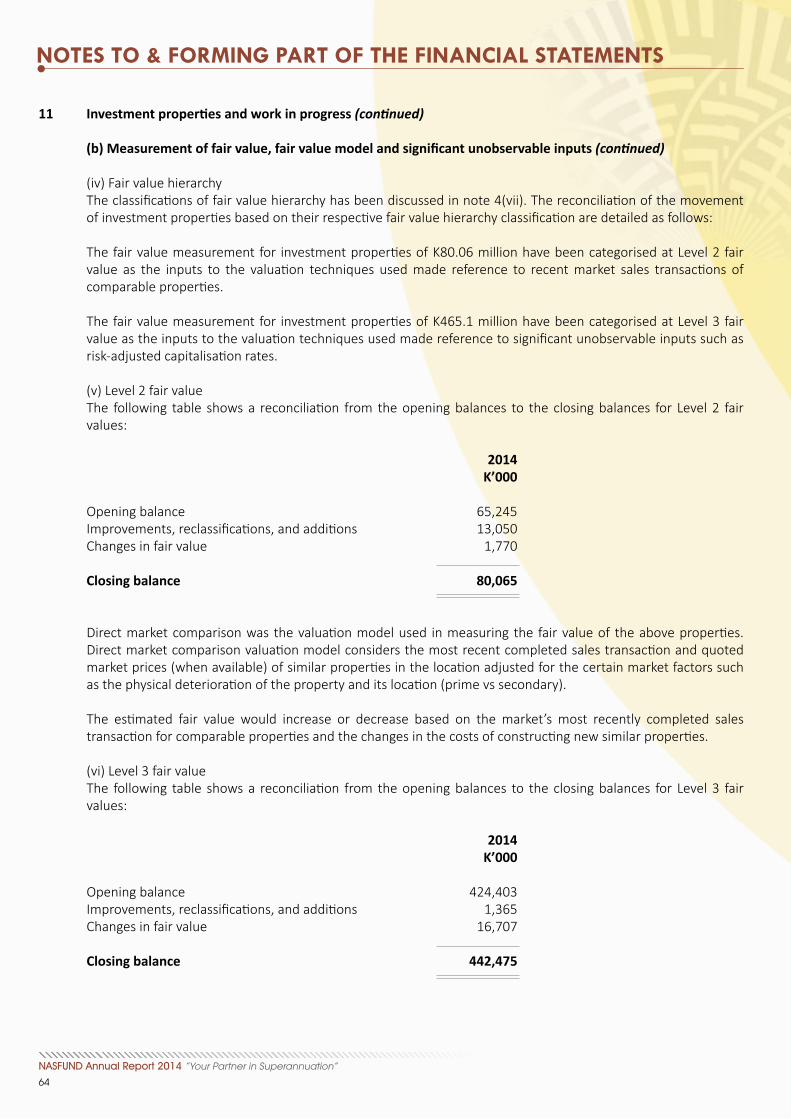
NASFUND Annual Report 2014 “Your Partner in Superannuation”
64
NOTES TO & FORMING PART OF THE FINANCIAL STATEMENTS
11 Investmentpropertiesandworkinprogress(continued) (b)Measurementoffairvalue,fairvaluemodelandsignificantunobservableinputs(continued) (iv) Fair value hierarchy The classifications of fair value hierarchy has been discussed in note 4(vii). The reconciliation of the movement of investment properties based on their respective fair value hierarchy classification are detailed as follows:
The fair value measurement for investment properties of K80.06 million have been categorised at Level 2 fair value as the inputs to the valuation techniques used made reference to recent market sales transactions of comparable properties. The fair value measurement for investment properties of K465.1 million have been categorised at Level 3 fair value as the inputs to the valuation techniques used made reference to significant unobservable inputs such as risk-adjusted capitalisation rates. (v) Level 2 fair value The following table shows a reconciliation from the opening balances to the closing balances for Level 2 fair values: 2014 K’000 Opening balance 65,245 Improvements, reclassifications, and additions 13,050 Changes in fair value 1,770 Closing balance 80,065 Direct market comparison was the valuation model used in measuring the fair value of the above properties. Direct market comparison valuation model considers the most recent completed sales transaction and quoted market prices (when available) of similar properties in the location adjusted for the certain market factors such as the physical deterioration of the property and its location (prime vs secondary). The estimated fair value would increase or decrease based on the market’s most recently completed sales transaction for comparable properties and the changes in the costs of constructing new similar properties. (vi) Level 3 fair value The following table shows a reconciliation from the opening balances to the closing balances for Level 3 fair values: 2014 K’000 Opening balance 424,403 Improvements, reclassifications, and additions 1,365 Changes in fair value 16,707 Closing balance 442,475
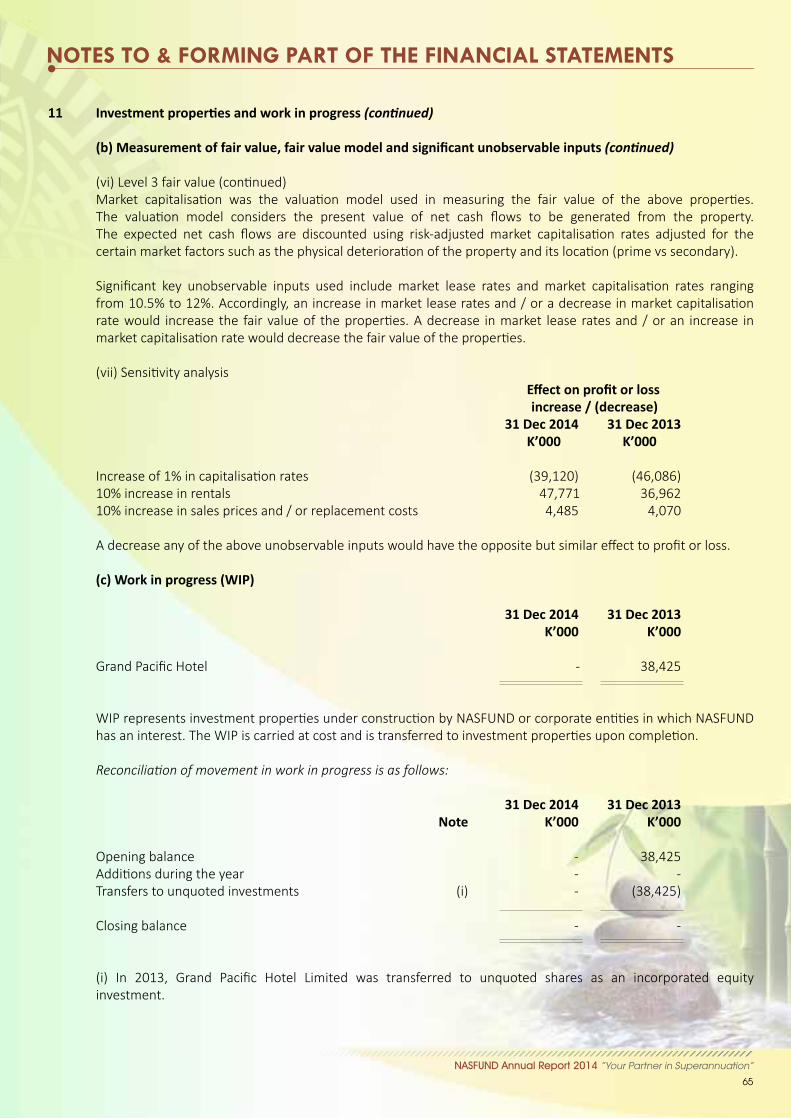
NASFUND Annual Report 2014 “Your Partner in Superannuation”
65
NOTES TO & FORMING PART OF THE FINANCIAL STATEMENTS
11 Investmentpropertiesandworkinprogress(continued) (b)Measurementoffairvalue,fairvaluemodelandsignificantunobservableinputs(continued) (vi) Level 3 fair value (continued) Market capitalisation was the valuation model used in measuring the fair value of the above properties. The valuation model considers the present value of net cash flows to be generated from the property. The expected net cash flows are discounted using risk-adjusted market capitalisation rates adjusted for the certain market factors such as the physical deterioration of the property and its location (prime vs secondary). Significant key unobservable inputs used include market lease rates and market capitalisation rates ranging from 10.5% to 12%. Accordingly, an increase in market lease rates and / or a decrease in market capitalisation rate would increase the fair value of the properties. A decrease in market lease rates and / or an increase in market capitalisation rate would decrease the fair value of the properties. (vii) Sensitivity analysis Effectonprofitorloss increase / (decrease) 31 Dec 2014 31 Dec 2013 K’000 K’000 Increase of 1% in capitalisation rates (39,120) (46,086) 10% increase in rentals 47,771 36,962 10% increase in sales prices and / or replacement costs 4,485 4,070 A decrease any of the above unobservable inputs would have the opposite but similar effect to profit or loss. (c) Work in progress (WIP) 31 Dec 2014 31 Dec 2013 K’000 K’000 Grand Pacific Hotel - 38,425 WIP represents investment properties under construction by NASFUND or corporate entities in which NASFUND has an interest. The WIP is carried at cost and is transferred to investment properties upon completion. Reconciliation of movement in work in progress is as follows: 31 Dec 2014 31 Dec 2013 Note K’000 K’000 Opening balance - 38,425 Additions during the year - - Transfers to unquoted investments (i) - (38,425) Closing balance - - (i) In 2013, Grand Pacific Hotel Limited was transferred to unquoted shares as an incorporated equity investment.
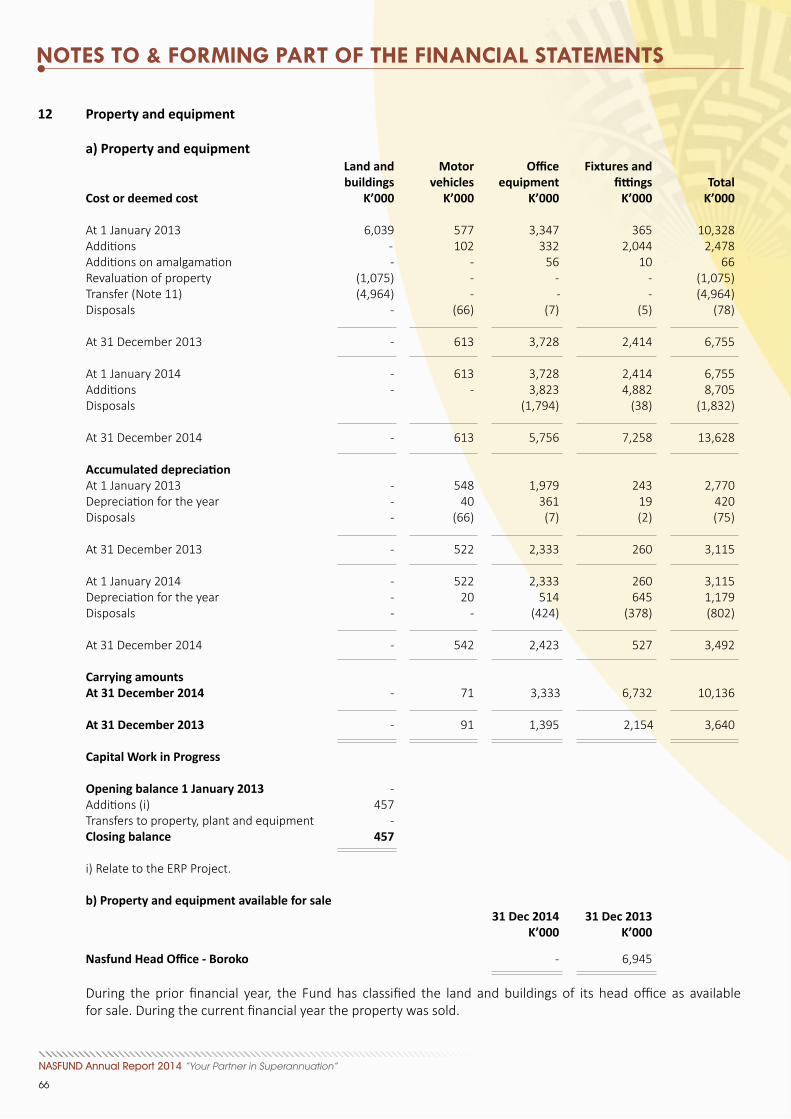
NASFUND Annual Report 2014 “Your Partner in Superannuation”
66
NOTES TO & FORMING PART OF THE FINANCIAL STATEMENTS
12 Property and equipment a) Property and equipment Landand Motor Office Fixturesand buildings vehicles equipment fittings Total Cost or deemed cost K’000 K’000 K’000 K’000 K’000 At 1 January 2013 6,039 577 3,347 365 10,328 Additions - 102 332 2,044 2,478 Additions on amalgamation - - 56 10 66 Revaluation of property (1,075) - - - (1,075) Transfer (Note 11) (4,964) - - - (4,964) Disposals - (66) (7) (5) (78) At 31 December 2013 - 613 3,728 2,414 6,755 At 1 January 2014 - 613 3,728 2,414 6,755 Additions - - 3,823 4,882 8,705 Disposals (1,794) (38) (1,832) At 31 December 2014 - 613 5,756 7,258 13,628 Accumulateddepreciation At 1 January 2013 - 548 1,979 243 2,770 Depreciation for the year - 40 361 19 420 Disposals - (66) (7) (2) (75) At 31 December 2013 - 522 2,333 260 3,115 At 1 January 2014 - 522 2,333 260 3,115 Depreciation for the year - 20 514 645 1,179 Disposals - - (424) (378) (802) At 31 December 2014 - 542 2,423 527 3,492 Carrying amounts At 31 December 2014 - 71 3,333 6,732 10,136 At 31 December 2013 - 91 1,395 2,154 3,640 Capital Work in Progress Opening balance 1 January 2013 - Additions (i) 457 Transfers to property, plant and equipment - Closing balance 457 i) Relate to the ERP Project. b) Property and equipment available for sale 31 Dec 2014 31 Dec 2013 K’000 K’000 NasfundHeadOffice-Boroko - 6,945 During the prior financial year, the Fund has classified the land and buildings of its head office as available for sale. During the current financial year the property was sold.
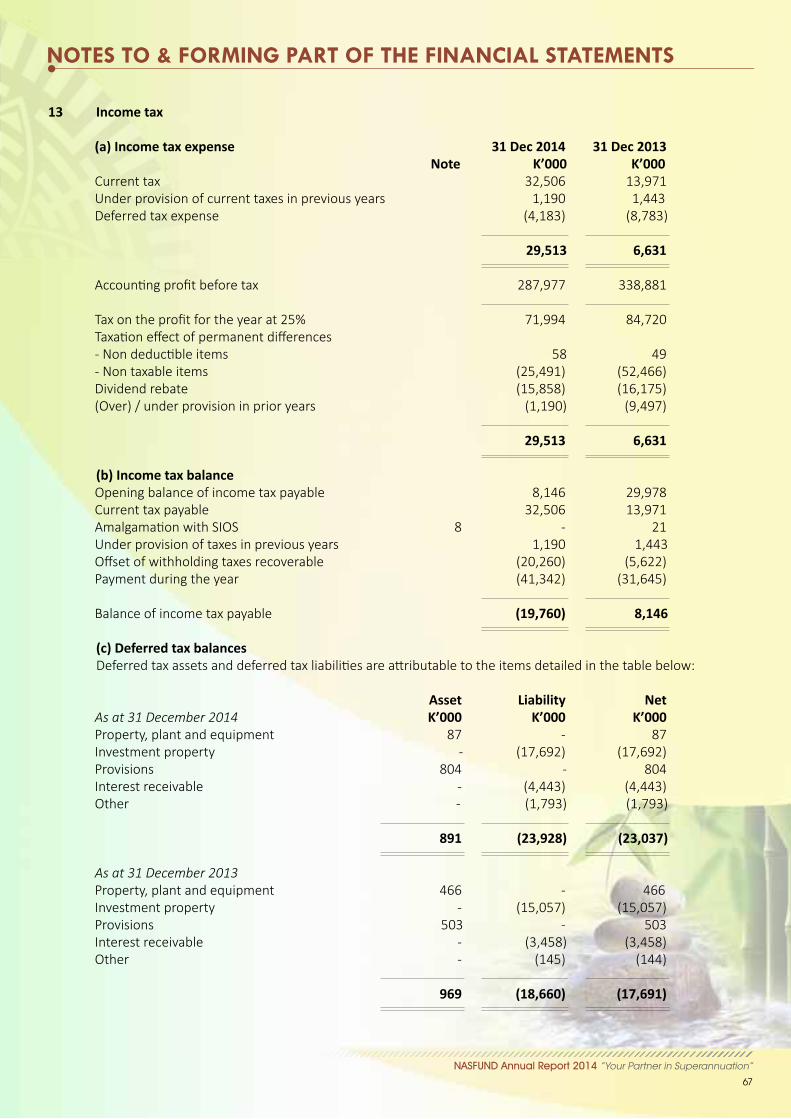
NASFUND Annual Report 2014 “Your Partner in Superannuation”
67
NOTES TO & FORMING PART OF THE FINANCIAL STATEMENTS
13 Income tax (a) Income tax expense 31 Dec 2014 31 Dec 2013 Note K’000 K’000 Current tax 32,506 13,971 Under provision of current taxes in previous years 1,190 1,443 Deferred tax expense (4,183) (8,783) 29,513 6,631 Accounting profit before tax 287,977 338,881 Tax on the profit for the year at 25% 71,994 84,720 Taxation effect of permanent differences - Non deductible items 58 49 - Non taxable items (25,491) (52,466) Dividend rebate (15,858) (16,175) (Over) / under provision in prior years (1,190) (9,497) 29,513 6,631 (b) Income tax balance Opening balance of income tax payable 8,146 29,978 Current tax payable 32,506 13,971 Amalgamation with SIOS 8 - 21 Under provision of taxes in previous years 1,190 1,443 Offset of withholding taxes recoverable (20,260) (5,622) Payment during the year (41,342) (31,645) Balance of income tax payable (19,760) 8,146 (c) Deferred tax balances Deferred tax assets and deferred tax liabilities are attributable to the items detailed in the table below: Asset Liability Net As at 31 December 2014 K’000 K’000 K’000 Property, plant and equipment 87 - 87 Investment property - (17,692) (17,692) Provisions 804 - 804 Interest receivable - (4,443) (4,443) Other - (1,793) (1,793) 891 (23,928) (23,037) As at 31 December 2013 Property, plant and equipment 466 - 466 Investment property - (15,057) (15,057) Provisions 503 - 503 Interest receivable - (3,458) (3,458) Other - (145) (144) 969 (18,660) (17,691)
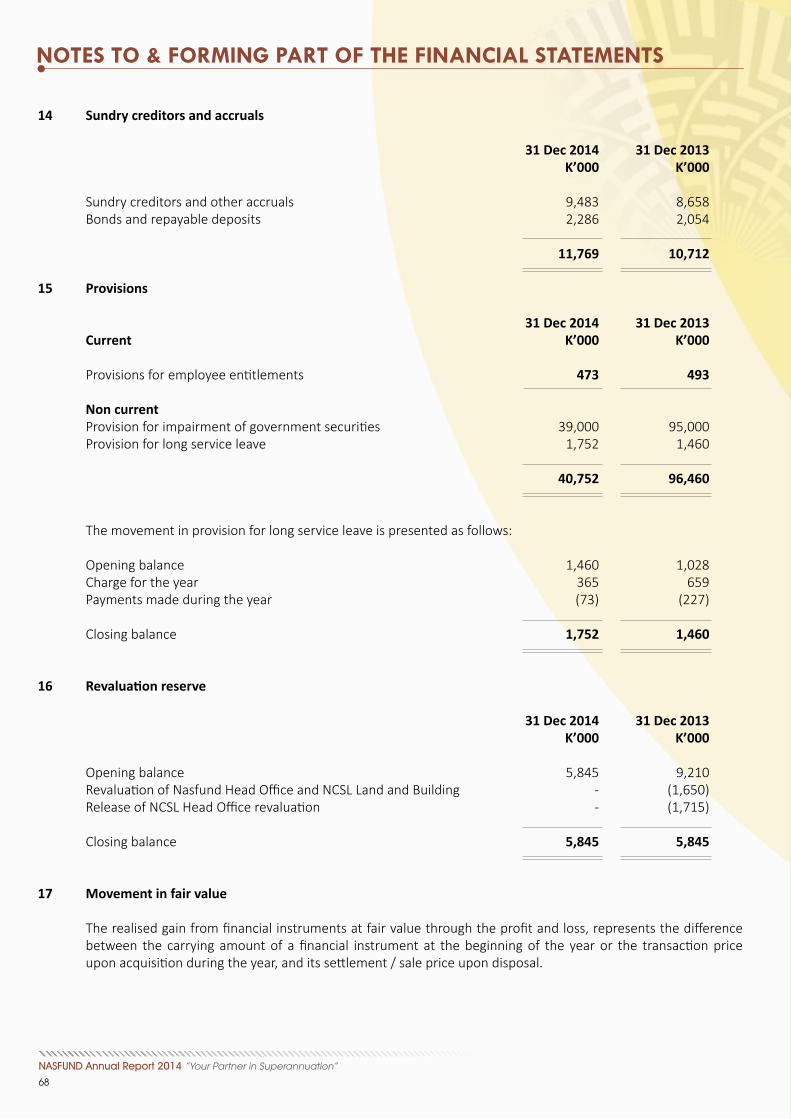
NASFUND Annual Report 2014 “Your Partner in Superannuation”
68
NOTES TO & FORMING PART OF THE FINANCIAL STATEMENTS
14 Sundry creditors and accruals
31 Dec 2014 31 Dec 2013 K’000 K’000 Sundry creditors and other accruals 9,483 8,658 Bonds and repayable deposits 2,286 2,054 11,769 10,712 15 Provisions 31 Dec 2014 31 Dec 2013 Current K’000 K’000 Provisions for employee entitlements 473 493 Non current Provision for impairment of government securities 39,000 95,000 Provision for long service leave 1,752 1,460 40,752 96,460 The movement in provision for long service leave is presented as follows: Opening balance 1,460 1,028 Charge for the year 365 659 Payments made during the year (73) (227) Closing balance 1,752 1,460
16 Revaluationreserve 31 Dec 2014 31 Dec 2013 K’000 K’000 Opening balance 5,845 9,210 Revaluation of Nasfund Head Office and NCSL Land and Building - (1,650) Release of NCSL Head Office revaluation - (1,715) Closing balance 5,845 5,845
17 Movement in fair value The realised gain from financial instruments at fair value through the profit and loss, represents the difference between the carrying amount of a financial instrument at the beginning of the year or the transaction price upon acquisition during the year, and its settlement / sale price upon disposal.
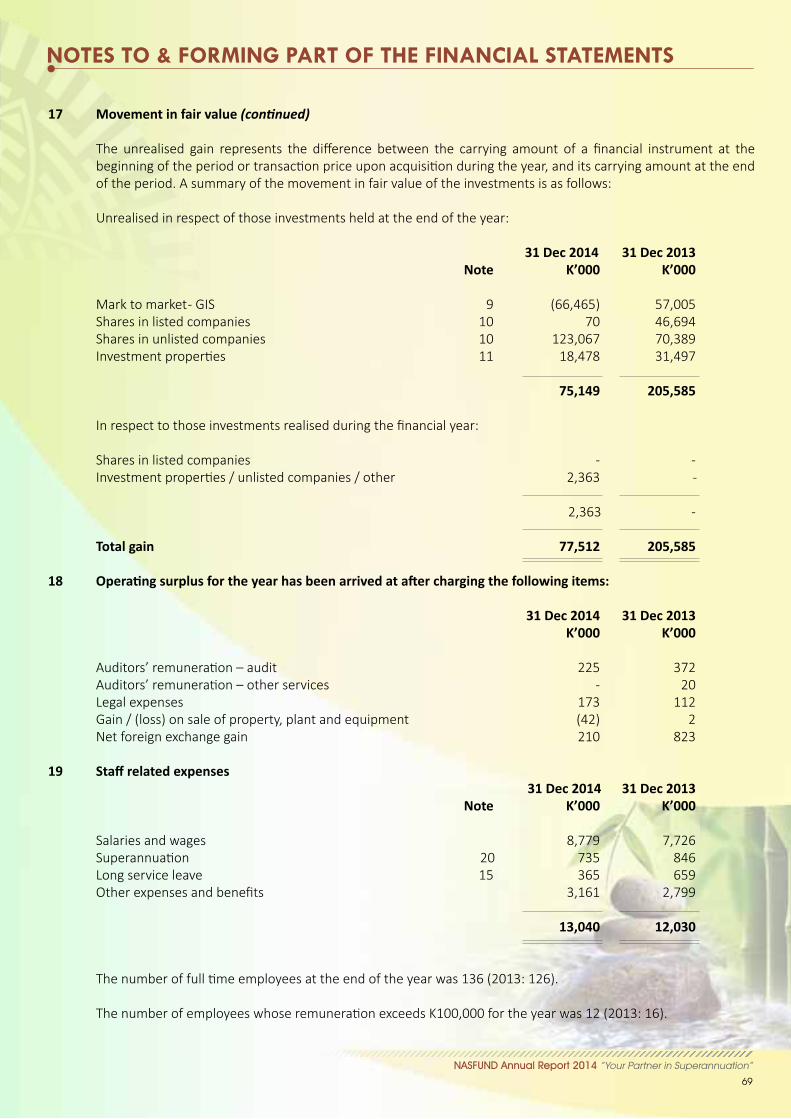
NASFUND Annual Report 2014 “Your Partner in Superannuation”
69
NOTES TO & FORMING PART OF THE FINANCIAL STATEMENTS
17 Movement in fair value (continued) The unrealised gain represents the difference between the carrying amount of a financial instrument at the beginning of the period or transaction price upon acquisition during the year, and its carrying amount at the end of the period. A summary of the movement in fair value of the investments is as follows: Unrealised in respect of those investments held at the end of the year: 31 Dec 2014 31 Dec 2013 Note K’000 K’000 Mark to market - GIS 9 (66,465) 57,005 Shares in listed companies 10 70 46,694 Shares in unlisted companies 10 123,067 70,389 Investment properties 11 18,478 31,497 75,149 205,585 In respect to those investments realised during the financial year: Shares in listed companies - - Investment properties / unlisted companies / other 2,363 - 2,363 - Total gain 77,512 205,585 18 Operatingsurplusfortheyearhasbeenarrivedatafterchargingthefollowingitems: 31 Dec 2014 31 Dec 2013 K’000 K’000 Auditors’ remuneration – audit 225 372 Auditors’ remuneration – other services - 20 Legal expenses 173 112 Gain / (loss) on sale of property, plant and equipment (42) 2 Net foreign exchange gain 210 823 19 Staffrelatedexpenses 31 Dec 2014 31 Dec 2013 Note K’000 K’000 Salaries and wages 8,779 7,726 Superannuation 20 735 846 Long service leave 15 365 659 Other expenses and benefits 3,161 2,799 13,040 12,030 The number of full time employees at the end of the year was 136 (2013: 126). The number of employees whose remuneration exceeds K100,000 for the year was 12 (2013: 16).
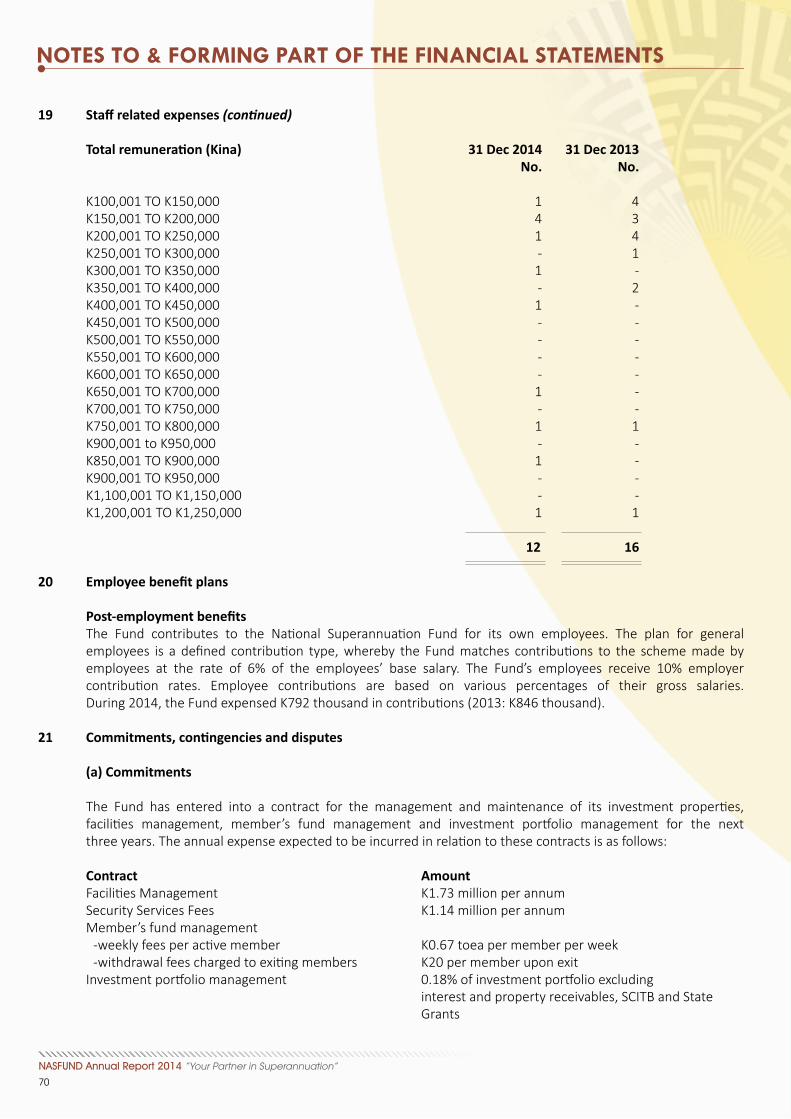
NASFUND Annual Report 2014 “Your Partner in Superannuation”
70
NOTES TO & FORMING PART OF THE FINANCIAL STATEMENTS
19 Staffrelatedexpenses(continued) Totalremuneration(Kina) 31Dec2014 31Dec2013 No. No. K100,001 TO K150,000 1 4 K150,001 TO K200,000 4 3 K200,001 TO K250,000 1 4 K250,001 TO K300,000 - 1 K300,001 TO K350,000 1 - K350,001 TO K400,000 - 2 K400,001 TO K450,000 1 - K450,001 TO K500,000 - - K500,001 TO K550,000 - - K550,001 TO K600,000 - - K600,001 TO K650,000 - - K650,001 TO K700,000 1 - K700,001 TO K750,000 - - K750,001 TO K800,000 1 1 K900,001 to K950,000 - - K850,001 TO K900,000 1 - K900,001 TO K950,000 - - K1,100,001 TO K1,150,000 - - K1,200,001 TO K1,250,000 1 1 12 16 20 Employeebenefitplans Post-employmentbenefits The Fund contributes to the National Superannuation Fund for its own employees. The plan for general employees is a defined contribution type, whereby the Fund matches contributions to the scheme made by employees at the rate of 6% of the employees’ base salary. The Fund’s employees receive 10% employer contribution rates. Employee contributions are based on various percentages of their gross salaries. During 2014, the Fund expensed K792 thousand in contributions (2013: K846 thousand). 21 Commitments,contingenciesanddisputes (a) Commitments The Fund has entered into a contract for the management and maintenance of its investment properties, facilities management, member’s fund management and investment portfolio management for the next three years. The annual expense expected to be incurred in relation to these contracts is as follows: Contract Amount Facilities Management K1.73 million per annum Security Services Fees K1.14 million per annum Member’s fund management -weekly fees per active member K0.67 toea per member per week -withdrawal fees charged to exiting members K20 per member upon exit Investment portfolio management 0.18% of investment portfolio excluding interest and property receivables, SCITB and State Grants

NASFUND Annual Report 2014 “Your Partner in Superannuation”
71
NOTES TO & FORMING PART OF THE FINANCIAL STATEMENTS
21 Commitments,contingenciesanddisputes(continued) (b)Governmentsecuritiesindispute The Fund had the following government securities which were directly or indirectly in dispute as at 31 December 2014: (i) Sovereign Community Infrastructure Treasury Bill (SCITB) - K125 million Recoverability of the SCITB is in dispute. The Government of Papua New Guinea claims that the SCITB is not a lawfully issued Treasury Bill. The Fund maintains, based on independent legal advice that the SCITB was legal and funds advanced for the SCITB and the applicable interest are fully recoverable. The Fund has commenced legal action against the State of Papua New Guinea, the Bank of Papua New Guinea and National Capital Limited (NCL) for the return of the K125 million. The Fund is advised that even if the proceedings are unsuccessful, it will recover a minimum of K55 million held by NCL in an account frozen by the Bank of Papua New Guinea. (ii)ExchangeofNiuginiNomineeNotes(K100million)forBankofSouthPacificshares During 2011, the Fund redeemed its holding of Notes issued by Nominees Niugini Limited (NNL) in exchange for shares in Bank of South Pacific (BSP), being part of a parcel of BSP Shares which Motor Vehicles Insurance Limited (MVIL) had mortgaged to NNL. There is currently legal action between Independent Public Business Corporation of Papua New Guinea (IPBC) (parent of MVIL), NNL and MVIL by which IPBC is seeking to have the BSP shares returned to MVIL. It has been suggested by external parties that there is a possibility that the deal could be unwound and thus, the shares may be required to be returned. The Fund has obtained independent legal advice and is advised that the Fund has good title to the parcel of BSP shares transferred to the Fund and there is no basis for any legal action against the Fund that would result in a negative outcome for the Fund. (iii) Provision for impairment Whilst the Fund does not accept liability for any of the above matters, it has an accumulated provision of K39 million (2013: K95 million) in respect of the above matters to take into account the vagueness of the laws of the State and the ability to recover the entire amounts (see note 15). (c)Materialcontracts-operational Contract Services Expiry Date Aon Hewitt (PNG) Limited Administration May 2015 SOS Security Ltd. Administration Feb 2016 PacWealth Capital Limited Investment Management Feb 2015
(d) Material contracts - property development Contract Services Expiry Date Curtain Bros. Ltd. Property Development 12 months after completion Lamana Developments Limited Property Development 12 months after completion Ashton Brunswick Limited Facilities Manager March 2016
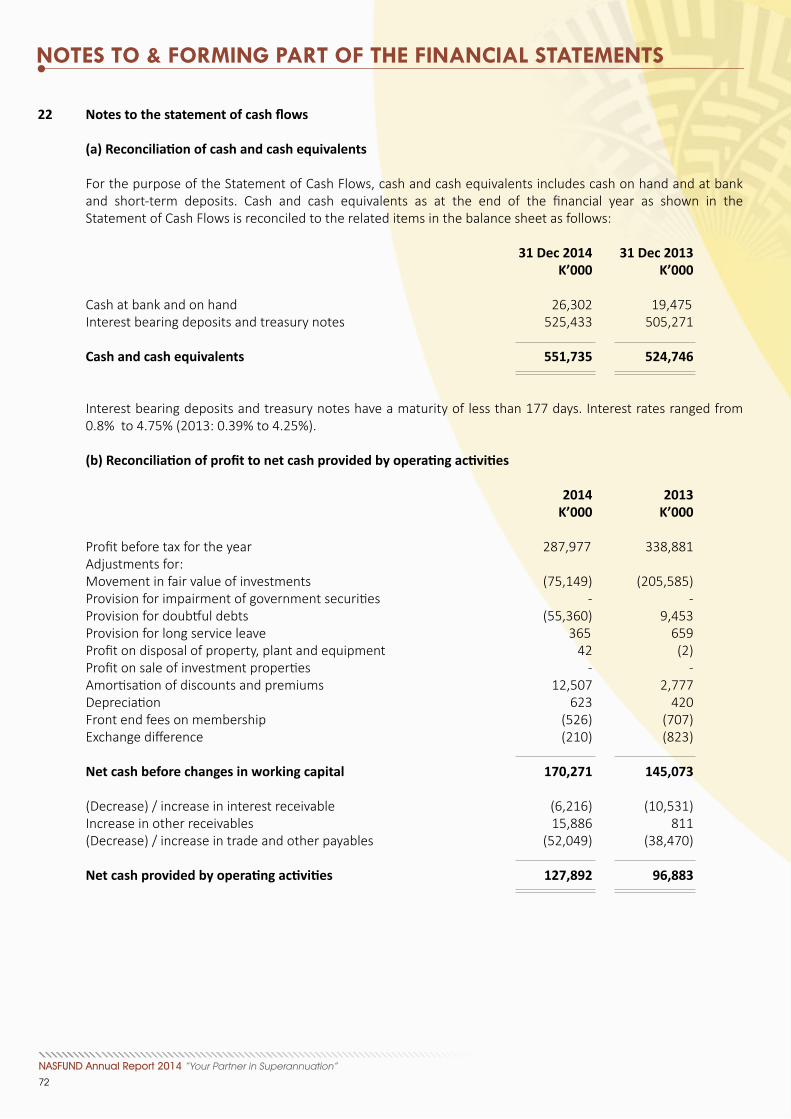
NASFUND Annual Report 2014 “Your Partner in Superannuation”
72
NOTES TO & FORMING PART OF THE FINANCIAL STATEMENTS
22 Notestothestatementofcashflows (a)Reconciliationofcashandcashequivalents For the purpose of the Statement of Cash Flows, cash and cash equivalents includes cash on hand and at bank and short-term deposits. Cash and cash equivalents as at the end of the financial year as shown in the Statement of Cash Flows is reconciled to the related items in the balance sheet as follows: 31 Dec 2014 31 Dec 2013 K’000 K’000 Cash at bank and on hand 26,302 19,475 Interest bearing deposits and treasury notes 525,433 505,271 Cash and cash equivalents 551,735 524,746 Interest bearing deposits and treasury notes have a maturity of less than 177 days. Interest rates ranged from 0.8% to 4.75% (2013: 0.39% to 4.25%). (b)Reconciliationofprofittonetcashprovidedbyoperatingactivities 2014 2013 K’000 K’000 Profit before tax for the year 287,977 338,881 Adjustments for: Movement in fair value of investments (75,149) (205,585) Provision for impairment of government securities - - Provision for doubtful debts (55,360) 9,453 Provision for long service leave 365 659 Profit on disposal of property, plant and equipment 42 (2) Profit on sale of investment properties - - Amortisation of discounts and premiums 12,507 2,777 Depreciation 623 420 Front end fees on membership (526) (707) Exchange difference (210) (823) Net cash before changes in working capital 170,271 145,073 (Decrease) / increase in interest receivable (6,216) (10,531) Increase in other receivables 15,886 811 (Decrease) / increase in trade and other payables (52,049) (38,470) Netcashprovidedbyoperatingactivities 127,892 96,883

NASFUND Annual Report 2014 “Your Partner in Superannuation”
73
NOTES TO & FORMING PART OF THE FINANCIAL STATEMENTS
23 Relatedpartytransactions Related parties represent major shareholders, directors and key management personnel of the Fund and entities controlled, jointly-controlled or significantly influenced by such parties. Pricing policies and the terms of these transactions are approved by the Board of Directors. Transactions with related parties during the year are as follows: (i) Nasfund Contributors Savings and Loan Society (“NCSL”) NASFUND Contributors Savings and Loan Society is a related party as only NASFUND contributors are eligible to be members of the Society. Transactions with Nasfund Contributors Savings and Loan Society during the year were as follows: 31 Dec 2014 31 Dec 2013 K’000 K’000 Opening balance owing to NASFUND 46 21 Administration services provided by NASFUND - 25 Payments made to NASFUND (41) - Closing balance 5 46 In addition, the Fund provides the use of the building NCSL uses as their head office for a nominal fee included in the above administration fee. 1 Dec 2014 31 Dec 2013 (ii) Nasmel Limited K’000 K’000 Opening intercompany balance owing to NASFUND 126,756 126,964 Improvements to Nasmel Limited investment properties (578) 607 Other account adjustments 696 (815) Closing intercompany balance owing to NASFUND 126,874 126,756 The loan with Nasmel represents long-term capital contributions by the Fund to develop investment properties and finance the investment in Mainland Holdings. The balance is interest-free and is included within the investment of unquoted investments of Nasmel in Note 10. 31 Dec 2014 31 Dec 2013 (iii) City Centre Developments Limited (“CCD”) K’000 K’000 Loan owing to NASFUND - opening balance - 2,781 Loan repayments 2,781 (1,443) Other account adjustments - (1,338) Loan owing to NASFUND - closing balance 2,781 - Opening intercompany balance owing to NASFUND 13,273 14,819 Loan repayments (2,781) (1,546) Closing intercompany balance owing to NASFUND 10,492 13,273 The loan agreement with CCD was completed in 2011, no interest has been incurred since that date and the loan balance has been repaid in monthly instalments in 2012. The intercompany balance of K14.8 million is currently interest-free pending negotiations of loan terms between the parties. The balance is expected to be repaid within the next 3 to 4 years through monthly instalments and is included within the investment of unquoted investments of CCD in Note 10.
NASFUND Annual Report 2014 “Your Partner in Superannuation”
74
NOTES TO & FORMING PART OF THE FINANCIAL STATEMENTS
23 Relatedpartytransactions(continued) (iv)Transactionswithkeymanagementpersonnel Key management personnel are Ian Tarutia (CEO), Warwick Vele (COO) Seno Wekina (CLO ), Charles Lee (CIO), Rajeev Sharma (CFO), John Topal (CRO), Sitiveni Weleilakeba (Change Consultant) and Dominic Beange (Investment Consultant) (v)Compensation Key management personnel compensation comprised of: 31 Dec 2014 31 Dec 2013 K’000 K’000 Salary and fees 4,171 3,528 Non-monetary benefits 903 292 Post-employment benefits 484 353 5,558 4,173 (vi) Loans No loans were provided to key management personnel during the year. (vii)Benefitspaidtokeymanagementpersonnel The following payments were made to Board members and Audit Committee members: 31 Dec 2014 31 Dec 2013 K’000 K’000 - Sitting allowance 62 36 - Quarterly allowance 1,118 1,238 - Audit committee fees 28 55 - Directors insurance 107 72 1,314 1,401 All of the above payments were made in the ordinary course of business. The above payments include payments of K55,000 (2013: K55,000) to JAJ & Associates for the services of Arthur Sam as an independent member of the Audit & Risk Committee of the Fund. (viii) Board of Trustees personnel interests The following Board of Trustees personnel interests are recorded in the Interests Register for the year: Name Nature Organisations Mr. Melchoir Togolo, CBE Director Westpac Bank (PNG) Ltd, Kumul Hotels Ltd, Heritage Park Hotel Ltd, Grand Pacific Hotel Ltd, Panamex Holdings (Singapore) Pte, Ltd.
Shareholder Bank of South Pacific Ltd, Nautilus Minerals Niugini Ltd (Share Options)
Mr. Graham Ainui, MBE Director First Investment Finance Ltd, Police Legacy, Employers Federation of PNG, Viva 5 Ltd.
NASFUND Annual Report 2014 “Your Partner in Superannuation”
75
NOTES TO & FORMING PART OF THE FINANCIAL STATEMENTS
23 Relatedpartytransactions(continued) (viii) Board of Trustees personnel interests (continued) Name Nature Organisations
Mr. William Lamur Director ENB Development Corporation Ltd, ENB Port Services Ltd, National Development Bank, NASFUND Contributors Savings & Loan Society (NCSL), Pacific Assurance Group, ENB Copra Cocoa & Coffee Co-Operative Society, Mainland Holdings Limited, ENB Properties Ltd, PEIL (Pacific Energy), Territory Packaging.
Shareholder Bank of South Pacific Ltd, Airlines of PNG Ltd, Oil Search Ltd. Mr. Murray Woo Director Woo Textile Corporation Limited, Heathly Kamwood Limited, Manufacturers Council of PNG, Getaway Travel Limited, Business Council of PNG, Airlines PNG Ltd, Print Monster Limited, NASFUND Contributors Savings & Loan Society.
Member Employers Federation of PNG.
Shareholder Highlands Pacific Limited, Oil Search Limited. Lady Mina Siaguru, CSM Director Divine Word University Council.
Shareholder Oil Search Ltd.
Member Porgera Environmental Advisory Komiti.
Mr. Hulala Tokome Director Puma Energy PNG Ltd, Puma Energy Refining PNG Ltd, Puma Energy Supply PNG Ltd, Mainland Holdings Limited, NASFUND Contributors Savings & Loan Society Ltd. Shareholder BP Oil Ltd, Interoil Ltd, Kina Asset Management Ltd. Mrs Lata Milner, MBE Director Pedy No. 10 Ltd, Private Boxes (PNG) Ltd, Renlim No. 7 Ltd. Shareholder Pedy No. 10 Ltd, Private Boxes (PNG) Ltd. Mr. Vera Raga Director NASFUND Contributors Savings & Loan Society Ltd, National Tripartite Consultative Council. Mr. David Doig Director Moore Business Systems (PNG) Ltd, Employers Federation of PNG. Shareholder Moore Business Systems (PNG) Ltd.

NASFUND Annual Report 2014 “Your Partner in Superannuation”
76
NOTES TO & FORMING PART OF THE FINANCIAL STATEMENTS
24 Financial instruments (a) Credit risk The carrying amount of financial assets represents the maximum credit exposure. The maximum exposure to credit risk at the reporting date was: 31 Dec 2014 31 Dec 2013 K’000 K’000 Government debt securities 697,707 694,458 Equity securities 1,775,491 1,590,279 Loans and receivables 177,033 93,170 Interest receivables 16,168 22,385 Property receivables 23,407 9,915 Other receivables 1,537 1,396 Cash and cash equivalents 551,735 524,746 3,243,079 2,936,349 The maximum exposure to credit risk for loans and receivables at the reporting date is concentrated in Papua New Guinea. Aging of trade receivables The ageing of unimpaired property receivables at the reporting date was: 31 Dec 2014 31 Dec 2013 K’000 K’000 Current 19,284 6,126 31 - 60 days 675 492 61 - 90 days 615 1,398 over 90 days 2,833 1,899 23,407 9,915 The movement in the allowance for impairment in respect of property receivables is as follows: 31 Dec 2014 31 Dec 2013 K’000 K’000 Opening balance 1,448 - Additional doubtful debts upon amalgamation with SIOS - 1,448 Doubtful debts provisions during the year - 640 Write-offs during the year - (640) Closing balance 1,448 1,448 (b) Liquidity risk Liquidity risk is the risk that the Fund will encounter difficulties in meeting the obligations associated with its financial liabilities that are settled by delivering cash or another financial asset. The Fund’s approach to managing liquidity risk is to ensure as far as possible that it will always have sufficient liquidity to meets its obligations when due under normal and stressed conditions without incurring unacceptable losses or risking damage to the Funds’ reputation. Contractual maturities of financial liabilities, including estimated interest payments and excluding the impact of netting agreements are expected to be realised within the first three months of 2014. Contractual financial liabilities comprise sundry creditors and accruals and current tax liabilities. Any interest payable on these accounts is expected to be insignificant for expected future contracted payments.

NASFUND Annual Report 2014 “Your Partner in Superannuation”
77
NOTES TO & FORMING PART OF THE FINANCIAL STATEMENTS
24 Financial instruments (continued) (c) Currency risk Currency risk is the risk that the fair value or future cash flows of a financial instrument will fluctuate because of changes in foreign exchange rates. The Fund is exposed to currency risk on financial instruments that are denominated in a currencies other than the functional currency (Kina) of the Fund. Consequently, the Fund is exposed to risks that the exchange rate of its currency relative to other foreign currencies may change in a manner that has an adverse affect on the value of that portion of the Fund’s investments denominated in currencies other than the Kina. The Fund’s exposure to foreign currency risk was as follows based on notional amounts: As at 31 December 2014 AUD GBP FJD SBD Equity investments 110,262 6,600 26,740 101,656 Cash at bank - - - 19,590 Gross balance 110,262 6,600 26,740 121,246 % of net asset value 6.3% 0.7% 1.0% 1.1% Foreign exchange rate 0.47 0.25 0.73 2.94 As at 31 December 2013 Equity investments 110,692 3,965 26,740 148,590 Cash at bank - - - 7,200 Gross balance 110,692 3,965 26,740 155,790 % of net asset value 6.8% 0.5% 1.1% 1.5% Foreign exchange rate 0.49 0.26 0.70 3.15 Sensitivityanalysis A 10 percent strengthening of the PNG Kina against the above currencies at 31 December would have decreased equity and profit or loss by the amounts shown below. This analysis assumes that all other variables, in particular interest rates, remain constant. The analysis was performed on the same basis for 2014 and 2013. 31 Dec 2014 31 Dec 2013 K’000 K’000 AUD 21,183 20,706 GBP 2,354 1,391 FJD 3,314 3,493 SBD 3,746 4,499 30,597 30,089 A 10 percent weakening of the PNG Kina against the above currencies at 31 December would have had the equal but opposite effect on the above currencies to the amounts shown above, on the basis that all other variables remain constant.
NASFUND Annual Report 2014 “Your Partner in Superannuation”
78
NOTES TO & FORMING PART OF THE FINANCIAL STATEMENTS
24 Financial instruments (continued) (d)Interestrateriskprofile(continued) Interest rate risk is the risk that the fair value or future cash flows of a financial instrument will fluctuate because of changes in market interest rates. At the reporting date the interest rate profile of the Fund’s interest-bearing financial instruments was: 31 Dec 2014 31 Dec 2013 K’000 K’000 Fixed rate instruments Financial assets (Government bonds and inscribed stock) 566,707 554,458 Treasury bills and interest-bearing deposits 525,433 505,271 Loans and other receivables 132,215 109,541 1,224,355 1,169,270 Variable rate instruments State grant 6,000 15,000 Loans and other receivables 44,819 18,177 Total 1,275,174 1,202,447 Sensitivityanalysis For 2014, Government Inscribed Stocks (“GIS”) is marked to market based on current yields. A change of 25 bps in yields would result in an increase in the value of GIS of K12.3 million. A change of 1% in the interest rates and a change of 10% in the consumer price index (CPI) of Port Moresby in respect of the state grant for the variable interest-bearing financial instruments would have increased or decreased profits by K4,126 thousand (2013: K1,310 thousand). (e) Other market price risk Other market price risk is the risk that the fair value or future cash flows of a financial instrument will fluctuate because of changes in market prices (other than those arising from interest rate risk or currency risk), whether those changes are caused by factors specific to the individual financial instrument or its issuer, or factors affecting all similar financial instruments traded in the market. As the Fund’s financial instruments are carried at fair values with changes recognised in the statement of comprehensive income, changes in market conditions affecting fair value will be recognised. Investments of the Fund (other than cash held for liquidity purposes and investment properties) comprise fixed interest securities, shares in listed companies, investments in unlisted companies and funds. The Fund’s exposure therefore is limited to the fair value movement of these investments. Other market price risk is mitigated by constructing a diversified portfolio of instruments which are traded on various markets. All investment managers are subject to extensive due diligence prior to being appointed with the recommendation for their appointment and removal made by the Investment Committee to the Board for final approval. The Investment Department receive monthly reports from all investment managers which are reviewed in detail and assessed against relevant benchmarks and expected returns. Investment manager performance is reported to the Investment Committee and Board on a quarterly basis.
NASFUND Annual Report 2014 “Your Partner in Superannuation”
79
NOTES TO & FORMING PART OF THE FINANCIAL STATEMENTS
24 Financial instruments (continued) (e) Other market price risk (continued) Sensitivityanalysis Following analysis of historical data and expected investment rate movements during the 2014 financial year, together with consultation with the investment consultant, the Fund’s Investment Department considers the following movements in other market price risk are reasonably possible. Listed overseas shares 15% Listed local shares 10% Investment in unquoted companies 5% Effectonnet Effectonnet Carrying assetsandprofit assetsandprofit As at 31 December 2014 % amount increase decrease Listed overseas shares 15% 262,594 39,389 (39,389) Listed local shares 10% 627,039 62,704 (62,704) Investment in unquoted companies 5% 705,576 35,279 (35,279) As at 31 December 2013 Listed overseas shares 15% 245,808 36,871 (36,871) Listed local shares 10% 687,128 68,713 (68,713) Investment in unquoted companies 5% 585,617 29,281 (29,281) (f) Fair value versus carrying values The carrying amounts of financial assets and liabilities as set out in the statement of financial position approximates their fair values. The significant methods and assumptions used in estimating the fair values are stated in notes 4, 9 and 10. (g) Fair value hierarchy Subsequent to initial recognition, the Fund uses the fair value hierarchy in determining the fair value of its available-for-sale financial assets, financial assets at fair value through profit and loss (“FVTPL”) and financial liabilities at FVTPL. The fair value hierarchy groups the financial instruments into Levels 1 to 3 based on the degree to which the fair value is observable. Details of each level are discussed in note 4(iii). The table below presents the basis of determining the fair value of each class of the Fund’s financial instrument measured at fair value subsequent to initial recognition.
Level 1 Level 2 Level 3 Total As at 31 December 2014 K’000 K’000 K’000 K’000 Government Inscribed Stock - - 566,707 566,707 Equity securities 889,633 - 705,576 1,595,210 889,633 - 1,272,283 2,161,917
Level 1 Level 2 Level 3 Total As at 31 December 2013 K’000 K’000 K’000 K’000 Government Inscribed Stock - - 554,458 554,458 Equity securities 932,936 49,300 536,317 1,518,553 932,936 49,300 1,090,775 2,073,011

NASFUND Annual Report 2014 “Your Partner in Superannuation”
80
NOTES TO & FORMING PART OF THE FINANCIAL STATEMENTS
24 Financial instruments (continued)
(h) Measurement of fair values (i) Financial instruments measured at fair value Equity securities Capitalisable maintainable earnings (CME) approach, orderly realisation of assets (ORA), net assets approach, and sum of parts were the valuation models used in measuring the fair value of the Level 3 fair value equity securities. For a summary of valuation methods used, unobservable inputs and sensitivity analysis associated with Equity securities, please refer to note 10. Debt securities - Government Inscribed Stock For 2014, GIS have been marked to market using a price formula and comparable current market yields. Please refer to note 9 for a sensitivity analysis relating to chnages in yields. (ii) Financial instruments not measured at fair value Debt securities Debt securities, which includes government securities and other loans, but excludes Government Inscribed Stock for the year ended 31 December 2013, are valued at amortised cost. Due to the absence of an observable market of these debt securities in Papua New Guinea and/or their nature as loans, the amortised cost approximates their fair values. There is no significant unobservable input used in the valuation model. (iii) Reconciliation of Level 2 fair values There has been no movement in Level 2 fair values during the year.
(iii) Reconciliation of Level 3 fair values The following table shows a reconciliation from the opening balances to the closing balances for Level 3 fair values: 2014 K’000 Opening balance 1,090,775 Reclassifications, and additions including amalgamation of SIOS - In respect of those fair valued this year which were valued at cost in prior year - Transfers from Level 2 - Disposals and redemptions during the year (4,640) Changes in fair value 56,602 Closing balance 1,142,737 25 Comparativefigures Certain amounts in the comparative financial statements and note disclosures have been reclassified to conform to the current year’s presentation. Management believes that the above reclassifications resulted to a better presentation of accounts and did not have any impact on prior year’s profit or loss. 26 Eventsafterbalancesheetdate There have been no significant events after the balance sheet date that have not been appropriately accounted for, or disclosed, in these financial statements.

NASFUND Annual Report 2014 “Your Partner in Superannuation”
81
NOTES

NASFUND Annual Report 2014 “Your Partner in Superannuation”
82
NOTES
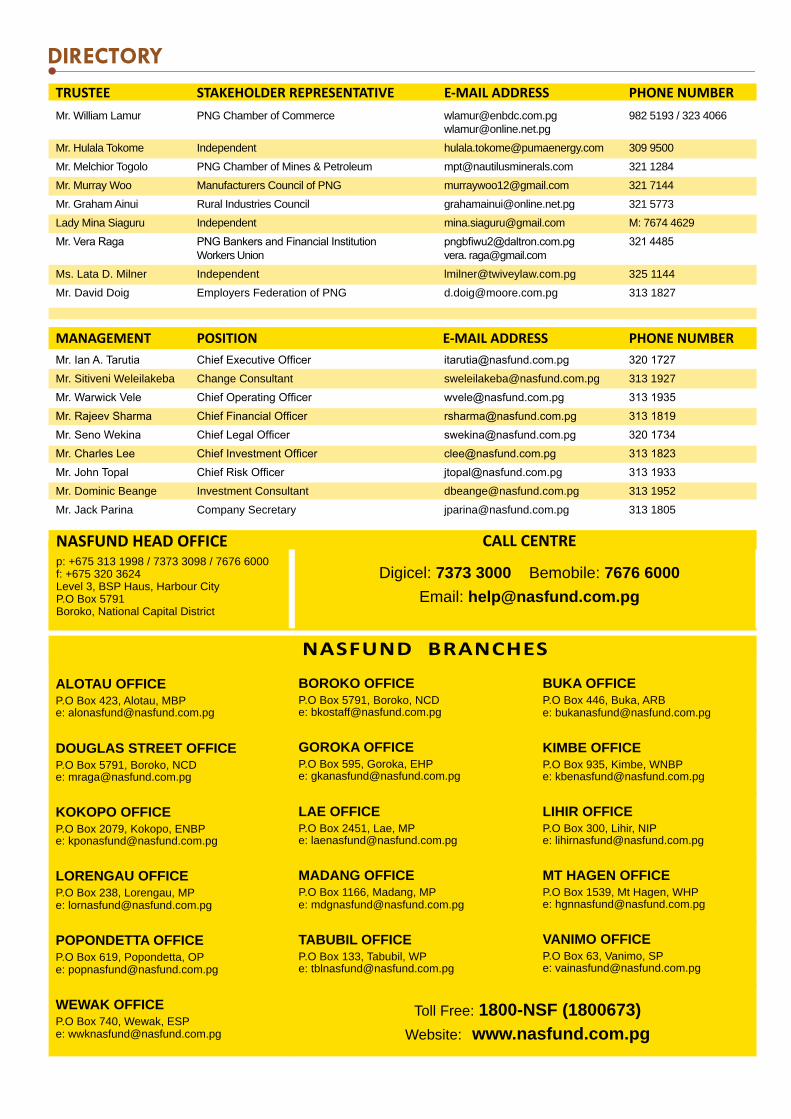
DIRECTORYTRUSTEE STAKEHOLDER REPRESENTATIVE E-MAIL ADDRESS PHONE NUMBERMr. William Lamur PNG Chamber of Commerce [email protected] 982 5193 / 323 4066 [email protected]
Mr. Hulala Tokome Independent [email protected] 309 9500
Mr. Melchior Togolo PNG Chamber of Mines & Petroleum [email protected] 321 1284
Mr. Murray Woo Manufacturers Council of PNG [email protected] 321 7144
Mr. Graham Ainui Rural Industries Council [email protected] 321 5773
Lady Mina Siaguru Independent [email protected] M: 7674 4629
Mr. Vera Raga PNG Bankers and Financial Institution [email protected] 321 4485 Workers Union vera. [email protected]
Ms. Lata D. Milner Independent [email protected] 325 1144
Mr. David Doig Employers Federation of PNG [email protected] 313 1827
MANAGEMENT POSITION E-MAIL ADDRESS PHONE NUMBERMr. Ian A. Tarutia Chief Executive Officer [email protected] 320 1727
Mr. Sitiveni Weleilakeba Change Consultant [email protected] 313 1927
Mr. Warwick Vele Chief Operating Officer [email protected] 313 1935
Mr. Rajeev Sharma Chief Financial Officer [email protected] 313 1819
Mr. Seno Wekina Chief Legal Officer [email protected] 320 1734
Mr. Charles Lee Chief Investment Officer [email protected] 313 1823
Mr. John Topal Chief Risk Officer [email protected] 313 1933
Mr. Dominic Beange Investment Consultant [email protected] 313 1952
Mr. Jack Parina Company Secretary [email protected] 313 1805
NASFUND HEAD OFFICEp: +675 313 1998 / 7373 3098 / 7676 6000 f: +675 320 3624Level 3, BSP Haus, Harbour CityP.O Box 5791 Boroko, National Capital District
NASFUND BRANCHES
ALOTAU OFFICEP.O Box 423, Alotau, MBPe: [email protected]
DOUGLAS STREET OFFICEP.O Box 5791, Boroko, NCDe: [email protected]
KOKOPO OFFICEP.O Box 2079, Kokopo, ENBPe: [email protected]
LORENGAU OFFICEP.O Box 238, Lorengau, MPe: [email protected]
POPONDETTA OFFICEP.O Box 619, Popondetta, OPe: [email protected]
WEWAK OFFICEP.O Box 740, Wewak, ESPe: [email protected]
BOROKO OFFICEP.O Box 5791, Boroko, NCDe: [email protected]
GOROKA OFFICEP.O Box 595, Goroka, EHPe: [email protected]
LAE OFFICEP.O Box 2451, Lae, MPe: [email protected]
MADANG OFFICEP.O Box 1166, Madang, MPe: [email protected]
TABUBIL OFFICEP.O Box 133, Tabubil, WPe: [email protected]
BUKA OFFICEP.O Box 446, Buka, ARBe: [email protected]
KIMBE OFFICEP.O Box 935, Kimbe, WNBPe: [email protected]
LIHIR OFFICEP.O Box 300, Lihir, NIPe: [email protected]
MT HAGEN OFFICEP.O Box 1539, Mt Hagen, WHPe: [email protected]
VANIMO OFFICEP.O Box 63, Vanimo, SPe: [email protected]
CALL CENTRE
Digicel: 7373 3000 Bemobile: 7676 6000
Email: [email protected]
Toll Free: 1800-NSF (1800673)Website: www.nasfund.com.pg