contents of the annual financial statements and notes · contents of the annual financial...
TRANSCRIPT
Annual Financial Statements and Notes mintek annual report 2010
Contents of the Annual Financial Statements and Notes
for the year ended 31 March 2010
56 Audit Committee RepoRt
57 diReCtoRS’ RepoRt
59 RepoRt oF the AuditoR-GeNeRAl
61 StAtemeNtS oF FiNANCiAl poSitioN
62 StAtemeNtS oF CompReheNSive iNCome
63 StAtemeNtS oF CASh FlowS
64 StAtemeNtS oF ChANGeS iN Net ASSetS
65 NoteS to the ANNuAl FiNANCiAl StAtemeNtS
55

mintek annual report 2010 Annual Financial Statements and Notes
Audit Committee Reportthe audit coMMittee has adopted forMal terMs of reference, which have been confirmed by the Mintek Board, and has performed its responsibilities as set out in the terms of reference. In understanding its responsibilities, the Audit Committee has reviewed the following:• The effectiveness of the internal control system;• The effectiveness of the internal audit function;• The risk areas of the entity to be covered in the internal and external audits;• The adequacy, reliability and accuracy of the financial information provided to management and other users of such information;• The accounting or auditing concerns identified as a result of the external and internal audits;• Compliance with legal and regulatory provisions;• The activities of the internal audit function;• The independence and objectivity of the external auditors; and,• The scope and results of the external audit function.
The Audit Committee is also responsible for:• Reporting to the Mintek Board and the Auditor-General where the report implicates any members of the accounting authority in fraud,
corruption or gross negligence;• Communicating any concerns it deems necessary to the Mintek Board;• Confirming the internal auditor’s charter and audit plan;• Encouraging communication between members of the Mintek Board, senior executive management, the internal auditors and
external auditors;• Conducting investigations within the terms of reference;• Concurring with the appointment of the in-house internal audit function;• Approving the internal audit work plan; and,• Setting the principles for recommending the use of the external auditor for non-audit services.
The Audit Committee is satisfied that internal controls and systems have been put in place during the year under review and that controls have functioned effectively during the period. The Audit Committee considers Mintek internal controls and systems to be appropriate in all material respects to:• Reduce the entity’s risk to an acceptable level;• Meet the business objectives of the entity;• Ensure the entity’s assets are adequately safeguarded; and, • Ensure that the transactions undertaken are recorded in the entity’s records.
The Audit Committee has evaluated the group and the company financial statements for the year ended 31 March 2010 and concluded that they fully comply, in all material aspects, with the requirements of the Public Finance Management Act (PFMA) No.1 of 1999, as amended, and South African Statements of Generally Accepted Accounting Practice (SA Statements of GAAP).
The Audit Committee has requested management to review and evaluate Mintek’s internal controls to identify areas that can be improved upon. The Audit Committee agrees that the adoption of the going concern premise is appropriate in preparing the annual financial statements. The Committee acknowledges that Mintek has made significant progress in addressing the control weakness identified previously and looks forward to the future control environment, which will provide a sound basis for Mintek to meet its obligation to its stakeholders.
mohau mphomelaChairperson of the Audit Committee31 March 2010
Audit Committee members:
Mr M MphomelaDr J BredellMs L MhlabeniMs N LilaMr B Mbewu
56

Annual Financial Statements and Notes mintek annual report 2010
directors’ ReportThe directors of Mintek take pleasure in submitting their 2009/2010 report together with the Annual financial statements as at 31 March 2010.
pRoFile
Mintek was established by the Mineral Technology Act 30 of 1989, incorporated as a public company in South Africa in terms of the Companies Act, 1973, as amended, and is listed as a national government business enterprise in schedule 3B of the Public Finance Management Act (PFMA), 1999, as amended.
FiNANCiAl ReSultS
The financial statements represent the financial result of Mintek and the consolidated results of its subsidiary, Mindev (Pty) Ltd, for the year ending 31 March 2010.
RepoRtiNG StANdARdS
The Mintek Group’s Annual Financial Statements comply with South African Statements of Generally Accepted Accounting Practice (GAAP) and the PFMA.
oRGANiSAtioNAl StRuCtuRe
Mintek’s organisational structure is shown on page 9 of the annual report.
pRiNCipAl ACtivitieS
Mintek, South Africa’s national mineral research organisation, is a state-owned enterprise established to ensure the sustainability and growth of the minerals industry through technology development and transfer. In terms of its mandate under the Mineral Technology Act 30 of 1989, Mintek’s main objectives are to promote mineral technology and to foster the establishment and expansion of industries in the field of minerals and products derived therefrom through research.
Specific aims include to:
• Develop efficient mineral processing technologies and sustainable value added products;
• Play a significant role in second economy interventions by developing technologies appropriate to the local jewellery, artisanal and small-scale mining (ASSM) industries;
• Support government regional and continental initiatives;
• Develop human and organisational skills whilst transforming its internal and external business processes and the workforce; and,
• Uphold good governance practices.
FiNANCiAl AFFAiRS
Review of operations
In the 2009/10 financial year Mintek experienced the effect of the economic recession more than anticipated. There was significantly lower demand for research and commercially driven projects forcing Mintek to implement stringent cost control measures to ensure profitability. It was a difficult year exacerbated by the cancellation of large projects and difficulties on other projects such as the smelting of high-chromium platinum concentrates (ConRoast). Mintek has also been affected by the high increase in electricity costs as well as the volatility of our local currency. Mintek has taken the view that these difficulties are short-term and therefore no decision was taken to minimise fixed costs. This view was validated judging by the current strong sales pipeline.
An insurance claim was lodged with the insurers in respect of an accident that occurred at Bay 2 on 27 March 2009. The claim was fully met for damages incurred in this unfortunate event.
Investment property amounting to R12,5m was reclassified in the current financial year as property, plant and equipment after the tenant terminated their lease agreement.
Revenue
Revenue has shown a steady increase in the last three years ending 2008/09. 2009/10 saw a decrease of R42,6m which is largely attributable to difficulties Mintek had with the ConRoast project and fewer pilot plants being executed than anticipated. The government grant, fully ring-fenced on research projects, remained fairly consistent in absolute terms in the last few years not increasing in line with inflation. Interest income almost doubled compared to 2007 (R12m) establishing this as a significant revenue stream for Mintek.
57

mintek annual report 2010 Annual Financial Statements and Notes
A strong commercial revenue pipeline was the driver to high, but erratic, profits in previous years. Notwithstanding the difficult year, gross margin on commercial projects was maintained at an average of 25%. Mintek still achieved a profit of R1.7m in this financial year, aided by strict expenditure management. Staff costs have increased by only 6% compared to 2009. Measures taken to contain staff costs in this year were the freezing of some vacancies and granting of lower annual increments. Despite a 54% increase in number of staff from 2007, salary costs only increased by 27%.
CASh Flow ANAlYSiS
The cash flow indicates that there have been challenges in making ends meet during the year with the reduced revenue, coupled with slower collections. Normal operations generated an investment of only R2,8m in the current year significantly lower than the R113m invested in the previous financial year. This was mainly as a result of lower working capital being available in the current year.
ASSetS
Capital expenditure
Mintek has seen a major injection into property, plant and equipment (PPE), and specifically equipment funded through state grant and other government agency funding. There has been a reclassification of the investment property as PPE in 2010 due to the termination of the lease from BHP Billiton. Mintek expanded its asset base by R25,1m (2009: R38,6 m) in the 2010 financial year. R14,9m was funded by the State grant received. This grant was specifically allocated to fund capex requirements. Assets with a net book value of R40 000 were written off in the current year.
JudiCiAl pRoCeediNGS
The directors are not aware of any significant judicial proceedings against Mintek, except those as disclosed in note 24 of the Annual Financial Statements.
poSt-BAlANCe Sheet eveNtS
There were no material post-balance sheet events that the directors are aware of.
SuBSidiARieS
The information relating to the entity’s financial interest in its subsidiary is disclosed in note 14 of the Annual Financial Statements.
the diReCtoRS oF miNteK AS At 31 mARCh 2010
executive director Mr MA Mngomezulu
Non-executive directors Mr M Mphomela – Chairperson Mrs N Qunta Mr P Streng Adv D Block Mr p White Ms S Sekgobela Ms S Maja Ms J Ndlovu Mr M Mabuza Mr t nell
The board secretary of Mintek is Ms S Bopape, and the business and postal addresses are as follows:
200 Malibongwe Drive Private Bag X3015Randburg Randburg 2194 2125
mr mA mngomezulu
58

Annual Financial Statements and Notes mintek annual report 2010
Report of the Auditor-GeneralRepoRt oF the AuditoR-GeNeRAl to pARliAmeNt oN the GRoup FiNANCiAl StAtemeNtS ANd peRFoRmANCe iNFoRmAtioN oF the CouNCil FoR miNeRAl teChNoloGY (miNteK) FoR the YeAR eNded 31 mARCh 2010
RepoRt oN the CoNSolidAted FiNANCiAl StAtemeNtS
introduction
I have audited the accompanying consolidated and separate financial statements of Mintek, which comprise the consolidated and separate statement of financial position as at 31 March 2010, and the consolidated and separate statements of comprehensive income, statements of changes in net assets and cash flow statements for the year then ended, and a summary of significant accounting policies and other explanatory information, and the accounting authority’s report as set out on pages 61 to 85.
Accounting Authority’s responsibility for the financial statements
The accounting authority is responsible for the preparation and fair presentation of these financial statements in accordance with South African Statements of Generally Accepted Accounting Practice (SA Statements of GAAP) and in the manner required by the Public Finance Management Act of South Africa, 1999 (Act No.1 of 1999)(PFMA) and the Minerals Technology Act, 1989 (Act 30 of 1989). This responsibility includes: designing, implementing and maintaining internal control relevant to the preparation and fair presentation of financial statements that are free from material misstatement, whether due to fraud or error; selecting and applying appropriate accounting policies; and making accounting estimates that are reasonable in the circumstances.
Auditor-General’s responsibility
As required by section 188 of the Constitution of South Africa and section 4 of the Public Audit Act of South Africa, 2004 (Act No. 5 of 2004)(PAA), my responsibility is to express an opinion on these financial statements based on my audit.
I conducted my audit in accordance with International Standards on Auditing and General Notice 1570 of 2009 issued in the Government Gazette 32758 of 27 November 2009. Those standards require that I comply with ethical requirements and plan and perform the audit to obtain reasonable assurance about whether the financial statements are free from material misstatement.
An audit involves performing procedures to obtain audit evidence about the amounts and disclosures in the financial statements. The procedures selected depend on the auditor’s judgement, including the assessment of the risks of material misstatement of the financial statements, whether due to fraud or error. In making those risk assessments, the auditor considers internal control relevant to the entity’s preparation and fair presentation of the financial statements in order to design audit procedures that are appropriate in the circumstances, but not for the purpose of expressing an opinion on the effectiveness of the entity’s internal control. An audit also includes evaluating the appropriateness of accounting policies used and the reasonableness of accounting estimates made by management, as well as evaluating the overall presentation of the financial statements.
I believe that the audit evidence I have obtained is sufficient and appropriate to provide a basis for my audit opinion.
opinion
In my opinion, these financial statements present fairly, in all material respects, the consolidated and separate financial position of MINTEK as at 31 March 2010, and its consolidated and separate financial performance and its consolidated and separate cash flows for the year then ended in accordance with the SA Statements of GAAP and in the manner required by the PFMA and the Mineral Technology Act.
RepoRt oN otheR leGAl ANd ReGulAtoRY ReQuiRemeNtS
In terms of the PAA of South Africa and General Notice 1570 of 2009, issued in the Government Gazette No. 32758 of 27 November 2009,
59

mintek annual report 2010 Annual Financial Statements and Notes
I include below my findings on the report on predetermined objectives and compliance with the PFMA, Mineral Technology Act and financial management (internal control).
Findings
Pre-determined objectives.
No matters to report.
Compliance with laws and regulations
income tax Act, 1962 (Act No. 58 of 1962)
Non-adherence to legislation
Contrary to the requirements of the Income Tax Act, 1962 (Act No. 58 of 1962) Fourth Schedule, paragrah 23, the entity has not lodged the Mindev (Pty) Ltd. income tax return with South African Revenue Services for the year under review.
iNteRNAl CoNtRol
I considered internal control relevant to my audit of the financial statements and the report on predetermined objectives and compliance with the PFMA and the Mineral Technology Act, but not for the purposes of expressing an opinion on the effectiveness of internal control. The matters reported are limited to the deficiencies identified during the audit.
No matters to report.
pretoria31 July 2010
60

Annual Financial Statements and Notes mintek annual report 2010
Financial Statements 2010
GRoup miNteK
2010 2009 2010 2009 Notes R r R r
Assets
Non-current assets
Property, plant and equipment 11 191,850,928 187,732,163 191,850,928 187,732,163
Intangible assets 12 3,457,152 4,135,480 3,457,152 4,135,480
Investment property 13 - 12,458,808 - 12,458,808
Investment in subsidiary 14 - - 100 100
Long-term loans and advances 15 4,636 85,690 4,636 85,690
total non-current assets 195,312,716 204,412,141 195,312,816 204,412,241
Current assets
Inventory 16 6,538,871 5,088,576 6,538,871 5,088,576
Trade and other receivables 17 60,242,726 82,422,822 60,242,726 78,977,747
Short-term investments 18 222,888,020 136,206,148 222,888,020 136,206,148
Cash and cash equivalents 3,760,522 79,617,943 3,760,522 79,617,943
total Current assets 293,430,139 303,335,489 293,430,139 299,890,414
Total assets 488,742,855 507,747,630 488,742,955 504,302,655
Equity
Revaluation surplus 109,358,306 110,256,095 109,358,306 110,256,095
Retained earnings 232,698,050 230,107,153 193,386,058 191,055,357
total equity 342,056,356 340,363,248 302,744,364 301,311,452
Liabilities
Non-current liabilities
Long-term retirement benefit obligation 22 30,545,000 32,585,000 30,545,000 32,585,000
Financial lease obligation 23 422,532 667,380 422,532 667,380
30,967,532 33,252,380 30,967,532 33,252,380
Current liabilities
Loans and advances from subsidiary 14 - - 39,472,396 35,665,938
Trade and other payables 19 38,980,835 54,773,871 38,820,531 54,714,754
Deferred income 20 76,373,594 78,510,292 76,373,594 78,510,292
Provisions 21 364,538 847,839 364,538 847,839
Current liabilities 115,718,967 134,132,002 155,031,059 169,738,823
Total equity and liabilities 488,742,855 507,747,630 488,742,955 504,302,655
stateMents of financial position at 31 March 2010
A mngomezulu Sakhi SimelaneCEO, Mintek GM: Finance, MintekRandburg, 30 July 2010
61

mintek annual report 2010 Annual Financial Statements and Notes
GRoup miNteK
2010
R
2009
r
2010
R
2009
r Notes
Continuing operations
revenue 2 346,795,197 389,413,133 346,795,197 389,413,133
Other operating income 3 6,049,878 8,130,036 6,049,878 8,130,036
Foreign currency (loss)/gain (3,718,463) 3,466,892 (3,718,463) 3,466,892
Investment income 4 21,895,534 25,270,245 21,532,951 24,088,317
Staff costs (228,709,077) (216,432,816) (228,709,077) (216,432,816)
Other operating expenses 5 (82,975,150) (118,018,857) (82,973,950) (118,018,857)
Finance expenses 6 (3,328,921) (8,545,590) (3,328,921) (8,545,590)
Audit fees 7 (2,556,579) (1,500,734) (2,556,579) (1,500,734)
Fees for services 8 (37,909,467) (30,157,188) (37,909,467) (30,157,188)
depreciation 9 (14,163,772) (15,500,025) (14,163,772) (15,500,025)
Loss on disposal of property, plant and equipment (81,404) (302,908) (81,404) (302,908)
Post-retirement benefit obligation 10 496,520 4,126,351 496,520 4,126,351
Profit before taxation 1,794,295 39,948,539 1,432,912 38,766,611
Taxation 25 (101,187) (330,940) - -
Profit for the year 1,693,108 39,617,599 1,432,912 38,766,611
Financial Statements 2010stateMents of coMprehensive incoMe for the year ended 31 March 2010
62

Annual Financial Statements and Notes mintek annual report 2010
GRoup miNteK
2010
R
2009
r
2010
R
2009
r Notes
Cash flows from operating activities
Cash receipts from customers 210,448,632 338,533,156 207,003,557 315,218,771
Government grant received 165,840,000 135,834,000 165,840,000 135,834,000
Cash paid to suppliers and employees (373,422,451) (361,127,826) (373,421,251) (361,127,826)
Cash generated from operations 29 2,866,181 113,239,330 (577,694) 89,924,945
Interest received 19,283,636 20,135,737 18,921,053 18,953,809
Finance costs (93,668) (191,324) (93,668) (191,324)
Provisions utilised 21 (1,616,568) (1,759,040) (1,616,568) (1,759,040)
Net cash inflow from operating activities 20,439,581 131,424,703 16,633,123 106,928,390
Cash flows from investing activities
Additions to property, plant and equipment 11.1 (25,120,946) (38,586,851) (25,120,946) (38,586,851)
Additions to intangible assets 12 (533,633) (940,319) (533,633) (940,319)
Funding received towards purchasing of property, plant and equipment 11.1 20,381,777 28,425,147 20,381,777 28,425,147
Funding received towards purchasing of intangible assets 12 46,000 179,515 46,000 179,515
Increase in investment deposits (86,681,872) (39,584,714) (86,681,872) (39,584,714)
Net cash outflow from investing activities (91,908,674) (50,507,222) (91,908,674) (50,507,222)
Cash flows from financing activities
Receipts for subsidiary - - 3,806,458 24,496,313
Long-term creditor payments (244,848) (322,923) (244,848) (322,923)
Post-retirement health care - contributions 22 (72,503) (3,860,467) (72,503) (3,860,467)
Post-retirement health care - settlements 22 (4,070,977) (46,147,137) (4,070,977) (46,147,137)
Net cash outflow from financing activities (4,388,328) (50,330,527) (581,870) (25,834,214)
Net (decrease)/increase in cash and cash equivalents
Cash and cash equivalents at beginning of year
Cash and cash equivalents at end of year
(75,857,421) 30,586,954 (75,857,421) 30,586,954
79,617,943 49,030,989 79,617,943 49,030,989
3,760,522 79,617,943 3,760,522 79,617,943
Financial Statements 2010 stateMents of cash floWs for year ended 31 March 2010
63

mintek annual report 2010 Annual Financial Statements and Notes
Retained earnings Revaluation Surplus total
Note R R R
GRoup
Balance as at 31 march 2008 189,591,765 111,153,884 300,745,649
Depreciation on revaluation of buildings 897,789 (897,789) -
Net profit for the year 39,617,599 - 39,617,599
Balance as at 31 march 2009 230,107,153 110,256,095 340,363,248
Depreciation on revaluation of buildings 897,789 (897,789) -
Net profit for the year 1,693,108 - 1,693,108
Balance as at 31 march 2010 232,698,050 109,358,306 342,056,356
miNteK
Balance as at 31 march 2008 151,390,957 111,153,884 262,544,841
Depreciation on revaluation of buildings 897,789 (897,789) -
Net profit for the year 38,766,611 - 38,766,611
Balance as at 31 march 2009 191,055,357 110,256,095 301,311,452
Depreciation on revaluation of buildings 897,789 (897,789) -
Net profit for the year 1,432,912 - 1,432,912
Balance as at 31 march 2010 193,386,058 109,358,306 302,744,364
Financial Statements 2010STATEMENTS OF CHANGES IN NET ASSETS FOR THE YEAR ENDED 31 MARCH 2010
64

Annual Financial Statements and Notes mintek annual report 2010
Notes to the Financial Statements 2010notes to the annual financial stateMents for the year ended 31 March 2010
General information
The Group consists of Mintek, a schedule 3B public entity and Mindev (Pty) Ltd, a wholly-owned subsidiary incorporated in South Africa.
The principal activities of Mintek and its subsidiary (the “Group”) are to undertake research, development and transfer or commercialisation of mineral technology.
1. Significant accounting policies and basis of preparation
The principal accounting policies applied in the preparation of these consolidated financial statements are materially consistent with those of the previous year, unless otherwise stated.
The consolidated financial statements have been prepared on the historical cost basis except for certain properties and financial instruments, which are measured at revalued amounts and fair values respectively, as explained in the accounting policies set out below.
The financial statements have been prepared in accordance with the South African Statements of Generally Accepted Accounting Practice (SAGAAP), and in the manner required by the Public Finance Management Act (PFMA) and Treasury Guidelines.
The Annual Financial Statements are expressed in its functional currency, South African Rands (R).
The financial statements are prepared in conformity with SAGAAP which requires the use of certain critical accounting estimates. There are no areas that would have involved a higher degree of judgment or complexity, or areas where assumptions and estimates are significant to the consolidated financial statements.
1.1 Basis of consolidation
The consolidated financial statements incorporate the financial statements of Mintek and Mindev.
All intragroup transactions, balances, income and expenses are eliminated on consolidation.
1.2 Foreign currency transactions and balances
At the balance sheet date, monetary assets and liabilities denominated in foreign currencies are translated into South African Rand at exchange rates prevailing at the balance sheet date.
Exchange differences arising on the settlement of monetary items, and on the translation of monetary items, are recognised in profit or loss in the period in which they arise.
1.3 investment in mindev
Subsidiary companies are enterprises in which the company holds a long-term equity interest and over which it has the power to control the financial and operating activities of the entities so as to obtain benefits from its activities. Mindev has over the past year been dormant except for the last payment received on a technology loan.
All investments in Mindev are initially recognised at cost less impairment losses. The carrying amount of such investment is reduced to recognise any decline, other than a temporary decline, in the value of the investment. Any carrying value adjustments are charged to the statement of comprehensive income in the period in which they are incurred.
1.4 investment in associates
The results and assets and liabilities of associates are incorporated in these consolidated financial statements using the equity method of accounting.
An associate is an entity in which the group has significant influence and that is neither a subsidiary nor an interest in a joint venture, through participation in the financial and operating policy decisions of the investee, but not control over those policies.
1.5 intangible assets
Intangible assets acquired separately and with finite useful lives are carried at costs less accumulated amortisation and any accumulated impairment losses. Amortisation for intangible assets with finite useful lives is provided on a straight-line basis over their estimated useful lives.
65

mintek annual report 2010 Annual Financial Statements and Notes
Notes to the Financial Statements 2010notes to the annual financial stateMents for the year ended 31 March 2010
Gains or losses arising from derecognition of an intangible asset are measured as the difference between the net disposal proceeds and the carrying amount of the asset and are recognised in the statement of comprehensive income when the asset is derecognised.
The estimated useful lives of the major categories of intangible assets are:
Computer Software: 3-5 years
1.6 Research and development costs
Expenditure on research activities is recognised as an expense in the period in which it is incurred.
An internally-generated intangible asset arising from the Group’s research and development is recognised only if all of the following conditions are met:• An asset is created that can be identified (such as software and new processes);• It is probable that the asset created will generate future economic benefits;• The development cost of the asset can be measured reliably;• It is technically feasible to complete the intangible asset so that it will be available for use or sale;• The ability to use or sell the intangible asset; and,• It is the intention to complete the intangible asset so that it will be available for use or sale.
Where no internally-generated intangible asset can be recognised, development expenditure is recognised as an expense in the period in which it is incurred.
Subsequent to initial recognition, internally-generated intangible assets are reported at cost less accumulated amortisation and accumulated impairment losses, on a straight-line basis over their useful lives.
1.7 impairment
At each balance sheet date, the Group assesses the carrying amounts of its tangible and intangible assets to determine whether there is any indication that those assets have suffered an impairment loss. If the recoverable amount of an asset is estimated to be less than its carrying amount, the carrying amount of the asset is reduced to its recoverable amount. An impairment loss is recognised as an expense immediately, unless the relevant asset is carried at a revalued amount, in which case the impairment loss is treated as revaluation decrease.
Where it is not possible to estimate the recoverable amount for an individual asset, the recoverable amount is determined for the cash-generating unit to which the asset belongs.
In addition, intangible assets with indefinite useful lives, intangible assets not yet available for use and goodwill acquired in a business combination are tested for impairment annually, and whenever there is an indication that they may be impaired.
The recoverable amount is determined as the higher of fair value less costs to sell and value in use. Value in use represents the present value of the future cash flows expected to be derived from an asset (cash-generating unit). The expected future cash flows are discounted to their present value using an appropriate discount rate that reflects current market assessments of the time value of money and the risk specific to the asset for which the future cash flow estimates have not been adjusted.
Where an impairment loss subsequently reverses, the carrying amount of the asset (cash-generating unit) is increased to the revised estimate of its recoverable amount, but so that the increased carrying amount does not exceed the carrying amount that would have been determined had no impairment loss been recognised for the asset (cash-generating unit) in prior years. A reversal of an impairment loss is recognised as income immediately, unless the relevant asset is carried at a revalued amount, in which case the reversal of the impairment loss is treated as a revaluation increase.
1.8 leases
Leases are classified as finance leases whenever the terms of the lease transfer substantially all the risks and rewards associated with ownership of an asset to the lessee. All other leases are classified as operating leases.
The group as a lessor
Rental income from operating leases is recognised in the statement of comprehensive income on a straight-line basis over the term of the relevant lease.
66

Annual Financial Statements and Notes mintek annual report 2010
Notes to the Financial Statements 2010notes to the annual financial stateMents for the year ended 31 March 2010
The group as a lessee
Assets held under finance leases are recognised as assets of the Group at their fair value at the inception of the lease or, if lower, at the present value of the minimum lease payments. The corresponding liability to the lessor is included in the consolidated balance sheet as a finance lease obligation. Lease payments are apportioned between finance charges and reduction of the lease obligation so as to achieve a constant rate of interest on the remaining balance of the liability.
Finance charges are charged directly to profit or loss, unless they are directly attributable to qualifying assets, in which case they are capitalised.
Rentals payable under operating leases are charged to profit or loss on a straight line basis over the term of the relevant lease. Benefits received and receivable as an incentive to enter into an operating lease are recognised as a reduction of rental expense over the lease term on a straight-line basis.
1.9 property, plant and equipment
Property, plant and equipment, other than land and buildings, are stated at cost less any accumulated depreciation, any earmarked grant funding and any accumulated impairment losses. Costs include all directly attributable expenditure incurred in the acquisition, construction and installation of such assets so as to bring them to the location and condition necessary for them to be capable of operating in the manner intended by management.
Land and buildings held for use in the production or supply of goods and services or for administrative purposes are stated in the balance sheet at their revalued amounts, being the fair value at the date of revaluation, less any subsequent accumulated depreciation and subsequent impairment losses.
Land is not depreciated. Properties were initially valued at historical cost. Revaluations are performed every three years by an independent professional valuator, such that the carrying amount does not differ materially from that which would be determined using fair values at the balance sheet date. (Refer Note 11)
Depreciation is provided to write-off the cost or fair value of property, plant and equipment other than land less their estimated residual values on a straight-line basis, over the estimated useful lives. Useful lives and residual values are reviewed and adjusted if appropriate at each balance sheet date.
The carrying values of property, plant and equipment are reviewed for impairment when events or changes in circumstances indicate that the carrying value may not be recoverable. If any such indication exists and when the carrying values exceed the estimated recoverable amount, the assets or cash generating units are written down to their recoverable amount.
Assets held under finance leases are depreciated over their expected useful lives on the same basis as owned assets or, where shorter, the term of the relevant lease.
An item of property, plant and equipment is derecognised upon disposal or when no future economic benefits are expected to arise from the continued use of the asset. Any gain or loss arising on derecognition of the asset (calculated as the difference between the net disposal proceeds and the carrying amount of the item) is included in the statement of comprehensive income in the year in which the item is derecognised.
Any revaluation increase arising on revaluation of land and buildings is credited to the non-distributable reserves, except to the extent that it reverses a revaluation decrease of the same asset previously recognised as an expense, in which case the increase is credited to the statement of comprehensive income to the extent of the decrease previously charged. A decrease that offsets previous revaluation increases of the same asset is charged against the non-distributable reserve.
A decrease in net carrying amount arising on revaluation of an asset is dealt with as an expense to the extent that it exceeds the balance, if any, on the non-distributable reserve relating to a previous revaluation of that asset.
On the subsequent sale or retirement of a revalued asset, the attributable revaluation surplus balance is transferred to retained profits.
At balance sheet date, the difference between depreciation based on the revalued carrying-amount of the asset (the depreciation charged to the statement of comprehensive income) and the depreciation based on the asset’s original cost is transferred from non-distributable reserves to retained earnings.
67

mintek annual report 2010 Annual Financial Statements and Notes
Notes to the Financial Statements 2010notes to the annual financial stateMents for the year ended 31 March 2010
The estimated useful lives of the major categories of property, plant, equipment are:
Buildings 50 yearsPlant 10 yearsEquipment 3 - 10 yearsVehicles 5 yearsFurniture and fittings 5 years
The gains and losses arising on the disposal or retirement of an item of property, plant, equipment and vehicles are determined as the difference between the sales proceeds and the carrying amount of the assets disposed and is recognised in profit and loss.
1.10 investment properties
Investment properties are measured at their fair values using the fair value model. Gains or losses arising from changes in the fair value of investment property are included in profit or loss for the period in which they arise.
An investment property is derecognised upon disposal or when the investment property is permanently withdrawn from use and no future economic benefits are expected from its disposals.
Any gain or loss arising on derecognition of the asset (calculated as the difference between the net disposal proceeds and the carrying amount of the asset) is included in the statement of comprehensive income in the year in which the item is derecognised.
The fair value is determined at balance sheet date by an independent professional valuator based on market evidence of the most recent prices achieved in arms length transactions of similar properties in the same area. (Refer Note 13)
1.11 Employee benefits
The Group operates a number of retirement benefit plans for its employees. These plans include a defined contribution plan and other retirement benefits such as medical aid benefit plans.
A defined contribution plan is a scheme under which the Group pays fixed contributions into a separate entity. The Group has no legal or constructive obligations to pay further contributions if the fund does not hold sufficient assets to pay all employees the benefits relating to employee service in the current and prior periods.
A defined benefit plan is a scheme that is not a defined contribution plan. Typically defined benefit plans define an amount of benefits that an employee will receive on retirement, usually dependent on one or more factors such as age, years of service and compensation.
1.11.1 post-retirement pension obligations
The liability recognised in the statement of financial position in respect of defined benefit pension plans is the present value of the defined benefit obligation at the balance sheet date less the fair value of plan assets, together with adjustments for unrecognised past-service costs. The defined benefit obligation is calculated annually by independent actuaries using the projected unit credit method.
Actuarial gains and losses arising from experience adjustments and changes in actuarial assumptions are charged or credited to equity in the statement of comprehensive income in the period in which they arise.
Past-service costs are recognised immediately in income, unless the changes to the pension plan are conditional on the employees remaining in service for a specified period of time (the vesting period). In this case, the past-service costs are amortised on a straight-line basis over the vesting period.
For defined contribution plans, the Group pays contributions to publicly or privately administered pension insurance plans on a mandatory, contractual or voluntary basis. The Group has no further payment obligations once the contributions have been paid. The contributions are recognised as employee benefit expense when they are due. The liability recognised in the balance sheet in respect of defined benefit pension plans is the present value of the defined benefit obligation at the balance sheet date less the fair value of plan assets, together with adjustments for unrecognised past-service costs. The defined benefit obligation is calculated annually by independent actuaries using the projected unit credit method.
Prepaid contributions are recognised as an asset to the extent that a cash refund or a reduction in the future payments is available.
68

Annual Financial Statements and Notes mintek annual report 2010
Notes to the Financial Statements 2010notes to the annual financial stateMents for the year ended 31 March 2010
1.11.2 post-retirement health care costs
This Group has an obligation to fund the medical aid benefits of all its past employees and dependants of past employees who retired or were in the employment of the Group prior to 31 December 1999. The plan liability is unfunded and fully provided for in the financial statements. The Group uses the projected unit credit actuarial method to determine the present value of its past service cost.
Actuarial gains and losses are recognised in full in the reporting period it relates to and is the excess over the greater of the present value of the past service obligation at the end of the reporting period before deducting the present value of assumed assets at the same date.
Valuations of these obligations are carried out annually by independent, qualified actuaries using appropriate mortality tables, long-term estimates of increases in medical costs and appropriate discount rates. General increases to medical aid contributions were estimated taking into account the projected future changes in the cost of medical services resulting from both inflation and specific changes to medical costs. The obligation calculated assumes that the cross-subsidy of pensioner’s benefits by the active members will continue as at present. If this cross–subsidy were to be removed, it would result in an increased estimated liability.
1.12 inventories
Inventories are stated at the lower of cost or net realisable value. Costs comprise direct materials and, where applicable, direct labour costs and those overheads that have been incurred in bringing the inventories to their present location and condition. Cost is calculated using the weighted average method. Net realisable value represents the estimated selling price in the ordinary course of business less any costs of completion and costs to be incurred in marketing, selling and distribution.
1.13 provisions
Provisions are recognised when the Group has a present obligation as a result of a past event and it is probable that this will result in an outflow of economic benefits and the amount can be reasonably determined.
The Group recognises its obligation for guaranteeing its products and services for periods as stipulated in its contracts with the Group’s customers. (Refer Note 21)
1.14 Financial instruments
Financial instruments recognised on the balance sheet include derivative instruments, investments, investments in debt securities, accounts receivable, cash and cash equivalents, accounts payable and interest-bearing debt. Financial instruments are initially measured at cost including transaction costs when the Group becomes a party to their contractual arrangements. The subsequent measurement of financial instruments is dealt with in the subsequent notes. When the Group can legally do so and the Group intends to settle on a net basis, or simultaneously related positive and negative values of financial instruments are offset within the balance sheet amounts.
1.14.1 derivative instruments
The Group does not use derivative financial instruments including forward rate agreements and forward exchange contracts to hedge its exposure to interest rate and foreign fluctuations. It is the Group’s policy not to hedge its exposure from foreign currency fluctuations, as it does not consider the impact to be significant. It is the policy of the Group not to trade in derivative financial instruments for speculative purposes.
1.14.2 investments
Investments consist of short to long-term money market instruments initially recorded at cost, which is the fair value of the cash placed with the institution. These investments are held-to-maturity financial assets. Interest is accrued using the effective interest rate method and included in the statement of comprehensive income on an accrual basis.
1.14.3 trade and other receivables
Trade and other receivables are recognised initially at fair value and subsequently measured at amortised cost using the effective interest method, less provision for impairment.
A provision for impairment of trade receivables is established when there is objective evidence that the Group will not be able to collect all amounts due according to the original terms of the receivables. Significant financial difficulties of the debtor, probability that the debtor will enter bankruptcy or financial reorganisation, and default or delinquency in payments (more than 30 days overdue) are considered indicators that the trade receivable is impaired.
The amount of the provision is the difference between the asset’s carrying amount and the present value of estimated future cash flows, discounted at the original effective interest rate. The carrying amount of the asset is reduced through the use of a provision account, and
69

mintek annual report 2010 Annual Financial Statements and Notes
Notes to the Financial Statements 2010notes to the annual financial stateMents for the year ended 31 March 2010
the amount of the loss is recognised in the statement of comprehensive income. When a trade receivable is uncollectible, it is written off in the year in which it is identified.
Subsequent recoveries of amounts previously written off are credited in the statement of comprehensive income.
1.14.4 Cash and cash equivalents
Cash and cash equivalents comprise cash on hand and cash at the bank.
The carrying amount of cash is measured at its fair value.
1.14.5 Financial liabilities
Financial liabilities are amortised at their original debt value less principal payments and amortisation. Derivatives are subsequently measured at fair value and gains and losses are included in the statement of comprehensive income for the period.
1.15 Government grants
Grants from Government are recognised at their fair value where there is a reasonable assurance that the grant will be received and the Group will comply with all attached conditions.
Government grants, which are intended to give immediate financial support to the entity, are recognised as income in the period in which they are received.
Government grants relating to costs are deferred and recognised in the statement of comprehensive income over the period necessary to match them with the costs that they are intended to compensate.
Government grants earmarked for specific fixed asset acquisitions are netted-off against the cost value of the fixed asset to the extent of the funds received.
1.16 Revenue recognition
Revenue is recognised when the sale transactions giving rise to such revenue is concluded and risks and rewards of ownership and title pass to the buyer under the terms of the applicable contract and the pricing is fixed and determinable.
Revenue is measured at the fair value of the consideration received or receivable and represents amounts receivable for goods sold and services provided in the normal course of business, net of discounts and sales related taxes.
Revenue from the sale of goods is recognised when the goods are delivered and title has passed.
Revenue arising from the rendering of services is recognised when services are provided. Where the outcome of a commercial work contract can be estimated reliably, revenue and costs are recognised by reference to the stage of completion of the commercial work contract at the balance sheet date, as measured by the proportion that costs incurred for work performed to date bear to the estimated total contract costs, except where this would not be representative of the stage of completion.
Where the outcome of a commercial work contract cannot be estimated reliably, contract revenue is recognised to the extent of contract costs incurred that it is probable will be recoverable. Contract costs are recognised as expenses in the period in which they are incurred.
Advance income arising as result of contracts undertaken in terms of commercial work in respect of invoices raised and paid for in advance but for which no substantial work has been made to justify the recognition of any revenue, is deferred until the income is earned based on the percentage of work completed.
Interest income from a financial asset is accrued on a time basis, by reference to the principal outstanding and at the effective interest rate applicable, which is the rate that exactly discounts the estimated future cash receipts through the expected life of the financial asset to that asset’s net carrying amount.
Revenue arising from licence fees is recognised on an accrual basis in accordance with the terms of the applicable contracts.
Rental income is derived from rental of fixed property and is recognised on an accrual basis in accordance with the substance of the relevant agreements.
1.17 Contracts in progress
Where the outcome of a contract can be estimated reliably, revenue and costs are recognised by reference to the stage of completion of the contract activity at the balance sheet date. The stage of completion is determined by the proportion of contract costs incurred to date in relation to the estimated total contract costs except where this would not be representative of the stage of completion.
70

Annual Financial Statements and Notes mintek annual report 2010
Notes to the Financial Statements 2010notes to the annual financial stateMents for the year ended 31 March 2010
Variations in contract work, claims and incentive payments are included to the extent that they have been agreed to by the customer.
Where the outcome of the contract cannot be estimated reliably, contract revenue is recognised to the extent of contract costs incurred that it is probable will be recoverable. Contract costs are recognised as expenses in the period in which they are incurred. When it is probable that total contract costs will exceed total contract revenue, the expected loss is immediately recognised as an expense to the statement of comprehensive income.
Where contract costs incurred to date plus recognised profits less recognised losses exceed progress billings, the surplus is shown as amounts due from customers for contract work. For contracts where progress billings exceed contract costs incurred to date plus recognised profits less recognised losses, the surplus is shown as amounts due to customers for contract work. Amounts received before the related work is performed are included in the consolidated balance sheet, as a liability, as deferred income. Amounts billed for work performed but not yet paid by the customer are included in the consolidated balance sheet under trade and other receivables.
1.18 taxation
Mintek is exempt from paying Income Tax in terms of section 10(1)cA(i) of the Income Tax Act no 58 of 1962 but registered for VAT. Mindev is registered for Income Tax purposes and is a legal tax paying entity.
The tax currently payable is based on taxable profit for the financial year. Taxable profit differs from profit as reported in the statement of comprehensive income because it excludes items of income or Mindev's liability for current tax is calculated using tax rates that have been enacted or substantively enacted by the balance sheet date. (Refer Note 25)
1.19 irregular, fruitless and wasteful expenditure
Irregular expenditure means expenditure incurred in contravention of, or not in accordance with, a requirement of any applicable legislation, including:• The PFMA; or,• Any provincial legislation providing for procurement procedures in that state-owned entity.
Fruitless and wasteful expenditure means expenditure that was made in vain and could have been avoided had reasonable care been exercised. All irregular, fruitless and wasteful expenditure is charged against income in the period in which it is incurred.
1.20 Financing costs
Financing costs are recognised in the statement of comprehensive income in the period in which they are incurred.
1.21 Changes in accounting policies and disclosures
1.21.1 New amendments adopted by the entity
• IAS 1 (AC101): Presentation of financial statements - effective 1 March 2009.
The entity has presented a statement of comprehensive income. Comparative information has been re-presented so that it is also in conformity with this revised standard.
Other new standards, amendments to standards and interpretations that has been issued by the standards board and are effective to the entity for the period beginning 1 March 2009 are currently not relevant to the current operations of the entity.
1.21.2 Standards, amendments and interpretations to existing standards that are not yet effective
The following standards and amendments to existing standards have been published and are mandatory for accounting periods beginning on or after 1 January 2010, or later periods, and have not been early adopted by Mintek:
• IAS 17 (AC105): Leases - effective 1 January 2010
Deletion of specific guidance regarding classification of leases of land, so as to eliminate inconsistency with the general guidance on lease classification. As a result, leases of land should be classified as either finance or operating, using the general principles of IAS 17.
• IAS 24 (AC126): Related party disclosures - effective 1 January 2011
Simplification of the disclosure requirements for government-related entities; clarification of the definition of a related party.
A number of other new standards, amendments to standards and interpretations that are not yet effective for the year ended 31 March 2010 that have not been dealt with in the financial statements as they are not relevant to the entity's current operations.
71

mintek annual report 2010 Annual Financial Statements and Notes
GRoup miNteK
2010 2009 2010 2009
R r R r
2. ReveNue
Government grants 123,561,047 105,777,683 123,561,047 105,777,683
State Grant 136,637,372 119,152,632 136,637,372 119,152,632
Less:
Portion of grant utilised to acquire fixed assets (10,244,537) (13,374,949) (10,244,537) (13,374,949)
Portion of grant carried over for committed capex purchases (2,831,788) - (2,831,788) -
other revenue streams 223,234,150 283,635,450 223,234,150 283,635,450
commercial 169,718,635 243,045,372 169,718,635 243,045,372
Earmarked 53,515,515 40,590,078 53,515,515 40,590,078
346,795,197 389,413,133 346,795,197 389,413,133
3. otheR opeRAtiNG iNCome
operating income 4,314,338 4,950,555 4,314,338 4,950,555
Library services 36,578 17,098 36,578 17,098
Breach of contract (employees) 3,000 158,487 3,000 158,487
Breach of contract (bursary/learnerships) 1,357,361 2,931,592 1,357,361 2,931,592
Bad debts recovered 64,935 5,098 64,935 5,098
Sundry income 2,852,464 1,838,280 2,852,464 1,838,280
Rental income - properties 1,735,540 1,908,743 1,735,540 1,908,743
investment property - Rental income - 1,270,738 - 1,270,738
6,049,878 8,130,036 6,049,878 8,130,036
4. iNveStmeNt iNCome
Interest earned: fixed deposits 18,772,285 18,564,615 18,772,285 18,564,615
Interest earned: loans to associates 362,583 1,181,928 - -
Interest earned: bank balances 84,590 272,161 84,590 272,161
Interest earned: staff debtors 53,086 117,033 53,086 117,033
Interest earned: trade debtors 11,092 - 11,092 -
Fair value Interest on debtors 2,611,898 5,134,508 2,611,898 5,134,508
21,895,534 25,270,245 21,532,951 24,088,317
5. otheR opeRAtiNG eXpeNSeS
Consumables 28,082,652 47,715,971 28,082,652 47,715,971
General running expenses 44,504,865 59,547,988 44,503,665 59,547,988
Repairs and maintenance 8,090,558 9,516,062 8,090,558 9,516,062
Fair value adjustment - investment property - 898,249 - 898,249
Bad debts written off 921,837 505,642 921,837 505,642
Provision for debtors' impairment 1,282,979 (165,055) 1,282,979 (165,055)
Inventory written down 104,197 - 104,197 -
82,987,088 118,018,857 82,985,888 118,018,857
Notes to the Financial Statements 2010notes to the annual financial stateMents for the year ended 31 March 2010
72

Annual Financial Statements and Notes mintek annual report 2010
6. FiNANCe eXpeNSeS
Interest other - 9,115 - 9,115
Fair value interest on creditors 635,253 1,556,689 635,253 1,556,689
Interest on post-retirement medical obligation 2,600,000 6,797,577 2,600,000 6,797,577
Interest on finance lease 93,668 182,209 93,668 182,209
3,328,921 8,545,590 3,328,921 8,545,590
7. Audit FeeS
Audit fees 2,556,579 1,500,734 2,556,579 1,500,734
2,556,579 1,500,734 2,556,579 1,500,734
8. FeeS FoR SeRviCeS
Consultants 36,204,808 28,189,203 36,204,808 28,189,203
Legal 1,704,659 1,967,985 1,704,659 1,967,985
37,909,467 30,157,188 37,909,467 30,157,188
9. depReCiAtioN
property, plant and equipment
Buildings 1,462,983 1,308,966 1,462,983 1,308,966
plant 2,558,744 2,292,137 2,558,744 2,292,137
Equipment 8,047,635 9,920,497 8,047,635 9,920,497
Vehicles 107,643 107,643 107,643 107,643
Leased assets 488,481 512,671 488,481 512,671
Furniture and fittings 333,622 300,448 333,622 300,448
12,999,108 14,442,362 12,999,108 14,442,362
intangible assets - amortisation
Computer software 1,164,664 1,057,663 1,164,664 1,057,663
14,163,772 15,500,025 14,163,772 15,500,025
10. poSt-RetiRemeNt BeNeFit oBliGAtioNS
Actuarial gain - post-retirement medical obligation (556,520) (4,189,973) (556,520) (4,189,973)
Actuarial loss - pension fund 60,000 63,622 60,000 63,622
(496,520) (4,126,351) (496,520) (4,126,351)
Number of employees 150 166 150 166
GRoup miNteK
2010 2009 2010 2009
R r R r
Notes to the Financial Statements 2010notes to the annual financial stateMents for the year ended 31 March 2010
73

mintek annual report 2010 Annual Financial Statements and Notes
11.1 pRopeRtY, plANt ANd eQuipmeNt
GRoup ANd miNteK 2010 GRoup ANd miNteK 2009
opening Balance
Additions Asset class transfers
Reclass- ification of investment
property
Application of funding to funded
assets
disposals Closing Balance
opening Balance
Additions Asset class transfers
Application of funding to funded
assets
disposals Closing Balance
R R R R R R R R R R R R R
Cost
Land 80,300,908 - - 3,643,200 - - 83,944,108 80,300,908 - - - - 80,300,908
Buildings 59,225,140 79,690 539,540 8,815,608 - (2) 68,659,976 56,156,960 11,641,117 (7,591,267) (981,671) - 59,225,140
plant 40,925,084 7,932 (138,487) - - (18,645) 40,775,884 41,614,440 4,439,084 (138,187) (3,500,716) (1,489,537) 40,925,084
Equipment 102,209,815 23,410,556 119,422 - (20,413,426) (544,659) 104,781,708 91,811,129 22,002,180 13,121,272 (23,936,035) (788,731) 102,209,815
Vehicles 990,580 - - - - - 990,580 990,580 - - - - 990,580
Furniture and fittings 2,763,579 664,234 - - - (11,759) 3,416,054 2,277,909 504,406 - (6,726) (12,010) 2,763,579
finance Leased assets 2,312,644 - - - - (300,396) 2,012,248 2,312,644 - - - - 2,312,644
capital work in progress 536,942 957,382 (519,176) - - - 975,148 5,928,760 - -5,391,818 - - 536,942
289,264,692 25,119,794 1,299 12,458,808 (20,413,426) (875,461) 305,555,707 281,393,330 38,586,787 - (28,425,147) (2,290,278) 289,264,692
opening Current Year
deprec-iation
Asset class transfers
Reclass- ification of investment
property
Application of funding to funded
assets
disposals Closing opening Current Year depreciation
Asset class transfers
Application of funding to funded
assets
disposals Closing
R R R R R R R R R R R R R
Accumulated depreciation
Buildings 12,839,862 1,462,983 2 - - 14,302,847 11,582,593 1,308,966 (51,697) - - 12,839,862
plant 25,230,334 2,558,744 (1,154) - - (15,604) 27,772,320 24,246,180 2,292,137 (21,568) - (1,286,415) 25,230,334
Equipment 59,642,512 8,047,635 - (31,649) (505,425) 67,153,073 50,339,481 9,920,497 72,904 - (690,370) 59,642,512
Vehicles 750,758 107,643 - - - - 858,401 643,115 107,643 - - - 750,758
Furniture and fittings 1,500,938 333,622 - - - (11,337) 1,823,223 1,210,779 300,448 294 - (10,583) 1,500,938
finance Leased assets 1,568,125 488,481 - - - (261,691) 1,794,915 1,055,454 512,671 - - - 1,568,125
101,532,529 12,999,108 (1,152) - (31,649) (794,057) 113,704,779 89,077,602 14,442,362 (67) - (1,987,368) 101,532,529
Fully depreciated assets and funded assets with a total acquisition value of R39 483 261 (2009: R19 948 401) is still in use.
These assets are recorded at R1 in the asset register and are not subject to the annual revaluation.
Notes to the Financial Statements 2010notes to the annual financial stateMents for the year ended 31 March 2010
74
Annual Financial Statements and Notes mintek annual report 2010
Notes to the Financial Statements 2010notes to the annual financial stateMents for the year ended 31 March 2010
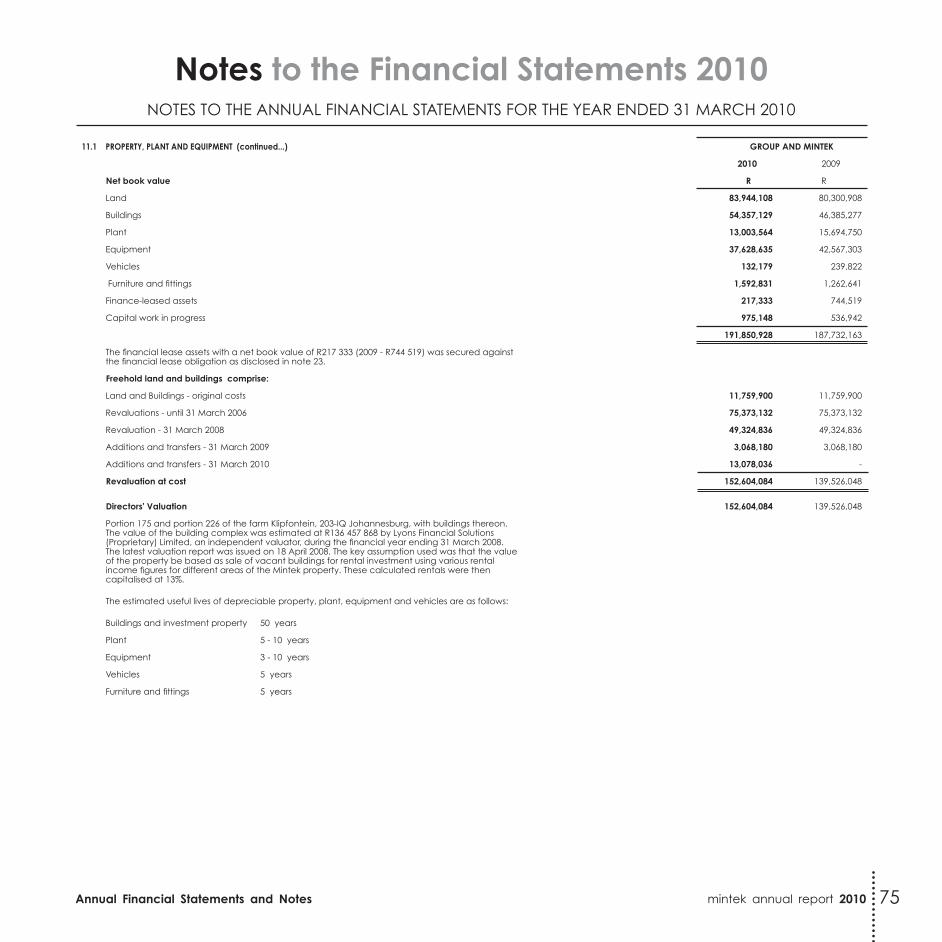
11.1 pRopeRtY, plANt ANd eQuipmeNt (continued...) GRoup ANd miNteK
2010 2009
Net book value R r
Land 83,944,108 80,300,908
Buildings 54,357,129 46,385,277
plant 13,003,564 15,694,750
Equipment 37,628,635 42,567,303
Vehicles 132,179 239,822
Furniture and fittings 1,592,831 1,262,641
Finance-leased assets 217,333 744,519
Capital work in progress 975,148 536,942
191,850,928 187,732,163
The financial lease assets with a net book value of R217 333 (2009 - R744 519) was secured against the financial lease obligation as disclosed in note 23.
Freehold land and buildings comprise:
Land and Buildings - original costs 11,759,900 11,759,900
Revaluations - until 31 March 2006 75,373,132 75,373,132
Revaluation - 31 March 2008 49,324,836 49,324,836
Additions and transfers - 31 March 2009 3,068,180 3,068,180
Additions and transfers - 31 March 2010 13,078,036 -
Revaluation at cost 152,604,084 139,526,048
directors' valuation 152,604,084 139,526,048
Portion 175 and portion 226 of the farm Klipfontein, 203-IQ Johannesburg, with buildings thereon. The value of the building complex was estimated at R136 457 868 by Lyons Financial Solutions (Proprietary) Limited, an independent valuator, during the financial year ending 31 March 2008. The latest valuation report was issued on 18 April 2008. The key assumption used was that the value of the property be based as sale of vacant buildings for rental investment using various rental income figures for different areas of the Mintek property. These calculated rentals were then capitalised at 13%.
The estimated useful lives of depreciable property, plant, equipment and vehicles are as follows:
Buildings and investment property 50 years
plant 5 - 10 years
Equipment 3 - 10 years
Vehicles 5 years
Furniture and fittings 5 years
75

mintek annual report 2010 Annual Financial Statements and Notes
Notes to the Financial Statements 2010notes to the annual financial stateMents for the year ended 31 March 2010
12. iNtANGiBle ASSetS
GRoup ANd miNteK 2010 GRoup ANd miNteK 2009
opening Balance Additions Asset class
transfersApplication of
funding Closing Balance
opening Balance Additions Application
of funding Closing Balance
R R R R R R R R R
Cost
Computer software 6,460,272 533,633 (1,299) (46,000) 6,946,606 5,699,468 940,319 (179,515) 6,460,272
6,460,272 533,633 (1,299) (46,000) 6,946,606 5,699,468 940,319 (179,515) 6,460,272
opening Balance
Current Year Amortisation Adjustment Closing
Balanceopening Balance
Current Year Amortisation Adjustment Closing Balance
R R R R R R R R
Accumulated Amortisation
Computer software 2,324,792 1,164,664 - (2) 3,489,454 1,267,129 1,057,663 - 2,324,792
2,324,792 1,164,664 - (2) 3,489,454 1,267,129 1,057,663 - 2,324,792
value as at 31 march 2010 3,457,152 value as at 31 march 2009 4,135,480
The estimated useful lives of depreciable intangible assets are as follows: 3-5 years
13. iNveStmeNt pRopeRtY
GRoup ANd miNteK 2010 GRoup ANd miNteK 2009
opening Balance
Reversal/ Reclassification
Closing Balance
opening Balance Revaluation Closing
Balance
R R R R R R
Buildings -Billiton 12,458,808 (12,458,808) - 13,357,057 (898,249) 12,458,808
12,458,808 (12,458,808) - 13,357,057 (898,249) 12,458,808
Fair value as at 31 march 2010 - Fair value as at 31 march 2009 12,458,808
Portion of portion 175 of the farm Klipfontein, 203-IQ Johannesburg, with buildings thereon. The value of the building complex was estimated at R12 458 808 by Resurgent Projects (Proprietary) Limited, an independent valuator for the year ended 31 March 2009. The latest valuation report was issued on 30 April 2009. The key assumptions used by the independent valuator were the utilisation of the income capitalisation method based on an average investor's risk rate (13%) and applying additional adjustment due the specialised nature of the property (1%) and the fact that the building is ostensibly vacant (1%). The revised capitalisation rate of 15% was then applied to conservative and competitive rental. This property was reclassified and transferred to property, plant and equipment from 1 April 2009 due to termination of the lease by BHP Billiton.
14.1 iNveStmeNt iN SuBSidiARY
Details of subsidiary are as follows:
Name of subsidiary place of incorporation
portion of ownership
Financial year end
Shares at cost 31 march 2010
Shares at cost 31 march 2009
indebtness 31 march 2010
indebtness 31 march 2009
Mindev (Proprietary) Limited South Africa 100% 31 March 2010 100 100 39,472,396 35,665,938
100 100 39,472,396 35,665,938
Mindev is engaged in the commercialisation of Mintek's patents and technology through the identification of suitable partners to advance such interests by way of direct investments in equity and through joint ventures.
Mintek holds 100% of the issued share capital of Mindev (Proprietary) Limited. The loans granted are unsecured and do not have fixed repayments terms.
14.2 iNveStmeNt iN ASSoCiAteS
SuBSidiARY ASSoCiAte: tollSoRt (pRopRietARY) limited
Tollsort (Proprietary) Limited ceased its operations at the end of September 2004 and as such there are no current financial statements available for Tollsort to provide adequate disclosure. Mindev has included the operating losses from Tollsort (Proprietary) Limited to an amount of R1 193 043 which represents twenty-five percent of Mindev's portion of the loan guarantee made to Standard Bank on behalf of Tollsort (Proprietary) Limited.
The investment was written off in 2010 after African Mineral Exploration Company did not accept the donation of the shares.
76
Annual Financial Statements and Notes mintek annual report 2010
Notes to the Financial Statements 2010notes to the annual financial stateMents for the year ended 31 March 2010
GRoup miNteK
2010 2009 2010 2009
Notes R r R r
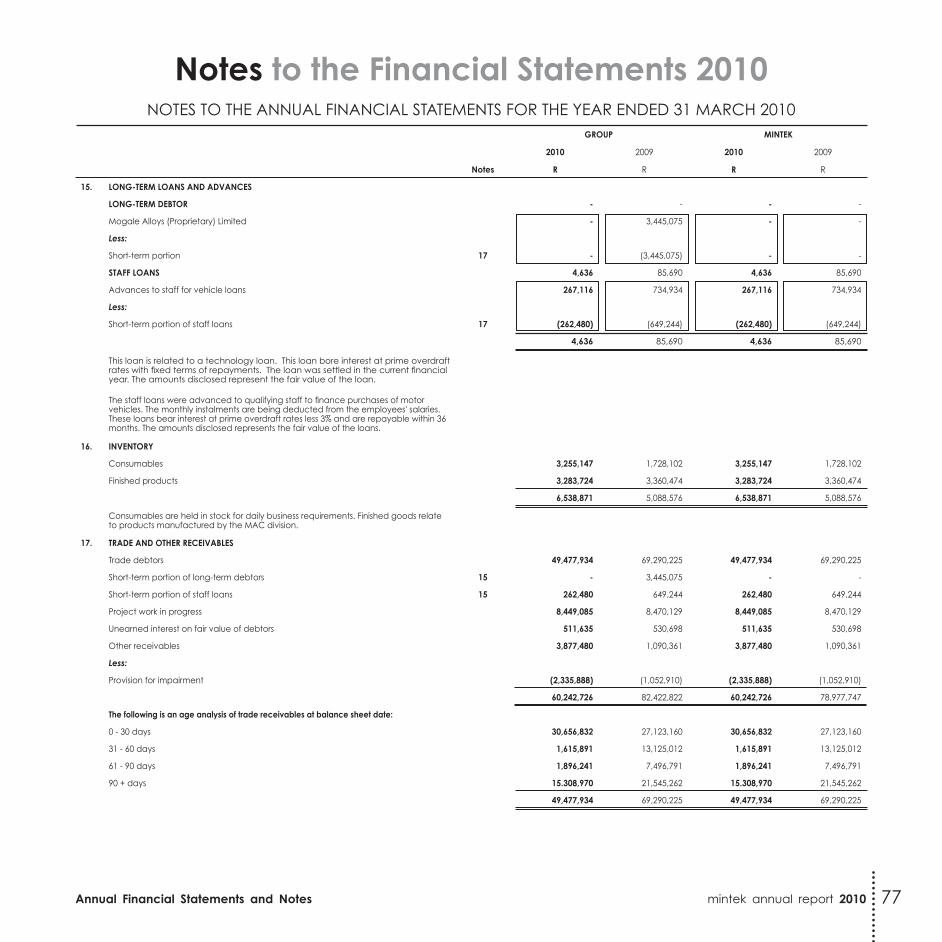
15. loNG-teRm loANS ANd AdvANCeS
loNG-teRm deBtoR - - - -
Mogale Alloys (Proprietary) Limited - 3,445,075 - -
Less:
Short-term portion 17 - (3,445,075) - -
StAFF loANS 4,636 85,690 4,636 85,690
Advances to staff for vehicle loans 267,116 734,934 267,116 734,934
Less:
Short-term portion of staff loans 17 (262,480) (649,244) (262,480) (649,244)
4,636 85,690 4,636 85,690
This loan is related to a technology loan. This loan bore interest at prime overdraft rates with fixed terms of repayments. The loan was settled in the current financial year. The amounts disclosed represent the fair value of the loan.
The staff loans were advanced to qualifying staff to finance purchases of motor vehicles. The monthly instalments are being deducted from the employees' salaries. These loans bear interest at prime overdraft rates less 3% and are repayable within 36 months. The amounts disclosed represents the fair value of the loans.
16. iNveNtoRY
Consumables 3,255,147 1,728,102 3,255,147 1,728,102
Finished products 3,283,724 3,360,474 3,283,724 3,360,474
6,538,871 5,088,576 6,538,871 5,088,576
Consumables are held in stock for daily business requirements. Finished goods relate to products manufactured by the MAC division.
17. tRAde ANd otheR ReCeivABleS
Trade debtors 49,477,934 69,290,225 49,477,934 69,290,225
Short-term portion of long-term debtors 15 - 3,445,075 - -
Short-term portion of staff loans 15 262,480 649,244 262,480 649,244
Project work in progress 8,449,085 8,470,129 8,449,085 8,470,129
Unearned interest on fair value of debtors 511,635 530,698 511,635 530,698
Other receivables 3,877,480 1,090,361 3,877,480 1,090,361
Less:
Provision for impairment (2,335,888) (1,052,910) (2,335,888) (1,052,910)
60,242,726 82,422,822 60,242,726 78,977,747
the following is an age analysis of trade receivables at balance sheet date:
0 - 30 days 30,656,832 27,123,160 30,656,832 27,123,160
31 - 60 days 1,615,891 13,125,012 1,615,891 13,125,012
61 - 90 days 1,896,241 7,496,791 1,896,241 7,496,791
90 + days 15.308,970 21,545,262 15.308,970 21,545,262
49,477,934 69,290,225 49,477,934 69,290,225
77

mintek annual report 2010 Annual Financial Statements and Notes
17. tRAde ANd otheR ReCeivABleS (continued...)
provision for impairment
included in the trade receivable balance are debtors which are past the original expected collection date (past due) at the reporting date, with a carrying amount of R14,721,789 (2009: R8,952,518) for which the company has not provided as there has not been a significant change in credit quality and the amounts are still considered recoverable. The company does not hold any collateral over these balances. The average age of these receivables is 76 days (2009: 100 days). A summarised age analysis of past debtors is set out below.
Ageing of past due but not impaired
60 - 90 days 1,896,241 7,434,945 1,896,241 7,434,945
90 - 120 days 12,825,548 1,517,573 12,825,548 1,517,573
14,721,789 8,952,518 14,721,789 8,952,518
movement in the allowance for doubtful debts
Balance at beginning of the year 1,052,910 1,217,964 1,052,910 1,217,964
Increase / (decrease) in provision 1,282,978 (165,054) 1,282,978 (165,054)
Balance at end of the year 2,335,888 1,052,910 2,335,888 1,052,910
Ageing of impaired trade receivables
60 - 90 days - - - -
90 - 120 days 2,335,888 1,052,910 2,335,888 1,052,910
Balance at end of the year 2,335,888 1,052,910 2,335,888 1,052,910
In determining the recoverability of a trade receivable, the company considers any change in the credit quality of the trade receivable from the date credit was initially granted up to the reporting date. Accordingly, the directors believe that there is no further credit provision required in excess of the allowance for doubtful debts. The company does not hold any collateral over these balances.
18. ShoRt-teRm iNveStmeNtS
Short-term investments 222,888,020 136,206,148 222,888,020 136,206,148
Investments in short-term fixed deposits are held with various reputable financial institutions at market value and interest has been earned at prime overdraft rates less a varied percentage over the year.Fixed investments held with various public financial institutions is partly earmarked as financing for the post-retirement medical aid liability.
19. tRAde ANd otheR pAYABleS
Trade payables 15,717,455 23,457,019 15,717,455 23,457,019
Unpaid interest - creditors (48,143) 290,946 (48,143) 290,946
Salary related payables 3,661,940 1,087,594 3,661,940 1,087,594
Current portion of lease creditor 23 227,929 359,586 227,929 359,586
SA Revenue Services - Other 3,335,608 10,582,837 3,335,608 10,582,837
SA Revenue Services - Income Tax 160,304 59,119 - -
Provision for leave pay 10,380,283 11,157,215 10,380,283 11,157,215
Accruals 5,545,459 7,779,557 5,545,459 7,779,557
38,980,835 54,773,873 38,820,531 54,714,754
The following is an age analysis of the trade and salary payables and accruals at balance sheet date:
0 - 60 days 27,405,512 32,324,170 27,405,512 32,324,170
61 - 90 days 559,441 - 559,441 -
90 + days 247,365 - 247,365 -
28,212,318 32,324,170 28,212,318 32,324,170
The average credit period for purchases is 45 days. Mintek has financial risk management policies to ensure that payables are paid within the credit timelines.
GROUP MINTEK
2010 2009 2010 2009
Notes R R R R
Notes to the Financial Statements 2010notes to the annual financial stateMents for the year ended 31 March 2010
78

Annual Financial Statements and Notes mintek annual report 2010
Notes to the Financial Statements 2010notes to the annual financial stateMents for the year ended 31 March 2010
20. deFeRRed iNCome
Deferred income 59,666,422 59,576,740 59,666,422 59,576,740
Advance client billing (Unearned income) 16,707,172 18,933,552 16,707,172 18,933,552
76,373,594 78,510,292 76,373,594 78,510,292
Deferred income arises as a result of contracts undertaken for several government departments and institutions in respects of amounts received in cash not yet accounted for as revenue.
Advance client billing income arise as a result of contracts undertaken in terms of commercial work where invoices are raised based on work that has not been done. The quantum of cost incurred provides the basis for the level of revenue recognised in the period.
21. pRoviSioNS opening Balance
RAdditional provisions
Rutilised and reversed
RClosing Balance
R
GRoup ANd miNteK
31 march 2010
Product warranties 847,839 1,133,267 (1,616,568) 364,538
847,839 1,133,267 (1,616,568) 364,538
GRoup ANd miNteK
31 march 2009
Product warranties 409,606 2,197,273 (1,759,040) 847,839
409,606 2,197,273 (1,759,040) 847,839
The provision for product warranties is Mintek recognising its probable liability for meeting its obligations in terms of products and services as stipulated in its contracts with its customers.
GROUP MINTEK
2010 2009 2010 2009
R R R R
22. loNG-teRm RetiRemeNt BeNeFit oBliGAtioN
Post-retirement medical aid 29,300,000 31,400,000 29,300,000 31,400,000
Pension benefit liability 1,245,000 1,185,000 1,245,000 1,185,000
long-term retirement benefit obligation 30,545,000 32,585,000 30,545,000 32,585,000
Number of employees members 150 166 150 166
post-retirement medical benefits
The amounts included in the balance sheet arising from Mintek's obligation in respect of post-retirement medical benefits is as follows:
Present value of obligations as at 31 March 2010 29,300,000 31,400,000 29,300,000 31,400,000
Post-retirement benefit obligation
Fixed investments held with various public financial institutions is partly earmarked as financing for the post-retirement medical aid liability. Mintek has not assigned a specific fund to hedge against the post-retirement medical aid liability.
movement in the net liability recognised in the balance sheet
Net-past service benefit liability: Beginning of the year 31,400,000 78,800,000 31,400,000 78,800,000
Interest cost 2,600,000 6,797,577 2,600,000 6,797,577
Contributions paid to service providers (72,503) (3,860,467) (72,503) (3,860,467)
Net actuarial gain (556,520) (4,189,973) (556,520) (4,189,973)
Settlements (4,070,977) (46,147,137) (4,070,977) (46,147,137)
Net-past service benefit liability: End of the year 29,300,000 31,400,000 29,300,000 31,400,000
GROUP MINTEK
2010 2009 2010 2009
R R R R
79

mintek annual report 2010 Annual Financial Statements and Notes
Pension benefit liability
Pension benefits are provided by membership of the Mintek Retirement Fund (MRF) and the Mintek Employees Retirement Fund (MERF).
movement in the net-liability recognised in the balance sheet
Employer liability at beginning of year 1,185,000 1,121,378 1,185,000 1,121,378
Prior year adjustments - 622,622 - 622,622
Payments - (972,000) - (972,000)
Interest costs - 133,000 - 133,000
Actuarial loss 60,000 280,000 60,000 280,000
Net employer liability at end of year 1,245,000 1,185,000 1,245,000 1,185,000
Current cost 60,000 63,622 60,000 63,622
At inception of the Fund a Retirement Reserve was allocated to certain members which will become payable at the time of the members' death or withdrawal. The employer also funds a minimum guaranteed pension for a member who entered the fund as at 1 January 1995. For purpose of calculating the valuation investment returns are expected to exceed salary increases by 3%.
* These payments are made from within the MRF and Mintek has no direct control over it.
Contributions are charged against income in the period in which they are incurred. Contributions so charged were as follows:
MRF and MERF 23,098,815 16,263,908 23,098,815 16,263,908
22. loNG-teRm RetiRemeNt BeNeFit oBliGAtioN (continued...)
Key assumptions
Expected long-term rate of return on plan assets 9.3% 8.5% 9.3% 8.5%
Expected increase in health care costs 7.0% 9.5% 7.0% 9.5%
Amounts recognised in income in respect of the scheme are as follows:
Current cost 2,600,000 - 2,600,000 -
Benefits paid
Contributions paid 72,503 3,860,467 72,503 3,860,467
Expected average remaining life of employees (years) 25 16 25 16
Sensitivity Analysis on past Service Cost
Discount rate increased by 1% p.a. 25,390,000 27,200,000 25,390,000 27,200,000
Discount rate decreased by 1% p.a. 34,180,000 36,700,000 34,180,000 36,700,000
Subsidy inflation increase by 1% p.a. 34,320,000 36,700,000 34,320,000 36,700,000
Subsidy inflation decrease by 1% p.a. 25,220,000 27,100,000 25,220,000 27,100,000
Retirement age 58 32,470,000 34,400,000 32,470,000 34,400,000
Medical cover is provided through a number of different schemes. Post-retirement medical cover in respect of qualifying employees is recognised as an expense over the expected remaining service lives of the relevant employees. The group has an obligation to provide medical benefits to certain pensioners and dependants. These liabilities have been provided in full, calculated on an actuarial basis. The liabilities are unfunded. Periodic valuation of these obligation is carried out by independent actuaries every year, the latest one being 31 March 2010.
GRoup miNteK
2010 2009 2010 2009
R r R r
Notes to the Financial Statements 2010notes to the annual financial stateMents for the year ended 31 March 2010
80

Annual Financial Statements and Notes mintek annual report 2010
23. FiNANCe leASe oBliGAtioNS
Amount due for finance lease obligation 650,461 1,026,966 650,461 1,026,966
Less current portion of finance lease obligation 19 (227,929) (359,586) (227,929) (359,586)
422,532 667,380 422,532 667,380
As of 31 March 2010 the aggregate amounts of minimum lease payments and the related imputed interest under capitalised lease contracts payable in each of the next five fiscal years and thereafter are as follows:
Capitalised leased assets
Payable within one year 227,929 359,586 227,929 359,586
Payable within 2-5 years 422,532 667,380 422,532 667,380
Net lease liability 650,461 1,026,966 650,461 1,026,966
It is the Group's policy to lease certain of its equipment. The Group has an equipment finance lease agreement with an average lease term of four to six years. All leases are on a fixed repayment basis and no arrangements have been entered into for contingent rental repayments.
24. CoNtiNGeNt liABilitieS
legal liabilities
Mintek has disputed employment termination contracts with former employees, the aggregate of which is not expected to exceed R831 750. Of this amount only one case of R348 000 is considered probable. The other cases that are making up the difference are not necessarily probable but are being reviewed.
Guarantees
Cessions in favour of ABSA Bank for R3 159 736 to meet requirements for credit card and other banking facilities has been registered. Cessions in favour of ABSA Bank for R3 176 860 to facilitate performance guarantees for customers has been registered.
25. tAXAtioN
South African normal taxation 101,187 330,940 - -
101,187 330,940 - -
No provision for income tax was made for the company as Mintek is exempted in terms of section 10(1)(CA)(i) of the Income Tax Act, No. 58 of 1962. Tax provisions and liabilities are with respect to Mindev and its associated companies and are payable through those entities.The effective tax rate payable by Mindev was 28% (2009 - 28%).
26. CommitmeNtS
Capital expenditure 14,000,058 1,265,985 14,000,058 1,265,985
Authorised and contracted for
operational expenditure
Contracted for 7,788,092 446,335 7,788,092 446,335
The future aggregate minimum lease payments under operating leases are as follows:
Future operating lease charges for vehicles
- Payable within one year 293,094 463,118 293,094 463,118
- Payable between two and five years - 308,744 - 308,744
293,094 771,862 293,094 771,862
Future operating lease charges for office equipment
- Payable within one year 120,224 233,183 120,224 233,183
- Payable between two and five years 30,258 164,061 30,258 164,061
150,482 397,244 150,482 397,244
The Group leases vehicles and office equipment under operating lease agreements. The lease terms are between 3 and 5 years.
Notes to the Financial Statements 2010notes to the annual financial stateMents for the year ended 31 March 2010
GRoup miNteK
2010 2009 2010 2009
Notes R r R r
81

mintek annual report 2010 Annual Financial Statements and Notes
Notes to the Financial Statements 2010notes to the annual financial stateMents for the year ended 31 March 2010
27. FRuitleSS, wASteFul ANd iRReGulAR eXpeNdituRe
Fraud and theft expenses 4,494 - 4,494 -
The amount relates to fraudulent travel claims for interviewees. The employee concerned has been dismissed and the matter has been reported to the SAPS.
28. FiFA woRld Cup eXpeNdituRe
Mintek did not incur any expenditure in relation to the World Cup.
29. CASh GeNeRAted FRom opeRAtioNS
profit from operations 1,693,108 39,617,599 1,432,912 38,766,611
Adjusted for:
Investment income 4 (21,895,534) (25,270,245) (21,532,951) (24,088,317)
Finance expenses 6 3,328,921 8,545,590 3,328,921 8,545,590
Investment property fair value adjustment 5 - 898,249 - 898,249
depreciation 9 14,163,772 15,500,025 14,163,772 15,500,025
Fair Value adjustment - debtors 4 2,611,898 5,134,508 2,611,898 5,134,508
Fair Value adjustment - creditors 6 (635,253) (1,556,689) (635,253) (1,556,689)
Loss on disposal of fixed assets 69,467 302,908 69,467 302,908
Provisions raised 21 1,133,267 2,197,273 1,133,267 2,197,273
Reversal of impairment loss on trade receivables 17 - (168,055) - (168,055)
Impairment loss recognised on trade receivables 17 1,282,978 - 1,282,978 -
Decrease in post-retirement obligations 10 (496,520) (4,126,351) (496,520) (4,126,351)
Taxation 25 101,187 330,940 - -
Cash flow from operations before working capital changes 1,357,291 41,408,752 1,358,491 41,408,752
working capital changes: 1,403,586 71,830,578 (2,041,489) 48,516,193
Decrease in loans 81,054 4,088,543 81,054 705,543
Increase in inventories (1,450,295) (2,140,748) (1,450,295) (2,140,748)
Decrease in receivables 20,803,749 28,405,191 17,358,674 8,473,806
(Decrease)/increase in payables (15,894,223) 3,015,041 (15,894,223) 3,015,041
(Decrease)/increase in deferred income (2,136,699) 38,462,551 (2,136,699) 38,462,551
2,760,877 113,239,330 (682,998) 89,924,945
GRoup miNteK
2010 2009 2010 2008
Notes R r R r
82
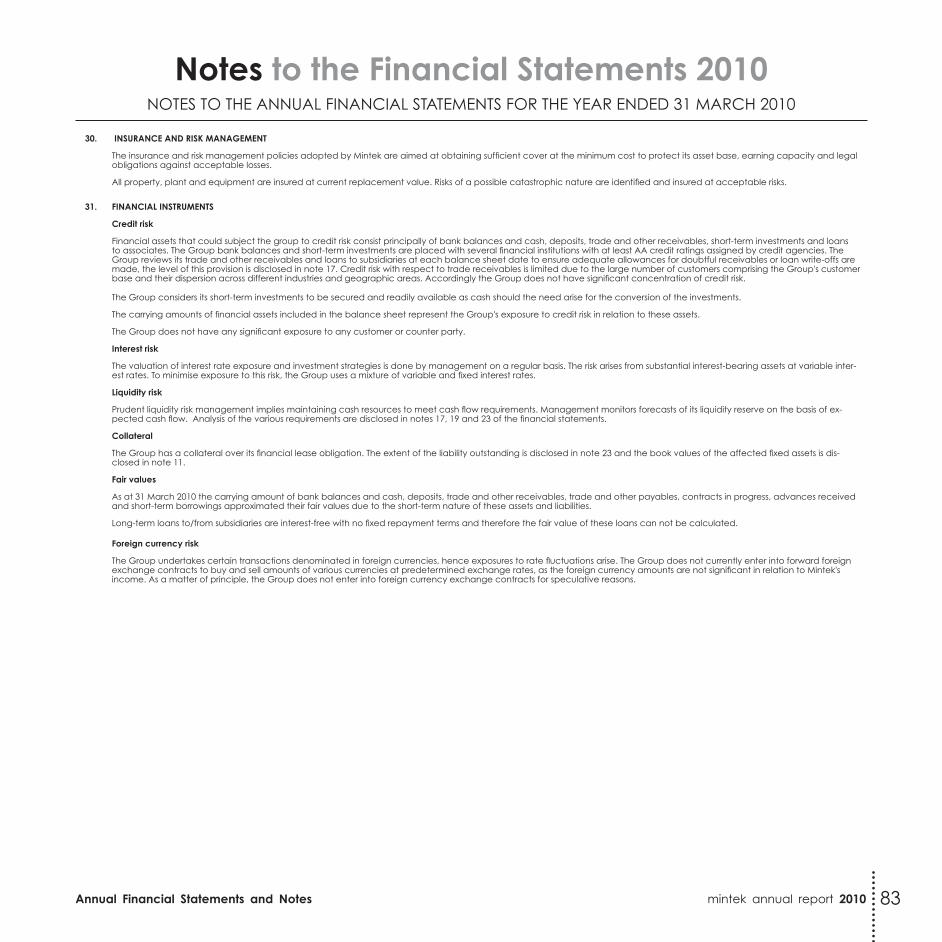
Annual Financial Statements and Notes mintek annual report 2010
Notes to the Financial Statements 2010notes to the annual financial stateMents for the year ended 31 March 2010
83
30. iNSuRANCe ANd RiSK mANAGemeNt
The insurance and risk management policies adopted by Mintek are aimed at obtaining sufficient cover at the minimum cost to protect its asset base, earning capacity and legal obligations against acceptable losses.
All property, plant and equipment are insured at current replacement value. Risks of a possible catastrophic nature are identified and insured at acceptable risks.
31. FiNANCiAl iNStRumeNtS
Credit risk
Financial assets that could subject the group to credit risk consist principally of bank balances and cash, deposits, trade and other receivables, short-term investments and loans to associates. The Group bank balances and short-term investments are placed with several financial institutions with at least AA credit ratings assigned by credit agencies. The Group reviews its trade and other receivables and loans to subsidiaries at each balance sheet date to ensure adequate allowances for doubtful receivables or loan write-offs are made, the level of this provision is disclosed in note 17. Credit risk with respect to trade receivables is limited due to the large number of customers comprising the Group's customer base and their dispersion across different industries and geographic areas. Accordingly the Group does not have significant concentration of credit risk.
The Group considers its short-term investments to be secured and readily available as cash should the need arise for the conversion of the investments.
The carrying amounts of financial assets included in the balance sheet represent the Group's exposure to credit risk in relation to these assets.
The Group does not have any significant exposure to any customer or counter party.
interest risk
The valuation of interest rate exposure and investment strategies is done by management on a regular basis. The risk arises from substantial interest-bearing assets at variable inter-est rates. To minimise exposure to this risk, the Group uses a mixture of variable and fixed interest rates.
liquidity risk
Prudent liquidity risk management implies maintaining cash resources to meet cash flow requirements. Management monitors forecasts of its liquidity reserve on the basis of ex-pected cash flow. Analysis of the various requirements are disclosed in notes 17, 19 and 23 of the financial statements.
Collateral
The Group has a collateral over its financial lease obligation. The extent of the liability outstanding is disclosed in note 23 and the book values of the affected fixed assets is dis-closed in note 11.
Fair values
As at 31 March 2010 the carrying amount of bank balances and cash, deposits, trade and other receivables, trade and other payables, contracts in progress, advances received and short-term borrowings approximated their fair values due to the short-term nature of these assets and liabilities.
Long-term loans to/from subsidiaries are interest-free with no fixed repayment terms and therefore the fair value of these loans can not be calculated.
Foreign currency risk
The Group undertakes certain transactions denominated in foreign currencies, hence exposures to rate fluctuations arise. The Group does not currently enter into forward foreign exchange contracts to buy and sell amounts of various currencies at predetermined exchange rates, as the foreign currency amounts are not significant in relation to Mintek's income. As a matter of principle, the Group does not enter into foreign currency exchange contracts for speculative reasons.

mintek annual report 2010 Annual Financial Statements and Notes
Notes to the Financial Statements 2010notes to the annual financial stateMents for the year ended 31 March 2010
2010R
2009r
Entity Basic Salary Fees for services as director
performance bonus and other
expenses
totAl total
32. BoARd memBeRS ANd eXeCutive mANAGemeNt RemuNeRAtioN
executive management
miNteK
Mr MA Mngomezulu Mintek 1,559,250 - 54,404 1,613,654 1,417,500
dr rl paul Mintek 1,390,895 - 54,406 1,445,301 1,270,500
dr M Motuku Mintek 1,135,591 - 44,350 1,179,941 1,037,295
Mr p craven Mintek (Appointed 01/10/2009) 529,650 - - 529,650 -
Mr as simelane Mintek 1,039,500 - 22,894 1,062,394 720,000
Ms R Bopape Mintek 1,034,550 - 25,960 1,060,510 780,714
total executive management 6,689,436 - 202,014 6,891,450 5,226,009
Non-executive management Board members
miNteK end of term: 28 February 2010
Mr H Motaung (Chairperson) Anooraq Resources Corporation - 33,718 - 33,718 35,752
Ms L Mhlabeni Bali Engineering Consultants - 24,640 - 24,640 26,330
Mr Ma ntilane Kwane Minerals Processing - 40,320 - 40,320 35,840
Dr J Bredell Minerals Development Consultant - 45,571 - 45,571 44,250
Mr R Havenstein Norilsk Nickel International - 68,888 - 68,888 54,138
Ms G Mthethwa Standard Bank - 26,880 - 26,880 30,260
Mr B Mbewu Self Employed - 8,960 - 8,960 13,440
Ms N Lila Astute Intellect - 17,920 - 17,920 8,960
Mr B Sehlapelo Rand Water Services (Pty) Ltd - 40,466 - 40,466 -
Mr M Mphomela Rand Merchant Bank - 57,688 - 57,688 63,858
miNdev
Mr MA Mngomezulu (Chairperson) Mintek - - - - -
Mr M Mphomela Rand Merchant Bank - - - - -
Mr as simelane Mintek - - - - -
Mr GL Rapoo sadpMr - - - - -
dr rl paul Mintek - - - - -
6,689,436 365,051 202,014 7,256,501 5,538,837
the following directors were appointed to the mintek Board on 1 march 2010:
Mr M Mphomela (Chairperson) Rand Merchant Bank
Mrs N Qunta ZBQ Consulting
Mr P Streng Independent management consultant
Adv D Block Masana Technologies (Pty) Ltd
Mr p White Venmyn Techno Consulting Firm
Ms S Sekgobela Mugamusi Consulting
Ms S Maja Jacques vd Merwe Maja Inc
Ms J Ndlovu NPC Cimpor (Pty) Ltd
Mr M Mabuza Department of Mineral Resources
Mr t nell Department of Mineral Resources
84
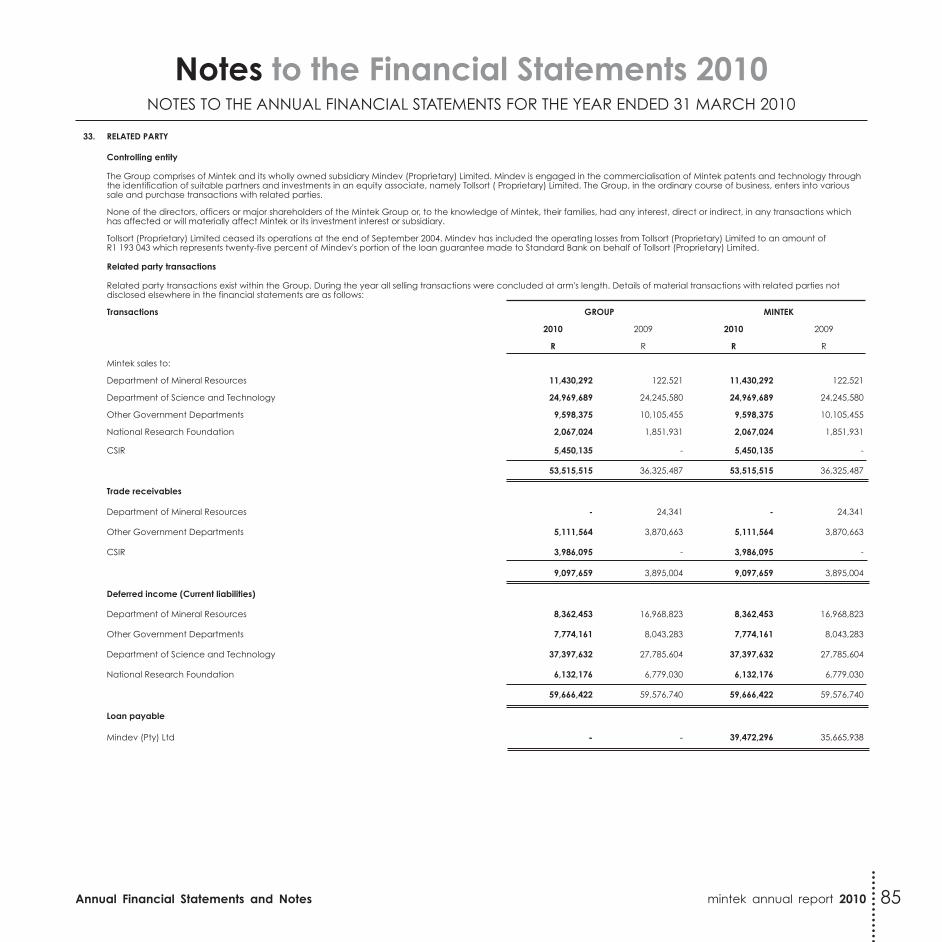
Annual Financial Statements and Notes mintek annual report 2010
Notes to the Financial Statements 2010notes to the annual financial stateMents for the year ended 31 March 2010
33. RelAted pARtY
Controlling entity
The Group comprises of Mintek and its wholly owned subsidiary Mindev (Proprietary) Limited. Mindev is engaged in the commercialisation of Mintek patents and technology through the identification of suitable partners and investments in an equity associate, namely Tollsort ( Proprietary) Limited. The Group, in the ordinary course of business, enters into various sale and purchase transactions with related parties.
None of the directors, officers or major shareholders of the Mintek Group or, to the knowledge of Mintek, their families, had any interest, direct or indirect, in any transactions which has affected or will materially affect Mintek or its investment interest or subsidiary.
Tollsort (Proprietary) Limited ceased its operations at the end of September 2004. Mindev has included the operating losses from Tollsort (Proprietary) Limited to an amount of R1 193 043 which represents twenty-five percent of Mindev's portion of the loan guarantee made to Standard Bank on behalf of Tollsort (Proprietary) Limited.
Related party transactions
Related party transactions exist within the Group. During the year all selling transactions were concluded at arm's length. Details of material transactions with related parties not disclosed elsewhere in the financial statements are as follows:
transactions GRoup miNteK
2010 2009 2010 2009
R r R r
Mintek sales to:
Department of Mineral Resources 11,430,292 122,521 11,430,292 122,521
Department of Science and Technology 24,969,689 24,245,580 24,969,689 24,245,580
Other Government Departments 9,598,375 10,105,455 9,598,375 10,105,455
National Research Foundation 2,067,024 1,851,931 2,067,024 1,851,931
csir 5,450,135 - 5,450,135 -
53,515,515 36,325,487 53,515,515 36,325,487
trade receivables
Department of Mineral Resources - 24,341 - 24,341
Other Government Departments 5,111,564 3,870,663 5,111,564 3,870,663
csir 3,986,095 - 3,986,095 -
9,097,659 3,895,004 9,097,659 3,895,004
deferred income (Current liabilities)
Department of Mineral Resources 8,362,453 16,968,823 8,362,453 16,968,823
Other Government Departments 7,774,161 8,043,283 7,774,161 8,043,283
Department of Science and Technology 37,397,632 27,785,604 37,397,632 27,785,604
National Research Foundation 6,132,176 6,779,030 6,132,176 6,779,030
59,666,422 59,576,740 59,666,422 59,576,740
loan payable
Mindev (Pty) Ltd - - 39,472,296 35,665,938
85

mintek annual report 2010 Annual Financial Statements and Notes
Notes
–––––––––––––––––––––––––––––––––––––––––––––––––––––––––––––––––––––––––––––––––––––––––––––––––––––––––––––––––––––––
–––––––––––––––––––––––––––––––––––––––––––––––––––––––––––––––––––––––––––––––––––––––––––––––––––––––––––––––––––––––
–––––––––––––––––––––––––––––––––––––––––––––––––––––––––––––––––––––––––––––––––––––––––––––––––––––––––––––––––––––––
–––––––––––––––––––––––––––––––––––––––––––––––––––––––––––––––––––––––––––––––––––––––––––––––––––––––––––––––––––––––
–––––––––––––––––––––––––––––––––––––––––––––––––––––––––––––––––––––––––––––––––––––––––––––––––––––––––––––––––––––––
–––––––––––––––––––––––––––––––––––––––––––––––––––––––––––––––––––––––––––––––––––––––––––––––––––––––––––––––––––––––
–––––––––––––––––––––––––––––––––––––––––––––––––––––––––––––––––––––––––––––––––––––––––––––––––––––––––––––––––––––––
–––––––––––––––––––––––––––––––––––––––––––––––––––––––––––––––––––––––––––––––––––––––––––––––––––––––––––––––––––––––
–––––––––––––––––––––––––––––––––––––––––––––––––––––––––––––––––––––––––––––––––––––––––––––––––––––––––––––––––––––––
–––––––––––––––––––––––––––––––––––––––––––––––––––––––––––––––––––––––––––––––––––––––––––––––––––––––––––––––––––––––
–––––––––––––––––––––––––––––––––––––––––––––––––––––––––––––––––––––––––––––––––––––––––––––––––––––––––––––––––––––––
–––––––––––––––––––––––––––––––––––––––––––––––––––––––––––––––––––––––––––––––––––––––––––––––––––––––––––––––––––––––
–––––––––––––––––––––––––––––––––––––––––––––––––––––––––––––––––––––––––––––––––––––––––––––––––––––––––––––––––––––––
–––––––––––––––––––––––––––––––––––––––––––––––––––––––––––––––––––––––––––––––––––––––––––––––––––––––––––––––––––––––
–––––––––––––––––––––––––––––––––––––––––––––––––––––––––––––––––––––––––––––––––––––––––––––––––––––––––––––––––––––––
–––––––––––––––––––––––––––––––––––––––––––––––––––––––––––––––––––––––––––––––––––––––––––––––––––––––––––––––––––––––
–––––––––––––––––––––––––––––––––––––––––––––––––––––––––––––––––––––––––––––––––––––––––––––––––––––––––––––––––––––––
–––––––––––––––––––––––––––––––––––––––––––––––––––––––––––––––––––––––––––––––––––––––––––––––––––––––––––––––––––––––
–––––––––––––––––––––––––––––––––––––––––––––––––––––––––––––––––––––––––––––––––––––––––––––––––––––––––––––––––––––––
–––––––––––––––––––––––––––––––––––––––––––––––––––––––––––––––––––––––––––––––––––––––––––––––––––––––––––––––––––––––
–––––––––––––––––––––––––––––––––––––––––––––––––––––––––––––––––––––––––––––––––––––––––––––––––––––––––––––––––––––––