contents volume xviii number 1 - iris consortium · newsletter i ncorporated research institutions...
TRANSCRIPT

NEWSLETTER
I N C O R P O R A T E D R E S E A R C H I N S T I T U T I O N S F O R S E I S M O L O G Y
CONTENTSSPRING/SUMMER 1999
V O L U M E X V I I I ■ N U M B E R 1
1Planet Earth On-Line
2Live Seismograms from the NetCharles Hutt and Harold Bolton
5The IDA Near Real-Time System
Peter Davis, et al
7Virtual Seismic Networks
Frank Vernon and Terry Wallace
9Building Support for the Geosciences
David Applegate
11Congressional Natural Hazards Caucus
12Avalanche Hazards in Khibiny Massif
Pavel Chernouss, et al
14New Format for the IRIS Workshop
16Seismologists Learning to Teach the
Teachers E&O Workshop
17Teach For America Intern at IRIS
Bella Desai
18IRIS Brings Seismology to Capitol Hill,
COSMOS
19Agreement Signed on US Russian
Cooperation
20IRIS/USGS Expand Museum Program
21USArray Workshop
22Bannergram, Staff News
23Interesting Seismograms
2412th Annual IRIS Workshop
Calendar, New Members
Planet Earth On-Line
10 min
Low-cost, high-bandwidth, globalcommunication systems are ushering ina new era for seismology. We nowdesign personal global data streams,assemble virtual seismic networks, andanalyze local ground motion in real-timefrom across the planet. Networkoperators remotely monitor datacollection and, with only a fewkeystrokes, can re-center the mass on aseismometer buried within a vaultthousands of miles away. In museumsand classrooms, students watch seismicwaves propagate around the world asinteractive global seismicity mapsinform them of earthquakes withinminutes of their occurrence.
This IRIS Newsletter features articles
that describe real-time data systems andseveral of their applications. In manyways, these articles mark the change ofemphasis in our data-driven sciencefrom collection to selection. The nextgeneration of seismologists will haveglobal data available in real-time atnominal cost. Many researchers neednever know (nor for that matterparticularly care) about the mechanics ofhow data are being collected andtransmitted, let alone how the stationsare installed, operated and maintained.For them, the new challenge will be thecoherent integration and use of thesevast and continually evolving streams ofsensor data. ■
KIV BHZ ∆=10° Mw=7.4
Real-time data are collected at Toro Peak in southern California from remote seismicstations using radio telemetry for PASSCAL Broadband Array tests and the ANZABroadband Seismic Network operations. The data are sent through the Internet using themicrowave link shown in the photo. [photo: G. Offield]

IRIS NEWSLETTER2
Live seismic data are now available onthe Internet. Both Data CollectionCenters of the Global SeismographicNetwork (GSN) have developed nearreal-time servers that make data fromGSN stations directly available. Bothtypes of data servers are known by theiracronyms:
LISS - Live Internet Seismic Serverwas developed by the USGSAlbuquerque Seismological Laboratory(ASL);
NRTS - Near Real-Time System wasdeveloped by the University ofCalifornia, San Diego (see followingarticle).
Although this article concentrates onthe LISS, NRTS has similarfunctionality.
Seismographic NetworksASL currently operates about 75 GSN
stations and the UCSD IDA groupapproximately 33 GSN stations. Both ofthese numbers are growing as the two
groups expect to complete theinstallation of a total of about 150 GSNstations over the next 2–3 years. Thiswill complete the installation phase ofthe GSN, developed by IRIS. (Figure 2)
Near real-time data are now availablefrom many of these GSN stations. TheLISS operating at ASL currently collectsdata from 36 GSN stations (Figure 2).The data from these stations can beobtained from the LISS in raw digital
Live Seismograms from the NetCharles R. Hutt and Harold BoltonUSGS Albuquerque Seismological Laboratory
form (miniSEED) and are displayed atthe LISS web site as heliplots coveringthe past 24 hours. The number ofstations with near real-time data isincreasing as connections to stations viathe Internet and satellite links becomemore widely available. There are alsoplans to include near real-time data viathe LISS from the US National SeismicNetwork (USNSN) stations in the nearfuture.
Figure 1. The 24-hour seismogramwas plotted from 1 sample-per-secondseismic data from the GSN station atScott Base, Antarctica (SBA) collectedin near real-time by the LISS runningat ASL. The regional Mb 4.6 event, seenon the plot, occurred near the BallenyIslands on July 6, 1999, at a distanceof 16.2 degrees.
Figure 2. The ASL LISS currently provides data from 36 stations of the GSN (plotted as red circles). Data fromChinese and Russian stations are received by the LISSes in their respective countries, and then served to theprimary LISS located in Albuquerque, New Mexico (as indicated by the heavy green and blue lines).
GARLZH
LBTB
LPAZ
PLCA
VNDA
BJT
KMI
ANTO
BILL
CHTO
CMB
CORGRFO
KBS
KEV
KIP
MA2
MAKZ
NWAO
PAB
PAS
PMG
SNZO
TBT
TIXI
TSUM
ULN
YAK
ABKTCMLA
JTS
MSVF
TAU
BGCA
SBA
HRV
MAJO
DBIC
ENH
HIAMDJ
ANMO
CASY
CCM
DPC
INCN
KONO
PMSA
SPA
RAYNHKT
PTGA
SSPA
TUCPFO
WRAB
QIZ
BDFB
BOSACPUP
LSA
WMQ
XANSSE
FURI
ADK
AFI
COLA
CTAO
DAV
GNI
GUMO
HNR
KIEV
KMBO
LSZ
LVC
PET
PTCNRAR
SDV
SFJ
SJG
TATO
TEIG WAKE
XMAS
YSSAAK
ALE
ARU
ASCN
BORG
BRVK
COCO
EFI
ERM
ESKFFCKDAK
KIV
KURK
LVZ
MSEY
NIL
NNA
NRIL
OBN
RPN
SHEL
SUR
TLY
HOPE
PAYG
DWPF
JOHN
ABUS
MBWA
MSKU
MACQ
QUE
Socorro
TarawaMBAR
SACV
KWAJ
Funafuti
NDI
KAPI
TRQA
BEC BHL
KOD
KOWA
Kanton
RAO
Midway
POHA
RCBR
TRIN
TRIS
SAML
WSAR
Jos
DGAR
Abha
Nukuhiva
SHIO
Madagascar
Sri Lanka
installed (118)
planned (33)
stations to ASL LISS
Moscow LISS to ASL LISS
Beijing LISS to ASL LISS
20:00:00-
21:00:00-
22:00:00-
23:00:00-
00:00:00-
01:00:00-
02:00:00-
03:00:00-
04:00:00-
05:00:00-
06:00:00-
07:00:00-
08:00:00-
09:00:00-
10:00:00-
11:00:00-
12:00:00-
13:00:00-
14:00:00-
15:00:00-
16:00:00-
17:00:00-
18:00:00-
19:00:00-
SBA ,LHZ Start Date:07/05/99 Filter: band-pass Displacement Magnification = 3000.00 @ 0.020 Hz
10.0min 20.0min 30.0min 40.0min 50.0min

3SPRING/SUMMER 1999
What can you use it for?Internet Surfing: Heliplots (as in
Figure 1) emulate the appearance andfunction of the old standard WWSSNphotographic paper seismograms thatwere created by writing a trace ofmagnified ground motion on a longpiece of paper wrapped around a drum.These heliplots are available on the LISSwebsite to anyone with access to acomputer, a web browser and Internetconnectivity. In addition to theseismograms, the LISS website includesa world map showing the earthquakes ofthe past 24 hours as reported by theUSGS National Earthquake InformationCenter (NEIC). The heliplots and mapare updated every 30 minutes, so it iseasy for seismo-surfers to keepthemselves informed of the world’scurrent seismicity. There are also linksto other informative earthquake orientedwebsites, including sites displaying liveseismic data and related educationalmaterial.
Seismic displays: The LISS providesa near real-time (1-3 minutes delay)source of waveforms from GSN stations
for several public seismic displays thatare connected via the Internet. Theseseismic displays are generally equippedwith an Internet connected computer andreceive live data streams from severalGSN stations that are displayed onanalog drum recorders. Such a displaystrikes a chord with the general public,since a live moving pen on a drumrecorder seems more like a “real”seismogram than a computer display.IRIS and ASL have, in fact, cooperatedin producing several of these displays,one of which is operating at IRISheadquarters (Figure 4). Similar displaysare operating at the New MexicoMuseum of Natural History and Sciencein Albuquerque, NM, at the AmericanMuseum of Natural History in NewYork, and at the Carnegie Museum ofNatural History in Pittsburgh. Inaddition, the first seismic displaydeveloped and built as a cooperativeeffort by IRIS, ASL, and the NMMuseum of Natural History, is currentlytouring the US as part of the FranklinInstitute’s “Powers of Nature” exhibit.
Professional use: The use of LISSdata by seismologists is still in itsinfancy. It is not exactly clear whatdirections may ensue, but many practicalapplications are in use or in
development. The LISS has the ability tomaintain a large number of simultaneousconnections, to any or all of the datacollected. This allows for anunprecedented amount of versatility inthe projects that are designed to use thedata. An obvious application is real-timemonitoring. These data can provide forquicker and more accurate earthquakesource information and are ideal forhazards groups such as the USGS NEICand tsunami warning centers. Alreadybeing constructed are ‘virtual networks’(see related article on page 7) whereworkers are able to collect data from asubset of stations that enhance thespecific goals of individual projects.These data are also proving to beinvaluable to the individual Data Centersas a tool to enhance quality control(QC). Rather than having to wait(sometimes up to several months) fordata tapes to be mailed from stations inthe field to the Data Centers, the QCanalyst can, at a glance, detect overtproblems (Figure 5) at a station andinitiate the appropriate correctiveactions.
How the LISS works, How toconnect
The primary LISS site is currently
Figure 4. Robert Woodward discusses global seismicity using a LISS seismicity displayat IRIS headquarters in Washington, DC.
Figure 3. ASL field engineer NeilZiegelman performs maintenance on radiotelemetry equipment at Vanda Station,Antarctica (VNDA). This type of telemetrylink is commonly used at remotely locatedseismograph stations to send real-timedata to the LISS.

IRIS NEWSLETTER4
Figure 5. “Thumbnails” from six of the 35 heliplots available on the LISSwebsite. Stations HKT and KONO have transients that can be easilyidentified by a quality control analyst scanning for station problems.
From the seismic station.....
through the lines.....
via the Internet Service Provider.....
through the Internet.....
through the LiveInternet Seismic Server.....
again through the Internet.....
L I S S Figure 6. Data flowdiagram of the LISSconnected to a singleseismograph stationwhile serving severalusers. The LISS actuallyconnects to manystations simultaneously,as well as to other LISSservers.
IU/GUMO, Guam, Marianas Islands IU/HKT, Hockley, Texas, USA
IU/INCN, Inchon, Republic of Korea IU/KBS, Ny-Alesund, Spitzbergen, Norway
IU/KIP, Kipapa, Hawaii, USA IU/KONO, Kongsberg, Norway
located at the USGS AlbuquerqueSeismological Laboratory. ASL willsoon have a secondary LISS located atanother site with much higherbandwidth capabilities. This changeshould be transparent to the user. Themost basic feature of the LISS is that itcan provide many users access to thedata from a single station while only theLISS server is actually connected to thestation (Figure 6). As the LISS canconnect to many stations, its versatilityis greatly enhanced. Currently, the LISSpulls over the entire set of channels froma station which has beenpreprogrammed by the station’s softwareengineers. If one LISS site were to die, itwould then be possible to turn onanother LISS site to gather each station’sdata without having to reprogram eachindividual station. The broadbandminiSEED data records from eachstation typically contain about 30seconds of data. Each station has arecord ready to be pulled about 120seconds after the initial record isacquired. The LISS servers thenbroadcast these records to any clientsconnected to the LISS server.
All the software and documentation
that are necessary to connect to the LISSare free and available to anyone willingto download them from the LISS website. Currently the software has beentested on Solaris and FreeBSD platformsand, if demand warrants, could beextended to various Linux and perhapsWindows systems. Users are encouragedto use and adapt the software in anymanner they wish.
Future DirectionsSecond generation LISS software is
currently under active development atASL. A primary goal of thisdevelopment will be to have redundantLISS servers that can be automaticallyswitched for load leveling and as backupshould there be a primary failure. Alsoto be included are the use of user ‘selectfiles’ for choosing which stations andchannels are to be received. Otherfeatures will be driven by user requests.The LISS source code will be freelymade available for development work.
Additional information on LISSconnectivity and current globalseismicity can be found at the LISSwebsite http://www.liss.org ■

5SPRING/SUMMER 1999
For the past seven years, theUniversity of California, San Diego(UCSD) has used the Near Real-TimeSystem (NRTS), a body of softwaredeveloped at UCSD with funding fromIRIS, to collect IRIS GSN data over theInternet.
In September 1992, NRTS was firstused to telemeter data from theKislovodsk miniarray back to a datacollection center in Obninsk, Russia,and from there to San Diego. Since then,the software has undergone majorrevision and has matured into a robustsystem, capable of acquiring data from avariety of stations. NRTS is now used bythe US Geological Survey’s NationalEarthquake Information Center (NEIC),and the National Oceanographic andAtmospheric Administration’s (NOAA)tsunami warning centers in Hawaii andAlaska. The IRIS Data ManagementSystem requests made by the IRISSPYDER® system use NRTS’ AutoDRMcapabilities. The two IRIS/IDA stationsthat are also part of the ComprehensiveTest Ban Treaty’s InternationalMonitoring System use NRTS totransmit data to the US National DataCenter.
From its inception, NRTS wasdesigned to meet the many requirementsfor communicating with a GSN station,where “last kilometer problems” oftencome into play. For example, power isusually at a premium at GSN stations,and can be subject to frequentinterruption. Also, the bandwidth of thecircuit to the station is often severelylimited, and high communications costscreate the need to reduce connectivity tominutes per day. With these and similarrestrictions in mind, NRTS was designedaround the TCP/IP protocol suite, andcan thus use the Internet and itsassociated long-haultelecommunications infrastructure. Bybasing data acquisition and transmissionupon the TCP/IP protocols, the task ofconnecting to a remote location isreduced to the task of bringing theInternet to the station — a problem for
which a multitude of off-the-shelfsolutions exist. Additionally, theapplication software on both ends of thecircuit can be designed without the needfor knowledge of the details of thecommunications links. As aconsequence, the NRTS datamanagement framework permits robustrecovery from interruptions incommunications links. The problem ofrestricted bandwidth is alleviated bynode replication at NRTS hubs locatedwhere connectivity is less bandwidth-limited. All of these features are veryimportant at GSN stations, which tend tolie at the very periphery of the cyberuniverse.
System ArchitectureNRTS runs on any POSIX compliant
UNIX platform. It accepts a data streamas input, writes the data to a disk loop,and then services data requests from thatloop. Once in the loop, data may berequested, either in segments orcontinuous feeds, in miniSEED, SAC,CSS, or GSE (Alpha or Beta) formats. Ifa continuous feed is requested, thosedata are passed on with little additionallatency. Each packet input to the NRTShost is immediately output by the datarequest server.
A computer running NRTS may beconfigured either as a station host or as ahub. A station host accepts data locallyand stores that data within a disk loop ofconfigurable length, and is limited onlyby disk size. The host’s data server cansatisfy requests for any data retainedwithin that disk loop. At many UCSD
The IDA Near Real-Time SystemPeter Davis, Jon Berger and David ChavezUniversity of California, San Diego
Figure 1. Schematic representation of IDA NRTS architecture. Data acquired fromgeophysical instruments at a field site are fed into a Solaris workstation. From there, thedata are available to users on the Internet by way of TCP/IP connections via telephonecircuit (either analog or digital) used in either dialup or continuous (leased) mode;satellites; or on a local area network (LAN). Once on the Internet, data can be easilyaccessed by individual investigators and organizations interested in monitoring seismicactivity in near real-time. The system is actively used by agencies charged with monitoringearthquakes, clandestine nuclear tests, and tsunamis.
NRTSWorkstation
NRTSWorkstation
NRTSWorkstation
NRTSWorkstation
GSNSeismometer Site GSN Station
Processor Site Satellite
Leased Circuit
Dial-Up Circuit
Local Area
Network
Internet
Point of Presence
Point of Presence IndividualUsers via SPYDER®
IDA Data &Operations Center
IMSIDC & NDC
IRIS DMC
USGS NEIC
NOAA TWC
GSN StationProcessor Site
GSN StationProcessor Site
GSNSeismometer Site
GSNSeismometer Site
GSNSeismometer Site GSN Station
Processor Site
Point of Presence
NRTS

IRIS NEWSLETTER6
stations, the loop length is set to oneweek. A hub accepts data feeds from oneor more station hosts. The hub’s dataserver may accept all or part of the dataavailable from a given station host. Theamount of data transferred to the hub isonly limited by the bandwidth and costof the circuit connecting host and hub.There are currently three principleNRTS hubs: one at UCSD in La Jolla,one in Obninsk, Russia, and one at IRISin Washington, DC.
Data requests may be directed toeither a hub or a station host. If a hub’sdata server cannot satisfy a request fromdata already transmitted to that hub, thenthe data server consults an ordered list ofNRTS data servers known to handle datafrom the desired station(s). Theseservers may be running either on thestation host or on other NRTS hubs. Incases where the circuit to a station isbandwidth limited, it is desirable todirect data requests first to the hub ratherthan the station. All requests that can besatisfied at the hub are fulfilled fromthere, and only those data not at the hubalready are requested from the station,thus avoiding duplicate transmission.
The KDAK ExampleTelemetry from station KDAK
(Kodiak, Alaska) is a good example ofhow the NRTS manages data retrievalover a complicated circuit. All datarecorded on site are sent via spreadspectrum radio to a PC at a Coast Guard Figure 3. IRIS/IDA seismographic stations currently accessible via telemetry.
retransmits to a number of users aroundthe world over the Internet. Thebandwidth of the telephone leg isinsufficient to transfer all data recordedat KDAK. Data not routinely transmittedover the above circuit may be obtainedby sending AutoDRM requests to IDA’sserver, idahub.ucsd.edu. NRTS retrievesthe requested segments and returns datato the user via email.
Future Developments for NRTSDuring the coming year, IDA expects
to establish telemetry to most of theremaining stations not yet reachable. Asadditional circuits are put in place andthe bandwidth of existing circuits arebroadened, more data than ever will beavailable in near real-time. Thearchitecture of NRTS is well designed toaccommodate these changes. In fact, afew changes to configuration files are allthat are required to convert managementof a bandwidth-limited dialup circuitthat handles only low rate and state-of-health data to one that handlescontinuously the entire output of a GSNstation.
As projects such as EarthScope maketelemetered data even easier for end-users to access, the node replicatingcapabilities of NRTS will come into fullplay. Data will be routinely copied tonodes that can be easily accessed thuspreventing the circuit over “the lastkilometer” from being overwhelmedservicing requests. The recipient neednever know (nor care) about the detailsof how data are retrieved from a stationhalfway around the world. ■
“The recipientneed never know(nor care) about thedetails of how dataare retrieved from astation halfwayaround the world.”
facility three kilometers away. NRTSrunning on the PC stores the data andretransmits a portion over a leased
Figure 2. Photo of IRIS/IDA station KDAK (Kodiak, Alaska), one of the US IMSseismic stations. In the foreground is a cover to protect the wellhead, and in back, ashed housing recording equipment. The round object in front of the shed is a tankcontaining propane fuel for the station’s thermoelectric generator.
telephone line to a Sun workstation atthe University of Alaska, Fairbanks.NRTS on that Sun stores the data and

7SPRING/SUMMER 1999
Seismology is an opportunisticscience where many significant resultsare achieved by a combination of goodplanning and hard work coupled with astrong component of serendipity. Takefor example the recent results generatedby data recorded from the deep Mw =7.6 Fiji and Mw = 8.2 Boliviaearthquakes and associated aftershocksin 1994. The high quality data recorded
Virtual Seismic NetworksFrank Vernon, University of California, San Diego andTerry Wallace, University of Arizona
border event, which did not have a co-located PASSCAL experiment, was wellrecorded by the Kyrgyz BroadbandNetwork (KNET), the Austrian NationalSeismic Network, and many otherregional and national networks. Many ofthe data for these events were availablealmost immediately through the Internet.
GSN stations routinely send data backto their respective data collection centers
the Aleutian Islands) to the smaller localnetworks, such as the Montana RegionalSeismic Network.
The most striking characteristic of theglobal distribution of seismographicstations is it’s incredibly heterogeneousnature. Many agencies from manycountries support the complexinfrastructure. These different agencieshave missions that range from seismic
VirtualSeismicNetwork
(VSN)ORB
21.52 S, 176.52 W, 145.6 km,11/15/1998 (319) 2:44:12.000, 5.70 mb Fiji
Global Events Recorded on VSN
180˚ 210˚ 240˚ 270˚ 300˚ 330˚ 0˚ 30˚ 60˚ 90˚ 120˚ 150˚ 180˚
-60˚
-30˚
0˚
30˚
60˚
ANZA / CalNev
ORB merge
Alaska
KNET
KIMB
IDA / ASL
ANZAUCBUNR
Real-Time Integration ofSeismic Data from Regional Seismic Networks, Arrays,
and the IRIS GlobalSeismic Network
ANZA
KNET
KIMB
ALASKA
GSN
ALASKA
IDA
ASL
ANZAUCBUNR
ANZA
UCB
UNR
KNET
KIMB
20° E 25°
25° S
40°
72° E 74° 76° 78°
42°
44° N
30°
30°
200 km
200 km
Events from CA-NV, centered at 37:-117
Events from KNET, centered at AAK
Events from Alaska, centered at 60:-150
Events from Kimberley, centered at BB18
ANZAORB
KNETORB
GSNORB
AlaskaORB
KIMBORB
CalNevORB
LISS/NRTS real-time GSN stationsGSN stations for future inclusion
KNET
ANZA
ALASKA
BRTT dbpick: new fiji1_unaligned.ps vernon Thu Dec 3 15:07:57 1998Filter: 1.0 LP, Amp: Auto
02:50:00.0001998319
02:52:00.0001998319
02:54:00.0001998319
02:56:00.0001998319
02:58:00.0001998319
03:00:00.0001998319
03:02:00.0001998319
03:04:00.0001998319
CTAO BHZTAU BHZKIP BHZ
GUMO BHZMGOD SHZTATO BHZ
PET BHZYSS BHZSOL HHZRDM HHZ
LVA2 HHZCRY HHZBZN HHZFRD HHZSND HHZ
KNW HHZPFO HHZ
INCN BHZKBM SHZTUC BHZCDD SHZAUH SHZOPT SHZCNP SHZ
ILS SHZINE SHZ
NNL SHZRDN SHZNKA SHZCKL SHZSSN SHZKAI SHZCFI SHZ
KNK SHZVLZ SHZSSP SHZCUT SHZSCM SHZKLU SHZPNL SHZGLB SHZBAL SHZ
ANMO BHZCTG SHZ
PLCA BHZKTH SHZPAX SHZ
BWN SHZWRH SHZTMW SHZDOT SHZ
COLA BHZMDM SHZPPD SHZFYU SHZNNA BHZULN BHZ
LPAZ BHZULHL BHZBDFB BHZTKM2 BHZ
KBK BHZCHM BHZUCH BHZAAK BHZUSP BHZ
EKS2 BHZAML BHZSUR BHZ
BOSA BHZLBTB BHZ
KONO BHZBGCA BHZ
AN
ZA
KN
ET
AL
ASK
A
BRTT dbpick: new fiji1_aligned.ps vernon Thu Dec 3 15:05:22 1998Filter: 1.0 LP, Amp: Auto
02:44:00.0001998319
02:44:10.0001998319
02:44:20.0001998319
02:44:30.0001998319
02:44:40.0001998319
02:44:50.0001998319
CTAO BHZTAU BHZKIP BHZ
GUMO BHZMGOD SHZTATO BHZ
PET BHZYSS BHZ
INCN BHZ
TUC BHZ
ANMO BHZ
PLCA BHZ
COLA BHZ
NNA BHZULN BHZ
LPAZ BHZ
BDFB BHZTKM2 BHZ
KBK BHZCHM BHZUCH BHZAAK BHZUSP BHZ
EKS2 BHZAML BHZSUR BHZ
BOSA BHZLBTB BHZ
KONO BHZBGCA BHZ
02:44:00.0001998319
02:44:10.0001998319
02:44:20.0001998319
02:44:30.0001998319
02:44:40.0001998319
02:44:50.0001998319
CTAO BHZTAU BHZKIP BHZ
GUMO BHZMGOD SHZTATO BHZ
PET BHZYSS BHZSOL HHZRDM HHZ
LVA2 HHZCRY HHZBZN HHZFRD HHZSND HHZ
KNW HHZPFO HHZ
SOL HHZRDM HHZ
LVA2 HHZCRY HHZBZN HHZFRD HHZSND HHZ
KNW HHZPFO HHZ
SOL HHZRDM HHZ
LVA2 HHZCRY HHZBZN HHZFRD HHZSND HHZ
KNW HHZPFO HHZ
INCN BHZ
TUC BHZ
ANMO BHZ
PLCA BHZ
COLA BHZ
CDD SHZAUH SHZOPT SHZCNP SHZ
ILS SHZINE SHZ
NNL SHZRDN SHZNKA SHZCKL SHZSSN SHZKAI SHZCFI SHZ
KNK SHZVLZ SHZSSP SHZCUT SHZSCM SHZKLU SHZPNL SHZGLB SHZBAL SHZ
KTH SHZPAX SHZ
BWN SHZWRH SHZTMW SHZDOT SHZ
CDD SHZAUH SHZOPT SHZCNP SHZ
ILS SHZINE SHZ
NNL SHZRDN SHZNKA SHZCKL SHZSSN SHZKAI SHZCFI SHZ
KNK SHZVLZ SHZSSP SHZCUT SHZSCM SHZKLU SHZPNL SHZGLB SHZBAL SHZ
KTH SHZPAX SHZ
BWN SHZWRH SHZTMW SHZDOT SHZ
KBM SHZ
CDD SHZAUH SHZOPT SHZCNP SHZ
ILS SHZINE SHZ
NNL SHZRDN SHZNKA SHZCKL SHZSSN SHZKAI SHZCFI SHZ
KNK SHZVLZ SHZSSP SHZCUT SHZSCM SHZKLU SHZPNL SHZGLB SHZBAL SHZ
CTG SHZ
KTH SHZPAX SHZ
BWN SHZWRH SHZTMW SHZDOT SHZ
MDM SHZPPD SHZFYU SHZNNA BHZULN BHZ
LPAZ BHZULHL BHZBDFB BHZTKM2 BHZ
KBK BHZCHM BHZUCH BHZAAK BHZUSP BHZ
EKS2 BHZAML BHZSUR BHZ
BOSA BHZLBTB BHZ
KONO BHZBGCA BHZ
Figure 1. A feasibility testto collect data from sevendifferent regional andglobal seismic networksand integrate them into a“Virtual Seismic Network”.Maps on the left showstation locations with thename of each network. Datafrom each network areprocessed to produceepicentral locations whichare shown on the maps onthe right. Collatedseismograms from anearthquake near Fiji,recorded on the VSN, areshown on the twowaveform plots in the lowerright.
by the permanent IRIS GSN stationswas certainly caused by good planning,while the fortuitous recording by localPASSCAL experiments was by virtue ofa lot of luck.
The GSN and PASSCAL datasetscurrently provide most of the broadbanddata used in seismological research,although this situation will be evolvingin the future as data from permanentregional and national broadband stationsbecome more widely available. The1999 deep Mw = 7.1 Russia-China
in San Diego and Albuquerque using theNRTS and LISS real-time data deliverysystems. The GSN currently includesfacilities in more than 80 countries. On anational scale, twenty-three IRISmember universities, along with theUSGS, operate real-time regionalseismic networks in every seismicallyactive region in the United States (http://www.cnss.org). These networks rangefrom the large aperture University ofAlaska network (with nearly 300stations covering all of Alaska including
monitoring to detailed hazardassessment at local levels. They are allunited, however, by the data they collect.
The transmission of real-time datafrom seismic field stations to a primarydata collection center is being done in avariety of ways according to eachnetwork’s specific mission and based onunique hardware, communicationsystems, number of stations, and arealcoverage requirements. While eachindividual network may have differentmissions and use different types of
IRIS NEWSLETTER8
equipment, all network data centers haveone thing in common: access to theInternet. With this existinginfrastructure, we can now consider theintegration of all accessible real-timedata.
Starting at the end of 1998, weconducted a feasibility test for real-timedata integration from multiple disparateseismic networks to create a “VirtualSeismic Network” (VSN). In the test,data from the IRIS GSN network, thePASSCAL Broadband Array, four USregional networks (University of Alaska,UC Berkeley, UC San Diego, andUniversity of Nevada, Reno), and theKyrgyzstan National BroadbandNetwork were integrated into onecommon data processing system (Figure1). This test successfully demonstratedthat over 150 seismic stations fromseven different primary data collectioncenters could be accessed through theInternet and processed in real-time. Thelevel of processing accomplished duringthe test included: data assembly,automated phase picking, event location,and display of event location andmagnitude information. In a paralleldevelopment, the USGS at Golden hasdeveloped their “Virtual Data Logger”as a mechanism to use real-time datafrom many network data sources to buildtheir global catalog.
The VSN is ushering in a new era inseismology where global data areavailable to any researcher in real-timeat nominal cost. But, how will the “real-time” era change seismology? The mostimmediate impact is thatindividual researcherswill be able to designexperiments which willbe able to maximizeexisting resources. Forexample, if a scientist isinterested in operating aportable experiment inChile, they can constructtheir own virtual networkfrom the global inventoryof stations thatmaximizes the monitoring capability forthat region of interest. Individualresearchers can also receive continuousdata streams (not event segmented),which means that new discoveries willbe made which in the past would have
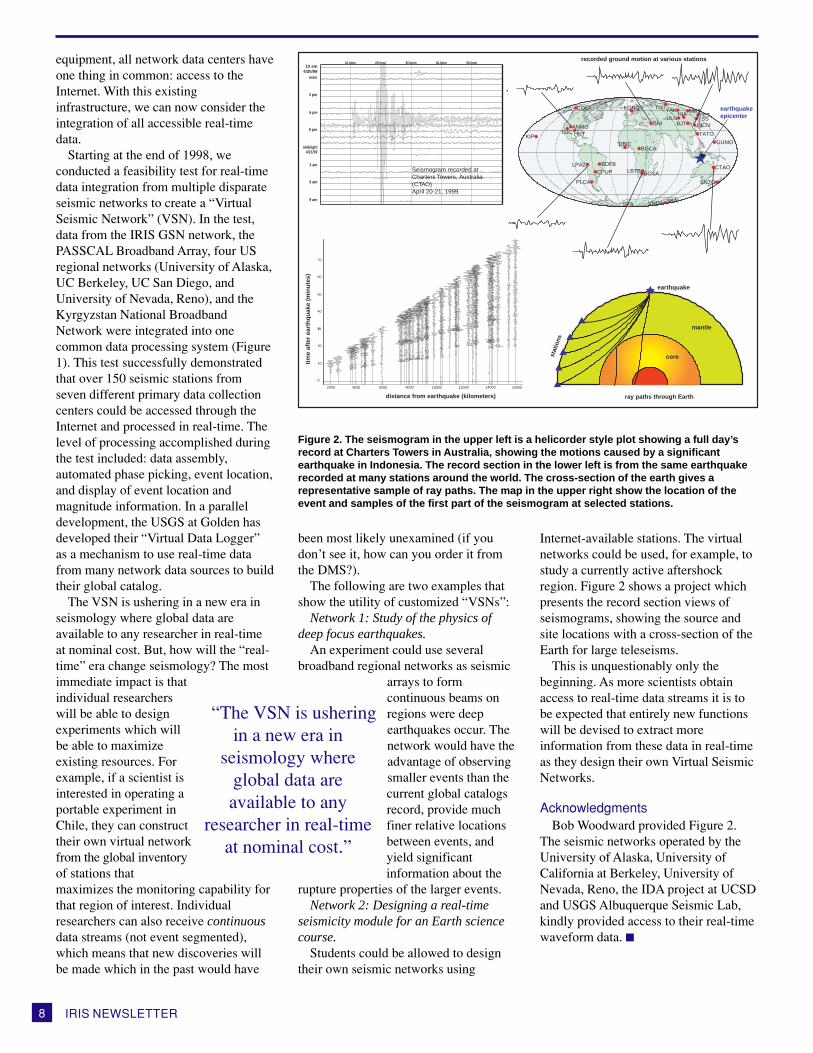
Figure 2. The seismogram in the upper left is a helicorder style plot showing a full day’srecord at Charters Towers in Australia, showing the motions caused by a significantearthquake in Indonesia. The record section in the lower left is from the same earthquakerecorded at many stations around the world. The cross-section of the earth gives arepresentative sample of ray paths. The map in the upper right show the location of theevent and samples of the first part of the seismogram at selected stations.
BJT
KIP
HIA
ANMO
COLA
GNIULN
INCN
YAK
LBTBLPAZ
PLCA
VNDA
BDFB
BOSACPUP
BGCA
SBA
DBIC
MA2PET
YSS
KONO
TATOTUC
GUMO
SNZO
HKT
SPA
CTAO
TIXI
noon
9 pm
10.0min 20.0min 30.0min 40.0min 50.0min
Seismogram recorded atCharters Towers, Australia (CTAO)April 20-21, 1999
distance from earthquake (kilometers)
tim
e af
ter
eart
hq
uak
e (m
inu
tes)
ray paths through Earth
earthquake
stat
ions
mantle
core
recorded ground motion at various stations
earthquakeepicenter
160001400012000100008000600040002000
10 am4/20/99
3 pm
6 pm
midnight4/21/99
3 am
6 am
9 am
70
60
50
40
30
20
10
0
been most likely unexamined (if youdon’t see it, how can you order it fromthe DMS?).
The following are two examples thatshow the utility of customized “VSNs”:
Network 1: Study of the physics ofdeep focus earthquakes.
An experiment could use severalbroadband regional networks as seismic
arrays to formcontinuous beams onregions were deepearthquakes occur. Thenetwork would have theadvantage of observingsmaller events than thecurrent global catalogsrecord, provide muchfiner relative locationsbetween events, andyield significantinformation about the
rupture properties of the larger events.Network 2: Designing a real-time
seismicity module for an Earth sciencecourse.
Students could be allowed to designtheir own seismic networks using
Internet-available stations. The virtualnetworks could be used, for example, tostudy a currently active aftershockregion. Figure 2 shows a project whichpresents the record section views ofseismograms, showing the source andsite locations with a cross-section of theEarth for large teleseisms.
This is unquestionably only thebeginning. As more scientists obtainaccess to real-time data streams it is tobe expected that entirely new functionswill be devised to extract moreinformation from these data in real-timeas they design their own Virtual SeismicNetworks.
AcknowledgmentsBob Woodward provided Figure 2.
The seismic networks operated by theUniversity of Alaska, University ofCalifornia at Berkeley, University ofNevada, Reno, the IDA project at UCSDand USGS Albuquerque Seismic Lab,kindly provided access to their real-timewaveform data. ■
“The VSN is usheringin a new era in
seismology whereglobal data areavailable to any
researcher in real-timeat nominal cost.”

9SPRING/SUMMER 1999
Scientists are well practiced inpresenting a strong rationale for theirresearch when competing for grants,making the case for why the research isimportant and how it will advance thestate of knowledge in their field. Theyare much less practiced at providing thepublic, and particularly their electedrepresentatives, with a similarlyconvincing case for funding the agenciesthat distribute those grants.
Science enjoys broad public supportbased on a general perception that it hashelped bring about improved quality oflife. That support, however, is as shallowas it is broad, and cannot be relied uponwhen science must compete with manyother worthy programs for scarce dollarswhen federal budgets are tight. If publicsupport is to continue and hopefullygrow, scientists must work with partnersin industry and government to putforward focused and convincingrationales for why their researchimproves people’s lives.
An inherent strength of thegeosciences is the direct relevance to awide range of resource, environmental,and natural hazard-related issues thataffect people’s everyday lives. And yet,geoscientists have fallen behind theircounterparts in other disciplines in theirability to attract federal support. Inparticular, funding for the principalgeoscience agency in the federalgovernment — the US GeologicalSurvey (USGS) — has lagged behindthat of other science agencies in recentyears.
To change this situation, geoscientistsneed to hone their arguments for thepolitical arena with the same care thatthey do in their research proposals.Perhaps the most promising rationalethat geoscientists can use is naturalhazard mitigation, an area where thecosts are high and the potential benefitsfrom geoscience research are great.
Political Rationales for ScienceSince the second World War,
economic growth, human health, andnational security have been the basis forjustifying federal science. Since the endof the Cold War, however, nationalsecurity has faded as the dominantrationale, replaced by human health. Alook at the percentage change in variousfederal science agencies over the pastfive years tells the story (see figureabove). In that time period, the budgetfor research and development (R&D) atthe National Institutes of Health (NIH)has increased nearly 30 percent inconstant dollars, while R&D spendingby the Department of Defense (DOD)dropped over 15 percent. Among theother major civilian science agencies,only the National Science Foundation(NSF) and the Environmental ProtectionAgency (EPA) posted gains. Overall,civilian R&D spending rose 5 percent,but if one removes NIH from the
calculation, it actually dropped 6percent.
What Rationales Work forGeoscience?
If NIH and NSF have been the bigwinners in recent years, science at theDepartment of the Interior has been thebiggest loser, faring considerably worsethan any other agency or department,including Defense.
Why is the USGS — now the lonescience bureau at Interior — lagging sofar behind? There are two principalreasons, both of which are alsoapplicable to the broader question ofwhy the geosciences in general arelagging. The first is simply the lack ofawareness in Congress of what theSurvey does. When the new Republicanmajority in Congress called for theSurvey’s abolition in 1995, it did so
Building Support for the GeosciencesDavid ApplegateAmerican Geological Institute
Percentage Change of Federal Research and Development Funding in Constant Dollars,Fiscal Years 1994-1999. [source: AAAS]
-25
-20
-15
-10
-5
0
5
10
15
20
25
30
% Change
NIH
NS
F
DO
D "
S&
T"
US
DA
EP
A
NA
SA
DO
C
DO
E
Inte
rior
(US
GS
)
Tot
al R
&D
Def
ense
R&
D
Non
def.
R&
D
Non
def.
R&
D(e
xcep
t NIH
)
Trends in R&D 1994-99(Constant Dollars)

IRIS NEWSLETTER10
because the USGS appeared to be anobscure agency without a visibleconstituency.
Second, it has proven difficult to usethe economic growth and human healthrationales to justify geoscience projectsand programs. The geosciences are mostclosely identified with the energy andmineral sectors, neither of which areviewed as growth sectors.
Successfully employing a humanhealth rationale for the geosciencesposes the even larger challenge oftranslating the overwhelming publicconcern for the environment into ademand for better scientificunderstanding of the Earth and itsprocesses.
If the traditional rationales for scienceare not working for the geosciences,then clearly new justifications arerequired. Last year, the House ofRepresentatives endorsed a new nationalscience policy developed by ScienceCommittee Vice-Chair Rep. Vern Ehlers(R-MI), a former physics professor.Ehlers calls for augmenting thetraditional rationales for science withone described as “helping society makegood decisions,” particularly when itcomes to environmental issues, where allsides are calling for a sound scientificbase for decision-making. This rationaleis particularly relevant to thegeosciences and to agencies like theUSGS where scientific expertise isseparated from regulatory or landmanagement authority.
A very different rationale that can beemployed is the wonder factor, whichunderpins much of the support for spaceresearch and astronomy. Thegeosciences also have tremendoussources of wonder in the processes ofour own dynamic planet, including theapocalyptic punctuations to Earthhistory and the volcanic eruptions andearthquakes that still inspire awe in ourmodern times.
The Case for Natural HazardsBoth of the alternative rationales
above suggest what is potentially themost compelling rationale for thegeosciences, one that encompasses all ofthe other rationales in a single issue area— mitigating natural hazards.
For geoscientists involved inenvironmental or resource activities or infundamental research, a natural hazardsrationale may seem unrelated to theirinterests. But when it comes tojustifying the geosciences to the publicand policy-makers, geoscientists willsink or swim as a group. Disciplinarydistinctions tend to fall away when it
comes to public perception. Ifgeoscientists as a community cancommunicate the value of their work innatural hazards, then the benefits accrueto the profession as a whole. Good willgoes a long way in a political setting,and it is important to seize every chanceto win some.
Carrying the Message ForwardIdentifying viable political rationales
is a first step toward building support forgeoscience research in Congress. Theremaining steps are directed at usingthose rationales to build support frompolicy-makers and their constituents.Here again, the task is no different thanmaking a well-constructed case for agrant. It is not enough to simply statehow you plan to spend a sum of moneywithout elaborating on the context,implications, and particularly thesignificance of the work. Scientists mustmake that same effort in the policyarena, and that means becoming anactive citizen-scientist.
Geoscientists cannot rely on thetraditional means of influencinglegislation. They do not comprise asizable voting bloc or make largecampaign contributions. Instead,geoscientists must convince policy-makers that their interests are in the
Science Committee Vice-Chair Rep. VernonEhlers (R-MI) science policy study arguedthat "helping society make gooddecisions" should be a key rationale forfederal investment in science.
Destroyed homes in Oklahoma City following Force 5 tornado that ripped through the cityon May 3, 1999. The devastation left by the half-mile-wide tornado prompted hearings in theUS House of Representatives on improving capabilities for storm prediction andatmospheric research. [photo courtesy of Vicky Fields]

11SPRING/SUMMER 1999
Natural disasters strike every stateand nearly every congressional district,thus creating a strong potential forincreasing awareness of geoscienceissues. Although such broad interestexists, there is no mechanism in placeon Capitol Hill to discuss the issues. Acongressional natural hazards caucusis one way of creating a forum toaddress common concerns andmaintain continuity of effort.
The proposal for a congressionalcaucus evolved from a symposium on“Real-time Monitoring and Warningfor Natural Hazards” that wassponsored last year by IRIS, theAmerican Geophysical Union, and theAmerican Geological Institute. Themeeting was part of the series PublicPrivate Partnerships 2000 (PPP2000): Forums on Public Policy Issuesin Natural Disaster Reductiondeveloped by the National Science andTechnology Council’s Subcommitteeon Natural Hazards Reduction and theInstitute for Business and HomeSafety. (see IRIS Newsletter Fall/Winter 1998, page 20)
At the symposium, it wasrecognized that a major challenge in
using natural hazards as a compellingrationale for supporting the geosciencesis that interest in the events themselveswanes too fast to stay on the politicalradar. Yet geoscientists must use theheightened short-term interest to explaintheir relevance. One means of improvingthe ability to educate Congress abouthazards when they arise is through theestablishment of a congressional naturalhazards caucus.
Because there is first-order agreementthat saving lives and reducing propertylosses from natural disasters is a publicgood, most programs to reduce lossesfrom natural hazards do not engenderthe partisan strife that complicates issuessuch as resource use and theenvironment. For example, a discussionon the contributions of geology toresource development cannot take placewithout first engaging in a debate overwhether the resources should bedeveloped in the first place. Likewise formost environmental issues. This is not tosay that hazards lack contention. Whenone gets to the specifics of land-userestrictions and insurance premiums, theissues may be just as intractable. Butsimply being able to get down to the
Congressional Natural Hazards Caucusspecifics at all is an accomplishmentin the political arena.
A congressional caucus couldprovide an infrastructure for holdingcongressional briefings or gettinginformation to interested Capitol Hilloffices. That is the purpose ofcaucuses, which are informalorganizations consisting of like-minded senators and/or representativeswho seek to increase awarenessamong their colleagues for a particularissue and to provide a forum fordiscussion. A successful naturalhazards caucus would draw uponscientific and engineering societies,the insurance industry, emergencymanager groups, and other entitieswith an interest in reducing the lossesfrom natural hazards. AGI, AGU, andIRIS are currently in the process ofmeeting with these groups and otherorganizations to develop support forthe caucus. ■
More information about the Forumson Public Policy Issues in NaturalDisaster Reduction can be found at:
www.usgs.gov/ppp2000/
public interest and that geoscienceresearch represents a public good. Aswith the economic growth rationale,such arguments are strongest if theycome not simply from the scientiststhemselves but from partners inacademia, government, and theprivate sector. In the case of naturalhazards, such partners may includeuniversities, state government, localofficials, utilities, insurers, and banks,as well as science and engineeringsocieties. All of these groups arecurrently involved in some form ofadvocacy in their own interest. Thekey is to get them to incorporatesupport for investment in thegeosciences into their advocacystrategy.
Building and maintaining supportfor the geosciences in Congress is a
continual process, and it will be mostsuccessful if it is just one componentof a broader public outreach andeducation effort. The long-termvitality of the geosciences depends onthe support, not just of Congress andthe federal agencies, but of theconstituencies which they serve.Fortunately, the geosciences have astrong case to make. All it takes areactive citizen-scientists to make itwork.
AcknowledgmentsPortions of this article were
adapted from Geotimes. Moreinformation about the AGIGovernment Affairs Program can befound at: www.agiweb.org/gap/gaphome.html ■
Scientific organizations such as AGU and AGI areincreasingly sponsoring forums on multi-disciplinary topics that have important public policyimplications. Above, scientists, economists, andland planners discuss future areas for cooperationand research at a forum on natural disasterreduction held at the American Geophysical Union.

IRIS NEWSLETTER12
BackgroundThe Khibiny Mountains in Kola is
highly snow avalanche prone duringwinter with hundreds of avalanchestaking place each year. In the pioneeringdays of mining operations in theKhibiny, which commenced in 1929, theavalanche hazards were largely ignoreduntil a tragic accident on December 5th,1935 when 88 miners perished nearKirovsk (Figure 1). Avalanche safetymeasures had already been initiated in1933, and even at this early stageartificial avalanche release experimentswere conducted. The 1935 tragedytriggered more comprehensive safetymeasures, and various researchprograms for measurements bearing onphysical snow conditions, precipitation,prevailing winds and othermeteorological parameters. The ultimategoals of these efforts, dating back to1935, are enhanced safety measures andavalanche forecasting. The latter goalhas proved rather elusive because theavalanche releases are a nonlinearprocess. Nevertheless, it remains highlyrelevant today, as skiers ‘invade’ theKhibiny in winter. In the future,avalanche hazard mitigation will becomeincreasingly important as more skiersand tourists visit the beautiful KhibinyMassif area. The project introduced hereaims at physical avalanche modelingwith the overall goal of risk mitigationthrough improved avalanche forecasting.
Seismic loading — artificialavalanche releases
Artificial avalanches can be triggeredusing dynamite or firing mortar roundsinto the ‘snow hanging wall’. Thesetechniques are well proven measures formitigating such hazards. Avalanchesmay also be released by seismic loading,which in the case of Khibiny, are causedby open pit and underground mineexplosions. Over the period 1959–1999,
Avalanche Hazards in Khibiny Massif, KOLA, andthe new Nansen Seismograph Station Pavel Chernouss, Yury Zuzin, Evgeny Mokrov 1), Gennady Kalabin 2), Yury Fedorenko 2,3), Eystein Husebye 3)
1) Center of Avalanche Safety of “Apatit” JSC, Murmansk Region, Russia, 2) Kola Science Centre RAS, Russia, 3) InstituteSolid Earth Physics, University of Bergen, Norway
approximately 225 avalanches weretriggered in this manner, excluding thosereleased intentionally by in situshootings. (Figure 2) Another example isthe large explosion (approximately 100tons of dynamite) on January 20, 1998,which triggered an avalanche of 40,000cubic meters directly into the open pitmine Centralnyi. As a result a stretch ofa road 600 meters long was buried underthick snow. Even moderate pit mineexplosions with charges in the range 10–100 kilograms of dynamite are observedto trigger avalanches at ranges of 2–3km away from the source, while thelarger 10–100 tones explosions can
trigger avalanches at least 15 km away.
The Nansen station — seismicloading monitoring
As previously mentioned,observations indicate that a causalrelationship exists between seismicloading and avalanche releases. Tomodel the phenomena, we require amore quantitative relationship, which, inturn, motivated our deployment of theNansen 3-component station in Khibiny,near the Kirovsk mining town (seeFigure 1). The station becameoperational January 5, 1999 and over 5months, hundreds of mining explosions
Figure 1. Topographic map of the Khilbini Massif (elevation step 100m) including locationsof major towns, operative mines and naturally the new 3-component Nansen station. NKKis close to several mines and besides offer an unique opportunity to study 3D wavefieldresponses of rough topography (Hestholm and Ruud, 1998)
33˚ 30' 34˚ 00'67˚ 30'
67˚ 45'
Kirovsk, Yurspor
Rasvumchorr
CentralnyiKoashva
Norpakh
Apatity
Kirovsk
Nansen Kola Seismic StationLaunched on 5 January, 1999
NKK

13SPRING/SUMMER 1999
were recorded. A few recordings fromthis station are shown in Figure 3. TheSP seismometers used ground velocitieswhich were converted to peak groundaccelerations (PGAs) and similarmeasures. The real challenge is tosimulate PGAs for an arbitraryexplosion over larger Khibiny areasusing 3D wave field synthetics, andproperly accounting for topographicfocusing/defocusing effects (Hestholmand Ruud, 1998).
Avalanche modeling and forecastingSeveral attempts of using avalanche
data for statistical forecasting for smallareas of the Khibiny have been undertaken, but apparently without muchsuccess (Chernous and Fedorenko,1998). Most successful were forecasts of‘avalanche situations’ during periods ofheavy snow accumulation, implying thatsome avalanches did occur after delaysof 2–4 days — not entirely unexpected.The avalanche database (dating back to1933) has been subjected to variouskinds of multivariate statistical analysis,but it remains somewhat unclear whichphysical parameters are most diagnosticfor avalanche releases. Parallel to theseinvestigations, studies on stochastic 3Dmodels simulating avalanche releaseshave commenced (Chernouss andFedorenko, 1998). The data from theNansen station would be most useful,
namely simulating the exceedance(seismic loading) of critical frictionforce limits in order to initiate anavalanche release.
PerspectivesAvalanche safety measures are well
handled by the Apartity AvalancheSafety Centre of JSC, Kirovsk, but areasof operations are limited to miningtowns and their surroundings. Ourproject aims at avalanche forecasting forlarger areas, in particular those popularwith weekend skiers. The most difficultpart of the project would be to merge
0
Rel
ativ
e A
mpl
itude
Pg Sg PmP NS
EW
Z
10 20 Time, s
NS
Z
EW
Rel
ativ
e A
mpl
itude
0 10 20 Time, s
wind modeling and snow accumulationswith changing snow conditions andavalanche triggering levels into anAvalanche Hazard Model. Our approachwould, in some respects, be similar tothose used in earthquake risk analysisand prediction. Even if we are onlymoderately successful, more stationswould be deployed for monitoringavalanche occurrences in the KhibinyMassif.
We invite any interested IRISmembers to join us in our avalanchemonitoring and modeling efforts.
AcknowledgmentsWe express our sincere thanks to the
Nansen Foundation, NorwegianAcademy of Sciences and Letters, Oslofor the financial support that enabled usto deploy and operate the Nansenstation.
ReferencesP. Chernouss and Yu. Fedorenko, 1998.
Probabilistic Evaluation of Snow SlabStability on Mountain Slopes. AnnalsGlaciology, 26, 303-306.
Hestholm. S and B. O. Ruud, 1998. 3-Dfinite difference elastic wavesmodeling including surfacetopography.Geophysics,63, 613-622 ■
Figure 2. Artificial avalanche release by mortar firings into the hanging snow wall at themountain top. The pockmarks indicate the explosion points.
Figure 3. Nansen station seismograms from a) a local mine explosion (18 km away) and b)a teleseismic event. The presumed PmP-phase in a) illustrate the importance oftopography in wavefield modeling. The phase polarization is elliptical, and the amplitude isalmost the same at each of the 3 components.
a) b)

IRIS NEWSLETTER14
New Format for the Annual IRIS Workshop
Participants at the Eleventh Annual IRIS Workshop
Participants enjoyed the beautiful weather during mealtimes.
Over 200 seismologists converged inFish Camp, California for the EleventhAnnual IRIS workshop. With theseismological community buzzing overproposed new initiatives such asEarthScope/USArray, the PlateBoundary Observatory, the AdvancedNational Seismic System, the newPASSCAL instrument, and the next IRISfive-year proposal, it was a time both toreview recent results and to plan ourfuture. Accordingly, the workshop wasstructured not only with the traditionallecture and poster sessions, but also witha series of discussion groups specificallydesigned to explore new initiatives andto create a common vision for the futureof IRIS. The new format was extremelysuccessful in generating ideas for nextIRIS 5-year proposal and in creating aconsensus among the IRIS communityon future initiatives.
Upon arrival, each workshopparticipant discovered that they had beenassigned to one of five discussiongroups. Wednesday evening began withthe traditional icebreaker, followed bydinner and a special reception wherestudents and post-docs met each otherand learned how they can participate inIRIS programs.
Thursday morning, the workshop
began with a lecture session onmountain building organized by BradHager. Brian Wernicke discussed theSierra-Nevada Uplift, Roger Buckdescribed visco-elastic interactions innormal faulting, and Leigh Roydenbroadened the presentations by outliningthe visco-elastic interactions that occurduring contraction. After a short break,the session concluded with presentationon the state of the lower crust by BradHager; and on crust-mantle interactionsby Gene Humphreys.
Following lunch, the Chair of the IRIS
Board of Directors, Anne Meltzer,introduced the five discussion groupleaders: Art Lerner-Lam, Alan Levander,Jeffrey Park, Gary Pavlis, and MichaelWysession. The groups convenedseparately for coffee and desert, withtheir assignment: “Identify and rank thefive most interesting scientific questionsthat seismology can address, andindicate those in which IRIS should playa role.” In the afternoon, a poster sessionprovided opportunity for informaldiscussions. The day concluded with anAnsel Adams lecture by RobertWoolard, dinner in the lodge, and briefpresentations by the group leaders fromthe afternoon discussions.
On Friday morning, Anne Meltzersummarized the results from thediscussion groups (see box). There wasremarkable similarity in both the viewsand priorities presented by each ofindependent discussion groups.Encouraged by the apparent consensuswithin the workshop, the groups werethen tasked with the follow-up question:“How can we best attain our IRIS-related goals within the context andtime-frame of our next 5-yearproposal?”
A series of lectures on the lowermantle organized by Michael Gurnisthen began. Lianxing Wen spoke about

15SPRING/SUMMER 1999
The most interesting questions that seismology can address(according to participants of the Eleventh Annual IRIS Workshop)
❖ What are the interactions between lithosphere and the underlyingmantle? How are these interactions expressed at the Earth’s surface?
❖ How do the core and mantle affect each other?
❖ How well mixed is the mantle?
❖ What is the seismicity and tectonics of terrestrial planets?
❖ What is the vertical distribution of anisotropy in the upper mantle andcrust? How does anisotropy relate to flow?
❖ What is the shape and origin of plumes?
❖ How do fluid and magmatic processes enable tectonics?
❖ What causes the initiation and termination of earthquake rupture?
❖ Do small earthquakes relate to large earthquakes?
❖ To what extent are earthquakes physically independent?
❖ What is the fine structure and organization of fault systems?
❖ What role does non-linear dynamics play in Earth processes?
❖ How does ground motion behave at the fine scale?
❖ What signals are we not observing?
Poster sessions provided opportunity for informal discussion and planning.
the fine seismic structure of thelowermost mantle; Quentin Williamsdiscussed the lowermost mantle andevidence for magma oceans and thesource of hotspots; and Guy Mastersspoke about the imaging of chemicaland thermal anomalies. Following thebreak, Lars Stixrude discussed the roleof mineral physics as the link betweenseismology and dynamics; and IgorSidorin reconciled the seismicobservations, models, and mineralphysics for the base of the mantle. Thelecture session convened promptly atnoon as everyone grabbed boxedlunches and many headed off to hikethrough Yosemite National Park.Following dinner that evening, thediscussion groups reconvened to developspecific recommendations for the nextIRIS 5-year proposal.
On Saturday, the group leaderspresented their final reports for the IRISproposal. Once again, there wasconsiderable consensus about the futurerole of IRIS and direction of our variousprograms. Many of therecommendations fell within the themes
of increasing resolution, bandwidth,coverage, and stability. There were alsocalls for improvements in dataaccessibility; development of the newPASSCAL instrument; coordinatedsoftware development, promotion of
new initiatives such as USArray and thePlate Boundary Initiative; expandedearthquake studies; and the use of theConsortium as an organizing structurefor the seismological community and asrepresentatives within Washington forthe greater Geoscience community.
Following the discussion groupreports, a lecture session organized byTom Jordon on the science ofearthquakes began. Göran Ekströmpresented a talk on global seismicity;Greg Beroza discussed regional studiesof earthquakes; Mark Zoback discussedlocal studies of earthquakes; and JamesDeterich gave a talk on laboratorystudies of earthquakes. The sessionended at noon.
Following lunch, representatives fromthe National Science Foundationdiscussed the EarthScope proposal andanswered questions from workshopparticipants. The workshop ended with abarbecue dinner and an astronomypresentation by Fresno State.
We extend a special thanks to theworkshop organizers John Vidale andGene Humphreys, the session chairs,Brad Hager, Michael Gurnis, and TomJordon, and a special thanks to thediscussion group leaders: Jeffrey Park,Art Lerner-Lam, Alan Levander, GaryPavlis, and Michael Wysession. ■

IRIS NEWSLETTER16
The IRIS Education and Outreachprogram held a one-day workshop inYosemite aimed at helping seismologistsprepare to run a workshop at their homeinstitution for local K–12 teachers. Theworkshop goals were to (1) involveparticipants in hands-on and inquiry-based activities that can be used to teachseismology and related Earth Science,(2) provide background on current issuesin K–12 science education and on theK–12 classroom environment, and (3)provide information on the logistics ofrunning a teacher workshop. Theworkshop, organized by Larry Braile(Purdue University), Sheryl Braile(Happy Hollow Elementary School),Rob Mellors (San Diego StateUniversity), and Catherine Johnson(IRIS), was attended by 14 people froma variety of colleges and universities.
An introductory quiz on K–12education statistics got everyone on theirfeet and temporarily away from thecoffee and donuts. (What percentage ofK–12 teachers are female? — answer atthe bottom of the page). The rest of theday focussed on activities to use in ateacher workshop. Participants madeslices and 3-D models of the Earth(activities designed to teach aboutinternal structure), and simulated theconstruction of travel-time curves andearthquake location through a walk-
minus-run-time activity carried outunder beautiful clear Yosemite skies.Other activities included demonstrationsof an epicenter plotting exercise, a platetectonics flip-book (home-grownsubstitute for computer simulations ofplate motions), and a plate tectonicsCDROM. In IRIS-run K–12 teacherworkshops, we also spend some time ina lecture/demonstration mode to provideparticipants with backgroundinformation and materials on platetectonics and earthquakes. A briefsynopsis of this lecture material was
given. The final activitywas a contest in whichparticipants designedearthquake-resistantbuildings. Testing of thestructures on a shaketable revealed that ourgroup of experts wouldprovide sound advice toa building safetycommission!
In addition, LarryBraile gave apresentation on thestatus of US education.We hear many, oftenconflicting, reports on
the television and in the newspapersabout the state of US education, inparticular science and math education.Much of the information and the way inwhich it is presented can be misleading.Larry discussed some of the currentcontroversial issues and the data sets onwhich broad political statements arebased.
Follow-up will involve eachparticipant running a 1–day workshopfor teachers in their local area during thenext academic year. IRIS Education andOutreach provides support and materialsfor these workshops. Jeff Barker whoattended a similar workshop in 1997 hassince run two teacher workshops andprovided encouraging “testimony”.Taking our science (and where possibleour own individual research) beyond ouruniversity and peers is our responsibilityas scientists. Short, teacher workshopsare effective, do not demand excessivetime, and last but not least are extremelyrewarding. We encourage all IRISmembers to participate in the workshopprogram. ■
Seismologists Learning to Teach the TeachersIRIS Education and Outreach WorkshopYosemite, June 1999
Prior to the IRIS Workshop, seismologists learned exercises andactivities for teacher workshops, including participating in a contest inwhich they designed earthquake-resistant buildings.
75% of K-12 teachers are female, 85% ofelementary school teachers are female.
John Craddock Macalester CollegeKazuya Fujita Michigan State UniversityKatrin Hafner California Institute of TechnologyAlan Kafka Boston CollegeJohn Lahr US Geological SurveyTim Long Georgia Institute of TechnologyElizabeth Meyers University of Alaska, FairbanksJim O’Donnell University of Nevada, Las VegasWayne Pennington Michigan Technological UniversityGerry Simila California State University, NorthridgeGregory van der Vink IRISFrank Vernon University of California, San DiegoLisa Wald US Geological Survey
Workshop Participants

17SPRING/SUMMER 1999
My first encounter with IRIShappened while I was waiting outsideJeffrey Park’s door during his officehours for Geology & Geophysics 120 atYale. I was a freshman, enrolled as a“probable” English major, taking theclass to fulfill my natural sciencerequirement. The student before me wastaking a long time, so my eyes naturallywandered around the Kline Geology Labcorridor and settled on a fetching posterof travel time curves. And there it was,in the lower right hand corner, in statelyfont topped with an elegant seismictrace, “the IRIS consortium.” I thought,“Cool logo.”
Little did I know that three monthslater I would find myself “trying out theresearch thing,” wrestling with Fortranand downloading seismic data from theIRIS DMC and SPYDER®. When Idecided that a second major in Historywould complement “the Geophysicsthing,” I didn’t know that IRIS wouldbecome the focus of my History thesis.And certainly, when I abandonedGeophysics and History altogether atgraduation to do Teach For America, Ididn’t realize I would be working as anIRIS intern the following summer. IRISfollows me around like the moon.
In this latest encounter, I have beenworking to fortify the .edu in IRIS’sdomain name. During the school year, Iam a second grade teacher in East PaloAlto, California. I have been workingthis summer to bring earthquake scienceto elementary students such as my own.I believe that if seismology as a field isto continue flourishing, we need toeducate not only those select few whowill eventually become seismologists,but also every one else, who will footthe bill. We all know, as scientists, theimportance of basic research inseismology as an end in itself. We needto instill this value in the public. Everychild in elementary school is taught andlearns to appreciate art, music, andsports. Only a tiny fraction of children
Teach For America Intern at IRISBella Desai, Teach For America
will ever become professional artists,musicians, or athletes, but almost all ofthem will grow to feel that these fieldsare inherent in a civilized society. It isdifficult to feel that basic seismologyresearch is inherent in today’s civilizedsociety if you don’t even know what“seismology” means. This summer, Ihave created elementary, middle, andhigh school lesson plans to supportIRIS’s upcoming display in theAmerican Museum of Natural HistoryDiscovery Room. I have also created aset of second grade lessons that are anextension of a standard language artscurriculum used widely throughoutCalifornia. By integrating seismologydirectly into language arts, I hope tomake it easier for teachers to bringseismology into their classrooms.
As I prepare to head back to schoolthis fall, I leave with a stack of lessonsand ideas under my arm. My goal as aTeach For America teacher is to provide
students in under-resourced areas withthe opportunity to attain an excellenteducation. As I return to fulfill thesecond half of my two-yearcommitment, I feel confident that thisjoint internship between Teach ForAmerica and IRIS will help me reachthat goal. Perhaps I will meet aelementary student someday who hasused the integrated curriculum or done aworkshop at the museum. Maybe shewill show me the different waves in theseismic trace above the purple IRISletters on the corner of a poster. Andthen I’ll think, “Cool logo.” ■
Bella Desai (left) and fellow Teach For America corps member demonstrate an activitydesigned to teach about seismic waves.
For more information about Teach ForAmerica and how to apply, call (800)832-1230 or visit their web sitewww.teachforamerica.org ■

IRIS NEWSLETTER18
An agreement has been reached toform a public benefit nonprofitcorporation entitled, “Consortium ofOrganizations for Strong-MotionObservation Systems.” (COSMOS)The decision was taken based on aCharter agreement between theCalifornia Strong MotionInstrumentation Program, the USGeological Survey, the US Bureau ofReclamation, and the US Army Corpsof Engineers. The sponsoringorganization is the US Committee forthe Advancement of Strong MotionPrograms (CASMP) funded by the
National Science Foundation (NSF).The purposes of the Corporation as
defined by the COSMOS Charter are asfollows:
1. Develop policies and fosterinnovative ideas for the urgentimprovement in the strong-motionmeasurement and their applications;
2. Promote the advancement ofstrong-motion measurement in denselyurbanized areas and other locations ofspecial significance to society likely tobe struck by future earthquakes;
3. Encourage and assist the rapid,convenient, and effective distribution of
IRIS Brings Seismology to Capitol Hill
Members of Congress and their staffcreated earthquakes, saw a playback ofthe 1994 Northridge event, and learnedabout global seismology at an exhibitionand reception on Capitol Hill organizedby the Coalition for National ScienceFunding. The exhibition featuredprojects supported by the NationalScience Foundation and demonstrated toCongress how such projects meet thenation’s research and education goals.
At the invitation of the AmericanGeological Institute and the AmericanGeophysical Union, IRIS set up aseismology display that was developedwith the US Geological Survey.Members of Congress appreciated thestrong cooperation between IRIS and theUS Geological Survey. They wereimpressed also with the multiple uses ofthe IRIS facilities — serving not onlyscientific research, but also earthquakehazards, nuclear monitoring, andeducation. Other exhibits included “TheVirtual Earth System” by the UniversityCorporation for Atmospheric Researchand “Measuring the Earth with Quasars”by the American Astronomical Society.
David Applegate, Director of GovernmentAffairs for the American GeologicalInstitute, discusses recordings from theNorthridge earthquake at the Coalition forNational Science Funding exhibition onCapitol Hill.
issued a statement commenting “I amamong those constantly amazed by thevariety and depth of NSF-sponsoredprojects, some of which are on displaytoday.... While other federal scienceagencies may have bigger budgets, Idoubt if any has a bigger impact than theNational Science Foundation (NSF) onthe scientific enterprise.”
At the AGU/AGI/IRIS exhibit, mostof the questions were about earthquakehazards and the frequency ofearthquakes in various parts of theworld. Such questions were no doubtpartly due to the timeliness of the exhibit— following the recent passage of theEarthquake Hazards ReductionAuthorization Act of 1999. The billauthorizes a total of $469.6 million overfive years for the National EarthquakeHazard Reduction Program (NEHRP),and includes funding for the AdvancedNational Seismic System. Although theauthorization passed strongly, the tightbudget climate may make it difficult forthe funds to be actually appropriated thisyear. ■
The Consortium of Organizations for Strong MotionObservation Systems (COSMOS)Bruce A. Bolt, President, COSMOS
strong-motion data according toCOSMOS standards;
4. Strengthen, expand, and supportstrong-motion programs;
5. Serve as a consortium throughwhich programs and institutions canwork to solve mutual problems withinstruments, data and its dissemination,and data utilization; and
6. Advance systematic user influenceon data acquisition and datadissemination processes. ■
Following the exhibition,Congressman F. James Sensenbrenner,Jr., Chairman of the Science Committee,
For more information see website:www.cosmos-eq.org/default.html

19SPRING/SUMMER 1999
Agreement Signed on US Russian Cooperation inObservational Seismology and Geodynamics
The twelve Global SeismographicNetwork stations in Russia addsignificantly to data for globalseismology, providing information froma broad region of Europe and Asia thathad previously been closed to westernobservers. Since the breakup of theSoviet Union, there have been numerouschanges in the mode of operation of theRussian GSN stations. Largely due tothe excellent cooperation between theGeophysical Service in Obninsk, theGSN networks operators (UCSD andASL) and individual station operators,the Russian stations have continued towork unabated, and in many ways haveimproved, during the dramatic changesin Russia over the past decade. Internethas been added to most of the stations,providing near real-time access to data.GPS instruments have been added at anumber of sites.
One perpetual source of problems hasbeen relations with the Russian customsservice. The agreement under which theGSN stations were originally installed inRussian was with the Soviet Academy ofSciences. Import of GSN equipment andsupplies was through the Academy andit was relatively easy for all scientificmaterials to be declared exempt fromduties and taxes. Under the new regime,import regulations have changeddramatically and customs control hasbecome much more complex andirregular. As a first step in attempting to
re-formalize the GSN project and solvethe customs problems, it was clear that anew agreement was required.
Many of the high level agreements forscientific cooperation with Russia arenow carried out under the bilateralexchanges coordinated by US Vice-President Gore and the Russian PrimeMinister (originally the Gore-Chernomyrdin Commission). At theScience and Technology Commissionmeeting of the Gore-Chernomyrdin
Commission in January 1996, aMemorandum of Understanding onObservational Seismology was signedthat eventually lead to a full Agreementprepared for the Gore-PrimakovCommission in March 1999. Althoughthe Kosovo crisis lead to the abruptcancellation of the full Commissionmeeting, the Science and TechnologyCommittee did meet and approved theAgreement which was signed on March24, 1999.
While signatures on a formaldocument are a significant and importantstep, the real work of ensuring the long-term, stable operation of the GSNstations in Russia continues to be achallenge. Problems with customsremain, especially in the remote areas ofthe far eastern regions. The financialsituation in Russia has placed seriousconstraints on the support of theirscientific infrastructure. Thecontributions to internationalseismology, through the dedicated workof the individuals at each of the Russianstations, is greatly appreciated. ■
30˚E 40˚E 50˚E 60˚E 70˚E 80˚E 90˚E 100˚E 110˚E 120˚E 130˚E 140˚E 150˚E 160˚E 170˚E 180˚
40˚N 40˚N
50˚N 50˚N
60˚N 60˚N
70˚N 70˚NTiksi
Petropavlovsk
Yuzhno Sakhalinsk
Talaya
KislovodskKislovodsk
BilibinoLovozeroNorilsk
Arti
GSN Stations in Russia Other GSN stations
ObninskArti
Yakutsk
Internet Lines
�
�
�
�Magadan
�
�
�
�GSN Stations with continuous GPS
Signatories to the Agreement: Director of the US Geological Survey,Chip Groat; Director of the National Science Foundation, Rita Colwell;Minister of Science and Technologies, Mikhail Kirpichnikov; and VicePresident of the Russian Academy of Sciences, Nikolai Laverov.Assisting in the signing ceremony are Laura Efros from the Office ofScience and Technology Policy and Vladimir Tychtchenko of theMinistry of Science and Technologies.

IRIS NEWSLETTER20
In partnership with the US GeologicalSurvey, IRIS is expanding its museumprogram. In addition to the prototypesthat are currently at IRIS headquarters inWashington, DC, the New MexicoMuseum of Natural History inAlbuquerque, NM, and the FranklinInstitute Science Museum inPhiladelphia, PA; additional exhibits arebeing developed at the CarnegieMuseum of Natural History inPittsburgh, PA, and the AmericanMuseum of Natural History in NewYork, NY. Within the next six months,we expect the display program to reachan audience of approximately 8.75million each year. With expansion of theprogram to include two or threeadditional museums over the next fewyears, the total audience for the fullprogram could be as high as 10 millionper year.
Display ConceptMost people are amazed to learn that
an earthquake occurred today; and theyare astonished to discover thatearthquakes are continually occurring. Ingeneral, the public views earthquakes asunusual events that result in cataclysmic
IRIS/USGS Expand Museum Program
destruction. We havedeveloped exhibits withthe above-mentionedmuseums to change thepublic perception ofearthquakes. We presentearthquakes not asdestructive events, butrather as signals of thedynamic geological forcesthat build our mountainsand create our oceanbasins. In other words, weseek to develop anappreciation forearthquakes as nature’sreminder that we areliving on the thin, outercrust of a planet whoseinterior is still cooling.
By bringing liveseismic data over theInternet and broadcastingit in museums, we providevisitors with evidence thatthe Earth’s surface is inmotion. The displays andaccompanyingeducational materialsshow why earthquakes
occur, how seismometers record earthquakes, howearthquakes relate to plate tectonics, and how we canuse seismology to explore the Earth’s interior. Thedisplays use earthquakes to capture the visitor’sattention, but they also use earthquakes as anintroduction for a broad range of Geoscience concepts.
In meeting with museums, we discovered thatapproximately 40% of their visitors arrive in groups,usually as part of a school trip. To host these groups,museums are creating “classrooms” and developingdemonstrations. For such classrooms, we are includingwithin the museum display the ability to playbackfamous earthquakes. Museums will, for example, beable to replay the Northridge earthquake and set thedisplay to record ground motion as it would appear atdifferent seismic stations across the United States.Visitors see, for example, that stations close to the
The IRIS/USGS seismology display is reported to be one ofthe most popular exhibits within the American Museum ofNatural History’s Hall of Planet Earth.
In addition to the new Hall of Planet Earth, IRIS and the USGS aredeveloping exhibits and demonstrations for the teaching Halls at theAmerican Museum of Natural History in New York.

21SPRING/SUMMER 1999
earthquake record P-waves and S-wavesin quick succession; but with increasingdistance from the earthquake the timedifferences between the arrival of the P-waves and S waves increases.Accompanying handouts and classroomexercises will translate this observationinto an understanding of how we areable to determine the location of anearthquake from seismic records.
A Launching Point for FurtherInterest in Geoscience
The museum display is designed as alaunching point for furtherunderstanding of seismology andGeoscience. In fact, all of theeducational content of the display can be“carried away” with the visitor. Inaddition to the one-pagers, posters, andteaching exercises, the electronicportions of the exhibit are accessiblethrough accompanying websites thatallow individuals or classes to continueto monitor global seismicity in theirclassrooms or homes. The websitedisplays are interactive and allowviewers to find out more informationabout individual earthquakes, to accessactual ground motion records fromvarious seismic stations, and toelectronically visit individual seismicstations around the world.
Further expansionThe display concepts are continually
evaluated through a variety of forums,including scientific conferences, EarthScience Week programs, andCongressional exhibits. We expect thatmost of our recommendations, however,will come from museums that have beentesting the prototype that is touringacross the country as part of the FranklinInstitutes Power of Nature exhibit.Videotape records of viewer responseand interview evaluations provided bythe various museums will be used toimprove the concepts of the display.
If you know of other museums thatwould be interested in developing real-time earthquake exhibits, please contactthe IRIS Education and OutreachProgram. ■
The “make-your-own-earthquake” display captures the attention of visitors, and promptsthem to learn more about the relationship of earthquakes to plate tectonics.
There are exciting developments atthe National Science Foundation(NSF) related to a major new facilitiesinitiative called “EarthScope: a Lookinto our Continent”. The EarthScience Division at NSF is workingwith a number of organizationsrepresenting the research communityto develop a plan to be presented tothe National Science Board later thisyear for consideration as a MajorResearch Equipment (MRE) initiative.The MRE account is an NSF-wideprogram to provide funding for theconstruction and acquisition of majorfacilities that are beyond the fundingresources of any one Directorate.
Two of the components ofEarthScope, USArray and the PlateBoundary Observatory (PBO) weredescribed in the last IRIS Newsletter.SAFOD (San Andreas FaultObservatory at Depth) was describedin the Fall 1993 issue of the IRISNewsletter. USArray and SAFOD areincluded as the first two componentsof the EarthScope initiative whichhas received strong support as itbegins to move through NSF. PBOand related facilities for satelliteinterferometric synthetic apertureradar (InSAR) will be proposed as afuture component of EarthScope.
The USArray component ofEarthScope is being presented to NSFas a significant enhancement tofacilities for portable seismicinstrumentation for use ininvestigations of the structure,evolution and dynamics of the NorthAmerican continent. At the same time,the Advanced National SeismicSystem (ANSS) has been authorized,as part of the National EarthquakeHazards Reduction Program, as aUSGS initiative to improve facilitiesfor permanent seismic networks forearthquake monitoring. IRIS and NSFare working closely with the USGS tocoordinate the development andimplementation of these twocomplementary facilities for a broadspectrum of seismological studies.
Information on EarthScope will beavailable through the IRIS websiteand www.EarthScope.org. Articles onUSArray have been published in EOS(June, 1999) and GSA Today(November, 1999). Reports fromrecent workshops on USArray andPBO will be posted. A USGS reporton ANSS is being published as USGSCircular 1188 and is also availablethrough http://geohazards.cr.usgs.gov/pubs/circ. ■
EarthScope News

IRIS NEWSLETTER22
The IRIS Data Management Centerwas happy to welcome Mary Edmundsto the staff in July, 1999, as a DataControl Technician. Mary is from theSeattle area, and was previously workingfor the University of Washington. Shehas a background in the Earth sciencesand has been a very welcome addition tothe group that archives and processes thelarge number of requests that comethrough the Center.
We want to congratulate Chau Tranand Christina Jenkins in the IRISbusiness department. Both deliveredbeautiful babies this summer. Chau’sfamily has another baby girl, Hien; andChristina delivered her first baby,Benjamin. All are doing well. ■
THIS ISSUE’S BANNERGRAM
STAFF NEWS
The seismogram above (and on page 1) is a broadband,vertical component recording of the Magnitude (Mw) 7.4earthquake that devastated parts of western Turkey onAugust 17, 1999. The recording shows the ground motion atthe IRIS GSN station KIV near Kislovodsk, Russia, about1,000km northeast of the earthquake epicenter.
Loss of life and damage to structures were massive. Morethan 15 thousand people were killed in the earthquake, over24 thousand injured. The estimated total economic loss dueto the earthquake exceeds $16 billion. Collapsed anddamaged buildings alone amount to over $5 billion. Mostdamaged structures were 4-8 story reinforced concretebuildings such as the one shown in the photo above. Thetechnical causes that contributed to the observed damage tobuildings include poor concrete quality, poor detailing ofreinforcements, and structural alterations.
The earthquake occurred along the northern strand of the
North Anatolian Fault Zone (NAFZ),one of the best studied strike-slip faultsin the world. According to reports fromTurkish and USGS field crews, the mainshock produced more than 100 km ofsurface rupture. Right-lateral offsets aslarge as 5 meters were observed alongthe entire length of the rupture. In thephoto (left) railroad tracks runningbetween the cities of Izmit and Arifiyiare offset by 2.7 meters.
The NAFZ is known as the mostprominent active fault in Turkey. Since1939, the NAFZ has produced sevenearthquakes with magnitudes (Ms)larger than 7.0. These earthquakes haveruptured the fault progressively fromeast to west, creating distinct regions ofenhanced stress levels. In 1997, a studyof stress changes along the faultestimated a 12% probability that withinthe next 30 years a major earthquakemay occur in the region of the NAFZnow effected by the August 17earthquake.
For more information and data fromthe earthquake, please visit our specialevent page on the Turkish earthquake atwww.iris.edu ■
KIV BHZ ∆=10° Mw=7.4
10 min
published 2 times per year by the IRIS Consortium.Please address your letters or inquires to:
IRIS Newsletter1200 New York Avenue, Suite 800 Washington, DC 20005Phone: 202-682-2220 Fax: 202-682-2444 www.iris.edu
The Incorporated Research Institutions for Seismology (IRIS) is a university consortium of over90 research institutions dedicated to monitoring the Earth and exploring its interior through thecollection and distribution of geophysical data. IRIS programs contribute to scholarly research,education, earthquake hazard mitigation, and the verification of the Comprehensive Test BanTreaty. IRIS operates through a Cooperative Agreement with the National Science Foundationunder the Division of Earth Science’s Instrumentation and Facilities Program. Funding isprovided by the National Science Foundation, the Department of Energy, the National Imageryand Mapping Agency, other federal agencies, universities, and private foundations. All IRISprograms are carried out in close coordination with the US Geological Survey and manyinternational partners.
The IRIS Newsletter welcomes contributed articles. Please contact one of the editors or sendyour submission to the address above.
Editor-in-Chief: Executive Editor: Production Editor:David Simpson Gregory van der Vink Anne DeLaBarre Miller([email protected]) ([email protected]) ([email protected])
IRIS NEWSLETTER

23FALL/WINTER 1998
A complex magnitude 6.5 earthquake recordedon June 15, 1999 in Central Mexico. Thisseismogram was recorded at the GSN siteANMO at an epicentral distance of 18.3 degrees.The earthquake consisted of at least two eventsabout 4 seconds apart.(Tyler Storm, ASL)
A typical mining explosion recorded on a vertical component PEPP instrumentat Eastern Greene Community School in rural Greene county, in southernIndiana, PPEGH. The seismogram, filtered with a 1Hz highpass filter, shows: ahigh frequency, commonly emergent P arrival, a low frequency S phase that isoften more impulsive than the P phase, and a prominent, high frequencyRayleigh wave with normal dispersion. (Gary Pavlis,Indiana University)
A 566km deep, magnitude 6.4earthquake, recorded in eastern Russiaon April 8, 1999. At 164 degrees, GSNstation PLCA recorded several strongcore and depth phases, includingPKPdf, PKPab, pPKPab and PP.(Tyler Storm, ASL)
Two Banda Sea earthquakes recorded on November 9, 1998 in Kamchatka. The data wererecorded with an excellent signal-to-noise ratio on PASSCAL instruments during the Site Edge ofKamchatka Slab experiment by station APA 100 km southwest of Petropavlovsk. A large,magnitude 6.8 event was followed 8.5 minutes later by a nearby magnitude 7.0 event. Withepicentral distances of 60 degrees for both events, the time difference between their occurrence isalmost identical with their corresponding S-P times, resulting in critical interference between the Swave arrival of the first event and the P wave arrival of the second event. (Jonathan Lees, YaleUniversity)
"Earthquakes" created bymembers of Congress andtheir staff during a reception ofthe National Science FundingCoalition on Capitol Hill in Mayof this year. Groundmotionwas recorded by an AS-1seismometer that wasconnected via an amplifier to ahelicorder. Visitors signed thesignals they created. (IRIS)
100 sec
60 sec
60 sec
10 sec

IRIS NEWSLETTER24
1200 New York Avenue, NWSuite 800Washington, DC 20005
Address Correction Requested
NON PROFIT ORG.US POSTAGE
PAIDWASHINGTON DCPERMIT NO 1227
IRIS welcomes as a ForeignAffiliate: Kuban State University,Krasnodar, Russia; Vladimir A.Babeshko, representative. ■
October 17-20Eastern SSA
Memphis, TN
December 13-19AGU
San Francisco, CA
December 13Board of Director’s Meeting
Yank Sing, San Francisco, CA
1 9 9 9
NEW MEMBERS
CALENDAR
2 0 0 0May 7-11
IRIS WorkshopSamoset, Rockport, ME
May 30-June 3Spring AGU
Washington, DC
June 18-239th International Symposium on
Deep Seismic Profiling of theContinents and their Margins
Ulvik, Norway
12th Annual IRIS Workshop
The 12th Annual IRIS Workshop willbe held May 7-11 at Samoset Resort, inRockport, Maine.
Samoset offers great meeting facilitiesas well as many recreational activities.Bar Harbor and Acadia National Parkare popular destinations to the North.There are also lighthouses, museumsand theaters to enjoy and an ocean ofbeauty, sailing and fishing opportunities.Samoset Resort is located 2.5 hoursnorth of Portland, ME.
For more information on Samoset, seetheir website: http://www.samoset.com/
Please watch for registrationinformation in the mail and on ourwebsite. ■
May 7-11, 2000Samoset Resort
Rockport, Maine