context for this work – twin aims…
TRANSCRIPT

1

2
Context for this work –
New cross government mental health strategy for England Dec 2009
Twin aims…

3
New horizons is about improving the mental health and well-being of the
population as well as improving the quality and accessibility of services for people
with poor mental health
New Horizons Focuses on prevention and early intervention maximising people’s
mental well being and recovery including when they are experiencing mental
health problems

4
Starting point – a social model of mental health
This representation of the causal factors and outcomes associated with MH –
from the Foresight mental health project report, 2008

5
So what’s the role of needs assessments?
In my experience, needs assessments play a crucial role at the interface between
government policy and the frontline in generating a shared understanding of
priorities for action to improve health and creating opportunities for integrated
strategy, commissioning and frontline work.
As the diagram sets out, JSNA involves bringing together relevant data and
evidence about patterns of health and its determinants, current services, the
views and experiences of the public, professionals and other stakeholders and
research evidence of what works.

6

7
England’s Place Survey 2008 provides information for each local authority area
on people’s perceptions of their community and services they receive. Several
questions give an indication of levels of well-being in our communities:
perceptions about how well people from different backgrounds get on together
and whether they treat each other with respect, how satisfied they are with their
local area, and whether they feel they can influence decisions and belong to a
local area.
Overall, Cumbria tends to do better than England on these measures. However
within Cumbria there are large differences. The more socially disadvantaged
areas tend to fare less well compared to Eden and South Lakeland. Barrow-in-
Furness is a noticeable exception. Considering it has the highest level of
deprivation in Cumbria, it scores relatively well on most of these measures.
Copeland has the lowest reported levels for several indicators including whether
people of different backgrounds get on together, whether people feel they can
influence decisions, whether people treat each other with respect and overall
satisfaction.

8
In order to better understand levels of well-being and the factors, or determinants,
which may either enhance or reduce well-being, a survey was undertaken in
2009 across the North West of England

9
The survey used the Warwick Edinburgh Mental Wellbeing scale (WEMWBS).
This scale is made up of seven items that cover two dimensions of mental
wellbeing: how people feel (pleasure) and being able to function positively. Each
statement has a five point scoring system, with responses ranging from ‘none of
the time’ through to ‘all of the time’. The highest possible score is therefore 35.

1010
The survey not only provides a population measure of positive mental health
using the Warwick and Edinburgh Scale, but also captures information on some
of the major determinants of mental wellbeing. The include the place where
people live and people’s feelings and relationships. Health was measured using a
subjective measure, rather than a medical diagnosis. Aspects of lifestyle and
significant life events were captured. The survey includes the financial,
employment and education situations of individuals. It also contained
demographic information.

11
This survey results provide us with a new baseline allowing us to compare well-
being across Cumbria’s districts and with other local authorities in the region.

12
The survey revealed a mean WEMWBS score for the North West of 27.7 out of a
maximum possible score of 35.

13
Cumbria’s mean score of 26.7 placed it just below the regional average. 13.9% of
Cumbria’s population had high levels of mental wellbeing (score of 33 and above
(i.e. one standard deviation above the NW mean)), 61.9% had moderate (23-32)
and 24.2% had low levels of mental wellbeing (score of 22 and below (i.e. one
standard deviation below the NW mean)).

14
Results by district in Cumbria show that only South Lakeland had a mean score
above the regional average. Survey participants in Eden had the lowest mean
well-being score, at 25.1 out of 35.
Why Eden? More respondents than expected answered ‘some of the time’ and
fewer answered ‘all the time’ on all WEMWBS questions
There is a strong association between answering ‘some of the time’ and reporting
worries about money (answers to ‘able to ask someone for help if in financial
difficulty and need to borrow £100’ and ‘worried about money during the last few
weeks’).
Weaker association with satisfaction with personal relationships and being retired
Eden residents are likely to have lived a bit less long than other Cumbria
residents, but this does not correlate with WEMWBS
Design artefact???

15
More interesting perhaps, the survey enables us to make correlations between
wellbeing and its determinants

16
Those who feel they are finding it difficult or very difficult to live on their present
income are more likely to have significantly lower wellbeing than those who are
comfortable or coping
16

17
Moving now from mental wellbeing to mental ill-health
These facts won’t be a surprise to most of you = though possibly for people not
involved in MH

18
Main source for prevalence data : Adult psychiatric morbidity for England, 2007
19
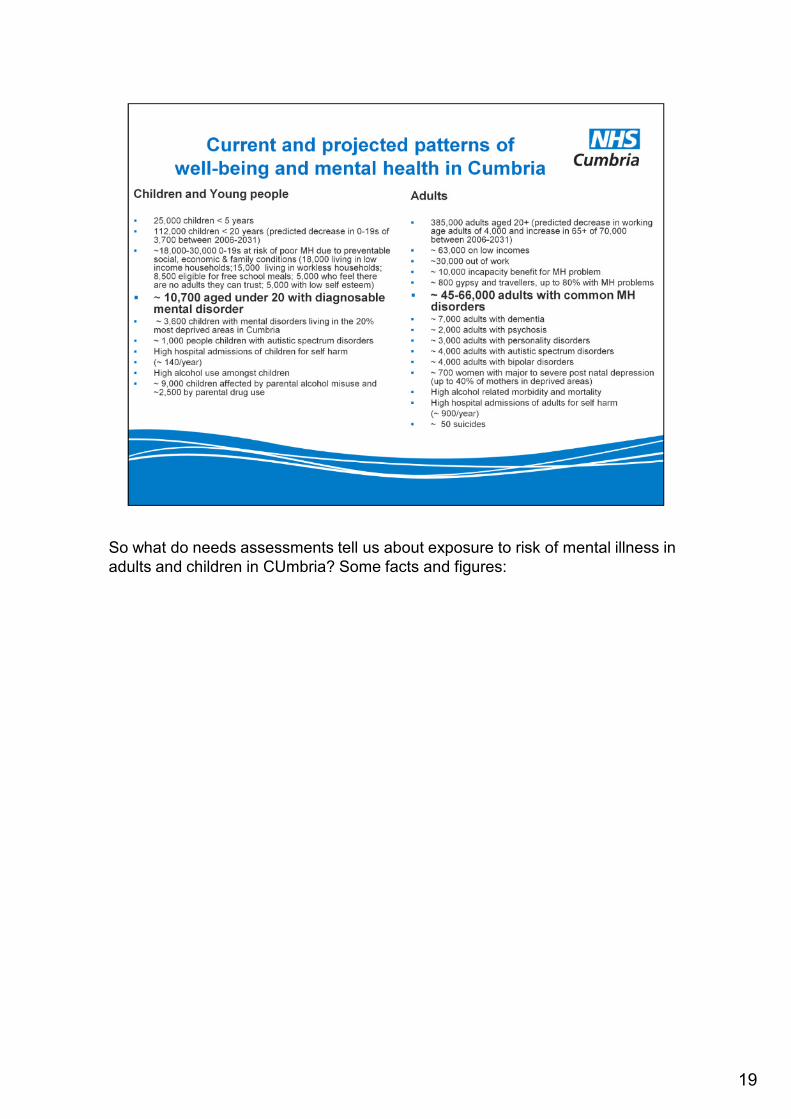
So what do needs assessments tell us about exposure to risk of mental illness in
adults and children in CUmbria? Some facts and figures:

20
What this slide – from CYP NA - tells us is that Poverty and deprivation are the
most important determinants of mental health – on the left a map of income
deprivation affecting children, on the right the PREDICTED prevalence of
mental disorders extrapolated from a 2004 ONS survey of mental disorders
in children.
The map of common mental disorders in adults shows similar results – as with
most health conditions, mental health is strongly correlated to deprivation.

21
NEXT 2 SLIDES ARE ABOUT PRIAMRY CARE AND MH
This slide is an example of PREDICTED PREVALENCE VS PRIMARY CARE PREVALENCE/QOF activity
Now to compare predicted numbers (from the national survey data) with numbers on GP registers.
This is an example of the kind of information that the needs assessment provides us with, it concerns the diagnosis of common mental disorders in primary care.
It shows the number of people on GP depression registers by district in Cumbria and the proportion of the total practice population, alongside the expected weighted prevalence in that population (Glover, 2008 – derived from adult psychiatric morbidity survey). There are higher than expected numbers of people recorded with a diagnosis of depression in the more affluent district of Eden (+1.7%) and fewer than expected in the more socially disadvantaged districts of Allerdale, Copeland, Carlisle, and Barrow (-4.4%) , where the actual prevalence is likely to be higher.
This could relate to several factors. The diagnosed prevalence may be a true reflection of actual prevalence of depression. This hypothesis would be compatible with the findings of the North West Mental Health and Well Being Survey 2009. The diagnosed prevalence may not be a good proxy measure of true prevalence, due to sources of bias, including differences in the recording of this information, or differences in treatment seeking behaviour or in clinical practice according to where people live. This would be consistent with the inverse care law whereby those most in need of services are least likely to access them.
22
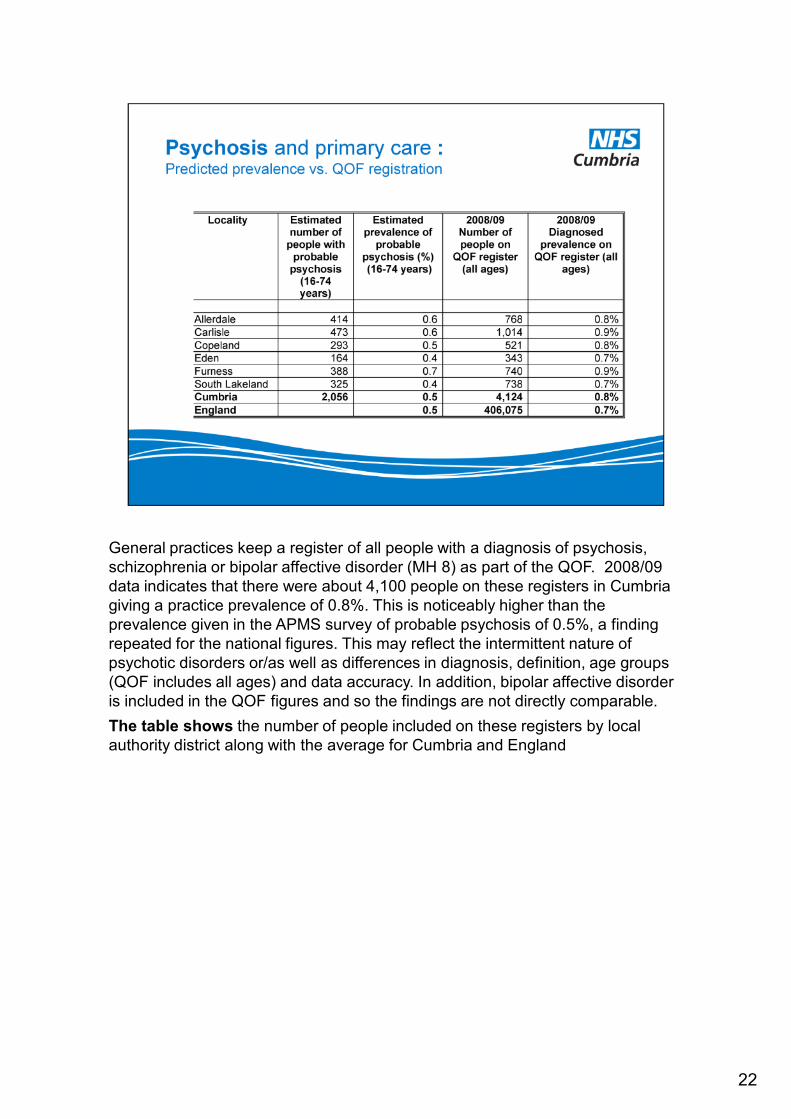
General practices keep a register of all people with a diagnosis of psychosis,
schizophrenia or bipolar affective disorder (MH 8) as part of the QOF. 2008/09
data indicates that there were about 4,100 people on these registers in Cumbria
giving a practice prevalence of 0.8%. This is noticeably higher than the
prevalence given in the APMS survey of probable psychosis of 0.5%, a finding
repeated for the national figures. This may reflect the intermittent nature of
psychotic disorders or/as well as differences in diagnosis, definition, age groups
(QOF includes all ages) and data accuracy. In addition, bipolar affective disorder
is included in the QOF figures and so the findings are not directly comparable.
The table shows the number of people included on these registers by local
authority district along with the average for Cumbria and England

23
THIS IS FROM PRESENTATION TO BOARD RE WORKFORCE AND IAPT =
THIS IS A GOOD EXAMPLE OF HOW NEEDS ASSESSMENT IS BEING USED
TO SHIFT RESOURCE ACCORDING TO NEED (MOSTLY DEPRIVATION)
FIRST STEP HAS TAKEN ESTIMATED PREVALENCE DATA INTO
ACCOUNT IN ITS SERVICE DESIGN.
There are an estimated 61883 people with a CMD over the age of 16 in Cumbria.
The prevalence CMD is likely to vary between 12% in Eden and 18% in
Furness.
The current workforce of 87.5 WTE would be sufficient to provide access to
psychological therapies for 35% of these 61883 people in a year.
For this level of access to remain consistent across each locality these 87.5 WTE
should be distributed as shown in the table below.
This indicates that the distribution of the workforce is lower than required
in Furness and to a lesser extent in Eden and South Lakes localities.

24
THIS IS ANOTHER EXAMPLE OF HOW TE NEEDS ASSESMENT
HIGHLIGHTS POSSIBLE EQUITY OF ACCESS ISSUES
THE TABLE shows the number of people using the early intervention in
psychosis service in each locality as at July 2009 and the number of referrals
(2006-08) compared with the expected level of psychosis in each locality
population. This shows that use of this service varies considerably between
areas, with most referrals occurring in Carlisle and largest caseload there too.
There is therefore a need to increase the equity of access to this service.
Nb I HAVEN’T INCLUDED ANYTHING ELSE ON CPFT ACTIVITY – THE DATA
QUALITY WAS SO POOR = cf improvement plan below
m

25
The engagement process for the mental health needs assessment was built on
good practice in public engagement. It was co-developed with Cumbria Mental
Health Group and consisted primarily of:
Facilitated sessions within 18 established locality meetings of CMHG and one
CMG meeting.
A survey of mental health service users and carers carried out by the Targeted
Community Engagement Programme.
‘Horizon scanning’ through one to one contacts with, and a stakeholder event
bring together, stakeholders with an interest in public engagement and asset
mapping for mental health (CMHG; CMG; Cumbria mental health third sector
provider forum; NHS Cumbria engagement team and public health team,
including team member working on gypsy and traveller health issues; Cumbria
DAAT; Cumbria Local Involvement Network, LINk; Cumbria County Council
community programmes and community development workers and
neighbourhood development team; Cumbria Equality Resource Centre; Churches
Together in Cumbria; GPs with an interest in mental health; Cumbria Suicide
Prevention Reference Group; and Cumbria Dementia Strategy lead).

26
Fourth element of needs assessment
we looked at evidence, guidance and innovative practice concerning public
mental health, models of mental health care services and evidence concerning
specific conditions and priority groups

27

28

29
Now to how we persuade our chief executives and directors of finance to invest in
prevention.
I think we would all agree that everyone has the right to the best physical and
mental health that society can afford.
But research also shows that there is an economic case for mental health
promotion, illness prevention and the creation of well-being.
For example, Targeted Parenting Programmes for children with conduct disorder
cost £639-3,839 but a total cost of a child with conduct disorder is £70,000 by 28
years of age.
Among the 10 most cost effective interventions for mental health, five concern
CYP. They are:

30

31
Model adopted by IAPT
Stepped care provides a framework in which the provision of services can be
organised to support patients, carers and healthcare professionals to identify and
access the most effective, but least intrusive, intervention appropriate to a
person’s needs. If a person does not benefit from that intervention, or declines an
intervention, they should be offered an appropriate intervention from the next
step. The intervention given in stepped care models ranges from ‘low intensity’ to
‘high intensity’. Patients generally have access to treatments on lower steps
before receiving treatments from higher steps. Stepped care has the potential for
deriving the greatest benefit from available therapeutic resources

32
And these are things that people can do themselves to increase WB – assets
based approach!
Part of Foresight Mental Capital and Wellbeing Project
New Economics Foundation – 5 evidence based ways to improve well-being
About individuals but also about their interactions in a social context – linked to
the determinants of mental health
The Foresight Mental Capital and Wellbeing project commissioned the New
Economics Foundation to gather evidence on actions that people could take
themselves to improve their well-being. They estimated that life expectancy could
be extended by 7.5 years by building the following actions - or ‘five ways to
wellbeing’ - into daily life. New Horizons sets out the government’s intention to
build a public campaign based on these messages.