continuation of a deep borehole stress measurement...
TRANSCRIPT
JOURNAL OF GEOPHYSICAL RESEARCH, VOL. 93, NO. B12, PAGES 15,196-15,206, DECEMBER 10, 1988
Continuation of a Deep Borehole Stress Measurement Profile Near the San Andreas Fault
2. Hydraulic Fracturing Stress Measurements at Black Butte, Mojave Desert, California
J. M. STOCK 1'2 AND J. H. HEALY
U.S. Geolo•lical Survey, Menlo Park, California
Hydraulic fracturing stress measurements were obtained in the Black Butte drill hole, 18 km northeast of the San Andreas fault in the Mojave Desert, at depths from 251 to 635 m. In all tests the least and greatest horizontal principal stresses (S h and S n, respectively) exceeded the vertical stress (Sv), indicating a thrust faulting stress regime. A single good-quality hydraulic fracture impression from 309 m depth indicates an S n direction of N41øE + 10 ø. This S n direction should be interpreted with caution because it is based on only one observation. This orientation is fairly compatible with nearby surface stress measurements but is incompatible with most of the hydraulic fracturing stress orientations reported from comparable depths in the Mojave Desert and is not favorable for right-lateral slip on either the San Andreas fault or NW striking faults present farther to the east. The stress regime measured in the Black Butte hole is comparable to that measured at nearby shallow depths but differs from the strike-slip or transitional (strike-slip to thrust faulting) stress regime present at similar depths in two nearby holes' Crystallaire, 4 km northeast of •the San Andreas fault, and Hi Vista, 32 km northeast of the San Andreas fault. The Sn direction measured in these holes is approximately 60 ø counterclockwise of that observed in the Black Butte hole. The differences in stress magnitudes and orientation among these holes substantiate previous indications of local variations in stress in the upper kilometer of the crust in this area and cast doubt on the validity of linear elastic models in which the effects of the San Andreas fault dominate the stress field in the western Mojave Desert.
INTRODUCTION
Thermomechanical models of the San Andreas fault imply that heat flow and stress magnitudes adjacent to the fault may provide useful constraints on the magnitudes of shear stresses present in the fault zone and hence on the physics of strike- slip failure along major crustal faults. The lack of a detectable thermal anomaly due to the San Andrea• fault suggests a low average magnitude (<20 MPa) of shear stress on the fault or an average coefficient of friction of 0.45 or less in the fault zone [Brune et al., 1969' Lachenbruch and Sass, 1973, 1980]. These values are not easily reqonciled with the higher values of average shear stress and frictional coefficients predicted from laboratory studies of rock strength [Hanks and Raleigh, 1980' Sibson, 1983' Byedee, 1978' Brace and Kohlstedt, 1980].
If the upper crust behaves elastically, the variation of shear stress with distance from a fault may reflect the depth depen- dence of the shear stress on the fault plane [Lachenbruch and Sass, 1973' Zoback and Roller, 1979] or the magnitude of basal shear tractions in the seismogenic zone [Lachenbruch and Sass, 1980; McGarr et al., 1982]. The variation of shear stress with depth within individual boreholes provides some constraint on the average shear stress in the brittle crust and on far-field loading mechanisms [McGarr, 1980, 1982' Zoback et al., 1980' McGarr et al., 1982]. In order to obtain the direct stress measurements needed to resolve the magnitude of the
•Also at Department of Earth, Atmospheric, and Planetary Sci- ences, Massachusetts Institute of Technology, Cambridge.
2Now at Department of Earth and Planetary Sciences, Harvard University, Cambridge, Massachusetts.
This paper is not subject to U.S. copyright. Published in 1988 by the American Geophysical Unions.
Paper number 88JB03389.
stresses on the San Andreas fault, a program of hydraulic fracturing stress measurements was initiated by the U.S. Geo- logical Survey in the vicinity of the San Andreas fault near Palmdale, California (Figure 1) [Zoback and Roller, 1979; Zoback et al., 1980; Hickman et al., this issue].
A series of shallow drill holes (Moj 1, Moj 2, Moj 4, Moj 5) were first tested to about 200 m depth. These all showed a thrust faulting stress regime, with maximum horizontal shear stress and horizontal principal stress magnitudes increasing with distance from the San Andreas fault [Zoback and Roller, 1979; Zoback et al., 1980]. Later, two deeper holes, Crys- tallaire (4 km from the San Andreas fault) and Hi Vista (32 km from the fault) were tested to depths of 849 and 546 m, respec- tively. In a related study, stress measurements to depths of 2 km have been obtained recently in the Cajon Pass drill hole, about 40 km SE of Crystallaire and 4.3 km NE of the San Andreas fault [Healy and Zoback, 1988].
In contrast to the results from shallow depths the deeper measurements from Crystallaire and Hi Vista indicate that stress magnitudes are constant, or decrease slightly, with in- creasing distance from the fault. When extrapolated to depth, they suggest an average shear stress of 56 MPa in the upper 14 km of the crust [McGarr et al., 1982].
The stress measurements reported here, collected between 1984 and 1987 in a hole at Black Butte, 18 km northeast of
the San Andreas fault (Figure 1), constitute a third deep pro- file constraining the depth dependence of the stress field in this part of the Mojave Desert. As shown below, the combined results from the Crystallaire, Black Butte, and Hi Vista holes indicate an unexpected complexity in the variation of the stress field with distance from the San Andreas fault.
GEOLOGIC SETTING
Black Butte is one of several outcrops of crystalline rock of presumed Mesozoic age [Dibblee, 1960; Miller and Morton,
15,196

STOCK AND HEALY: STRESS MEASUREMENTS AT ]]LACK BUTTE, CALIFORNIA 15,197
i i I i I i
119*00' 118"00'
35ø30 '
35ø00 '
34o15 '
117'00'
0 10 20 30 40 50 60 KM
Fig. 1. Map of the western Mojave Desert (between the Garlock and San Andreas faults), showing the location of the Black Butte, Hi Vista, Crystallaire (XTLR), and DOSECC-Cajon Pass deep holes and the shallow stress measurement holes Moj 1, 2, 4• and 5; wells XTLR and Moj 2 are within 20 m of each other. Well-located faults with Quaternary displacement are shown as solid lines; approximately located or concealed Quaternary faults are shown as dashed or dotted lines, respectively [after Jennings, 1975].
1980] in the western Mojave Desert east and south of Lan- caster, California. The top of Black Butte is at 1091 m eleva- tion, and the surrounding desert alluvium begins at 931 m. In outcrop, the butte consists of a core of mafic rock (hornblende gabbro and hornblende diorite) rimmed by granitic rock [Springer and Myren, 1985]. The 17.1-cm-diameter hole was drilled on the southeast edge of Black Butte, at coordinates 34ø33'N, 117ø43'W and a surface elevation of 927 m. With the
exception of 12 m of alluvium at the top, the hole is entirely within fractured quartz monzonite to granodiorite, with minor hornblende grabbro to 198 m depth [Springer and Myren, 1985]. The static water level was 76 m below the surface in June 1984 and had risen to within 70 m of the surface by August 1985.
HYDRAULIC FRACTURING STRESS MEASUREMENTS
The theory and method of stress measurement using the hydraulic fracturing technique have been extensively discussed by Haimson and Fairhurst [1967], Hickman and Zoback [1983], and others. General details of the techniques and equipment used in the Black Butte hole are given by Zoback and Hickman [1982], Zoback et al. [1980], and Hickman et al.
[1985]. A resettable straddle packer was used for all tests, and pressures were measured downhole, in the tubing just above the test interval. These pressures were recorded on an Amerada-type mechanical pressure gauge and on an electronic pressure gauge attached to the end of the wireline. Flow rates for water injected into the drill pipe, and withdrawn from the drill pipe, were measured at the surface using Flow Technol- ogy flowmeters.
Acoustic televiewer logs [see Zemanek et al., 1970] of the Black Butte hole, obtained prior to testing, showed extensive fracturing of the borehole wall at all depths below the water table, with a large fracture zone from 500 to 541 m [Springer and Myren, 1985]. There were very few unfractured intervals long enough to accommodate the 4.4- to 5-m straddle packer assemblies (1.0- to 1.3-m packer elements, 2.4-m interval) used in the tests. The first series of tests, in June 1984, was conduct- ed in unfractured intervals centered on depths of 199, 309, 631, and 635 m. The second set of tests, in August 1985, was con- ducted in less pristine rock at 251, 380, 467, and 548 m depth. The preexisting fractures seen on the televiewer log in and near these intervals may account for many of the problems encountered in these tests (see below).
All depths were measured by a mechanical depth counter

15,198 STOCK AND HEALY' STRESS MEASUREMENTS AT BLACK BUTTE, CALIFORNIA
12-
•. 8
a. 4
0
199 rn
210 310 410 510 TIME (MIN}
•O z 100 I •; o
uJ 15 I u) 10
a. 5
0
0
251 rn
2•0 3•0 TIME (MIN)
4• do
•o E• oo q •
, • -rSh
m pp 0• • • ,.
0 10 2o 3o TIME (MIN)
• _• 100--•
I
o
0 110 2•0 TIME (MIN)
.• $h -- pp
467 rn
548 m
24-
16-
8-
0 ..
h r-'l I-1 n 309 rn
• $v
-- pp
;o do ;o ;o ;o TIME (MIN}
•:• lOO- o:• _
'-?; o _
30-
•. -
a:: "" 10 _
O'
0
631 rn
1•0 2•0 3tO 4•0 5•0 TIME (MIN}
ua 30
u• 20
rl ['-"-,,._ 380 rn
• T $h •$v
,'o .'o o ,'o TIME (MIN) TIME (MIN}
635 rn
• 1 40 50
Fig. 2. Pressure and flow records for eight tests. Pressure was recorded downhole; flow was measured at the top of the hole. P, is pore pressure at the depth of the test' S,, is vertic.al stress; Sa is least horizontal principal stress. Sa values with arrows are upper bounds. These values are listed in Table 1, and they were obtained as described in the text. Flow back out of the fracture is plotted as negative flow for the tests at 631 and 635 m and was not digitized for the other tests.
on the wireline and are corrected to 1984 surface datum, 1.6 m above 1987 site grade. Depth corrections for 1985 and 1987 tests were obtained by comparing relative depths of prominent fractures visible on repeated borehole televiewer logs and should be accurate to within 0.5 m.
In hydraulic fracturing tests the rock is assumed to behave as an elastic, isotropic solid, and one principal stress (the verti- cal stress S,•) is assumed to be directed parallel to the borehole axis. Under these conditions, when a section of the borehole is
isolated between two packers, and pressurized, a hydraulic fracture should form perpendicular to S•. In this case, the normal stress on the fracture away from the borehole is equal to Sa. This stress should be equivalent to the stress at which the fracture closes, the instantaneous shut-in pressure (ISIP), seen as an inflection in the pressure-time curve when the inter- val is sealed off ("shut in") ['see Gronseth and Kry, 1983, Figure 2].
In these tests the value of S• for each depth was determined
on the basis of stable ISIP values, stable pumping pressures, and step rate pumping tests (Figures 2 and 3; the appendix). The magnitude of the greatest horizontal stress S n was deter- mined using linear elastic relations for the stresses around a cylindrical cavity (Bredehoeft et al. [1976]; after Haimson and Fairhurst [1967] and Hubbert and Willis [1957]):
S, = 3S•,- P•,- Pro (1)
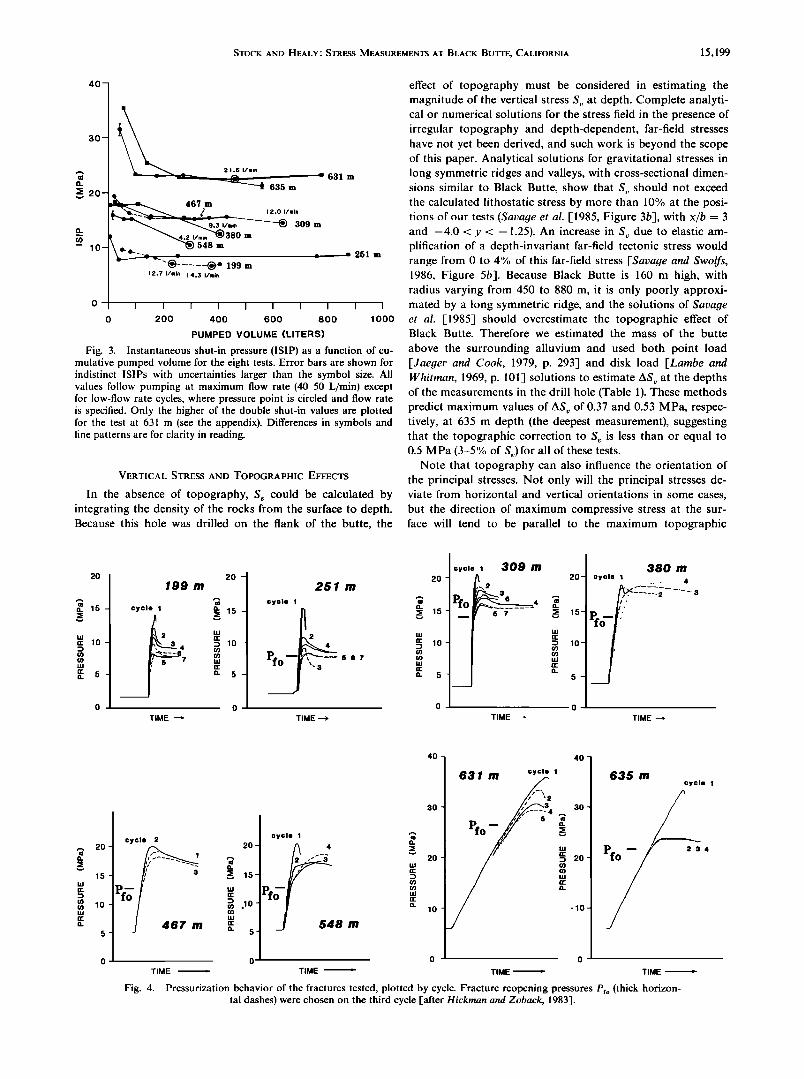
where P•, is the pore pressure and Pfo is the fracture reopening pressure, or the pressure at which the pressurization curve• for later cycles depart from the pressurization curve on the first cycle, indicating that the fracture has reopened and is accept- ing fluid. Generally, the value of Pro on the third cycle is used [see Hickman and Zoback, 1983]. Because of the su•btlety of this change in slope the fracture reopening pressures iFigure 4) are not always easily identified and have relatively large un- certainties due to slight variation in the flow rates.
STOCK AND HEALY.' STRESS MEASUREMENTS AT BLACK BUTTE, CALIFORNIA 15,199
40-
30-
'• - - -• • •'-• • 631 m O. 635 m
m • -'"'--.•/,.,. • 309 m
• R ••/•i. _•380 m
• '• .... • 199m • 251m I 2.7 I/ain 14.3 I/ain
0 [ I I I I I I I I I I 0 200 400 600 800 1000
PUMPED VOLUME (LITERS)
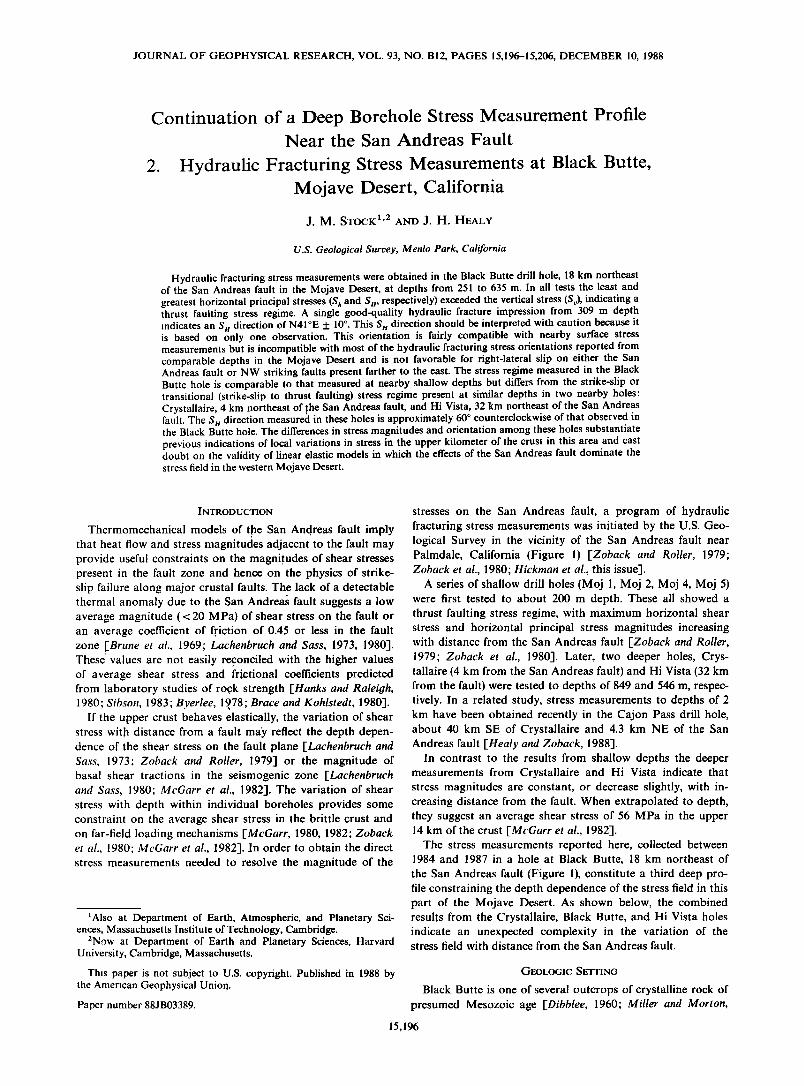
Fi•. 3. Instantaneous shut-in pressure (ISlP) as a function of cu- mulative pumped volume for the eight tests. Error bars are shown for indistinct ISlPs with uncertainties lar•er than the symbol size. All values follow pumping at maximum flow rate (4•50 L/min) except for low-flow rate cycles, where pressure point is circled and flow rate is specified. Only the hi•her of the double shut-in values are plotted for the test at 631 m (see the appendix). Differences in symbols and line patterns are for clarity in reading.
VERTICAL STRESS AND TOPOGRAPHIC EFFECTS
In the absence of topography, S v could be calculated by integrating the density of the rocks from the surface to depth. Because this hole was drilled on the flank of the butte, the
effect of topography must be considered in estimating the magnitude of the vertical stress S,, at depth. Complete analyti- cal or numerical solutions for the stress field in the presence of irregular topography and depth-dependent, far-field stresses have not yet been derived, and such work is beyond the scope of this paper. Analytical solutions for gravitational stresses in long symmetric ridges and valleys, with cross-sectional dimen- sions similar to Black Butte, show that S,, should not exceed the calculated lithostatic stress by more than 10% at the posi- tions of our tests (Savage et al. [1985, Figure 3b-I, with x/b = 3 and -4.0 < y < -1.25). An increase in S,, due to elastic am- plification of a depth-invariant far-field tectonic stress would range from 0 to 4% of this far-field stress [Savage and Swolfs, 1986, Figure 5b]. Because Black Butte is 160 m high, with radius varying from 450 to 880 m, it is only poorly approxi- mated by a long symmetric ridge, and the solutions of Savage et al. [1985] should overestimate the topographic effect of Black Butte. Therefore we estimated the mass of the butte
above the surrounding alluvium and used both point load [daeger and Cook, 1979, p. 293] and disk load [Lambe and Whitman, 1969, p. 101] solutions to estimate ASv at the depths of the measurements in the drill hole (Table 1). These methods predict maximum values of AS• of 0.37 and 0.53 MPa, respec- tively, at 635 m depth (the deepest measurement), suggesting that the topographic correction to S• is less than or equal to 0.5 MPa (3-5% of S 0 for all of these tests.
Note that topography can also influence the orientation of the principal stresses. Not only will the principal stresses de- viate from horizontal and vertical orientations in some cases, but the direction of maximum compressive stress at the sur- face will tend to be parallel to the maximum topographic
2o
uJ n- 10-
199 rn
cycle 1
2
34
TIME ---•
20-
Q- 15-
LU
• 10-
Q- 5 -
0 J
251 rn
cycle I • • 15
2 4 • 10 g
• 5
TIME ---->
I cycle I 309 m 20-
15-
5-
TIME --+
380 m cycle I -- 4
ß
TIME --->
20-
15-
10-
5 -
cycle 2 20-
g 15-
09 ,10-
J 467 rn Q.
30
cycle I • 4 •
2 .".'-i '-' 20
Pf • ,0 _I 548 rn
40- 40
631 m cycle 1
////•'•_2 30 x/"---: 4
- • 20
-10
o o o o
635 m cycle 1
/^
234 _
TIME : TIME :- TIME : TIME
Fig. 4. Pressurization behavior of the fractures tested, plotted by cycle. Fracture reopening pressures Pro (thick horizon- tal dashes) were chosen on the third cycle [after Hickman and Zoback, 1983].

15,200 STOCK AND HEALY' STRESS MEASUREMENTS AT BLACK BUTTE, CALIFORNIA
TABLE 1. Hydrofrac Results, Black Butte Drill Hole
SH Pb ISIP Pro Frac St, Greatest rxy
Breakdown Shut-in Reopen Pp Pore Vertical Sh Least Horizontal Shear Depth, Pressure, Pressure, Pressure, Pressure,* Stress,? Horizontal Stress, ASv,$ ASk,,õ Stress, Impression
m MPa MPa MPa MPa MPa Stress, MPa MPa MPa MPa MPa Resultô
199 14.7+_0.2 7.0+_0.5 1.2 5.2 0.03 0.22 A . .
251 15.0+_0.2 8.5+_0.2 8.'0•'1.0 1.8 6.5 •.:•+-' 0.2 1:•.• •- 1.6 0.06 0.28 3.•+_0.9 B 309 20.5+_0.2 15.5+_0.2 14.0+_ 1.0 2.3 8.1 15.5+_0.2 30.2+_ 1.6 0.10 0.36 7.4+_0.9 C
380 19.1+_0.2 17.7+_0.3 14.1+_1.0 3.2 10.0 -<17.7+_0.3 -<35.8+_1.9 0.16 0.42 . . . B 467 19.8+_0.2 15.5+_0.2 12.5+_1.0 4.0 12.2 -<15.5+_0.2 -<30.0+_1.6 0.24 0.47 . . . D 548 20.1+_0.2 16.0+_0.2 4.8 14.3 <16.0+_0.2 0.31 0.50 E 631 35.9+_0.2 22.4+_0.6 24.•'1.0 5.4 16.5 22.4+_0.6 3•;.•+-' 2.8 0.37 0.53 7.•-i.7 E 635 33.3+_0.2 23.0+_0.2 20.6+_1.0 5.5 16.6 23.0+_0.2 42.9+_1.6 0.38 0.53 9.9+_0.9 B
*Calculated for a water table at 76 m depth in 1984 tests and 70 m in 1985 tests. ?Calculated for an average density of 2.65 g/cm 3. No drift correction was applied because this hole is everywhere within 3 ø of vertical. $Estimate of the topographic correction to the calculated value of the vertical stress, by approximation of the butte as a point load. Point
load was applied 800 m from the drill hole. See text for discussion. õAlternative estimate of the topographic correction to the vertical stress, by approximating the butte as a disk load of radius 630 m. ôImpression results: A, high-angle preexisting fractures were recorded' B, no fractures seen' C, vertical fracture striking N41øE +_ 10 ø (in
1985) and 20-cm segment of vertical fracture striking N222øE +_ 10 ø (in 1987); D, short (<15 cm) length of vertical fracture striking N60øE +_ 10ø; E, no impression attempted.
gradient [e.g., Savage and Swolfs, 1986, Figure 7]. If the maxi- mum topographic gradient is not parallel to a principal stress direction in the far-field, the azimuths of the principal stress directions may vary locally. An exact calculation of the mag- nitude of the expected effects at Black Butte is beyond the scope of this paper, although it is worth noting that the direc- tion of the maximum topographic gradient at the Black Butte drill hole is N20øW, quite different from the N40øE S n direc- tion interpreted for the site, as discussed below.
UNCERTAINTIES IN S h
Part of the difficulty in identifying inflections in the pressure decay during shut-in may be linked to the rate of this pressure decay, which varied among the tests. The tests can be divided into three categories: tests with a rapid rate of pressure decay during shut-in, with pressures asymptotically approaching Pp (tests at 199, 380, 467, and 548 m); tests with slower rates of pressure decay and ISIP values equal to pumping pressures on later cycles (251,309, and 635 m); and tests with slow rates of pressure decay and ISIP inflections less than stable pumping pressures on later cycles (test at 631 m).
In tests of the first category there is clearly some communi- cation of fluid between the interval and the open hole at low pressures during the shut-in. In some of these tests (380 and 467 m) the character of the pressurization curves at the be- ginning of each cycle (Figure 4) suggests that the principal fi'acture is hydraulically dominant at flow rates of 50 L/min. This can be seen from the linear pressure increase to sharp breakdowns and repeatable reopening pressures, which looks very different from the continuously curved pressure increase and slow rollover that might characterize a large bypass to the open hole. However, at lower pumping rates these leak rates may become significant and mask the value of S h. Therefore the lowest stable pumping pressures from these tests are con- sidered to be upper bounds on the true value of Sh. Cycles for which a well-behaved fracture does not appear to be control- ling the hydraulic behavior (the test at 199 m and the last cycles of the tests at 380 and 548 m) were not used to obtain values of the principal stresses (see the appendix).
ORIENTATION OF THE STRESS FIELD'
FRACTURE IMPRESSIONS
Under the assumptions of the hydraulic fracturing theory, induced hydraulic fractures form parallel to Sn. The orienta- tion of the stress field can thus be deduced from the trace of
these fractures on an oriented impression packer [-see Ander- son and Stahl, 1967] or on an acoustic televiewer log. Al- though acoustic televiewer logs were run both before and after the hydrofrac testing, no induced hydraulic fractures or bore- hole breakouts [Bell and Gough, 1983] were observed. The lack of observable hydraulic fractures on these logs is not unusual; we infer this to be due to a hydraulic fracture aper- ture smaller than the resolution of the televiewer signal at these operating conditions.
In 1985, three attempts were made to obtain impressions of hydraulic fractures, one at 635 m depth and two at 309 m depth (see the appendix). The second attempt at 309 m depth yielded a successful impression, indicating an Sn direction of N41øE + 10 '• (Figure 5). Due to budget constraints, no other impressions were collected in 1985.
In 1987 we returned to the site to obtain impressions from more of the 1984 and 1985 hydrofrac intervals. Prior to the 1987 impressions, the water in the hole was replaced with thick drilling mud to maintain hole stability. This mud may have adversely affected our ability to obtain good impressions of the borehole wall in 1987. Nevertheless, six impression packers were inflated in the hydrofrac intervals at 199, 309, 467, 251,380, and 635 m depth (Table 1 and the appendix). All of these elements were scraped badly during the trip in and out of the hole, but three of them retained impressions of fractures when they were brought back to the surface. The poor quality of these impressions, the lack of borehole wall rock detritus on the returned packers, and the scarcity of im- pressions of preexisting or healed fractures may all have been due to the extremely thick mud in the hole. The quality of the impressions was not noticeably improved by inflation of some of the impression packers to seal pressures exceeding the breakdown pressures of the original tests. The 1987 post-

STOCK AND HEALY' STRESS MEASUREMENTS AT BLACK BUTTE, CALIFORNIA 15,201
HYDROFRAC 309 M
Unwrapped View of
Impression Packer TOP
I i i
E N W S BOTTOM
I • N41øE strike N97øE reference line
Fig. 5. Unwrapped tracing of the impression packer used at 309 m depth. Strike and reference line are given relative to geographic north. The impression was centered at 308.6 m depth.
thrust faulting stress regime, with S,, < S h (Figure 6). At some depths, especially in light of the upper bounds, this stress regime may be transitional to a strike-slip faulting stress regime. However, in the best constrained tests, S n is signifi- cantly greater in magnitude than Sh, indicating relatively high shear stresses on vertical planes ([S n - Sh]/2 ) as well as on the inclined planes containing the maximum shear stress ([S n - s•]/2).
It is often informative to examine results of stress measure-
ments in terms of the implications for frictional sliding on preexisting faults. A preexisting fault of optimal orientation will slide when the least and greatest principal stresses (S 3 and S•, respectively), the coefficient of sliding friction # and the pore pressure P•, meet the following condition [e.g., Sibson, 1974; Brace and Kohlstedt, 1980]:
(S, - Pp)/(S 3 - P•,)= [(#2 + 1),/2 + #]2 (2)
Application of this equation to the results from the Black Butte hole, where likely values of # range from 0.6 to 1.0 [Byerlee, 1978], shows that the observed S H values are within the range where frictional sliding might occur on preexisting faults, especially at depths of 300-400 m (Figure 6).
COMPARISON WITH REGIONAL DATA
Hydraulic fracturing. The results from the Black Butte hole, 18 km from the San Andreas fault, indicate a thrust
impression acoustic televiewer log showed no new fractures when compared to the log obtained prior to hydrofrac testing in 1984.
In summary, the one impression from 309 m, obtained in 1985, is of high quality, but the lack of independent confir- mation of this orientation at other depths, as well as the scat- ter in Sn orientation observed in other drill holes nearby [Hickman et al., this issue; Shamir et al., 1988] renders this Sn direction somewhat uncertain.
Because only two of the hydraulic fractures were directly observed to be vertical, the possibility that these tests created nonvertical, or even horizontal, fractures must be evaluated.
Certainly, the lack of results on many of the impressions would permit the possibility of nonvertical fractures being present but unrecorded by the impressions. However, the most reliable ISIP values from these tests exceed uncorrected values
of S v by 25-90% and corrected values by 22-83%. If the fractures had been horizontal, then the ISIP values imply a vertical stress far in excess of that expected from the topogra- phy present. Vertical stresses both greater than and less than the calculated lithostat have been obtained from overcoring and from ISIP measurements on horizontal fractures [e.g., McGarr and Gay, 1978; Evans et al., 1988]; but we know of no cases where measured Sv values exceed expected S• values by as much as 83%. It thus seems unlikely that the ISIP values measured in the Black Butte hole reflect normal stresses on
horizontal planes. The possibility of oblique planes cannot be ruled out; variation in orientations of the fractures, if present, may have contributed to the scatter in the S h values.
STRESS REGIME AND FAULT SLIP
The S h and Sn values obtained in the Black Butte hole generally increase with depth along a trend characteristic of a
lOO
200
• 300
,I--
• 4o•
STRESS (•MPa) 0 10 20 30 40 50 60
I ,I
o
eSh IS H
•-upper
bound
800
Fig. 6. Stress magnitudes plotted as a function of depth in the Black Butte hole (Table 1). Circles, least horizontal principal stress squares, greatest horizontal principal stress S n. Error bars indicate the uncertainty in the calculated S n values. Arrows indicate values treated as upper bounds (see text for discussion). Uncertainties in the S•, values are less than the width of the symbol. Lines indicate values of the pore pressure and the vertical stress (Table 1). A frictional sliding criterion for thrust faulting (equation (2) in text) was used to obtain limits on the field where optimally oriented preexisting faults would be stable, for two bounding values of the coefficient of friction p of 0.6 and 1.0. S n values to the right of these lines imply that frictional sliding might be expected on optimally oriented preexisting faults for the specified value of the coefficient of friction.

15,202 STOCK AND HEALY: STRESS MEASUREMENTS AT BLACK BUTTE, CALIFORNIA
faulting stress regime at depths from 200 to 650 m, with the possibility of a transition to a strike-slip stress regime at some depths. Thrust faulting stress regimes have also been observed throughout the four 200-m-deep holes in this area (Moj 1, M oj 2, Moj 4, Moj 5) [Zoback and Roller, 1979' Zoback et al., 1980]. Although both XTLR and Hi Vista (4 and 32 km, respectively, from the San Andreas fault) have thrust faulting stress regimes at shallow depths, they have strike-slip or tran- sitional (strike-slip to thrust faulting) stress regimes at greater depths (from 550 and 250 m, respectively, to the bottoms of the holes at 850 and 550 m, respectively). The ARKOMA drill hole in Cajon Pass has a normal faulting stress regime be- tween 1 and 1.5 km depth, and the DOSECC drill hole in Cajon Pass (Figure 1) has a strike-slip faulting stress regime at 2 km depth [Healy and Zoback, 1988].
The S H direction determined from the one orientation measurement in the Black Butte hole, N41øE + 10 ø, differs
from previous hydraulic fracturing results nearby. Stress orien- tations from the other holes in the Mojave Desert show con- siderable scatter [Hickman et al., this issue], suggesting that the Black Butte orientation should be intepreted with caution in the absence of other data. The highest-quality measure- ments from holes elsewhere in the Mojave Desert indicate an approximate NW to NNE direction of S H [Hickman et al., this issue' Zoback et al., 1980], and the Cajon Pass drill hole has a mean S u direction N73øE, with a scatter of _+37 ø [Shamir et al., 1988]. Thus the one measurement from the Black Butte hole is 40c:'-80 ø clockwise from the orientation in the western
Mojave Desert and 15ø-60 ø counterclockwise from the orien- tation at the Cajon Pass drill hole.
Strain relaxation. A series of shallow strain relaxation
measurements made by overcoring, and interpreted for S u di- rection, indicated NNW to ENE directions of S u within 20 km of Black Butte. These are N34øE from Adobe Mountain
(15 km NNE of Black Butte), N78øE and N32øE from two sites at Lovejoy Buttes (13 km WNW of Black Butte), and N87CE at Black Butte itself (all doorstopper measurements from Sbaret al. [1979])' N60øE + 3 ø at Lovejoy Buttes, N16'W _+ 59 • at Adobe Mountain, and N4øW _+ 11 ø at Piute Butte, 16 km NW of Black Butte (all measurements made with the U.S. Bureau of Mines technique [from Tullis, 1981]). Be- cause these measurements were all made within 6 m of the
surface, where later work showed that induced thermal
stresses dominate, the relevance of these overcoring results to the tectonic stress field has been questioned [Sbar et al., 1984]. Strain relaxation measurements from 6 to 29 m depth at Piute Butte (below the zone of thermal perturbation) yielded an S u direction of N13'W _+ 3 c::', in good agreement both with Tu!lis's [1981] overcoring measurement and with various stress indicators close to the Palmdale section of the San An-
dreas fault [Sbaret al., 1984]. Sbar et al.'s [1979] doorstopper measurement at Black Butte yielded an S, direction 46 • clock- wise of that obtained from our impression at 309 m.
The interpretation and significance of these results, in light of the thermal stress problem, will require detailed analysis that is beyond the scope of this paper. It is worth noting that these measurements indicate SH directions ranging from NNW clockwise to east, encompassing the values obtained from the stress orientations at Black Butte, Crystallaire, Hi Vista, and Cajon Pass and possibly providing additional indication of nonuniform principal stress directions in the western Mojave Desert.
Faults. Known major faults within about 30 km of Black Butte strike NW (Figure 1). The historically active faults clos- est to Black Butte are those of the San Andreas fault system, 18 km to the southwest. The NW striking Mirage Valley fault, 12 km northeast of the Black Butte hole, and the NW striking Llano fault, 9 km SW of the Black Butte hole, have Quater- nary displacement [Bortu.qno and Spittier, 1986]. The timing and amount of displacement on these faults are unknown, but they are parallel to the active NW striking right-lateral strike- slip faults of the central Mojave Desert to the east. A low level of seismicity is recorded in this part of the western Mojave Desert, with active seismicity increasing both toward the San Andreas fault and toward the central Mojave Desert [e.g.,
,
Hileman and Hanks, 1975]. Seismicity. The depth ranges sampled by these stress
measurements and by the seismicity do not overlap, but exam- ination of regional focal mechanisms shows that the relative stress magnitudes measured in the Black Butte hole may be present elsewhere in the Mojave Desert. Focal mechanisms of earthquakes in the central Mojave Desert generally indicate strike-slip motion, with nodal planes frequently parallel to mapped Quaternary faults striking N15øW to N45øW [Sauber et al.. 1986]. Focal mechanisms from the San Andreas fault region near Palmdale show considerably more scatter, with both strike-slip and thrust mechanisms recorded, and up to 60 •-> variation in the compression axes of the events [McNally et al., 1978' Sauber et al., 1983]. Sauber et al. [1983] report focal mechanisms for four earthquakes in the Mojave block north of the San Andreas fault, within 20 km of Black Butte. Three of these events show pure thrust faulting, and the re- maining event shows oblique thrust faulting' all have shallow- dipping. north to NNE trending compression axes. Compres- sion axes oriented N-S were also observed in some of the later
thrusting events in the Juniper Hills swarm, south of the San Andreas fault near Pearblossom [McNally et al., 1978]. The thrust faulting stress regime indicated by these events is con- sistent with the magnitudes of the principal stresses observed in the Black Butte hole, but the compression axes for these focal mechanisms are 20•-40 • clockwise of the S n direction inferred from the hydraulic fracturing impression recovered from the Black Butte hole.
Geodetic strain measurements. Additional information on
the current patterns of deformation in the area near Black Butte come from the Tehachapi and Palmdale trilateration networks [e.g., Sara.qe, 1983]. The Palmdale network spans the San Andreas fault in a small area near Palmdale, east of
Black Butte' the Tehachapi network spans the Garlock and White Wolf faults, as well as the "big bend" in the San An- dreas fault. A line from Black Butte west to Littlerock forms
the southeastern corner of the Tehachapi network. For the period 1973-1983, axes of principal shortening for the Palm- dale network and the San Andreas subset of the Tehachapi network were oriented N19•W + 2 ø and N17<•W _+ 1 ø, respec- tively [Kin.q and Sat,a•de, 1984]. The axes of principal exten- sion for both of these networks are nearly parallel to the line from Black Butte to Littlerock, which showed extension during this period. Although principal axes of infinitesimal strain change and principal axes of total stress are only paral- lel for homogeneous deformation of an isotropic solid in which the principal axes of strain are invariant with time, it is encouraging that the current tectonic deformation measured by these trilateration networks is consistent with the orienta-
STOCK AND HEALY' STRESS MEASUREMENTS AT BLACK BUTTE, CALIFORNIA 15,203
o
lOO -
2oo
3oo
•.• 400 -
Cl 500 -
600 -
700 -
800 -
10
Stress (MPa) 2O 30 4O 5O 6O
I I I
9OO
I I
Sh S H XTLR 0 ß Black Butte [] ß
HI Vista A ß
upper •' bound
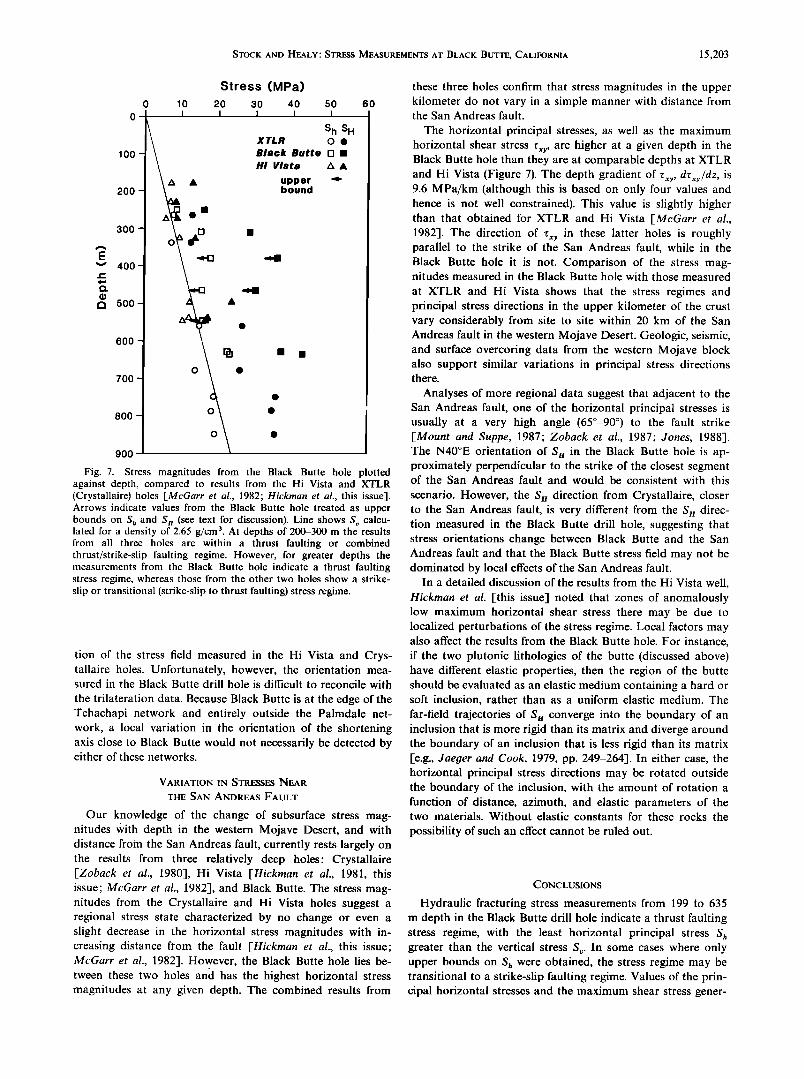
Fig. 7. Stress magnitudes from the Black Butte hole plotted against depth, compared to results from the Hi Vista and XTLR (Crystallaire) holes [McGarr et al., 1982; Hickman et al., this issue]. Arrows indicate values from the Black Butte hole treated as upper bounds on S h and S n (see text for discussion). Line shows S•, calcu- lated for a density of 2.65 g/cm 3. At depths of 200-300 m the results from all three holes are within a thrust faulting or combined thrust/strike-slip faulting regime. However, for greater depths the measurements from the Black Butte hole indicate a thrust faulting stress regime, whereas those from the other two holes show a strike- slip or transitional (strike-slip to thrust faulting) stress regime.
tion of the stress field measured in the Hi Vista and Crys- tallaire holes. Unfortunately, however, the orientation mea- sured in the Black Butte drill hole is difficult to reconcile with
the trilateration data. Because Black Butte is at the edge of the Tehachapi network and entirely outside the Palmdale net- work, a local variation in the orientation of the shortening axis close to Black Butte would not necessarily be detected by either of these networks.
VARIATION IN STRESSES NEAR
THE SAN ANDREAS FAULT
Our knowledge of the change of subsurface stress mag- nitudes with depth in the western Mojave Desert, and with distance from the San Andreas fault, currently rests largely on the results from three relatively deep holes: Crystallaire FZoback eta!., 19803, Hi Vista [Hickman et al., 1981, this issue; McGarr et al., 1982], and Black Butte. The stress mag- nitudes from the Crystallaire and Hi Vista holes suggest a regional stress state characterized by no change or even a slight decrease in the horizontal stress magnitudes with in- creasing distance from the fault [Hickman et al., this issue; McGarr et al., 1982]. However, the Black Butte hole lies be- tween these two holes and has the highest horizontal stress magnitudes at any given depth. The combined results from
these three holes confirm that stress magnitudes in the upper kilometer do not vary in a simple manner with distance from the San Andreas fault.
The horizontal principal stresses, as well as the maximum horizontal shear stress Zxy, are higher at a given depth in the Black Butte hole than they are at comparable depths at XTLR
and Hi Vista (Figure 7). The depth gradient of Zxy, dzx•./dz, is 9.6 MPa/km (although this is based on only four values and hence is not well constrained). This value is slightly higher than that obtained for XTLR and Hi Vista [McGarr et al., 1982]. The direction of rx• in these latter holes is roughly parallel to the strike of the San Andreas fault, while in the Black Butte hole it is not. Comparison of the stress mag- nitudes measured in the Black Butte hole with those measured
at XTLR and Hi Vista shows that the stress regimes and principal stress directions in the upper kilometer of the crust vary considerably from site to site within 20 km of the San Andreas fault in the western Mojave Desert. Geologic, seismic, and surface overcoring data from the western Mojave block also support similar variations in principal stress directions there.
Analyses of more regional data suggest that adjacent to the San Andreas fault, one of the horizontal principal stresses is usually at a very high angle (650-90 ø) to the fault strike [Mount and Suppe, 1987; Zoback et al., 1987; Jones, 1988]. The N40øE orientation of S H in the Black Butte hole is ap- proximately perpendicular to the strike of the closest segment of the San Andreas fault and would be consistent with this
scenario. However, the SH direction from Crystallaire, closer to the San Andreas fault, is very different from the S• direc- tion measured in the Black Butte drill hole, suggesting that stress orientations change between Black Butte and the San Andreas fault and that the Black Butte stress field may not be dominated by local effects of the San Andreas fault.
In a detailed discussion of the results from the Hi Vista well, Hickman et al. [this issue] noted that zones of anomalously low maximum horizontal shear stress there may be due to localized perturbations of the stress regime. Local factors may also affect the results from the Black Butte hole. For instance, if the two plutonic lithologies of the butte (discussed above) have different elastic properties, then the region of the butte should be evaluated as an elastic medium containing a hard or soft inclusion, rather than as a uniform elastic medium. The
far-field trajectories of Sn converge into the boundary of an inclusion that is more rigid than its matrix and diverge around the boundary of an inclusion that is less rigid than its matrix [e.g., daefier and Cook, 1979, pp. 249-264]. In either case, the horizontal principal stress directions may be rotated outside the boundary of the inclusion, with the amount of rotation a function of distance, azimuth, and elastic parameters of the two materials. Without elastic constants for these rocks the
possibility of such an effect cannot be ruled out.
CONCLUSIONS
Hydraulic fracturing stress measurements from 199 to 635 m depth in the Black Butte drill hole indicate a thrust faulting stress regime, with the least horizontal principal stress S h greater than the vertical stress S•,. In some cases where only upper bounds on Sh were obtained, the stress regime may be transitional to a strike-slip faulting regime. Values of the prin- cipal horizontal stresses and the maximum shear stress gener-

15,204 STOCK AND HEALY' STRESS MEASUREMENTS AT BLACK BUTTE, CALIFORNIA
ally increase with depth. This stress regime is similar to that measured at shallow depths in other drill holes in the western Mojave Desert but differs from the strike-slip stress regime measured at comparable depths in two deeper holes nearby: XTLR (4 km from the San Andreas fault) and Hi Vista (32 km from the San Andreas fault). The Su direction measured in the Black Butte drill hole, N41øE, is 40ø-80 ø clockwise of the best constrained values from the other drill holes nearby.
The stress field in the western Mojave Desert is complex, as observed by McGarr et al. [1982] and Hickman et al. [this issue]. There is considerable variability in the state of stress at all depths that have b•en measured in this region, exceeding what might be expected from measurement errors or system- atic change related to depth or distance from the San Andreas fault. Results from the Black Butte hole confirm this varia-
bility; the S• orientation obt:fined there makes it yet more difficult to fit all of the stress, •easurements from this area, or even the deeper measurements alone, into the simple patterns formerly proposed for stress variation with distance from the San Andreas fault. At depths of 200 m or less, Zoback and Roller [1979] and McGarr et al. [1982] showed that there does appear to be an increase in the horizontal principal stresses with distance from the San Andreas fault. Such a
trend might be inferred from the deeper measurements in the Crystallaire and Black Butte holes; the opposite trend would be inferred from either the Black Butte and Hi Vista holes
alone or the Crystallaire and Hi Vista holes alone. At present, the data from all three holes imply that the stress field at 18-32 km from the San Andreas fault is truly complex and not simply dominated by the effects of the fault itself.
APPENDIX: DETAILS OF HYDRAULIC FRACTURING
TEST CURVES AND IMPRESSIONS
Test at 199 m. This test appears to be a leak, rather than a true hydrofrac, because (1) fracture opening pressures (Pro) decreased continually from cycle to cycle and showed no tend- ency to stabilize (Figure 4); and (2) pressures decreased con- tinually during pumping and never reached steady values on any cycle, despite the 50 L/min flow rates. The impression taken at this depth (discussed below) recorded portions of preexisting fractures but no vertical hydraulic fracture, sug- gesting that this test may have been dominated by preexisting natural fractures, perhaps coupled with packer bypass. For these reasons, neither S h nor Sn was calculated from this test.
In 1987 a 2.7-m-long TAM impression element was cen- tered at 198.7 m and inflated for 30 min. Inflation pressure varied due to the presence of a leak in the drill pipe. During part of this inflation, packer seal pressure (assuming 85% seal efficiency [e.g., Et•ans, 1987]) exceeded the breakdown pres- sure Ph of the original hydrofrac test (Table 1). Impressions of portions of two high-angle fractures were recorded at the top and bottom of the impression packer. These correlate well in spacing and orientation with two fractures visible on the tele- viewer log recorded prior to hydrofrac testing, in June 1984. Because these fractures were not created by hydrofrac testing, they cannot be used to determine the Sn direction. Short lengths (< 15 cm) of other near-vertical fractures were visible on the impression packer but were insufficient to yield Su direction. Images of these fractures were not visible on the 1984 televiewer log.
Test at 251 m. On the second cycle a valve was leaking at the manifold. The valve was closed after shut-in but not before
some accidental flowback had occurred. Because of the very
short pumping time and consequent rapid pressure decay on cycle 3, only cycles 1 and 4-7 were used in the interpretation. At the end of cycle 6 the packers were left set in the interval
for approximately 12 hours in order to allow any excess P•, to dissipate. Then, cycle 7 was conducted as an experiment to determine whether the longer equilibration time affected the fracture behavior. The pressure-time curve of this final cycle was basically identical to that of cycle 6, indicating that per- haps no significant excess pore pressure built up during the first five cycles, as might be expected for low-permeability granite. Because no inflections were observed in the pressure- time curves during shut-in for cycles 4-7, the stable pumping pressures at the ends of these cycles are equal to the ISIPs. A plot of ISIP against total pumped volume (Figure 3)con- strains S h as 8.5 + 0.2 MPa.
An impression packer was inflated at this depth in 1987, at a seal pressure Pro < Pscal < Pt,, for 45 min. The packer had about 1,/4 of its rubber scraped off during the trip into and out of the hole. No fractures were visible on the remaining im- pression rubber.
Test at 309 m. The value of S• is taken from the consistent values of ISIP on cycles 3-6. The ISIP of cycle 7 is lower but is not used because the pressure in the interval decreased con- tinuously during the low flow rate pumping earlier in cycle 7.
Two impressions were attempted at this depth in 1985. First, a 2-m-long conventional TAM straddle packer element,, wrapped with impression rubber, was inflated to a seal pres- sure P•o < Pseal < Pt,, for 70 min. However, when the packer was removed from the hole, no fracture impressions were vis- ible. The packer was undamaged, but the rubber was very hard and may have cured prematurely because of exposure to strong sunlight during assembly. A new packer was prepared in the shade, lowered to the same depth, and inflated for 30 min, to a seal pressure Psea• > Pt,' This recorded a very fine hairline impression of a vertical fracture, apparently merging with a dipping fracture, both striking N41øE +_ 10 ø (Figure 5). These fractures were not visible on televiewer logs either before or after the hydraulic fracturing test. This orientation indicates an S u direction of N41øE +_ 10 ø.
A 2.7-m TAM impression packer was inflated in this inter- val for 39 rain in 1987, with a seal pressure Ps½• > Pt,- This packer did not deflate completely after the impression, and much of the rubber had been scraped off when the packer was retrieved. However, a 20-cm-long vertical fracture was visible on one side of the packer, at an azimuth of N222øE, centered at a depth of 307.5 m. This may correspond to the continu- ation of the fracture striking N41•E _+ 10 '• (a difference of 1 ø in azimuth) on the 1985 impression (Figure 5). The 1987 im- pression should have overlapped the upper 1 m of the 1985 impression at this depth, but the dipping fracture visible on the 1985 impression was not recorded on the 1987 impression.
Test at 380 m. The first three cycles of this test showed repeatable pressurization behavior' cycle 4 showed progres- sively slower pressurization and higher pumping pressures. The rapid pressure decay at the end of each cycle suggests a leak back to the drill hole. A step rate injection test was conducted at the end of cycle 4, but the continuous drop in pressure during each pumping step did not allow the mag- nitude of S• to be precisely constrained. The average steady pumping pressure at the end of cycles 2, 3, and 4 is taken to be an upper bound on the value of S•. Because a value of Pro on cycle 3 could be chosen with reasonable confidence, an upper bound on S u was also computed (Table 1).

STOCK AND HEALY' STRESS MEASUREMENTS AT BLACK BUTTE, CALIFORNIA 15,205
An impression packer was inflated at this depth in 1987 to a seal pressure Pro < P•ea• < Pb (Table 1). This pressure was only maintained for 14 min due to a leak in the drill pipe. This packer was not significantly scraped and had wall rock debris embedded in the rubber, but no fractures were visible.
Test at 467 m. Cycle 4 consisted of a steprate pumping test that began before cycle 3 pressures had been bled back to equilibrium (the level of the water table). The final flow rate on cycle 4 resulted in similar pressurization and rollover to that observed during the three earlier cycles. Because the rapid pressure decay at the end of each cycle suggests a large leak back to the drill hole, the stable pumping pressure at the end of the test, 15.5 _+ 0.2 MPa, is considered to be only an upper bound on the value of S h. Note that low-flow rate pumping at the beginning of cycle 4 appeared to be approaching an equi- librium value close to S•. (Figure 2).
In 1987 an impression packer was inflated here with Pro < Pseal < P•, for 1 hour. This recorded a 20-m vertical fracture trace at the center of the element and a few centimeters of a
lower-angle fracture at the base of the inflated interval. Be- cause mechanical problems prevented confirmation of the first compass reading with a duplicate compass reading, this frac- ture was not used to determine Sn orientation.
Test at 548 m. The pressure-time record of this test was very similar to that of the test at 380 m depth (Figure 2). The pressure decayed very rapidly to the pore pressure (P•,) during shut-in (suggesting communication with the open hole), and pressures continually decreased during step rate pumping on the fourth cycle. No inflections are visible in the pressure-time curves following shut-in, so the ISIP for each cycle is equal to the pressure at shut-in. The average steady pumping pressure at the end of cycles 2 and 3 is taken to be an upper bound on the value of S h. The ISIP at the end of cycle 4 (Figure 3) was much lower because of the low flow rates used in the step rate pumping test. Pressurization of cycles 1 and 2 was similar (Figure 4), but both cycles 3 and 4 look very different. Thus, although a value of Pro may be chosen on cycle 3, its relevance to the rest of the test is unclear, and it has not been used in
determining an upper bound on S n (Table 1). No impression was attempted at this depth. Test at 631 m. In this test, two inflections (ISIPs) are vis-
ible in each of the pressure-time curves after shut-in on the last three cycles, at 23.0 _+ 0.2 MPa and at 21.8 ___ 0.2 MPa (Figure 2). The origin of this double shut-in pressure is not known but may be due to a slight change in orientation of the hydraulic fracture away from the borehole. The Sh value for this test, 22.4 _+ 0.6 MPa, is the average of these shut-in pres- sures and includes both. Note that these ISIPs are consistently lower than the steady pumping pressures preceding shut-in and are constant regardless of the different flow rates preced- ing them (Figure 2), suggesting that the behavior of the frac- ture is very repeatable and not influenced by flow rate.
No impression was attempted at this depth. Test at 635 m. During cycle 3, and on the early portions of
subsequent cycles, the pumping pressure dropped to a plateau of 23.0 +_ 0.2 MPa. On cycles 4 and 5 this was followed by a rise to higher pressure. This plateau, together with the ISIP from cycles 2 and 3, gives the value of Sh at this depth. The pumping pressure at a very low flow rate at the end of the test (Figure 3) was less than the calculated value of Sh, presumably because of small leaks past the packers or permeation of the fluid into the formation. The reopening behavior of this frac- ture was very repeatable (Figure 4).
In 1985 an impression was attempted at this depth, but the packer was damaged while coming out of the hole, and no fractures were observed. In another attempt in 1987 the packer leaked during inflation and moved several meters up the hole. This sheared off all of the rubber, so no impressions were recorded.
Acknowledgments. Mark Ader, Kirk Behrendt, David Castillo, Tom Denham, Rob Harris, Jacky Hennegan, Stephen Hickman, Jim Huckaby, Laura Jones, Rick Ludlum, Brennan O'Neill, Jim Springer, Dennis Styles, and Joe Svitek assisted with various aspects of the three field operations. Special thanks go to Mark Zoback and Don Stierman for their participation in this experiment. Bill Brace, Terry Engelder, J. Brian Evans, Stephen Hickman, Art McGarr, Ross Stein, Don Stierman, and an anonymous JGR reviewer provided thorough and helpful reviews. Research performed while the first author was a graduate student at MIT was supported by a fellowship from the Fannie and John Hertz Foundation.
REFERENCES
Anderson, T. O., and E. J. Stahl, A study of induced fracturing using an instrumental approach, J. Pet. Technol., 19, 261-267, 1967.
Bell, J. S., and D. I. Gough, The use of borehole breakouts in the study of crustal stress, in Hydraulic Fracturing Stress Measure- ments, edited by M.D. Zoback and B.C. Haimson, pp. 201-209, National Academy Press, Washington, D.C., 1983.
Bortugno, E. J., and T. E. Spittier, Geologic map of the San Bernard- ino Quadrangle, Map 3A (Geology), Calif. Div. of Mines and Geol., Sacramento, 1986.
Brace, W. F., and D. L. Kohlstedt, Limits on lithospheric stress im- posed by laboratory experiments, J. Geophys. Res., 85, 6248-6252, 1980.
Bredehoeft, J. D., R. G. Wolff, W. S. Keys, and E. Shuter, Hydraulic fracturing to determine the regional in situ stress field, Piceance Basin, Colorado, Geol. Soc. Am. Bull., 87, 250-258, 1976.
Brune, J. N., T. L. Henyey, and R. F. Roy, Heat flow, stress, and rate of slip along the San Andreas fault, California, d. Geophys. Res., 74, 3821-3827, 1969.
Byedee, J. D., Friction of rocks, Pure Appl. Geophys., 116, 615-626, 1978.
Dibblee, T. W., Jr., Preliminary Geologic Map of the Shadow Moun- tains Quadrangle, Los Angeles and San Bernardino counties, CA., U.S. Geol. Surv. Miner. Invest. Field Map, MF-227, 1960.
Evans, K., A laboratory study of two straddle-packer systems under simulated hydrofrac stress-measurement conditions, d. Ener•ty Resour. Technol., 109, 180-190, 1987.
Evans, K. F., C. H. Sholz, and T. Engelder, An analysis of horizontal fracture initiation during hydrofrac stress measurements in granite at North Conway, New Hampshire, Geophys. d. R. Astron. Soc., 93, 251-264, 1988.
Gronseth, J. M., and P. R. Kry, Instantaneous shut-in pressure and its relationship to the minimum in-situ stress, in Hydraulic Fracturing Stress Measurements, eidited by M. D. Zoback and B.C. Haimson, pp. 55-60, National Academy Press, Washington, D.C., 1983.
Haimson, B.C., and C. Fairhurst, Initiation and extension of hy- draulic fractures in rock, Soc. Pet. Eng. d., 7, 310-318, 1967.
Hanks, T. C., and C. B. Raleigh, The conference on magnitude of deviatoric stresses in the Earth's crust and uppermost mantle, J. Geophys. Res., 85, 6083-6085, 1980.
Healy, J. H., and M. D. Zoback, Hydraulic fracturing in-situ stress measurements to 2.1 km depth at Cajon Pass, California, Geophys. Res. Lett., 15(9), 1005-1008, 1988.
Hickman, S. H., and M. D. Zoback, The interpretation of hydraulic fracturing pressure-time data for in-situ stress determination, in Hydraulic Fracturing Stress Measurements, edited by M. D. Zoback and B.C. Haimson, pp. 44-54, National Academy Press, Wash- ington, D.C., 1983.
Hickman, S. H., J. H. Healy, M.D. Zoback, and J. Svitek, Recent in-situ stress measurements at depth in the western Mojave Desert, Eos Trans. AGU, 62, 1048, 1981.
Hickman, S. H., J. H. Healy, and M.D. Zoback, In situ stress, natural fracture distribution, and borehole elongation in the Auburn geo- thermal well, Auburn, New York, d. Geophys. Res., 90, 5497-5512, 1985.
15,206 STOCK AND HEALY: STRESS MEASUREMENTS AT BLACK BUTTE, CALIFORNIA
Hickman, S. H., M.D. Zoback, and J. H. Healy, Continuation of a deep borehole stress measurement profile near the San Andreas fault, 1, Hydraulic fracturing stress measurements at Hi Vista, Cali- fornia, J. Geophys. Res., this issue.
Hileman, J. A., and T. C. Hanks, Seismicity along the San Andreas fault, Southern California, San Andreas Fault in Southern Califor- nia, Spec. Rep. 118, pp. 28-39, Calif. Div. of Mines and Geol., Sacramento, 1975.
Hubbert, M. K., and D. G. Willis, Mechanics of hydraulic fracturing, J. Pet. Technol., 9, 153-168, 1957.
Jaeger, J. C., and N. G. Cook, Fundamentals of Rock Mechanics, Chapman and Hall, London, 1979.
Jennings, C. W., Fault map of Californid, with locations of volcanoes, thermal springs, and thermal wells, Geol. Data Map 1, Calif. Div. of Mines and Geol., Sacramento, 1975.
Jones, L. M., Focal mechanisms and the state of stress on the San Andreas fault in southern California, J. Geophys. Res., 93, 8869- 8891, 1988.
King, N. E., and J. C. Savage, Regional deformation near Palmdale, California, 1973-1983, J. Geophys. Res., 89, 2471-2477, 1984.
Lachenbruch, A. H., and J. H. Sass, Thermo-mechanical aspects of the San Andreas fault system, in Proceedin,is of the Conference on the Tectonic Problems of the San Andreas Fault System, edited by R. L. Kovach and A. Nur, pp. 192-205, Stanford University Press, Palo Alto, Calif., 1973.
Lachenbruch, A. H., and J. H. Sass, Heat flow and energetics of the San Andreas fault zone, J. Geophys. Res., 85, 6185-6222, 1980.
Lambe, T. W., and R. V. Whitman, Soil Mechanics, John Wiley, New York, 1969.
McGarr, A., Some constraints on levels of shear stress in the crust from observations and theory, J. Geophys. Res., 85, 6231-6238, 1980.
McGarr, A., At•alysis of states of stress between provinces of constant stress, J. Geophys. Res., 87, 9279-9288, 1982.
McGarr, A., and N. C. Gay, State of stress in the Earth's crust, Annu. Rev. Earth Planet. Sci., 6, 405-436, 1978.
McGarr, A., M.D. Zoback, and T. C. Hanks, Implications of an elastic analysis of in situ stress measurements near the San Andreas fault, d. Geophys. Res., 87, 7797-7806, 1982.
McNally, K. C., H. Kanamori, J. C. Pechmann, and G. Fuis, Earth- quake swarm along the San Andreas fault near Palmdale, Califor- nia, 1976 to 1977, Science, 201, 814-817, 1978.
Miller, F. K., and D. M. Morton, Potassium-argon geochronology of the eastern Transverse Ranges and southern Mojave Desert, south- ern California, U.S. Geol. Surv. Prof. Pap., 1152, 30 pp., 1980.
Mount, V. S., and J. Suppe, State of stress near the San Andreas fault: Implications for wrench tectonics, Geolo•ty, 15, 1143-1146, 1987.
Sauber, J., K. McNally, J. C. Pechmann, and H. Kanamori, Seismicity near Palmdale, California, and its relation to strain changes, J. Geophys. Res., 88, 2213-2219, 1983.
Sauber, J., W. Thatcher, and S.C. Solomon, Geodetic measurement of deformation in the central Mojave Desert, California, J. Geophys. Res., 91, 12,683-12,693, 1986.
Savage, J. C., Strain accumulation in western United States, Annu. Rev. Earth Planet. Sci., 11, 11-43, 1983.
Savage, W. Z., and H. S. Swolfs, Tectonic and gravitational stress in long symmetric ridges and valley, J. Geophys. Res., 91, •3677-3685, 1986.
Savage, W. Z., H. S. Swolfs, and P.S. Powers, Gravitational stresses in long symmetric ridges and valleys, Int. J. Rock Mech. Min. Sci. Geo•nech. Abstr., 22(5), 291-302, 1985.
Sbar, M. L., T. Engelder, R. Plumb, and S. Marshak, Stress pattern near the San Andreas fault, Palmdale, California, from near-surface in situ stress measurements, d. Geophys. Res., 84, 156-164, 1979.
Sbar, M. L., R. M. Richardson, C. Flaccus, and T. Engelder, Near- surface in situ stress, 1, Strain relaxation measurements and the San Andreas fault in southern California, d. Geophys. Res., 89, 9323- 9332, 1984.
Shamir, G., M. D. Zoback, and C. A. Barton, In situ stress orienta- tions near the San Andreas fault: Preliminary results to 2.1 km depth from the Cajon Pass Scientific Drill Hole, Geophys. Res. Lett., 15, 989-992, 1988.
Sibson, R. H., Frictional constraints on thrust, wrench, and normal faults, Nature, 249, 542-544, 1974.
Sibson, R. H., Continental fault structure and the shallow earthquake source, d. Geol. Soc. London, 140, 741-767, 1983.
Springer, J. E., and G. D. Myren, Geologic data report on the Black Butte hydrofrac hole, western San Bernardino County, California, U.S. Geol. Surv. Open File Rep., 85-214, 25 pp., 1985.
Tullis, T. E., Stress measurements via shallow overcoring near the San Andreas fault, in Mechanical Behavior of Crustal Rocks: The Handin Volume Geophys. Mono•tr. Ser., vol. 24, edited by M. L. Carter, M. Friedman, J. M. Logan, and D. W. Stearns, pp. 199-214, AGU, Washington, D.C., 1981.
Zemanek, J., E. E. Glenn, L. J. Norton, and R. L. Caldwell, Forma- tion evaluation by inspection with the borehole televiewer, Geo- physics, 35, 254-269, 1970.
Zoback, M.D., and S. Hickman, In situ study of the physical mecha- nisms controlling induced seismicity at Monticello Reservoir, South Carolina, d. Geophys. Res., 87, 6959-6974, 1982.
Zoback, M.D., and J. C. Roller, Magnitude of shear stress on the San Andreas fault: Implications from a stress measurement profile at shallow depth, Science, 206, 445-447, 1979.
Zoback, M.D., H. Tsukahara, and S. Hickman, Stress measurements at depth in the vicinity of the San Andreas fault: Implications for the magnitude of shear stress at depth, J. Geophys. Res., 85, 6157- 6173, 1980.
Zoback, M. D., et al., New evidence on the state of stress of the San Andreas fault system, Science, 238, 1105-1111, 1987.
J. H. Healy, U.S. Geological Survey, MS 977, 345 Middlefield Road, Menlo Park, CA 94025.
J. M. Stock, Department of Earth and Planetary Sciences, Harvard University, Cambridge, MA 02138.
(Received January 21, 1987; revised July 28, 1988;
accepted December 16, 1987.)