continuous improvement toolkit · continuous improvement toolkit . waste walks: used to quickly...
TRANSCRIPT
Continuous Improvement Toolkit . www.citoolkit.com
Continuous Improvement Toolkit
Value Analysis
NVA
VA

Continuous Improvement Toolkit . www.citoolkit.com
The Continuous Improvement Map
Check Sheets
Data Collection
Process Mapping Flowcharting
Flow Process Charts**
Just in Time
Control Charts
Mistake Proofing
Relations Mapping
Understanding Performance**
Fishbone Diagram
Design of Experiment
Implementing Solutions***
Group Creativity
Brainstorming Attribute Analysis
Selecting & Decision Making
Decision Tree
Cost Benefit Analysis
Voting
Planning & Project Management*
Kaizen Events
Quick Changeover
Managing Risk
FMEA
PDPC
RAID Log*
Observations
Focus Groups
Understanding Cause & Effect
Pareto Analysis
IDEF0
5 Whys
Kano
KPIs
Lean Measures
Importance-Urgency Mapping
Waste Analysis**
Fault Tree Analysis
Morphological Analysis
Benchmarking***
SCAMPER***
Matrix Diagram
Confidence Intervals
Pugh Matrix
SIPOC*
Prioritization Matrix
Stakeholder Analysis
Critical-to Tree
Paired Comparison
Improvement Roadmaps
Interviews
Quality Function Deployment
Graphical Analysis
Lateral Thinking
Hypothesis Testing
Visual Management Reliability Analysis
Cross Training
Tree Diagram*
ANOVA
Gap Analysis*
Traffic Light Assessment
TPN Analysis
Decision Balance Sheet
Risk Analysis*
Automation
Simulation
Service Blueprints
DMAIC
Product Family Matrix Run Charts
TPM
Control Planning
Chi-Square
SWOT Analysis
Capability Indices
Policy Deployment
Data collection planner*
Affinity Diagram Questionnaires
Probability Distributions
Bottleneck Analysis
MSA
Descriptive Statistics
Cost of Quality* Process Yield
Histograms 5S
Pick Chart
Portfolio Matrix
Four Field Matrix
Root Cause Analysis Data Mining
How-How Diagram*** Sampling
Spaghetti **
Mind Mapping*
Project Charter
PDCA
Designing & Analyzing Processes
Correlation Scatter Plots Regression
Gantt Charts
Activity Networks RACI Matrix
PERT/CPM Daily Planning
MOST
Standard work Document control A3 Thinking
Multi vari Studies
OEE
Earned Value
Delphi Method
Time Value Map**
Value Stream Mapping**
Force Field Analysis
Payoff Matrix
Suggestion systems Five Ws
Process Redesign
Break-even Analysis
Value Analysis**
Flow Pull
Ergonomics

Continuous Improvement Toolkit . www.citoolkit.com
Value:
One of the most important concepts within Lean.
One of the most valuable outcomes Lean provides.
Value Analysis focuses on what adds value to business processes as perceived by the customer.
A process that does not add value to the product or service should be redesigned or eliminated altogether.
- Value Analysis

Continuous Improvement Toolkit . www.citoolkit.com
Each step within a process can be classified into one of three categories:
• Value added activities.
• Essential non-value added activities (or unavoidable wastes).
• Non-value added activities.
- Value Analysis
NVA
Step 3
ENVA
Step 2
VA
Step 1

Continuous Improvement Toolkit . www.citoolkit.com
Value Added Activities:
Increase the worth of a product or services from the customer’s perspective.
Common examples include:
• Machining a part.
• Serving a customer at a call center.
- Value Analysis
NVA
Step 3
ENVA
Step 2
VA
Step 1

Continuous Improvement Toolkit . www.citoolkit.com
Essential Non-Value Added Activities:
Add no value to a product or service.
The customer is not willing to pay for them.
However, they are necessary for the business due to the current settings of the process.
Common examples include: purchasing, R&D and inspecting parts for quality defects.
- Value Analysis
NVA
Step 3
ENVA
Step 2
VA
Step 1
Continuous Improvement Toolkit . www.citoolkit.com
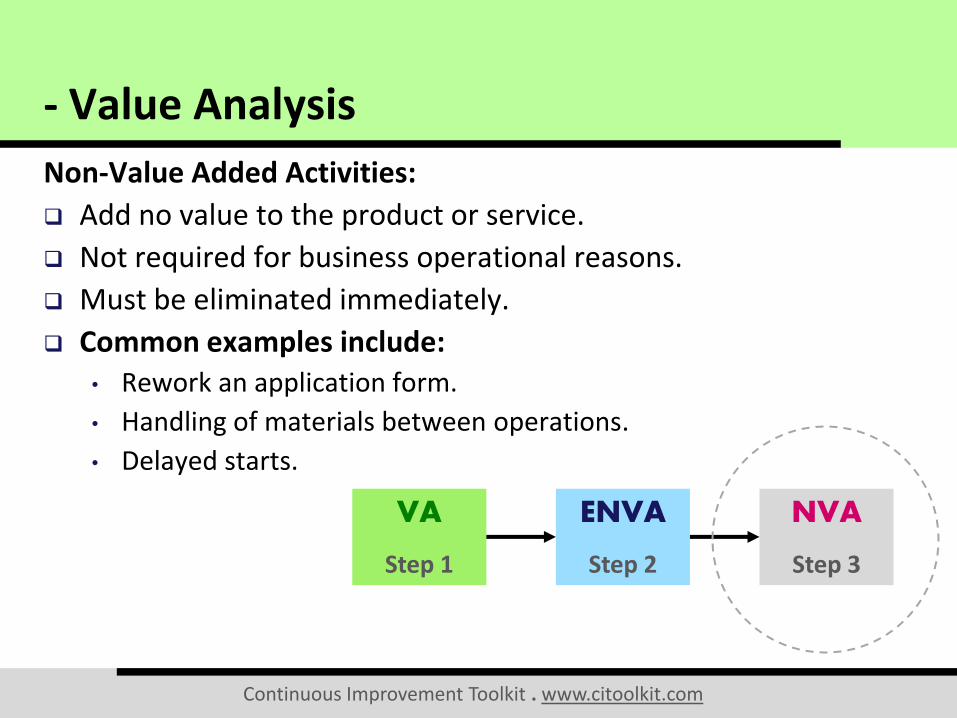
Non-Value Added Activities:
Add no value to the product or service.
Not required for business operational reasons.
Must be eliminated immediately.
Common examples include: • Rework an application form.
• Handling of materials between operations.
• Delayed starts.
- Value Analysis
NVA
Step 3
ENVA
Step 2
VA
Step 1
Continuous Improvement Toolkit . www.citoolkit.com
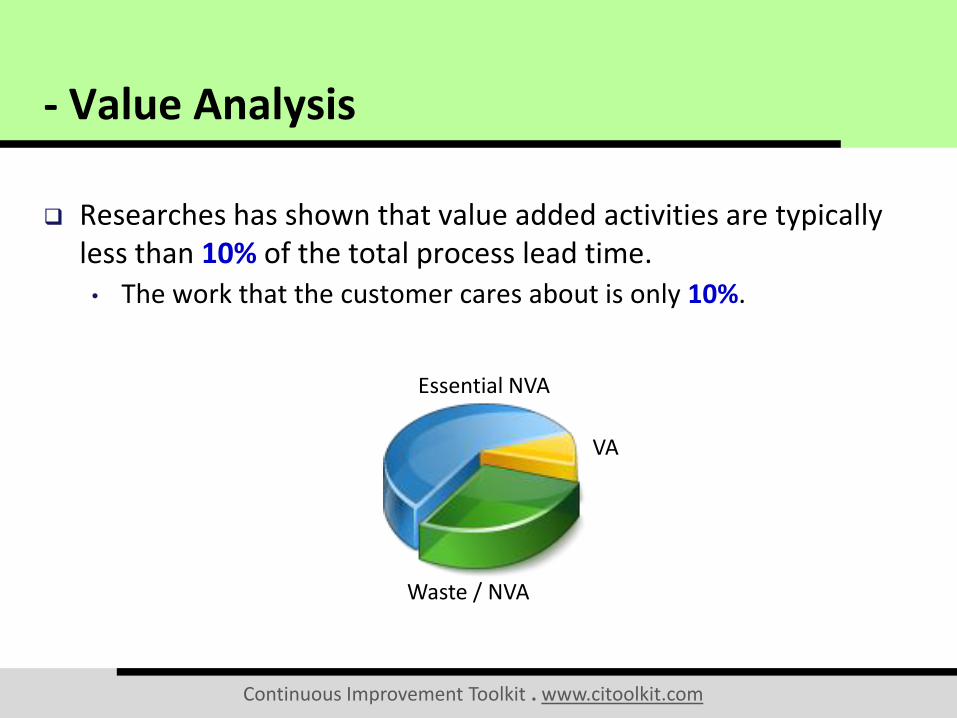
Researches has shown that value added activities are typically less than 10% of the total process lead time. • The work that the customer cares about is only 10%.
- Value Analysis
Essential NVA
Waste / NVA
VA

Continuous Improvement Toolkit . www.citoolkit.com
The first step when analyzing the value of any process is to determine who the ultimate customer is.
An ultimate customer is the end user of the product or service.
Understand their expectations clearly and know exactly what they are willing to pay for.
Listen actively to your customers.
Encourage them to send feedback on how well your product or service meets their needs (for future process improvements).
- Value Analysis
Continuous Improvement Toolkit . www.citoolkit.com
Patients are the ultimate customers in medical services.
It is important to provide them with comprehensive and personalized health care.
Patients instead often get stuck in processes that don’t add value to their primary care: • They are often asked to fill out medical
forms multiple times.
• They wait too long to receive a consultation from their primary doctor.
- Value Analysis
Continuous Improvement Toolkit . www.citoolkit.com
The traditional approach to process improvement is to focus on reducing the time to perform the value added work. • Normally through capital investment.
The Lean approach however focuses on eliminating the root causes of the 90% of the non-value added activities.
• Much cheaper and more effective.
- Value Analysis
Lean Approach

Continuous Improvement Toolkit . www.citoolkit.com
Tools to identify and analyze non-value added activities: • The eight wastes.
• Waste walks.
• Waste recording forms & waste logs.
• Opportunity process map.
• Value matrix.
• Value timeline.
• VA/NVA metrics.
- Value Analysis

Continuous Improvement Toolkit . www.citoolkit.com
The Eight Wastes:
- Value Analysis
Transport Inventory Motion Waiting
Overproducing Over Processing
Defects Skills
TIM WOODS
Continuous Improvement Toolkit . www.citoolkit.com
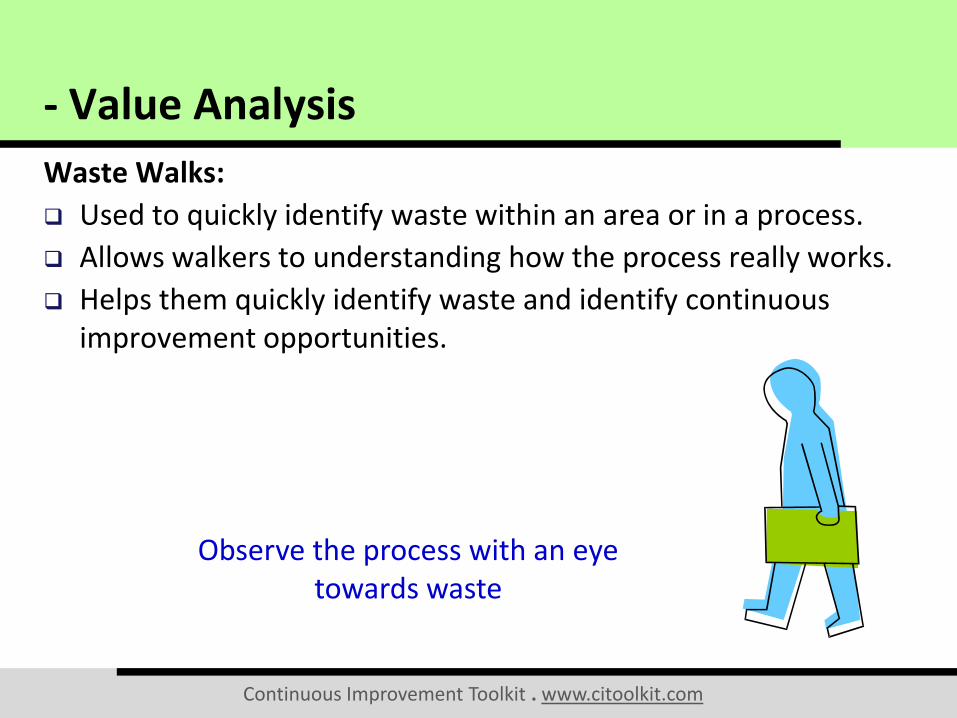
Waste Walks:
Used to quickly identify waste within an area or in a process.
Allows walkers to understanding how the process really works.
Helps them quickly identify waste and identify continuous improvement opportunities.
- Value Analysis
Observe the process with an eye towards waste

Continuous Improvement Toolkit . www.citoolkit.com
How to Conduct a Waste Walk:
Clearly describe the objective of conducting the waste walk.
Select the process or area and define the boundaries.
Prepare an observation form to collect the desired information.
Get permission from the process owner or supervisor to conduct the walks and talk to the people there.
Walk the flow of the process and look for each of the eight types of waste.
Collect data, observe actual practices, interview people and ask questions.
Identify opportunities to eliminate waste.
Prioritize improvement actions as appropriate.
- Value Analysis
Continuous Improvement Toolkit . www.citoolkit.com
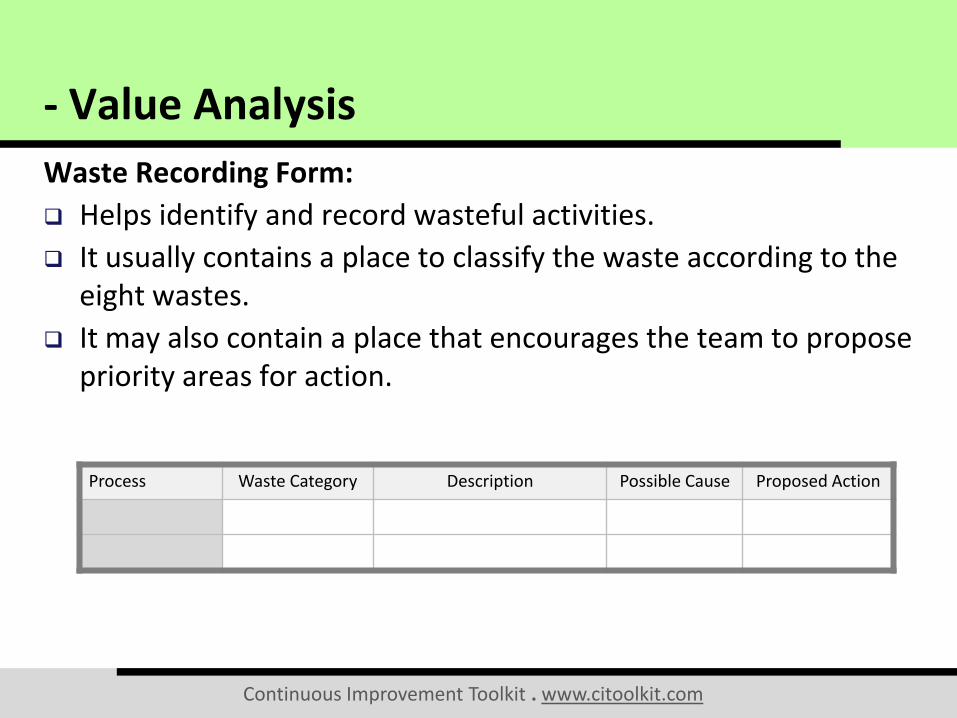
Waste Recording Form:
Helps identify and record wasteful activities.
It usually contains a place to classify the waste according to the eight wastes.
It may also contain a place that encourages the team to propose priority areas for action.
- Value Analysis
Process Waste Category Description Possible Cause Proposed Action
Continuous Improvement Toolkit . www.citoolkit.com
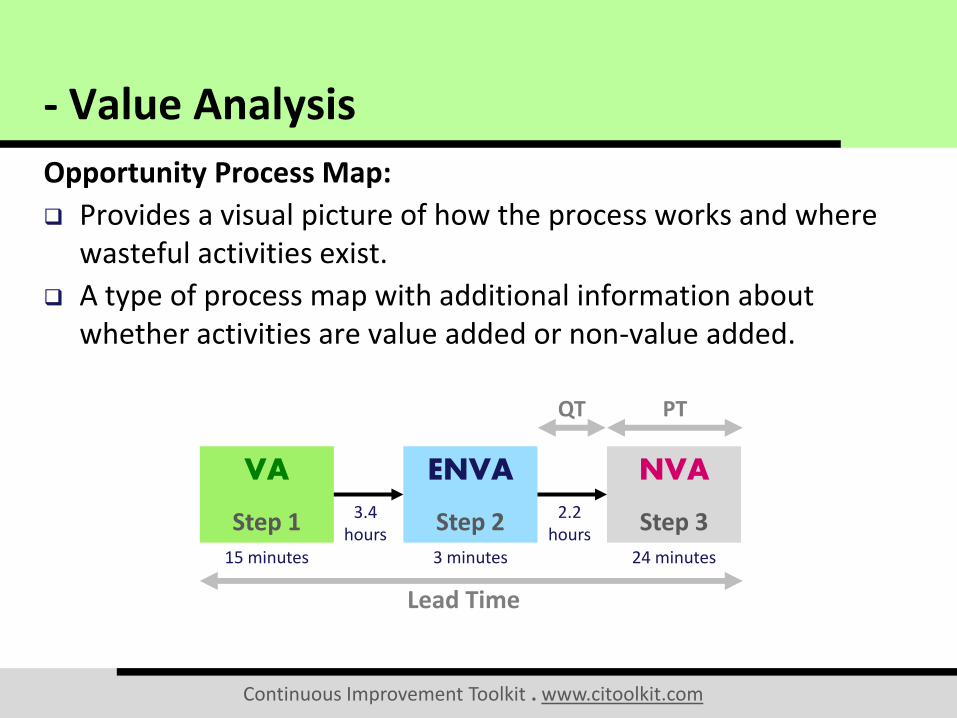
Opportunity Process Map:
Provides a visual picture of how the process works and where wasteful activities exist.
A type of process map with additional information about whether activities are value added or non-value added.
- Value Analysis
NVA
Step 3
ENVA
Step 2
VA
Step 1
Lead Time
QT PT
15 minutes 3 minutes 24 minutes
3.4 hours
2.2 hours

Continuous Improvement Toolkit . www.citoolkit.com
Value Matrix:
Used to help make correct decisions about wasteful and non-value added activities.
If the activity is unnecessary and adds no value to the product or service, then you need to eliminate it immediately.
If the activity adds no value but is necessary for business operational reasons, then it can be reduced, integrated or simplified to optimize the process.
- Value Analysis
$$ Reduce
Integrate Simplify
Waste

Continuous Improvement Toolkit . www.citoolkit.com
Value Timeline:
Reflects the value added and the non-value added activities of the core process.
Helps approximating VA and NVA percentages.
Placed at the bottom the value stream map.
- Value Analysis
30 sec
0.1 days
45 sec 17 sec 376 sec 179 sec
0.1 days
0.1 days
75 days
0.4 days
0.2 days
397 sec
12 days NVA
VA

Continuous Improvement Toolkit . www.citoolkit.com
VA/NVA Metrics:
Total Value Added Time.
Value Stream Ratio (VA%) - The proportion of time spent in the process that a product or service is actually being worked on a way that is adding value.
- Value Analysis
VS Ratio (%) = Total Value Add Time
Total Lead Time