lean – continuous improvement toolkit · pdf filelean – continuous improvement ....
TRANSCRIPT

LEAN – Continuous Improvement Toolkit
We acknowledge and appreciate the development of these resources by staff from UW Finance and Facilities Strategy Management: Cheryl Hawley, Dan Druliner, David Wright,
Jeanne Semura, and Ray Hsu.

2
Continuous Improvement Toolkit Idea Generation
Tools Project
Management Tools
Data Gathering Tools
Data Display Tools
Data Analysis Tools
Brainstorming & Green-lighting
Consideration & Constraints Worksheet
Affinity Diagram Affinity Diagram Cause & Effect Diagrams (Fishbone)
Delphi Technique Implementation / Communication Plan
Check Sheets Control Charts Plus-Minus-Interesting
Multi-voting Project Progress Checklist
Surveys Flowcharts Decision/Solution Matrix
Charter Benefits and Practicability Analysis
Histograms
Project Lifecycle Comparison Matrix
Pareto Graphs
Run Charts (Trend Charts)

3
Lean Continuous Improvement Toolkit TABLE OF CONTENTS
Continuous Improvement Toolkit 2
Table of Contents 3
Affinity Diagrams 4
Benefit and Practicability Analysis 5
Brainstorming & Green-lighting 6
Cause & Effect Diagram (Fishbone) 8
Checksheets 9
Comparison Matrix 10
Charter (Sample) 12
Considerations & Constraints Worksheet 16
Control Charts 17
Decision/Solution Matrix 18
Delphi Technique 19
Flowcharts 20
Histograms 25
Implementation / Communication Plan 27
Multi-Voting 28
Pareto Graph 29
Plus-Minus-Interesting 30
Project Lifecycle 31
Project Progress Checklist 32
Run Charts 33
Surveys 34

4
Affinity Diagrams Primary Application
• Use to add structure to a large or complicated issue - such as customer needs • Break down a complicated issue into easy to understand categories • Gain agreement on an issue or situation
Steps to Constructing
1. State the issue or problem to be worked on 2. Generate ideas for the issue in question & write on a card or sticky note 3. Collect the cards or sticky notes 4. Arrange the cards or sticky notes into related groups 5. Create a title or heading for each group - short 1 to 3 words that describe the main theme or focus of
group it represents
FEATURE CATEGORY Variable Length Messages INCOMING MESSAGES Time & Date Stamp Doesn't Count "Hang-Ups" Indicates Number of Messages Secret Access Code PRIVACY Earphone Jack Clear Instructions INSTRUCTIONS Quick Reference Card Controls Clearly Marked CONTROLS Easy to Use Can Operate from Remote Phone Easy to Erase ERASING Erase Selected Messages
Requirements for Telephone Answering Machine
Time & Date
Quick Reference
Earphone
Variable Length
Easy to
Easy to
Controls Clearly
Indicates Number of
Can Operate from Remote
Doesn't Count "Hang-
Erase Selected
Clear
Secret Access
5
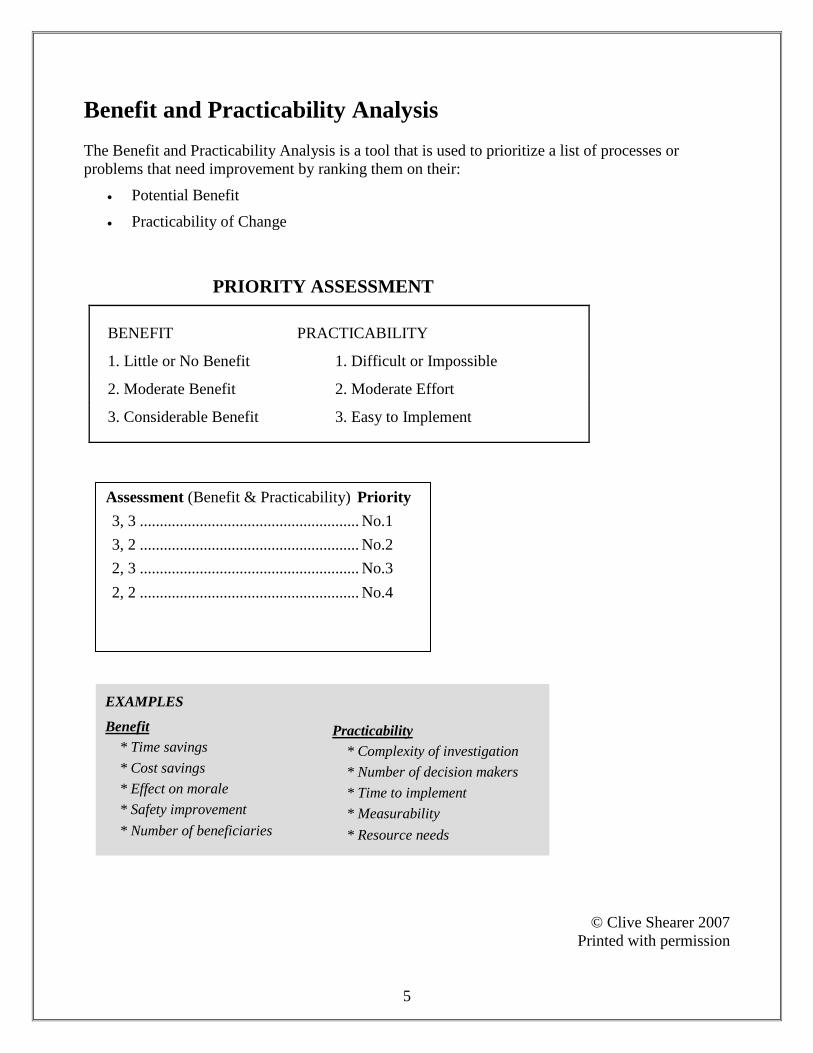
Benefit and Practicability Analysis The Benefit and Practicability Analysis is a tool that is used to prioritize a list of processes or problems that need improvement by ranking them on their:
• Potential Benefit
• Practicability of Change
PRIORITY ASSESSMENT
BENEFIT PRACTICABILITY
1. Little or No Benefit 1. Difficult or Impossible
2. Moderate Benefit 2. Moderate Effort
3. Considerable Benefit 3. Easy to Implement
© Clive Shearer 2007 Printed with permission
Assessment (Benefit & Practicability) Priority 3, 3 ....................................................... No.1 3, 2 ....................................................... No.2 2, 3 ....................................................... No.3 2, 2 ....................................................... No.4
EXAMPLES
Benefit * Time savings * Cost savings * Effect on morale * Safety improvement * Number of beneficiaries
Practicability * Complexity of investigation * Number of decision makers * Time to implement * Measurability * Resource needs

6
Brainstorming & Green-lighting
Brainstorming This tool is used to ensure the group has explored a broad range of options before a decision is made. Individuals are encouraged to express all possible solutions, even if they seem silly at the time. No discussion, judgment or criticism of ideas is done during the brainstorm. Following the brainstorm session, discussion and/or critique of the proposed ideas can be done. Advantages: Allows and encourages all group members to participate in the solution. Encourages creative thinking. Often raises viable considerations or solutions that may have been otherwise withheld as potentially risky or silly. Disadvantages: It can prove difficult to stick to the original issue or problem when suggested solutions become broad ranging and creative, but unrealistic or incongruous with the problem at hand. Also it's important to remember that not all people are comfortable with such a rapid, open style of communicating ideas. Allow space and opportunity, whenever possible, for those individuals who might have good ideas but are more cautious of speaking out in group settings. Guidelines for Brainstorming:
• State the objective clearly and list any known constraints • No criticism, evaluation, or discussion when ideas are suggested • Don’t let session be dominated by a few
• Contribute ideas in rotation • One idea per turn • Okay to 'pass'
• Record all ideas • Leader and facilitator should remain neutral
• Draw people out without insulting or intimidating • Energize the group • Encourage and compliment the group

7
Green-Lighting – Structured Brainstorming Green-lighting is a structured form of brainstorming. The goal is to generate a large number of ideas within a short time. Everyone is encouraged to participate, so by structuring the format it prevents a few individuals from dominating the discussion. Rules for Green-Lighting
• Each person, in turn, gives one idea only • It is OK to pass • No questions or comments are allowed • Decide in advance how many times to go around the group
o Small groups – continue around until one complete turn has occurred with no new ideas o Large groups – go around group two or three times
• Ask clarifying questions (only the contributor of the idea may answer)

8
Cause & Effect Diagram (Fishbone)
Cause & effect diagrams are sometimes called 'fishbone' diagrams. They are drawn to clearly illustrate the various causes affecting a process by sorting out and relating them. The purpose of a cause & effect diagram is to separate true causes from symptoms and to sort out major causes so that problems can be prevented from recurring. Primary Application • To improve process quality • To assess conformance to customer requirements • To visually display the relationship between a given effect and its potential causes • To isolate different causes Steps to Constructing 1. Define the problem or effect 2. Define the major categories of possible causes (manpower, materials, methods, machines) 3. Construct the diagram, defining the problem or effect in a box and positioning major categories
as 'feeders' 4. Brainstorm possible causes within categories 5. Ask questions such as ‘what are the machine issues affecting / causing...’; ‘why is this
happening’ 6. Analyze each cause to focus on more specific causes 7. Look for items that appear in more than one category – these tend to be more likely causes 8. Identify likely and actionable root causes
Manpower / Staff Materials
Bad Tasting Coffee
Experience
Personal Preference
Ability
Grind
Bean
Water
With/without filter
Methods
Warming Temp
Stove Gas or Electric
Pot Size
Brand
Machines / Equipment
Drip or Perk Brew time

9
Checksheets Checksheets are simple forms used to gather data to answer the question: "How often are certain events occurring?" Primary Application
• Use to improve process quality • Use as a template for collecting and recording data • Promotes consistency of comparing data
Steps to Constructing
1. Establish purpose for collecting data 2. Identify categories / data to collect 3. Brainstorm factors affecting categories 4. Determine time period for data collection 5. Determine how data will be analyzed 6. Construct a table for recording data
Problem: Complaints about Coffee
Date Cold Bitter Weak
3/1/01
3/2/01
3/3/01
3/4/01
3/5/01
3/6/01
3/7/01
3/8/01
3/9/01
3/10/01
10
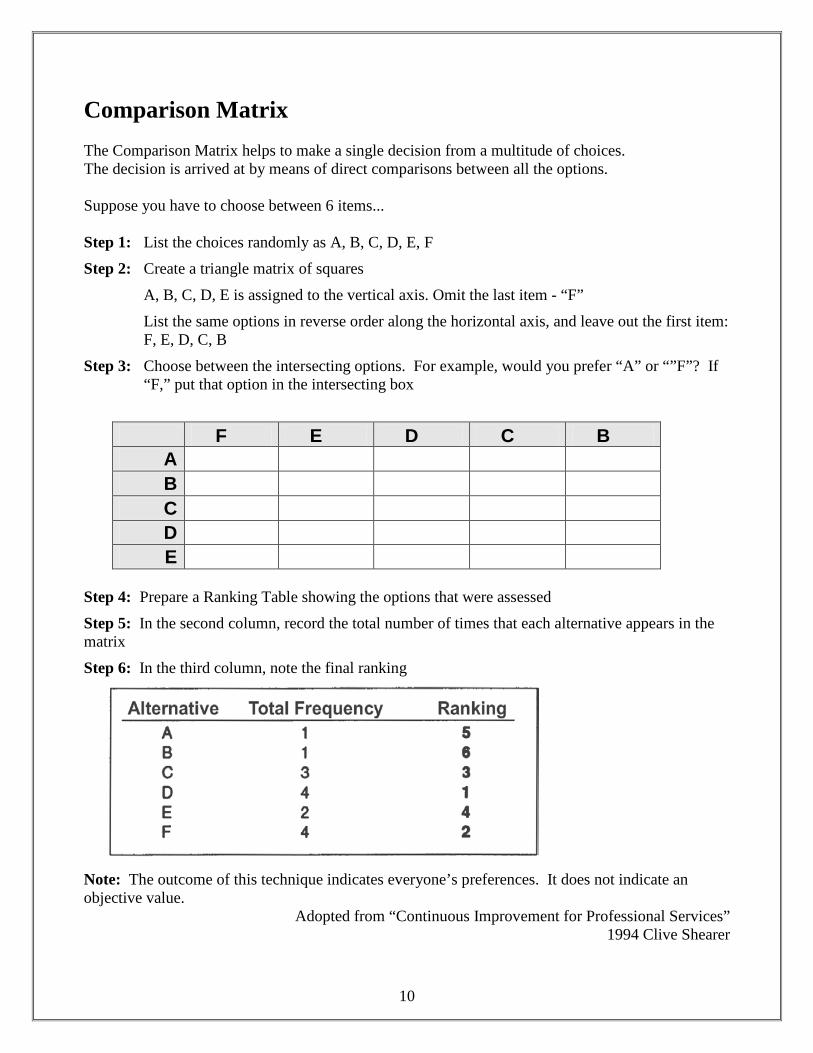
Comparison Matrix The Comparison Matrix helps to make a single decision from a multitude of choices. The decision is arrived at by means of direct comparisons between all the options. Suppose you have to choose between 6 items... Step 1: List the choices randomly as A, B, C, D, E, F
Step 2: Create a triangle matrix of squares
A, B, C, D, E is assigned to the vertical axis. Omit the last item - “F”
List the same options in reverse order along the horizontal axis, and leave out the first item: F, E, D, C, B
Step 3: Choose between the intersecting options. For example, would you prefer “A” or “”F”? If “F,” put that option in the intersecting box
F E D C B A B C D E
Step 4: Prepare a Ranking Table showing the options that were assessed
Step 5: In the second column, record the total number of times that each alternative appears in the matrix
Step 6: In the third column, note the final ranking
Note: The outcome of this technique indicates everyone’s preferences. It does not indicate an objective value.
Adopted from “Continuous Improvement for Professional Services” 1994 Clive Shearer
11
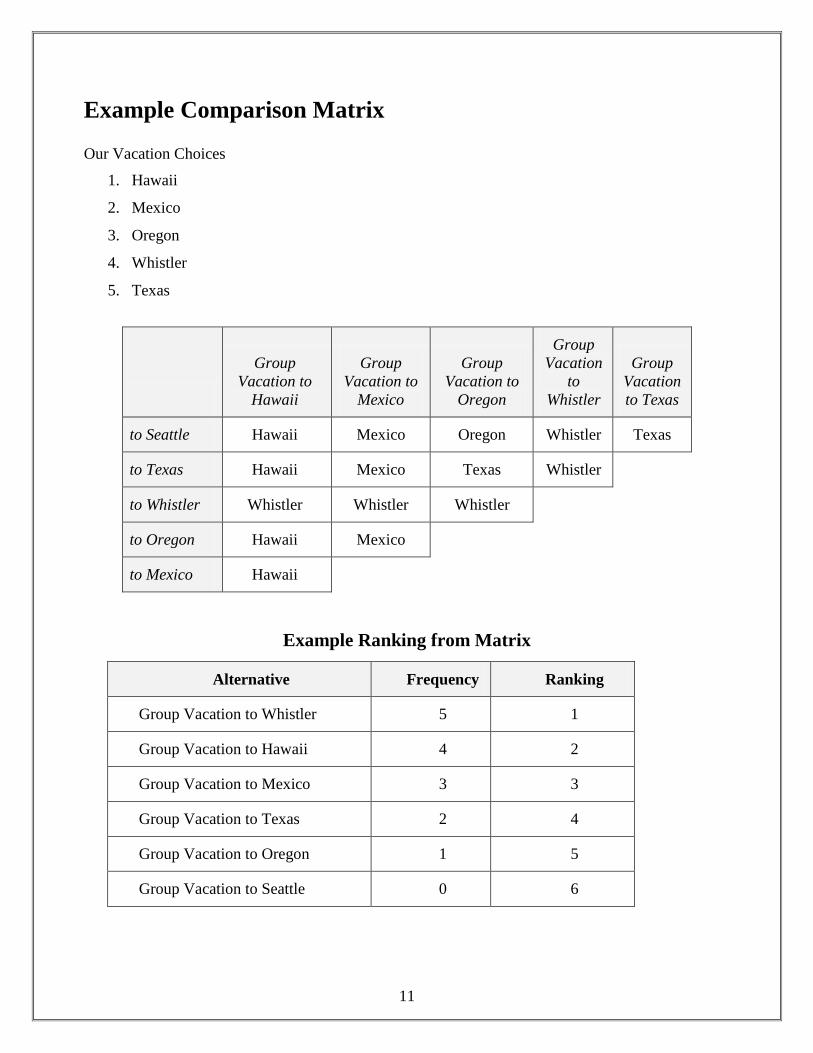
Example Comparison Matrix Our Vacation Choices
1. Hawaii
2. Mexico
3. Oregon
4. Whistler
5. Texas
Group Vacation to
Hawaii
Group Vacation to
Mexico
Group Vacation to
Oregon
Group Vacation
to Whistler
Group Vacation to Texas
to Seattle Hawaii Mexico Oregon Whistler Texas
to Texas Hawaii Mexico Texas Whistler
to Whistler Whistler Whistler Whistler
to Oregon Hawaii Mexico
to Mexico Hawaii
Example Ranking from Matrix
Alternative Frequency Ranking
Group Vacation to Whistler 5 1
Group Vacation to Hawaii 4 2
Group Vacation to Mexico 3 3
Group Vacation to Texas 2 4
Group Vacation to Oregon 1 5
Group Vacation to Seattle 0 6

12
Strategic Initiative Charter July 18 - December 11, 2006
Name of Initiative: Accounts Payable Customer Service Improvement Project
What is this Initiative? The Accounts Payable Customer Service Improvement Team is a University-wide committee. Our goal is to identify opportunities for customer service improvement in the short term and to make recommendations for long term solutions.
Initiative Owner Name Title Phone E-mail
Owner Financial Services Director 999-999-9999 [email protected]
What is the Problem/Opportunity? With an understanding of the Accounts Payable process, the team will hold several focus group sessions throughout the summer in the FOCUS group model to identify what our customers need and would like to see improved. Our goals are as follows:
• Identify who to include in our focus groups • Identify what information we need from our focus groups • Establish a listing of improvements • Implement type 1 improvements • Track and communicate type 2 improvements
Problem Statement: The Financial Management 2006 Customer Survey provided feedback that the Accounts Payable team needs to achieve significant improvements to the level of customer service provided to UW campus and other customers. The AP team can learn directly from customers by engaging them in a USER-model process improvement initiative to identify and implement improvements to the AP process to achieve excellence in customer service.
Gaps: • Transaction tracking in heritage system (PAS) is minimal • Communications and information exchange mechanisms between AP and campus are inadequate • AP Customer service is not consistent • PAS system will not be replaced with user-friendly technology in near future
Work done so far: • Review of specific problems identified by the customer survey (Spring 2006) • Communication plan initiated (FM Newsletter May 2006) • Rapid Process Improvement initiatives by AP Teams in 2005/2006 • Identification of problem manual payment processes in AP (Summer 2006) • Initial Six Sigma pilot analysis of online invoice payment (June 2006)
SAMPLE CHARTER

13
Purpose The Accounts Payable Customer Service Improvement team was formed in the summer of 2006 following a customer survey in 2005 that revealed we could improve the level of customer service we provide.
Core Team Expectations: • Broad representation of the University • Question current processes and structures • Identify new and revised service and support mechanisms • Prioritize and evaluate stakeholder feedback • Participate in decision-making • Advocate and communicate goals of project • Perform at high level as a team
Project Team Role: • Members are comprised of subject matter, technical and functional experts • Assume responsibility for high-quality, timely project deliverables as assigned • Coordinate efforts between the tasks to address potential related impacts • Assess risk, and define approaches for payment process improvement • Meet project objectives and timeline • Participate implementation of deliverables • Initial team meeting will focus on team-building and planning • Participation is critical • Data-driven analysis
Project Team Leaders: [Name] • Plan, facilitate, and document Sponsor meetings • Facilitate and direct the Project Team • Plan and coordinate communications with executives, users and stakeholders • Ensure user readiness and sequencing for implementations • Manage development of business processes, policies, and procedures • Approve project action and communication plans • Manage and communicate payment process concerns and escalate issues to the project sponsors, executive sponsor and key
stakeholders
Project Manager: [Name] • Plan and document all meetings of the Core Project • Communicate with and document sub-project teams, as needed • Develop and manage the project action and communication plans and ensure that all plans are integrated for timelines. • Draft presentation and reporting materials • Draft policies, procedures and other deliverables as needed and appropriate • Develop and manage issues list • Monitor timelines • Manage and communicate risk factors • Manage standards for project methodology and documentation • Work closely with the Project Team on all issues, using a single action plan and parking lot issue tracking system
SAMPLE CHARTER

14
Executive Sponsors: • Provide guidance and facilitate issues when sponsors or stakeholders have competing demands • Hold project sponsors and project leadership accountable to the timelines, external approvals and agreed approaches to the project
implementation • Ensure that all the senior and other stakeholders are kept informed of the project issues • Advocate for the project • Provide executive oversight to the project to clarify business requirements, confirm timelines and implementation approaches • Review project progress on a regular basis • Clarify policy and address escalated practice and implementation issues, including issues between internal organizations • Escalate any issues that threaten to jeopardize the success of the project to a higher executive level when necessary • Secure/approve any resources required for the project • Provide support for implementation by ensuring cooperation and execution of project tasks assigned to staff and others • Make decisions based on Project Team recommendations
Stakeholders: • This project will require support and alignment of key stakeholders throughout the UW. Although not involved in the day-to-day
project design and implementation, each major decision and milestone will be reviewed and acknowledged by these stakeholders. • Participate in issue identification and prioritization • Provide feedback to project team as requested • Participate in periodic review sessions, as appropriate • Review decisions and deliverables for impact, risk mitigation and compliance with business needs
Boundaries/Scope • Short term improvements
Major Categories of Customers • Campus Customers • External Customers (vendors) • Process Partners
Strategic Alignment • Process Improvements
Measures of Success • Survey measures now (10/06) and in 6 months (04/06)
Membership Name Title Phone E-mail
Name Title 999-999-9999 [email protected]
Name Title 999-999-9999 [email protected]
Name Title 999-999-9999 [email protected]
SAMPLE CHARTER
15
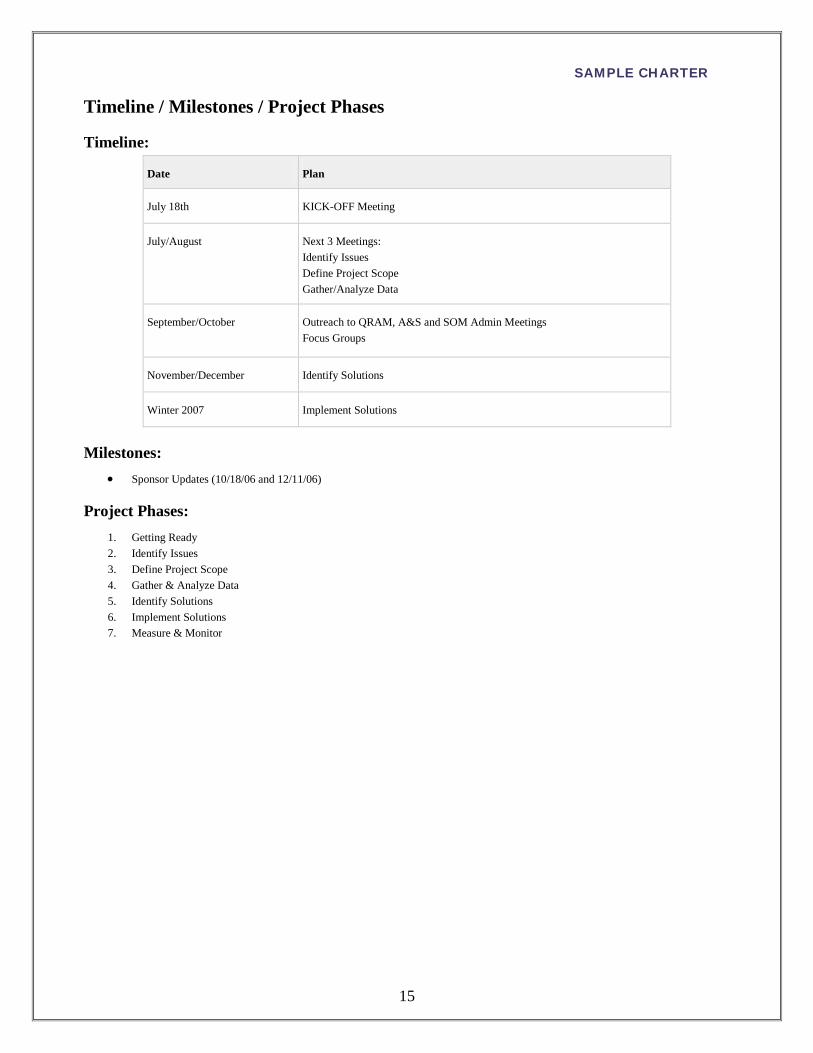
Timeline / Milestones / Project Phases
Timeline:
Date Plan
July 18th KICK-OFF Meeting
July/August Next 3 Meetings: Identify Issues Define Project Scope Gather/Analyze Data
September/October Outreach to QRAM, A&S and SOM Admin Meetings Focus Groups
November/December Identify Solutions
Winter 2007 Implement Solutions
Milestones: • Sponsor Updates (10/18/06 and 12/11/06)
Project Phases: 1. Getting Ready 2. Identify Issues 3. Define Project Scope 4. Gather & Analyze Data 5. Identify Solutions 6. Implement Solutions 7. Measure & Monitor
SAMPLE CHARTER
16
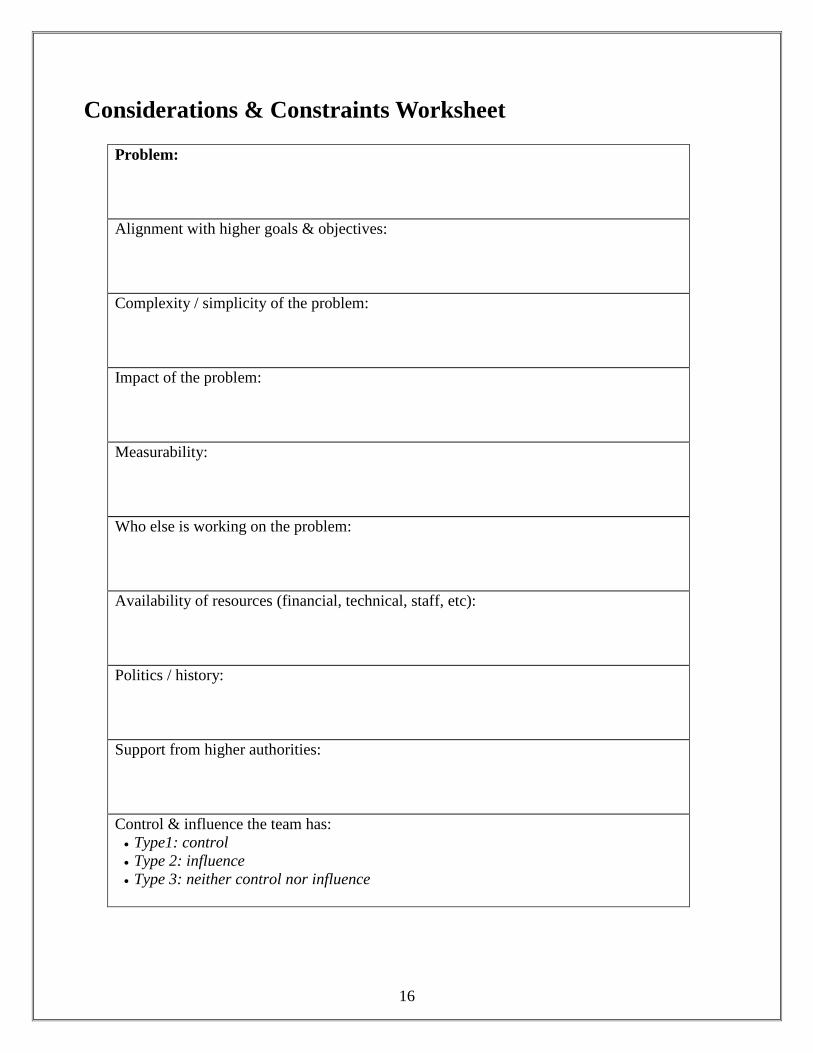
Considerations & Constraints Worksheet
Problem: Alignment with higher goals & objectives: Complexity / simplicity of the problem: Impact of the problem: Measurability: Who else is working on the problem: Availability of resources (financial, technical, staff, etc): Politics / history: Support from higher authorities: Control & influence the team has: • Type1: control • Type 2: influence • Type 3: neither control nor influence

17
Control Charts
Control charts are used to evaluate the amount and type of variation within a process. A control chart is similar to a run chart with the addition of a mean (centerline) and upper and lower control limits. Steps to Constructing
1. Collect data 2. Plot the data points 3. Compute mean (average) of individual data points 4. Compute control limits (standard deviation) 5. Draw the mean and upper & lower control limits on the chart
Mean (centerline)
• The mean is the average of a set of data • When added to a run chart, the mean becomes the centerline • The centerline indicates the typical level of process performance
Control Limits
• Calculated upper and lower boundaries on common cause variations • Can be used to determine process stability • One or more points outside the control limits indicates special cause variation
Things to Look For
• Data points falling outside control limits • 6 or more points in a row steadily increasing or decreasing • 8 or more points in a row on one side of the centerline
Complaints about Coffee
0
5
10
15
20
25
4/1/014/2/01
4/3/014/4/01
4/5/014/6/01
4/7/014/8/01
4/9/01
4/10/01
4/11/01
4/12/01
4/13/01
4/14/01
4/15/01
4/16/01
4/17/01
4/18/01
Dates
# of
Com
plai
nts

18
Decision/Solution Matrix
The decision/solution matrix can be used for multiple purposes. It may be used when trying to identify what decisions or solutions are most viable, or it may be used to help select a problem to work on.
Steps to Constructing
1. Decide which criteria are important in selecting solutions and put these across the top row of the matrix
2. List the possible solutions down the left side of the matrix
3. Agree on a rating scale to use
3 = fully meets the criteria 2 = partially meets the criteria 1 = little or no connection to the criteria
4. Rate the solutions
5. Look at the results and identify which solutions best meet the criteria
Criteria Important to Solution
Solutions Low Cost Decrease in customer complaints Quick to implement Staff
acceptance
New coffee maker
1
Different brand of coffee 2 3
Filtered water 2 1
Follow coffee maker directions 3 3 2
Train staff 2 2

19
Delphi Technique
The Delphi technique, or multi-voting, is a way to narrow the results of a brainstorming session or the causes from creation of a fishbone diagram. Delphi is an effective tool for controversial issues or when a team can't come to an agreement. Steps to Constructing
1. Make sure everyone understands the items being voted on - discuss if necessary
2. Decide how many ‘votes’ each individual will have, usually no more than 6-8 or 1/4-1/3 of total items
3. Give each team member as many colored dots as the number of allowable votes
4. Tell everyone to vote for the items they think are most important – they can place multiple dots on one item
5. Tally the votes
6. Review the results and make a selection – if there are still a large number of items, go through narrowing a 2nd time voting only on top items. Use half the number of votes for the 2nd round

20
Flowcharts Flowcharts are a tool for planning and analyzing processes. They allow you to break any process down into individual events or activities and to display these in shorthand form showing the logical relationships between them. Constructing flowcharts promotes better understanding of processes which is a prerequisite for improvement. Primary Application
• To see how a process works • To identify critical points, bottlenecks or problem areas in a process • To see how different steps in the process are related • To identify the ‘ideal’ flow of a process from start to finish • To design a new work process
Steps to Constructing
1. Identify the process to flowchart 2. Determine beginning and ending points of the process 3. Identify major steps in the process 4. List additional steps as needed 5. Put steps in proper sequence 6. Assign appropriate symbols to each step 7. Connect steps with arrows to show the flow of the process 8. Test the flowchart to make sure all the necessary steps have been included 9. Finalize the flowchart
Standard Flowchart Symbols
SYMBOL REPRESENTS EXAMPLE Beginning or Ending point Receive complaint /
Complete process
Decision Point Yes / No Pass / Fail
Activity Hold a meeting Make a phone call
Document Report is completed Form is filled out
Connector Go to another page or another part of the flowchart
Flow Move from one activity to next
Major types of flowcharts are: Departmental or cross-functional Straight-line/horizontal
Top down Vertical

21
Departmental or Cross-Functional Flowchart
To-Be
GUARANTEED - MILITARY, GOVERNMENT, STATE
Acc
ount
ing
Uni
t
RECONCILE 33XXXX
BUDGETS
Cus
tom
er S
ervi
ce U
nit
VERIFY DEPOSIT
DEPOSIT FUNDS
DOWNLOAD EXPENSES
Stu
dent
Spo
nsor
PROCESS VOUCHER
Create cash transmittal
SEND CONTRACT TO
SFS
DISBURSE FUNDS
Download after 30th day of the
quarter
AUTHORIZE FUNDS
Adjust as needed
SEND PAYMENT TO SFS VIA ACH
Post payment to scholarship database
Reconcile FAS deposit - 2 to 3
days later
Upload CT file to Fastrans
Update contract information in scholarships
database
Assign budget number or sponsor
code as needed
GENERATE BILL
Create bill
Send bill and copy of contract to
sponsor
File original contract
Authorize manually in SDB
Disburse funds to student’s account
View ACH deposits

22
Straight-Line Horizontal Flowchart
Complete audit fieldwork
Auditor
Clear supervisor’s workpaper reviewcomments and revise draft report
Auditor
Review audit workpapers and draftreport
Supervisor
Prepare draft report w/“DRAFT” watermark
Auditor
Revise draftreport
Auditor
Review draftreport
Director
Review draft report for readability,grammer, and format
Program Coordinator
Revise draft report
Auditor
Prepare draft transmittalletter
Auditor
Review draft audit report and sign-offtransmittal letter and release record
Director
Release draft reportwith “DRAFT”
watermark
Deliver (mail, in person, or fax) draftreport to auditee
Auditor
Sign-off releaserecord
Supervisor
Sign-off releaserecord
Program Coordinator
Sign-offrelease record
Director
StartTime
Sign-off final audit reportand release record
Supervisor
Proof read and format final report
Program Coordinator
Sign-off final audit report, transmittalletter, and release record
Director
Prepare finaltransmittal letter
Auditor
Sign-off releaserecord
Program Coordinator
Print and sign-offaudit report
Auditor
Revise audit report andremove “DRAFT” watermark
Auditor
EndTime
Internal Audit -Abbreviated “As-Is” Flow Chart
23
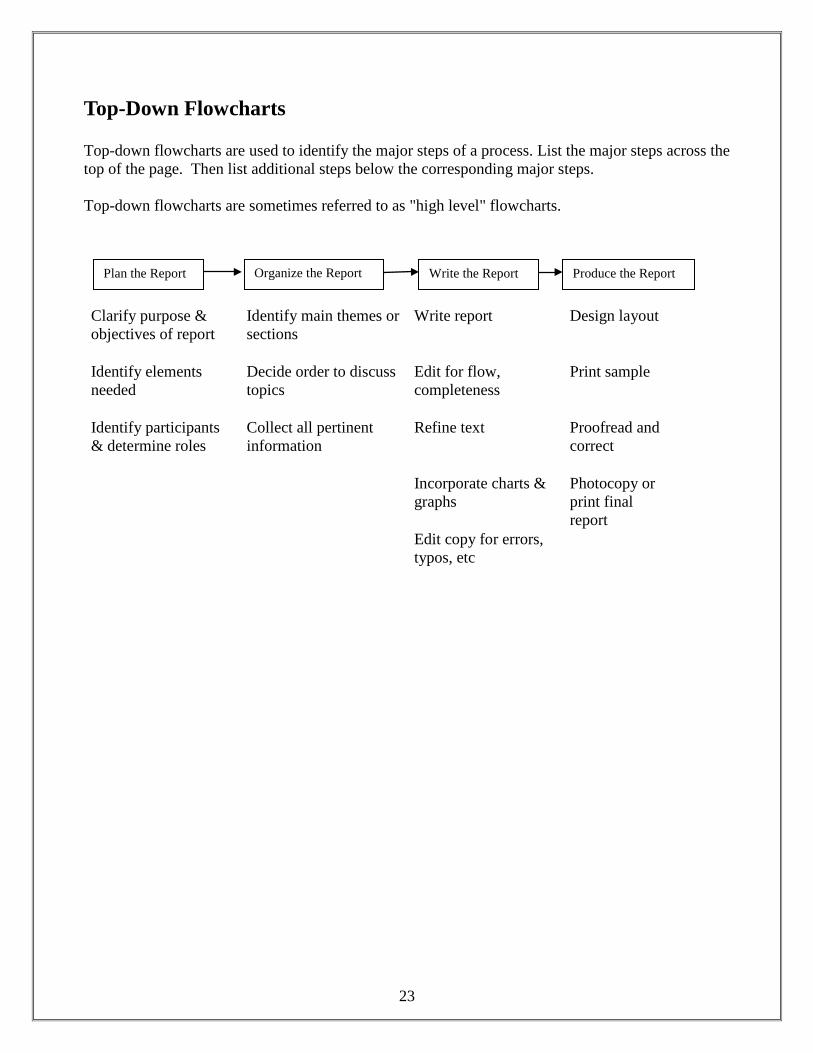
Top-Down Flowcharts
Top-down flowcharts are used to identify the major steps of a process. List the major steps across the top of the page. Then list additional steps below the corresponding major steps. Top-down flowcharts are sometimes referred to as "high level" flowcharts. Clarify purpose & objectives of report
Identify main themes or sections
Write report Design layout
Identify elements needed
Decide order to discuss topics
Edit for flow, completeness
Print sample
Identify participants & determine roles
Collect all pertinent information
Refine text Proofread and correct
Incorporate charts & graphs
Photocopy or print final report
Edit copy for errors, typos, etc
Plan the Report Organize the Report
Write the Report Produce the Report

24
Vertical Flowchart
On time forappt?
Yes
NoDelay until on-time studentsare checked in
Studentsigns in at
window
Doesstudent
have currentID?
Student waitsfor advisor
IsAdvisoron time?
Fictional Student Registration for Academic Advisors
NoReception staff
confirmsstudent status
Yes
No
Reception staffaccesses and
printsschedule
Yes
Yes
NoStudent waits
for advisor
Student arrivesat Office
Advisor seesstudent and appt
begins
Doesstudent
have classschedule?

25
Complaints about Coffee
0
5
10
15
20
25
30
4/1/
01
4/2/
01
4/3/
01
4/4/
01
4/5/
01
4/6/
01
4/7/
01
4/8/
01
4/9/
01
4/10
/01
4/11
/01
4/12
/01
4/13
/01
4/14
/01
4/15
/01
4/16
/01
4/17
/01
4/18
/01
# of
com
plai
nts
Histograms Histograms are bar graphs that show how often different values occur. Histograms take measurement data (e.g., processing time, response time, scores) and display the distribution to reveal the amount of variation that the process has within it. Primary Application • To analyze quickly whether a process can meet the customer’s requirements • To determine whether the output of a process is distributed approximately normal • To communicate the distribution quickly and easily to others Steps to Constructing 1. Gather & tabulate data (time, weight, size, frequency of specific occurrence) 2. Calculate the range & interval width (how many bars to show on graph) 3. Draw the axes 4. Tabulate the data by intervals 5. Plot the data 6. Analyze the histogram

26
Histograms – Variability Histograms are used to determine the 'spread' or pattern of the data. The most common pattern is the bell-shaped curve known as the ‘normal curve.’ In a normal curve, points are as likely to occur on one side of the average as on the other. Below are samples of histograms which are not normally distributed. Small Variability In this set of data, there isn’t much difference in numbers – there is little variation. This distribution could occur if a process is very consistent, one in which the same results occur almost all of the time. If the time to pay an invoice is always within 5 days, there would be little variability in the histogram. Large Variability This kind of pattern is the opposite of the one above. In this distribution, there is considerable difference in the numbers. This distribution could occur if there is a process which is not under control. For example, if the time to process invoices can vary from 2 days (if the invoice is hand-carried through the process) to 3 months (if the invoice sits in the department for months before being submitted for payment) large variability will occur. Skewed Variability In a skewed distribution, the bars in the graph are lopsided meaning they stack up on one end or the other of the graph. In the skewed graph above, there is a left skew because more of the numbers are on the left side of the graph. This kind of distribution could result in an invoice process if most invoices are paid relatively quickly (in less than one week), but a few take months to be paid. In contrast, a right skewed distribution is one in which more numbers stack on the right side of the graph. In the invoice example, a right skewed distribution would happen if a few invoices were paid in less than a week but most bills took months to be paid.

27
Implementation Plan
Implementation and communication plans can help bring about a successful implementation of a solution. Primary Application
• To list necessary steps for implementation of your improvement efforts • To provide a mechanism for tracking progress • To document who should be notified, and when
Steps to Constructing
1. List steps that need to be completed - refrain from too detailed descriptions 2. Determine who is responsible for each step 3. Decide on a realistic completion date 4. Update as status changes
Action Step Responsible Person Complete By Status / Date
Communication Plan What Messages
need to be conveyed Target
Audience Medium to Communicate
(Email, Newsletter, Meeting, etc.) Due Date
By Whom
28
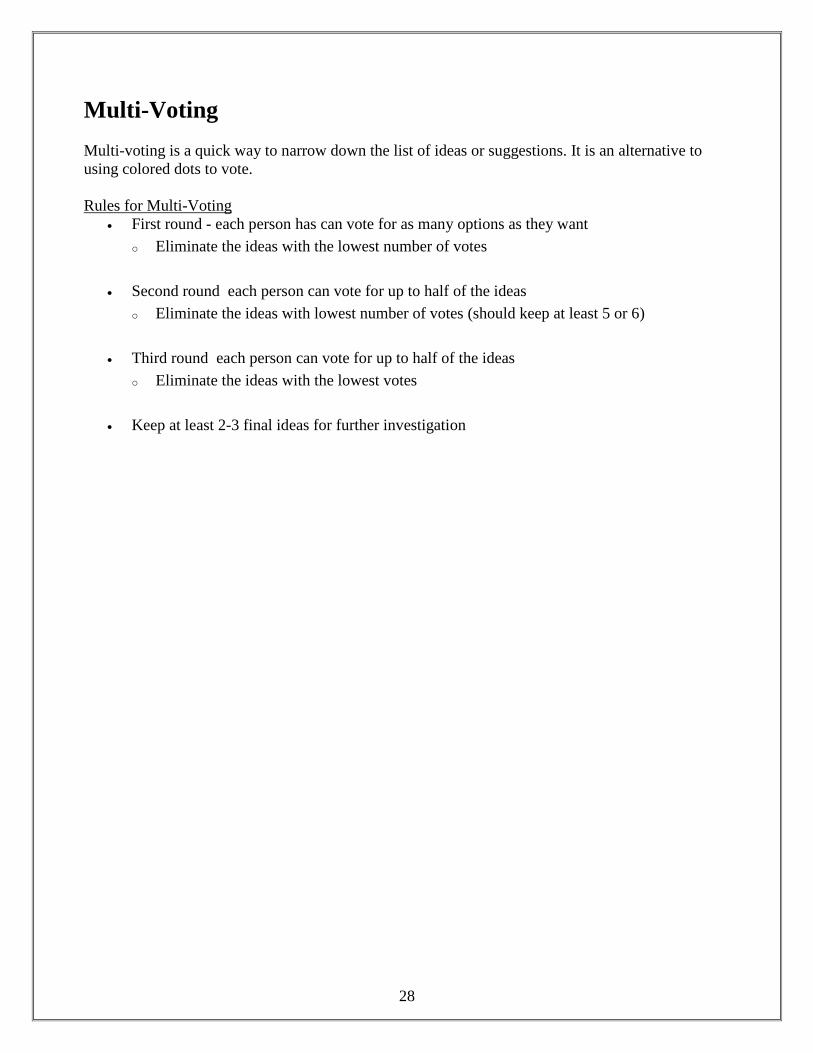
Multi-Voting Multi-voting is a quick way to narrow down the list of ideas or suggestions. It is an alternative to using colored dots to vote. Rules for Multi-Voting
• First round - each person has can vote for as many options as they want o Eliminate the ideas with the lowest number of votes
• Second round each person can vote for up to half of the ideas
o Eliminate the ideas with lowest number of votes (should keep at least 5 or 6) • Third round each person can vote for up to half of the ideas
o Eliminate the ideas with the lowest votes • Keep at least 2-3 final ideas for further investigation

29
Pareto Graph
Pareto graphs are a special form of vertical bar graphs which help to determine which problems to solve and in what order. Doing a Pareto graph based on either a checklist or some other form of data collection helps direct attention to significant problems. Primary Application
• Assess conformance to customer requirements • Rank improvement opportunities and set objectives • Rank order different causes of problems from most to least significant
Steps to Constructing
1. Select problem to be examined or causes to be compared 2. Select standard unit of measurement and time period to be analyzed 3. Collect and summarize data 4. Sort data in order of decreasing frequency 5. Create a bar chart where heights represent frequency 6. Compare frequency of each cause relative to all other causes
Customer Complaints: Visits to Advisor
4535
10 9 7
42%
75%
85%
93%100%
0
20
40
60
80
100
Wait Time IncorrectInformation
ReschedulingAppts
Incorrect Item Late Invoice0%
20%
40%
60%
80%
100%
Number of Complaints Cumulative % Complaints Pareto Target
30
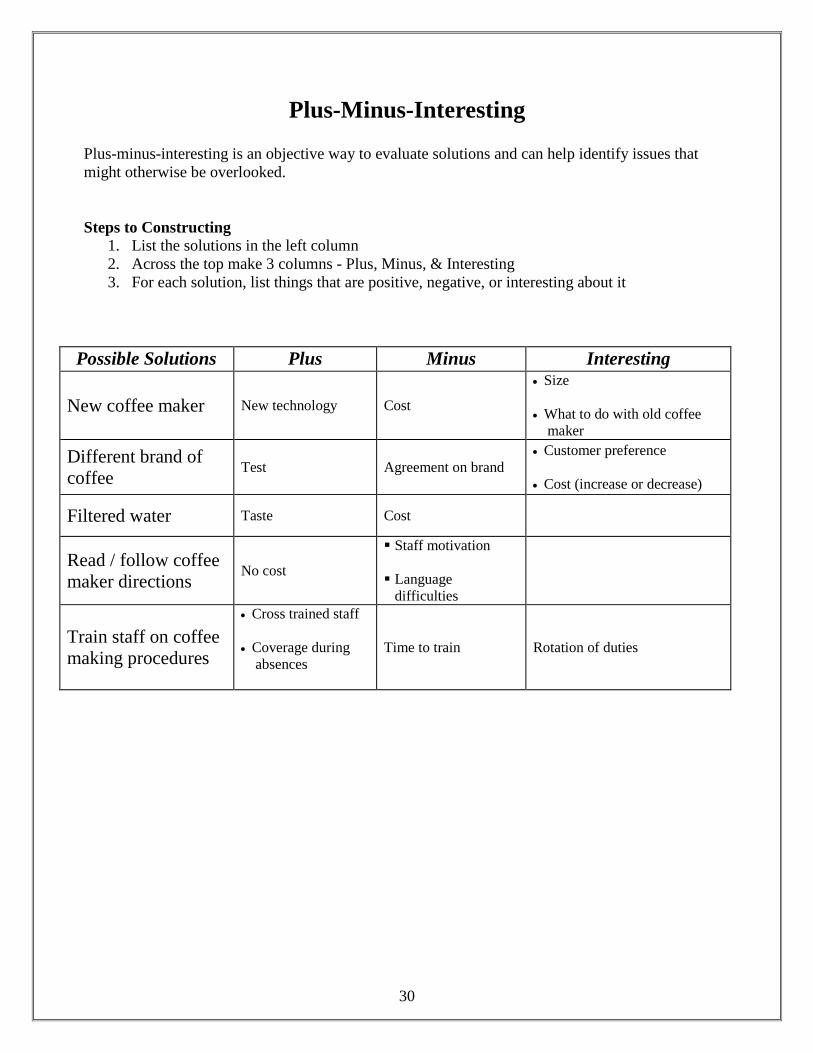
Plus-Minus-Interesting
Plus-minus-interesting is an objective way to evaluate solutions and can help identify issues that might otherwise be overlooked. Steps to Constructing
1. List the solutions in the left column 2. Across the top make 3 columns - Plus, Minus, & Interesting 3. For each solution, list things that are positive, negative, or interesting about it
Possible Solutions Plus Minus Interesting
New coffee maker New technology Cost
• Size • What to do with old coffee
maker
Different brand of coffee Test Agreement on brand
• Customer preference • Cost (increase or decrease)
Filtered water Taste Cost
Read / follow coffee maker directions No cost
Staff motivation Language
difficulties
Train staff on coffee making procedures
• Cross trained staff • Coverage during
absences
Time to train Rotation of duties

31

32
Analyze the process
Identify possible causes of problems
Select likely causes
Gather data to establish root causes
Analyze data
Rank causes
Develop permanent solutions
Project Progress Checklist
Project progress checklists can be used to monitor the team’s progress through the PDCA cycle. This tool can help if a team gets stuck between phases of a project. Some of the items may not pertain to your team – or you might be able to identify other steps that are not listed here that you want to add.
Team charter / mission statement
Receive from management
Clarify, modify if necessary
Get management approval for mission revisions
Define goals and objectives related to mission
Planning
Select team members
Determine when team meetings will be held
Create an improvement plan
Develop a top-down flowchart of project stages
Make changes & document improvements
Develop a pilot plan to test changes
Implement pilot
Gather data on new process
Analyze data, critique changes in light of data
Redesign improvements in process and repeat this step if necessary
Implement additional changes
Monitor results of changes
Establish a system to monitor in the
Education / team building activities
Introduce team members
Explain roles and expectations
Provide training in needed data tools
Develop ownership in project
Study the process
Construct top-down flowchart of process
Interview customers to identify needs
Design data gathering procedures
Gather data on process
Analyze data to see if process is stable
Identify problems with process
Closure
Prepare presentation on project
Deliver presentation
Evaluate team’s progress
Document changes in the process

33
Complaints about Coffee
02468
10121416
4/1/01
4/2/01
4/3/01
4/4/01
4/5/01
4/6/01
4/7/01
4/8/01
4/9/01
4/10/0
1
4/11/0
1
4/12/0
1
4/13/0
1
4/14/0
1
4/15/0
1
4/16/0
1
4/17/0
1
4/18/0
1
# of
com
plai
nts
bitterweakcold
Run Charts (Trend Charts)
Run charts, which are sometimes referred to as trend charts, are used to visually represent data over time. They can help monitor a process to see whether or not the long-range average is changing. Run charts are simple tools to construct and use. Primary Application
• To monitor quality measures • To focus attention on meaningful shifts in data • Find patterns that can yield valuable insights • Compare one period of data to another, checking for changes
Steps to Constructing
1. Identify what to measure (quality indicator such as volume, cycle time, errors, waste) 2. Collect data 3. Plot data on graph 4. Search for patterns or trends in data
Cautions / Drawbacks When using run charts to plot data, there is a tendency to see every variation in data as being important. The user should remember that run charts are used to help focus attention on truly vital changes in the process, which may represent a trend or shift in the average.

34
Surveys Surveys are used to collect data about the knowledge and opinions of a targeted group of people. Common types of surveys are written questionnaires and face-to-face or telephone interviews. Surveys are commonly used in quality improvement efforts to discover customers’ views of how a process is functioning. Primary Application
• When identifying customer requirements • When assessing performance against requirements • When identifying or prioritizing problems to address • When assessing whether an implemented solution was successful • Periodically to confirm that improved performance is being maintained
Steps to Constructing
1. Determine objective of survey – what you hope to learn 2. Write down as many questions as possible related to the objective, then narrow to a few
critical ones 3. Rewrite questions emphasizing question type and wording
• Close-ended questions are structured, offering only specifically stated response alternatives such as multiple choice, rating scale, yes/no or agree/disagree
• Open-ended questions are unstructured and permit free latitude in response but hard to tabulate
4. Arrange questions in logical sequence by topic and from general to specific within topic 5. Write directions and plan page layout 6. Test draft survey by surveying a small sample of people 7. Revise survey as needed 8. Distribute survey
Ways to increase response rate of surveys
• Have surveys printed on colored paper so they don’t get lost on desks • Use email for surveys • Use personal addressing as opposed to a form letter • Plan for second mailing to increase response rate • Obtain organizational commitment to permit & encourage people to participate