continuous production of succinic acid with
TRANSCRIPT

CVD 800
Continuous production of succinic acid with
Actinobacillus
succinogenes biofilms Effect of complex nitrogen
source on yield and productivity
Uma RP Vijayan
10065424
copycopy UUnniivveerrssiittyy ooff PPrreettoorriiaa
Continuous production of succinic acid with Actinobacillus
succinogenes biofilms Effect of complex nitrogen source
on yield and productivity
by
Uma Rajendra Prasad Vijayan
Dissertation presented in partial fulfilment of the requirements for the degree
of
Master of Engineering in Chemical Engineering
at the University of Pretoria
Faculty of Engineering the Built Environment and Information Technology
Department of Chemical Engineering
University of Pretoria
Supervisor Prof W Nicol
26 April 2016
copycopy UUnniivveerrssiittyy ooff PPrreettoorriiaa
Synopsis
Continuous fermentations were performed in an external-recycle biofilm
reactor using glucose and CO2 as carbon substrates The nitrogen source for
the auxotrophic Actinobacillus succinogenes was a combination of yeast
extract (YE) and corn steep liquor (CSL) and sometimes only YE or CSL
was used The total concentration of the complex nitrogen source in the
growth medium remained constant at 16 gmiddotL-1 although the respective
concentrations of YE and CSL were varied for all runs In this study the
concentrations of the organic acids especially succinic acid (SA) and its
productivity were profiled
The succinic acid productivity of A succinogenes decreased by 67 as the
amount of YE in the complex nitrogen source mixture decreased from
16 gmiddotL-1to 0 gmiddotL-1 Succinic acid production increased as the CSL
concentration in the nitrogen source increased and the mass ratio of
succinic acid to acetic acid exceeded the theoretical maximum limit of
393 gmiddotg-1 when only CSL was used as the nitrogen source The mass ratio
of formic acid to acetic acid was consistently within the theoretical yield
limitations (077 gmiddotgminus1) and decreased as the CSL concentration in the
nitrogen source increased
Three fermentation runs were performed The highest SA concentration in
this study was 2257 gmiddotL-1 when only YE was used as the nitrogen source in
the growth medium and the highest SA productivity obtained in this study
was 158 gmiddotL-1middoth-1 when a combination of YE and CSL was used as a nitrogen
source The highest mass ratio of SA to AA achieved was 83 gmiddotg-1 when CSL
copycopy UUnniivveerrssiittyy ooff PPrreettoorriiaa
was the sole nitrogen source The mass ratio of FA to AA was consistently
less than 077 gmiddotg-1 approaching 0 gmiddotg-1 as the CSL concentration in the
nitrogen source increased
It is assumed that surplus nicotinamide adenine dinucleotide (NADH) is
required to achieve the results obtained in this study and it is likely to be
provided by the activation or enhancement of an alternative metabolic
pathway ie the pentose phosphate pathway in the presence of CSL or the
absence of YE
Keywords A succinogenes Continuous fermentation Biofilm Corn steep
liquor Yeast extract
copycopy UUnniivveerrssiittyy ooff PPrreettoorriiaa
Acknowledgements
1 Prof Willie Nicol is thanked for his financial support towards this
research in addition to his role as an excellent supervisor
2 The financial assistance of the National Research Foundation (NRF)
towards this research is hereby acknowledged Opinions expressed and
conclusions arrived at are those of the author and are not necessarily to be
attributed to the NRF
3 Sekghetho Charles Mokwatlo is thanked for his general assistance in
experimental work
4 Michael Bradfield Andre Naudeacute and Jolandi Herselman are thanked for
their insights into the experimental procedure
copycopy UUnniivveerrssiittyy ooff PPrreettoorriiaa
Table of Contents
Synopsis iii
Acknowledgements v
List of Figures viii
List of Tables x
Nomenclature xi
1 Introduction 1
2 Literature survey 5
21 Bio-based chemicals 5
22 Succinic acid 6
221 Application of succinic acid 6
222 Succinic acid market 8
223 Bio-based SA production 9
23 Actinobacillus succinogenes 10
231 Decsription of microorganism 10
232 Metabolic pathway 11
2 4 SA yield considerations 16
25 Nitrogen source for A succinogenes 19
26 Continuous fermentation 27
3 Materials and Methods 30
31 Microorganism and growth 30
copycopy UUnniivveerrssiittyy ooff PPrreettoorriiaa
32 Fermentation media 30
33 Bioreactor 33
34 Fermentation procedure 36
35 Online monitoring 37
36 Analytical methods 38
37 Steady-state check 39
38 Summary of fermentation 40
4 Results and Discussion 44
41 Experimental strategy for different runs 44
42 Productivity analysis 49
43 Analysis of product distribution 52
5 Conclusions 64
6 References 66
copycopy UUnniivveerrssiittyy ooff PPrreettoorriiaa
List of Figures
Figure 21 Succinic acid molecule 6
Figure 22 Various chemicals and products derived from succinic acid
(Zeikus et al 1999) 7
Figure 23 Simplified metabolic network of A succinogenes (based on
McKinlay et al (2007) 14
Figure 24 Simplified metabolic network of A succinogenes (PDH
active) 17
Figure 25 Simplified metabolic network of A succinogenes (PFL active)
18
Figure 26 (a) Simplified metabolic network of A succinogenes
(oxidative TCA cycle active) (b) Simplified metabolic network of A
succinogenes (glyoxylate bypass active) 19
Figure 31a) Simplified schematic of bioreactor setup 34
Figure 31b) Bioreactor setup 35
Figure 32 a) Bioreactor before inoculation b) Biofilm growth using
only YE as nitrogen source c) Bioreactor with only CSL as nitrogen
source 42
Figure 33 a) Internal support for biofilm attachment (at the end of
fermentation run 1) b)Internal supports for biofilm attachment (at
the end of fermentation run 3) 43
Figure 41 Product concentration profiles for SA AA and FA of
A succinogenes as the YE in the growth media varied 50
Figure 42 SA productivity profile and glucose consumption rate profiles
of A succinogenes as the YE in the growth media varied 51
copycopy UUnniivveerrssiittyy ooff PPrreettoorriiaa
Figure 43 Experimental yields plotted with the maximum theoretical
yields profile of A succinogenes as YE in medium changes 55
Figure 44 Pyruvate concentration profile of A succinogenes as YE in
medium changes 56
Figure 45 NADH ratio consumed during production of A succinogenes
as YE in medium changes 57
Figure 46 Mass ratio of succinic acid over glucose profile of
A succinogenes as YE in medium changes 60
copycopy UUnniivveerrssiittyy ooff PPrreettoorriiaa
List of Tables
Table 21 Batch fermentation studies of A succinogenes using different
nitrogen sources namely YE and CSL 24
Table 22 Continuous fermentation studies of A succinogenes using
different nitrogen sources namely YE and CSL 29
Table 31 Specifications of feed mediaa used during fermentations 32
Table 32 Summary of fermentation runs performed 40
Table 41 Steady state data for the three continuous fermentation runs
46
copycopy UUnniivveerrssiittyy ooff PPrreettoorriiaa
Nomenclature
CAA concentration of acetic acid (gmiddotL-1)
CFA concentration of formic acid (gmiddotL-1)
CS0 initial glucose concentration in feed medium (gmiddotL-1)
CSA concentration of succinic acid (gmiddotL-1)
Df dilution rate based on feed (h-1)
DT total dilution rate(h-1)
MMAA molar mass of acetic acid (gmiddotgmol-1)
MMFA molar mass of formic acid (gmiddotgmol-1)
MMSA molar mass of succinic acid (gmiddotgmol-1)
PSA succinic acid productivity
R1 fermentation run 1
R2 fermentation run 2
R3 fermentation run 3
copycopy UUnniivveerrssiittyy ooff PPrreettoorriiaa
vvm volumetric flowrate of gas per reactor volume
YAASA yieldratio of succinic acid on acetic acid (gmiddotg-1)
YAAFA yieldratio of formic acid on acetic acid (gmiddotg-1)
YGLSA yieldratio of succinic acid on glucose (gmiddotg-1)
Abbreviations
AA AcA acetic acid
Ac-CoA acetyl coenzyme A
ATP adenosine triphosphate
CSL corn steep liquor
DCW dry cell weight
FA formic acid
FDH formate dehydrogenase
FDH-H formate dehydrogenase activity
copycopy UUnniivveerrssiittyy ooff PPrreettoorriiaa
FHL formate-hydrogen lyase
Fum fumarate
GLC Glu glucose
HPLC high-performance liquid chromatography
Mal malate
NADH nicotinamide adenine dinucleotide
NADPH nicotinamide adenine dinucleotide phosphate
OXA oxaloacetate
PDH pyruvate dehydrogenase
PEP phosphoenolpyruvate
PFL pyruvate-formatelyase
PPP pentose phosphate pathway
PYR Pyr pyruvate
RI refractive index
copycopy UUnniivveerrssiittyy ooff PPrreettoorriiaa
SA succinic acid
TCA tricarboxylic acid
TSB tryptone soy broth
YE yeast extract
Greek letters
ΔGLC glucose consumed (gmiddotL-1)
copycopy UUnniivveerrssiittyy ooff PPrreettoorriiaa
1
1 Introduction
Modern civilisation is highly dependent on chemical products and fuels
derived from non-renewable raw materials such as crude oil and natural
gas However the depletion of non-renewable raw materials and the
potentially negative long-term environmental impacts caused by the
processing of the raw materials is forcing industries to develop alternative
routes to produce the fuel and chemicals that are essential for current
society (Cok et al 2014)
An alternative that is fast growing in popularity is the replacement of non-
renewable raw materials such as fossil fuels with renewable biomass In
2004 the US Department of Energy (Werpy amp Peterson 2004) identified a
wide range of chemicals that could be produced from renewable biomass
and only 12 of them were listed as top platform chemicals In 2010 the list
was revised and the top 10 chemicals that had the biggest market potential
were declared (Bozell amp Peterson 2010) Succinic acid (SA) was shortlisted
as one of those top 10 chemicals (Bozell amp Peterson 2010) and its
recognition as a potential platform chemical by the US Department of
Energy resulted in opportunities for SA to replace petroleum-based
platform chemicals such as maleic anhydride and adipic acid (Zeikus Jain amp
Elankovan 1999)
At present commercial production of bio-SA is done mainly by four
companies BioAmber Reverdia Myriant and Succinity which Succinity is
the largest in terms of production capacity (Grand-View- Research 2014)
In order for fermentation processes to be economically competitive with
petrochemicals-derived products research on the biological production of
copycopy UUnniivveerrssiittyy ooff PPrreettoorriiaa
2
SA has become extensive over the years because of the need to understand
and refine the process of producing bio-SA
In the literature the choices of microbial organisms available for bio-based
SA production are very diverse although most natural production hosts
described are capnophilic microorganisms (Beauprez De Mey amp Soetaert
2010) A succinogenes stood out as one of the most favourable strains for
commercial production due to its ability to produce SA naturally at high
titres (Zeikus et al 1999) and its tolerance to high acid concentrations (Lin
et al 2008) However one major drawback of Actinobacillus succinogenes
is the auxotrophic requirement for amino acids and vitamins (McKinlay
Zeikus amp Vieille 2005) In fermentation studies usually the essential amino
acids and vitamins are provided by adding yeast extract (YE) or corn steep
liquor (CSL) to the feed medium but in an industrial setup addition of YE
would be highly unfeasible because of the estimated cost which ranges
between US$350kg and US$67kg (Kwon et al 2000 Sridee et al 2011)
For the successful commercial exploitation of A succinogenes the cost of
the fermentation feedstock and the availability of essential and beneficial
ingredients that will influence the conversion process should be taken into
account Since using only YE is not economically feasible cheaper sources
of these critical components are hence required CSL is the first ideal
candidate as its market value ranges between US$007kg and
US$0075kg (Davis et al 2013)
Most fermentation studies done on A succinogenes employ a batch mode of
operation (Beauprez et al 2010) in which final concentrations yield and
productivity are used as performance indicators To date all publications in
which the complex nitrogen source was varied have used batch
copycopy UUnniivveerrssiittyy ooff PPrreettoorriiaa
3
fermentation (Xi et al 2013 Jiang et al 2010 Shen et al 2015 Yan et al
2013) Nevertheless none of these studies distinguished between the
nitrogen requirements for growth-related and non-growth-related SA
production It is well known that the specific growth rate of A succinogenes
is severely inhibited by the accumulation of organic acids in the
fermentation broth (Corona-Gonzaacutelez et al 2008) and that the specific
growth rate approaches zero above an SA titre in the vicinity of 10-15 gmiddotL-1
(Brink amp Nicol 2014) Most batch fermentations reach a final SA
concentration well in excess of this critical SA concentration thus
indicating that a significant fraction of the SA in these studies is produced
under non-growth or maintenance conditions and that the nutrient
requirements for the non-growth production phase might be different to
those of the growth phase in all likelihood less severe
In order to study the non-growth nutrient requirements of A succinogenes
steady state would be ideal this can be achieved through a continuous
mode of operation Maharaj Bradfield and Nicol (2014) have clearly
demonstrated that prolonged steady state operation of A succinogenes
under non-growth conditions is feasible and stable The concentrations of
organic acids in the fermentation broth can be manipulated by altering the
throughput (or dilution rate) in order to induce non-growth production of
SA Another beneficial factor with continuous operations is biofilms which
are unavoidably formed in long-term continuous fermentations and can
significantly enhance productivity as observed by Van Heerden and Nicol
(2013b)
This study aims to evaluate the complex nitrogen requirements of non-
growing A succinogenes biofilms Nitrogen sources used in this study will
copycopy UUnniivveerrssiittyy ooff PPrreettoorriiaa
4
be restricted to YE and CSL since they are the most common sources of
nitrogen sources used in the literature and because of the potential
economic advantage of using CSL Initial biomass accumulation will be
achieved by using only YE for rapid growth of the micro-organism Once
non-growth production of SA commences the YE content will be reduced
and the CSL content will be increased The total complex nitrogen source
concentration in the feed will be maintained at a constant value of 16 gmiddotL-1
throughout the experiments however the percentage of YE in the total
complex nitrogen source will decrease over time Throughout the study the
change in nitrogen source will be referred to as YE in the nitrogen
source At a fixed dilution rate (at a chosen initial SA concentration) for the
whole run productivity and product distribution as a function of YE in
the nitrogen source will be assessed
copycopy UUnniivveerrssiittyy ooff PPrreettoorriiaa
5
2 Literature survey
21 Bio-based chemicals
Bio-based chemicals are platform and intermediate chemicals derived from
biomass feedstocks The US Department of Energy (DOE) identified 300
potential bio-based platform chemicals but most of the proposed
chemicals did not have sufficient market potential nor was it economical to
produce them Only 30 chemicals were considered to be relevant since they
had the potential to replace non-bio-based chemicals and out of those 30
chemicals only 12 building block chemicals were identified as being the
most important because of their potential market chemical derivatives and
synthesis pathways (Werpy amp Peterson 2004)
The importance for bio-based production of fuels and chemicals arises
from the need to move away from petroleum-based production The
depletion of non-renewable feedstocks and the strong demand by
consumers for environmentally friendly energy sources has made the
production of fuels and chemicals from biomass feedstocks to be a
sustainable alternative to the petrochemical production route Government
and industry are now interested in bio-based resources and production and
they understand that to form a sustainable global economy a bio-based
industry should substitute the current petroleum-based routes to produces
fuels and chemicals (Cok et al 2014) However to have a bio-based
economy for the development of highly efficient and cost effective bio-
refineries is essential Petrochemical production has been optimised and
refined over long period of time making it a cheaper option compared with
the relatively new bio-based production Therefore to enhance the
development of a bio-based economy it is essential that the biological
copycopy UUnniivveerrssiittyy ooff PPrreettoorriiaa
6
processes are understood refined and optimised through continuous
research and development (Cok et al 2014)
22 Succinic acid
221 Application of succinic acid
One of the top 12 bio-based platform chemicals recognized by the US DOE
was succinic acid (SA) (Werpy amp Peterson 2004 Bozell amp Peterson 2010)
See Figure 21 for the molecular structure of SA Most of the SA produced to
meet global demand is manufactured through the petroleum route ie it is
produced by the partial oxidation of butane followed by hydrogenation of
the intermediate product which is maleic anhydride However the
expensive conversion costs and non-renewability of this petroleum-based
route for producing SA has limited the SA market to low-cost bulk
application (Xu amp Guo 2010 Beauprez et al 2010)
Figure 21 Succinic acid molecule
Traditionally the application of SA has been limited mainly to four
functional regions its largest area of application is as a surfactant an
additive to a detergent and a foaming agent the second is as an ion chelator
copycopy UUnniivveerrssiittyy ooff PPrreettoorriiaa
7
for preventing corrosion and spot corrosion of metals in the electroplating
industry the third is as an acidulant which is a pH regulator and flavouring
agent in the food industry and the fourth area of application region is in
the pharmaceutical industry specifically in the production of antibiotics
amino acids and vitamins (Xu amp Guo 2010) As a platform chemical it is
also used as a precursor of many commodity or specialty chemicals as seen
in Figure 22 (Zeikus et al 1999)
Figure 22Various chemicals and products derived from succinic acid
(Zeikus et al 1999)
Nevertheless there is potential for the bulk application of SA The key to
the growth of the SA market lies in its derivatives The diamines and diols
that are derived from SA can be used as monomer units of a variety of
Figure 22 Various chemicals and products derived from succinic acid
(Zeikus et al 1999)
copycopy UUnniivveerrssiittyy ooff PPrreettoorriiaa
8
plastics such as polyesters polyamides and polyester amides (Bechthold et
al2008) Among them is the SA derivative 14-butanediol (BDO) It is a
platform chemical for tetrahydrofuran (THF) gamma-butyrolactone (GBL)
and polymers such as polybutylene terephthalate (PBT) and polyurethane
(PU) These chemicals are widely used in the production of engineering
thermoplastics and elastic fibres and because of these applications the
BDO market is expected to increase as the demand for THF and spandex for
sports apparel increase (Grand- View- Research 2014) Another derivative
of SA that is predicted to increase the SA global market is the biodegradable
polybutylene succinate (PBS) and its copolymers PBS polymers have a
range of applications as supermarket bags packaging film mulch film and
other disposable articles Owing to the steady growth of the market for
biodegradable plastic the demand for PBS is expected to increase rapidly
which in turn could grow the SA market (ICIS 2012)
222 Succinic acid market
The global SA market in 2011 was estimated to be worth US$240 million
and it is projected to reach US$836 million by 2018 (Transparency-Market-
Research 2014) due to the development of the bio-SA Consumption of
petroleum-based SA in manufacturing various other chemicals is restricted
due to unpredictability of price and carbon footprints These concerns
however are advancing the progression of biological manufacturing of SA
The major drivers for this growth will be the high cost of crude oil the rise
in carbon footprints and an interest in producing ldquogreenrdquo chemicals Newer
applications of SA as PBS BDO plasticizers and polyesters polyols will fast-
track the future growth of the bio-SA market However the higher price of
bio-SA and the lengthy extraction processes are the primary factors that
copycopy UUnniivveerrssiittyy ooff PPrreettoorriiaa
9
will restrain the market growth for the next few years although the market
is expected to grow at a significant rate over the next seven years (Allied
Market Research 2014)
At present there are numerous institutions researching the development of
SA through bio-based raw materials and there are companies that are
already manufacturing bio-SA for commercial purposes The list of major
companies involved in the production of bio-SA includes BioAmber
Myraint DSM Mitsui amp Co Mitsubishi BASF Roquette Freacuterese SA Purac
and Reverdia In 2013 the global bio-SA market volume was approximately
51 100 tons and in seven years it is expected to reach a market volume of
710 000 tons In that same year BDO is predicted to emerge as the largest
application segment for bio-SA as it will replace maleic anhydride in the
production of BDO every 1MT of maleic anhydride will be replaced by
12MT of bio-SA (Allied Market Research 2014)
223 Bio-based SA production
Bio-SA which has the same structure as petroleum-based SA is produced
by the fermentation of a carbohydrate using a natural producer or an
engineered organism The feedstock used for the production of bio-based
succinic acid can be wheat maize glucose lignocellulosic-derived sugar or
sorghum grain processed to starch (BioConSepT 2013)
Compared with the petroleum-based process the fermentation process has
the advantages of mild operating conditions independence of the fossil
feedstock and fixation of CO2 and with development of genetic engineering
metabolic modification of microbial strains and improvement of
copycopy UUnniivveerrssiittyy ooff PPrreettoorriiaa
10
purification technology the fermentative production of SA from renewable
resources can be more cost-effective than the fossil-based processes (Xu amp
Guo 2010)
To date various microorganisms have been reported to produce SA such
as typical gastrointestinal bacteria and rumen bacteria and some
lactobacillus strains (Kaneuchi Seki amp Komagata 1988 Beauprez et al
2010) Among them Actinobacillus succinogenes (Guettler Rumler amp Jain
1999) Anaerobiospirillum succiniciproducens (Oh et al 2008) Mannheimia
succiniciproducens (Lee et al 2000) and genetically modified Escherichia
coli (Lin Bennet amp San 2005) are the most promising strains for producing
SA at high yields Fungi species such as Aspergillus niger Aspergillus
fumigatus Byssochlamys nivea Lentinus degener Paecilomyces varioti
Penicillium viniferum and yeast Saccharomyces cerevisia also produce
succinic acid but not in high concentrations or yields (Song amp Lee 2006)
Nevertheless for industrial applications A succinogenes stands out because
it is by far the most studied wild strain (Brink amp Nicol 2014) and its ability
to produce high concentrations of SA naturally from a broad range of
carbon sources (Guettler et al 1999 McKinlay Vieille amp Zeikus 2007)
further makes it ideal for commercial applications
23 Actinobacillus succinogenes
231 Description of microorganism
A succinogenes a Gram-negative rod-shaped and non-motile bacterium
isolated from bovine rumen (Guettler et al 1999) is considered to be one
copycopy UUnniivveerrssiittyy ooff PPrreettoorriiaa
11
of the top natural SA producing microorganisms (McKinlay et al 2007
Brink amp Nicol 2014) It produces SA as part of a mixed acid fermentation in
which acetic acid (AA) formic acid (FA) and ethanol are the by-products It
is capable of digesting a wide range of carbon sources such as glucose
fructose mannitol arabitol sorbitol sucrose xylose and arabinose under
anaerobic conditions (Van der Werf et a 1997) but most laboratory
experiments use glucose fructose xylose and sucrose as carbon substrates
A succinogenes grows optimally at moderate temperatures (37 degC to 39 degC)
and it is facultative anaerobic ie it can survive in the presence or absence
of oxygen Furthermore it is capnophilic because its growth is enhanced at
increased CO2 concentrations (Guettler et al 1999) and it is a
chemoheterotroph that grows optimally at pH ranging from 6 to 74
232 Metabolic pathway
As stated earlier A succinogenes is a promising candidate for industrial SA
production However in addition to producing SA it also produces formic
acid (FA) acetic acid (AA) and sometimes ethanol The summarised version
of the metabolic pathway for A succinogenes is shown in Figure 23
A succinogenes ferments glucose to phosphoenolpyruvate (PEP) by
glycolysis PEP is thought to serve as the point of divergence between the
FA AA and ethanol producing pathway (C3 pathway) and the SA producing
(C4) pathway The path from glucose to PEP is neutral overall in terms of
adenosine triphosphate (ATP) production but one-third of nicotinamide
adenine dinucleotide (NADH) is produced per cmol of glucose consumed
copycopy UUnniivveerrssiittyy ooff PPrreettoorriiaa
12
C4 metabolic pathway (reverse tricarboxylic pathway)
Overall this pathway leads to the formation of SA and two molecules of
NADH and one molecule of CO2 must be consumed to form one molecule of
SA Ideally one would prefer the carbon flux to follow this route to attain
homosuccinate production
The key enzyme in this pathway is PEP carboxykinase because it pushes
the carbon flux from PEP to oxaloacetate which later on becomes SA This
enzyme is regulated by CO2 levels ie the level of CO2 available to A
succinogenes will have an influence on the SA production of the organism
(Van der Werf et al 1997) Hence it will be imperative to achieve correct
extracellular and intracellular CO2 levels during SA production
C3 metabolic pathway
However the C3 pathway cannot be avoided due to the redox requirement
of the cell In this pathway PEP is converted to pyruvate by pyruvate
kinase generating one molecule of ATP during the process Pyruvate is
then converted to acetyl-CoA by either pyruvate dehydrogenase (PDH)
andor pyruvate-formatelyase (PFL)
Pyruvate conversion with PDH results in one molecule of CO2 and one
molecule of NADH being formed alongside one molecule of AA With PFL
FA is produced instead of CO2 and NADH but FA can be further broken
down to CO2 and NADH by the enzyme formate dehydrogenase (FDH)
copycopy UUnniivveerrssiittyy ooff PPrreettoorriiaa
13
The FDH activity (encoded by the fdhF gene in A succinogenes) is known to
occur only under the following conditions (Spector 2009)
Absence of an electron acceptor such as oxygen or nitrate
Acidic pH conditions
Presence of FA
PFL expression is stated to be dependent upon two glycolysis enzyme
activities namely phosphoglucoisomerase and phosphofructokinase
Interestingly the expression of PFL and FDH enzymes is reported to
increase under carbon energy source starvation (Spector 2009)
Acetyl-CoA is the branch point at which both ethanol and AA are later
formed In this process a molecule of ATP is produced per molecule of AA
formed For one molecule of ethanol formed two molecules of NADH are
absorbed However ethanol formation can be reduced if there is
intracellular availability of CO2 to the organism (Van der Werf et al 1997)
copycopy UUnniivveerrssiittyy ooff PPrreettoorriiaa
14
Figure 23 Simplified metabolic network of A succinogenes (based on
McKinlay et al (2007)
copycopy UUnniivveerrssiittyy ooff PPrreettoorriiaa
15
Pentose phosphate pathway (PPP)
Figure 23 gives a simplified version of the metabolic pathway of A
succinogenes However several studies have noted that the pentose
phosphate pathway is an additional pathway for the A succinogenes (Brink
amp Nicol 2014 Bradfield amp Nicol 2014 Van der Werf et al 1997 McKinlay
et al 2007 McKinlay et al 2005) McKinlay (2007) stated that the PPP
only contributed 20 to the NADPH required for the organismrsquos growth
But Bradfield amp Nicol (2014) and Brink amp Nicol (2014) postulated that the
contribution of the PPP could increase and be more than predicted when
the organism enters the maintenance phase or non-growth phase
According to Ruumlhl et al (2012) a resting non-growing Bacillus subtilis cell
showed constant metabolic activity without cell growth which lead to an
apparent overproduction of nicotinamide adenine dinucleotide phosphate
(NADPH) (via the PPP) which is then converted by transhydrogenase into
NADH Bradfield amp Nicol (2014) claim that it is possible that this can also
occur with A succinogenes as it does possess the transhydrogenase The
analysis by Bradfield amp Nicol (2014) indicated an under-prediction of the
YAASA for the growth metabolism (associated with NADH ldquolossesrdquo) while an
over-prediction of the YAASA is achieved for the maintenance metabolism
(associated with NADH ldquogainrdquo) This could imply that different metabolic
pathways are employed under growth and maintenance conditions
Medium contributions were previously considered as the source for the
NADH disparities during the maintenance phase but this reasoning can be
ruled out given the results of the study done by Brink amp Nicol (2014) in
which the same medium resulted in opposite redox balance trends with
regard to the growth and non-growth phases
copycopy UUnniivveerrssiittyy ooff PPrreettoorriiaa
16
24 SA yield considerations
The theoretical maximum yield of SA on a carbon substrate through
fermentation can be determined by considering the net metabolic pathway
involved and a redox balance as illustrated by Villadsen Nielsen amp Lideacuten
(2011 159-163) The overall black box stoichiometry in converting glucose
to SA with no biomass and no by-product formation is
C6H12O6 + 120788
120789CO2rarr
120783120784
120789C4H6O4 +
120788
120789H2O (21)
From Equation 21 the theoretical maximum yield of succinic acid on
glucose (YGLSA) is 112 gmiddotg-1 However it is not possible to achieve the
maximum yield because actual SA yield will depend on the active metabolic
pathway of the organism and the associated product distribution To
determine the maximum YGLSA possible with by-product formation a redox
balance is required
Pyruvate metabolism
Assuming that there is no carbon flux to cell growth and if only the PDH
enzyme is active or FDH converting all FA the overall black box
stoichiometry in converting glucose to SA and AA with no biomass
formation is
C6H12O6 + 120784
120785CO2rarr
120786
120785C4H6O4 +
120784
120785C2H4O2 (22)
Since no FA is formed the YAAFA will be 0 gmiddotg-1 This pathway releases one
molecule of NADH for every molecule of AA produced (see Figure 24) The
copycopy UUnniivveerrssiittyy ooff PPrreettoorriiaa
17
NADH would be consumed by the C4 pathway to produce SA and then the
theoretical YGLSA would be 088 gmiddotg-1
Figure 24 Simplified metabolic network of A succinogenes (PDH
active)
On the other hand if only the PFL enzyme is active both FA and AA will be
formed (see Figure 25) The overall black box stoichiometry in converting
glucose to SA AA and FA with no biomass formation is
C6H12O6 + CO2rarrC4H6O4 +C2H4O2 + CH2O2 (23)
For every molecule of FA formed a molecule of AA will be produced so the
YAAFA will be 076 gmiddotg-1 As a result YGLSA will be 066 gmiddotg-1 If both PFL and
FDH enzymes are active then FA will be broken down to produce CO2 and
NADH which will result in YAAFA being 0 gmiddotg-1 and YGLSA being 088 gmiddotg-1
copycopy UUnniivveerrssiittyy ooff PPrreettoorriiaa
18
Figure 25 Simplified metabolic network of A succinogenes (PFL
active)
Nevertheless as mentioned by Van Heerden amp Nicol (2013a)the maximum
theoretical yield of SA can be obtained through the metabolic engineering
of A succinogenes This can be achieved by manipulating the organism to
use the oxidative part of the tricarboxylic acid (TCA) cycle under anaerobic
conditions (see Figure 26a)
copycopy UUnniivveerrssiittyy ooff PPrreettoorriiaa
19
Figure 26 (a) Simplified metabolic network of A succinogenes
(oxidative TCA cycle active) (b) Simplified metabolic network of A
succinogenes (glyoxylate bypass active)
Alternatively the glyoxylate bypass can be utilised (Figure 26b) to give the
same result For both these scenarios the mass-based SA-to-glucose ratio is
112 gmiddotg-1 which is the maximum theoretical yield of SA that can be
achieved
25 Nitrogen source for A succinogenes
The composition of the growth medium is a key factor in microbial
fermentations An important element of the fermentation medium which
will be essential for the growth of the organism is the nitrogen source
In the rumen A succinogenes is surrounded by a massive source of
nutrients which allow the organism to thrive But outside the rumen more
specifically in the laboratory or in an industrial fermentation setup
copycopy UUnniivveerrssiittyy ooff PPrreettoorriiaa
20
nutrients important for growth of the organism must be provided Since
A succinogenes is auxotrophic it requires certain amino acids and vitamins
to be provided for growth and SA production McKinlay et al (2010)
determined the essential vitamins required for the growth to be nicotinic
acid pantothenate pyridoxine and thiamine and the needed amino acids to
be cysteine glutamate and methionine Furthermore they concluded that
it is able to grow without biotin supplementation
By contrast Xi et al (2012) declared the essential vitamins to be only biotin
and nicotinic acid and the essential amino acids to be only glutamate and
methionine Nevertheless the addition of these defined components makes
the growth medium expensive for industrial use (Shuler amp Kargi 2002 52)
This collection of vitamins and amino acids is thought to be better
introduced to the organism in a complex form (eg yeast extract or corn
steep liquor) where the components and concentration of the nitrogen-
carrying compounds are unknown A complex form of nitrogen source is
less expensive than a defined form and it is said to produce higher cell
growth compared with media with a defined nitrogen source (Shuler amp
Kargi 2002 52)
Batch fermentation studies
Table 21 lists batch studies that investigated alternative nitrogen sources
for SA production and A succinogenes growth From the studies that used
only one type of nitrogen source (either YE or YE amp CSL or CSL amp vitamins)
it can be seen that studies that used only YE generally had a lower YGLSA
compared with the studies that used a combination of YE and CSL as the
nitrogen source Addition of vitamins (Yan et al 2013) to CSL produced SA
copycopy UUnniivveerrssiittyy ooff PPrreettoorriiaa
21
yields and cell growth that were better than the results produced by the YE
and CSL combination
Studies that compared different nitrogen sources within the same study
such as Jiang et al (2010) and Shen et al (2015) compared the
performance of several nitrogen sources inorganic and organic and
observed the following
Inorganic nitrogen sources such as (NH4)2SO4 or NH4Cl were the
worst performing with regard to cell growth and SA yield (Jiang et al
2010)
YE as the only nitrogen source in a growth medium produced the
highest SA yield and the highest dry cell weight (DCW) in comparison
with other nitrogen sources (Jiang et al 2010 Shen et al 2015)
CSL a by-product of corn starch production as the only nitrogen
source in a growth medium was the second best performer (Jiang et
al 2010 Shen et al 2015)
CSL medium did not achieve full carbon substrate conversion
compared with YE medium at the end of the batch fermentation
(Jiang et al 2010 Shen et al 2015)
These studies suggested that the most promising nitrogen source in terms
of A succinogenes growth and SA yield from carbon substrate was yeast
extract (YE) YE is said to have various vitamins amino acids minerals and
trace metals that are necessary to stimulate the growth of A succinogenes
and synthesize its metabolites (Kasprow Lange amp Kirwan 1998) Although
YE is considered to be the best source of nitrogen its price ranges from
US$350kg to US$67kg (Kwon et al 2000 Sridee et al 2011) while the
copycopy UUnniivveerrssiittyy ooff PPrreettoorriiaa
22
price of CSL ranges from US$007kg to US$0075kg (Davis et al 2013)
which makes YE an expensive and unfeasible nitrogen source for long-term
industrial fermentation (Jiang et al 2010 Xi et al 2013 Shen et al 2015)
and CSL an economically viable alternative to YE The feasibility of CSL
feasibility as a nitrogen source was also investigated using microorganisms
such as Mannheimia succiniciproducens (MBEL55E) and Anaerobiospirillum
succiniciproducens Those studies (Lee et al 2000 2002) came to the same
conclusion as Jiang et al (2010) and Shen et al (2015) the inexpensive CSL
can replace the expensive YE as a nitrogen source to promote cell growth
and SA production
A possible reason why CSL proved to be second best to YE is because CSL
contained the cofactor biotin which is considered to be vitally important
for the metabolism of protein lipid and carbohydrate (Xi et al 2012) The
biotin content in CSL is 1 mgmiddotkg-1 and this is said to be sufficient to make a
significant contribution to the nutritional requirement of A succinogenes or
other microorganisms (Nghiem et al 1996) However Jiang et al (2010)
and Shen et al (2015) noticed that with CSL as a nitrogen source in
contrast to YE as the nitrogen source there was a significant amount of
residual glucose that remained at the end of the batch fermentation Shen
et al (2015) suggest that CSL may lack trace elements and certain nitrogen-
containing compounds that prevent A succinogenes from meeting its
normal physiological needs Another reason could be that the batch
fermentation time was not long enough for the CSL medium to reach full
carbohydrate consumption Since no profile of the variables over time was
given for these studies it is hard to determine whether the residual glucose
found in the CSL medium was due to a lack of nutrients or productivity
reduction
copycopy UUnniivveerrssiittyy ooff PPrreettoorriiaa
23
Xi et al (2013) stated that the heme and CSL combination in the production
medium improved SA production by creating a more reductive
environment (the initial redox potential was very low when heme was
added to the medium)
copycopy UUnniivveerrssiittyy ooff PPrreettoorriiaa
24
Table 21 Batch fermentation studies of A succinogenes using different nitrogen sources namely YE and CSL
Study Model Nitrogen source (gmiddotL-1)
Carbon Source
CSo (gmiddotL-1)
CSA (gmiddotL-1)
YGLSA
(gmiddotg-1) YAASA
(gmiddotg-1) YAAFA
(gmiddotg-1)
DCW
(gmiddotg-1)
Gunnarsson
Karakashevamp
Angelidaki (2014)
130Z YE(20) Synthetic
hydrolysate
36 30 083 86 058 25
Zhen et al (2009)
CGMCC
1593
YE(15) Straw
hydrolysate
58 455 0807 7583 083 56
Corona-Gonzalez et
al (2008)
130Z YE(10) Glucose 547 338 062 52 11 37
Liu et al (2008)
CGMCC
1593
YE(10) Sugarcane
molasses
644 464 072 77 3 5
Yan et al (2013)
CCTCC
M2012
036
CSL(25) amp
vitamins
mixture
Glucose 50 39 085 - - -
copycopy UUnniivveerrssiittyy ooff PPrreettoorriiaa
25
Study Model Nitrogen source (gmiddotL-1)
Carbon Source
CSo (gmiddotL-1)
CSA (gmiddotL-1)
YGLSA
(gmiddotg-1) YAASA
(gmiddotg-1) YAAFA
(gmiddotg-1)
DCW
(gmiddotg-1)
CCTCC
M2012
036
CSL(25) amp
vitamins
mixture
Glucose 100 881 088 - - -
Jiang et al (2014)
CGMCC
1716
YE(10) amp
CSL(5)
mixture
Sucrose 100 55 069 11 09 3
Chen et al (2010)
NJ113 YE(10) amp
CSL(5)
mixture
Glucose 50 42 084 - - -
Urbance et al
(2004)
130Z YE(6) amp
CSL (10)
mixture
Glucose 40 339 087 - - -
Urbance et al
(2003)
130Z YE(6) amp
CSL(10)
mixture
Glucose
20 174 087 - - -
copycopy UUnniivveerrssiittyy ooff PPrreettoorriiaa
26
Study Model Nitrogen source (gmiddotL-1)
Carbon Source
CSo (gmiddotL-1)
CSA (gmiddotL-1)
YGLSA
(gmiddotg-1) YAASA
(gmiddotg-1) YAAFA
(gmiddotg-1)
DCW
(gmiddotg-1)
Shen et al (2015) GXAS1
37
YE(12) Sugarcane
molasses
70 546 078 75 5 38
CSL(206) Sugarcane
molasses
70 479 068 76 573 3
Xi et al (2013)
NJ113 YE(10) amp
CSL(75)
mixture
Glucose 30 171 057 372 - 37
CSL (15) Glucose 30 151 050 458 - 31
CSL (15) amp
heme (0001)
mixture
Glucose 30 217 072 493 - 33
Jiang et al (2010)
NJ113 YE(15) Glucose 70 487 070 - - 45
CSL(15) Glucose 70 96 014 - - 21
copycopy UUnniivveerrssiittyy ooff PPrreettoorriiaa
27
Continuous fermentation studies
To date all continuous fermentation studies except the study done by Yan
et al (2014) used a combination YE and CSL (based on the revised SA
medium by Urbance et al 2003) as nitrogen sources None of these studies
investigated on the effect of varying the nitrogen sources type or the
concentration on SA productivity and cell growth In Table 22 it can be
seen that with a fixed combination of YE and CSL growth medium Maharaj
et al (2014) achieved the highest SA yield on glucose mass ratio and
highest SA concentration However Yan et al (2014) reported even YGLSA
and SA concentration and they used a combination of the inexpensive CSL
and defined vitamins
26 Continuous fermentation
In an economic context the need to produce large volumes of product is the
main reason for the selection of the continuous reactor mode preferably
one in which a wild strain acts as the biocatalyst to diminish mutation
problems (Villadsen et al 2011 384) Continuous systems are
advantageous also on a monetary scale because they have lower capital and
labour costs in comparison with batch production systems and since
continuous processes are time independent constant product quality is
more attainable compared with batch or fed-batch processes (Villadsen et
al 2011 384)
A unique aspect of continuous operation is the formation of biofilm which
is inevitable during pro-longed A succinogenes fermentations (Van
Heerden amp Nicol 2013 Maharaj amp Nicol 2014 Urbance et al 2003
copycopy UUnniivveerrssiittyy ooff PPrreettoorriiaa
28
Bradfield amp Nicol 2014 Brink amp Nicol 2014) Biofilms are microbial cell
layers that are embedded in self-produced exopolysacharide (EPS) which is
prone to attaching to surfaces Reactors with biofilms can be operated for
longer periods of time and are very economical because of the self-
immobilizing nature of A succinogenes which results in high volumetric
productivities (Rosche et al 2009)
It is well-known that the growth of A succinogenes is inhibited by the total
concentration of acids in the medium (Corona-Gonzaacutelez et al 2008 Lin et
al 2008 Urbance et al 2004) and therefore at a low throughput (or D)
growth of the organism will be slow since that is when high yields and acid
concentrations are found At a high D the biofilm is established at a quicker
rate but process instability is more severe (Maharaj amp Nicol 2014) The
excessive biofilm shedding at this point does not allow the system to reach
steady state easily and maintain it At a low D the effects seen with a high D
are not observed According to Bradfield amp Nicol (2014) the concentrations
produced at a low D are linked to the maintenance phase and therefore
only a small fraction of the biomass is replicating which allows the system
to reach and maintain steady state (Maharaj amp Nicol 2014)
copycopy UUnniivveerrssiittyy ooff PPrreettoorriiaa
29
Table 22 Continuous fermentation studies of A succinogenes using different nitrogen sources namely YE and CSL
Study Organism model
Nitrogen source
Dilution CSo (gmiddotL-1)
CSA (gmiddotL-1)
YGLSA
(gmiddotg-1) YAASA
(gmiddotg-1) YAAFA
(gmiddotg-1)
DCW
(gmiddotg-1)
Maharaj et al
(2014)
130Z YE(6) amp
CSL(10)
0054
071
326
141
09
080
-
-
-
-
-
-
Yan et al
(2014)
CCTCC
M2012036
CSL(25) amp
vitamins
01-04 188-
3996
084-
092
- - -
001-01 422-
636
072-
085
- - -
Van Heerden
and Nicol
(2013b)
130Z YE(6) amp
CSL(10)
049 13 071 25 077 -
Urbance et al
(2004)
130Z
YE(6) amp
CSL(10)
085
104
076
-
-
-
copycopy UUnniivveerrssiittyy ooff PPrreettoorriiaa
30
3 Materials and Methods
31 Microorganism and growth
Microorganism
In this study Actinobacillus succinogenes 130Z (DSM No 22257 or ATCC
No 55618) was used It was obtained from the German Collection of
Microorganisms and Cell Cultures (Braunschweig Germany) The culture
was stored in a cryopreservation solution at a temperature of ndash75 degC
Inoculum preparation
Inoculum was prepared by transferring 1 ml of the preserved culture to a
vial containing 15 ml of sterilized tryptone soy broth (TSB) The vial was
sealed and stored in an incubator at 37 degC with a shaker speed of 100 rpm
for a duration of 16ndash24 h The broth was later tested for contamination and
usability by performing an analysis with high-performance liquid
chromatography (HPLC) If the broth contained lactic acid or ethanol it was
considered to be contaminated and if a considerable amount of SA was
found in the broth then the culture was deemed to be viable
32 Fermentation media
All chemicals used to make the fermentation medium were obtained from
Merck KgaA (Darmstadt Germany) unless otherwise indicated The feed
medium consisted of three parts a growth medium a phosphate buffer and
copycopy UUnniivveerrssiittyy ooff PPrreettoorriiaa
31
a glucose solution The fermentation medium is based on the composition
proposed by Urbance et al (2003)
Six different growth media were used during the fermentation runs each
medium were composed of a different type andor concentration of
nitrogen sources The first medium used only yeast extract (YE) as the
nitrogen source and the last medium used only corn steep liquor (CSL) The
first run had approximately 33 gmiddotL-1of D-glucose added to the medium and
the last run had approximately 45 gmiddotL-1 of D-glucose added to the medium
Table 31 gives details of the components and the respective concentrations
used to make the feed media CO2(g) (Afrox Johannesburg South Africa)
was fed into the recycle line at 10 vvm to serve as the inorganic carbon
source
copycopy UUnniivveerrssiittyy ooff PPrreettoorriiaa
32
Table 31 Specifications of feed mediaa used during fermentations
Medium
1
Medium
2
Medium
3
Medium
4
Medium
5
Medium
6
Glucose (gmiddotL-1)
Runs 1 amp 2 33 33 33 33 33 33
Run 3 45 45 45 45 45 45
Growth (gmiddotL-1)
YE 16 10 6 3 1 0
CSL 0 6 10 13 15 16
YE ( of YE in
N2 source)d
100 625 375 1875 625 0
NaCl 1 1 1 1 1 1
MgCl2middot6H2O 02 02 02 02 02 02
CaCl22H2O 02 02 02 02 02 02
CH₃COONa 136 136 136 136 136 136
Na2Smiddot9H2O 016 016 016 016 016 016
Antifoam Ybc 1 1 1 1 1 1
Phosphate (gmiddotL-1)
K2HPO4 16 16 16 16 16 16
KH2PO4 32 32 32 32 32 32
a Based on Urbance et al (2003)
b Antifoam from Sigma-Aldrich St Louis USA
c Concentration is in mlmiddotL-1
d YE in N2 source is the of YE in the total complex nitrogen source in the medium
The concentration of the total complex nitrogen source (a combination of CSL and
powder YE) was 16 gmiddotL-1 throughout the fermentations for all runs
copycopy UUnniivveerrssiittyy ooff PPrreettoorriiaa
33
33 Bioreactor
The bioreactor pictured in Figure 31 (a amp b) was a glass cylindrical body
set between an aluminium base and head with an external recycle line to
provide agitation The working volume of the reactor (including recycle)
was 356 mL The liquid level in the reactor was maintained by using a
peristaltic pump on the product line All pumps used in the system were
peristaltic pumps A wooden stick covered in terry cloth was inserted in the
glass cylindrical body for biofilm attachment In fermentation run1 and
run2 one stick was used and in fermentation run 3 three sticks were used
CO2 flow rates were controlled using Brooks 5850S mass flow controllers
(Brooks Instrument Hungary) and the CO2 entered the reactor via an inlet
in the recycle line which was connected to a 02 μm PTFE membrane filter
(Midisart 2000 Sartorius Goumlttingen Germany) The gas exited the system
through a filter with the same specifications as mentioned earlier
connected to the foam-trap
The pH was measured using a CPS 71D-7TB21 glass combination probe
(Endress+Hauser Gerlingen Germany) held within a stainless-steel holder
connected in-line within the recycle stream Maintaining the pH at 68
required the use of a Liquiline CM442 (Endress+Hauser Gerlingen
Germany) in which an internal relay controlled the dosing of 10 M
unsterilized NaOH in an onndashoff fashion Temperature was controlled in a
similar fashion a hotplate was used to provide the heat required to
maintain the temperature at 37 degC For better control of temperature
fluctuations the hotplate was linked to the National Instrument (NI)
module The NI module is further discussed in Section 35
copycopy UUnniivveerrssiittyy ooff PPrreettoorriiaa
34
Figure 31a) Simplified schematic of bioreactor setup
No Description
1 Gas filter
2 Foam-trap 3 Medium
reservoir 1 4 Antifoam
reservoir 5 Medium
reservoir 2 6 Inoculation
septum 7 Reactor body 8 Hot plate 9 Temperature
control 10 pH probe 11 Product
reservoir 12 NaOH reservoir 13 CO2 cylinder 14 Controller 15 Recycle pump 16 Dosing pump
17 Gas flow controller
8
7
2
3
4
5
11
12
13
17
T pH
6
C
DAQ
PC
1
9 10
14
15
16
copycopy UUnniivveerrssiittyy ooff PPrreettoorriiaa
35
Figure 31b) Bioreactor setup
copycopy UUnniivveerrssiittyy ooff PPrreettoorriiaa
36
34 Fermentation procedure
The three parts of the fermentation medium (growth medium buffer and
glucose) were prepared in separate bottles and were autoclaved at 121degC
for 60 minutes To prevent unwanted reactions amongst the medium
components the three parts of the medium were only mixed once the
bottles had cooled to room temperature (approx 24 degC) The reactor
system (excluding NaOH) was also autoclaved at the same temperature and
duration as stated above
The first fermentation medium (see Table 31) was used to start up the
fermentation It had only YE as the nitrogen source This was done to form
a substantial amount of biofilm for full glucose consumption The feed
setup was then connected to the sterile reactor system with a sterile
coupling The coupling consisted of a U-connection one half of which was
fixed to the feed setup and the other half to the reactor system Each half of
the connection had a ball valve to isolate the system from the external
environment The half connections were then coupled and placed in an oil
bath at 140 degC for 20 minutes The reactor was then filled with medium and
once the temperature and pH had stabilized to 37degC and 68 respectively
10 mL of inoculum was injected into the reactor through a silicon septum
attached to the reactor head
Fermentations were started off by operating the system at batch conditions
for 17 hours and then changing to continuous operation at a low dilution
rate This allowed for cell accumulation and prevented cell washout
Addition of antifoam into the reactor was only done when deemed
necessary The recycle flow rate was kept constant at 500 mLmiddotmin-1 in all
fermentations to maintain similar shear conditions The CO2 flow rate was
copycopy UUnniivveerrssiittyy ooff PPrreettoorriiaa
37
set at a vvm of 10 as it seemed sufficient to maintain CO2 saturation in the
reactor After a few days of operation biofilm appeared on internal surface
of the bioreactor as well as the wooden stick covered in terry cloth which
was inserted into the glass cylinder as the intended surface for biofilm
attachment
Controlled variables
Dilution rates for the fermentation runs were determined using the first
fermentation medium Once biofilm had formed in the reactor after a few
days of continuous operation the dilution rate was adjusted until 95 of
initial glucose had been consumed For R3 90 was the target for glucose
consumption The dilution rate was fixed for the entire experimental run if
the above mentioned glucose consumption stayed more or less constant for
three days or more
Media change during fermentation
Similar to the feed connection to the reactor the different medium setups
were connected to the sterile reactor system with another sterile coupling
The half connections were then coupled and the U-connection was placed
in an oil bath at 140 degC for 40 minutes
35 Online monitoring
Monitoring of the process was performed in a similar fashion to that of Van
Heerden and Nicol (2013b) in which the time-averaged NaOH dosing
copycopy UUnniivveerrssiittyy ooff PPrreettoorriiaa
38
fraction was linked to a productivity factor allowing an estimated SA
concentration to be calculated in real-time A LabVIEW (NI module)
program was used to monitor and control the reactor The program was
linked to the reactor instrumentation using a cDAQ-9184 data acquisition
device (National Instruments Hungary) with voltage and current input
modules and a current output module Temperature dosing and antifoam
flowrates were controlled with the program Temperature pH gas flow
rates and the time-averaged dosing of NaOH were recorded through the
program
36 Analytical methods
HPLC analysis
High-performance liquid chromatography (HPLC) was used to determine
the concentrations of glucose SA and other organic acids Analyses were
done using an Agilent 1260 Infinity HPLC (Agilent Technologies USA)
equipped with an RI detector and a 300 mm times 78 mm Aminex HPX-87 H
ion-exchange column (Bio-Rad Laboratories USA) The mobile phase (03
mLmiddotL-1 and 11 mLmiddotL-1H2SO4) flowrate was 06 mLmiddotmin-1 and the column
temperature was 60degC
Suspended cell analysis
Once the reactor had reached a steady state the product stream was
collected in a bottle that was kept in a small bar refrigerator The product
bottle was kept cool to prevent further growth of cells and metabolic
activity and depending on the dilution rate the duration of the collection
period varied from 12 to 72 hours The collected volume was then
copycopy UUnniivveerrssiittyy ooff PPrreettoorriiaa
39
thoroughly mixed and a 12 mL sample was collected for suspended cell
analysis This was performed by splitting the 12 mL sample into 12 x 1 mL
samples and centrifuging at 4000 rpm for 2 minutes The samples were
centrifuged three times and after each centrifugation the supernatant was
poured out and the cell precipitate washed in distilled water Following the
third centrifugation the cell precipitates were transferred to an empty
glass vial that had been measured beforehand The cell precipitates were
then dried to a constant weight in an 85 degC oven
Mass balance analysis
Overall mass balances were performed to assess the accuracy of each
sample The mass balances were performed by comparing the
stoichiometric amount of glucose required to achieve the experimental
concentrations of SA AA and FA with the experimental amount of glucose
consumed
37 Steady state check
When the time-averaged dosing profile constructed by the LabVIEW
program ceased to fluctuate by a 5 standard deviation of the average
dosing flow it was assumed that the system had reached pseudo-steady
state and the product stream was sampled To further ascertain steady
state the glucose and organic acid concentrations in product samples
frequently taken over a certain period were compared and if negligible
differences were found between the sample data the system was
confirmed to be at steady state
copycopy UUnniivveerrssiittyy ooff PPrreettoorriiaa
40
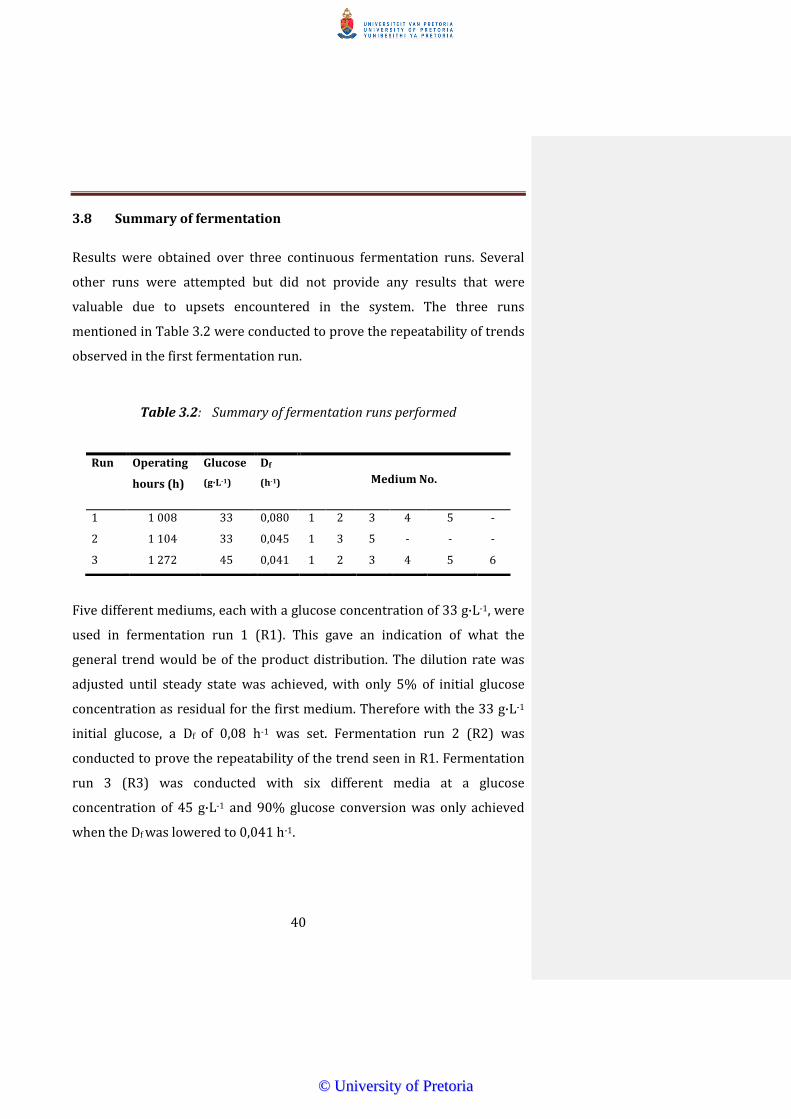
38 Summary of fermentation
Results were obtained over three continuous fermentation runs Several
other runs were attempted but did not provide any results that were
valuable due to upsets encountered in the system The three runs
mentioned in Table 32 were conducted to prove the repeatability of trends
observed in the first fermentation run
Table 32 Summary of fermentation runs performed
Five different mediums each with a glucose concentration of 33 gmiddotL-1 were
used in fermentation run 1 (R1) This gave an indication of what the
general trend would be of the product distribution The dilution rate was
adjusted until steady state was achieved with only 5 of initial glucose
concentration as residual for the first medium Therefore with the 33 gmiddotL-1
initial glucose a Df of 008 h-1 was set Fermentation run 2 (R2) was
conducted to prove the repeatability of the trend seen in R1 Fermentation
run 3 (R3) was conducted with six different media at a glucose
concentration of 45 gmiddotL-1 and 90 glucose conversion was only achieved
when the Df was lowered to 0041 h-1
Run Operating
hours (h)
Glucose
(gmiddotL-1)
Df
(h-1) Medium No
1 1 008 33 0080 1 2 3 4 5 -
2 1 104 33 0045 1 3 5 - - -
3 1 272 45 0041 1 2 3 4 5 6
copycopy UUnniivveerrssiittyy ooff PPrreettoorriiaa
41
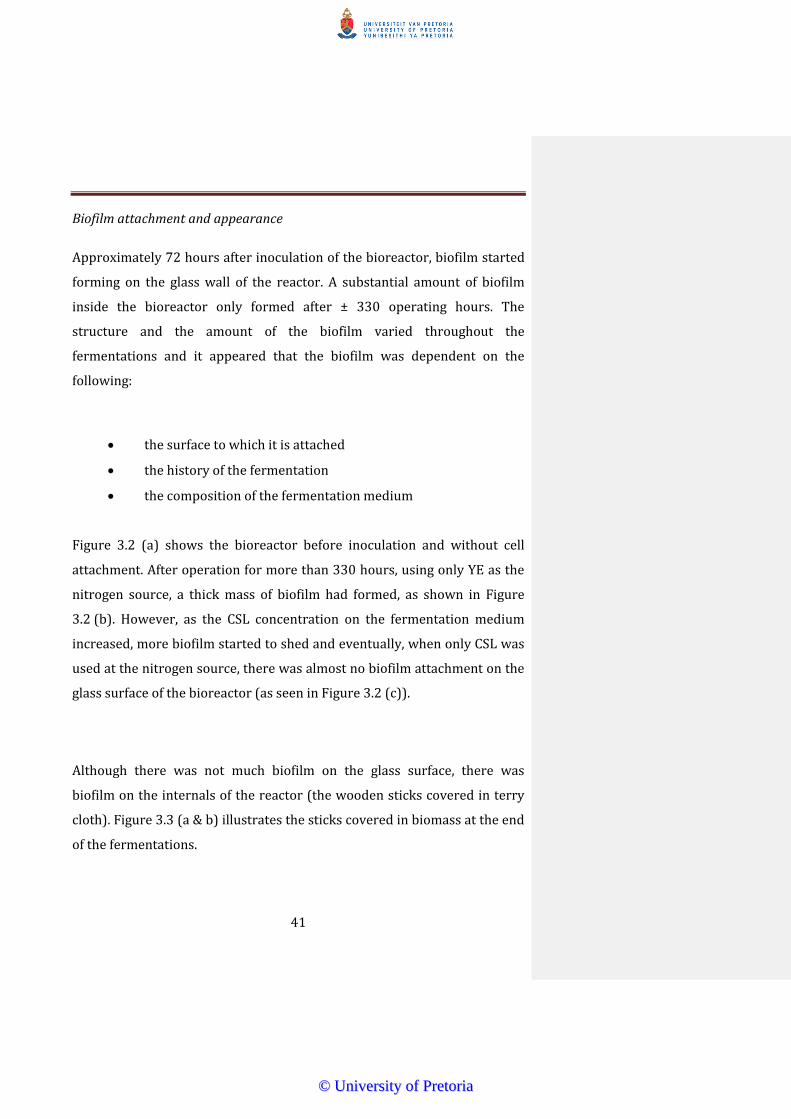
Biofilm attachment and appearance
Approximately 72 hours after inoculation of the bioreactor biofilm started
forming on the glass wall of the reactor A substantial amount of biofilm
inside the bioreactor only formed after plusmn 330 operating hours The
structure and the amount of the biofilm varied throughout the
fermentations and it appeared that the biofilm was dependent on the
following
the surface to which it is attached
the history of the fermentation
the composition of the fermentation medium
Figure 32 (a) shows the bioreactor before inoculation and without cell
attachment After operation for more than 330 hours using only YE as the
nitrogen source a thick mass of biofilm had formed as shown in Figure
32 (b) However as the CSL concentration on the fermentation medium
increased more biofilm started to shed and eventually when only CSL was
used at the nitrogen source there was almost no biofilm attachment on the
glass surface of the bioreactor (as seen in Figure 32 (c))
Although there was not much biofilm on the glass surface there was
biofilm on the internals of the reactor (the wooden sticks covered in terry
cloth) Figure 33 (a amp b) illustrates the sticks covered in biomass at the end
of the fermentations
copycopy UUnniivveerrssiittyy ooff PPrreettoorriiaa
42
Figure 32 a) Bioreactor before inoculation b) Biofilm growth using
only YE as nitrogen source c) Bioreactor with only CSL as nitrogen source
(a) (b) (c)
copycopy UUnniivveerrssiittyy ooff PPrreettoorriiaa
43
Figure 33 a) Internal support for biofilm attachment (at the end of
fermentation run 1) b)Internal supports for biofilm attachment (at the end
of fermentation run 3)
(a) (b)
copycopy UUnniivveerrssiittyy ooff PPrreettoorriiaa
44
4 Results and Discussion
41 Experimental strategy for different runs
The objective of R1 (fermentation run 1) was to find steady state data that
could be analysed to understand the influence of YE and CSL on the growth
and productivity of A succinogenes As seen in Table 31 the media used in
the experiments differed from each other regarding the concentrations of
CSL and YE but the total complex nitrogen source concentration in the
media remained constant The intended experimental plan was to report
the steady state product concentrations as the concentration of YE in the
growth medium varied (ie as the YE concentration decreased and the CSL
concentration increased) R2 (fermentation run 2) which followed the
same procedure as R1 was conducted to prove that the data found in R1
was repeatable R3 (fermentation run 3) was an attempt to achieve high SA
concentrations following the same experimental plan as R1 except that R3
used a high initial glucose feed concentration and had additional internal
support to increase the surface area available for biofilm attachments
All fermentations began with a growth medium that contained only YE as
the nitrogen source (100 YE) and once a healthy and stable biofilm had
formed the growth media were changed according to the procedure
explained in Section 34 Fermentation procedure
Initially R1 had a high biomass content and activity (when only YE was in
the fermentation medium) and as the YE content in the growth medium
decreased the biomass activity decreased R2 was effectively a repetition
of R1 but due to the low initial biomass activity the dilution rate was
adjusted to have approx 95 glucose conversion (when the growth
copycopy UUnniivveerrssiittyy ooff PPrreettoorriiaa
45
medium had only YE as the nitrogen source) Despite the increased surface
area for biofilm attachment the biomass in R3 struggled to achieve the
same activity as R1 Initially the SA concentration was slightly higher but
eventually the results of R3 coincided with those of R2 when CSL was
introduced into the growth medium The dilution rate for R3 could have
been lowered further to reach higher product concentrations but it was
decided not to do this due to time constraints for achieving steady state
Table 41 gives the steady state results for all three runs
copycopy UUnniivveerrssiittyy ooff PPrreettoorriiaa
46
Table 41 Steady state data for the three continuous fermentation runs
Dilution
(h-1)
SA
(gmiddotL-1) AA (gmiddotL-1) FA (gmiddotL-1)
PYR
(gmiddotL-1)
Δ GLC
(gmiddotL-1)
YE ( in nitrogen
source)
Black box mass
balance ()
Average black box
mass balance ()
Average black box
mass balance ()
with DCW
Fermentation run 1
008 1731 814 608 048 3041 10000 8529
008 1685 816 619 050 3067 10000 8347
009 1671 800 612 051 3059 10000 8269 8382
008 1860 702 449 066 2916 6250 8777
008 1872 667 435 079 2917 6250 8716 8747 9581
008 1764 492 263 045 2619 3750 8343
008 1792 494 251 033 2596 3750 8473
008 1778 498 259 031 2596 3750 8441 8419
008 1691 359 183 178 2152 1875 9646
008 1696 349 168 175 2223 1875 9278
008 1669 353 170 172 2107 1875 9687 9537
008 1565 239 064 224 1855 625 9935
008 1411 192 048 290 1808 625 9459
008 1328 176 056 293 1822 625 8921 9438
copycopy UUnniivveerrssiittyy ooff PPrreettoorriiaa
47
Dilution
(h-1)
SA
(gmiddotL-1) AA (gmiddotL-1) FA (gmiddotL-1)
PYR
(gmiddotL-1)
Δ GLC
(gmiddotL-1)
YE ( in nitrogen
source)
Black box mass
balance ()
Average black box
mass balance ()
Average black box
mass balance ()
with DCW
Fermentation Run 2
004 1780 852 569 051 2954 10000 9023
004 1853 878 569 044 2972 10000 9256
004 1874 897 585 040 3004 10000 9287 9189
004 1796 564 248 042 2489 3750 9154
004 1759 582 263 035 2354 3750 9616
004 1760 570 228 038 2561 3750 8760 9177
004 1175 290 071 201 1447 625 10575
004 1106 289 074 199 1455 625 10081
004 1080 283 071 202 1390 625 10357 10338
Fermentation Run 3
004 2253 1022 493 026 3695 10000 8686
004 2257 1009 499 023 3673 10000 8711
004 2205 976 477 025 3656 10000 8522 8640 9138
004 1927 787 298 000 3043 6250 8538
004 1970 803 306 007 3221 6250 8266
004 1991 820 335 005 3242 6250 8344 8383 9213
004 1785 604 128 063 2998 3750 8583
copycopy UUnniivveerrssiittyy ooff PPrreettoorriiaa
48
Dilution
(h-1)
SA
(gmiddotL-1) AA (gmiddotL-1) FA (gmiddotL-1)
PYR
(gmiddotL-1)
Δ GLC
(gmiddotL-1)
YE ( in nitrogen
source)
Black box mass
balance ()
Average black box
mass balance ()
Average black box
mass balance ()
with DCW
004 1879 615 131 069 3092 3750 8572 8568 8974
004 1635 493 028 067 2635 1875 8718
004 1628 486 022 077 2605 1875 8644
004 1578 455 036 080 2664 1875 8431 8598 9919
004 1159 295 000 082 1489 625 9255
004 1110 286 000 098 1955 625 8545
004 1104 275 000 099 1419 625 9630
004 1044 259 000 114 1433 625 8908 9085 11240
004 817 137 000 177 1582 000 6186
004 709 086 000 237 1425 000 8691
004 725 072 000 249 1457 000 6140
004 712 080 000 273 1271 000 7161 7045 7234
copycopy UUnniivveerrssiittyy ooff PPrreettoorriiaa
49
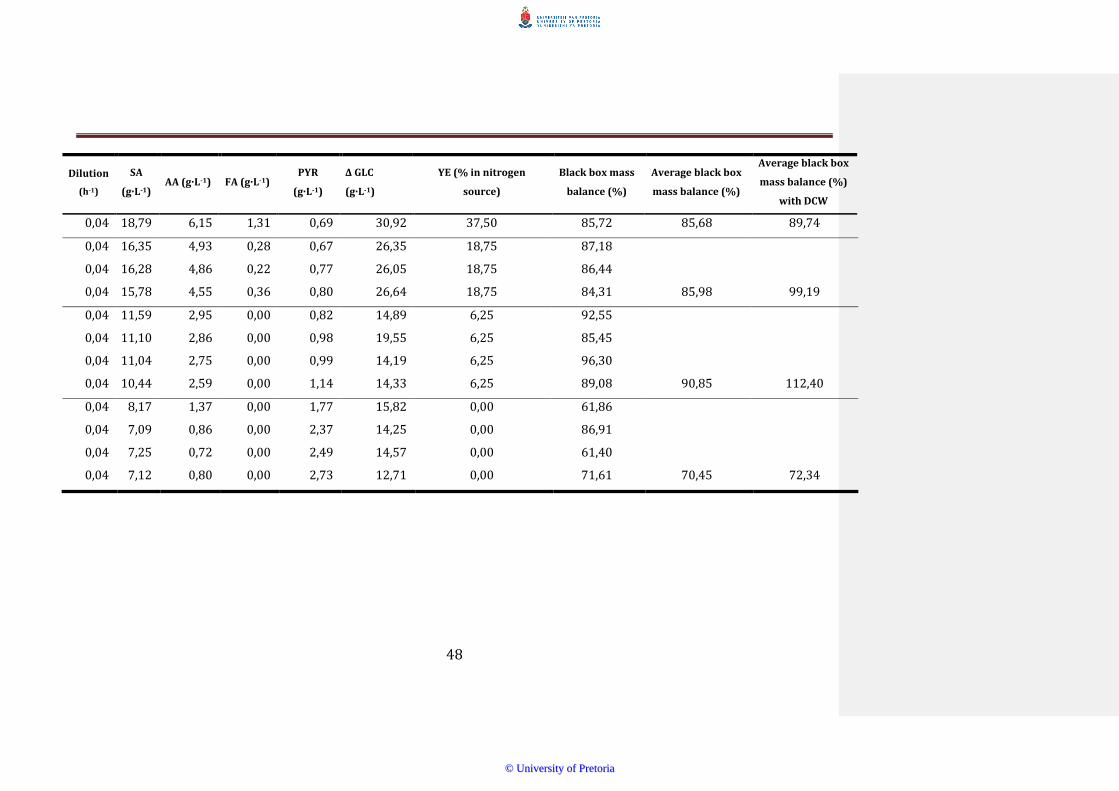
Mass balances or redox balances were performed on all the samples and
the average closures of the steady state samples are shown in Table 41
Mass balance closure did increase as the YE content decreased In R3
DCWs were taken to see if the mass balance closure would reach 100
Including the DCWs significantly improved the mass balance but did not
close it Anything above 90 was considered a proper closure and most
figures that were below 100 may indicate unknown metabolites or non-
perfect analysis of acids and sugars
42 Productivity analysis
Figure 41 shows the average concentrations of SA AA and FA in the
product streams at steady state for all fermentation runs For a clear
comparison of the metabolite concentrations of all the fermentation runs
the results were put into a single plot despite the differences in dilution
rate and glucose feed concentration The reasons for the difference in
dilution rates were explained in Section 41
copycopy UUnniivveerrssiittyy ooff PPrreettoorriiaa
50
R1
R2
R3
SA
FA
AA
Figure 41
(See Table 31)
Figure 42 depicts how SA productivity and the glucose consumption rate
changed as the YE concentration decreased
0
2
4
6
8
10
12
14
16
18
20
22
24
0 10 20 30 40 50 60 70 80 90 100
Co
nce
ntr
atio
n(g
middotL-1
)
YE in Nitrogen Source
Figure 41 Product concentration profiles for SA AA and FA of
A succinogenes as the YE in the growth media varied
The total nitrogen source (combination of YE and CSL) concentration in the
growth medium stayed constant at 16 gmiddotL-1only the concentrations of YE (powder
form) and CSL (liquid form) varied
Commented [B1] In order for the very long captions for Figures 41 to 46 NOT to show in the automatic List of Figures Ive converted the detailed descriptions to normal text
copycopy UUnniivveerrssiittyy ooff PPrreettoorriiaa
51
R1
R2
R3
Productivity SA
Glucose
consumption rate
Figure 42SA productivity profile and glucose consumption rat
A succinogenes as the YE in the growth media varied
(See Table 31)
SA concentration decreased as the concentration of YE was reduced in the
medium When only YE was used as the nitrogen source which is an ideal
ingredient for A succinogenes growth and SA productivity the highest SA
concentration for R2 and R3 was achieved For R1 the SA concentration
was at its highest when the 625 of YE medium was used Despite the
difference in glucose concentration SA concentrations for R1 R2 and R3
0
02
04
06
08
1
12
14
16
18
2
22
24
26
28
3
0
02
04
06
08
1
12
14
16
0 10 20 30 40 50 60 70 80 90 100
Glu
cose
co
nsu
mp
tio
n r
ate
(gL
hr)
Pro
du
ctiv
ity
SA
(gmiddotL
-1middoth
r-1))
of YE in Nitrogen source
Figure 42 SA productivity profile and glucose consumption rate
profiles of A succinogenes as the YE in the growth media varied
The total nitrogen source (combination of YE and CSL) concentration in the
growth medium stayed constant at 16 gmiddotL-1 only the concentrations of YE
(powder form) and CSL(liquid form) varied
copycopy UUnniivveerrssiittyy ooff PPrreettoorriiaa
52
were similar when CSL was added to the medium R3 started with a high SA
concentration as expected but then quickly dropped and displayed the
trend observed in R1 and R2 AA and FA both decreased as the YE content
in the medium decreased for all runs The concentrations for both FA and
AA more or less matched in all runs irrespective of the dilution rate and
the glucose feed concentration When only CSL was used as the nitrogen
source in the growth medium in R3 no FA was produced
The SA productivity trend shown in Figure 42 is the same as the SA
concentration profile The highest SA productivity obtained in this study
was 158 gmiddotL-1middoth-1 when a 625 YE medium was used as the nitrogen
source From Figure 42 it should be clear that the productivities of R1
were almost twice as high as the productivities of R2 The same can be said
for the glucose consumption rates for R1 and R2 This is because the
dilution rate of R1 was also twice as much as the dilution rate of R2
According to Maharaj et al (2014) a decrease in dilution should lead to an
increase in product concentrations and yields R1 and R2 do not follow that
trend Instead their product concentrations profile matched A possible
reason for the inconsistency in the trends could be that there was less
biofilm activity in R2 for an unknown reason compared with the biofilm
activity in R1 resulting in a product concentrations profile match instead of
higher product concentrations in R2 compared with the profile for R1
43 Analysis of product distribution
Metabolite concentrations were used to determine and study the product
distributions YAASA YAAFA and YGLSA of the three fermentations
copycopy UUnniivveerrssiittyy ooff PPrreettoorriiaa
53
In Section 24 the theoretical metabolic flux limitations were discussed and
it was noted that in the absence of biomass formation the maximum
theoretical values for YAASA and YGLSA should be 393gmiddotg-1 and 088 gmiddotg-1
respectively These yields would only be achieved if no FA was produced
ie if only PDH was active However if the PFL route was active and all of
the FA was converted to CO2 and NADH by FDH then the maximum
theoretical yields mentioned earlier could be still achieved If biomass is
produced then a portion of the glucose in the growth medium would be
directed to the anabolic pathway which would influence the carbon
distribution resulting in maximum yields less than those given above
It is illustrated in Figure 43 that YAASA should vary between 197 gmiddotgminus1 (for
YAAFA = 077 gmiddotgminus1) and 393 gmiddotg-1 (for YAAFA = 0 gmiddotgminus1) Using only YE as the
nitrogen source the experimental yields for all runs matched the maximum
theoretical yields that were obtained when only the PFL enzyme was
active As the nitrogen source content varied (ie CSL concentration
increased and YE concentration decreased) YAASA increased and YAAFA
decreased thus indicating a shift in the metabolic flux distribution YAASA for
R2 and R3 were similar throughout the runs so was YAAFA However when
the YE concentration in the nitrogen source was 1875 for R1 and R3
YAASA exceeded the maximum theoretical yield while YAAFA was still in the
range of 0 gmiddotg-1 to 077 gmiddotg-1 The highest YAASA achieved in this study was 83
gmiddotg-1 and the lowest YAAFA was 0 gmiddotg-1 as seen in Figure 43 these yields
were obtained in R3 when only CSL was used as the nitrogen source
Certain batch studies in A succinogenes also achieved a YAASA that exceeded
the maximum theoretical yield (see Section 26 Table 21) but those
studies used YE as the nitrogen source whereas in this study it was
copycopy UUnniivveerrssiittyy ooff PPrreettoorriiaa
54
achieved using only CSL Xi et al (2013) was the only study (batch
fermentation) mentioned in Table 21 that used only CSL as the nitrogen
source with glucose as the carbon substrate and exceeded the maximum
theoretical YAASA They attained a YAASA of 458 gmiddotg-1
copycopy UUnniivveerrssiittyy ooff PPrreettoorriiaa
55
R1
R2
R3
SAAA
FAAA
Figure 43 Experimental yields plotted with the maximum theoretical yields
profile of A succinogenes as YE in medium changes
Considering the flux at the pyruvate node YAAFA decreased and was
approaching zero as the CSL concentration in the nitrogen source
increased as seen in Figure 43 This could be an outcome of an increase in
either PDH or FDH activity or a decrease in activity for both PDH and PFL
resulting in an increased concentration of pyruvate in the product stream
Figure 44 illustrates how the pyruvate concentration increased as the CSL
concentration in the growth medium increased
0
05
1
15
2
25
3
35
4
45
5
55
6
65
7
75
8
85
9
0 10 20 30 40 50 60 70 80 90 100
Mas
s ra
tio
(g
g-1)
YE in Nitrogen Source
SAAA max (PFL)
FAAA max (PFL)
SAAA max (PDH)
FAAA max (PDH)
Figure 43 Experimental yields plotted with the maximum theoretical
yields profile of A succinogenes as YE in medium changes
The total nitrogen source (combination of YE and CSL) concentration in the
growth medium stayed constant at 16 gmiddotL-1 only the concentrations of YE
(powder form) and CSL(liquid form) varied
copycopy UUnniivveerrssiittyy ooff PPrreettoorriiaa
56
(See Table 31)
According to the redox balance it is expected that YAASA would increase as
YAAFA decreased and in this study the same development was observed
This could be linked to the increasing CSL concentration in the nitrogen
source in this study Bradfield amp Nicol (2014) suggested that there could be
an additional reducing power that produced the yields that were achieved
Using carbon and redox balances they noticed in their study that the
experimental YAASA values exceeded the predicted values suggesting that an
increase in PDH or FDH activity was not the only contribution to the
increase in YAASA and that additional reducing power was present The same
0
02
04
06
08
1
12
14
16
18
2
22
24
26
28
3
0 10 20 30 40 50 60 70 80 90 100
Co
nce
ntr
atio
n(g
L)
YE in Nitrogen Source
PYR R1
PYR R2
PYR R3
Figure 44 Pyruvate concentration profile of A succinogenes as YE in
medium changes
The total nitrogen source (combination of YE and CSL) concentration in the
growth medium stayed constant at 16 gmiddotL-1 only the concentrations of YE
(powder form) and CSL(liquid form) varied
copycopy UUnniivveerrssiittyy ooff PPrreettoorriiaa
57
explanation can be applied to this study as seen in Figure 43 The increase
in the YAASA is influenced by the decrease in the YAAFA ratio although it is not
sufficient to reach the expected ratios (according to the redox balance)
(See Table 31)
Figure 45 illustrates the NADH consumed per NADH produced for all
fermentation runs The NADH consumed (mol NADHmiddotcmol glucose-1) was
calculated as follow
09
1
11
12
13
14
15
16
17
18
19
2
0 10 20 30 40 50 60 70 80 90 100
NA
DH
Co
nsu
med
NA
DH
Pro
du
ced
of YE in Nitrogen source
NADH R1
NADH R2
NADH R3
Figure 45 NADH ratio consumed during production of A succinogenes
as YE in medium changes
The total nitrogen source (combination of YE and CSL) concentration in the
growth medium stayed constant at 16 gmiddotL-1 only the concentrations of YE
(powder form) and CSL(liquid form) varied
copycopy UUnniivveerrssiittyy ooff PPrreettoorriiaa
58
2119862119878119860119872119872119878119860
6∆119866119871119862119872119872119866119871119862
frasl (41)
Using Figure 2 Equation 41 was generated The only pathway that
consumed NADH was the path that converted PEP to SA where 2 molecules
of NADH were consumed to produce 1 molecule of SA
The NADH (mol NADHmiddotcmol glucose-1) produced was calculated as follow
(119862119878119860
119872119872119878119860+
2119862119860119860
119872119872119860119860minus
119862119865119860
119872119872119865119860)
6∆119866119871119862
119872119872119866119871119862
frasl (42)
The path from glucose to PEP produced 2 molecules of NADH per one
glucose molecule consumed and from PYR to AA 1 molecule of NADH per
one AA molecule was produced All the inputs for these equations were the
product concentrations obtained from the experimental runs
In Figure 45 it is noted that for all the fermentation runs the ratio of NADH
consumed to NADH produced increased as the concentration of YE in the
growth medium increased Nevertheless there is a clear dissimilarity
between the three runs In R3 the NADH production was higher than the
consumption for all growth media except when only CSL was used as the
nitrogen source R2 and R3 in comparison with R1 did not display a
massive imbalance in the NADH ratio and R1 was the only run where NADH
consumed over produced ratio consistently increased significantly as the
YE content in the growth medium increased It appears that the additional
NADH generation capability of R1 was not fully present in R2 and R3 and
possibly the strains used in R2 and R3 had altered production
copycopy UUnniivveerrssiittyy ooff PPrreettoorriiaa
59
characteristics compared with the original strain Nevertheless the R1
results coincide with the observation of both Bradfield amp Nicol (2014) and
Brink amp Nicol (2014) which was that there was an ldquoexcessrdquo of NADH that
was consumed during the maintenance phasenon-growth phase resulting
in a high YAASA
copycopy UUnniivveerrssiittyy ooff PPrreettoorriiaa
60
(See Table 31)
Figure 46 illustrates the yield of SA on glucose for R1 This graph shows
how the flux from glucose to SA increases as the CSL concentration in the
growth medium increases The trend observed in Figure 46 can be linked
to the ldquoexcessrdquo NADH that favours the production of SA Xi et al (2013)
observed that using only CSL as the nitrogen source provided high
selectivity towards SA (458 gmiddotgminus1) in comparison with other by-products
On the other hand CSL with heme provided a high glucose-to-SA flux
(072 gmiddotgminus1) and a much higher YAASA (493 gmiddotgminus1) A similar observation was
04
043
046
049
052
055
058
061
064
067
07
073
076
079
082
085
088
0 10 20 30 40 50 60 70 80 90 100
Mas
s ra
tio
(g
g-1)
YE in Nitrogen Source
SAGL R1
SAGL max(PFL)SAGL max(PDH)
Figure 46 Mass ratio of succinic acid over glucose profile of
A succinogenes as YE in medium changes
The total nitrogen source (combination of YE and CSL) concentration in the
growth medium stayed constant at 16 gmiddotL-1 only the concentrations of YE
(powder form) and CSL(liquid form) varied
copycopy UUnniivveerrssiittyy ooff PPrreettoorriiaa
61
documented by Yan et al (2013) Xi et al (2012) tried to explain this
observation in their study by stating that CSL contained cofactor biotin
which promoted the high SA selectivity
It is reasonable to postulate that there is an ingredient in CSL that may
trigger or enhance the activity of an additional metabolic pathway known
as the pentose phosphate pathway (PPP) to produce high carbon flux to SA
and high SA selectivity The idea of PPP as the source of the additional
reducing power stems from the findings of Bradfield and Nicol (2014)
Their analysis has shown that if the NADPH generated in the PPP cycle is
converted to NADH in order to supply redox to the SA pathway then high
SA selectivity can be achieved A succinogenes has the transhydrogenase
that allows PPP to be active and as mentioned earlier the presence or
absence of one or more ingredients in CSL may allow this enzyme to be
active consequently activating the PPP as well
Xi et al (2012) did mention biotin as the culprit for the high SA selectivity
They investigated the influence of biotin on A succinogenes growth and SA
productivity by varying the biotin concentration in a chemically defined
medium There was no SA production and cell growth was severely
inhibited when biotin was absent from the growth medium They reported
a high SA yield in their study but their data for AA concentration YGLAA and
YAASA were inconsistent with their observed product concentrations The
following example is extracted from their results In the experiment using
8 mg L-1biotin the glucose consumed was 300 g L-1 CSA = 194 g L-1 CAA =
32 g L-1 YGLAA = 0203 g g-1 and YAASA = 61 g g-1 However the YGLAA should
have been 0107 gmiddotg-1 if CAA was reported correctly but if the value for YAASA
was used as the value of CAA then the reported YGLAA would be correct
copycopy UUnniivveerrssiittyy ooff PPrreettoorriiaa
62
Nevertheless because of the inconsistency of the data it cannot be
concluded that biotin did play a role in gaining a high SA yield
Either the presence or absence of a component in a growth medium can
influence the enzymatic activity of a pathway and this concept should be
used to postulate explanations for the results obtained in this study
A breakdown of the constituents of CSL and YE could help in identifying the
ingredients in CSL that may have triggered or enhanced the activity of the
PPP Since both CSL and YE are complex media and there is no definite
information on the ingredients it is hard to fully confirm the following
theory
Xiao et al (2013) did a study on the constituents of CSL and stated that any
grade of CSL has the following amino acids isoleucine asparagine
methionine lysine proline and aspartic acid YE was reported by an
industrial data sheet (Organotechniereg SAS France) to have a high
content of the following alanine isoleucine leucine methionine
phenylalanine tyrosine and valine Although there are common amino
acids shared between CSL and YE there is one amino acid YE has that is
absent from CSL namely leucine This could be a reason why CSL could be
related to the excess NADH
Leucine in Ecoli is said to repress the transhydrogenase activity which in
turn represses the PPP (Gerolimatos amp Hanson 1978) This could be true
for A succinogenes since it also has the transhydrogenase for PPP as
mentioned in Section 23 A succinogenes with only YE as the nitrogen
source produced yields that were expected according to the carbon and
redox balance It can be postulated that as the YE content reduce the
copycopy UUnniivveerrssiittyy ooff PPrreettoorriiaa
63
leucine content decreased and the activity of the transhydrogenase
increased causing additional NADH to be generated from the enhanced
PPP resulting in improved yields
copycopy UUnniivveerrssiittyy ooff PPrreettoorriiaa
64
5 Conclusions
The complex nitrogen requirements of non-growing A succinogenes
biofilms were evaluated The study restricted itself to the use of YE and CSL
as nitrogen sources The SA productivity yields and titre were the variables
assessed
The YE concentration was decreased while simultaneously increasing the
CSL concentration in the medium Although this led to a decrease in the
steady state productivity of the organism overall SA selectivity increased
The production of certain metabolites such as SA and pyruvate also
increased while FA and AA concentrations decreased in the increasing
absence of YE This led to an increase in the SA to AA mass ratio and to a
decrease in the FA to AA mass ratio When zero amounts of YE were in the
growth medium no FA was produced
Three fermentation runs were performed The highest SA concentration in
this study was 2257gmiddotL-1 when only YE was used as the nitrogen source in
the growth medium and the highest SA productivity obtained in this study
was 158 gmiddotL-1middoth-1 when a combination of YE(625) and CSL(375) was
used as the nitrogen sourceThe highest SA to AA mass ratio achieved was
83 gmiddotg-1 when only CSL was used as the nitrogen source The FA to AA
mass ratio was consistently less than 077 gmiddotg-1 approaching 0 gmiddotg-1 as the
CSL concentration in the nitrogen source increased
Lower FA to AA mass ratio values were not fully responsible for the
increase in the SA to AA mass ratio The surplus NADH required is provided
copycopy UUnniivveerrssiittyy ooff PPrreettoorriiaa
65
by the activation or enhancement of an alternative metabolic pathway ie
the pentose phosphate pathway
The observations made in this study bolster the idea of using a combination
of YE and CSL where YE is the minor component as the nitrogen source for
commercialisation of bio-based succinic acid production using
Asuccinogenes as the catalyst
copycopy UUnniivveerrssiittyy ooff PPrreettoorriiaa
66
6 References
Allied Market Research (2014) ldquoWorld bio succinic acid market ndash
Opportunities and forecasts 2013ndash2020rdquo [Online]
httpswwwalliedmarketresearchcombio-succinic-acid-market
Beauprez JJ De Mey M and Soetaert WK (2010) ldquoMicrobial succinic acid
production natural versus metabolic engineered producersrdquo Process
Biochem451103ndash1114
Bechthold I Bretz K Kabasci S Kopitzky R and Springer A (2008)
ldquoSuccinic acid a new platform chemical for biobased polymers from
renewable resourcesrdquo Chem Eng Technol 31647ndash654
BioConSepT (2013) ldquoDetermination of market potential for selected
platform chemicalsrdquo [Online] httpwwwbioconsepteuwp-
contentuploadsBioConSepT_Market-potential-for-selected-platform-
chemicals_ppt1pdf
Bozell JJ and Petersen GR (2010) ldquoTechnology development for the
production of biobased products from biorefinery carbohydrates ndash the US
Department of Energyrsquos ldquoTop 10rdquorevisitedrdquo Green Chem 12539ndash554
Bradfield MFA and Nicol W (2014) ldquoContinuous succinic acid production
by Actinobacillus succinogenes in a biofilm reactor steady-state metabolic
flux variationrdquo Biochem Eng J 851ndash7
copycopy UUnniivveerrssiittyy ooff PPrreettoorriiaa
67
Brink HG and Nicol W (2014) ldquoSuccinic acid production with Actinobacillus
succinogenes Rate and yield analysis of chemostat and biofilm culturesrdquo
Microb Cell Fact 13111-122
Chen K Jiang M Wei P Yao J and Wu H (2010)rdquoSuccinic acid production
from acid hydrolysate of corn fiber by Actinobacillus succinogenesrdquo Appl
Biochem Biotechnol 160477ndash485
Cok B Tsiropoulos I Roes AL and Patel MK (2014) ldquoSuccinic acid
production derived from carbohydrates An energy and greenhouse gas
assessment of a platform chemical toward a bio-based economyrdquo Biofuels
Bioprod Bioref 816-29
Corona-Gonzaacutelez RI Bories A Gonzaacutelez Alvarez V and Pelayo-Ortiz C
(2008) ldquoKinetic study of succinic acid production by Actinobacillus
succinogenes ZT-130rdquo Process Biochem 431047ndash1053
Davis R Tao L Tan ECD Biddy MJ Beckham GT Scarlata C Jacobson J
Cafferty K Ross J Lukas J Knorr D and Schoen P(2013) ldquoProcess Design
and Economics for the Conversion of Lignocellulosic Biomass to
Hydrocarbons Dilute-Acid and Enzymatic Deconstruction of Biomass to
Sugars and Biological Conversion of Sugars to Hydrocarbonsrdquo NREL Report
No TP-5100-60223 [Online]
httpwwwnrelgovdocsfy14osti60223pdf
Gerolimatos B and Hanson RL (1978) ldquoRepression of Escherichia coli
pyridine nucleotide transhydrogenase by leucinerdquo J Bacteriol 134(2)394-
400
copycopy UUnniivveerrssiittyy ooff PPrreettoorriiaa
68
Grand-View-Research (2015) ldquoBio-Succinic Acid Market Analysis by
Application (BDO Polyester Polyols PBSPBST Plasticizers Alkyd Resins)
and Segment Forecasts to 2020ldquo [Online]
httpwwwgrandviewresearchcomindustry-analysisbio-succinic-acid-
market ISBN Code 978-1-68038-085-9
Guettler M Rumler D and Jain M (1999) ldquoActinobacillus succinogenes sp
nov a novel succinic-acid-producing strain from the bovine rumenrdquo Int J
Syst Bacteriol 49207ndash216
Gunnarsson IB Karakashev D and Angelidaki I (2014) ldquoSuccinic acid
production by fermentation of Jerusalem artichoke tuberhydrolysate with
Actinobacillus succinogenes 130Zrdquo Ind Crops-Prod 62125ndash129
ICIS (2012)rdquoChemical industry awaits for bio-succinic acid potentialrdquo
[Online]
httpwwwiciscomArticles201201309527521chemical+industry+
awaits+for+biosuccinic+acid+potentialhtml
Jiang M Chen K Liu Z Wei P Ying H and Chang H (2010) ldquoSuccinic acid
production by Actinobacillus succinogenes using spent Brewers yeast
hydrolysate as a nitrogen sourcerdquo Appl Biochem Biotechnol 160 244ndash
254
Jiang M Dai W Xi Y Wu M Kong X Ma J Min Zhang M Chen K and Wei
P (2014) ldquoSuccinic acid production from sucrose by Actinobacillus
succinogenes NJ113rdquo BioresourTechnol 153327ndash332
copycopy UUnniivveerrssiittyy ooff PPrreettoorriiaa
69
Kaneuchi C Seki M and Komagata K (1988) ldquoProduction of succinic acid
from citric acid and related acids by Lactobacillus strainsrdquo Appl Environ
Microbiol 543053ndash3056
Kasprow RP Lange AJ and Kirwan DJ (1998)ldquoCorrelation of fermentation
yield with yeast extract composition as characterized by near-infrared
spectroscopyrdquo Biotechnol Prog 14318minus325
Kwon S Lee PC Lee EG Chang YK and Chang N (2000) ldquoProduction of
lactic acid by Lactobacillus rhamnosus with Vitamin-supplemented soybean
hydrolysaterdquo Enzyme Microb Technol 26209-215
Lee PC Lee WG Kwon S Lee SY and Chang HN (2000) ldquoBatch and
continuous cultivation of Anaerobiospirillum succiniciproducens for the
production of succinic acid from wheyrdquo Appl Microbiol Biotechnol 5423ndash
27
Lee PC Lee SY Hong SH and Chang HN (2002) ldquoIsolation and
characterization of a new succinic acid-producing bacterium Mannheimia
succiniciproducens MBEL55E from bovine rumenrdquo Appl Microbiol
Biotechnol 58(5)663ndash668
Lin H Bennett GN and San KY (2005) ldquoFed-batch culture of a
metabolically engineered Escherichia coli strain designed for high-level
succinate production and yield under aerobic conditions rdquoBiotechnol
Bioeng 90775ndash779
copycopy UUnniivveerrssiittyy ooff PPrreettoorriiaa
70
Lin SKC Du C Koutinas A Wang R amp Webb C (2008) ldquoSubstrate and
product inhibition kinetics in succinic acid production by Actinobacillus
succinogenesrdquo Biochem Eng J 41(2)128ndash135
Liu YP Zheng P Sun ZH Ni Y Dong JJ and Zhu LL (2008) ldquoEconomical
succinic acid production from cane molasses by Actinobacillus
succinogenesrdquo Bioresour Technol 991736ndash1742
Maharaj K Bradfield MFA and Nicol W (2014) ldquoSuccinic acid-producing
biofilms of Actinobacillus succinogenes Reproducibility stability and
productivityrdquo Appl Microbiol Biotechnol 98(17)7379ndash7386
McKinlay JB Zeikus JG amp Vieille C (2005) ldquoInsights into Actinobacillus
succinogenes fermentative metabolism in a chemically defined growth
mediumrdquo Appl Environ Microbiol 71(11) 6651ndash6656
McKinlay JB Vieille C and Zeikus JG (2007) ldquoProspects for a bio-based
succinate industryrdquo Appl Microbiol Biotechnol 76727ndash740
McKinlay JB Laivenieks M Schindler BD McKinlay A Siddaramappa S
Challacombe JF Lowry SR Clum A Lapidus AL and Burkhart KB (2010)
ldquoA genomic perspective on the potential of Actinobacillus succinogenes for
industrial succinate productionrdquo BMC Genomics 11 (1) 680
Nghiem NP Davison BH Suttle BE and Richardson GR (1997)
ldquoProduction of succinic acid by Anaerobiospirillum succiniciproducensrdquo Appl
Biochem Biotechnol 63ndash65 565ndash576
copycopy UUnniivveerrssiittyy ooff PPrreettoorriiaa
71
Oh I Lee H Park C Lee SY and Lee J (2008) ldquoSuccinic acid production by
continuous fermentation process using Mannheimia succiniciproducens
LPK7rdquo J Microbiol Biotechnol 18908ndash912
Organotechniereg SAS (2008) ldquoTechnical Data Sheet Yeast Extract 19512rdquo
[Online] httpwwworganotechniecomdoc_en19512pdf [accessed 22
November 2015]
Rosche B Li XZ Hauer B Schmid A and Buehler K (2009) ldquoMicrobial
biofilms A concept for industrial catalysisrdquo Trends Biotechnol 27636ndash43
DOI 101016jtibtech200908001
Ruumlhl M Le Coq D Aymerich S and Sauer U (2012) ldquo13C-flux analysis
reveals NADPH balancing transhydrogenation cycles in stationary phase of
nitrogen-starving Bacillus subtilisrdquo JBiolChem 287(33) 27959ndash27970
Shen N Qin Y Wang Q Liao S Zhu J Zhu Q Mi H Adhikari B Wei Y and
Huang R (2015) ldquoProduction of succinic acid from sugarcane molasses
supplemented with a mixture of corn steep liquor powder and peanut meal
as nitrogen sources by Actinobacillus succinogenesrdquo Appl Microbiol 60544-
551
Shuler M and Kargi F (2002) ldquoBioprocess Engineering Basic Conceptsrdquo 2nd
ed Prentice Hall New York
Song H and Lee SY (2006) ldquoProduction of succinic acid by bacterial
fermentationrdquo Enzyme MicrobTechnol 39-(3)352ndash361
copycopy UUnniivveerrssiittyy ooff PPrreettoorriiaa
72
Spector MP (2009) ldquoMetabolism central (intermediary)rdquo in M Schaechter
(Ed) Encyclopedia of Microbiology 3rd ed Academic Press Oxford 242ndash
264
Sridee W Laopaiboon L Jaisil P and Laopaiboon P (2011) ldquoThe use of
dried spent yeast as a low-cost nitrogen supplement in ethanol
fermentation from sweet sorghum juice under very high gravity
conditionsrdquo Electron JBiotechnol14(6)1-15
Transparency-Market-Research (2014) ldquoSuccinic acid market for 14-bdo
resin coatings dyes amp inks pharmaceutical polyurethane food
plasticizers cosmetics solvents amp lubricants and de-icing solutions
applications-Global industry analysis size share growth trends and
forecast 2012ndash2018rdquo [Online]
httpwwwtransparencymarketresearchcomsuccinic-acidhtml
Urbance SE Pometto AL DiSpirito A and Demirci A (2003) ldquoMedium
evaluation and plastic composite support ingredient selection for biofilm
formation and succinic acid production by Actinobacillus succinogenesrdquo
Food Biotechnol 17(1)53ndash65
Urbance SE Pometto AL DiSpirito A and Denli Y (2004) ldquoEvaluation of
succinic acid continuous and repeat-batch biofilm fermentation by
Actinobacillus succinogenes using plastic composite support bioreactorsrdquo
ApplMicrobiolBiotechnol 65 (6)664ndash70
Van der Werf MJ Guettler MV Jain MK and Zeikus JG (1997)
ldquoEnvironmental and physiological factors affecting the succinate product
copycopy UUnniivveerrssiittyy ooff PPrreettoorriiaa
73
ratio during carbohydrate fermentation by Actinobacillus sp 130Zrdquo Arch
Microbiol 167332ndash342
Van Heerden CD and Nicol W (2013a) ldquoContinuous and batch cultures of
Escherichia coli KJ134 for succinic acid fermentation Metabolic flux
distributions and production characteristicsrdquo Microb Cell Fact 12-(1) 80-
90
Van Heerden CD and Nicol W (2013b) ldquoContinuous succinic acid
fermentation by Actinobacillus succinogenesrdquo Biochem EngJ 735ndash11
Villadsen J Nielsen J amp Lideacuten G (2011) ldquoBioreaction Engineering
Principlesrdquo 3rd ed Springer US Boston MA
Werpy T and Petersen G (2004) ldquoTop value added chemicals from
biomass Vol 1 Results of screening for potential candidates from sugars
and synthesis gasrdquo National Renewable Energy Lab Golden CO US
Xi Y Chen K Xu R Zhang J Bai X Jiang M Wei P and Chen J (2012)
ldquoEffect of biotin and a similar compound on succinic acid fermentation by
Actinobacillus succinogenes in a chemically defined mediumrdquo Biochem Eng
J 6987ndash92
Xi Y Chen K Dai W Ma J Zhang M Jiang M Wei P and Ouyang PK
(2013) ldquoSuccinic acid production by Actinobacillus succinogenes NJ113
using corn steep liquor powder as nitrogen sourcerdquo Bioresour Technol
136 775ndash779
copycopy UUnniivveerrssiittyy ooff PPrreettoorriiaa
74
Xiao X Hou Y Liu Y Liu Y Zhao H Dong L Du J Wang Y Bai G and Luo
G (2013) ldquoClassification and analysis of corn steep liquor by UPLCQ-TOF
MS and HPLCrdquo Talanta 107344ndash348
Xu J and Guo B (2010) ldquoMicrobial succinic acid its polymer poly(butylene
succinate) and applicationsrdquo Plastics from Bacteria Natural Functions and
Applications Microbiology Monographs Vol 14 Springer Verlag
BerlinHeidelberg DOI 101007978-3-642-03287514
Yan Q Zheng P Dong JJ and Sun ZH (2013) ldquoA fibrous bed bioreactor to
improve the productivity of succinic acid by Actinobacillus succinogenesrdquo
JChemTechnolBiotechnol 89(11)1760-1766DOI101002jctb4257
Yan Q Zheng P Tao S and Donga J (2014) ldquoFermentation process for
continuous production of succinic acid in a fibrous bed bioreactorrdquo
Biochem Eng J 9192-98
Zeikus JG Jain MK and Elankovan P (1999) ldquoBiotechnology of succinic acid
production and markets for derived industrial productsrdquo Appl Microbiol
Biotechnol 51545ndash552
Zheng P Dong J Sun Z Ni Y and Fang L (2009) ldquoFermentative production
of succinic acid from straw hydrolysate by Actinobacillus succinogenesrdquo
Bioresour Technol 100 2425ndash2429
copycopy UUnniivveerrssiittyy ooff PPrreettoorriiaa

Continuous production of succinic acid with Actinobacillus
succinogenes biofilms Effect of complex nitrogen source
on yield and productivity
by
Uma Rajendra Prasad Vijayan
Dissertation presented in partial fulfilment of the requirements for the degree
of
Master of Engineering in Chemical Engineering
at the University of Pretoria
Faculty of Engineering the Built Environment and Information Technology
Department of Chemical Engineering
University of Pretoria
Supervisor Prof W Nicol
26 April 2016
copycopy UUnniivveerrssiittyy ooff PPrreettoorriiaa
Synopsis
Continuous fermentations were performed in an external-recycle biofilm
reactor using glucose and CO2 as carbon substrates The nitrogen source for
the auxotrophic Actinobacillus succinogenes was a combination of yeast
extract (YE) and corn steep liquor (CSL) and sometimes only YE or CSL
was used The total concentration of the complex nitrogen source in the
growth medium remained constant at 16 gmiddotL-1 although the respective
concentrations of YE and CSL were varied for all runs In this study the
concentrations of the organic acids especially succinic acid (SA) and its
productivity were profiled
The succinic acid productivity of A succinogenes decreased by 67 as the
amount of YE in the complex nitrogen source mixture decreased from
16 gmiddotL-1to 0 gmiddotL-1 Succinic acid production increased as the CSL
concentration in the nitrogen source increased and the mass ratio of
succinic acid to acetic acid exceeded the theoretical maximum limit of
393 gmiddotg-1 when only CSL was used as the nitrogen source The mass ratio
of formic acid to acetic acid was consistently within the theoretical yield
limitations (077 gmiddotgminus1) and decreased as the CSL concentration in the
nitrogen source increased
Three fermentation runs were performed The highest SA concentration in
this study was 2257 gmiddotL-1 when only YE was used as the nitrogen source in
the growth medium and the highest SA productivity obtained in this study
was 158 gmiddotL-1middoth-1 when a combination of YE and CSL was used as a nitrogen
source The highest mass ratio of SA to AA achieved was 83 gmiddotg-1 when CSL
copycopy UUnniivveerrssiittyy ooff PPrreettoorriiaa
was the sole nitrogen source The mass ratio of FA to AA was consistently
less than 077 gmiddotg-1 approaching 0 gmiddotg-1 as the CSL concentration in the
nitrogen source increased
It is assumed that surplus nicotinamide adenine dinucleotide (NADH) is
required to achieve the results obtained in this study and it is likely to be
provided by the activation or enhancement of an alternative metabolic
pathway ie the pentose phosphate pathway in the presence of CSL or the
absence of YE
Keywords A succinogenes Continuous fermentation Biofilm Corn steep
liquor Yeast extract
copycopy UUnniivveerrssiittyy ooff PPrreettoorriiaa
Acknowledgements
1 Prof Willie Nicol is thanked for his financial support towards this
research in addition to his role as an excellent supervisor
2 The financial assistance of the National Research Foundation (NRF)
towards this research is hereby acknowledged Opinions expressed and
conclusions arrived at are those of the author and are not necessarily to be
attributed to the NRF
3 Sekghetho Charles Mokwatlo is thanked for his general assistance in
experimental work
4 Michael Bradfield Andre Naudeacute and Jolandi Herselman are thanked for
their insights into the experimental procedure
copycopy UUnniivveerrssiittyy ooff PPrreettoorriiaa
Table of Contents
Synopsis iii
Acknowledgements v
List of Figures viii
List of Tables x
Nomenclature xi
1 Introduction 1
2 Literature survey 5
21 Bio-based chemicals 5
22 Succinic acid 6
221 Application of succinic acid 6
222 Succinic acid market 8
223 Bio-based SA production 9
23 Actinobacillus succinogenes 10
231 Decsription of microorganism 10
232 Metabolic pathway 11
2 4 SA yield considerations 16
25 Nitrogen source for A succinogenes 19
26 Continuous fermentation 27
3 Materials and Methods 30
31 Microorganism and growth 30
copycopy UUnniivveerrssiittyy ooff PPrreettoorriiaa
32 Fermentation media 30
33 Bioreactor 33
34 Fermentation procedure 36
35 Online monitoring 37
36 Analytical methods 38
37 Steady-state check 39
38 Summary of fermentation 40
4 Results and Discussion 44
41 Experimental strategy for different runs 44
42 Productivity analysis 49
43 Analysis of product distribution 52
5 Conclusions 64
6 References 66
copycopy UUnniivveerrssiittyy ooff PPrreettoorriiaa
List of Figures
Figure 21 Succinic acid molecule 6
Figure 22 Various chemicals and products derived from succinic acid
(Zeikus et al 1999) 7
Figure 23 Simplified metabolic network of A succinogenes (based on
McKinlay et al (2007) 14
Figure 24 Simplified metabolic network of A succinogenes (PDH
active) 17
Figure 25 Simplified metabolic network of A succinogenes (PFL active)
18
Figure 26 (a) Simplified metabolic network of A succinogenes
(oxidative TCA cycle active) (b) Simplified metabolic network of A
succinogenes (glyoxylate bypass active) 19
Figure 31a) Simplified schematic of bioreactor setup 34
Figure 31b) Bioreactor setup 35
Figure 32 a) Bioreactor before inoculation b) Biofilm growth using
only YE as nitrogen source c) Bioreactor with only CSL as nitrogen
source 42
Figure 33 a) Internal support for biofilm attachment (at the end of
fermentation run 1) b)Internal supports for biofilm attachment (at
the end of fermentation run 3) 43
Figure 41 Product concentration profiles for SA AA and FA of
A succinogenes as the YE in the growth media varied 50
Figure 42 SA productivity profile and glucose consumption rate profiles
of A succinogenes as the YE in the growth media varied 51
copycopy UUnniivveerrssiittyy ooff PPrreettoorriiaa
Figure 43 Experimental yields plotted with the maximum theoretical
yields profile of A succinogenes as YE in medium changes 55
Figure 44 Pyruvate concentration profile of A succinogenes as YE in
medium changes 56
Figure 45 NADH ratio consumed during production of A succinogenes
as YE in medium changes 57
Figure 46 Mass ratio of succinic acid over glucose profile of
A succinogenes as YE in medium changes 60
copycopy UUnniivveerrssiittyy ooff PPrreettoorriiaa
List of Tables
Table 21 Batch fermentation studies of A succinogenes using different
nitrogen sources namely YE and CSL 24
Table 22 Continuous fermentation studies of A succinogenes using
different nitrogen sources namely YE and CSL 29
Table 31 Specifications of feed mediaa used during fermentations 32
Table 32 Summary of fermentation runs performed 40
Table 41 Steady state data for the three continuous fermentation runs
46
copycopy UUnniivveerrssiittyy ooff PPrreettoorriiaa
Nomenclature
CAA concentration of acetic acid (gmiddotL-1)
CFA concentration of formic acid (gmiddotL-1)
CS0 initial glucose concentration in feed medium (gmiddotL-1)
CSA concentration of succinic acid (gmiddotL-1)
Df dilution rate based on feed (h-1)
DT total dilution rate(h-1)
MMAA molar mass of acetic acid (gmiddotgmol-1)
MMFA molar mass of formic acid (gmiddotgmol-1)
MMSA molar mass of succinic acid (gmiddotgmol-1)
PSA succinic acid productivity
R1 fermentation run 1
R2 fermentation run 2
R3 fermentation run 3
copycopy UUnniivveerrssiittyy ooff PPrreettoorriiaa
vvm volumetric flowrate of gas per reactor volume
YAASA yieldratio of succinic acid on acetic acid (gmiddotg-1)
YAAFA yieldratio of formic acid on acetic acid (gmiddotg-1)
YGLSA yieldratio of succinic acid on glucose (gmiddotg-1)
Abbreviations
AA AcA acetic acid
Ac-CoA acetyl coenzyme A
ATP adenosine triphosphate
CSL corn steep liquor
DCW dry cell weight
FA formic acid
FDH formate dehydrogenase
FDH-H formate dehydrogenase activity
copycopy UUnniivveerrssiittyy ooff PPrreettoorriiaa
FHL formate-hydrogen lyase
Fum fumarate
GLC Glu glucose
HPLC high-performance liquid chromatography
Mal malate
NADH nicotinamide adenine dinucleotide
NADPH nicotinamide adenine dinucleotide phosphate
OXA oxaloacetate
PDH pyruvate dehydrogenase
PEP phosphoenolpyruvate
PFL pyruvate-formatelyase
PPP pentose phosphate pathway
PYR Pyr pyruvate
RI refractive index
copycopy UUnniivveerrssiittyy ooff PPrreettoorriiaa
SA succinic acid
TCA tricarboxylic acid
TSB tryptone soy broth
YE yeast extract
Greek letters
ΔGLC glucose consumed (gmiddotL-1)
copycopy UUnniivveerrssiittyy ooff PPrreettoorriiaa
1
1 Introduction
Modern civilisation is highly dependent on chemical products and fuels
derived from non-renewable raw materials such as crude oil and natural
gas However the depletion of non-renewable raw materials and the
potentially negative long-term environmental impacts caused by the
processing of the raw materials is forcing industries to develop alternative
routes to produce the fuel and chemicals that are essential for current
society (Cok et al 2014)
An alternative that is fast growing in popularity is the replacement of non-
renewable raw materials such as fossil fuels with renewable biomass In
2004 the US Department of Energy (Werpy amp Peterson 2004) identified a
wide range of chemicals that could be produced from renewable biomass
and only 12 of them were listed as top platform chemicals In 2010 the list
was revised and the top 10 chemicals that had the biggest market potential
were declared (Bozell amp Peterson 2010) Succinic acid (SA) was shortlisted
as one of those top 10 chemicals (Bozell amp Peterson 2010) and its
recognition as a potential platform chemical by the US Department of
Energy resulted in opportunities for SA to replace petroleum-based
platform chemicals such as maleic anhydride and adipic acid (Zeikus Jain amp
Elankovan 1999)
At present commercial production of bio-SA is done mainly by four
companies BioAmber Reverdia Myriant and Succinity which Succinity is
the largest in terms of production capacity (Grand-View- Research 2014)
In order for fermentation processes to be economically competitive with
petrochemicals-derived products research on the biological production of
copycopy UUnniivveerrssiittyy ooff PPrreettoorriiaa
2
SA has become extensive over the years because of the need to understand
and refine the process of producing bio-SA
In the literature the choices of microbial organisms available for bio-based
SA production are very diverse although most natural production hosts
described are capnophilic microorganisms (Beauprez De Mey amp Soetaert
2010) A succinogenes stood out as one of the most favourable strains for
commercial production due to its ability to produce SA naturally at high
titres (Zeikus et al 1999) and its tolerance to high acid concentrations (Lin
et al 2008) However one major drawback of Actinobacillus succinogenes
is the auxotrophic requirement for amino acids and vitamins (McKinlay
Zeikus amp Vieille 2005) In fermentation studies usually the essential amino
acids and vitamins are provided by adding yeast extract (YE) or corn steep
liquor (CSL) to the feed medium but in an industrial setup addition of YE
would be highly unfeasible because of the estimated cost which ranges
between US$350kg and US$67kg (Kwon et al 2000 Sridee et al 2011)
For the successful commercial exploitation of A succinogenes the cost of
the fermentation feedstock and the availability of essential and beneficial
ingredients that will influence the conversion process should be taken into
account Since using only YE is not economically feasible cheaper sources
of these critical components are hence required CSL is the first ideal
candidate as its market value ranges between US$007kg and
US$0075kg (Davis et al 2013)
Most fermentation studies done on A succinogenes employ a batch mode of
operation (Beauprez et al 2010) in which final concentrations yield and
productivity are used as performance indicators To date all publications in
which the complex nitrogen source was varied have used batch
copycopy UUnniivveerrssiittyy ooff PPrreettoorriiaa
3
fermentation (Xi et al 2013 Jiang et al 2010 Shen et al 2015 Yan et al
2013) Nevertheless none of these studies distinguished between the
nitrogen requirements for growth-related and non-growth-related SA
production It is well known that the specific growth rate of A succinogenes
is severely inhibited by the accumulation of organic acids in the
fermentation broth (Corona-Gonzaacutelez et al 2008) and that the specific
growth rate approaches zero above an SA titre in the vicinity of 10-15 gmiddotL-1
(Brink amp Nicol 2014) Most batch fermentations reach a final SA
concentration well in excess of this critical SA concentration thus
indicating that a significant fraction of the SA in these studies is produced
under non-growth or maintenance conditions and that the nutrient
requirements for the non-growth production phase might be different to
those of the growth phase in all likelihood less severe
In order to study the non-growth nutrient requirements of A succinogenes
steady state would be ideal this can be achieved through a continuous
mode of operation Maharaj Bradfield and Nicol (2014) have clearly
demonstrated that prolonged steady state operation of A succinogenes
under non-growth conditions is feasible and stable The concentrations of
organic acids in the fermentation broth can be manipulated by altering the
throughput (or dilution rate) in order to induce non-growth production of
SA Another beneficial factor with continuous operations is biofilms which
are unavoidably formed in long-term continuous fermentations and can
significantly enhance productivity as observed by Van Heerden and Nicol
(2013b)
This study aims to evaluate the complex nitrogen requirements of non-
growing A succinogenes biofilms Nitrogen sources used in this study will
copycopy UUnniivveerrssiittyy ooff PPrreettoorriiaa
4
be restricted to YE and CSL since they are the most common sources of
nitrogen sources used in the literature and because of the potential
economic advantage of using CSL Initial biomass accumulation will be
achieved by using only YE for rapid growth of the micro-organism Once
non-growth production of SA commences the YE content will be reduced
and the CSL content will be increased The total complex nitrogen source
concentration in the feed will be maintained at a constant value of 16 gmiddotL-1
throughout the experiments however the percentage of YE in the total
complex nitrogen source will decrease over time Throughout the study the
change in nitrogen source will be referred to as YE in the nitrogen
source At a fixed dilution rate (at a chosen initial SA concentration) for the
whole run productivity and product distribution as a function of YE in
the nitrogen source will be assessed
copycopy UUnniivveerrssiittyy ooff PPrreettoorriiaa
5
2 Literature survey
21 Bio-based chemicals
Bio-based chemicals are platform and intermediate chemicals derived from
biomass feedstocks The US Department of Energy (DOE) identified 300
potential bio-based platform chemicals but most of the proposed
chemicals did not have sufficient market potential nor was it economical to
produce them Only 30 chemicals were considered to be relevant since they
had the potential to replace non-bio-based chemicals and out of those 30
chemicals only 12 building block chemicals were identified as being the
most important because of their potential market chemical derivatives and
synthesis pathways (Werpy amp Peterson 2004)
The importance for bio-based production of fuels and chemicals arises
from the need to move away from petroleum-based production The
depletion of non-renewable feedstocks and the strong demand by
consumers for environmentally friendly energy sources has made the
production of fuels and chemicals from biomass feedstocks to be a
sustainable alternative to the petrochemical production route Government
and industry are now interested in bio-based resources and production and
they understand that to form a sustainable global economy a bio-based
industry should substitute the current petroleum-based routes to produces
fuels and chemicals (Cok et al 2014) However to have a bio-based
economy for the development of highly efficient and cost effective bio-
refineries is essential Petrochemical production has been optimised and
refined over long period of time making it a cheaper option compared with
the relatively new bio-based production Therefore to enhance the
development of a bio-based economy it is essential that the biological
copycopy UUnniivveerrssiittyy ooff PPrreettoorriiaa
6
processes are understood refined and optimised through continuous
research and development (Cok et al 2014)
22 Succinic acid
221 Application of succinic acid
One of the top 12 bio-based platform chemicals recognized by the US DOE
was succinic acid (SA) (Werpy amp Peterson 2004 Bozell amp Peterson 2010)
See Figure 21 for the molecular structure of SA Most of the SA produced to
meet global demand is manufactured through the petroleum route ie it is
produced by the partial oxidation of butane followed by hydrogenation of
the intermediate product which is maleic anhydride However the
expensive conversion costs and non-renewability of this petroleum-based
route for producing SA has limited the SA market to low-cost bulk
application (Xu amp Guo 2010 Beauprez et al 2010)
Figure 21 Succinic acid molecule
Traditionally the application of SA has been limited mainly to four
functional regions its largest area of application is as a surfactant an
additive to a detergent and a foaming agent the second is as an ion chelator
copycopy UUnniivveerrssiittyy ooff PPrreettoorriiaa
7
for preventing corrosion and spot corrosion of metals in the electroplating
industry the third is as an acidulant which is a pH regulator and flavouring
agent in the food industry and the fourth area of application region is in
the pharmaceutical industry specifically in the production of antibiotics
amino acids and vitamins (Xu amp Guo 2010) As a platform chemical it is
also used as a precursor of many commodity or specialty chemicals as seen
in Figure 22 (Zeikus et al 1999)
Figure 22Various chemicals and products derived from succinic acid
(Zeikus et al 1999)
Nevertheless there is potential for the bulk application of SA The key to
the growth of the SA market lies in its derivatives The diamines and diols
that are derived from SA can be used as monomer units of a variety of
Figure 22 Various chemicals and products derived from succinic acid
(Zeikus et al 1999)
copycopy UUnniivveerrssiittyy ooff PPrreettoorriiaa
8
plastics such as polyesters polyamides and polyester amides (Bechthold et
al2008) Among them is the SA derivative 14-butanediol (BDO) It is a
platform chemical for tetrahydrofuran (THF) gamma-butyrolactone (GBL)
and polymers such as polybutylene terephthalate (PBT) and polyurethane
(PU) These chemicals are widely used in the production of engineering
thermoplastics and elastic fibres and because of these applications the
BDO market is expected to increase as the demand for THF and spandex for
sports apparel increase (Grand- View- Research 2014) Another derivative
of SA that is predicted to increase the SA global market is the biodegradable
polybutylene succinate (PBS) and its copolymers PBS polymers have a
range of applications as supermarket bags packaging film mulch film and
other disposable articles Owing to the steady growth of the market for
biodegradable plastic the demand for PBS is expected to increase rapidly
which in turn could grow the SA market (ICIS 2012)
222 Succinic acid market
The global SA market in 2011 was estimated to be worth US$240 million
and it is projected to reach US$836 million by 2018 (Transparency-Market-
Research 2014) due to the development of the bio-SA Consumption of
petroleum-based SA in manufacturing various other chemicals is restricted
due to unpredictability of price and carbon footprints These concerns
however are advancing the progression of biological manufacturing of SA
The major drivers for this growth will be the high cost of crude oil the rise
in carbon footprints and an interest in producing ldquogreenrdquo chemicals Newer
applications of SA as PBS BDO plasticizers and polyesters polyols will fast-
track the future growth of the bio-SA market However the higher price of
bio-SA and the lengthy extraction processes are the primary factors that
copycopy UUnniivveerrssiittyy ooff PPrreettoorriiaa
9
will restrain the market growth for the next few years although the market
is expected to grow at a significant rate over the next seven years (Allied
Market Research 2014)
At present there are numerous institutions researching the development of
SA through bio-based raw materials and there are companies that are
already manufacturing bio-SA for commercial purposes The list of major
companies involved in the production of bio-SA includes BioAmber
Myraint DSM Mitsui amp Co Mitsubishi BASF Roquette Freacuterese SA Purac
and Reverdia In 2013 the global bio-SA market volume was approximately
51 100 tons and in seven years it is expected to reach a market volume of
710 000 tons In that same year BDO is predicted to emerge as the largest
application segment for bio-SA as it will replace maleic anhydride in the
production of BDO every 1MT of maleic anhydride will be replaced by
12MT of bio-SA (Allied Market Research 2014)
223 Bio-based SA production
Bio-SA which has the same structure as petroleum-based SA is produced
by the fermentation of a carbohydrate using a natural producer or an
engineered organism The feedstock used for the production of bio-based
succinic acid can be wheat maize glucose lignocellulosic-derived sugar or
sorghum grain processed to starch (BioConSepT 2013)
Compared with the petroleum-based process the fermentation process has
the advantages of mild operating conditions independence of the fossil
feedstock and fixation of CO2 and with development of genetic engineering
metabolic modification of microbial strains and improvement of
copycopy UUnniivveerrssiittyy ooff PPrreettoorriiaa
10
purification technology the fermentative production of SA from renewable
resources can be more cost-effective than the fossil-based processes (Xu amp
Guo 2010)
To date various microorganisms have been reported to produce SA such
as typical gastrointestinal bacteria and rumen bacteria and some
lactobacillus strains (Kaneuchi Seki amp Komagata 1988 Beauprez et al
2010) Among them Actinobacillus succinogenes (Guettler Rumler amp Jain
1999) Anaerobiospirillum succiniciproducens (Oh et al 2008) Mannheimia
succiniciproducens (Lee et al 2000) and genetically modified Escherichia
coli (Lin Bennet amp San 2005) are the most promising strains for producing
SA at high yields Fungi species such as Aspergillus niger Aspergillus
fumigatus Byssochlamys nivea Lentinus degener Paecilomyces varioti
Penicillium viniferum and yeast Saccharomyces cerevisia also produce
succinic acid but not in high concentrations or yields (Song amp Lee 2006)
Nevertheless for industrial applications A succinogenes stands out because
it is by far the most studied wild strain (Brink amp Nicol 2014) and its ability
to produce high concentrations of SA naturally from a broad range of
carbon sources (Guettler et al 1999 McKinlay Vieille amp Zeikus 2007)
further makes it ideal for commercial applications
23 Actinobacillus succinogenes
231 Description of microorganism
A succinogenes a Gram-negative rod-shaped and non-motile bacterium
isolated from bovine rumen (Guettler et al 1999) is considered to be one
copycopy UUnniivveerrssiittyy ooff PPrreettoorriiaa
11
of the top natural SA producing microorganisms (McKinlay et al 2007
Brink amp Nicol 2014) It produces SA as part of a mixed acid fermentation in
which acetic acid (AA) formic acid (FA) and ethanol are the by-products It
is capable of digesting a wide range of carbon sources such as glucose
fructose mannitol arabitol sorbitol sucrose xylose and arabinose under
anaerobic conditions (Van der Werf et a 1997) but most laboratory
experiments use glucose fructose xylose and sucrose as carbon substrates
A succinogenes grows optimally at moderate temperatures (37 degC to 39 degC)
and it is facultative anaerobic ie it can survive in the presence or absence
of oxygen Furthermore it is capnophilic because its growth is enhanced at
increased CO2 concentrations (Guettler et al 1999) and it is a
chemoheterotroph that grows optimally at pH ranging from 6 to 74
232 Metabolic pathway
As stated earlier A succinogenes is a promising candidate for industrial SA
production However in addition to producing SA it also produces formic
acid (FA) acetic acid (AA) and sometimes ethanol The summarised version
of the metabolic pathway for A succinogenes is shown in Figure 23
A succinogenes ferments glucose to phosphoenolpyruvate (PEP) by
glycolysis PEP is thought to serve as the point of divergence between the
FA AA and ethanol producing pathway (C3 pathway) and the SA producing
(C4) pathway The path from glucose to PEP is neutral overall in terms of
adenosine triphosphate (ATP) production but one-third of nicotinamide
adenine dinucleotide (NADH) is produced per cmol of glucose consumed
copycopy UUnniivveerrssiittyy ooff PPrreettoorriiaa
12
C4 metabolic pathway (reverse tricarboxylic pathway)
Overall this pathway leads to the formation of SA and two molecules of
NADH and one molecule of CO2 must be consumed to form one molecule of
SA Ideally one would prefer the carbon flux to follow this route to attain
homosuccinate production
The key enzyme in this pathway is PEP carboxykinase because it pushes
the carbon flux from PEP to oxaloacetate which later on becomes SA This
enzyme is regulated by CO2 levels ie the level of CO2 available to A
succinogenes will have an influence on the SA production of the organism
(Van der Werf et al 1997) Hence it will be imperative to achieve correct
extracellular and intracellular CO2 levels during SA production
C3 metabolic pathway
However the C3 pathway cannot be avoided due to the redox requirement
of the cell In this pathway PEP is converted to pyruvate by pyruvate
kinase generating one molecule of ATP during the process Pyruvate is
then converted to acetyl-CoA by either pyruvate dehydrogenase (PDH)
andor pyruvate-formatelyase (PFL)
Pyruvate conversion with PDH results in one molecule of CO2 and one
molecule of NADH being formed alongside one molecule of AA With PFL
FA is produced instead of CO2 and NADH but FA can be further broken
down to CO2 and NADH by the enzyme formate dehydrogenase (FDH)
copycopy UUnniivveerrssiittyy ooff PPrreettoorriiaa
13
The FDH activity (encoded by the fdhF gene in A succinogenes) is known to
occur only under the following conditions (Spector 2009)
Absence of an electron acceptor such as oxygen or nitrate
Acidic pH conditions
Presence of FA
PFL expression is stated to be dependent upon two glycolysis enzyme
activities namely phosphoglucoisomerase and phosphofructokinase
Interestingly the expression of PFL and FDH enzymes is reported to
increase under carbon energy source starvation (Spector 2009)
Acetyl-CoA is the branch point at which both ethanol and AA are later
formed In this process a molecule of ATP is produced per molecule of AA
formed For one molecule of ethanol formed two molecules of NADH are
absorbed However ethanol formation can be reduced if there is
intracellular availability of CO2 to the organism (Van der Werf et al 1997)
copycopy UUnniivveerrssiittyy ooff PPrreettoorriiaa
14
Figure 23 Simplified metabolic network of A succinogenes (based on
McKinlay et al (2007)
copycopy UUnniivveerrssiittyy ooff PPrreettoorriiaa
15
Pentose phosphate pathway (PPP)
Figure 23 gives a simplified version of the metabolic pathway of A
succinogenes However several studies have noted that the pentose
phosphate pathway is an additional pathway for the A succinogenes (Brink
amp Nicol 2014 Bradfield amp Nicol 2014 Van der Werf et al 1997 McKinlay
et al 2007 McKinlay et al 2005) McKinlay (2007) stated that the PPP
only contributed 20 to the NADPH required for the organismrsquos growth
But Bradfield amp Nicol (2014) and Brink amp Nicol (2014) postulated that the
contribution of the PPP could increase and be more than predicted when
the organism enters the maintenance phase or non-growth phase
According to Ruumlhl et al (2012) a resting non-growing Bacillus subtilis cell
showed constant metabolic activity without cell growth which lead to an
apparent overproduction of nicotinamide adenine dinucleotide phosphate
(NADPH) (via the PPP) which is then converted by transhydrogenase into
NADH Bradfield amp Nicol (2014) claim that it is possible that this can also
occur with A succinogenes as it does possess the transhydrogenase The
analysis by Bradfield amp Nicol (2014) indicated an under-prediction of the
YAASA for the growth metabolism (associated with NADH ldquolossesrdquo) while an
over-prediction of the YAASA is achieved for the maintenance metabolism
(associated with NADH ldquogainrdquo) This could imply that different metabolic
pathways are employed under growth and maintenance conditions
Medium contributions were previously considered as the source for the
NADH disparities during the maintenance phase but this reasoning can be
ruled out given the results of the study done by Brink amp Nicol (2014) in
which the same medium resulted in opposite redox balance trends with
regard to the growth and non-growth phases
copycopy UUnniivveerrssiittyy ooff PPrreettoorriiaa
16
24 SA yield considerations
The theoretical maximum yield of SA on a carbon substrate through
fermentation can be determined by considering the net metabolic pathway
involved and a redox balance as illustrated by Villadsen Nielsen amp Lideacuten
(2011 159-163) The overall black box stoichiometry in converting glucose
to SA with no biomass and no by-product formation is
C6H12O6 + 120788
120789CO2rarr
120783120784
120789C4H6O4 +
120788
120789H2O (21)
From Equation 21 the theoretical maximum yield of succinic acid on
glucose (YGLSA) is 112 gmiddotg-1 However it is not possible to achieve the
maximum yield because actual SA yield will depend on the active metabolic
pathway of the organism and the associated product distribution To
determine the maximum YGLSA possible with by-product formation a redox
balance is required
Pyruvate metabolism
Assuming that there is no carbon flux to cell growth and if only the PDH
enzyme is active or FDH converting all FA the overall black box
stoichiometry in converting glucose to SA and AA with no biomass
formation is
C6H12O6 + 120784
120785CO2rarr
120786
120785C4H6O4 +
120784
120785C2H4O2 (22)
Since no FA is formed the YAAFA will be 0 gmiddotg-1 This pathway releases one
molecule of NADH for every molecule of AA produced (see Figure 24) The
copycopy UUnniivveerrssiittyy ooff PPrreettoorriiaa
17
NADH would be consumed by the C4 pathway to produce SA and then the
theoretical YGLSA would be 088 gmiddotg-1
Figure 24 Simplified metabolic network of A succinogenes (PDH
active)
On the other hand if only the PFL enzyme is active both FA and AA will be
formed (see Figure 25) The overall black box stoichiometry in converting
glucose to SA AA and FA with no biomass formation is
C6H12O6 + CO2rarrC4H6O4 +C2H4O2 + CH2O2 (23)
For every molecule of FA formed a molecule of AA will be produced so the
YAAFA will be 076 gmiddotg-1 As a result YGLSA will be 066 gmiddotg-1 If both PFL and
FDH enzymes are active then FA will be broken down to produce CO2 and
NADH which will result in YAAFA being 0 gmiddotg-1 and YGLSA being 088 gmiddotg-1
copycopy UUnniivveerrssiittyy ooff PPrreettoorriiaa
18
Figure 25 Simplified metabolic network of A succinogenes (PFL
active)
Nevertheless as mentioned by Van Heerden amp Nicol (2013a)the maximum
theoretical yield of SA can be obtained through the metabolic engineering
of A succinogenes This can be achieved by manipulating the organism to
use the oxidative part of the tricarboxylic acid (TCA) cycle under anaerobic
conditions (see Figure 26a)
copycopy UUnniivveerrssiittyy ooff PPrreettoorriiaa
19
Figure 26 (a) Simplified metabolic network of A succinogenes
(oxidative TCA cycle active) (b) Simplified metabolic network of A
succinogenes (glyoxylate bypass active)
Alternatively the glyoxylate bypass can be utilised (Figure 26b) to give the
same result For both these scenarios the mass-based SA-to-glucose ratio is
112 gmiddotg-1 which is the maximum theoretical yield of SA that can be
achieved
25 Nitrogen source for A succinogenes
The composition of the growth medium is a key factor in microbial
fermentations An important element of the fermentation medium which
will be essential for the growth of the organism is the nitrogen source
In the rumen A succinogenes is surrounded by a massive source of
nutrients which allow the organism to thrive But outside the rumen more
specifically in the laboratory or in an industrial fermentation setup
copycopy UUnniivveerrssiittyy ooff PPrreettoorriiaa
20
nutrients important for growth of the organism must be provided Since
A succinogenes is auxotrophic it requires certain amino acids and vitamins
to be provided for growth and SA production McKinlay et al (2010)
determined the essential vitamins required for the growth to be nicotinic
acid pantothenate pyridoxine and thiamine and the needed amino acids to
be cysteine glutamate and methionine Furthermore they concluded that
it is able to grow without biotin supplementation
By contrast Xi et al (2012) declared the essential vitamins to be only biotin
and nicotinic acid and the essential amino acids to be only glutamate and
methionine Nevertheless the addition of these defined components makes
the growth medium expensive for industrial use (Shuler amp Kargi 2002 52)
This collection of vitamins and amino acids is thought to be better
introduced to the organism in a complex form (eg yeast extract or corn
steep liquor) where the components and concentration of the nitrogen-
carrying compounds are unknown A complex form of nitrogen source is
less expensive than a defined form and it is said to produce higher cell
growth compared with media with a defined nitrogen source (Shuler amp
Kargi 2002 52)
Batch fermentation studies
Table 21 lists batch studies that investigated alternative nitrogen sources
for SA production and A succinogenes growth From the studies that used
only one type of nitrogen source (either YE or YE amp CSL or CSL amp vitamins)
it can be seen that studies that used only YE generally had a lower YGLSA
compared with the studies that used a combination of YE and CSL as the
nitrogen source Addition of vitamins (Yan et al 2013) to CSL produced SA
copycopy UUnniivveerrssiittyy ooff PPrreettoorriiaa
21
yields and cell growth that were better than the results produced by the YE
and CSL combination
Studies that compared different nitrogen sources within the same study
such as Jiang et al (2010) and Shen et al (2015) compared the
performance of several nitrogen sources inorganic and organic and
observed the following
Inorganic nitrogen sources such as (NH4)2SO4 or NH4Cl were the
worst performing with regard to cell growth and SA yield (Jiang et al
2010)
YE as the only nitrogen source in a growth medium produced the
highest SA yield and the highest dry cell weight (DCW) in comparison
with other nitrogen sources (Jiang et al 2010 Shen et al 2015)
CSL a by-product of corn starch production as the only nitrogen
source in a growth medium was the second best performer (Jiang et
al 2010 Shen et al 2015)
CSL medium did not achieve full carbon substrate conversion
compared with YE medium at the end of the batch fermentation
(Jiang et al 2010 Shen et al 2015)
These studies suggested that the most promising nitrogen source in terms
of A succinogenes growth and SA yield from carbon substrate was yeast
extract (YE) YE is said to have various vitamins amino acids minerals and
trace metals that are necessary to stimulate the growth of A succinogenes
and synthesize its metabolites (Kasprow Lange amp Kirwan 1998) Although
YE is considered to be the best source of nitrogen its price ranges from
US$350kg to US$67kg (Kwon et al 2000 Sridee et al 2011) while the
copycopy UUnniivveerrssiittyy ooff PPrreettoorriiaa
22
price of CSL ranges from US$007kg to US$0075kg (Davis et al 2013)
which makes YE an expensive and unfeasible nitrogen source for long-term
industrial fermentation (Jiang et al 2010 Xi et al 2013 Shen et al 2015)
and CSL an economically viable alternative to YE The feasibility of CSL
feasibility as a nitrogen source was also investigated using microorganisms
such as Mannheimia succiniciproducens (MBEL55E) and Anaerobiospirillum
succiniciproducens Those studies (Lee et al 2000 2002) came to the same
conclusion as Jiang et al (2010) and Shen et al (2015) the inexpensive CSL
can replace the expensive YE as a nitrogen source to promote cell growth
and SA production
A possible reason why CSL proved to be second best to YE is because CSL
contained the cofactor biotin which is considered to be vitally important
for the metabolism of protein lipid and carbohydrate (Xi et al 2012) The
biotin content in CSL is 1 mgmiddotkg-1 and this is said to be sufficient to make a
significant contribution to the nutritional requirement of A succinogenes or
other microorganisms (Nghiem et al 1996) However Jiang et al (2010)
and Shen et al (2015) noticed that with CSL as a nitrogen source in
contrast to YE as the nitrogen source there was a significant amount of
residual glucose that remained at the end of the batch fermentation Shen
et al (2015) suggest that CSL may lack trace elements and certain nitrogen-
containing compounds that prevent A succinogenes from meeting its
normal physiological needs Another reason could be that the batch
fermentation time was not long enough for the CSL medium to reach full
carbohydrate consumption Since no profile of the variables over time was
given for these studies it is hard to determine whether the residual glucose
found in the CSL medium was due to a lack of nutrients or productivity
reduction
copycopy UUnniivveerrssiittyy ooff PPrreettoorriiaa
23
Xi et al (2013) stated that the heme and CSL combination in the production
medium improved SA production by creating a more reductive
environment (the initial redox potential was very low when heme was
added to the medium)
copycopy UUnniivveerrssiittyy ooff PPrreettoorriiaa
24
Table 21 Batch fermentation studies of A succinogenes using different nitrogen sources namely YE and CSL
Study Model Nitrogen source (gmiddotL-1)
Carbon Source
CSo (gmiddotL-1)
CSA (gmiddotL-1)
YGLSA
(gmiddotg-1) YAASA
(gmiddotg-1) YAAFA
(gmiddotg-1)
DCW
(gmiddotg-1)
Gunnarsson
Karakashevamp
Angelidaki (2014)
130Z YE(20) Synthetic
hydrolysate
36 30 083 86 058 25
Zhen et al (2009)
CGMCC
1593
YE(15) Straw
hydrolysate
58 455 0807 7583 083 56
Corona-Gonzalez et
al (2008)
130Z YE(10) Glucose 547 338 062 52 11 37
Liu et al (2008)
CGMCC
1593
YE(10) Sugarcane
molasses
644 464 072 77 3 5
Yan et al (2013)
CCTCC
M2012
036
CSL(25) amp
vitamins
mixture
Glucose 50 39 085 - - -
copycopy UUnniivveerrssiittyy ooff PPrreettoorriiaa
25
Study Model Nitrogen source (gmiddotL-1)
Carbon Source
CSo (gmiddotL-1)
CSA (gmiddotL-1)
YGLSA
(gmiddotg-1) YAASA
(gmiddotg-1) YAAFA
(gmiddotg-1)
DCW
(gmiddotg-1)
CCTCC
M2012
036
CSL(25) amp
vitamins
mixture
Glucose 100 881 088 - - -
Jiang et al (2014)
CGMCC
1716
YE(10) amp
CSL(5)
mixture
Sucrose 100 55 069 11 09 3
Chen et al (2010)
NJ113 YE(10) amp
CSL(5)
mixture
Glucose 50 42 084 - - -
Urbance et al
(2004)
130Z YE(6) amp
CSL (10)
mixture
Glucose 40 339 087 - - -
Urbance et al
(2003)
130Z YE(6) amp
CSL(10)
mixture
Glucose
20 174 087 - - -
copycopy UUnniivveerrssiittyy ooff PPrreettoorriiaa
26
Study Model Nitrogen source (gmiddotL-1)
Carbon Source
CSo (gmiddotL-1)
CSA (gmiddotL-1)
YGLSA
(gmiddotg-1) YAASA
(gmiddotg-1) YAAFA
(gmiddotg-1)
DCW
(gmiddotg-1)
Shen et al (2015) GXAS1
37
YE(12) Sugarcane
molasses
70 546 078 75 5 38
CSL(206) Sugarcane
molasses
70 479 068 76 573 3
Xi et al (2013)
NJ113 YE(10) amp
CSL(75)
mixture
Glucose 30 171 057 372 - 37
CSL (15) Glucose 30 151 050 458 - 31
CSL (15) amp
heme (0001)
mixture
Glucose 30 217 072 493 - 33
Jiang et al (2010)
NJ113 YE(15) Glucose 70 487 070 - - 45
CSL(15) Glucose 70 96 014 - - 21
copycopy UUnniivveerrssiittyy ooff PPrreettoorriiaa
27
Continuous fermentation studies
To date all continuous fermentation studies except the study done by Yan
et al (2014) used a combination YE and CSL (based on the revised SA
medium by Urbance et al 2003) as nitrogen sources None of these studies
investigated on the effect of varying the nitrogen sources type or the
concentration on SA productivity and cell growth In Table 22 it can be
seen that with a fixed combination of YE and CSL growth medium Maharaj
et al (2014) achieved the highest SA yield on glucose mass ratio and
highest SA concentration However Yan et al (2014) reported even YGLSA
and SA concentration and they used a combination of the inexpensive CSL
and defined vitamins
26 Continuous fermentation
In an economic context the need to produce large volumes of product is the
main reason for the selection of the continuous reactor mode preferably
one in which a wild strain acts as the biocatalyst to diminish mutation
problems (Villadsen et al 2011 384) Continuous systems are
advantageous also on a monetary scale because they have lower capital and
labour costs in comparison with batch production systems and since
continuous processes are time independent constant product quality is
more attainable compared with batch or fed-batch processes (Villadsen et
al 2011 384)
A unique aspect of continuous operation is the formation of biofilm which
is inevitable during pro-longed A succinogenes fermentations (Van
Heerden amp Nicol 2013 Maharaj amp Nicol 2014 Urbance et al 2003
copycopy UUnniivveerrssiittyy ooff PPrreettoorriiaa
28
Bradfield amp Nicol 2014 Brink amp Nicol 2014) Biofilms are microbial cell
layers that are embedded in self-produced exopolysacharide (EPS) which is
prone to attaching to surfaces Reactors with biofilms can be operated for
longer periods of time and are very economical because of the self-
immobilizing nature of A succinogenes which results in high volumetric
productivities (Rosche et al 2009)
It is well-known that the growth of A succinogenes is inhibited by the total
concentration of acids in the medium (Corona-Gonzaacutelez et al 2008 Lin et
al 2008 Urbance et al 2004) and therefore at a low throughput (or D)
growth of the organism will be slow since that is when high yields and acid
concentrations are found At a high D the biofilm is established at a quicker
rate but process instability is more severe (Maharaj amp Nicol 2014) The
excessive biofilm shedding at this point does not allow the system to reach
steady state easily and maintain it At a low D the effects seen with a high D
are not observed According to Bradfield amp Nicol (2014) the concentrations
produced at a low D are linked to the maintenance phase and therefore
only a small fraction of the biomass is replicating which allows the system
to reach and maintain steady state (Maharaj amp Nicol 2014)
copycopy UUnniivveerrssiittyy ooff PPrreettoorriiaa
29
Table 22 Continuous fermentation studies of A succinogenes using different nitrogen sources namely YE and CSL
Study Organism model
Nitrogen source
Dilution CSo (gmiddotL-1)
CSA (gmiddotL-1)
YGLSA
(gmiddotg-1) YAASA
(gmiddotg-1) YAAFA
(gmiddotg-1)
DCW
(gmiddotg-1)
Maharaj et al
(2014)
130Z YE(6) amp
CSL(10)
0054
071
326
141
09
080
-
-
-
-
-
-
Yan et al
(2014)
CCTCC
M2012036
CSL(25) amp
vitamins
01-04 188-
3996
084-
092
- - -
001-01 422-
636
072-
085
- - -
Van Heerden
and Nicol
(2013b)
130Z YE(6) amp
CSL(10)
049 13 071 25 077 -
Urbance et al
(2004)
130Z
YE(6) amp
CSL(10)
085
104
076
-
-
-
copycopy UUnniivveerrssiittyy ooff PPrreettoorriiaa
30
3 Materials and Methods
31 Microorganism and growth
Microorganism
In this study Actinobacillus succinogenes 130Z (DSM No 22257 or ATCC
No 55618) was used It was obtained from the German Collection of
Microorganisms and Cell Cultures (Braunschweig Germany) The culture
was stored in a cryopreservation solution at a temperature of ndash75 degC
Inoculum preparation
Inoculum was prepared by transferring 1 ml of the preserved culture to a
vial containing 15 ml of sterilized tryptone soy broth (TSB) The vial was
sealed and stored in an incubator at 37 degC with a shaker speed of 100 rpm
for a duration of 16ndash24 h The broth was later tested for contamination and
usability by performing an analysis with high-performance liquid
chromatography (HPLC) If the broth contained lactic acid or ethanol it was
considered to be contaminated and if a considerable amount of SA was
found in the broth then the culture was deemed to be viable
32 Fermentation media
All chemicals used to make the fermentation medium were obtained from
Merck KgaA (Darmstadt Germany) unless otherwise indicated The feed
medium consisted of three parts a growth medium a phosphate buffer and
copycopy UUnniivveerrssiittyy ooff PPrreettoorriiaa
31
a glucose solution The fermentation medium is based on the composition
proposed by Urbance et al (2003)
Six different growth media were used during the fermentation runs each
medium were composed of a different type andor concentration of
nitrogen sources The first medium used only yeast extract (YE) as the
nitrogen source and the last medium used only corn steep liquor (CSL) The
first run had approximately 33 gmiddotL-1of D-glucose added to the medium and
the last run had approximately 45 gmiddotL-1 of D-glucose added to the medium
Table 31 gives details of the components and the respective concentrations
used to make the feed media CO2(g) (Afrox Johannesburg South Africa)
was fed into the recycle line at 10 vvm to serve as the inorganic carbon
source
copycopy UUnniivveerrssiittyy ooff PPrreettoorriiaa
32
Table 31 Specifications of feed mediaa used during fermentations
Medium
1
Medium
2
Medium
3
Medium
4
Medium
5
Medium
6
Glucose (gmiddotL-1)
Runs 1 amp 2 33 33 33 33 33 33
Run 3 45 45 45 45 45 45
Growth (gmiddotL-1)
YE 16 10 6 3 1 0
CSL 0 6 10 13 15 16
YE ( of YE in
N2 source)d
100 625 375 1875 625 0
NaCl 1 1 1 1 1 1
MgCl2middot6H2O 02 02 02 02 02 02
CaCl22H2O 02 02 02 02 02 02
CH₃COONa 136 136 136 136 136 136
Na2Smiddot9H2O 016 016 016 016 016 016
Antifoam Ybc 1 1 1 1 1 1
Phosphate (gmiddotL-1)
K2HPO4 16 16 16 16 16 16
KH2PO4 32 32 32 32 32 32
a Based on Urbance et al (2003)
b Antifoam from Sigma-Aldrich St Louis USA
c Concentration is in mlmiddotL-1
d YE in N2 source is the of YE in the total complex nitrogen source in the medium
The concentration of the total complex nitrogen source (a combination of CSL and
powder YE) was 16 gmiddotL-1 throughout the fermentations for all runs
copycopy UUnniivveerrssiittyy ooff PPrreettoorriiaa
33
33 Bioreactor
The bioreactor pictured in Figure 31 (a amp b) was a glass cylindrical body
set between an aluminium base and head with an external recycle line to
provide agitation The working volume of the reactor (including recycle)
was 356 mL The liquid level in the reactor was maintained by using a
peristaltic pump on the product line All pumps used in the system were
peristaltic pumps A wooden stick covered in terry cloth was inserted in the
glass cylindrical body for biofilm attachment In fermentation run1 and
run2 one stick was used and in fermentation run 3 three sticks were used
CO2 flow rates were controlled using Brooks 5850S mass flow controllers
(Brooks Instrument Hungary) and the CO2 entered the reactor via an inlet
in the recycle line which was connected to a 02 μm PTFE membrane filter
(Midisart 2000 Sartorius Goumlttingen Germany) The gas exited the system
through a filter with the same specifications as mentioned earlier
connected to the foam-trap
The pH was measured using a CPS 71D-7TB21 glass combination probe
(Endress+Hauser Gerlingen Germany) held within a stainless-steel holder
connected in-line within the recycle stream Maintaining the pH at 68
required the use of a Liquiline CM442 (Endress+Hauser Gerlingen
Germany) in which an internal relay controlled the dosing of 10 M
unsterilized NaOH in an onndashoff fashion Temperature was controlled in a
similar fashion a hotplate was used to provide the heat required to
maintain the temperature at 37 degC For better control of temperature
fluctuations the hotplate was linked to the National Instrument (NI)
module The NI module is further discussed in Section 35
copycopy UUnniivveerrssiittyy ooff PPrreettoorriiaa
34
Figure 31a) Simplified schematic of bioreactor setup
No Description
1 Gas filter
2 Foam-trap 3 Medium
reservoir 1 4 Antifoam
reservoir 5 Medium
reservoir 2 6 Inoculation
septum 7 Reactor body 8 Hot plate 9 Temperature
control 10 pH probe 11 Product
reservoir 12 NaOH reservoir 13 CO2 cylinder 14 Controller 15 Recycle pump 16 Dosing pump
17 Gas flow controller
8
7
2
3
4
5
11
12
13
17
T pH
6
C
DAQ
PC
1
9 10
14
15
16
copycopy UUnniivveerrssiittyy ooff PPrreettoorriiaa
35
Figure 31b) Bioreactor setup
copycopy UUnniivveerrssiittyy ooff PPrreettoorriiaa
36
34 Fermentation procedure
The three parts of the fermentation medium (growth medium buffer and
glucose) were prepared in separate bottles and were autoclaved at 121degC
for 60 minutes To prevent unwanted reactions amongst the medium
components the three parts of the medium were only mixed once the
bottles had cooled to room temperature (approx 24 degC) The reactor
system (excluding NaOH) was also autoclaved at the same temperature and
duration as stated above
The first fermentation medium (see Table 31) was used to start up the
fermentation It had only YE as the nitrogen source This was done to form
a substantial amount of biofilm for full glucose consumption The feed
setup was then connected to the sterile reactor system with a sterile
coupling The coupling consisted of a U-connection one half of which was
fixed to the feed setup and the other half to the reactor system Each half of
the connection had a ball valve to isolate the system from the external
environment The half connections were then coupled and placed in an oil
bath at 140 degC for 20 minutes The reactor was then filled with medium and
once the temperature and pH had stabilized to 37degC and 68 respectively
10 mL of inoculum was injected into the reactor through a silicon septum
attached to the reactor head
Fermentations were started off by operating the system at batch conditions
for 17 hours and then changing to continuous operation at a low dilution
rate This allowed for cell accumulation and prevented cell washout
Addition of antifoam into the reactor was only done when deemed
necessary The recycle flow rate was kept constant at 500 mLmiddotmin-1 in all
fermentations to maintain similar shear conditions The CO2 flow rate was
copycopy UUnniivveerrssiittyy ooff PPrreettoorriiaa
37
set at a vvm of 10 as it seemed sufficient to maintain CO2 saturation in the
reactor After a few days of operation biofilm appeared on internal surface
of the bioreactor as well as the wooden stick covered in terry cloth which
was inserted into the glass cylinder as the intended surface for biofilm
attachment
Controlled variables
Dilution rates for the fermentation runs were determined using the first
fermentation medium Once biofilm had formed in the reactor after a few
days of continuous operation the dilution rate was adjusted until 95 of
initial glucose had been consumed For R3 90 was the target for glucose
consumption The dilution rate was fixed for the entire experimental run if
the above mentioned glucose consumption stayed more or less constant for
three days or more
Media change during fermentation
Similar to the feed connection to the reactor the different medium setups
were connected to the sterile reactor system with another sterile coupling
The half connections were then coupled and the U-connection was placed
in an oil bath at 140 degC for 40 minutes
35 Online monitoring
Monitoring of the process was performed in a similar fashion to that of Van
Heerden and Nicol (2013b) in which the time-averaged NaOH dosing
copycopy UUnniivveerrssiittyy ooff PPrreettoorriiaa
38
fraction was linked to a productivity factor allowing an estimated SA
concentration to be calculated in real-time A LabVIEW (NI module)
program was used to monitor and control the reactor The program was
linked to the reactor instrumentation using a cDAQ-9184 data acquisition
device (National Instruments Hungary) with voltage and current input
modules and a current output module Temperature dosing and antifoam
flowrates were controlled with the program Temperature pH gas flow
rates and the time-averaged dosing of NaOH were recorded through the
program
36 Analytical methods
HPLC analysis
High-performance liquid chromatography (HPLC) was used to determine
the concentrations of glucose SA and other organic acids Analyses were
done using an Agilent 1260 Infinity HPLC (Agilent Technologies USA)
equipped with an RI detector and a 300 mm times 78 mm Aminex HPX-87 H
ion-exchange column (Bio-Rad Laboratories USA) The mobile phase (03
mLmiddotL-1 and 11 mLmiddotL-1H2SO4) flowrate was 06 mLmiddotmin-1 and the column
temperature was 60degC
Suspended cell analysis
Once the reactor had reached a steady state the product stream was
collected in a bottle that was kept in a small bar refrigerator The product
bottle was kept cool to prevent further growth of cells and metabolic
activity and depending on the dilution rate the duration of the collection
period varied from 12 to 72 hours The collected volume was then
copycopy UUnniivveerrssiittyy ooff PPrreettoorriiaa
39
thoroughly mixed and a 12 mL sample was collected for suspended cell
analysis This was performed by splitting the 12 mL sample into 12 x 1 mL
samples and centrifuging at 4000 rpm for 2 minutes The samples were
centrifuged three times and after each centrifugation the supernatant was
poured out and the cell precipitate washed in distilled water Following the
third centrifugation the cell precipitates were transferred to an empty
glass vial that had been measured beforehand The cell precipitates were
then dried to a constant weight in an 85 degC oven
Mass balance analysis
Overall mass balances were performed to assess the accuracy of each
sample The mass balances were performed by comparing the
stoichiometric amount of glucose required to achieve the experimental
concentrations of SA AA and FA with the experimental amount of glucose
consumed
37 Steady state check
When the time-averaged dosing profile constructed by the LabVIEW
program ceased to fluctuate by a 5 standard deviation of the average
dosing flow it was assumed that the system had reached pseudo-steady
state and the product stream was sampled To further ascertain steady
state the glucose and organic acid concentrations in product samples
frequently taken over a certain period were compared and if negligible
differences were found between the sample data the system was
confirmed to be at steady state
copycopy UUnniivveerrssiittyy ooff PPrreettoorriiaa
40
38 Summary of fermentation
Results were obtained over three continuous fermentation runs Several
other runs were attempted but did not provide any results that were
valuable due to upsets encountered in the system The three runs
mentioned in Table 32 were conducted to prove the repeatability of trends
observed in the first fermentation run
Table 32 Summary of fermentation runs performed
Five different mediums each with a glucose concentration of 33 gmiddotL-1 were
used in fermentation run 1 (R1) This gave an indication of what the
general trend would be of the product distribution The dilution rate was
adjusted until steady state was achieved with only 5 of initial glucose
concentration as residual for the first medium Therefore with the 33 gmiddotL-1
initial glucose a Df of 008 h-1 was set Fermentation run 2 (R2) was
conducted to prove the repeatability of the trend seen in R1 Fermentation
run 3 (R3) was conducted with six different media at a glucose
concentration of 45 gmiddotL-1 and 90 glucose conversion was only achieved
when the Df was lowered to 0041 h-1
Run Operating
hours (h)
Glucose
(gmiddotL-1)
Df
(h-1) Medium No
1 1 008 33 0080 1 2 3 4 5 -
2 1 104 33 0045 1 3 5 - - -
3 1 272 45 0041 1 2 3 4 5 6
copycopy UUnniivveerrssiittyy ooff PPrreettoorriiaa
41
Biofilm attachment and appearance
Approximately 72 hours after inoculation of the bioreactor biofilm started
forming on the glass wall of the reactor A substantial amount of biofilm
inside the bioreactor only formed after plusmn 330 operating hours The
structure and the amount of the biofilm varied throughout the
fermentations and it appeared that the biofilm was dependent on the
following
the surface to which it is attached
the history of the fermentation
the composition of the fermentation medium
Figure 32 (a) shows the bioreactor before inoculation and without cell
attachment After operation for more than 330 hours using only YE as the
nitrogen source a thick mass of biofilm had formed as shown in Figure
32 (b) However as the CSL concentration on the fermentation medium
increased more biofilm started to shed and eventually when only CSL was
used at the nitrogen source there was almost no biofilm attachment on the
glass surface of the bioreactor (as seen in Figure 32 (c))
Although there was not much biofilm on the glass surface there was
biofilm on the internals of the reactor (the wooden sticks covered in terry
cloth) Figure 33 (a amp b) illustrates the sticks covered in biomass at the end
of the fermentations
copycopy UUnniivveerrssiittyy ooff PPrreettoorriiaa
42
Figure 32 a) Bioreactor before inoculation b) Biofilm growth using
only YE as nitrogen source c) Bioreactor with only CSL as nitrogen source
(a) (b) (c)
copycopy UUnniivveerrssiittyy ooff PPrreettoorriiaa
43
Figure 33 a) Internal support for biofilm attachment (at the end of
fermentation run 1) b)Internal supports for biofilm attachment (at the end
of fermentation run 3)
(a) (b)
copycopy UUnniivveerrssiittyy ooff PPrreettoorriiaa
44
4 Results and Discussion
41 Experimental strategy for different runs
The objective of R1 (fermentation run 1) was to find steady state data that
could be analysed to understand the influence of YE and CSL on the growth
and productivity of A succinogenes As seen in Table 31 the media used in
the experiments differed from each other regarding the concentrations of
CSL and YE but the total complex nitrogen source concentration in the
media remained constant The intended experimental plan was to report
the steady state product concentrations as the concentration of YE in the
growth medium varied (ie as the YE concentration decreased and the CSL
concentration increased) R2 (fermentation run 2) which followed the
same procedure as R1 was conducted to prove that the data found in R1
was repeatable R3 (fermentation run 3) was an attempt to achieve high SA
concentrations following the same experimental plan as R1 except that R3
used a high initial glucose feed concentration and had additional internal
support to increase the surface area available for biofilm attachments
All fermentations began with a growth medium that contained only YE as
the nitrogen source (100 YE) and once a healthy and stable biofilm had
formed the growth media were changed according to the procedure
explained in Section 34 Fermentation procedure
Initially R1 had a high biomass content and activity (when only YE was in
the fermentation medium) and as the YE content in the growth medium
decreased the biomass activity decreased R2 was effectively a repetition
of R1 but due to the low initial biomass activity the dilution rate was
adjusted to have approx 95 glucose conversion (when the growth
copycopy UUnniivveerrssiittyy ooff PPrreettoorriiaa
45
medium had only YE as the nitrogen source) Despite the increased surface
area for biofilm attachment the biomass in R3 struggled to achieve the
same activity as R1 Initially the SA concentration was slightly higher but
eventually the results of R3 coincided with those of R2 when CSL was
introduced into the growth medium The dilution rate for R3 could have
been lowered further to reach higher product concentrations but it was
decided not to do this due to time constraints for achieving steady state
Table 41 gives the steady state results for all three runs
copycopy UUnniivveerrssiittyy ooff PPrreettoorriiaa
46
Table 41 Steady state data for the three continuous fermentation runs
Dilution
(h-1)
SA
(gmiddotL-1) AA (gmiddotL-1) FA (gmiddotL-1)
PYR
(gmiddotL-1)
Δ GLC
(gmiddotL-1)
YE ( in nitrogen
source)
Black box mass
balance ()
Average black box
mass balance ()
Average black box
mass balance ()
with DCW
Fermentation run 1
008 1731 814 608 048 3041 10000 8529
008 1685 816 619 050 3067 10000 8347
009 1671 800 612 051 3059 10000 8269 8382
008 1860 702 449 066 2916 6250 8777
008 1872 667 435 079 2917 6250 8716 8747 9581
008 1764 492 263 045 2619 3750 8343
008 1792 494 251 033 2596 3750 8473
008 1778 498 259 031 2596 3750 8441 8419
008 1691 359 183 178 2152 1875 9646
008 1696 349 168 175 2223 1875 9278
008 1669 353 170 172 2107 1875 9687 9537
008 1565 239 064 224 1855 625 9935
008 1411 192 048 290 1808 625 9459
008 1328 176 056 293 1822 625 8921 9438
copycopy UUnniivveerrssiittyy ooff PPrreettoorriiaa
47
Dilution
(h-1)
SA
(gmiddotL-1) AA (gmiddotL-1) FA (gmiddotL-1)
PYR
(gmiddotL-1)
Δ GLC
(gmiddotL-1)
YE ( in nitrogen
source)
Black box mass
balance ()
Average black box
mass balance ()
Average black box
mass balance ()
with DCW
Fermentation Run 2
004 1780 852 569 051 2954 10000 9023
004 1853 878 569 044 2972 10000 9256
004 1874 897 585 040 3004 10000 9287 9189
004 1796 564 248 042 2489 3750 9154
004 1759 582 263 035 2354 3750 9616
004 1760 570 228 038 2561 3750 8760 9177
004 1175 290 071 201 1447 625 10575
004 1106 289 074 199 1455 625 10081
004 1080 283 071 202 1390 625 10357 10338
Fermentation Run 3
004 2253 1022 493 026 3695 10000 8686
004 2257 1009 499 023 3673 10000 8711
004 2205 976 477 025 3656 10000 8522 8640 9138
004 1927 787 298 000 3043 6250 8538
004 1970 803 306 007 3221 6250 8266
004 1991 820 335 005 3242 6250 8344 8383 9213
004 1785 604 128 063 2998 3750 8583
copycopy UUnniivveerrssiittyy ooff PPrreettoorriiaa
48
Dilution
(h-1)
SA
(gmiddotL-1) AA (gmiddotL-1) FA (gmiddotL-1)
PYR
(gmiddotL-1)
Δ GLC
(gmiddotL-1)
YE ( in nitrogen
source)
Black box mass
balance ()
Average black box
mass balance ()
Average black box
mass balance ()
with DCW
004 1879 615 131 069 3092 3750 8572 8568 8974
004 1635 493 028 067 2635 1875 8718
004 1628 486 022 077 2605 1875 8644
004 1578 455 036 080 2664 1875 8431 8598 9919
004 1159 295 000 082 1489 625 9255
004 1110 286 000 098 1955 625 8545
004 1104 275 000 099 1419 625 9630
004 1044 259 000 114 1433 625 8908 9085 11240
004 817 137 000 177 1582 000 6186
004 709 086 000 237 1425 000 8691
004 725 072 000 249 1457 000 6140
004 712 080 000 273 1271 000 7161 7045 7234
copycopy UUnniivveerrssiittyy ooff PPrreettoorriiaa
49
Mass balances or redox balances were performed on all the samples and
the average closures of the steady state samples are shown in Table 41
Mass balance closure did increase as the YE content decreased In R3
DCWs were taken to see if the mass balance closure would reach 100
Including the DCWs significantly improved the mass balance but did not
close it Anything above 90 was considered a proper closure and most
figures that were below 100 may indicate unknown metabolites or non-
perfect analysis of acids and sugars
42 Productivity analysis
Figure 41 shows the average concentrations of SA AA and FA in the
product streams at steady state for all fermentation runs For a clear
comparison of the metabolite concentrations of all the fermentation runs
the results were put into a single plot despite the differences in dilution
rate and glucose feed concentration The reasons for the difference in
dilution rates were explained in Section 41
copycopy UUnniivveerrssiittyy ooff PPrreettoorriiaa
50
R1
R2
R3
SA
FA
AA
Figure 41
(See Table 31)
Figure 42 depicts how SA productivity and the glucose consumption rate
changed as the YE concentration decreased
0
2
4
6
8
10
12
14
16
18
20
22
24
0 10 20 30 40 50 60 70 80 90 100
Co
nce
ntr
atio
n(g
middotL-1
)
YE in Nitrogen Source
Figure 41 Product concentration profiles for SA AA and FA of
A succinogenes as the YE in the growth media varied
The total nitrogen source (combination of YE and CSL) concentration in the
growth medium stayed constant at 16 gmiddotL-1only the concentrations of YE (powder
form) and CSL (liquid form) varied
Commented [B1] In order for the very long captions for Figures 41 to 46 NOT to show in the automatic List of Figures Ive converted the detailed descriptions to normal text
copycopy UUnniivveerrssiittyy ooff PPrreettoorriiaa
51
R1
R2
R3
Productivity SA
Glucose
consumption rate
Figure 42SA productivity profile and glucose consumption rat
A succinogenes as the YE in the growth media varied
(See Table 31)
SA concentration decreased as the concentration of YE was reduced in the
medium When only YE was used as the nitrogen source which is an ideal
ingredient for A succinogenes growth and SA productivity the highest SA
concentration for R2 and R3 was achieved For R1 the SA concentration
was at its highest when the 625 of YE medium was used Despite the
difference in glucose concentration SA concentrations for R1 R2 and R3
0
02
04
06
08
1
12
14
16
18
2
22
24
26
28
3
0
02
04
06
08
1
12
14
16
0 10 20 30 40 50 60 70 80 90 100
Glu
cose
co
nsu
mp
tio
n r
ate
(gL
hr)
Pro
du
ctiv
ity
SA
(gmiddotL
-1middoth
r-1))
of YE in Nitrogen source
Figure 42 SA productivity profile and glucose consumption rate
profiles of A succinogenes as the YE in the growth media varied
The total nitrogen source (combination of YE and CSL) concentration in the
growth medium stayed constant at 16 gmiddotL-1 only the concentrations of YE
(powder form) and CSL(liquid form) varied
copycopy UUnniivveerrssiittyy ooff PPrreettoorriiaa
52
were similar when CSL was added to the medium R3 started with a high SA
concentration as expected but then quickly dropped and displayed the
trend observed in R1 and R2 AA and FA both decreased as the YE content
in the medium decreased for all runs The concentrations for both FA and
AA more or less matched in all runs irrespective of the dilution rate and
the glucose feed concentration When only CSL was used as the nitrogen
source in the growth medium in R3 no FA was produced
The SA productivity trend shown in Figure 42 is the same as the SA
concentration profile The highest SA productivity obtained in this study
was 158 gmiddotL-1middoth-1 when a 625 YE medium was used as the nitrogen
source From Figure 42 it should be clear that the productivities of R1
were almost twice as high as the productivities of R2 The same can be said
for the glucose consumption rates for R1 and R2 This is because the
dilution rate of R1 was also twice as much as the dilution rate of R2
According to Maharaj et al (2014) a decrease in dilution should lead to an
increase in product concentrations and yields R1 and R2 do not follow that
trend Instead their product concentrations profile matched A possible
reason for the inconsistency in the trends could be that there was less
biofilm activity in R2 for an unknown reason compared with the biofilm
activity in R1 resulting in a product concentrations profile match instead of
higher product concentrations in R2 compared with the profile for R1
43 Analysis of product distribution
Metabolite concentrations were used to determine and study the product
distributions YAASA YAAFA and YGLSA of the three fermentations
copycopy UUnniivveerrssiittyy ooff PPrreettoorriiaa
53
In Section 24 the theoretical metabolic flux limitations were discussed and
it was noted that in the absence of biomass formation the maximum
theoretical values for YAASA and YGLSA should be 393gmiddotg-1 and 088 gmiddotg-1
respectively These yields would only be achieved if no FA was produced
ie if only PDH was active However if the PFL route was active and all of
the FA was converted to CO2 and NADH by FDH then the maximum
theoretical yields mentioned earlier could be still achieved If biomass is
produced then a portion of the glucose in the growth medium would be
directed to the anabolic pathway which would influence the carbon
distribution resulting in maximum yields less than those given above
It is illustrated in Figure 43 that YAASA should vary between 197 gmiddotgminus1 (for
YAAFA = 077 gmiddotgminus1) and 393 gmiddotg-1 (for YAAFA = 0 gmiddotgminus1) Using only YE as the
nitrogen source the experimental yields for all runs matched the maximum
theoretical yields that were obtained when only the PFL enzyme was
active As the nitrogen source content varied (ie CSL concentration
increased and YE concentration decreased) YAASA increased and YAAFA
decreased thus indicating a shift in the metabolic flux distribution YAASA for
R2 and R3 were similar throughout the runs so was YAAFA However when
the YE concentration in the nitrogen source was 1875 for R1 and R3
YAASA exceeded the maximum theoretical yield while YAAFA was still in the
range of 0 gmiddotg-1 to 077 gmiddotg-1 The highest YAASA achieved in this study was 83
gmiddotg-1 and the lowest YAAFA was 0 gmiddotg-1 as seen in Figure 43 these yields
were obtained in R3 when only CSL was used as the nitrogen source
Certain batch studies in A succinogenes also achieved a YAASA that exceeded
the maximum theoretical yield (see Section 26 Table 21) but those
studies used YE as the nitrogen source whereas in this study it was
copycopy UUnniivveerrssiittyy ooff PPrreettoorriiaa
54
achieved using only CSL Xi et al (2013) was the only study (batch
fermentation) mentioned in Table 21 that used only CSL as the nitrogen
source with glucose as the carbon substrate and exceeded the maximum
theoretical YAASA They attained a YAASA of 458 gmiddotg-1
copycopy UUnniivveerrssiittyy ooff PPrreettoorriiaa
55
R1
R2
R3
SAAA
FAAA
Figure 43 Experimental yields plotted with the maximum theoretical yields
profile of A succinogenes as YE in medium changes
Considering the flux at the pyruvate node YAAFA decreased and was
approaching zero as the CSL concentration in the nitrogen source
increased as seen in Figure 43 This could be an outcome of an increase in
either PDH or FDH activity or a decrease in activity for both PDH and PFL
resulting in an increased concentration of pyruvate in the product stream
Figure 44 illustrates how the pyruvate concentration increased as the CSL
concentration in the growth medium increased
0
05
1
15
2
25
3
35
4
45
5
55
6
65
7
75
8
85
9
0 10 20 30 40 50 60 70 80 90 100
Mas
s ra
tio
(g
g-1)
YE in Nitrogen Source
SAAA max (PFL)
FAAA max (PFL)
SAAA max (PDH)
FAAA max (PDH)
Figure 43 Experimental yields plotted with the maximum theoretical
yields profile of A succinogenes as YE in medium changes
The total nitrogen source (combination of YE and CSL) concentration in the
growth medium stayed constant at 16 gmiddotL-1 only the concentrations of YE
(powder form) and CSL(liquid form) varied
copycopy UUnniivveerrssiittyy ooff PPrreettoorriiaa
56
(See Table 31)
According to the redox balance it is expected that YAASA would increase as
YAAFA decreased and in this study the same development was observed
This could be linked to the increasing CSL concentration in the nitrogen
source in this study Bradfield amp Nicol (2014) suggested that there could be
an additional reducing power that produced the yields that were achieved
Using carbon and redox balances they noticed in their study that the
experimental YAASA values exceeded the predicted values suggesting that an
increase in PDH or FDH activity was not the only contribution to the
increase in YAASA and that additional reducing power was present The same
0
02
04
06
08
1
12
14
16
18
2
22
24
26
28
3
0 10 20 30 40 50 60 70 80 90 100
Co
nce
ntr
atio
n(g
L)
YE in Nitrogen Source
PYR R1
PYR R2
PYR R3
Figure 44 Pyruvate concentration profile of A succinogenes as YE in
medium changes
The total nitrogen source (combination of YE and CSL) concentration in the
growth medium stayed constant at 16 gmiddotL-1 only the concentrations of YE
(powder form) and CSL(liquid form) varied
copycopy UUnniivveerrssiittyy ooff PPrreettoorriiaa
57
explanation can be applied to this study as seen in Figure 43 The increase
in the YAASA is influenced by the decrease in the YAAFA ratio although it is not
sufficient to reach the expected ratios (according to the redox balance)
(See Table 31)
Figure 45 illustrates the NADH consumed per NADH produced for all
fermentation runs The NADH consumed (mol NADHmiddotcmol glucose-1) was
calculated as follow
09
1
11
12
13
14
15
16
17
18
19
2
0 10 20 30 40 50 60 70 80 90 100
NA
DH
Co
nsu
med
NA
DH
Pro
du
ced
of YE in Nitrogen source
NADH R1
NADH R2
NADH R3
Figure 45 NADH ratio consumed during production of A succinogenes
as YE in medium changes
The total nitrogen source (combination of YE and CSL) concentration in the
growth medium stayed constant at 16 gmiddotL-1 only the concentrations of YE
(powder form) and CSL(liquid form) varied
copycopy UUnniivveerrssiittyy ooff PPrreettoorriiaa
58
2119862119878119860119872119872119878119860
6∆119866119871119862119872119872119866119871119862
frasl (41)
Using Figure 2 Equation 41 was generated The only pathway that
consumed NADH was the path that converted PEP to SA where 2 molecules
of NADH were consumed to produce 1 molecule of SA
The NADH (mol NADHmiddotcmol glucose-1) produced was calculated as follow
(119862119878119860
119872119872119878119860+
2119862119860119860
119872119872119860119860minus
119862119865119860
119872119872119865119860)
6∆119866119871119862
119872119872119866119871119862
frasl (42)
The path from glucose to PEP produced 2 molecules of NADH per one
glucose molecule consumed and from PYR to AA 1 molecule of NADH per
one AA molecule was produced All the inputs for these equations were the
product concentrations obtained from the experimental runs
In Figure 45 it is noted that for all the fermentation runs the ratio of NADH
consumed to NADH produced increased as the concentration of YE in the
growth medium increased Nevertheless there is a clear dissimilarity
between the three runs In R3 the NADH production was higher than the
consumption for all growth media except when only CSL was used as the
nitrogen source R2 and R3 in comparison with R1 did not display a
massive imbalance in the NADH ratio and R1 was the only run where NADH
consumed over produced ratio consistently increased significantly as the
YE content in the growth medium increased It appears that the additional
NADH generation capability of R1 was not fully present in R2 and R3 and
possibly the strains used in R2 and R3 had altered production
copycopy UUnniivveerrssiittyy ooff PPrreettoorriiaa
59
characteristics compared with the original strain Nevertheless the R1
results coincide with the observation of both Bradfield amp Nicol (2014) and
Brink amp Nicol (2014) which was that there was an ldquoexcessrdquo of NADH that
was consumed during the maintenance phasenon-growth phase resulting
in a high YAASA
copycopy UUnniivveerrssiittyy ooff PPrreettoorriiaa
60
(See Table 31)
Figure 46 illustrates the yield of SA on glucose for R1 This graph shows
how the flux from glucose to SA increases as the CSL concentration in the
growth medium increases The trend observed in Figure 46 can be linked
to the ldquoexcessrdquo NADH that favours the production of SA Xi et al (2013)
observed that using only CSL as the nitrogen source provided high
selectivity towards SA (458 gmiddotgminus1) in comparison with other by-products
On the other hand CSL with heme provided a high glucose-to-SA flux
(072 gmiddotgminus1) and a much higher YAASA (493 gmiddotgminus1) A similar observation was
04
043
046
049
052
055
058
061
064
067
07
073
076
079
082
085
088
0 10 20 30 40 50 60 70 80 90 100
Mas
s ra
tio
(g
g-1)
YE in Nitrogen Source
SAGL R1
SAGL max(PFL)SAGL max(PDH)
Figure 46 Mass ratio of succinic acid over glucose profile of
A succinogenes as YE in medium changes
The total nitrogen source (combination of YE and CSL) concentration in the
growth medium stayed constant at 16 gmiddotL-1 only the concentrations of YE
(powder form) and CSL(liquid form) varied
copycopy UUnniivveerrssiittyy ooff PPrreettoorriiaa
61
documented by Yan et al (2013) Xi et al (2012) tried to explain this
observation in their study by stating that CSL contained cofactor biotin
which promoted the high SA selectivity
It is reasonable to postulate that there is an ingredient in CSL that may
trigger or enhance the activity of an additional metabolic pathway known
as the pentose phosphate pathway (PPP) to produce high carbon flux to SA
and high SA selectivity The idea of PPP as the source of the additional
reducing power stems from the findings of Bradfield and Nicol (2014)
Their analysis has shown that if the NADPH generated in the PPP cycle is
converted to NADH in order to supply redox to the SA pathway then high
SA selectivity can be achieved A succinogenes has the transhydrogenase
that allows PPP to be active and as mentioned earlier the presence or
absence of one or more ingredients in CSL may allow this enzyme to be
active consequently activating the PPP as well
Xi et al (2012) did mention biotin as the culprit for the high SA selectivity
They investigated the influence of biotin on A succinogenes growth and SA
productivity by varying the biotin concentration in a chemically defined
medium There was no SA production and cell growth was severely
inhibited when biotin was absent from the growth medium They reported
a high SA yield in their study but their data for AA concentration YGLAA and
YAASA were inconsistent with their observed product concentrations The
following example is extracted from their results In the experiment using
8 mg L-1biotin the glucose consumed was 300 g L-1 CSA = 194 g L-1 CAA =
32 g L-1 YGLAA = 0203 g g-1 and YAASA = 61 g g-1 However the YGLAA should
have been 0107 gmiddotg-1 if CAA was reported correctly but if the value for YAASA
was used as the value of CAA then the reported YGLAA would be correct
copycopy UUnniivveerrssiittyy ooff PPrreettoorriiaa
62
Nevertheless because of the inconsistency of the data it cannot be
concluded that biotin did play a role in gaining a high SA yield
Either the presence or absence of a component in a growth medium can
influence the enzymatic activity of a pathway and this concept should be
used to postulate explanations for the results obtained in this study
A breakdown of the constituents of CSL and YE could help in identifying the
ingredients in CSL that may have triggered or enhanced the activity of the
PPP Since both CSL and YE are complex media and there is no definite
information on the ingredients it is hard to fully confirm the following
theory
Xiao et al (2013) did a study on the constituents of CSL and stated that any
grade of CSL has the following amino acids isoleucine asparagine
methionine lysine proline and aspartic acid YE was reported by an
industrial data sheet (Organotechniereg SAS France) to have a high
content of the following alanine isoleucine leucine methionine
phenylalanine tyrosine and valine Although there are common amino
acids shared between CSL and YE there is one amino acid YE has that is
absent from CSL namely leucine This could be a reason why CSL could be
related to the excess NADH
Leucine in Ecoli is said to repress the transhydrogenase activity which in
turn represses the PPP (Gerolimatos amp Hanson 1978) This could be true
for A succinogenes since it also has the transhydrogenase for PPP as
mentioned in Section 23 A succinogenes with only YE as the nitrogen
source produced yields that were expected according to the carbon and
redox balance It can be postulated that as the YE content reduce the
copycopy UUnniivveerrssiittyy ooff PPrreettoorriiaa
63
leucine content decreased and the activity of the transhydrogenase
increased causing additional NADH to be generated from the enhanced
PPP resulting in improved yields
copycopy UUnniivveerrssiittyy ooff PPrreettoorriiaa
64
5 Conclusions
The complex nitrogen requirements of non-growing A succinogenes
biofilms were evaluated The study restricted itself to the use of YE and CSL
as nitrogen sources The SA productivity yields and titre were the variables
assessed
The YE concentration was decreased while simultaneously increasing the
CSL concentration in the medium Although this led to a decrease in the
steady state productivity of the organism overall SA selectivity increased
The production of certain metabolites such as SA and pyruvate also
increased while FA and AA concentrations decreased in the increasing
absence of YE This led to an increase in the SA to AA mass ratio and to a
decrease in the FA to AA mass ratio When zero amounts of YE were in the
growth medium no FA was produced
Three fermentation runs were performed The highest SA concentration in
this study was 2257gmiddotL-1 when only YE was used as the nitrogen source in
the growth medium and the highest SA productivity obtained in this study
was 158 gmiddotL-1middoth-1 when a combination of YE(625) and CSL(375) was
used as the nitrogen sourceThe highest SA to AA mass ratio achieved was
83 gmiddotg-1 when only CSL was used as the nitrogen source The FA to AA
mass ratio was consistently less than 077 gmiddotg-1 approaching 0 gmiddotg-1 as the
CSL concentration in the nitrogen source increased
Lower FA to AA mass ratio values were not fully responsible for the
increase in the SA to AA mass ratio The surplus NADH required is provided
copycopy UUnniivveerrssiittyy ooff PPrreettoorriiaa
65
by the activation or enhancement of an alternative metabolic pathway ie
the pentose phosphate pathway
The observations made in this study bolster the idea of using a combination
of YE and CSL where YE is the minor component as the nitrogen source for
commercialisation of bio-based succinic acid production using
Asuccinogenes as the catalyst
copycopy UUnniivveerrssiittyy ooff PPrreettoorriiaa
66
6 References
Allied Market Research (2014) ldquoWorld bio succinic acid market ndash
Opportunities and forecasts 2013ndash2020rdquo [Online]
httpswwwalliedmarketresearchcombio-succinic-acid-market
Beauprez JJ De Mey M and Soetaert WK (2010) ldquoMicrobial succinic acid
production natural versus metabolic engineered producersrdquo Process
Biochem451103ndash1114
Bechthold I Bretz K Kabasci S Kopitzky R and Springer A (2008)
ldquoSuccinic acid a new platform chemical for biobased polymers from
renewable resourcesrdquo Chem Eng Technol 31647ndash654
BioConSepT (2013) ldquoDetermination of market potential for selected
platform chemicalsrdquo [Online] httpwwwbioconsepteuwp-
contentuploadsBioConSepT_Market-potential-for-selected-platform-
chemicals_ppt1pdf
Bozell JJ and Petersen GR (2010) ldquoTechnology development for the
production of biobased products from biorefinery carbohydrates ndash the US
Department of Energyrsquos ldquoTop 10rdquorevisitedrdquo Green Chem 12539ndash554
Bradfield MFA and Nicol W (2014) ldquoContinuous succinic acid production
by Actinobacillus succinogenes in a biofilm reactor steady-state metabolic
flux variationrdquo Biochem Eng J 851ndash7
copycopy UUnniivveerrssiittyy ooff PPrreettoorriiaa
67
Brink HG and Nicol W (2014) ldquoSuccinic acid production with Actinobacillus
succinogenes Rate and yield analysis of chemostat and biofilm culturesrdquo
Microb Cell Fact 13111-122
Chen K Jiang M Wei P Yao J and Wu H (2010)rdquoSuccinic acid production
from acid hydrolysate of corn fiber by Actinobacillus succinogenesrdquo Appl
Biochem Biotechnol 160477ndash485
Cok B Tsiropoulos I Roes AL and Patel MK (2014) ldquoSuccinic acid
production derived from carbohydrates An energy and greenhouse gas
assessment of a platform chemical toward a bio-based economyrdquo Biofuels
Bioprod Bioref 816-29
Corona-Gonzaacutelez RI Bories A Gonzaacutelez Alvarez V and Pelayo-Ortiz C
(2008) ldquoKinetic study of succinic acid production by Actinobacillus
succinogenes ZT-130rdquo Process Biochem 431047ndash1053
Davis R Tao L Tan ECD Biddy MJ Beckham GT Scarlata C Jacobson J
Cafferty K Ross J Lukas J Knorr D and Schoen P(2013) ldquoProcess Design
and Economics for the Conversion of Lignocellulosic Biomass to
Hydrocarbons Dilute-Acid and Enzymatic Deconstruction of Biomass to
Sugars and Biological Conversion of Sugars to Hydrocarbonsrdquo NREL Report
No TP-5100-60223 [Online]
httpwwwnrelgovdocsfy14osti60223pdf
Gerolimatos B and Hanson RL (1978) ldquoRepression of Escherichia coli
pyridine nucleotide transhydrogenase by leucinerdquo J Bacteriol 134(2)394-
400
copycopy UUnniivveerrssiittyy ooff PPrreettoorriiaa
68
Grand-View-Research (2015) ldquoBio-Succinic Acid Market Analysis by
Application (BDO Polyester Polyols PBSPBST Plasticizers Alkyd Resins)
and Segment Forecasts to 2020ldquo [Online]
httpwwwgrandviewresearchcomindustry-analysisbio-succinic-acid-
market ISBN Code 978-1-68038-085-9
Guettler M Rumler D and Jain M (1999) ldquoActinobacillus succinogenes sp
nov a novel succinic-acid-producing strain from the bovine rumenrdquo Int J
Syst Bacteriol 49207ndash216
Gunnarsson IB Karakashev D and Angelidaki I (2014) ldquoSuccinic acid
production by fermentation of Jerusalem artichoke tuberhydrolysate with
Actinobacillus succinogenes 130Zrdquo Ind Crops-Prod 62125ndash129
ICIS (2012)rdquoChemical industry awaits for bio-succinic acid potentialrdquo
[Online]
httpwwwiciscomArticles201201309527521chemical+industry+
awaits+for+biosuccinic+acid+potentialhtml
Jiang M Chen K Liu Z Wei P Ying H and Chang H (2010) ldquoSuccinic acid
production by Actinobacillus succinogenes using spent Brewers yeast
hydrolysate as a nitrogen sourcerdquo Appl Biochem Biotechnol 160 244ndash
254
Jiang M Dai W Xi Y Wu M Kong X Ma J Min Zhang M Chen K and Wei
P (2014) ldquoSuccinic acid production from sucrose by Actinobacillus
succinogenes NJ113rdquo BioresourTechnol 153327ndash332
copycopy UUnniivveerrssiittyy ooff PPrreettoorriiaa
69
Kaneuchi C Seki M and Komagata K (1988) ldquoProduction of succinic acid
from citric acid and related acids by Lactobacillus strainsrdquo Appl Environ
Microbiol 543053ndash3056
Kasprow RP Lange AJ and Kirwan DJ (1998)ldquoCorrelation of fermentation
yield with yeast extract composition as characterized by near-infrared
spectroscopyrdquo Biotechnol Prog 14318minus325
Kwon S Lee PC Lee EG Chang YK and Chang N (2000) ldquoProduction of
lactic acid by Lactobacillus rhamnosus with Vitamin-supplemented soybean
hydrolysaterdquo Enzyme Microb Technol 26209-215
Lee PC Lee WG Kwon S Lee SY and Chang HN (2000) ldquoBatch and
continuous cultivation of Anaerobiospirillum succiniciproducens for the
production of succinic acid from wheyrdquo Appl Microbiol Biotechnol 5423ndash
27
Lee PC Lee SY Hong SH and Chang HN (2002) ldquoIsolation and
characterization of a new succinic acid-producing bacterium Mannheimia
succiniciproducens MBEL55E from bovine rumenrdquo Appl Microbiol
Biotechnol 58(5)663ndash668
Lin H Bennett GN and San KY (2005) ldquoFed-batch culture of a
metabolically engineered Escherichia coli strain designed for high-level
succinate production and yield under aerobic conditions rdquoBiotechnol
Bioeng 90775ndash779
copycopy UUnniivveerrssiittyy ooff PPrreettoorriiaa
70
Lin SKC Du C Koutinas A Wang R amp Webb C (2008) ldquoSubstrate and
product inhibition kinetics in succinic acid production by Actinobacillus
succinogenesrdquo Biochem Eng J 41(2)128ndash135
Liu YP Zheng P Sun ZH Ni Y Dong JJ and Zhu LL (2008) ldquoEconomical
succinic acid production from cane molasses by Actinobacillus
succinogenesrdquo Bioresour Technol 991736ndash1742
Maharaj K Bradfield MFA and Nicol W (2014) ldquoSuccinic acid-producing
biofilms of Actinobacillus succinogenes Reproducibility stability and
productivityrdquo Appl Microbiol Biotechnol 98(17)7379ndash7386
McKinlay JB Zeikus JG amp Vieille C (2005) ldquoInsights into Actinobacillus
succinogenes fermentative metabolism in a chemically defined growth
mediumrdquo Appl Environ Microbiol 71(11) 6651ndash6656
McKinlay JB Vieille C and Zeikus JG (2007) ldquoProspects for a bio-based
succinate industryrdquo Appl Microbiol Biotechnol 76727ndash740
McKinlay JB Laivenieks M Schindler BD McKinlay A Siddaramappa S
Challacombe JF Lowry SR Clum A Lapidus AL and Burkhart KB (2010)
ldquoA genomic perspective on the potential of Actinobacillus succinogenes for
industrial succinate productionrdquo BMC Genomics 11 (1) 680
Nghiem NP Davison BH Suttle BE and Richardson GR (1997)
ldquoProduction of succinic acid by Anaerobiospirillum succiniciproducensrdquo Appl
Biochem Biotechnol 63ndash65 565ndash576
copycopy UUnniivveerrssiittyy ooff PPrreettoorriiaa
71
Oh I Lee H Park C Lee SY and Lee J (2008) ldquoSuccinic acid production by
continuous fermentation process using Mannheimia succiniciproducens
LPK7rdquo J Microbiol Biotechnol 18908ndash912
Organotechniereg SAS (2008) ldquoTechnical Data Sheet Yeast Extract 19512rdquo
[Online] httpwwworganotechniecomdoc_en19512pdf [accessed 22
November 2015]
Rosche B Li XZ Hauer B Schmid A and Buehler K (2009) ldquoMicrobial
biofilms A concept for industrial catalysisrdquo Trends Biotechnol 27636ndash43
DOI 101016jtibtech200908001
Ruumlhl M Le Coq D Aymerich S and Sauer U (2012) ldquo13C-flux analysis
reveals NADPH balancing transhydrogenation cycles in stationary phase of
nitrogen-starving Bacillus subtilisrdquo JBiolChem 287(33) 27959ndash27970
Shen N Qin Y Wang Q Liao S Zhu J Zhu Q Mi H Adhikari B Wei Y and
Huang R (2015) ldquoProduction of succinic acid from sugarcane molasses
supplemented with a mixture of corn steep liquor powder and peanut meal
as nitrogen sources by Actinobacillus succinogenesrdquo Appl Microbiol 60544-
551
Shuler M and Kargi F (2002) ldquoBioprocess Engineering Basic Conceptsrdquo 2nd
ed Prentice Hall New York
Song H and Lee SY (2006) ldquoProduction of succinic acid by bacterial
fermentationrdquo Enzyme MicrobTechnol 39-(3)352ndash361
copycopy UUnniivveerrssiittyy ooff PPrreettoorriiaa
72
Spector MP (2009) ldquoMetabolism central (intermediary)rdquo in M Schaechter
(Ed) Encyclopedia of Microbiology 3rd ed Academic Press Oxford 242ndash
264
Sridee W Laopaiboon L Jaisil P and Laopaiboon P (2011) ldquoThe use of
dried spent yeast as a low-cost nitrogen supplement in ethanol
fermentation from sweet sorghum juice under very high gravity
conditionsrdquo Electron JBiotechnol14(6)1-15
Transparency-Market-Research (2014) ldquoSuccinic acid market for 14-bdo
resin coatings dyes amp inks pharmaceutical polyurethane food
plasticizers cosmetics solvents amp lubricants and de-icing solutions
applications-Global industry analysis size share growth trends and
forecast 2012ndash2018rdquo [Online]
httpwwwtransparencymarketresearchcomsuccinic-acidhtml
Urbance SE Pometto AL DiSpirito A and Demirci A (2003) ldquoMedium
evaluation and plastic composite support ingredient selection for biofilm
formation and succinic acid production by Actinobacillus succinogenesrdquo
Food Biotechnol 17(1)53ndash65
Urbance SE Pometto AL DiSpirito A and Denli Y (2004) ldquoEvaluation of
succinic acid continuous and repeat-batch biofilm fermentation by
Actinobacillus succinogenes using plastic composite support bioreactorsrdquo
ApplMicrobiolBiotechnol 65 (6)664ndash70
Van der Werf MJ Guettler MV Jain MK and Zeikus JG (1997)
ldquoEnvironmental and physiological factors affecting the succinate product
copycopy UUnniivveerrssiittyy ooff PPrreettoorriiaa
73
ratio during carbohydrate fermentation by Actinobacillus sp 130Zrdquo Arch
Microbiol 167332ndash342
Van Heerden CD and Nicol W (2013a) ldquoContinuous and batch cultures of
Escherichia coli KJ134 for succinic acid fermentation Metabolic flux
distributions and production characteristicsrdquo Microb Cell Fact 12-(1) 80-
90
Van Heerden CD and Nicol W (2013b) ldquoContinuous succinic acid
fermentation by Actinobacillus succinogenesrdquo Biochem EngJ 735ndash11
Villadsen J Nielsen J amp Lideacuten G (2011) ldquoBioreaction Engineering
Principlesrdquo 3rd ed Springer US Boston MA
Werpy T and Petersen G (2004) ldquoTop value added chemicals from
biomass Vol 1 Results of screening for potential candidates from sugars
and synthesis gasrdquo National Renewable Energy Lab Golden CO US
Xi Y Chen K Xu R Zhang J Bai X Jiang M Wei P and Chen J (2012)
ldquoEffect of biotin and a similar compound on succinic acid fermentation by
Actinobacillus succinogenes in a chemically defined mediumrdquo Biochem Eng
J 6987ndash92
Xi Y Chen K Dai W Ma J Zhang M Jiang M Wei P and Ouyang PK
(2013) ldquoSuccinic acid production by Actinobacillus succinogenes NJ113
using corn steep liquor powder as nitrogen sourcerdquo Bioresour Technol
136 775ndash779
copycopy UUnniivveerrssiittyy ooff PPrreettoorriiaa
74
Xiao X Hou Y Liu Y Liu Y Zhao H Dong L Du J Wang Y Bai G and Luo
G (2013) ldquoClassification and analysis of corn steep liquor by UPLCQ-TOF
MS and HPLCrdquo Talanta 107344ndash348
Xu J and Guo B (2010) ldquoMicrobial succinic acid its polymer poly(butylene
succinate) and applicationsrdquo Plastics from Bacteria Natural Functions and
Applications Microbiology Monographs Vol 14 Springer Verlag
BerlinHeidelberg DOI 101007978-3-642-03287514
Yan Q Zheng P Dong JJ and Sun ZH (2013) ldquoA fibrous bed bioreactor to
improve the productivity of succinic acid by Actinobacillus succinogenesrdquo
JChemTechnolBiotechnol 89(11)1760-1766DOI101002jctb4257
Yan Q Zheng P Tao S and Donga J (2014) ldquoFermentation process for
continuous production of succinic acid in a fibrous bed bioreactorrdquo
Biochem Eng J 9192-98
Zeikus JG Jain MK and Elankovan P (1999) ldquoBiotechnology of succinic acid
production and markets for derived industrial productsrdquo Appl Microbiol
Biotechnol 51545ndash552
Zheng P Dong J Sun Z Ni Y and Fang L (2009) ldquoFermentative production
of succinic acid from straw hydrolysate by Actinobacillus succinogenesrdquo
Bioresour Technol 100 2425ndash2429
copycopy UUnniivveerrssiittyy ooff PPrreettoorriiaa

Figure 43 Experimental yields plotted with the maximum theoretical
yields profile of A succinogenes as YE in medium changes 55
Figure 44 Pyruvate concentration profile of A succinogenes as YE in
medium changes 56
Figure 45 NADH ratio consumed during production of A succinogenes
as YE in medium changes 57
Figure 46 Mass ratio of succinic acid over glucose profile of
A succinogenes as YE in medium changes 60
copycopy UUnniivveerrssiittyy ooff PPrreettoorriiaa
List of Tables
Table 21 Batch fermentation studies of A succinogenes using different
nitrogen sources namely YE and CSL 24
Table 22 Continuous fermentation studies of A succinogenes using
different nitrogen sources namely YE and CSL 29
Table 31 Specifications of feed mediaa used during fermentations 32
Table 32 Summary of fermentation runs performed 40
Table 41 Steady state data for the three continuous fermentation runs
46
copycopy UUnniivveerrssiittyy ooff PPrreettoorriiaa
Nomenclature
CAA concentration of acetic acid (gmiddotL-1)
CFA concentration of formic acid (gmiddotL-1)
CS0 initial glucose concentration in feed medium (gmiddotL-1)
CSA concentration of succinic acid (gmiddotL-1)
Df dilution rate based on feed (h-1)
DT total dilution rate(h-1)
MMAA molar mass of acetic acid (gmiddotgmol-1)
MMFA molar mass of formic acid (gmiddotgmol-1)
MMSA molar mass of succinic acid (gmiddotgmol-1)
PSA succinic acid productivity
R1 fermentation run 1
R2 fermentation run 2
R3 fermentation run 3
copycopy UUnniivveerrssiittyy ooff PPrreettoorriiaa
vvm volumetric flowrate of gas per reactor volume
YAASA yieldratio of succinic acid on acetic acid (gmiddotg-1)
YAAFA yieldratio of formic acid on acetic acid (gmiddotg-1)
YGLSA yieldratio of succinic acid on glucose (gmiddotg-1)
Abbreviations
AA AcA acetic acid
Ac-CoA acetyl coenzyme A
ATP adenosine triphosphate
CSL corn steep liquor
DCW dry cell weight
FA formic acid
FDH formate dehydrogenase
FDH-H formate dehydrogenase activity
copycopy UUnniivveerrssiittyy ooff PPrreettoorriiaa
FHL formate-hydrogen lyase
Fum fumarate
GLC Glu glucose
HPLC high-performance liquid chromatography
Mal malate
NADH nicotinamide adenine dinucleotide
NADPH nicotinamide adenine dinucleotide phosphate
OXA oxaloacetate
PDH pyruvate dehydrogenase
PEP phosphoenolpyruvate
PFL pyruvate-formatelyase
PPP pentose phosphate pathway
PYR Pyr pyruvate
RI refractive index
copycopy UUnniivveerrssiittyy ooff PPrreettoorriiaa
SA succinic acid
TCA tricarboxylic acid
TSB tryptone soy broth
YE yeast extract
Greek letters
ΔGLC glucose consumed (gmiddotL-1)
copycopy UUnniivveerrssiittyy ooff PPrreettoorriiaa
1
1 Introduction
Modern civilisation is highly dependent on chemical products and fuels
derived from non-renewable raw materials such as crude oil and natural
gas However the depletion of non-renewable raw materials and the
potentially negative long-term environmental impacts caused by the
processing of the raw materials is forcing industries to develop alternative
routes to produce the fuel and chemicals that are essential for current
society (Cok et al 2014)
An alternative that is fast growing in popularity is the replacement of non-
renewable raw materials such as fossil fuels with renewable biomass In
2004 the US Department of Energy (Werpy amp Peterson 2004) identified a
wide range of chemicals that could be produced from renewable biomass
and only 12 of them were listed as top platform chemicals In 2010 the list
was revised and the top 10 chemicals that had the biggest market potential
were declared (Bozell amp Peterson 2010) Succinic acid (SA) was shortlisted
as one of those top 10 chemicals (Bozell amp Peterson 2010) and its
recognition as a potential platform chemical by the US Department of
Energy resulted in opportunities for SA to replace petroleum-based
platform chemicals such as maleic anhydride and adipic acid (Zeikus Jain amp
Elankovan 1999)
At present commercial production of bio-SA is done mainly by four
companies BioAmber Reverdia Myriant and Succinity which Succinity is
the largest in terms of production capacity (Grand-View- Research 2014)
In order for fermentation processes to be economically competitive with
petrochemicals-derived products research on the biological production of
copycopy UUnniivveerrssiittyy ooff PPrreettoorriiaa
2
SA has become extensive over the years because of the need to understand
and refine the process of producing bio-SA
In the literature the choices of microbial organisms available for bio-based
SA production are very diverse although most natural production hosts
described are capnophilic microorganisms (Beauprez De Mey amp Soetaert
2010) A succinogenes stood out as one of the most favourable strains for
commercial production due to its ability to produce SA naturally at high
titres (Zeikus et al 1999) and its tolerance to high acid concentrations (Lin
et al 2008) However one major drawback of Actinobacillus succinogenes
is the auxotrophic requirement for amino acids and vitamins (McKinlay
Zeikus amp Vieille 2005) In fermentation studies usually the essential amino
acids and vitamins are provided by adding yeast extract (YE) or corn steep
liquor (CSL) to the feed medium but in an industrial setup addition of YE
would be highly unfeasible because of the estimated cost which ranges
between US$350kg and US$67kg (Kwon et al 2000 Sridee et al 2011)
For the successful commercial exploitation of A succinogenes the cost of
the fermentation feedstock and the availability of essential and beneficial
ingredients that will influence the conversion process should be taken into
account Since using only YE is not economically feasible cheaper sources
of these critical components are hence required CSL is the first ideal
candidate as its market value ranges between US$007kg and
US$0075kg (Davis et al 2013)
Most fermentation studies done on A succinogenes employ a batch mode of
operation (Beauprez et al 2010) in which final concentrations yield and
productivity are used as performance indicators To date all publications in
which the complex nitrogen source was varied have used batch
copycopy UUnniivveerrssiittyy ooff PPrreettoorriiaa
3
fermentation (Xi et al 2013 Jiang et al 2010 Shen et al 2015 Yan et al
2013) Nevertheless none of these studies distinguished between the
nitrogen requirements for growth-related and non-growth-related SA
production It is well known that the specific growth rate of A succinogenes
is severely inhibited by the accumulation of organic acids in the
fermentation broth (Corona-Gonzaacutelez et al 2008) and that the specific
growth rate approaches zero above an SA titre in the vicinity of 10-15 gmiddotL-1
(Brink amp Nicol 2014) Most batch fermentations reach a final SA
concentration well in excess of this critical SA concentration thus
indicating that a significant fraction of the SA in these studies is produced
under non-growth or maintenance conditions and that the nutrient
requirements for the non-growth production phase might be different to
those of the growth phase in all likelihood less severe
In order to study the non-growth nutrient requirements of A succinogenes
steady state would be ideal this can be achieved through a continuous
mode of operation Maharaj Bradfield and Nicol (2014) have clearly
demonstrated that prolonged steady state operation of A succinogenes
under non-growth conditions is feasible and stable The concentrations of
organic acids in the fermentation broth can be manipulated by altering the
throughput (or dilution rate) in order to induce non-growth production of
SA Another beneficial factor with continuous operations is biofilms which
are unavoidably formed in long-term continuous fermentations and can
significantly enhance productivity as observed by Van Heerden and Nicol
(2013b)
This study aims to evaluate the complex nitrogen requirements of non-
growing A succinogenes biofilms Nitrogen sources used in this study will
copycopy UUnniivveerrssiittyy ooff PPrreettoorriiaa
4
be restricted to YE and CSL since they are the most common sources of
nitrogen sources used in the literature and because of the potential
economic advantage of using CSL Initial biomass accumulation will be
achieved by using only YE for rapid growth of the micro-organism Once
non-growth production of SA commences the YE content will be reduced
and the CSL content will be increased The total complex nitrogen source
concentration in the feed will be maintained at a constant value of 16 gmiddotL-1
throughout the experiments however the percentage of YE in the total
complex nitrogen source will decrease over time Throughout the study the
change in nitrogen source will be referred to as YE in the nitrogen
source At a fixed dilution rate (at a chosen initial SA concentration) for the
whole run productivity and product distribution as a function of YE in
the nitrogen source will be assessed
copycopy UUnniivveerrssiittyy ooff PPrreettoorriiaa
5
2 Literature survey
21 Bio-based chemicals
Bio-based chemicals are platform and intermediate chemicals derived from
biomass feedstocks The US Department of Energy (DOE) identified 300
potential bio-based platform chemicals but most of the proposed
chemicals did not have sufficient market potential nor was it economical to
produce them Only 30 chemicals were considered to be relevant since they
had the potential to replace non-bio-based chemicals and out of those 30
chemicals only 12 building block chemicals were identified as being the
most important because of their potential market chemical derivatives and
synthesis pathways (Werpy amp Peterson 2004)
The importance for bio-based production of fuels and chemicals arises
from the need to move away from petroleum-based production The
depletion of non-renewable feedstocks and the strong demand by
consumers for environmentally friendly energy sources has made the
production of fuels and chemicals from biomass feedstocks to be a
sustainable alternative to the petrochemical production route Government
and industry are now interested in bio-based resources and production and
they understand that to form a sustainable global economy a bio-based
industry should substitute the current petroleum-based routes to produces
fuels and chemicals (Cok et al 2014) However to have a bio-based
economy for the development of highly efficient and cost effective bio-
refineries is essential Petrochemical production has been optimised and
refined over long period of time making it a cheaper option compared with
the relatively new bio-based production Therefore to enhance the
development of a bio-based economy it is essential that the biological
copycopy UUnniivveerrssiittyy ooff PPrreettoorriiaa
6
processes are understood refined and optimised through continuous
research and development (Cok et al 2014)
22 Succinic acid
221 Application of succinic acid
One of the top 12 bio-based platform chemicals recognized by the US DOE
was succinic acid (SA) (Werpy amp Peterson 2004 Bozell amp Peterson 2010)
See Figure 21 for the molecular structure of SA Most of the SA produced to
meet global demand is manufactured through the petroleum route ie it is
produced by the partial oxidation of butane followed by hydrogenation of
the intermediate product which is maleic anhydride However the
expensive conversion costs and non-renewability of this petroleum-based
route for producing SA has limited the SA market to low-cost bulk
application (Xu amp Guo 2010 Beauprez et al 2010)
Figure 21 Succinic acid molecule
Traditionally the application of SA has been limited mainly to four
functional regions its largest area of application is as a surfactant an
additive to a detergent and a foaming agent the second is as an ion chelator
copycopy UUnniivveerrssiittyy ooff PPrreettoorriiaa
7
for preventing corrosion and spot corrosion of metals in the electroplating
industry the third is as an acidulant which is a pH regulator and flavouring
agent in the food industry and the fourth area of application region is in
the pharmaceutical industry specifically in the production of antibiotics
amino acids and vitamins (Xu amp Guo 2010) As a platform chemical it is
also used as a precursor of many commodity or specialty chemicals as seen
in Figure 22 (Zeikus et al 1999)
Figure 22Various chemicals and products derived from succinic acid
(Zeikus et al 1999)
Nevertheless there is potential for the bulk application of SA The key to
the growth of the SA market lies in its derivatives The diamines and diols
that are derived from SA can be used as monomer units of a variety of
Figure 22 Various chemicals and products derived from succinic acid
(Zeikus et al 1999)
copycopy UUnniivveerrssiittyy ooff PPrreettoorriiaa
8
plastics such as polyesters polyamides and polyester amides (Bechthold et
al2008) Among them is the SA derivative 14-butanediol (BDO) It is a
platform chemical for tetrahydrofuran (THF) gamma-butyrolactone (GBL)
and polymers such as polybutylene terephthalate (PBT) and polyurethane
(PU) These chemicals are widely used in the production of engineering
thermoplastics and elastic fibres and because of these applications the
BDO market is expected to increase as the demand for THF and spandex for
sports apparel increase (Grand- View- Research 2014) Another derivative
of SA that is predicted to increase the SA global market is the biodegradable
polybutylene succinate (PBS) and its copolymers PBS polymers have a
range of applications as supermarket bags packaging film mulch film and
other disposable articles Owing to the steady growth of the market for
biodegradable plastic the demand for PBS is expected to increase rapidly
which in turn could grow the SA market (ICIS 2012)
222 Succinic acid market
The global SA market in 2011 was estimated to be worth US$240 million
and it is projected to reach US$836 million by 2018 (Transparency-Market-
Research 2014) due to the development of the bio-SA Consumption of
petroleum-based SA in manufacturing various other chemicals is restricted
due to unpredictability of price and carbon footprints These concerns
however are advancing the progression of biological manufacturing of SA
The major drivers for this growth will be the high cost of crude oil the rise
in carbon footprints and an interest in producing ldquogreenrdquo chemicals Newer
applications of SA as PBS BDO plasticizers and polyesters polyols will fast-
track the future growth of the bio-SA market However the higher price of
bio-SA and the lengthy extraction processes are the primary factors that
copycopy UUnniivveerrssiittyy ooff PPrreettoorriiaa
9
will restrain the market growth for the next few years although the market
is expected to grow at a significant rate over the next seven years (Allied
Market Research 2014)
At present there are numerous institutions researching the development of
SA through bio-based raw materials and there are companies that are
already manufacturing bio-SA for commercial purposes The list of major
companies involved in the production of bio-SA includes BioAmber
Myraint DSM Mitsui amp Co Mitsubishi BASF Roquette Freacuterese SA Purac
and Reverdia In 2013 the global bio-SA market volume was approximately
51 100 tons and in seven years it is expected to reach a market volume of
710 000 tons In that same year BDO is predicted to emerge as the largest
application segment for bio-SA as it will replace maleic anhydride in the
production of BDO every 1MT of maleic anhydride will be replaced by
12MT of bio-SA (Allied Market Research 2014)
223 Bio-based SA production
Bio-SA which has the same structure as petroleum-based SA is produced
by the fermentation of a carbohydrate using a natural producer or an
engineered organism The feedstock used for the production of bio-based
succinic acid can be wheat maize glucose lignocellulosic-derived sugar or
sorghum grain processed to starch (BioConSepT 2013)
Compared with the petroleum-based process the fermentation process has
the advantages of mild operating conditions independence of the fossil
feedstock and fixation of CO2 and with development of genetic engineering
metabolic modification of microbial strains and improvement of
copycopy UUnniivveerrssiittyy ooff PPrreettoorriiaa
10
purification technology the fermentative production of SA from renewable
resources can be more cost-effective than the fossil-based processes (Xu amp
Guo 2010)
To date various microorganisms have been reported to produce SA such
as typical gastrointestinal bacteria and rumen bacteria and some
lactobacillus strains (Kaneuchi Seki amp Komagata 1988 Beauprez et al
2010) Among them Actinobacillus succinogenes (Guettler Rumler amp Jain
1999) Anaerobiospirillum succiniciproducens (Oh et al 2008) Mannheimia
succiniciproducens (Lee et al 2000) and genetically modified Escherichia
coli (Lin Bennet amp San 2005) are the most promising strains for producing
SA at high yields Fungi species such as Aspergillus niger Aspergillus
fumigatus Byssochlamys nivea Lentinus degener Paecilomyces varioti
Penicillium viniferum and yeast Saccharomyces cerevisia also produce
succinic acid but not in high concentrations or yields (Song amp Lee 2006)
Nevertheless for industrial applications A succinogenes stands out because
it is by far the most studied wild strain (Brink amp Nicol 2014) and its ability
to produce high concentrations of SA naturally from a broad range of
carbon sources (Guettler et al 1999 McKinlay Vieille amp Zeikus 2007)
further makes it ideal for commercial applications
23 Actinobacillus succinogenes
231 Description of microorganism
A succinogenes a Gram-negative rod-shaped and non-motile bacterium
isolated from bovine rumen (Guettler et al 1999) is considered to be one
copycopy UUnniivveerrssiittyy ooff PPrreettoorriiaa
11
of the top natural SA producing microorganisms (McKinlay et al 2007
Brink amp Nicol 2014) It produces SA as part of a mixed acid fermentation in
which acetic acid (AA) formic acid (FA) and ethanol are the by-products It
is capable of digesting a wide range of carbon sources such as glucose
fructose mannitol arabitol sorbitol sucrose xylose and arabinose under
anaerobic conditions (Van der Werf et a 1997) but most laboratory
experiments use glucose fructose xylose and sucrose as carbon substrates
A succinogenes grows optimally at moderate temperatures (37 degC to 39 degC)
and it is facultative anaerobic ie it can survive in the presence or absence
of oxygen Furthermore it is capnophilic because its growth is enhanced at
increased CO2 concentrations (Guettler et al 1999) and it is a
chemoheterotroph that grows optimally at pH ranging from 6 to 74
232 Metabolic pathway
As stated earlier A succinogenes is a promising candidate for industrial SA
production However in addition to producing SA it also produces formic
acid (FA) acetic acid (AA) and sometimes ethanol The summarised version
of the metabolic pathway for A succinogenes is shown in Figure 23
A succinogenes ferments glucose to phosphoenolpyruvate (PEP) by
glycolysis PEP is thought to serve as the point of divergence between the
FA AA and ethanol producing pathway (C3 pathway) and the SA producing
(C4) pathway The path from glucose to PEP is neutral overall in terms of
adenosine triphosphate (ATP) production but one-third of nicotinamide
adenine dinucleotide (NADH) is produced per cmol of glucose consumed
copycopy UUnniivveerrssiittyy ooff PPrreettoorriiaa
12
C4 metabolic pathway (reverse tricarboxylic pathway)
Overall this pathway leads to the formation of SA and two molecules of
NADH and one molecule of CO2 must be consumed to form one molecule of
SA Ideally one would prefer the carbon flux to follow this route to attain
homosuccinate production
The key enzyme in this pathway is PEP carboxykinase because it pushes
the carbon flux from PEP to oxaloacetate which later on becomes SA This
enzyme is regulated by CO2 levels ie the level of CO2 available to A
succinogenes will have an influence on the SA production of the organism
(Van der Werf et al 1997) Hence it will be imperative to achieve correct
extracellular and intracellular CO2 levels during SA production
C3 metabolic pathway
However the C3 pathway cannot be avoided due to the redox requirement
of the cell In this pathway PEP is converted to pyruvate by pyruvate
kinase generating one molecule of ATP during the process Pyruvate is
then converted to acetyl-CoA by either pyruvate dehydrogenase (PDH)
andor pyruvate-formatelyase (PFL)
Pyruvate conversion with PDH results in one molecule of CO2 and one
molecule of NADH being formed alongside one molecule of AA With PFL
FA is produced instead of CO2 and NADH but FA can be further broken
down to CO2 and NADH by the enzyme formate dehydrogenase (FDH)
copycopy UUnniivveerrssiittyy ooff PPrreettoorriiaa
13
The FDH activity (encoded by the fdhF gene in A succinogenes) is known to
occur only under the following conditions (Spector 2009)
Absence of an electron acceptor such as oxygen or nitrate
Acidic pH conditions
Presence of FA
PFL expression is stated to be dependent upon two glycolysis enzyme
activities namely phosphoglucoisomerase and phosphofructokinase
Interestingly the expression of PFL and FDH enzymes is reported to
increase under carbon energy source starvation (Spector 2009)
Acetyl-CoA is the branch point at which both ethanol and AA are later
formed In this process a molecule of ATP is produced per molecule of AA
formed For one molecule of ethanol formed two molecules of NADH are
absorbed However ethanol formation can be reduced if there is
intracellular availability of CO2 to the organism (Van der Werf et al 1997)
copycopy UUnniivveerrssiittyy ooff PPrreettoorriiaa
14
Figure 23 Simplified metabolic network of A succinogenes (based on
McKinlay et al (2007)
copycopy UUnniivveerrssiittyy ooff PPrreettoorriiaa
15
Pentose phosphate pathway (PPP)
Figure 23 gives a simplified version of the metabolic pathway of A
succinogenes However several studies have noted that the pentose
phosphate pathway is an additional pathway for the A succinogenes (Brink
amp Nicol 2014 Bradfield amp Nicol 2014 Van der Werf et al 1997 McKinlay
et al 2007 McKinlay et al 2005) McKinlay (2007) stated that the PPP
only contributed 20 to the NADPH required for the organismrsquos growth
But Bradfield amp Nicol (2014) and Brink amp Nicol (2014) postulated that the
contribution of the PPP could increase and be more than predicted when
the organism enters the maintenance phase or non-growth phase
According to Ruumlhl et al (2012) a resting non-growing Bacillus subtilis cell
showed constant metabolic activity without cell growth which lead to an
apparent overproduction of nicotinamide adenine dinucleotide phosphate
(NADPH) (via the PPP) which is then converted by transhydrogenase into
NADH Bradfield amp Nicol (2014) claim that it is possible that this can also
occur with A succinogenes as it does possess the transhydrogenase The
analysis by Bradfield amp Nicol (2014) indicated an under-prediction of the
YAASA for the growth metabolism (associated with NADH ldquolossesrdquo) while an
over-prediction of the YAASA is achieved for the maintenance metabolism
(associated with NADH ldquogainrdquo) This could imply that different metabolic
pathways are employed under growth and maintenance conditions
Medium contributions were previously considered as the source for the
NADH disparities during the maintenance phase but this reasoning can be
ruled out given the results of the study done by Brink amp Nicol (2014) in
which the same medium resulted in opposite redox balance trends with
regard to the growth and non-growth phases
copycopy UUnniivveerrssiittyy ooff PPrreettoorriiaa
16
24 SA yield considerations
The theoretical maximum yield of SA on a carbon substrate through
fermentation can be determined by considering the net metabolic pathway
involved and a redox balance as illustrated by Villadsen Nielsen amp Lideacuten
(2011 159-163) The overall black box stoichiometry in converting glucose
to SA with no biomass and no by-product formation is
C6H12O6 + 120788
120789CO2rarr
120783120784
120789C4H6O4 +
120788
120789H2O (21)
From Equation 21 the theoretical maximum yield of succinic acid on
glucose (YGLSA) is 112 gmiddotg-1 However it is not possible to achieve the
maximum yield because actual SA yield will depend on the active metabolic
pathway of the organism and the associated product distribution To
determine the maximum YGLSA possible with by-product formation a redox
balance is required
Pyruvate metabolism
Assuming that there is no carbon flux to cell growth and if only the PDH
enzyme is active or FDH converting all FA the overall black box
stoichiometry in converting glucose to SA and AA with no biomass
formation is
C6H12O6 + 120784
120785CO2rarr
120786
120785C4H6O4 +
120784
120785C2H4O2 (22)
Since no FA is formed the YAAFA will be 0 gmiddotg-1 This pathway releases one
molecule of NADH for every molecule of AA produced (see Figure 24) The
copycopy UUnniivveerrssiittyy ooff PPrreettoorriiaa
17
NADH would be consumed by the C4 pathway to produce SA and then the
theoretical YGLSA would be 088 gmiddotg-1
Figure 24 Simplified metabolic network of A succinogenes (PDH
active)
On the other hand if only the PFL enzyme is active both FA and AA will be
formed (see Figure 25) The overall black box stoichiometry in converting
glucose to SA AA and FA with no biomass formation is
C6H12O6 + CO2rarrC4H6O4 +C2H4O2 + CH2O2 (23)
For every molecule of FA formed a molecule of AA will be produced so the
YAAFA will be 076 gmiddotg-1 As a result YGLSA will be 066 gmiddotg-1 If both PFL and
FDH enzymes are active then FA will be broken down to produce CO2 and
NADH which will result in YAAFA being 0 gmiddotg-1 and YGLSA being 088 gmiddotg-1
copycopy UUnniivveerrssiittyy ooff PPrreettoorriiaa
18
Figure 25 Simplified metabolic network of A succinogenes (PFL
active)
Nevertheless as mentioned by Van Heerden amp Nicol (2013a)the maximum
theoretical yield of SA can be obtained through the metabolic engineering
of A succinogenes This can be achieved by manipulating the organism to
use the oxidative part of the tricarboxylic acid (TCA) cycle under anaerobic
conditions (see Figure 26a)
copycopy UUnniivveerrssiittyy ooff PPrreettoorriiaa
19
Figure 26 (a) Simplified metabolic network of A succinogenes
(oxidative TCA cycle active) (b) Simplified metabolic network of A
succinogenes (glyoxylate bypass active)
Alternatively the glyoxylate bypass can be utilised (Figure 26b) to give the
same result For both these scenarios the mass-based SA-to-glucose ratio is
112 gmiddotg-1 which is the maximum theoretical yield of SA that can be
achieved
25 Nitrogen source for A succinogenes
The composition of the growth medium is a key factor in microbial
fermentations An important element of the fermentation medium which
will be essential for the growth of the organism is the nitrogen source
In the rumen A succinogenes is surrounded by a massive source of
nutrients which allow the organism to thrive But outside the rumen more
specifically in the laboratory or in an industrial fermentation setup
copycopy UUnniivveerrssiittyy ooff PPrreettoorriiaa
20
nutrients important for growth of the organism must be provided Since
A succinogenes is auxotrophic it requires certain amino acids and vitamins
to be provided for growth and SA production McKinlay et al (2010)
determined the essential vitamins required for the growth to be nicotinic
acid pantothenate pyridoxine and thiamine and the needed amino acids to
be cysteine glutamate and methionine Furthermore they concluded that
it is able to grow without biotin supplementation
By contrast Xi et al (2012) declared the essential vitamins to be only biotin
and nicotinic acid and the essential amino acids to be only glutamate and
methionine Nevertheless the addition of these defined components makes
the growth medium expensive for industrial use (Shuler amp Kargi 2002 52)
This collection of vitamins and amino acids is thought to be better
introduced to the organism in a complex form (eg yeast extract or corn
steep liquor) where the components and concentration of the nitrogen-
carrying compounds are unknown A complex form of nitrogen source is
less expensive than a defined form and it is said to produce higher cell
growth compared with media with a defined nitrogen source (Shuler amp
Kargi 2002 52)
Batch fermentation studies
Table 21 lists batch studies that investigated alternative nitrogen sources
for SA production and A succinogenes growth From the studies that used
only one type of nitrogen source (either YE or YE amp CSL or CSL amp vitamins)
it can be seen that studies that used only YE generally had a lower YGLSA
compared with the studies that used a combination of YE and CSL as the
nitrogen source Addition of vitamins (Yan et al 2013) to CSL produced SA
copycopy UUnniivveerrssiittyy ooff PPrreettoorriiaa
21
yields and cell growth that were better than the results produced by the YE
and CSL combination
Studies that compared different nitrogen sources within the same study
such as Jiang et al (2010) and Shen et al (2015) compared the
performance of several nitrogen sources inorganic and organic and
observed the following
Inorganic nitrogen sources such as (NH4)2SO4 or NH4Cl were the
worst performing with regard to cell growth and SA yield (Jiang et al
2010)
YE as the only nitrogen source in a growth medium produced the
highest SA yield and the highest dry cell weight (DCW) in comparison
with other nitrogen sources (Jiang et al 2010 Shen et al 2015)
CSL a by-product of corn starch production as the only nitrogen
source in a growth medium was the second best performer (Jiang et
al 2010 Shen et al 2015)
CSL medium did not achieve full carbon substrate conversion
compared with YE medium at the end of the batch fermentation
(Jiang et al 2010 Shen et al 2015)
These studies suggested that the most promising nitrogen source in terms
of A succinogenes growth and SA yield from carbon substrate was yeast
extract (YE) YE is said to have various vitamins amino acids minerals and
trace metals that are necessary to stimulate the growth of A succinogenes
and synthesize its metabolites (Kasprow Lange amp Kirwan 1998) Although
YE is considered to be the best source of nitrogen its price ranges from
US$350kg to US$67kg (Kwon et al 2000 Sridee et al 2011) while the
copycopy UUnniivveerrssiittyy ooff PPrreettoorriiaa
22
price of CSL ranges from US$007kg to US$0075kg (Davis et al 2013)
which makes YE an expensive and unfeasible nitrogen source for long-term
industrial fermentation (Jiang et al 2010 Xi et al 2013 Shen et al 2015)
and CSL an economically viable alternative to YE The feasibility of CSL
feasibility as a nitrogen source was also investigated using microorganisms
such as Mannheimia succiniciproducens (MBEL55E) and Anaerobiospirillum
succiniciproducens Those studies (Lee et al 2000 2002) came to the same
conclusion as Jiang et al (2010) and Shen et al (2015) the inexpensive CSL
can replace the expensive YE as a nitrogen source to promote cell growth
and SA production
A possible reason why CSL proved to be second best to YE is because CSL
contained the cofactor biotin which is considered to be vitally important
for the metabolism of protein lipid and carbohydrate (Xi et al 2012) The
biotin content in CSL is 1 mgmiddotkg-1 and this is said to be sufficient to make a
significant contribution to the nutritional requirement of A succinogenes or
other microorganisms (Nghiem et al 1996) However Jiang et al (2010)
and Shen et al (2015) noticed that with CSL as a nitrogen source in
contrast to YE as the nitrogen source there was a significant amount of
residual glucose that remained at the end of the batch fermentation Shen
et al (2015) suggest that CSL may lack trace elements and certain nitrogen-
containing compounds that prevent A succinogenes from meeting its
normal physiological needs Another reason could be that the batch
fermentation time was not long enough for the CSL medium to reach full
carbohydrate consumption Since no profile of the variables over time was
given for these studies it is hard to determine whether the residual glucose
found in the CSL medium was due to a lack of nutrients or productivity
reduction
copycopy UUnniivveerrssiittyy ooff PPrreettoorriiaa
23
Xi et al (2013) stated that the heme and CSL combination in the production
medium improved SA production by creating a more reductive
environment (the initial redox potential was very low when heme was
added to the medium)
copycopy UUnniivveerrssiittyy ooff PPrreettoorriiaa
24
Table 21 Batch fermentation studies of A succinogenes using different nitrogen sources namely YE and CSL
Study Model Nitrogen source (gmiddotL-1)
Carbon Source
CSo (gmiddotL-1)
CSA (gmiddotL-1)
YGLSA
(gmiddotg-1) YAASA
(gmiddotg-1) YAAFA
(gmiddotg-1)
DCW
(gmiddotg-1)
Gunnarsson
Karakashevamp
Angelidaki (2014)
130Z YE(20) Synthetic
hydrolysate
36 30 083 86 058 25
Zhen et al (2009)
CGMCC
1593
YE(15) Straw
hydrolysate
58 455 0807 7583 083 56
Corona-Gonzalez et
al (2008)
130Z YE(10) Glucose 547 338 062 52 11 37
Liu et al (2008)
CGMCC
1593
YE(10) Sugarcane
molasses
644 464 072 77 3 5
Yan et al (2013)
CCTCC
M2012
036
CSL(25) amp
vitamins
mixture
Glucose 50 39 085 - - -
copycopy UUnniivveerrssiittyy ooff PPrreettoorriiaa
25
Study Model Nitrogen source (gmiddotL-1)
Carbon Source
CSo (gmiddotL-1)
CSA (gmiddotL-1)
YGLSA
(gmiddotg-1) YAASA
(gmiddotg-1) YAAFA
(gmiddotg-1)
DCW
(gmiddotg-1)
CCTCC
M2012
036
CSL(25) amp
vitamins
mixture
Glucose 100 881 088 - - -
Jiang et al (2014)
CGMCC
1716
YE(10) amp
CSL(5)
mixture
Sucrose 100 55 069 11 09 3
Chen et al (2010)
NJ113 YE(10) amp
CSL(5)
mixture
Glucose 50 42 084 - - -
Urbance et al
(2004)
130Z YE(6) amp
CSL (10)
mixture
Glucose 40 339 087 - - -
Urbance et al
(2003)
130Z YE(6) amp
CSL(10)
mixture
Glucose
20 174 087 - - -
copycopy UUnniivveerrssiittyy ooff PPrreettoorriiaa
26
Study Model Nitrogen source (gmiddotL-1)
Carbon Source
CSo (gmiddotL-1)
CSA (gmiddotL-1)
YGLSA
(gmiddotg-1) YAASA
(gmiddotg-1) YAAFA
(gmiddotg-1)
DCW
(gmiddotg-1)
Shen et al (2015) GXAS1
37
YE(12) Sugarcane
molasses
70 546 078 75 5 38
CSL(206) Sugarcane
molasses
70 479 068 76 573 3
Xi et al (2013)
NJ113 YE(10) amp
CSL(75)
mixture
Glucose 30 171 057 372 - 37
CSL (15) Glucose 30 151 050 458 - 31
CSL (15) amp
heme (0001)
mixture
Glucose 30 217 072 493 - 33
Jiang et al (2010)
NJ113 YE(15) Glucose 70 487 070 - - 45
CSL(15) Glucose 70 96 014 - - 21
copycopy UUnniivveerrssiittyy ooff PPrreettoorriiaa
27
Continuous fermentation studies
To date all continuous fermentation studies except the study done by Yan
et al (2014) used a combination YE and CSL (based on the revised SA
medium by Urbance et al 2003) as nitrogen sources None of these studies
investigated on the effect of varying the nitrogen sources type or the
concentration on SA productivity and cell growth In Table 22 it can be
seen that with a fixed combination of YE and CSL growth medium Maharaj
et al (2014) achieved the highest SA yield on glucose mass ratio and
highest SA concentration However Yan et al (2014) reported even YGLSA
and SA concentration and they used a combination of the inexpensive CSL
and defined vitamins
26 Continuous fermentation
In an economic context the need to produce large volumes of product is the
main reason for the selection of the continuous reactor mode preferably
one in which a wild strain acts as the biocatalyst to diminish mutation
problems (Villadsen et al 2011 384) Continuous systems are
advantageous also on a monetary scale because they have lower capital and
labour costs in comparison with batch production systems and since
continuous processes are time independent constant product quality is
more attainable compared with batch or fed-batch processes (Villadsen et
al 2011 384)
A unique aspect of continuous operation is the formation of biofilm which
is inevitable during pro-longed A succinogenes fermentations (Van
Heerden amp Nicol 2013 Maharaj amp Nicol 2014 Urbance et al 2003
copycopy UUnniivveerrssiittyy ooff PPrreettoorriiaa
28
Bradfield amp Nicol 2014 Brink amp Nicol 2014) Biofilms are microbial cell
layers that are embedded in self-produced exopolysacharide (EPS) which is
prone to attaching to surfaces Reactors with biofilms can be operated for
longer periods of time and are very economical because of the self-
immobilizing nature of A succinogenes which results in high volumetric
productivities (Rosche et al 2009)
It is well-known that the growth of A succinogenes is inhibited by the total
concentration of acids in the medium (Corona-Gonzaacutelez et al 2008 Lin et
al 2008 Urbance et al 2004) and therefore at a low throughput (or D)
growth of the organism will be slow since that is when high yields and acid
concentrations are found At a high D the biofilm is established at a quicker
rate but process instability is more severe (Maharaj amp Nicol 2014) The
excessive biofilm shedding at this point does not allow the system to reach
steady state easily and maintain it At a low D the effects seen with a high D
are not observed According to Bradfield amp Nicol (2014) the concentrations
produced at a low D are linked to the maintenance phase and therefore
only a small fraction of the biomass is replicating which allows the system
to reach and maintain steady state (Maharaj amp Nicol 2014)
copycopy UUnniivveerrssiittyy ooff PPrreettoorriiaa
29
Table 22 Continuous fermentation studies of A succinogenes using different nitrogen sources namely YE and CSL
Study Organism model
Nitrogen source
Dilution CSo (gmiddotL-1)
CSA (gmiddotL-1)
YGLSA
(gmiddotg-1) YAASA
(gmiddotg-1) YAAFA
(gmiddotg-1)
DCW
(gmiddotg-1)
Maharaj et al
(2014)
130Z YE(6) amp
CSL(10)
0054
071
326
141
09
080
-
-
-
-
-
-
Yan et al
(2014)
CCTCC
M2012036
CSL(25) amp
vitamins
01-04 188-
3996
084-
092
- - -
001-01 422-
636
072-
085
- - -
Van Heerden
and Nicol
(2013b)
130Z YE(6) amp
CSL(10)
049 13 071 25 077 -
Urbance et al
(2004)
130Z
YE(6) amp
CSL(10)
085
104
076
-
-
-
copycopy UUnniivveerrssiittyy ooff PPrreettoorriiaa
30
3 Materials and Methods
31 Microorganism and growth
Microorganism
In this study Actinobacillus succinogenes 130Z (DSM No 22257 or ATCC
No 55618) was used It was obtained from the German Collection of
Microorganisms and Cell Cultures (Braunschweig Germany) The culture
was stored in a cryopreservation solution at a temperature of ndash75 degC
Inoculum preparation
Inoculum was prepared by transferring 1 ml of the preserved culture to a
vial containing 15 ml of sterilized tryptone soy broth (TSB) The vial was
sealed and stored in an incubator at 37 degC with a shaker speed of 100 rpm
for a duration of 16ndash24 h The broth was later tested for contamination and
usability by performing an analysis with high-performance liquid
chromatography (HPLC) If the broth contained lactic acid or ethanol it was
considered to be contaminated and if a considerable amount of SA was
found in the broth then the culture was deemed to be viable
32 Fermentation media
All chemicals used to make the fermentation medium were obtained from
Merck KgaA (Darmstadt Germany) unless otherwise indicated The feed
medium consisted of three parts a growth medium a phosphate buffer and
copycopy UUnniivveerrssiittyy ooff PPrreettoorriiaa
31
a glucose solution The fermentation medium is based on the composition
proposed by Urbance et al (2003)
Six different growth media were used during the fermentation runs each
medium were composed of a different type andor concentration of
nitrogen sources The first medium used only yeast extract (YE) as the
nitrogen source and the last medium used only corn steep liquor (CSL) The
first run had approximately 33 gmiddotL-1of D-glucose added to the medium and
the last run had approximately 45 gmiddotL-1 of D-glucose added to the medium
Table 31 gives details of the components and the respective concentrations
used to make the feed media CO2(g) (Afrox Johannesburg South Africa)
was fed into the recycle line at 10 vvm to serve as the inorganic carbon
source
copycopy UUnniivveerrssiittyy ooff PPrreettoorriiaa
32
Table 31 Specifications of feed mediaa used during fermentations
Medium
1
Medium
2
Medium
3
Medium
4
Medium
5
Medium
6
Glucose (gmiddotL-1)
Runs 1 amp 2 33 33 33 33 33 33
Run 3 45 45 45 45 45 45
Growth (gmiddotL-1)
YE 16 10 6 3 1 0
CSL 0 6 10 13 15 16
YE ( of YE in
N2 source)d
100 625 375 1875 625 0
NaCl 1 1 1 1 1 1
MgCl2middot6H2O 02 02 02 02 02 02
CaCl22H2O 02 02 02 02 02 02
CH₃COONa 136 136 136 136 136 136
Na2Smiddot9H2O 016 016 016 016 016 016
Antifoam Ybc 1 1 1 1 1 1
Phosphate (gmiddotL-1)
K2HPO4 16 16 16 16 16 16
KH2PO4 32 32 32 32 32 32
a Based on Urbance et al (2003)
b Antifoam from Sigma-Aldrich St Louis USA
c Concentration is in mlmiddotL-1
d YE in N2 source is the of YE in the total complex nitrogen source in the medium
The concentration of the total complex nitrogen source (a combination of CSL and
powder YE) was 16 gmiddotL-1 throughout the fermentations for all runs
copycopy UUnniivveerrssiittyy ooff PPrreettoorriiaa
33
33 Bioreactor
The bioreactor pictured in Figure 31 (a amp b) was a glass cylindrical body
set between an aluminium base and head with an external recycle line to
provide agitation The working volume of the reactor (including recycle)
was 356 mL The liquid level in the reactor was maintained by using a
peristaltic pump on the product line All pumps used in the system were
peristaltic pumps A wooden stick covered in terry cloth was inserted in the
glass cylindrical body for biofilm attachment In fermentation run1 and
run2 one stick was used and in fermentation run 3 three sticks were used
CO2 flow rates were controlled using Brooks 5850S mass flow controllers
(Brooks Instrument Hungary) and the CO2 entered the reactor via an inlet
in the recycle line which was connected to a 02 μm PTFE membrane filter
(Midisart 2000 Sartorius Goumlttingen Germany) The gas exited the system
through a filter with the same specifications as mentioned earlier
connected to the foam-trap
The pH was measured using a CPS 71D-7TB21 glass combination probe
(Endress+Hauser Gerlingen Germany) held within a stainless-steel holder
connected in-line within the recycle stream Maintaining the pH at 68
required the use of a Liquiline CM442 (Endress+Hauser Gerlingen
Germany) in which an internal relay controlled the dosing of 10 M
unsterilized NaOH in an onndashoff fashion Temperature was controlled in a
similar fashion a hotplate was used to provide the heat required to
maintain the temperature at 37 degC For better control of temperature
fluctuations the hotplate was linked to the National Instrument (NI)
module The NI module is further discussed in Section 35
copycopy UUnniivveerrssiittyy ooff PPrreettoorriiaa
34
Figure 31a) Simplified schematic of bioreactor setup
No Description
1 Gas filter
2 Foam-trap 3 Medium
reservoir 1 4 Antifoam
reservoir 5 Medium
reservoir 2 6 Inoculation
septum 7 Reactor body 8 Hot plate 9 Temperature
control 10 pH probe 11 Product
reservoir 12 NaOH reservoir 13 CO2 cylinder 14 Controller 15 Recycle pump 16 Dosing pump
17 Gas flow controller
8
7
2
3
4
5
11
12
13
17
T pH
6
C
DAQ
PC
1
9 10
14
15
16
copycopy UUnniivveerrssiittyy ooff PPrreettoorriiaa
35
Figure 31b) Bioreactor setup
copycopy UUnniivveerrssiittyy ooff PPrreettoorriiaa
36
34 Fermentation procedure
The three parts of the fermentation medium (growth medium buffer and
glucose) were prepared in separate bottles and were autoclaved at 121degC
for 60 minutes To prevent unwanted reactions amongst the medium
components the three parts of the medium were only mixed once the
bottles had cooled to room temperature (approx 24 degC) The reactor
system (excluding NaOH) was also autoclaved at the same temperature and
duration as stated above
The first fermentation medium (see Table 31) was used to start up the
fermentation It had only YE as the nitrogen source This was done to form
a substantial amount of biofilm for full glucose consumption The feed
setup was then connected to the sterile reactor system with a sterile
coupling The coupling consisted of a U-connection one half of which was
fixed to the feed setup and the other half to the reactor system Each half of
the connection had a ball valve to isolate the system from the external
environment The half connections were then coupled and placed in an oil
bath at 140 degC for 20 minutes The reactor was then filled with medium and
once the temperature and pH had stabilized to 37degC and 68 respectively
10 mL of inoculum was injected into the reactor through a silicon septum
attached to the reactor head
Fermentations were started off by operating the system at batch conditions
for 17 hours and then changing to continuous operation at a low dilution
rate This allowed for cell accumulation and prevented cell washout
Addition of antifoam into the reactor was only done when deemed
necessary The recycle flow rate was kept constant at 500 mLmiddotmin-1 in all
fermentations to maintain similar shear conditions The CO2 flow rate was
copycopy UUnniivveerrssiittyy ooff PPrreettoorriiaa
37
set at a vvm of 10 as it seemed sufficient to maintain CO2 saturation in the
reactor After a few days of operation biofilm appeared on internal surface
of the bioreactor as well as the wooden stick covered in terry cloth which
was inserted into the glass cylinder as the intended surface for biofilm
attachment
Controlled variables
Dilution rates for the fermentation runs were determined using the first
fermentation medium Once biofilm had formed in the reactor after a few
days of continuous operation the dilution rate was adjusted until 95 of
initial glucose had been consumed For R3 90 was the target for glucose
consumption The dilution rate was fixed for the entire experimental run if
the above mentioned glucose consumption stayed more or less constant for
three days or more
Media change during fermentation
Similar to the feed connection to the reactor the different medium setups
were connected to the sterile reactor system with another sterile coupling
The half connections were then coupled and the U-connection was placed
in an oil bath at 140 degC for 40 minutes
35 Online monitoring
Monitoring of the process was performed in a similar fashion to that of Van
Heerden and Nicol (2013b) in which the time-averaged NaOH dosing
copycopy UUnniivveerrssiittyy ooff PPrreettoorriiaa
38
fraction was linked to a productivity factor allowing an estimated SA
concentration to be calculated in real-time A LabVIEW (NI module)
program was used to monitor and control the reactor The program was
linked to the reactor instrumentation using a cDAQ-9184 data acquisition
device (National Instruments Hungary) with voltage and current input
modules and a current output module Temperature dosing and antifoam
flowrates were controlled with the program Temperature pH gas flow
rates and the time-averaged dosing of NaOH were recorded through the
program
36 Analytical methods
HPLC analysis
High-performance liquid chromatography (HPLC) was used to determine
the concentrations of glucose SA and other organic acids Analyses were
done using an Agilent 1260 Infinity HPLC (Agilent Technologies USA)
equipped with an RI detector and a 300 mm times 78 mm Aminex HPX-87 H
ion-exchange column (Bio-Rad Laboratories USA) The mobile phase (03
mLmiddotL-1 and 11 mLmiddotL-1H2SO4) flowrate was 06 mLmiddotmin-1 and the column
temperature was 60degC
Suspended cell analysis
Once the reactor had reached a steady state the product stream was
collected in a bottle that was kept in a small bar refrigerator The product
bottle was kept cool to prevent further growth of cells and metabolic
activity and depending on the dilution rate the duration of the collection
period varied from 12 to 72 hours The collected volume was then
copycopy UUnniivveerrssiittyy ooff PPrreettoorriiaa
39
thoroughly mixed and a 12 mL sample was collected for suspended cell
analysis This was performed by splitting the 12 mL sample into 12 x 1 mL
samples and centrifuging at 4000 rpm for 2 minutes The samples were
centrifuged three times and after each centrifugation the supernatant was
poured out and the cell precipitate washed in distilled water Following the
third centrifugation the cell precipitates were transferred to an empty
glass vial that had been measured beforehand The cell precipitates were
then dried to a constant weight in an 85 degC oven
Mass balance analysis
Overall mass balances were performed to assess the accuracy of each
sample The mass balances were performed by comparing the
stoichiometric amount of glucose required to achieve the experimental
concentrations of SA AA and FA with the experimental amount of glucose
consumed
37 Steady state check
When the time-averaged dosing profile constructed by the LabVIEW
program ceased to fluctuate by a 5 standard deviation of the average
dosing flow it was assumed that the system had reached pseudo-steady
state and the product stream was sampled To further ascertain steady
state the glucose and organic acid concentrations in product samples
frequently taken over a certain period were compared and if negligible
differences were found between the sample data the system was
confirmed to be at steady state
copycopy UUnniivveerrssiittyy ooff PPrreettoorriiaa
40
38 Summary of fermentation
Results were obtained over three continuous fermentation runs Several
other runs were attempted but did not provide any results that were
valuable due to upsets encountered in the system The three runs
mentioned in Table 32 were conducted to prove the repeatability of trends
observed in the first fermentation run
Table 32 Summary of fermentation runs performed
Five different mediums each with a glucose concentration of 33 gmiddotL-1 were
used in fermentation run 1 (R1) This gave an indication of what the
general trend would be of the product distribution The dilution rate was
adjusted until steady state was achieved with only 5 of initial glucose
concentration as residual for the first medium Therefore with the 33 gmiddotL-1
initial glucose a Df of 008 h-1 was set Fermentation run 2 (R2) was
conducted to prove the repeatability of the trend seen in R1 Fermentation
run 3 (R3) was conducted with six different media at a glucose
concentration of 45 gmiddotL-1 and 90 glucose conversion was only achieved
when the Df was lowered to 0041 h-1
Run Operating
hours (h)
Glucose
(gmiddotL-1)
Df
(h-1) Medium No
1 1 008 33 0080 1 2 3 4 5 -
2 1 104 33 0045 1 3 5 - - -
3 1 272 45 0041 1 2 3 4 5 6
copycopy UUnniivveerrssiittyy ooff PPrreettoorriiaa
41
Biofilm attachment and appearance
Approximately 72 hours after inoculation of the bioreactor biofilm started
forming on the glass wall of the reactor A substantial amount of biofilm
inside the bioreactor only formed after plusmn 330 operating hours The
structure and the amount of the biofilm varied throughout the
fermentations and it appeared that the biofilm was dependent on the
following
the surface to which it is attached
the history of the fermentation
the composition of the fermentation medium
Figure 32 (a) shows the bioreactor before inoculation and without cell
attachment After operation for more than 330 hours using only YE as the
nitrogen source a thick mass of biofilm had formed as shown in Figure
32 (b) However as the CSL concentration on the fermentation medium
increased more biofilm started to shed and eventually when only CSL was
used at the nitrogen source there was almost no biofilm attachment on the
glass surface of the bioreactor (as seen in Figure 32 (c))
Although there was not much biofilm on the glass surface there was
biofilm on the internals of the reactor (the wooden sticks covered in terry
cloth) Figure 33 (a amp b) illustrates the sticks covered in biomass at the end
of the fermentations
copycopy UUnniivveerrssiittyy ooff PPrreettoorriiaa
42
Figure 32 a) Bioreactor before inoculation b) Biofilm growth using
only YE as nitrogen source c) Bioreactor with only CSL as nitrogen source
(a) (b) (c)
copycopy UUnniivveerrssiittyy ooff PPrreettoorriiaa
43
Figure 33 a) Internal support for biofilm attachment (at the end of
fermentation run 1) b)Internal supports for biofilm attachment (at the end
of fermentation run 3)
(a) (b)
copycopy UUnniivveerrssiittyy ooff PPrreettoorriiaa
44
4 Results and Discussion
41 Experimental strategy for different runs
The objective of R1 (fermentation run 1) was to find steady state data that
could be analysed to understand the influence of YE and CSL on the growth
and productivity of A succinogenes As seen in Table 31 the media used in
the experiments differed from each other regarding the concentrations of
CSL and YE but the total complex nitrogen source concentration in the
media remained constant The intended experimental plan was to report
the steady state product concentrations as the concentration of YE in the
growth medium varied (ie as the YE concentration decreased and the CSL
concentration increased) R2 (fermentation run 2) which followed the
same procedure as R1 was conducted to prove that the data found in R1
was repeatable R3 (fermentation run 3) was an attempt to achieve high SA
concentrations following the same experimental plan as R1 except that R3
used a high initial glucose feed concentration and had additional internal
support to increase the surface area available for biofilm attachments
All fermentations began with a growth medium that contained only YE as
the nitrogen source (100 YE) and once a healthy and stable biofilm had
formed the growth media were changed according to the procedure
explained in Section 34 Fermentation procedure
Initially R1 had a high biomass content and activity (when only YE was in
the fermentation medium) and as the YE content in the growth medium
decreased the biomass activity decreased R2 was effectively a repetition
of R1 but due to the low initial biomass activity the dilution rate was
adjusted to have approx 95 glucose conversion (when the growth
copycopy UUnniivveerrssiittyy ooff PPrreettoorriiaa
45
medium had only YE as the nitrogen source) Despite the increased surface
area for biofilm attachment the biomass in R3 struggled to achieve the
same activity as R1 Initially the SA concentration was slightly higher but
eventually the results of R3 coincided with those of R2 when CSL was
introduced into the growth medium The dilution rate for R3 could have
been lowered further to reach higher product concentrations but it was
decided not to do this due to time constraints for achieving steady state
Table 41 gives the steady state results for all three runs
copycopy UUnniivveerrssiittyy ooff PPrreettoorriiaa
46
Table 41 Steady state data for the three continuous fermentation runs
Dilution
(h-1)
SA
(gmiddotL-1) AA (gmiddotL-1) FA (gmiddotL-1)
PYR
(gmiddotL-1)
Δ GLC
(gmiddotL-1)
YE ( in nitrogen
source)
Black box mass
balance ()
Average black box
mass balance ()
Average black box
mass balance ()
with DCW
Fermentation run 1
008 1731 814 608 048 3041 10000 8529
008 1685 816 619 050 3067 10000 8347
009 1671 800 612 051 3059 10000 8269 8382
008 1860 702 449 066 2916 6250 8777
008 1872 667 435 079 2917 6250 8716 8747 9581
008 1764 492 263 045 2619 3750 8343
008 1792 494 251 033 2596 3750 8473
008 1778 498 259 031 2596 3750 8441 8419
008 1691 359 183 178 2152 1875 9646
008 1696 349 168 175 2223 1875 9278
008 1669 353 170 172 2107 1875 9687 9537
008 1565 239 064 224 1855 625 9935
008 1411 192 048 290 1808 625 9459
008 1328 176 056 293 1822 625 8921 9438
copycopy UUnniivveerrssiittyy ooff PPrreettoorriiaa
47
Dilution
(h-1)
SA
(gmiddotL-1) AA (gmiddotL-1) FA (gmiddotL-1)
PYR
(gmiddotL-1)
Δ GLC
(gmiddotL-1)
YE ( in nitrogen
source)
Black box mass
balance ()
Average black box
mass balance ()
Average black box
mass balance ()
with DCW
Fermentation Run 2
004 1780 852 569 051 2954 10000 9023
004 1853 878 569 044 2972 10000 9256
004 1874 897 585 040 3004 10000 9287 9189
004 1796 564 248 042 2489 3750 9154
004 1759 582 263 035 2354 3750 9616
004 1760 570 228 038 2561 3750 8760 9177
004 1175 290 071 201 1447 625 10575
004 1106 289 074 199 1455 625 10081
004 1080 283 071 202 1390 625 10357 10338
Fermentation Run 3
004 2253 1022 493 026 3695 10000 8686
004 2257 1009 499 023 3673 10000 8711
004 2205 976 477 025 3656 10000 8522 8640 9138
004 1927 787 298 000 3043 6250 8538
004 1970 803 306 007 3221 6250 8266
004 1991 820 335 005 3242 6250 8344 8383 9213
004 1785 604 128 063 2998 3750 8583
copycopy UUnniivveerrssiittyy ooff PPrreettoorriiaa
48
Dilution
(h-1)
SA
(gmiddotL-1) AA (gmiddotL-1) FA (gmiddotL-1)
PYR
(gmiddotL-1)
Δ GLC
(gmiddotL-1)
YE ( in nitrogen
source)
Black box mass
balance ()
Average black box
mass balance ()
Average black box
mass balance ()
with DCW
004 1879 615 131 069 3092 3750 8572 8568 8974
004 1635 493 028 067 2635 1875 8718
004 1628 486 022 077 2605 1875 8644
004 1578 455 036 080 2664 1875 8431 8598 9919
004 1159 295 000 082 1489 625 9255
004 1110 286 000 098 1955 625 8545
004 1104 275 000 099 1419 625 9630
004 1044 259 000 114 1433 625 8908 9085 11240
004 817 137 000 177 1582 000 6186
004 709 086 000 237 1425 000 8691
004 725 072 000 249 1457 000 6140
004 712 080 000 273 1271 000 7161 7045 7234
copycopy UUnniivveerrssiittyy ooff PPrreettoorriiaa
49
Mass balances or redox balances were performed on all the samples and
the average closures of the steady state samples are shown in Table 41
Mass balance closure did increase as the YE content decreased In R3
DCWs were taken to see if the mass balance closure would reach 100
Including the DCWs significantly improved the mass balance but did not
close it Anything above 90 was considered a proper closure and most
figures that were below 100 may indicate unknown metabolites or non-
perfect analysis of acids and sugars
42 Productivity analysis
Figure 41 shows the average concentrations of SA AA and FA in the
product streams at steady state for all fermentation runs For a clear
comparison of the metabolite concentrations of all the fermentation runs
the results were put into a single plot despite the differences in dilution
rate and glucose feed concentration The reasons for the difference in
dilution rates were explained in Section 41
copycopy UUnniivveerrssiittyy ooff PPrreettoorriiaa
50
R1
R2
R3
SA
FA
AA
Figure 41
(See Table 31)
Figure 42 depicts how SA productivity and the glucose consumption rate
changed as the YE concentration decreased
0
2
4
6
8
10
12
14
16
18
20
22
24
0 10 20 30 40 50 60 70 80 90 100
Co
nce
ntr
atio
n(g
middotL-1
)
YE in Nitrogen Source
Figure 41 Product concentration profiles for SA AA and FA of
A succinogenes as the YE in the growth media varied
The total nitrogen source (combination of YE and CSL) concentration in the
growth medium stayed constant at 16 gmiddotL-1only the concentrations of YE (powder
form) and CSL (liquid form) varied
Commented [B1] In order for the very long captions for Figures 41 to 46 NOT to show in the automatic List of Figures Ive converted the detailed descriptions to normal text
copycopy UUnniivveerrssiittyy ooff PPrreettoorriiaa
51
R1
R2
R3
Productivity SA
Glucose
consumption rate
Figure 42SA productivity profile and glucose consumption rat
A succinogenes as the YE in the growth media varied
(See Table 31)
SA concentration decreased as the concentration of YE was reduced in the
medium When only YE was used as the nitrogen source which is an ideal
ingredient for A succinogenes growth and SA productivity the highest SA
concentration for R2 and R3 was achieved For R1 the SA concentration
was at its highest when the 625 of YE medium was used Despite the
difference in glucose concentration SA concentrations for R1 R2 and R3
0
02
04
06
08
1
12
14
16
18
2
22
24
26
28
3
0
02
04
06
08
1
12
14
16
0 10 20 30 40 50 60 70 80 90 100
Glu
cose
co
nsu
mp
tio
n r
ate
(gL
hr)
Pro
du
ctiv
ity
SA
(gmiddotL
-1middoth
r-1))
of YE in Nitrogen source
Figure 42 SA productivity profile and glucose consumption rate
profiles of A succinogenes as the YE in the growth media varied
The total nitrogen source (combination of YE and CSL) concentration in the
growth medium stayed constant at 16 gmiddotL-1 only the concentrations of YE
(powder form) and CSL(liquid form) varied
copycopy UUnniivveerrssiittyy ooff PPrreettoorriiaa
52
were similar when CSL was added to the medium R3 started with a high SA
concentration as expected but then quickly dropped and displayed the
trend observed in R1 and R2 AA and FA both decreased as the YE content
in the medium decreased for all runs The concentrations for both FA and
AA more or less matched in all runs irrespective of the dilution rate and
the glucose feed concentration When only CSL was used as the nitrogen
source in the growth medium in R3 no FA was produced
The SA productivity trend shown in Figure 42 is the same as the SA
concentration profile The highest SA productivity obtained in this study
was 158 gmiddotL-1middoth-1 when a 625 YE medium was used as the nitrogen
source From Figure 42 it should be clear that the productivities of R1
were almost twice as high as the productivities of R2 The same can be said
for the glucose consumption rates for R1 and R2 This is because the
dilution rate of R1 was also twice as much as the dilution rate of R2
According to Maharaj et al (2014) a decrease in dilution should lead to an
increase in product concentrations and yields R1 and R2 do not follow that
trend Instead their product concentrations profile matched A possible
reason for the inconsistency in the trends could be that there was less
biofilm activity in R2 for an unknown reason compared with the biofilm
activity in R1 resulting in a product concentrations profile match instead of
higher product concentrations in R2 compared with the profile for R1
43 Analysis of product distribution
Metabolite concentrations were used to determine and study the product
distributions YAASA YAAFA and YGLSA of the three fermentations
copycopy UUnniivveerrssiittyy ooff PPrreettoorriiaa
53
In Section 24 the theoretical metabolic flux limitations were discussed and
it was noted that in the absence of biomass formation the maximum
theoretical values for YAASA and YGLSA should be 393gmiddotg-1 and 088 gmiddotg-1
respectively These yields would only be achieved if no FA was produced
ie if only PDH was active However if the PFL route was active and all of
the FA was converted to CO2 and NADH by FDH then the maximum
theoretical yields mentioned earlier could be still achieved If biomass is
produced then a portion of the glucose in the growth medium would be
directed to the anabolic pathway which would influence the carbon
distribution resulting in maximum yields less than those given above
It is illustrated in Figure 43 that YAASA should vary between 197 gmiddotgminus1 (for
YAAFA = 077 gmiddotgminus1) and 393 gmiddotg-1 (for YAAFA = 0 gmiddotgminus1) Using only YE as the
nitrogen source the experimental yields for all runs matched the maximum
theoretical yields that were obtained when only the PFL enzyme was
active As the nitrogen source content varied (ie CSL concentration
increased and YE concentration decreased) YAASA increased and YAAFA
decreased thus indicating a shift in the metabolic flux distribution YAASA for
R2 and R3 were similar throughout the runs so was YAAFA However when
the YE concentration in the nitrogen source was 1875 for R1 and R3
YAASA exceeded the maximum theoretical yield while YAAFA was still in the
range of 0 gmiddotg-1 to 077 gmiddotg-1 The highest YAASA achieved in this study was 83
gmiddotg-1 and the lowest YAAFA was 0 gmiddotg-1 as seen in Figure 43 these yields
were obtained in R3 when only CSL was used as the nitrogen source
Certain batch studies in A succinogenes also achieved a YAASA that exceeded
the maximum theoretical yield (see Section 26 Table 21) but those
studies used YE as the nitrogen source whereas in this study it was
copycopy UUnniivveerrssiittyy ooff PPrreettoorriiaa
54
achieved using only CSL Xi et al (2013) was the only study (batch
fermentation) mentioned in Table 21 that used only CSL as the nitrogen
source with glucose as the carbon substrate and exceeded the maximum
theoretical YAASA They attained a YAASA of 458 gmiddotg-1
copycopy UUnniivveerrssiittyy ooff PPrreettoorriiaa
55
R1
R2
R3
SAAA
FAAA
Figure 43 Experimental yields plotted with the maximum theoretical yields
profile of A succinogenes as YE in medium changes
Considering the flux at the pyruvate node YAAFA decreased and was
approaching zero as the CSL concentration in the nitrogen source
increased as seen in Figure 43 This could be an outcome of an increase in
either PDH or FDH activity or a decrease in activity for both PDH and PFL
resulting in an increased concentration of pyruvate in the product stream
Figure 44 illustrates how the pyruvate concentration increased as the CSL
concentration in the growth medium increased
0
05
1
15
2
25
3
35
4
45
5
55
6
65
7
75
8
85
9
0 10 20 30 40 50 60 70 80 90 100
Mas
s ra
tio
(g
g-1)
YE in Nitrogen Source
SAAA max (PFL)
FAAA max (PFL)
SAAA max (PDH)
FAAA max (PDH)
Figure 43 Experimental yields plotted with the maximum theoretical
yields profile of A succinogenes as YE in medium changes
The total nitrogen source (combination of YE and CSL) concentration in the
growth medium stayed constant at 16 gmiddotL-1 only the concentrations of YE
(powder form) and CSL(liquid form) varied
copycopy UUnniivveerrssiittyy ooff PPrreettoorriiaa
56
(See Table 31)
According to the redox balance it is expected that YAASA would increase as
YAAFA decreased and in this study the same development was observed
This could be linked to the increasing CSL concentration in the nitrogen
source in this study Bradfield amp Nicol (2014) suggested that there could be
an additional reducing power that produced the yields that were achieved
Using carbon and redox balances they noticed in their study that the
experimental YAASA values exceeded the predicted values suggesting that an
increase in PDH or FDH activity was not the only contribution to the
increase in YAASA and that additional reducing power was present The same
0
02
04
06
08
1
12
14
16
18
2
22
24
26
28
3
0 10 20 30 40 50 60 70 80 90 100
Co
nce
ntr
atio
n(g
L)
YE in Nitrogen Source
PYR R1
PYR R2
PYR R3
Figure 44 Pyruvate concentration profile of A succinogenes as YE in
medium changes
The total nitrogen source (combination of YE and CSL) concentration in the
growth medium stayed constant at 16 gmiddotL-1 only the concentrations of YE
(powder form) and CSL(liquid form) varied
copycopy UUnniivveerrssiittyy ooff PPrreettoorriiaa
57
explanation can be applied to this study as seen in Figure 43 The increase
in the YAASA is influenced by the decrease in the YAAFA ratio although it is not
sufficient to reach the expected ratios (according to the redox balance)
(See Table 31)
Figure 45 illustrates the NADH consumed per NADH produced for all
fermentation runs The NADH consumed (mol NADHmiddotcmol glucose-1) was
calculated as follow
09
1
11
12
13
14
15
16
17
18
19
2
0 10 20 30 40 50 60 70 80 90 100
NA
DH
Co
nsu
med
NA
DH
Pro
du
ced
of YE in Nitrogen source
NADH R1
NADH R2
NADH R3
Figure 45 NADH ratio consumed during production of A succinogenes
as YE in medium changes
The total nitrogen source (combination of YE and CSL) concentration in the
growth medium stayed constant at 16 gmiddotL-1 only the concentrations of YE
(powder form) and CSL(liquid form) varied
copycopy UUnniivveerrssiittyy ooff PPrreettoorriiaa
58
2119862119878119860119872119872119878119860
6∆119866119871119862119872119872119866119871119862
frasl (41)
Using Figure 2 Equation 41 was generated The only pathway that
consumed NADH was the path that converted PEP to SA where 2 molecules
of NADH were consumed to produce 1 molecule of SA
The NADH (mol NADHmiddotcmol glucose-1) produced was calculated as follow
(119862119878119860
119872119872119878119860+
2119862119860119860
119872119872119860119860minus
119862119865119860
119872119872119865119860)
6∆119866119871119862
119872119872119866119871119862
frasl (42)
The path from glucose to PEP produced 2 molecules of NADH per one
glucose molecule consumed and from PYR to AA 1 molecule of NADH per
one AA molecule was produced All the inputs for these equations were the
product concentrations obtained from the experimental runs
In Figure 45 it is noted that for all the fermentation runs the ratio of NADH
consumed to NADH produced increased as the concentration of YE in the
growth medium increased Nevertheless there is a clear dissimilarity
between the three runs In R3 the NADH production was higher than the
consumption for all growth media except when only CSL was used as the
nitrogen source R2 and R3 in comparison with R1 did not display a
massive imbalance in the NADH ratio and R1 was the only run where NADH
consumed over produced ratio consistently increased significantly as the
YE content in the growth medium increased It appears that the additional
NADH generation capability of R1 was not fully present in R2 and R3 and
possibly the strains used in R2 and R3 had altered production
copycopy UUnniivveerrssiittyy ooff PPrreettoorriiaa
59
characteristics compared with the original strain Nevertheless the R1
results coincide with the observation of both Bradfield amp Nicol (2014) and
Brink amp Nicol (2014) which was that there was an ldquoexcessrdquo of NADH that
was consumed during the maintenance phasenon-growth phase resulting
in a high YAASA
copycopy UUnniivveerrssiittyy ooff PPrreettoorriiaa
60
(See Table 31)
Figure 46 illustrates the yield of SA on glucose for R1 This graph shows
how the flux from glucose to SA increases as the CSL concentration in the
growth medium increases The trend observed in Figure 46 can be linked
to the ldquoexcessrdquo NADH that favours the production of SA Xi et al (2013)
observed that using only CSL as the nitrogen source provided high
selectivity towards SA (458 gmiddotgminus1) in comparison with other by-products
On the other hand CSL with heme provided a high glucose-to-SA flux
(072 gmiddotgminus1) and a much higher YAASA (493 gmiddotgminus1) A similar observation was
04
043
046
049
052
055
058
061
064
067
07
073
076
079
082
085
088
0 10 20 30 40 50 60 70 80 90 100
Mas
s ra
tio
(g
g-1)
YE in Nitrogen Source
SAGL R1
SAGL max(PFL)SAGL max(PDH)
Figure 46 Mass ratio of succinic acid over glucose profile of
A succinogenes as YE in medium changes
The total nitrogen source (combination of YE and CSL) concentration in the
growth medium stayed constant at 16 gmiddotL-1 only the concentrations of YE
(powder form) and CSL(liquid form) varied
copycopy UUnniivveerrssiittyy ooff PPrreettoorriiaa
61
documented by Yan et al (2013) Xi et al (2012) tried to explain this
observation in their study by stating that CSL contained cofactor biotin
which promoted the high SA selectivity
It is reasonable to postulate that there is an ingredient in CSL that may
trigger or enhance the activity of an additional metabolic pathway known
as the pentose phosphate pathway (PPP) to produce high carbon flux to SA
and high SA selectivity The idea of PPP as the source of the additional
reducing power stems from the findings of Bradfield and Nicol (2014)
Their analysis has shown that if the NADPH generated in the PPP cycle is
converted to NADH in order to supply redox to the SA pathway then high
SA selectivity can be achieved A succinogenes has the transhydrogenase
that allows PPP to be active and as mentioned earlier the presence or
absence of one or more ingredients in CSL may allow this enzyme to be
active consequently activating the PPP as well
Xi et al (2012) did mention biotin as the culprit for the high SA selectivity
They investigated the influence of biotin on A succinogenes growth and SA
productivity by varying the biotin concentration in a chemically defined
medium There was no SA production and cell growth was severely
inhibited when biotin was absent from the growth medium They reported
a high SA yield in their study but their data for AA concentration YGLAA and
YAASA were inconsistent with their observed product concentrations The
following example is extracted from their results In the experiment using
8 mg L-1biotin the glucose consumed was 300 g L-1 CSA = 194 g L-1 CAA =
32 g L-1 YGLAA = 0203 g g-1 and YAASA = 61 g g-1 However the YGLAA should
have been 0107 gmiddotg-1 if CAA was reported correctly but if the value for YAASA
was used as the value of CAA then the reported YGLAA would be correct
copycopy UUnniivveerrssiittyy ooff PPrreettoorriiaa
62
Nevertheless because of the inconsistency of the data it cannot be
concluded that biotin did play a role in gaining a high SA yield
Either the presence or absence of a component in a growth medium can
influence the enzymatic activity of a pathway and this concept should be
used to postulate explanations for the results obtained in this study
A breakdown of the constituents of CSL and YE could help in identifying the
ingredients in CSL that may have triggered or enhanced the activity of the
PPP Since both CSL and YE are complex media and there is no definite
information on the ingredients it is hard to fully confirm the following
theory
Xiao et al (2013) did a study on the constituents of CSL and stated that any
grade of CSL has the following amino acids isoleucine asparagine
methionine lysine proline and aspartic acid YE was reported by an
industrial data sheet (Organotechniereg SAS France) to have a high
content of the following alanine isoleucine leucine methionine
phenylalanine tyrosine and valine Although there are common amino
acids shared between CSL and YE there is one amino acid YE has that is
absent from CSL namely leucine This could be a reason why CSL could be
related to the excess NADH
Leucine in Ecoli is said to repress the transhydrogenase activity which in
turn represses the PPP (Gerolimatos amp Hanson 1978) This could be true
for A succinogenes since it also has the transhydrogenase for PPP as
mentioned in Section 23 A succinogenes with only YE as the nitrogen
source produced yields that were expected according to the carbon and
redox balance It can be postulated that as the YE content reduce the
copycopy UUnniivveerrssiittyy ooff PPrreettoorriiaa
63
leucine content decreased and the activity of the transhydrogenase
increased causing additional NADH to be generated from the enhanced
PPP resulting in improved yields
copycopy UUnniivveerrssiittyy ooff PPrreettoorriiaa
64
5 Conclusions
The complex nitrogen requirements of non-growing A succinogenes
biofilms were evaluated The study restricted itself to the use of YE and CSL
as nitrogen sources The SA productivity yields and titre were the variables
assessed
The YE concentration was decreased while simultaneously increasing the
CSL concentration in the medium Although this led to a decrease in the
steady state productivity of the organism overall SA selectivity increased
The production of certain metabolites such as SA and pyruvate also
increased while FA and AA concentrations decreased in the increasing
absence of YE This led to an increase in the SA to AA mass ratio and to a
decrease in the FA to AA mass ratio When zero amounts of YE were in the
growth medium no FA was produced
Three fermentation runs were performed The highest SA concentration in
this study was 2257gmiddotL-1 when only YE was used as the nitrogen source in
the growth medium and the highest SA productivity obtained in this study
was 158 gmiddotL-1middoth-1 when a combination of YE(625) and CSL(375) was
used as the nitrogen sourceThe highest SA to AA mass ratio achieved was
83 gmiddotg-1 when only CSL was used as the nitrogen source The FA to AA
mass ratio was consistently less than 077 gmiddotg-1 approaching 0 gmiddotg-1 as the
CSL concentration in the nitrogen source increased
Lower FA to AA mass ratio values were not fully responsible for the
increase in the SA to AA mass ratio The surplus NADH required is provided
copycopy UUnniivveerrssiittyy ooff PPrreettoorriiaa
65
by the activation or enhancement of an alternative metabolic pathway ie
the pentose phosphate pathway
The observations made in this study bolster the idea of using a combination
of YE and CSL where YE is the minor component as the nitrogen source for
commercialisation of bio-based succinic acid production using
Asuccinogenes as the catalyst
copycopy UUnniivveerrssiittyy ooff PPrreettoorriiaa
66
6 References
Allied Market Research (2014) ldquoWorld bio succinic acid market ndash
Opportunities and forecasts 2013ndash2020rdquo [Online]
httpswwwalliedmarketresearchcombio-succinic-acid-market
Beauprez JJ De Mey M and Soetaert WK (2010) ldquoMicrobial succinic acid
production natural versus metabolic engineered producersrdquo Process
Biochem451103ndash1114
Bechthold I Bretz K Kabasci S Kopitzky R and Springer A (2008)
ldquoSuccinic acid a new platform chemical for biobased polymers from
renewable resourcesrdquo Chem Eng Technol 31647ndash654
BioConSepT (2013) ldquoDetermination of market potential for selected
platform chemicalsrdquo [Online] httpwwwbioconsepteuwp-
contentuploadsBioConSepT_Market-potential-for-selected-platform-
chemicals_ppt1pdf
Bozell JJ and Petersen GR (2010) ldquoTechnology development for the
production of biobased products from biorefinery carbohydrates ndash the US
Department of Energyrsquos ldquoTop 10rdquorevisitedrdquo Green Chem 12539ndash554
Bradfield MFA and Nicol W (2014) ldquoContinuous succinic acid production
by Actinobacillus succinogenes in a biofilm reactor steady-state metabolic
flux variationrdquo Biochem Eng J 851ndash7
copycopy UUnniivveerrssiittyy ooff PPrreettoorriiaa
67
Brink HG and Nicol W (2014) ldquoSuccinic acid production with Actinobacillus
succinogenes Rate and yield analysis of chemostat and biofilm culturesrdquo
Microb Cell Fact 13111-122
Chen K Jiang M Wei P Yao J and Wu H (2010)rdquoSuccinic acid production
from acid hydrolysate of corn fiber by Actinobacillus succinogenesrdquo Appl
Biochem Biotechnol 160477ndash485
Cok B Tsiropoulos I Roes AL and Patel MK (2014) ldquoSuccinic acid
production derived from carbohydrates An energy and greenhouse gas
assessment of a platform chemical toward a bio-based economyrdquo Biofuels
Bioprod Bioref 816-29
Corona-Gonzaacutelez RI Bories A Gonzaacutelez Alvarez V and Pelayo-Ortiz C
(2008) ldquoKinetic study of succinic acid production by Actinobacillus
succinogenes ZT-130rdquo Process Biochem 431047ndash1053
Davis R Tao L Tan ECD Biddy MJ Beckham GT Scarlata C Jacobson J
Cafferty K Ross J Lukas J Knorr D and Schoen P(2013) ldquoProcess Design
and Economics for the Conversion of Lignocellulosic Biomass to
Hydrocarbons Dilute-Acid and Enzymatic Deconstruction of Biomass to
Sugars and Biological Conversion of Sugars to Hydrocarbonsrdquo NREL Report
No TP-5100-60223 [Online]
httpwwwnrelgovdocsfy14osti60223pdf
Gerolimatos B and Hanson RL (1978) ldquoRepression of Escherichia coli
pyridine nucleotide transhydrogenase by leucinerdquo J Bacteriol 134(2)394-
400
copycopy UUnniivveerrssiittyy ooff PPrreettoorriiaa
68
Grand-View-Research (2015) ldquoBio-Succinic Acid Market Analysis by
Application (BDO Polyester Polyols PBSPBST Plasticizers Alkyd Resins)
and Segment Forecasts to 2020ldquo [Online]
httpwwwgrandviewresearchcomindustry-analysisbio-succinic-acid-
market ISBN Code 978-1-68038-085-9
Guettler M Rumler D and Jain M (1999) ldquoActinobacillus succinogenes sp
nov a novel succinic-acid-producing strain from the bovine rumenrdquo Int J
Syst Bacteriol 49207ndash216
Gunnarsson IB Karakashev D and Angelidaki I (2014) ldquoSuccinic acid
production by fermentation of Jerusalem artichoke tuberhydrolysate with
Actinobacillus succinogenes 130Zrdquo Ind Crops-Prod 62125ndash129
ICIS (2012)rdquoChemical industry awaits for bio-succinic acid potentialrdquo
[Online]
httpwwwiciscomArticles201201309527521chemical+industry+
awaits+for+biosuccinic+acid+potentialhtml
Jiang M Chen K Liu Z Wei P Ying H and Chang H (2010) ldquoSuccinic acid
production by Actinobacillus succinogenes using spent Brewers yeast
hydrolysate as a nitrogen sourcerdquo Appl Biochem Biotechnol 160 244ndash
254
Jiang M Dai W Xi Y Wu M Kong X Ma J Min Zhang M Chen K and Wei
P (2014) ldquoSuccinic acid production from sucrose by Actinobacillus
succinogenes NJ113rdquo BioresourTechnol 153327ndash332
copycopy UUnniivveerrssiittyy ooff PPrreettoorriiaa
69
Kaneuchi C Seki M and Komagata K (1988) ldquoProduction of succinic acid
from citric acid and related acids by Lactobacillus strainsrdquo Appl Environ
Microbiol 543053ndash3056
Kasprow RP Lange AJ and Kirwan DJ (1998)ldquoCorrelation of fermentation
yield with yeast extract composition as characterized by near-infrared
spectroscopyrdquo Biotechnol Prog 14318minus325
Kwon S Lee PC Lee EG Chang YK and Chang N (2000) ldquoProduction of
lactic acid by Lactobacillus rhamnosus with Vitamin-supplemented soybean
hydrolysaterdquo Enzyme Microb Technol 26209-215
Lee PC Lee WG Kwon S Lee SY and Chang HN (2000) ldquoBatch and
continuous cultivation of Anaerobiospirillum succiniciproducens for the
production of succinic acid from wheyrdquo Appl Microbiol Biotechnol 5423ndash
27
Lee PC Lee SY Hong SH and Chang HN (2002) ldquoIsolation and
characterization of a new succinic acid-producing bacterium Mannheimia
succiniciproducens MBEL55E from bovine rumenrdquo Appl Microbiol
Biotechnol 58(5)663ndash668
Lin H Bennett GN and San KY (2005) ldquoFed-batch culture of a
metabolically engineered Escherichia coli strain designed for high-level
succinate production and yield under aerobic conditions rdquoBiotechnol
Bioeng 90775ndash779
copycopy UUnniivveerrssiittyy ooff PPrreettoorriiaa
70
Lin SKC Du C Koutinas A Wang R amp Webb C (2008) ldquoSubstrate and
product inhibition kinetics in succinic acid production by Actinobacillus
succinogenesrdquo Biochem Eng J 41(2)128ndash135
Liu YP Zheng P Sun ZH Ni Y Dong JJ and Zhu LL (2008) ldquoEconomical
succinic acid production from cane molasses by Actinobacillus
succinogenesrdquo Bioresour Technol 991736ndash1742
Maharaj K Bradfield MFA and Nicol W (2014) ldquoSuccinic acid-producing
biofilms of Actinobacillus succinogenes Reproducibility stability and
productivityrdquo Appl Microbiol Biotechnol 98(17)7379ndash7386
McKinlay JB Zeikus JG amp Vieille C (2005) ldquoInsights into Actinobacillus
succinogenes fermentative metabolism in a chemically defined growth
mediumrdquo Appl Environ Microbiol 71(11) 6651ndash6656
McKinlay JB Vieille C and Zeikus JG (2007) ldquoProspects for a bio-based
succinate industryrdquo Appl Microbiol Biotechnol 76727ndash740
McKinlay JB Laivenieks M Schindler BD McKinlay A Siddaramappa S
Challacombe JF Lowry SR Clum A Lapidus AL and Burkhart KB (2010)
ldquoA genomic perspective on the potential of Actinobacillus succinogenes for
industrial succinate productionrdquo BMC Genomics 11 (1) 680
Nghiem NP Davison BH Suttle BE and Richardson GR (1997)
ldquoProduction of succinic acid by Anaerobiospirillum succiniciproducensrdquo Appl
Biochem Biotechnol 63ndash65 565ndash576
copycopy UUnniivveerrssiittyy ooff PPrreettoorriiaa
71
Oh I Lee H Park C Lee SY and Lee J (2008) ldquoSuccinic acid production by
continuous fermentation process using Mannheimia succiniciproducens
LPK7rdquo J Microbiol Biotechnol 18908ndash912
Organotechniereg SAS (2008) ldquoTechnical Data Sheet Yeast Extract 19512rdquo
[Online] httpwwworganotechniecomdoc_en19512pdf [accessed 22
November 2015]
Rosche B Li XZ Hauer B Schmid A and Buehler K (2009) ldquoMicrobial
biofilms A concept for industrial catalysisrdquo Trends Biotechnol 27636ndash43
DOI 101016jtibtech200908001
Ruumlhl M Le Coq D Aymerich S and Sauer U (2012) ldquo13C-flux analysis
reveals NADPH balancing transhydrogenation cycles in stationary phase of
nitrogen-starving Bacillus subtilisrdquo JBiolChem 287(33) 27959ndash27970
Shen N Qin Y Wang Q Liao S Zhu J Zhu Q Mi H Adhikari B Wei Y and
Huang R (2015) ldquoProduction of succinic acid from sugarcane molasses
supplemented with a mixture of corn steep liquor powder and peanut meal
as nitrogen sources by Actinobacillus succinogenesrdquo Appl Microbiol 60544-
551
Shuler M and Kargi F (2002) ldquoBioprocess Engineering Basic Conceptsrdquo 2nd
ed Prentice Hall New York
Song H and Lee SY (2006) ldquoProduction of succinic acid by bacterial
fermentationrdquo Enzyme MicrobTechnol 39-(3)352ndash361
copycopy UUnniivveerrssiittyy ooff PPrreettoorriiaa
72
Spector MP (2009) ldquoMetabolism central (intermediary)rdquo in M Schaechter
(Ed) Encyclopedia of Microbiology 3rd ed Academic Press Oxford 242ndash
264
Sridee W Laopaiboon L Jaisil P and Laopaiboon P (2011) ldquoThe use of
dried spent yeast as a low-cost nitrogen supplement in ethanol
fermentation from sweet sorghum juice under very high gravity
conditionsrdquo Electron JBiotechnol14(6)1-15
Transparency-Market-Research (2014) ldquoSuccinic acid market for 14-bdo
resin coatings dyes amp inks pharmaceutical polyurethane food
plasticizers cosmetics solvents amp lubricants and de-icing solutions
applications-Global industry analysis size share growth trends and
forecast 2012ndash2018rdquo [Online]
httpwwwtransparencymarketresearchcomsuccinic-acidhtml
Urbance SE Pometto AL DiSpirito A and Demirci A (2003) ldquoMedium
evaluation and plastic composite support ingredient selection for biofilm
formation and succinic acid production by Actinobacillus succinogenesrdquo
Food Biotechnol 17(1)53ndash65
Urbance SE Pometto AL DiSpirito A and Denli Y (2004) ldquoEvaluation of
succinic acid continuous and repeat-batch biofilm fermentation by
Actinobacillus succinogenes using plastic composite support bioreactorsrdquo
ApplMicrobiolBiotechnol 65 (6)664ndash70
Van der Werf MJ Guettler MV Jain MK and Zeikus JG (1997)
ldquoEnvironmental and physiological factors affecting the succinate product
copycopy UUnniivveerrssiittyy ooff PPrreettoorriiaa
73
ratio during carbohydrate fermentation by Actinobacillus sp 130Zrdquo Arch
Microbiol 167332ndash342
Van Heerden CD and Nicol W (2013a) ldquoContinuous and batch cultures of
Escherichia coli KJ134 for succinic acid fermentation Metabolic flux
distributions and production characteristicsrdquo Microb Cell Fact 12-(1) 80-
90
Van Heerden CD and Nicol W (2013b) ldquoContinuous succinic acid
fermentation by Actinobacillus succinogenesrdquo Biochem EngJ 735ndash11
Villadsen J Nielsen J amp Lideacuten G (2011) ldquoBioreaction Engineering
Principlesrdquo 3rd ed Springer US Boston MA
Werpy T and Petersen G (2004) ldquoTop value added chemicals from
biomass Vol 1 Results of screening for potential candidates from sugars
and synthesis gasrdquo National Renewable Energy Lab Golden CO US
Xi Y Chen K Xu R Zhang J Bai X Jiang M Wei P and Chen J (2012)
ldquoEffect of biotin and a similar compound on succinic acid fermentation by
Actinobacillus succinogenes in a chemically defined mediumrdquo Biochem Eng
J 6987ndash92
Xi Y Chen K Dai W Ma J Zhang M Jiang M Wei P and Ouyang PK
(2013) ldquoSuccinic acid production by Actinobacillus succinogenes NJ113
using corn steep liquor powder as nitrogen sourcerdquo Bioresour Technol
136 775ndash779
copycopy UUnniivveerrssiittyy ooff PPrreettoorriiaa
74
Xiao X Hou Y Liu Y Liu Y Zhao H Dong L Du J Wang Y Bai G and Luo
G (2013) ldquoClassification and analysis of corn steep liquor by UPLCQ-TOF
MS and HPLCrdquo Talanta 107344ndash348
Xu J and Guo B (2010) ldquoMicrobial succinic acid its polymer poly(butylene
succinate) and applicationsrdquo Plastics from Bacteria Natural Functions and
Applications Microbiology Monographs Vol 14 Springer Verlag
BerlinHeidelberg DOI 101007978-3-642-03287514
Yan Q Zheng P Dong JJ and Sun ZH (2013) ldquoA fibrous bed bioreactor to
improve the productivity of succinic acid by Actinobacillus succinogenesrdquo
JChemTechnolBiotechnol 89(11)1760-1766DOI101002jctb4257
Yan Q Zheng P Tao S and Donga J (2014) ldquoFermentation process for
continuous production of succinic acid in a fibrous bed bioreactorrdquo
Biochem Eng J 9192-98
Zeikus JG Jain MK and Elankovan P (1999) ldquoBiotechnology of succinic acid
production and markets for derived industrial productsrdquo Appl Microbiol
Biotechnol 51545ndash552
Zheng P Dong J Sun Z Ni Y and Fang L (2009) ldquoFermentative production
of succinic acid from straw hydrolysate by Actinobacillus succinogenesrdquo
Bioresour Technol 100 2425ndash2429
copycopy UUnniivveerrssiittyy ooff PPrreettoorriiaa

1
1 Introduction
Modern civilisation is highly dependent on chemical products and fuels
derived from non-renewable raw materials such as crude oil and natural
gas However the depletion of non-renewable raw materials and the
potentially negative long-term environmental impacts caused by the
processing of the raw materials is forcing industries to develop alternative
routes to produce the fuel and chemicals that are essential for current
society (Cok et al 2014)
An alternative that is fast growing in popularity is the replacement of non-
renewable raw materials such as fossil fuels with renewable biomass In
2004 the US Department of Energy (Werpy amp Peterson 2004) identified a
wide range of chemicals that could be produced from renewable biomass
and only 12 of them were listed as top platform chemicals In 2010 the list
was revised and the top 10 chemicals that had the biggest market potential
were declared (Bozell amp Peterson 2010) Succinic acid (SA) was shortlisted
as one of those top 10 chemicals (Bozell amp Peterson 2010) and its
recognition as a potential platform chemical by the US Department of
Energy resulted in opportunities for SA to replace petroleum-based
platform chemicals such as maleic anhydride and adipic acid (Zeikus Jain amp
Elankovan 1999)
At present commercial production of bio-SA is done mainly by four
companies BioAmber Reverdia Myriant and Succinity which Succinity is
the largest in terms of production capacity (Grand-View- Research 2014)
In order for fermentation processes to be economically competitive with
petrochemicals-derived products research on the biological production of
copycopy UUnniivveerrssiittyy ooff PPrreettoorriiaa
2
SA has become extensive over the years because of the need to understand
and refine the process of producing bio-SA
In the literature the choices of microbial organisms available for bio-based
SA production are very diverse although most natural production hosts
described are capnophilic microorganisms (Beauprez De Mey amp Soetaert
2010) A succinogenes stood out as one of the most favourable strains for
commercial production due to its ability to produce SA naturally at high
titres (Zeikus et al 1999) and its tolerance to high acid concentrations (Lin
et al 2008) However one major drawback of Actinobacillus succinogenes
is the auxotrophic requirement for amino acids and vitamins (McKinlay
Zeikus amp Vieille 2005) In fermentation studies usually the essential amino
acids and vitamins are provided by adding yeast extract (YE) or corn steep
liquor (CSL) to the feed medium but in an industrial setup addition of YE
would be highly unfeasible because of the estimated cost which ranges
between US$350kg and US$67kg (Kwon et al 2000 Sridee et al 2011)
For the successful commercial exploitation of A succinogenes the cost of
the fermentation feedstock and the availability of essential and beneficial
ingredients that will influence the conversion process should be taken into
account Since using only YE is not economically feasible cheaper sources
of these critical components are hence required CSL is the first ideal
candidate as its market value ranges between US$007kg and
US$0075kg (Davis et al 2013)
Most fermentation studies done on A succinogenes employ a batch mode of
operation (Beauprez et al 2010) in which final concentrations yield and
productivity are used as performance indicators To date all publications in
which the complex nitrogen source was varied have used batch
copycopy UUnniivveerrssiittyy ooff PPrreettoorriiaa
3
fermentation (Xi et al 2013 Jiang et al 2010 Shen et al 2015 Yan et al
2013) Nevertheless none of these studies distinguished between the
nitrogen requirements for growth-related and non-growth-related SA
production It is well known that the specific growth rate of A succinogenes
is severely inhibited by the accumulation of organic acids in the
fermentation broth (Corona-Gonzaacutelez et al 2008) and that the specific
growth rate approaches zero above an SA titre in the vicinity of 10-15 gmiddotL-1
(Brink amp Nicol 2014) Most batch fermentations reach a final SA
concentration well in excess of this critical SA concentration thus
indicating that a significant fraction of the SA in these studies is produced
under non-growth or maintenance conditions and that the nutrient
requirements for the non-growth production phase might be different to
those of the growth phase in all likelihood less severe
In order to study the non-growth nutrient requirements of A succinogenes
steady state would be ideal this can be achieved through a continuous
mode of operation Maharaj Bradfield and Nicol (2014) have clearly
demonstrated that prolonged steady state operation of A succinogenes
under non-growth conditions is feasible and stable The concentrations of
organic acids in the fermentation broth can be manipulated by altering the
throughput (or dilution rate) in order to induce non-growth production of
SA Another beneficial factor with continuous operations is biofilms which
are unavoidably formed in long-term continuous fermentations and can
significantly enhance productivity as observed by Van Heerden and Nicol
(2013b)
This study aims to evaluate the complex nitrogen requirements of non-
growing A succinogenes biofilms Nitrogen sources used in this study will
copycopy UUnniivveerrssiittyy ooff PPrreettoorriiaa
4
be restricted to YE and CSL since they are the most common sources of
nitrogen sources used in the literature and because of the potential
economic advantage of using CSL Initial biomass accumulation will be
achieved by using only YE for rapid growth of the micro-organism Once
non-growth production of SA commences the YE content will be reduced
and the CSL content will be increased The total complex nitrogen source
concentration in the feed will be maintained at a constant value of 16 gmiddotL-1
throughout the experiments however the percentage of YE in the total
complex nitrogen source will decrease over time Throughout the study the
change in nitrogen source will be referred to as YE in the nitrogen
source At a fixed dilution rate (at a chosen initial SA concentration) for the
whole run productivity and product distribution as a function of YE in
the nitrogen source will be assessed
copycopy UUnniivveerrssiittyy ooff PPrreettoorriiaa
5
2 Literature survey
21 Bio-based chemicals
Bio-based chemicals are platform and intermediate chemicals derived from
biomass feedstocks The US Department of Energy (DOE) identified 300
potential bio-based platform chemicals but most of the proposed
chemicals did not have sufficient market potential nor was it economical to
produce them Only 30 chemicals were considered to be relevant since they
had the potential to replace non-bio-based chemicals and out of those 30
chemicals only 12 building block chemicals were identified as being the
most important because of their potential market chemical derivatives and
synthesis pathways (Werpy amp Peterson 2004)
The importance for bio-based production of fuels and chemicals arises
from the need to move away from petroleum-based production The
depletion of non-renewable feedstocks and the strong demand by
consumers for environmentally friendly energy sources has made the
production of fuels and chemicals from biomass feedstocks to be a
sustainable alternative to the petrochemical production route Government
and industry are now interested in bio-based resources and production and
they understand that to form a sustainable global economy a bio-based
industry should substitute the current petroleum-based routes to produces
fuels and chemicals (Cok et al 2014) However to have a bio-based
economy for the development of highly efficient and cost effective bio-
refineries is essential Petrochemical production has been optimised and
refined over long period of time making it a cheaper option compared with
the relatively new bio-based production Therefore to enhance the
development of a bio-based economy it is essential that the biological
copycopy UUnniivveerrssiittyy ooff PPrreettoorriiaa
6
processes are understood refined and optimised through continuous
research and development (Cok et al 2014)
22 Succinic acid
221 Application of succinic acid
One of the top 12 bio-based platform chemicals recognized by the US DOE
was succinic acid (SA) (Werpy amp Peterson 2004 Bozell amp Peterson 2010)
See Figure 21 for the molecular structure of SA Most of the SA produced to
meet global demand is manufactured through the petroleum route ie it is
produced by the partial oxidation of butane followed by hydrogenation of
the intermediate product which is maleic anhydride However the
expensive conversion costs and non-renewability of this petroleum-based
route for producing SA has limited the SA market to low-cost bulk
application (Xu amp Guo 2010 Beauprez et al 2010)
Figure 21 Succinic acid molecule
Traditionally the application of SA has been limited mainly to four
functional regions its largest area of application is as a surfactant an
additive to a detergent and a foaming agent the second is as an ion chelator
copycopy UUnniivveerrssiittyy ooff PPrreettoorriiaa
7
for preventing corrosion and spot corrosion of metals in the electroplating
industry the third is as an acidulant which is a pH regulator and flavouring
agent in the food industry and the fourth area of application region is in
the pharmaceutical industry specifically in the production of antibiotics
amino acids and vitamins (Xu amp Guo 2010) As a platform chemical it is
also used as a precursor of many commodity or specialty chemicals as seen
in Figure 22 (Zeikus et al 1999)
Figure 22Various chemicals and products derived from succinic acid
(Zeikus et al 1999)
Nevertheless there is potential for the bulk application of SA The key to
the growth of the SA market lies in its derivatives The diamines and diols
that are derived from SA can be used as monomer units of a variety of
Figure 22 Various chemicals and products derived from succinic acid
(Zeikus et al 1999)
copycopy UUnniivveerrssiittyy ooff PPrreettoorriiaa
8
plastics such as polyesters polyamides and polyester amides (Bechthold et
al2008) Among them is the SA derivative 14-butanediol (BDO) It is a
platform chemical for tetrahydrofuran (THF) gamma-butyrolactone (GBL)
and polymers such as polybutylene terephthalate (PBT) and polyurethane
(PU) These chemicals are widely used in the production of engineering
thermoplastics and elastic fibres and because of these applications the
BDO market is expected to increase as the demand for THF and spandex for
sports apparel increase (Grand- View- Research 2014) Another derivative
of SA that is predicted to increase the SA global market is the biodegradable
polybutylene succinate (PBS) and its copolymers PBS polymers have a
range of applications as supermarket bags packaging film mulch film and
other disposable articles Owing to the steady growth of the market for
biodegradable plastic the demand for PBS is expected to increase rapidly
which in turn could grow the SA market (ICIS 2012)
222 Succinic acid market
The global SA market in 2011 was estimated to be worth US$240 million
and it is projected to reach US$836 million by 2018 (Transparency-Market-
Research 2014) due to the development of the bio-SA Consumption of
petroleum-based SA in manufacturing various other chemicals is restricted
due to unpredictability of price and carbon footprints These concerns
however are advancing the progression of biological manufacturing of SA
The major drivers for this growth will be the high cost of crude oil the rise
in carbon footprints and an interest in producing ldquogreenrdquo chemicals Newer
applications of SA as PBS BDO plasticizers and polyesters polyols will fast-
track the future growth of the bio-SA market However the higher price of
bio-SA and the lengthy extraction processes are the primary factors that
copycopy UUnniivveerrssiittyy ooff PPrreettoorriiaa
9
will restrain the market growth for the next few years although the market
is expected to grow at a significant rate over the next seven years (Allied
Market Research 2014)
At present there are numerous institutions researching the development of
SA through bio-based raw materials and there are companies that are
already manufacturing bio-SA for commercial purposes The list of major
companies involved in the production of bio-SA includes BioAmber
Myraint DSM Mitsui amp Co Mitsubishi BASF Roquette Freacuterese SA Purac
and Reverdia In 2013 the global bio-SA market volume was approximately
51 100 tons and in seven years it is expected to reach a market volume of
710 000 tons In that same year BDO is predicted to emerge as the largest
application segment for bio-SA as it will replace maleic anhydride in the
production of BDO every 1MT of maleic anhydride will be replaced by
12MT of bio-SA (Allied Market Research 2014)
223 Bio-based SA production
Bio-SA which has the same structure as petroleum-based SA is produced
by the fermentation of a carbohydrate using a natural producer or an
engineered organism The feedstock used for the production of bio-based
succinic acid can be wheat maize glucose lignocellulosic-derived sugar or
sorghum grain processed to starch (BioConSepT 2013)
Compared with the petroleum-based process the fermentation process has
the advantages of mild operating conditions independence of the fossil
feedstock and fixation of CO2 and with development of genetic engineering
metabolic modification of microbial strains and improvement of
copycopy UUnniivveerrssiittyy ooff PPrreettoorriiaa
10
purification technology the fermentative production of SA from renewable
resources can be more cost-effective than the fossil-based processes (Xu amp
Guo 2010)
To date various microorganisms have been reported to produce SA such
as typical gastrointestinal bacteria and rumen bacteria and some
lactobacillus strains (Kaneuchi Seki amp Komagata 1988 Beauprez et al
2010) Among them Actinobacillus succinogenes (Guettler Rumler amp Jain
1999) Anaerobiospirillum succiniciproducens (Oh et al 2008) Mannheimia
succiniciproducens (Lee et al 2000) and genetically modified Escherichia
coli (Lin Bennet amp San 2005) are the most promising strains for producing
SA at high yields Fungi species such as Aspergillus niger Aspergillus
fumigatus Byssochlamys nivea Lentinus degener Paecilomyces varioti
Penicillium viniferum and yeast Saccharomyces cerevisia also produce
succinic acid but not in high concentrations or yields (Song amp Lee 2006)
Nevertheless for industrial applications A succinogenes stands out because
it is by far the most studied wild strain (Brink amp Nicol 2014) and its ability
to produce high concentrations of SA naturally from a broad range of
carbon sources (Guettler et al 1999 McKinlay Vieille amp Zeikus 2007)
further makes it ideal for commercial applications
23 Actinobacillus succinogenes
231 Description of microorganism
A succinogenes a Gram-negative rod-shaped and non-motile bacterium
isolated from bovine rumen (Guettler et al 1999) is considered to be one
copycopy UUnniivveerrssiittyy ooff PPrreettoorriiaa
11
of the top natural SA producing microorganisms (McKinlay et al 2007
Brink amp Nicol 2014) It produces SA as part of a mixed acid fermentation in
which acetic acid (AA) formic acid (FA) and ethanol are the by-products It
is capable of digesting a wide range of carbon sources such as glucose
fructose mannitol arabitol sorbitol sucrose xylose and arabinose under
anaerobic conditions (Van der Werf et a 1997) but most laboratory
experiments use glucose fructose xylose and sucrose as carbon substrates
A succinogenes grows optimally at moderate temperatures (37 degC to 39 degC)
and it is facultative anaerobic ie it can survive in the presence or absence
of oxygen Furthermore it is capnophilic because its growth is enhanced at
increased CO2 concentrations (Guettler et al 1999) and it is a
chemoheterotroph that grows optimally at pH ranging from 6 to 74
232 Metabolic pathway
As stated earlier A succinogenes is a promising candidate for industrial SA
production However in addition to producing SA it also produces formic
acid (FA) acetic acid (AA) and sometimes ethanol The summarised version
of the metabolic pathway for A succinogenes is shown in Figure 23
A succinogenes ferments glucose to phosphoenolpyruvate (PEP) by
glycolysis PEP is thought to serve as the point of divergence between the
FA AA and ethanol producing pathway (C3 pathway) and the SA producing
(C4) pathway The path from glucose to PEP is neutral overall in terms of
adenosine triphosphate (ATP) production but one-third of nicotinamide
adenine dinucleotide (NADH) is produced per cmol of glucose consumed
copycopy UUnniivveerrssiittyy ooff PPrreettoorriiaa
12
C4 metabolic pathway (reverse tricarboxylic pathway)
Overall this pathway leads to the formation of SA and two molecules of
NADH and one molecule of CO2 must be consumed to form one molecule of
SA Ideally one would prefer the carbon flux to follow this route to attain
homosuccinate production
The key enzyme in this pathway is PEP carboxykinase because it pushes
the carbon flux from PEP to oxaloacetate which later on becomes SA This
enzyme is regulated by CO2 levels ie the level of CO2 available to A
succinogenes will have an influence on the SA production of the organism
(Van der Werf et al 1997) Hence it will be imperative to achieve correct
extracellular and intracellular CO2 levels during SA production
C3 metabolic pathway
However the C3 pathway cannot be avoided due to the redox requirement
of the cell In this pathway PEP is converted to pyruvate by pyruvate
kinase generating one molecule of ATP during the process Pyruvate is
then converted to acetyl-CoA by either pyruvate dehydrogenase (PDH)
andor pyruvate-formatelyase (PFL)
Pyruvate conversion with PDH results in one molecule of CO2 and one
molecule of NADH being formed alongside one molecule of AA With PFL
FA is produced instead of CO2 and NADH but FA can be further broken
down to CO2 and NADH by the enzyme formate dehydrogenase (FDH)
copycopy UUnniivveerrssiittyy ooff PPrreettoorriiaa
13
The FDH activity (encoded by the fdhF gene in A succinogenes) is known to
occur only under the following conditions (Spector 2009)
Absence of an electron acceptor such as oxygen or nitrate
Acidic pH conditions
Presence of FA
PFL expression is stated to be dependent upon two glycolysis enzyme
activities namely phosphoglucoisomerase and phosphofructokinase
Interestingly the expression of PFL and FDH enzymes is reported to
increase under carbon energy source starvation (Spector 2009)
Acetyl-CoA is the branch point at which both ethanol and AA are later
formed In this process a molecule of ATP is produced per molecule of AA
formed For one molecule of ethanol formed two molecules of NADH are
absorbed However ethanol formation can be reduced if there is
intracellular availability of CO2 to the organism (Van der Werf et al 1997)
copycopy UUnniivveerrssiittyy ooff PPrreettoorriiaa
14
Figure 23 Simplified metabolic network of A succinogenes (based on
McKinlay et al (2007)
copycopy UUnniivveerrssiittyy ooff PPrreettoorriiaa
15
Pentose phosphate pathway (PPP)
Figure 23 gives a simplified version of the metabolic pathway of A
succinogenes However several studies have noted that the pentose
phosphate pathway is an additional pathway for the A succinogenes (Brink
amp Nicol 2014 Bradfield amp Nicol 2014 Van der Werf et al 1997 McKinlay
et al 2007 McKinlay et al 2005) McKinlay (2007) stated that the PPP
only contributed 20 to the NADPH required for the organismrsquos growth
But Bradfield amp Nicol (2014) and Brink amp Nicol (2014) postulated that the
contribution of the PPP could increase and be more than predicted when
the organism enters the maintenance phase or non-growth phase
According to Ruumlhl et al (2012) a resting non-growing Bacillus subtilis cell
showed constant metabolic activity without cell growth which lead to an
apparent overproduction of nicotinamide adenine dinucleotide phosphate
(NADPH) (via the PPP) which is then converted by transhydrogenase into
NADH Bradfield amp Nicol (2014) claim that it is possible that this can also
occur with A succinogenes as it does possess the transhydrogenase The
analysis by Bradfield amp Nicol (2014) indicated an under-prediction of the
YAASA for the growth metabolism (associated with NADH ldquolossesrdquo) while an
over-prediction of the YAASA is achieved for the maintenance metabolism
(associated with NADH ldquogainrdquo) This could imply that different metabolic
pathways are employed under growth and maintenance conditions
Medium contributions were previously considered as the source for the
NADH disparities during the maintenance phase but this reasoning can be
ruled out given the results of the study done by Brink amp Nicol (2014) in
which the same medium resulted in opposite redox balance trends with
regard to the growth and non-growth phases
copycopy UUnniivveerrssiittyy ooff PPrreettoorriiaa
16
24 SA yield considerations
The theoretical maximum yield of SA on a carbon substrate through
fermentation can be determined by considering the net metabolic pathway
involved and a redox balance as illustrated by Villadsen Nielsen amp Lideacuten
(2011 159-163) The overall black box stoichiometry in converting glucose
to SA with no biomass and no by-product formation is
C6H12O6 + 120788
120789CO2rarr
120783120784
120789C4H6O4 +
120788
120789H2O (21)
From Equation 21 the theoretical maximum yield of succinic acid on
glucose (YGLSA) is 112 gmiddotg-1 However it is not possible to achieve the
maximum yield because actual SA yield will depend on the active metabolic
pathway of the organism and the associated product distribution To
determine the maximum YGLSA possible with by-product formation a redox
balance is required
Pyruvate metabolism
Assuming that there is no carbon flux to cell growth and if only the PDH
enzyme is active or FDH converting all FA the overall black box
stoichiometry in converting glucose to SA and AA with no biomass
formation is
C6H12O6 + 120784
120785CO2rarr
120786
120785C4H6O4 +
120784
120785C2H4O2 (22)
Since no FA is formed the YAAFA will be 0 gmiddotg-1 This pathway releases one
molecule of NADH for every molecule of AA produced (see Figure 24) The
copycopy UUnniivveerrssiittyy ooff PPrreettoorriiaa
17
NADH would be consumed by the C4 pathway to produce SA and then the
theoretical YGLSA would be 088 gmiddotg-1
Figure 24 Simplified metabolic network of A succinogenes (PDH
active)
On the other hand if only the PFL enzyme is active both FA and AA will be
formed (see Figure 25) The overall black box stoichiometry in converting
glucose to SA AA and FA with no biomass formation is
C6H12O6 + CO2rarrC4H6O4 +C2H4O2 + CH2O2 (23)
For every molecule of FA formed a molecule of AA will be produced so the
YAAFA will be 076 gmiddotg-1 As a result YGLSA will be 066 gmiddotg-1 If both PFL and
FDH enzymes are active then FA will be broken down to produce CO2 and
NADH which will result in YAAFA being 0 gmiddotg-1 and YGLSA being 088 gmiddotg-1
copycopy UUnniivveerrssiittyy ooff PPrreettoorriiaa
18
Figure 25 Simplified metabolic network of A succinogenes (PFL
active)
Nevertheless as mentioned by Van Heerden amp Nicol (2013a)the maximum
theoretical yield of SA can be obtained through the metabolic engineering
of A succinogenes This can be achieved by manipulating the organism to
use the oxidative part of the tricarboxylic acid (TCA) cycle under anaerobic
conditions (see Figure 26a)
copycopy UUnniivveerrssiittyy ooff PPrreettoorriiaa
19
Figure 26 (a) Simplified metabolic network of A succinogenes
(oxidative TCA cycle active) (b) Simplified metabolic network of A
succinogenes (glyoxylate bypass active)
Alternatively the glyoxylate bypass can be utilised (Figure 26b) to give the
same result For both these scenarios the mass-based SA-to-glucose ratio is
112 gmiddotg-1 which is the maximum theoretical yield of SA that can be
achieved
25 Nitrogen source for A succinogenes
The composition of the growth medium is a key factor in microbial
fermentations An important element of the fermentation medium which
will be essential for the growth of the organism is the nitrogen source
In the rumen A succinogenes is surrounded by a massive source of
nutrients which allow the organism to thrive But outside the rumen more
specifically in the laboratory or in an industrial fermentation setup
copycopy UUnniivveerrssiittyy ooff PPrreettoorriiaa
20
nutrients important for growth of the organism must be provided Since
A succinogenes is auxotrophic it requires certain amino acids and vitamins
to be provided for growth and SA production McKinlay et al (2010)
determined the essential vitamins required for the growth to be nicotinic
acid pantothenate pyridoxine and thiamine and the needed amino acids to
be cysteine glutamate and methionine Furthermore they concluded that
it is able to grow without biotin supplementation
By contrast Xi et al (2012) declared the essential vitamins to be only biotin
and nicotinic acid and the essential amino acids to be only glutamate and
methionine Nevertheless the addition of these defined components makes
the growth medium expensive for industrial use (Shuler amp Kargi 2002 52)
This collection of vitamins and amino acids is thought to be better
introduced to the organism in a complex form (eg yeast extract or corn
steep liquor) where the components and concentration of the nitrogen-
carrying compounds are unknown A complex form of nitrogen source is
less expensive than a defined form and it is said to produce higher cell
growth compared with media with a defined nitrogen source (Shuler amp
Kargi 2002 52)
Batch fermentation studies
Table 21 lists batch studies that investigated alternative nitrogen sources
for SA production and A succinogenes growth From the studies that used
only one type of nitrogen source (either YE or YE amp CSL or CSL amp vitamins)
it can be seen that studies that used only YE generally had a lower YGLSA
compared with the studies that used a combination of YE and CSL as the
nitrogen source Addition of vitamins (Yan et al 2013) to CSL produced SA
copycopy UUnniivveerrssiittyy ooff PPrreettoorriiaa
21
yields and cell growth that were better than the results produced by the YE
and CSL combination
Studies that compared different nitrogen sources within the same study
such as Jiang et al (2010) and Shen et al (2015) compared the
performance of several nitrogen sources inorganic and organic and
observed the following
Inorganic nitrogen sources such as (NH4)2SO4 or NH4Cl were the
worst performing with regard to cell growth and SA yield (Jiang et al
2010)
YE as the only nitrogen source in a growth medium produced the
highest SA yield and the highest dry cell weight (DCW) in comparison
with other nitrogen sources (Jiang et al 2010 Shen et al 2015)
CSL a by-product of corn starch production as the only nitrogen
source in a growth medium was the second best performer (Jiang et
al 2010 Shen et al 2015)
CSL medium did not achieve full carbon substrate conversion
compared with YE medium at the end of the batch fermentation
(Jiang et al 2010 Shen et al 2015)
These studies suggested that the most promising nitrogen source in terms
of A succinogenes growth and SA yield from carbon substrate was yeast
extract (YE) YE is said to have various vitamins amino acids minerals and
trace metals that are necessary to stimulate the growth of A succinogenes
and synthesize its metabolites (Kasprow Lange amp Kirwan 1998) Although
YE is considered to be the best source of nitrogen its price ranges from
US$350kg to US$67kg (Kwon et al 2000 Sridee et al 2011) while the
copycopy UUnniivveerrssiittyy ooff PPrreettoorriiaa
22
price of CSL ranges from US$007kg to US$0075kg (Davis et al 2013)
which makes YE an expensive and unfeasible nitrogen source for long-term
industrial fermentation (Jiang et al 2010 Xi et al 2013 Shen et al 2015)
and CSL an economically viable alternative to YE The feasibility of CSL
feasibility as a nitrogen source was also investigated using microorganisms
such as Mannheimia succiniciproducens (MBEL55E) and Anaerobiospirillum
succiniciproducens Those studies (Lee et al 2000 2002) came to the same
conclusion as Jiang et al (2010) and Shen et al (2015) the inexpensive CSL
can replace the expensive YE as a nitrogen source to promote cell growth
and SA production
A possible reason why CSL proved to be second best to YE is because CSL
contained the cofactor biotin which is considered to be vitally important
for the metabolism of protein lipid and carbohydrate (Xi et al 2012) The
biotin content in CSL is 1 mgmiddotkg-1 and this is said to be sufficient to make a
significant contribution to the nutritional requirement of A succinogenes or
other microorganisms (Nghiem et al 1996) However Jiang et al (2010)
and Shen et al (2015) noticed that with CSL as a nitrogen source in
contrast to YE as the nitrogen source there was a significant amount of
residual glucose that remained at the end of the batch fermentation Shen
et al (2015) suggest that CSL may lack trace elements and certain nitrogen-
containing compounds that prevent A succinogenes from meeting its
normal physiological needs Another reason could be that the batch
fermentation time was not long enough for the CSL medium to reach full
carbohydrate consumption Since no profile of the variables over time was
given for these studies it is hard to determine whether the residual glucose
found in the CSL medium was due to a lack of nutrients or productivity
reduction
copycopy UUnniivveerrssiittyy ooff PPrreettoorriiaa
23
Xi et al (2013) stated that the heme and CSL combination in the production
medium improved SA production by creating a more reductive
environment (the initial redox potential was very low when heme was
added to the medium)
copycopy UUnniivveerrssiittyy ooff PPrreettoorriiaa
24
Table 21 Batch fermentation studies of A succinogenes using different nitrogen sources namely YE and CSL
Study Model Nitrogen source (gmiddotL-1)
Carbon Source
CSo (gmiddotL-1)
CSA (gmiddotL-1)
YGLSA
(gmiddotg-1) YAASA
(gmiddotg-1) YAAFA
(gmiddotg-1)
DCW
(gmiddotg-1)
Gunnarsson
Karakashevamp
Angelidaki (2014)
130Z YE(20) Synthetic
hydrolysate
36 30 083 86 058 25
Zhen et al (2009)
CGMCC
1593
YE(15) Straw
hydrolysate
58 455 0807 7583 083 56
Corona-Gonzalez et
al (2008)
130Z YE(10) Glucose 547 338 062 52 11 37
Liu et al (2008)
CGMCC
1593
YE(10) Sugarcane
molasses
644 464 072 77 3 5
Yan et al (2013)
CCTCC
M2012
036
CSL(25) amp
vitamins
mixture
Glucose 50 39 085 - - -
copycopy UUnniivveerrssiittyy ooff PPrreettoorriiaa
25
Study Model Nitrogen source (gmiddotL-1)
Carbon Source
CSo (gmiddotL-1)
CSA (gmiddotL-1)
YGLSA
(gmiddotg-1) YAASA
(gmiddotg-1) YAAFA
(gmiddotg-1)
DCW
(gmiddotg-1)
CCTCC
M2012
036
CSL(25) amp
vitamins
mixture
Glucose 100 881 088 - - -
Jiang et al (2014)
CGMCC
1716
YE(10) amp
CSL(5)
mixture
Sucrose 100 55 069 11 09 3
Chen et al (2010)
NJ113 YE(10) amp
CSL(5)
mixture
Glucose 50 42 084 - - -
Urbance et al
(2004)
130Z YE(6) amp
CSL (10)
mixture
Glucose 40 339 087 - - -
Urbance et al
(2003)
130Z YE(6) amp
CSL(10)
mixture
Glucose
20 174 087 - - -
copycopy UUnniivveerrssiittyy ooff PPrreettoorriiaa
26
Study Model Nitrogen source (gmiddotL-1)
Carbon Source
CSo (gmiddotL-1)
CSA (gmiddotL-1)
YGLSA
(gmiddotg-1) YAASA
(gmiddotg-1) YAAFA
(gmiddotg-1)
DCW
(gmiddotg-1)
Shen et al (2015) GXAS1
37
YE(12) Sugarcane
molasses
70 546 078 75 5 38
CSL(206) Sugarcane
molasses
70 479 068 76 573 3
Xi et al (2013)
NJ113 YE(10) amp
CSL(75)
mixture
Glucose 30 171 057 372 - 37
CSL (15) Glucose 30 151 050 458 - 31
CSL (15) amp
heme (0001)
mixture
Glucose 30 217 072 493 - 33
Jiang et al (2010)
NJ113 YE(15) Glucose 70 487 070 - - 45
CSL(15) Glucose 70 96 014 - - 21
copycopy UUnniivveerrssiittyy ooff PPrreettoorriiaa
27
Continuous fermentation studies
To date all continuous fermentation studies except the study done by Yan
et al (2014) used a combination YE and CSL (based on the revised SA
medium by Urbance et al 2003) as nitrogen sources None of these studies
investigated on the effect of varying the nitrogen sources type or the
concentration on SA productivity and cell growth In Table 22 it can be
seen that with a fixed combination of YE and CSL growth medium Maharaj
et al (2014) achieved the highest SA yield on glucose mass ratio and
highest SA concentration However Yan et al (2014) reported even YGLSA
and SA concentration and they used a combination of the inexpensive CSL
and defined vitamins
26 Continuous fermentation
In an economic context the need to produce large volumes of product is the
main reason for the selection of the continuous reactor mode preferably
one in which a wild strain acts as the biocatalyst to diminish mutation
problems (Villadsen et al 2011 384) Continuous systems are
advantageous also on a monetary scale because they have lower capital and
labour costs in comparison with batch production systems and since
continuous processes are time independent constant product quality is
more attainable compared with batch or fed-batch processes (Villadsen et
al 2011 384)
A unique aspect of continuous operation is the formation of biofilm which
is inevitable during pro-longed A succinogenes fermentations (Van
Heerden amp Nicol 2013 Maharaj amp Nicol 2014 Urbance et al 2003
copycopy UUnniivveerrssiittyy ooff PPrreettoorriiaa
28
Bradfield amp Nicol 2014 Brink amp Nicol 2014) Biofilms are microbial cell
layers that are embedded in self-produced exopolysacharide (EPS) which is
prone to attaching to surfaces Reactors with biofilms can be operated for
longer periods of time and are very economical because of the self-
immobilizing nature of A succinogenes which results in high volumetric
productivities (Rosche et al 2009)
It is well-known that the growth of A succinogenes is inhibited by the total
concentration of acids in the medium (Corona-Gonzaacutelez et al 2008 Lin et
al 2008 Urbance et al 2004) and therefore at a low throughput (or D)
growth of the organism will be slow since that is when high yields and acid
concentrations are found At a high D the biofilm is established at a quicker
rate but process instability is more severe (Maharaj amp Nicol 2014) The
excessive biofilm shedding at this point does not allow the system to reach
steady state easily and maintain it At a low D the effects seen with a high D
are not observed According to Bradfield amp Nicol (2014) the concentrations
produced at a low D are linked to the maintenance phase and therefore
only a small fraction of the biomass is replicating which allows the system
to reach and maintain steady state (Maharaj amp Nicol 2014)
copycopy UUnniivveerrssiittyy ooff PPrreettoorriiaa
29
Table 22 Continuous fermentation studies of A succinogenes using different nitrogen sources namely YE and CSL
Study Organism model
Nitrogen source
Dilution CSo (gmiddotL-1)
CSA (gmiddotL-1)
YGLSA
(gmiddotg-1) YAASA
(gmiddotg-1) YAAFA
(gmiddotg-1)
DCW
(gmiddotg-1)
Maharaj et al
(2014)
130Z YE(6) amp
CSL(10)
0054
071
326
141
09
080
-
-
-
-
-
-
Yan et al
(2014)
CCTCC
M2012036
CSL(25) amp
vitamins
01-04 188-
3996
084-
092
- - -
001-01 422-
636
072-
085
- - -
Van Heerden
and Nicol
(2013b)
130Z YE(6) amp
CSL(10)
049 13 071 25 077 -
Urbance et al
(2004)
130Z
YE(6) amp
CSL(10)
085
104
076
-
-
-
copycopy UUnniivveerrssiittyy ooff PPrreettoorriiaa
30
3 Materials and Methods
31 Microorganism and growth
Microorganism
In this study Actinobacillus succinogenes 130Z (DSM No 22257 or ATCC
No 55618) was used It was obtained from the German Collection of
Microorganisms and Cell Cultures (Braunschweig Germany) The culture
was stored in a cryopreservation solution at a temperature of ndash75 degC
Inoculum preparation
Inoculum was prepared by transferring 1 ml of the preserved culture to a
vial containing 15 ml of sterilized tryptone soy broth (TSB) The vial was
sealed and stored in an incubator at 37 degC with a shaker speed of 100 rpm
for a duration of 16ndash24 h The broth was later tested for contamination and
usability by performing an analysis with high-performance liquid
chromatography (HPLC) If the broth contained lactic acid or ethanol it was
considered to be contaminated and if a considerable amount of SA was
found in the broth then the culture was deemed to be viable
32 Fermentation media
All chemicals used to make the fermentation medium were obtained from
Merck KgaA (Darmstadt Germany) unless otherwise indicated The feed
medium consisted of three parts a growth medium a phosphate buffer and
copycopy UUnniivveerrssiittyy ooff PPrreettoorriiaa
31
a glucose solution The fermentation medium is based on the composition
proposed by Urbance et al (2003)
Six different growth media were used during the fermentation runs each
medium were composed of a different type andor concentration of
nitrogen sources The first medium used only yeast extract (YE) as the
nitrogen source and the last medium used only corn steep liquor (CSL) The
first run had approximately 33 gmiddotL-1of D-glucose added to the medium and
the last run had approximately 45 gmiddotL-1 of D-glucose added to the medium
Table 31 gives details of the components and the respective concentrations
used to make the feed media CO2(g) (Afrox Johannesburg South Africa)
was fed into the recycle line at 10 vvm to serve as the inorganic carbon
source
copycopy UUnniivveerrssiittyy ooff PPrreettoorriiaa
32
Table 31 Specifications of feed mediaa used during fermentations
Medium
1
Medium
2
Medium
3
Medium
4
Medium
5
Medium
6
Glucose (gmiddotL-1)
Runs 1 amp 2 33 33 33 33 33 33
Run 3 45 45 45 45 45 45
Growth (gmiddotL-1)
YE 16 10 6 3 1 0
CSL 0 6 10 13 15 16
YE ( of YE in
N2 source)d
100 625 375 1875 625 0
NaCl 1 1 1 1 1 1
MgCl2middot6H2O 02 02 02 02 02 02
CaCl22H2O 02 02 02 02 02 02
CH₃COONa 136 136 136 136 136 136
Na2Smiddot9H2O 016 016 016 016 016 016
Antifoam Ybc 1 1 1 1 1 1
Phosphate (gmiddotL-1)
K2HPO4 16 16 16 16 16 16
KH2PO4 32 32 32 32 32 32
a Based on Urbance et al (2003)
b Antifoam from Sigma-Aldrich St Louis USA
c Concentration is in mlmiddotL-1
d YE in N2 source is the of YE in the total complex nitrogen source in the medium
The concentration of the total complex nitrogen source (a combination of CSL and
powder YE) was 16 gmiddotL-1 throughout the fermentations for all runs
copycopy UUnniivveerrssiittyy ooff PPrreettoorriiaa
33
33 Bioreactor
The bioreactor pictured in Figure 31 (a amp b) was a glass cylindrical body
set between an aluminium base and head with an external recycle line to
provide agitation The working volume of the reactor (including recycle)
was 356 mL The liquid level in the reactor was maintained by using a
peristaltic pump on the product line All pumps used in the system were
peristaltic pumps A wooden stick covered in terry cloth was inserted in the
glass cylindrical body for biofilm attachment In fermentation run1 and
run2 one stick was used and in fermentation run 3 three sticks were used
CO2 flow rates were controlled using Brooks 5850S mass flow controllers
(Brooks Instrument Hungary) and the CO2 entered the reactor via an inlet
in the recycle line which was connected to a 02 μm PTFE membrane filter
(Midisart 2000 Sartorius Goumlttingen Germany) The gas exited the system
through a filter with the same specifications as mentioned earlier
connected to the foam-trap
The pH was measured using a CPS 71D-7TB21 glass combination probe
(Endress+Hauser Gerlingen Germany) held within a stainless-steel holder
connected in-line within the recycle stream Maintaining the pH at 68
required the use of a Liquiline CM442 (Endress+Hauser Gerlingen
Germany) in which an internal relay controlled the dosing of 10 M
unsterilized NaOH in an onndashoff fashion Temperature was controlled in a
similar fashion a hotplate was used to provide the heat required to
maintain the temperature at 37 degC For better control of temperature
fluctuations the hotplate was linked to the National Instrument (NI)
module The NI module is further discussed in Section 35
copycopy UUnniivveerrssiittyy ooff PPrreettoorriiaa
34
Figure 31a) Simplified schematic of bioreactor setup
No Description
1 Gas filter
2 Foam-trap 3 Medium
reservoir 1 4 Antifoam
reservoir 5 Medium
reservoir 2 6 Inoculation
septum 7 Reactor body 8 Hot plate 9 Temperature
control 10 pH probe 11 Product
reservoir 12 NaOH reservoir 13 CO2 cylinder 14 Controller 15 Recycle pump 16 Dosing pump
17 Gas flow controller
8
7
2
3
4
5
11
12
13
17
T pH
6
C
DAQ
PC
1
9 10
14
15
16
copycopy UUnniivveerrssiittyy ooff PPrreettoorriiaa
35
Figure 31b) Bioreactor setup
copycopy UUnniivveerrssiittyy ooff PPrreettoorriiaa
36
34 Fermentation procedure
The three parts of the fermentation medium (growth medium buffer and
glucose) were prepared in separate bottles and were autoclaved at 121degC
for 60 minutes To prevent unwanted reactions amongst the medium
components the three parts of the medium were only mixed once the
bottles had cooled to room temperature (approx 24 degC) The reactor
system (excluding NaOH) was also autoclaved at the same temperature and
duration as stated above
The first fermentation medium (see Table 31) was used to start up the
fermentation It had only YE as the nitrogen source This was done to form
a substantial amount of biofilm for full glucose consumption The feed
setup was then connected to the sterile reactor system with a sterile
coupling The coupling consisted of a U-connection one half of which was
fixed to the feed setup and the other half to the reactor system Each half of
the connection had a ball valve to isolate the system from the external
environment The half connections were then coupled and placed in an oil
bath at 140 degC for 20 minutes The reactor was then filled with medium and
once the temperature and pH had stabilized to 37degC and 68 respectively
10 mL of inoculum was injected into the reactor through a silicon septum
attached to the reactor head
Fermentations were started off by operating the system at batch conditions
for 17 hours and then changing to continuous operation at a low dilution
rate This allowed for cell accumulation and prevented cell washout
Addition of antifoam into the reactor was only done when deemed
necessary The recycle flow rate was kept constant at 500 mLmiddotmin-1 in all
fermentations to maintain similar shear conditions The CO2 flow rate was
copycopy UUnniivveerrssiittyy ooff PPrreettoorriiaa
37
set at a vvm of 10 as it seemed sufficient to maintain CO2 saturation in the
reactor After a few days of operation biofilm appeared on internal surface
of the bioreactor as well as the wooden stick covered in terry cloth which
was inserted into the glass cylinder as the intended surface for biofilm
attachment
Controlled variables
Dilution rates for the fermentation runs were determined using the first
fermentation medium Once biofilm had formed in the reactor after a few
days of continuous operation the dilution rate was adjusted until 95 of
initial glucose had been consumed For R3 90 was the target for glucose
consumption The dilution rate was fixed for the entire experimental run if
the above mentioned glucose consumption stayed more or less constant for
three days or more
Media change during fermentation
Similar to the feed connection to the reactor the different medium setups
were connected to the sterile reactor system with another sterile coupling
The half connections were then coupled and the U-connection was placed
in an oil bath at 140 degC for 40 minutes
35 Online monitoring
Monitoring of the process was performed in a similar fashion to that of Van
Heerden and Nicol (2013b) in which the time-averaged NaOH dosing
copycopy UUnniivveerrssiittyy ooff PPrreettoorriiaa
38
fraction was linked to a productivity factor allowing an estimated SA
concentration to be calculated in real-time A LabVIEW (NI module)
program was used to monitor and control the reactor The program was
linked to the reactor instrumentation using a cDAQ-9184 data acquisition
device (National Instruments Hungary) with voltage and current input
modules and a current output module Temperature dosing and antifoam
flowrates were controlled with the program Temperature pH gas flow
rates and the time-averaged dosing of NaOH were recorded through the
program
36 Analytical methods
HPLC analysis
High-performance liquid chromatography (HPLC) was used to determine
the concentrations of glucose SA and other organic acids Analyses were
done using an Agilent 1260 Infinity HPLC (Agilent Technologies USA)
equipped with an RI detector and a 300 mm times 78 mm Aminex HPX-87 H
ion-exchange column (Bio-Rad Laboratories USA) The mobile phase (03
mLmiddotL-1 and 11 mLmiddotL-1H2SO4) flowrate was 06 mLmiddotmin-1 and the column
temperature was 60degC
Suspended cell analysis
Once the reactor had reached a steady state the product stream was
collected in a bottle that was kept in a small bar refrigerator The product
bottle was kept cool to prevent further growth of cells and metabolic
activity and depending on the dilution rate the duration of the collection
period varied from 12 to 72 hours The collected volume was then
copycopy UUnniivveerrssiittyy ooff PPrreettoorriiaa
39
thoroughly mixed and a 12 mL sample was collected for suspended cell
analysis This was performed by splitting the 12 mL sample into 12 x 1 mL
samples and centrifuging at 4000 rpm for 2 minutes The samples were
centrifuged three times and after each centrifugation the supernatant was
poured out and the cell precipitate washed in distilled water Following the
third centrifugation the cell precipitates were transferred to an empty
glass vial that had been measured beforehand The cell precipitates were
then dried to a constant weight in an 85 degC oven
Mass balance analysis
Overall mass balances were performed to assess the accuracy of each
sample The mass balances were performed by comparing the
stoichiometric amount of glucose required to achieve the experimental
concentrations of SA AA and FA with the experimental amount of glucose
consumed
37 Steady state check
When the time-averaged dosing profile constructed by the LabVIEW
program ceased to fluctuate by a 5 standard deviation of the average
dosing flow it was assumed that the system had reached pseudo-steady
state and the product stream was sampled To further ascertain steady
state the glucose and organic acid concentrations in product samples
frequently taken over a certain period were compared and if negligible
differences were found between the sample data the system was
confirmed to be at steady state
copycopy UUnniivveerrssiittyy ooff PPrreettoorriiaa
40
38 Summary of fermentation
Results were obtained over three continuous fermentation runs Several
other runs were attempted but did not provide any results that were
valuable due to upsets encountered in the system The three runs
mentioned in Table 32 were conducted to prove the repeatability of trends
observed in the first fermentation run
Table 32 Summary of fermentation runs performed
Five different mediums each with a glucose concentration of 33 gmiddotL-1 were
used in fermentation run 1 (R1) This gave an indication of what the
general trend would be of the product distribution The dilution rate was
adjusted until steady state was achieved with only 5 of initial glucose
concentration as residual for the first medium Therefore with the 33 gmiddotL-1
initial glucose a Df of 008 h-1 was set Fermentation run 2 (R2) was
conducted to prove the repeatability of the trend seen in R1 Fermentation
run 3 (R3) was conducted with six different media at a glucose
concentration of 45 gmiddotL-1 and 90 glucose conversion was only achieved
when the Df was lowered to 0041 h-1
Run Operating
hours (h)
Glucose
(gmiddotL-1)
Df
(h-1) Medium No
1 1 008 33 0080 1 2 3 4 5 -
2 1 104 33 0045 1 3 5 - - -
3 1 272 45 0041 1 2 3 4 5 6
copycopy UUnniivveerrssiittyy ooff PPrreettoorriiaa
41
Biofilm attachment and appearance
Approximately 72 hours after inoculation of the bioreactor biofilm started
forming on the glass wall of the reactor A substantial amount of biofilm
inside the bioreactor only formed after plusmn 330 operating hours The
structure and the amount of the biofilm varied throughout the
fermentations and it appeared that the biofilm was dependent on the
following
the surface to which it is attached
the history of the fermentation
the composition of the fermentation medium
Figure 32 (a) shows the bioreactor before inoculation and without cell
attachment After operation for more than 330 hours using only YE as the
nitrogen source a thick mass of biofilm had formed as shown in Figure
32 (b) However as the CSL concentration on the fermentation medium
increased more biofilm started to shed and eventually when only CSL was
used at the nitrogen source there was almost no biofilm attachment on the
glass surface of the bioreactor (as seen in Figure 32 (c))
Although there was not much biofilm on the glass surface there was
biofilm on the internals of the reactor (the wooden sticks covered in terry
cloth) Figure 33 (a amp b) illustrates the sticks covered in biomass at the end
of the fermentations
copycopy UUnniivveerrssiittyy ooff PPrreettoorriiaa
42
Figure 32 a) Bioreactor before inoculation b) Biofilm growth using
only YE as nitrogen source c) Bioreactor with only CSL as nitrogen source
(a) (b) (c)
copycopy UUnniivveerrssiittyy ooff PPrreettoorriiaa
43
Figure 33 a) Internal support for biofilm attachment (at the end of
fermentation run 1) b)Internal supports for biofilm attachment (at the end
of fermentation run 3)
(a) (b)
copycopy UUnniivveerrssiittyy ooff PPrreettoorriiaa
44
4 Results and Discussion
41 Experimental strategy for different runs
The objective of R1 (fermentation run 1) was to find steady state data that
could be analysed to understand the influence of YE and CSL on the growth
and productivity of A succinogenes As seen in Table 31 the media used in
the experiments differed from each other regarding the concentrations of
CSL and YE but the total complex nitrogen source concentration in the
media remained constant The intended experimental plan was to report
the steady state product concentrations as the concentration of YE in the
growth medium varied (ie as the YE concentration decreased and the CSL
concentration increased) R2 (fermentation run 2) which followed the
same procedure as R1 was conducted to prove that the data found in R1
was repeatable R3 (fermentation run 3) was an attempt to achieve high SA
concentrations following the same experimental plan as R1 except that R3
used a high initial glucose feed concentration and had additional internal
support to increase the surface area available for biofilm attachments
All fermentations began with a growth medium that contained only YE as
the nitrogen source (100 YE) and once a healthy and stable biofilm had
formed the growth media were changed according to the procedure
explained in Section 34 Fermentation procedure
Initially R1 had a high biomass content and activity (when only YE was in
the fermentation medium) and as the YE content in the growth medium
decreased the biomass activity decreased R2 was effectively a repetition
of R1 but due to the low initial biomass activity the dilution rate was
adjusted to have approx 95 glucose conversion (when the growth
copycopy UUnniivveerrssiittyy ooff PPrreettoorriiaa
45
medium had only YE as the nitrogen source) Despite the increased surface
area for biofilm attachment the biomass in R3 struggled to achieve the
same activity as R1 Initially the SA concentration was slightly higher but
eventually the results of R3 coincided with those of R2 when CSL was
introduced into the growth medium The dilution rate for R3 could have
been lowered further to reach higher product concentrations but it was
decided not to do this due to time constraints for achieving steady state
Table 41 gives the steady state results for all three runs
copycopy UUnniivveerrssiittyy ooff PPrreettoorriiaa
46
Table 41 Steady state data for the three continuous fermentation runs
Dilution
(h-1)
SA
(gmiddotL-1) AA (gmiddotL-1) FA (gmiddotL-1)
PYR
(gmiddotL-1)
Δ GLC
(gmiddotL-1)
YE ( in nitrogen
source)
Black box mass
balance ()
Average black box
mass balance ()
Average black box
mass balance ()
with DCW
Fermentation run 1
008 1731 814 608 048 3041 10000 8529
008 1685 816 619 050 3067 10000 8347
009 1671 800 612 051 3059 10000 8269 8382
008 1860 702 449 066 2916 6250 8777
008 1872 667 435 079 2917 6250 8716 8747 9581
008 1764 492 263 045 2619 3750 8343
008 1792 494 251 033 2596 3750 8473
008 1778 498 259 031 2596 3750 8441 8419
008 1691 359 183 178 2152 1875 9646
008 1696 349 168 175 2223 1875 9278
008 1669 353 170 172 2107 1875 9687 9537
008 1565 239 064 224 1855 625 9935
008 1411 192 048 290 1808 625 9459
008 1328 176 056 293 1822 625 8921 9438
copycopy UUnniivveerrssiittyy ooff PPrreettoorriiaa
47
Dilution
(h-1)
SA
(gmiddotL-1) AA (gmiddotL-1) FA (gmiddotL-1)
PYR
(gmiddotL-1)
Δ GLC
(gmiddotL-1)
YE ( in nitrogen
source)
Black box mass
balance ()
Average black box
mass balance ()
Average black box
mass balance ()
with DCW
Fermentation Run 2
004 1780 852 569 051 2954 10000 9023
004 1853 878 569 044 2972 10000 9256
004 1874 897 585 040 3004 10000 9287 9189
004 1796 564 248 042 2489 3750 9154
004 1759 582 263 035 2354 3750 9616
004 1760 570 228 038 2561 3750 8760 9177
004 1175 290 071 201 1447 625 10575
004 1106 289 074 199 1455 625 10081
004 1080 283 071 202 1390 625 10357 10338
Fermentation Run 3
004 2253 1022 493 026 3695 10000 8686
004 2257 1009 499 023 3673 10000 8711
004 2205 976 477 025 3656 10000 8522 8640 9138
004 1927 787 298 000 3043 6250 8538
004 1970 803 306 007 3221 6250 8266
004 1991 820 335 005 3242 6250 8344 8383 9213
004 1785 604 128 063 2998 3750 8583
copycopy UUnniivveerrssiittyy ooff PPrreettoorriiaa
48
Dilution
(h-1)
SA
(gmiddotL-1) AA (gmiddotL-1) FA (gmiddotL-1)
PYR
(gmiddotL-1)
Δ GLC
(gmiddotL-1)
YE ( in nitrogen
source)
Black box mass
balance ()
Average black box
mass balance ()
Average black box
mass balance ()
with DCW
004 1879 615 131 069 3092 3750 8572 8568 8974
004 1635 493 028 067 2635 1875 8718
004 1628 486 022 077 2605 1875 8644
004 1578 455 036 080 2664 1875 8431 8598 9919
004 1159 295 000 082 1489 625 9255
004 1110 286 000 098 1955 625 8545
004 1104 275 000 099 1419 625 9630
004 1044 259 000 114 1433 625 8908 9085 11240
004 817 137 000 177 1582 000 6186
004 709 086 000 237 1425 000 8691
004 725 072 000 249 1457 000 6140
004 712 080 000 273 1271 000 7161 7045 7234
copycopy UUnniivveerrssiittyy ooff PPrreettoorriiaa
49
Mass balances or redox balances were performed on all the samples and
the average closures of the steady state samples are shown in Table 41
Mass balance closure did increase as the YE content decreased In R3
DCWs were taken to see if the mass balance closure would reach 100
Including the DCWs significantly improved the mass balance but did not
close it Anything above 90 was considered a proper closure and most
figures that were below 100 may indicate unknown metabolites or non-
perfect analysis of acids and sugars
42 Productivity analysis
Figure 41 shows the average concentrations of SA AA and FA in the
product streams at steady state for all fermentation runs For a clear
comparison of the metabolite concentrations of all the fermentation runs
the results were put into a single plot despite the differences in dilution
rate and glucose feed concentration The reasons for the difference in
dilution rates were explained in Section 41
copycopy UUnniivveerrssiittyy ooff PPrreettoorriiaa
50
R1
R2
R3
SA
FA
AA
Figure 41
(See Table 31)
Figure 42 depicts how SA productivity and the glucose consumption rate
changed as the YE concentration decreased
0
2
4
6
8
10
12
14
16
18
20
22
24
0 10 20 30 40 50 60 70 80 90 100
Co
nce
ntr
atio
n(g
middotL-1
)
YE in Nitrogen Source
Figure 41 Product concentration profiles for SA AA and FA of
A succinogenes as the YE in the growth media varied
The total nitrogen source (combination of YE and CSL) concentration in the
growth medium stayed constant at 16 gmiddotL-1only the concentrations of YE (powder
form) and CSL (liquid form) varied
Commented [B1] In order for the very long captions for Figures 41 to 46 NOT to show in the automatic List of Figures Ive converted the detailed descriptions to normal text
copycopy UUnniivveerrssiittyy ooff PPrreettoorriiaa
51
R1
R2
R3
Productivity SA
Glucose
consumption rate
Figure 42SA productivity profile and glucose consumption rat
A succinogenes as the YE in the growth media varied
(See Table 31)
SA concentration decreased as the concentration of YE was reduced in the
medium When only YE was used as the nitrogen source which is an ideal
ingredient for A succinogenes growth and SA productivity the highest SA
concentration for R2 and R3 was achieved For R1 the SA concentration
was at its highest when the 625 of YE medium was used Despite the
difference in glucose concentration SA concentrations for R1 R2 and R3
0
02
04
06
08
1
12
14
16
18
2
22
24
26
28
3
0
02
04
06
08
1
12
14
16
0 10 20 30 40 50 60 70 80 90 100
Glu
cose
co
nsu
mp
tio
n r
ate
(gL
hr)
Pro
du
ctiv
ity
SA
(gmiddotL
-1middoth
r-1))
of YE in Nitrogen source
Figure 42 SA productivity profile and glucose consumption rate
profiles of A succinogenes as the YE in the growth media varied
The total nitrogen source (combination of YE and CSL) concentration in the
growth medium stayed constant at 16 gmiddotL-1 only the concentrations of YE
(powder form) and CSL(liquid form) varied
copycopy UUnniivveerrssiittyy ooff PPrreettoorriiaa
52
were similar when CSL was added to the medium R3 started with a high SA
concentration as expected but then quickly dropped and displayed the
trend observed in R1 and R2 AA and FA both decreased as the YE content
in the medium decreased for all runs The concentrations for both FA and
AA more or less matched in all runs irrespective of the dilution rate and
the glucose feed concentration When only CSL was used as the nitrogen
source in the growth medium in R3 no FA was produced
The SA productivity trend shown in Figure 42 is the same as the SA
concentration profile The highest SA productivity obtained in this study
was 158 gmiddotL-1middoth-1 when a 625 YE medium was used as the nitrogen
source From Figure 42 it should be clear that the productivities of R1
were almost twice as high as the productivities of R2 The same can be said
for the glucose consumption rates for R1 and R2 This is because the
dilution rate of R1 was also twice as much as the dilution rate of R2
According to Maharaj et al (2014) a decrease in dilution should lead to an
increase in product concentrations and yields R1 and R2 do not follow that
trend Instead their product concentrations profile matched A possible
reason for the inconsistency in the trends could be that there was less
biofilm activity in R2 for an unknown reason compared with the biofilm
activity in R1 resulting in a product concentrations profile match instead of
higher product concentrations in R2 compared with the profile for R1
43 Analysis of product distribution
Metabolite concentrations were used to determine and study the product
distributions YAASA YAAFA and YGLSA of the three fermentations
copycopy UUnniivveerrssiittyy ooff PPrreettoorriiaa
53
In Section 24 the theoretical metabolic flux limitations were discussed and
it was noted that in the absence of biomass formation the maximum
theoretical values for YAASA and YGLSA should be 393gmiddotg-1 and 088 gmiddotg-1
respectively These yields would only be achieved if no FA was produced
ie if only PDH was active However if the PFL route was active and all of
the FA was converted to CO2 and NADH by FDH then the maximum
theoretical yields mentioned earlier could be still achieved If biomass is
produced then a portion of the glucose in the growth medium would be
directed to the anabolic pathway which would influence the carbon
distribution resulting in maximum yields less than those given above
It is illustrated in Figure 43 that YAASA should vary between 197 gmiddotgminus1 (for
YAAFA = 077 gmiddotgminus1) and 393 gmiddotg-1 (for YAAFA = 0 gmiddotgminus1) Using only YE as the
nitrogen source the experimental yields for all runs matched the maximum
theoretical yields that were obtained when only the PFL enzyme was
active As the nitrogen source content varied (ie CSL concentration
increased and YE concentration decreased) YAASA increased and YAAFA
decreased thus indicating a shift in the metabolic flux distribution YAASA for
R2 and R3 were similar throughout the runs so was YAAFA However when
the YE concentration in the nitrogen source was 1875 for R1 and R3
YAASA exceeded the maximum theoretical yield while YAAFA was still in the
range of 0 gmiddotg-1 to 077 gmiddotg-1 The highest YAASA achieved in this study was 83
gmiddotg-1 and the lowest YAAFA was 0 gmiddotg-1 as seen in Figure 43 these yields
were obtained in R3 when only CSL was used as the nitrogen source
Certain batch studies in A succinogenes also achieved a YAASA that exceeded
the maximum theoretical yield (see Section 26 Table 21) but those
studies used YE as the nitrogen source whereas in this study it was
copycopy UUnniivveerrssiittyy ooff PPrreettoorriiaa
54
achieved using only CSL Xi et al (2013) was the only study (batch
fermentation) mentioned in Table 21 that used only CSL as the nitrogen
source with glucose as the carbon substrate and exceeded the maximum
theoretical YAASA They attained a YAASA of 458 gmiddotg-1
copycopy UUnniivveerrssiittyy ooff PPrreettoorriiaa
55
R1
R2
R3
SAAA
FAAA
Figure 43 Experimental yields plotted with the maximum theoretical yields
profile of A succinogenes as YE in medium changes
Considering the flux at the pyruvate node YAAFA decreased and was
approaching zero as the CSL concentration in the nitrogen source
increased as seen in Figure 43 This could be an outcome of an increase in
either PDH or FDH activity or a decrease in activity for both PDH and PFL
resulting in an increased concentration of pyruvate in the product stream
Figure 44 illustrates how the pyruvate concentration increased as the CSL
concentration in the growth medium increased
0
05
1
15
2
25
3
35
4
45
5
55
6
65
7
75
8
85
9
0 10 20 30 40 50 60 70 80 90 100
Mas
s ra
tio
(g
g-1)
YE in Nitrogen Source
SAAA max (PFL)
FAAA max (PFL)
SAAA max (PDH)
FAAA max (PDH)
Figure 43 Experimental yields plotted with the maximum theoretical
yields profile of A succinogenes as YE in medium changes
The total nitrogen source (combination of YE and CSL) concentration in the
growth medium stayed constant at 16 gmiddotL-1 only the concentrations of YE
(powder form) and CSL(liquid form) varied
copycopy UUnniivveerrssiittyy ooff PPrreettoorriiaa
56
(See Table 31)
According to the redox balance it is expected that YAASA would increase as
YAAFA decreased and in this study the same development was observed
This could be linked to the increasing CSL concentration in the nitrogen
source in this study Bradfield amp Nicol (2014) suggested that there could be
an additional reducing power that produced the yields that were achieved
Using carbon and redox balances they noticed in their study that the
experimental YAASA values exceeded the predicted values suggesting that an
increase in PDH or FDH activity was not the only contribution to the
increase in YAASA and that additional reducing power was present The same
0
02
04
06
08
1
12
14
16
18
2
22
24
26
28
3
0 10 20 30 40 50 60 70 80 90 100
Co
nce
ntr
atio
n(g
L)
YE in Nitrogen Source
PYR R1
PYR R2
PYR R3
Figure 44 Pyruvate concentration profile of A succinogenes as YE in
medium changes
The total nitrogen source (combination of YE and CSL) concentration in the
growth medium stayed constant at 16 gmiddotL-1 only the concentrations of YE
(powder form) and CSL(liquid form) varied
copycopy UUnniivveerrssiittyy ooff PPrreettoorriiaa
57
explanation can be applied to this study as seen in Figure 43 The increase
in the YAASA is influenced by the decrease in the YAAFA ratio although it is not
sufficient to reach the expected ratios (according to the redox balance)
(See Table 31)
Figure 45 illustrates the NADH consumed per NADH produced for all
fermentation runs The NADH consumed (mol NADHmiddotcmol glucose-1) was
calculated as follow
09
1
11
12
13
14
15
16
17
18
19
2
0 10 20 30 40 50 60 70 80 90 100
NA
DH
Co
nsu
med
NA
DH
Pro
du
ced
of YE in Nitrogen source
NADH R1
NADH R2
NADH R3
Figure 45 NADH ratio consumed during production of A succinogenes
as YE in medium changes
The total nitrogen source (combination of YE and CSL) concentration in the
growth medium stayed constant at 16 gmiddotL-1 only the concentrations of YE
(powder form) and CSL(liquid form) varied
copycopy UUnniivveerrssiittyy ooff PPrreettoorriiaa
58
2119862119878119860119872119872119878119860
6∆119866119871119862119872119872119866119871119862
frasl (41)
Using Figure 2 Equation 41 was generated The only pathway that
consumed NADH was the path that converted PEP to SA where 2 molecules
of NADH were consumed to produce 1 molecule of SA
The NADH (mol NADHmiddotcmol glucose-1) produced was calculated as follow
(119862119878119860
119872119872119878119860+
2119862119860119860
119872119872119860119860minus
119862119865119860
119872119872119865119860)
6∆119866119871119862
119872119872119866119871119862
frasl (42)
The path from glucose to PEP produced 2 molecules of NADH per one
glucose molecule consumed and from PYR to AA 1 molecule of NADH per
one AA molecule was produced All the inputs for these equations were the
product concentrations obtained from the experimental runs
In Figure 45 it is noted that for all the fermentation runs the ratio of NADH
consumed to NADH produced increased as the concentration of YE in the
growth medium increased Nevertheless there is a clear dissimilarity
between the three runs In R3 the NADH production was higher than the
consumption for all growth media except when only CSL was used as the
nitrogen source R2 and R3 in comparison with R1 did not display a
massive imbalance in the NADH ratio and R1 was the only run where NADH
consumed over produced ratio consistently increased significantly as the
YE content in the growth medium increased It appears that the additional
NADH generation capability of R1 was not fully present in R2 and R3 and
possibly the strains used in R2 and R3 had altered production
copycopy UUnniivveerrssiittyy ooff PPrreettoorriiaa
59
characteristics compared with the original strain Nevertheless the R1
results coincide with the observation of both Bradfield amp Nicol (2014) and
Brink amp Nicol (2014) which was that there was an ldquoexcessrdquo of NADH that
was consumed during the maintenance phasenon-growth phase resulting
in a high YAASA
copycopy UUnniivveerrssiittyy ooff PPrreettoorriiaa
60
(See Table 31)
Figure 46 illustrates the yield of SA on glucose for R1 This graph shows
how the flux from glucose to SA increases as the CSL concentration in the
growth medium increases The trend observed in Figure 46 can be linked
to the ldquoexcessrdquo NADH that favours the production of SA Xi et al (2013)
observed that using only CSL as the nitrogen source provided high
selectivity towards SA (458 gmiddotgminus1) in comparison with other by-products
On the other hand CSL with heme provided a high glucose-to-SA flux
(072 gmiddotgminus1) and a much higher YAASA (493 gmiddotgminus1) A similar observation was
04
043
046
049
052
055
058
061
064
067
07
073
076
079
082
085
088
0 10 20 30 40 50 60 70 80 90 100
Mas
s ra
tio
(g
g-1)
YE in Nitrogen Source
SAGL R1
SAGL max(PFL)SAGL max(PDH)
Figure 46 Mass ratio of succinic acid over glucose profile of
A succinogenes as YE in medium changes
The total nitrogen source (combination of YE and CSL) concentration in the
growth medium stayed constant at 16 gmiddotL-1 only the concentrations of YE
(powder form) and CSL(liquid form) varied
copycopy UUnniivveerrssiittyy ooff PPrreettoorriiaa
61
documented by Yan et al (2013) Xi et al (2012) tried to explain this
observation in their study by stating that CSL contained cofactor biotin
which promoted the high SA selectivity
It is reasonable to postulate that there is an ingredient in CSL that may
trigger or enhance the activity of an additional metabolic pathway known
as the pentose phosphate pathway (PPP) to produce high carbon flux to SA
and high SA selectivity The idea of PPP as the source of the additional
reducing power stems from the findings of Bradfield and Nicol (2014)
Their analysis has shown that if the NADPH generated in the PPP cycle is
converted to NADH in order to supply redox to the SA pathway then high
SA selectivity can be achieved A succinogenes has the transhydrogenase
that allows PPP to be active and as mentioned earlier the presence or
absence of one or more ingredients in CSL may allow this enzyme to be
active consequently activating the PPP as well
Xi et al (2012) did mention biotin as the culprit for the high SA selectivity
They investigated the influence of biotin on A succinogenes growth and SA
productivity by varying the biotin concentration in a chemically defined
medium There was no SA production and cell growth was severely
inhibited when biotin was absent from the growth medium They reported
a high SA yield in their study but their data for AA concentration YGLAA and
YAASA were inconsistent with their observed product concentrations The
following example is extracted from their results In the experiment using
8 mg L-1biotin the glucose consumed was 300 g L-1 CSA = 194 g L-1 CAA =
32 g L-1 YGLAA = 0203 g g-1 and YAASA = 61 g g-1 However the YGLAA should
have been 0107 gmiddotg-1 if CAA was reported correctly but if the value for YAASA
was used as the value of CAA then the reported YGLAA would be correct
copycopy UUnniivveerrssiittyy ooff PPrreettoorriiaa
62
Nevertheless because of the inconsistency of the data it cannot be
concluded that biotin did play a role in gaining a high SA yield
Either the presence or absence of a component in a growth medium can
influence the enzymatic activity of a pathway and this concept should be
used to postulate explanations for the results obtained in this study
A breakdown of the constituents of CSL and YE could help in identifying the
ingredients in CSL that may have triggered or enhanced the activity of the
PPP Since both CSL and YE are complex media and there is no definite
information on the ingredients it is hard to fully confirm the following
theory
Xiao et al (2013) did a study on the constituents of CSL and stated that any
grade of CSL has the following amino acids isoleucine asparagine
methionine lysine proline and aspartic acid YE was reported by an
industrial data sheet (Organotechniereg SAS France) to have a high
content of the following alanine isoleucine leucine methionine
phenylalanine tyrosine and valine Although there are common amino
acids shared between CSL and YE there is one amino acid YE has that is
absent from CSL namely leucine This could be a reason why CSL could be
related to the excess NADH
Leucine in Ecoli is said to repress the transhydrogenase activity which in
turn represses the PPP (Gerolimatos amp Hanson 1978) This could be true
for A succinogenes since it also has the transhydrogenase for PPP as
mentioned in Section 23 A succinogenes with only YE as the nitrogen
source produced yields that were expected according to the carbon and
redox balance It can be postulated that as the YE content reduce the
copycopy UUnniivveerrssiittyy ooff PPrreettoorriiaa
63
leucine content decreased and the activity of the transhydrogenase
increased causing additional NADH to be generated from the enhanced
PPP resulting in improved yields
copycopy UUnniivveerrssiittyy ooff PPrreettoorriiaa
64
5 Conclusions
The complex nitrogen requirements of non-growing A succinogenes
biofilms were evaluated The study restricted itself to the use of YE and CSL
as nitrogen sources The SA productivity yields and titre were the variables
assessed
The YE concentration was decreased while simultaneously increasing the
CSL concentration in the medium Although this led to a decrease in the
steady state productivity of the organism overall SA selectivity increased
The production of certain metabolites such as SA and pyruvate also
increased while FA and AA concentrations decreased in the increasing
absence of YE This led to an increase in the SA to AA mass ratio and to a
decrease in the FA to AA mass ratio When zero amounts of YE were in the
growth medium no FA was produced
Three fermentation runs were performed The highest SA concentration in
this study was 2257gmiddotL-1 when only YE was used as the nitrogen source in
the growth medium and the highest SA productivity obtained in this study
was 158 gmiddotL-1middoth-1 when a combination of YE(625) and CSL(375) was
used as the nitrogen sourceThe highest SA to AA mass ratio achieved was
83 gmiddotg-1 when only CSL was used as the nitrogen source The FA to AA
mass ratio was consistently less than 077 gmiddotg-1 approaching 0 gmiddotg-1 as the
CSL concentration in the nitrogen source increased
Lower FA to AA mass ratio values were not fully responsible for the
increase in the SA to AA mass ratio The surplus NADH required is provided
copycopy UUnniivveerrssiittyy ooff PPrreettoorriiaa
65
by the activation or enhancement of an alternative metabolic pathway ie
the pentose phosphate pathway
The observations made in this study bolster the idea of using a combination
of YE and CSL where YE is the minor component as the nitrogen source for
commercialisation of bio-based succinic acid production using
Asuccinogenes as the catalyst
copycopy UUnniivveerrssiittyy ooff PPrreettoorriiaa
66
6 References
Allied Market Research (2014) ldquoWorld bio succinic acid market ndash
Opportunities and forecasts 2013ndash2020rdquo [Online]
httpswwwalliedmarketresearchcombio-succinic-acid-market
Beauprez JJ De Mey M and Soetaert WK (2010) ldquoMicrobial succinic acid
production natural versus metabolic engineered producersrdquo Process
Biochem451103ndash1114
Bechthold I Bretz K Kabasci S Kopitzky R and Springer A (2008)
ldquoSuccinic acid a new platform chemical for biobased polymers from
renewable resourcesrdquo Chem Eng Technol 31647ndash654
BioConSepT (2013) ldquoDetermination of market potential for selected
platform chemicalsrdquo [Online] httpwwwbioconsepteuwp-
contentuploadsBioConSepT_Market-potential-for-selected-platform-
chemicals_ppt1pdf
Bozell JJ and Petersen GR (2010) ldquoTechnology development for the
production of biobased products from biorefinery carbohydrates ndash the US
Department of Energyrsquos ldquoTop 10rdquorevisitedrdquo Green Chem 12539ndash554
Bradfield MFA and Nicol W (2014) ldquoContinuous succinic acid production
by Actinobacillus succinogenes in a biofilm reactor steady-state metabolic
flux variationrdquo Biochem Eng J 851ndash7
copycopy UUnniivveerrssiittyy ooff PPrreettoorriiaa
67
Brink HG and Nicol W (2014) ldquoSuccinic acid production with Actinobacillus
succinogenes Rate and yield analysis of chemostat and biofilm culturesrdquo
Microb Cell Fact 13111-122
Chen K Jiang M Wei P Yao J and Wu H (2010)rdquoSuccinic acid production
from acid hydrolysate of corn fiber by Actinobacillus succinogenesrdquo Appl
Biochem Biotechnol 160477ndash485
Cok B Tsiropoulos I Roes AL and Patel MK (2014) ldquoSuccinic acid
production derived from carbohydrates An energy and greenhouse gas
assessment of a platform chemical toward a bio-based economyrdquo Biofuels
Bioprod Bioref 816-29
Corona-Gonzaacutelez RI Bories A Gonzaacutelez Alvarez V and Pelayo-Ortiz C
(2008) ldquoKinetic study of succinic acid production by Actinobacillus
succinogenes ZT-130rdquo Process Biochem 431047ndash1053
Davis R Tao L Tan ECD Biddy MJ Beckham GT Scarlata C Jacobson J
Cafferty K Ross J Lukas J Knorr D and Schoen P(2013) ldquoProcess Design
and Economics for the Conversion of Lignocellulosic Biomass to
Hydrocarbons Dilute-Acid and Enzymatic Deconstruction of Biomass to
Sugars and Biological Conversion of Sugars to Hydrocarbonsrdquo NREL Report
No TP-5100-60223 [Online]
httpwwwnrelgovdocsfy14osti60223pdf
Gerolimatos B and Hanson RL (1978) ldquoRepression of Escherichia coli
pyridine nucleotide transhydrogenase by leucinerdquo J Bacteriol 134(2)394-
400
copycopy UUnniivveerrssiittyy ooff PPrreettoorriiaa
68
Grand-View-Research (2015) ldquoBio-Succinic Acid Market Analysis by
Application (BDO Polyester Polyols PBSPBST Plasticizers Alkyd Resins)
and Segment Forecasts to 2020ldquo [Online]
httpwwwgrandviewresearchcomindustry-analysisbio-succinic-acid-
market ISBN Code 978-1-68038-085-9
Guettler M Rumler D and Jain M (1999) ldquoActinobacillus succinogenes sp
nov a novel succinic-acid-producing strain from the bovine rumenrdquo Int J
Syst Bacteriol 49207ndash216
Gunnarsson IB Karakashev D and Angelidaki I (2014) ldquoSuccinic acid
production by fermentation of Jerusalem artichoke tuberhydrolysate with
Actinobacillus succinogenes 130Zrdquo Ind Crops-Prod 62125ndash129
ICIS (2012)rdquoChemical industry awaits for bio-succinic acid potentialrdquo
[Online]
httpwwwiciscomArticles201201309527521chemical+industry+
awaits+for+biosuccinic+acid+potentialhtml
Jiang M Chen K Liu Z Wei P Ying H and Chang H (2010) ldquoSuccinic acid
production by Actinobacillus succinogenes using spent Brewers yeast
hydrolysate as a nitrogen sourcerdquo Appl Biochem Biotechnol 160 244ndash
254
Jiang M Dai W Xi Y Wu M Kong X Ma J Min Zhang M Chen K and Wei
P (2014) ldquoSuccinic acid production from sucrose by Actinobacillus
succinogenes NJ113rdquo BioresourTechnol 153327ndash332
copycopy UUnniivveerrssiittyy ooff PPrreettoorriiaa
69
Kaneuchi C Seki M and Komagata K (1988) ldquoProduction of succinic acid
from citric acid and related acids by Lactobacillus strainsrdquo Appl Environ
Microbiol 543053ndash3056
Kasprow RP Lange AJ and Kirwan DJ (1998)ldquoCorrelation of fermentation
yield with yeast extract composition as characterized by near-infrared
spectroscopyrdquo Biotechnol Prog 14318minus325
Kwon S Lee PC Lee EG Chang YK and Chang N (2000) ldquoProduction of
lactic acid by Lactobacillus rhamnosus with Vitamin-supplemented soybean
hydrolysaterdquo Enzyme Microb Technol 26209-215
Lee PC Lee WG Kwon S Lee SY and Chang HN (2000) ldquoBatch and
continuous cultivation of Anaerobiospirillum succiniciproducens for the
production of succinic acid from wheyrdquo Appl Microbiol Biotechnol 5423ndash
27
Lee PC Lee SY Hong SH and Chang HN (2002) ldquoIsolation and
characterization of a new succinic acid-producing bacterium Mannheimia
succiniciproducens MBEL55E from bovine rumenrdquo Appl Microbiol
Biotechnol 58(5)663ndash668
Lin H Bennett GN and San KY (2005) ldquoFed-batch culture of a
metabolically engineered Escherichia coli strain designed for high-level
succinate production and yield under aerobic conditions rdquoBiotechnol
Bioeng 90775ndash779
copycopy UUnniivveerrssiittyy ooff PPrreettoorriiaa
70
Lin SKC Du C Koutinas A Wang R amp Webb C (2008) ldquoSubstrate and
product inhibition kinetics in succinic acid production by Actinobacillus
succinogenesrdquo Biochem Eng J 41(2)128ndash135
Liu YP Zheng P Sun ZH Ni Y Dong JJ and Zhu LL (2008) ldquoEconomical
succinic acid production from cane molasses by Actinobacillus
succinogenesrdquo Bioresour Technol 991736ndash1742
Maharaj K Bradfield MFA and Nicol W (2014) ldquoSuccinic acid-producing
biofilms of Actinobacillus succinogenes Reproducibility stability and
productivityrdquo Appl Microbiol Biotechnol 98(17)7379ndash7386
McKinlay JB Zeikus JG amp Vieille C (2005) ldquoInsights into Actinobacillus
succinogenes fermentative metabolism in a chemically defined growth
mediumrdquo Appl Environ Microbiol 71(11) 6651ndash6656
McKinlay JB Vieille C and Zeikus JG (2007) ldquoProspects for a bio-based
succinate industryrdquo Appl Microbiol Biotechnol 76727ndash740
McKinlay JB Laivenieks M Schindler BD McKinlay A Siddaramappa S
Challacombe JF Lowry SR Clum A Lapidus AL and Burkhart KB (2010)
ldquoA genomic perspective on the potential of Actinobacillus succinogenes for
industrial succinate productionrdquo BMC Genomics 11 (1) 680
Nghiem NP Davison BH Suttle BE and Richardson GR (1997)
ldquoProduction of succinic acid by Anaerobiospirillum succiniciproducensrdquo Appl
Biochem Biotechnol 63ndash65 565ndash576
copycopy UUnniivveerrssiittyy ooff PPrreettoorriiaa
71
Oh I Lee H Park C Lee SY and Lee J (2008) ldquoSuccinic acid production by
continuous fermentation process using Mannheimia succiniciproducens
LPK7rdquo J Microbiol Biotechnol 18908ndash912
Organotechniereg SAS (2008) ldquoTechnical Data Sheet Yeast Extract 19512rdquo
[Online] httpwwworganotechniecomdoc_en19512pdf [accessed 22
November 2015]
Rosche B Li XZ Hauer B Schmid A and Buehler K (2009) ldquoMicrobial
biofilms A concept for industrial catalysisrdquo Trends Biotechnol 27636ndash43
DOI 101016jtibtech200908001
Ruumlhl M Le Coq D Aymerich S and Sauer U (2012) ldquo13C-flux analysis
reveals NADPH balancing transhydrogenation cycles in stationary phase of
nitrogen-starving Bacillus subtilisrdquo JBiolChem 287(33) 27959ndash27970
Shen N Qin Y Wang Q Liao S Zhu J Zhu Q Mi H Adhikari B Wei Y and
Huang R (2015) ldquoProduction of succinic acid from sugarcane molasses
supplemented with a mixture of corn steep liquor powder and peanut meal
as nitrogen sources by Actinobacillus succinogenesrdquo Appl Microbiol 60544-
551
Shuler M and Kargi F (2002) ldquoBioprocess Engineering Basic Conceptsrdquo 2nd
ed Prentice Hall New York
Song H and Lee SY (2006) ldquoProduction of succinic acid by bacterial
fermentationrdquo Enzyme MicrobTechnol 39-(3)352ndash361
copycopy UUnniivveerrssiittyy ooff PPrreettoorriiaa
72
Spector MP (2009) ldquoMetabolism central (intermediary)rdquo in M Schaechter
(Ed) Encyclopedia of Microbiology 3rd ed Academic Press Oxford 242ndash
264
Sridee W Laopaiboon L Jaisil P and Laopaiboon P (2011) ldquoThe use of
dried spent yeast as a low-cost nitrogen supplement in ethanol
fermentation from sweet sorghum juice under very high gravity
conditionsrdquo Electron JBiotechnol14(6)1-15
Transparency-Market-Research (2014) ldquoSuccinic acid market for 14-bdo
resin coatings dyes amp inks pharmaceutical polyurethane food
plasticizers cosmetics solvents amp lubricants and de-icing solutions
applications-Global industry analysis size share growth trends and
forecast 2012ndash2018rdquo [Online]
httpwwwtransparencymarketresearchcomsuccinic-acidhtml
Urbance SE Pometto AL DiSpirito A and Demirci A (2003) ldquoMedium
evaluation and plastic composite support ingredient selection for biofilm
formation and succinic acid production by Actinobacillus succinogenesrdquo
Food Biotechnol 17(1)53ndash65
Urbance SE Pometto AL DiSpirito A and Denli Y (2004) ldquoEvaluation of
succinic acid continuous and repeat-batch biofilm fermentation by
Actinobacillus succinogenes using plastic composite support bioreactorsrdquo
ApplMicrobiolBiotechnol 65 (6)664ndash70
Van der Werf MJ Guettler MV Jain MK and Zeikus JG (1997)
ldquoEnvironmental and physiological factors affecting the succinate product
copycopy UUnniivveerrssiittyy ooff PPrreettoorriiaa
73
ratio during carbohydrate fermentation by Actinobacillus sp 130Zrdquo Arch
Microbiol 167332ndash342
Van Heerden CD and Nicol W (2013a) ldquoContinuous and batch cultures of
Escherichia coli KJ134 for succinic acid fermentation Metabolic flux
distributions and production characteristicsrdquo Microb Cell Fact 12-(1) 80-
90
Van Heerden CD and Nicol W (2013b) ldquoContinuous succinic acid
fermentation by Actinobacillus succinogenesrdquo Biochem EngJ 735ndash11
Villadsen J Nielsen J amp Lideacuten G (2011) ldquoBioreaction Engineering
Principlesrdquo 3rd ed Springer US Boston MA
Werpy T and Petersen G (2004) ldquoTop value added chemicals from
biomass Vol 1 Results of screening for potential candidates from sugars
and synthesis gasrdquo National Renewable Energy Lab Golden CO US
Xi Y Chen K Xu R Zhang J Bai X Jiang M Wei P and Chen J (2012)
ldquoEffect of biotin and a similar compound on succinic acid fermentation by
Actinobacillus succinogenes in a chemically defined mediumrdquo Biochem Eng
J 6987ndash92
Xi Y Chen K Dai W Ma J Zhang M Jiang M Wei P and Ouyang PK
(2013) ldquoSuccinic acid production by Actinobacillus succinogenes NJ113
using corn steep liquor powder as nitrogen sourcerdquo Bioresour Technol
136 775ndash779
copycopy UUnniivveerrssiittyy ooff PPrreettoorriiaa
74
Xiao X Hou Y Liu Y Liu Y Zhao H Dong L Du J Wang Y Bai G and Luo
G (2013) ldquoClassification and analysis of corn steep liquor by UPLCQ-TOF
MS and HPLCrdquo Talanta 107344ndash348
Xu J and Guo B (2010) ldquoMicrobial succinic acid its polymer poly(butylene
succinate) and applicationsrdquo Plastics from Bacteria Natural Functions and
Applications Microbiology Monographs Vol 14 Springer Verlag
BerlinHeidelberg DOI 101007978-3-642-03287514
Yan Q Zheng P Dong JJ and Sun ZH (2013) ldquoA fibrous bed bioreactor to
improve the productivity of succinic acid by Actinobacillus succinogenesrdquo
JChemTechnolBiotechnol 89(11)1760-1766DOI101002jctb4257
Yan Q Zheng P Tao S and Donga J (2014) ldquoFermentation process for
continuous production of succinic acid in a fibrous bed bioreactorrdquo
Biochem Eng J 9192-98
Zeikus JG Jain MK and Elankovan P (1999) ldquoBiotechnology of succinic acid
production and markets for derived industrial productsrdquo Appl Microbiol
Biotechnol 51545ndash552
Zheng P Dong J Sun Z Ni Y and Fang L (2009) ldquoFermentative production
of succinic acid from straw hydrolysate by Actinobacillus succinogenesrdquo
Bioresour Technol 100 2425ndash2429
copycopy UUnniivveerrssiittyy ooff PPrreettoorriiaa

2
SA has become extensive over the years because of the need to understand
and refine the process of producing bio-SA
In the literature the choices of microbial organisms available for bio-based
SA production are very diverse although most natural production hosts
described are capnophilic microorganisms (Beauprez De Mey amp Soetaert
2010) A succinogenes stood out as one of the most favourable strains for
commercial production due to its ability to produce SA naturally at high
titres (Zeikus et al 1999) and its tolerance to high acid concentrations (Lin
et al 2008) However one major drawback of Actinobacillus succinogenes
is the auxotrophic requirement for amino acids and vitamins (McKinlay
Zeikus amp Vieille 2005) In fermentation studies usually the essential amino
acids and vitamins are provided by adding yeast extract (YE) or corn steep
liquor (CSL) to the feed medium but in an industrial setup addition of YE
would be highly unfeasible because of the estimated cost which ranges
between US$350kg and US$67kg (Kwon et al 2000 Sridee et al 2011)
For the successful commercial exploitation of A succinogenes the cost of
the fermentation feedstock and the availability of essential and beneficial
ingredients that will influence the conversion process should be taken into
account Since using only YE is not economically feasible cheaper sources
of these critical components are hence required CSL is the first ideal
candidate as its market value ranges between US$007kg and
US$0075kg (Davis et al 2013)
Most fermentation studies done on A succinogenes employ a batch mode of
operation (Beauprez et al 2010) in which final concentrations yield and
productivity are used as performance indicators To date all publications in
which the complex nitrogen source was varied have used batch
copycopy UUnniivveerrssiittyy ooff PPrreettoorriiaa
3
fermentation (Xi et al 2013 Jiang et al 2010 Shen et al 2015 Yan et al
2013) Nevertheless none of these studies distinguished between the
nitrogen requirements for growth-related and non-growth-related SA
production It is well known that the specific growth rate of A succinogenes
is severely inhibited by the accumulation of organic acids in the
fermentation broth (Corona-Gonzaacutelez et al 2008) and that the specific
growth rate approaches zero above an SA titre in the vicinity of 10-15 gmiddotL-1
(Brink amp Nicol 2014) Most batch fermentations reach a final SA
concentration well in excess of this critical SA concentration thus
indicating that a significant fraction of the SA in these studies is produced
under non-growth or maintenance conditions and that the nutrient
requirements for the non-growth production phase might be different to
those of the growth phase in all likelihood less severe
In order to study the non-growth nutrient requirements of A succinogenes
steady state would be ideal this can be achieved through a continuous
mode of operation Maharaj Bradfield and Nicol (2014) have clearly
demonstrated that prolonged steady state operation of A succinogenes
under non-growth conditions is feasible and stable The concentrations of
organic acids in the fermentation broth can be manipulated by altering the
throughput (or dilution rate) in order to induce non-growth production of
SA Another beneficial factor with continuous operations is biofilms which
are unavoidably formed in long-term continuous fermentations and can
significantly enhance productivity as observed by Van Heerden and Nicol
(2013b)
This study aims to evaluate the complex nitrogen requirements of non-
growing A succinogenes biofilms Nitrogen sources used in this study will
copycopy UUnniivveerrssiittyy ooff PPrreettoorriiaa
4
be restricted to YE and CSL since they are the most common sources of
nitrogen sources used in the literature and because of the potential
economic advantage of using CSL Initial biomass accumulation will be
achieved by using only YE for rapid growth of the micro-organism Once
non-growth production of SA commences the YE content will be reduced
and the CSL content will be increased The total complex nitrogen source
concentration in the feed will be maintained at a constant value of 16 gmiddotL-1
throughout the experiments however the percentage of YE in the total
complex nitrogen source will decrease over time Throughout the study the
change in nitrogen source will be referred to as YE in the nitrogen
source At a fixed dilution rate (at a chosen initial SA concentration) for the
whole run productivity and product distribution as a function of YE in
the nitrogen source will be assessed
copycopy UUnniivveerrssiittyy ooff PPrreettoorriiaa
5
2 Literature survey
21 Bio-based chemicals
Bio-based chemicals are platform and intermediate chemicals derived from
biomass feedstocks The US Department of Energy (DOE) identified 300
potential bio-based platform chemicals but most of the proposed
chemicals did not have sufficient market potential nor was it economical to
produce them Only 30 chemicals were considered to be relevant since they
had the potential to replace non-bio-based chemicals and out of those 30
chemicals only 12 building block chemicals were identified as being the
most important because of their potential market chemical derivatives and
synthesis pathways (Werpy amp Peterson 2004)
The importance for bio-based production of fuels and chemicals arises
from the need to move away from petroleum-based production The
depletion of non-renewable feedstocks and the strong demand by
consumers for environmentally friendly energy sources has made the
production of fuels and chemicals from biomass feedstocks to be a
sustainable alternative to the petrochemical production route Government
and industry are now interested in bio-based resources and production and
they understand that to form a sustainable global economy a bio-based
industry should substitute the current petroleum-based routes to produces
fuels and chemicals (Cok et al 2014) However to have a bio-based
economy for the development of highly efficient and cost effective bio-
refineries is essential Petrochemical production has been optimised and
refined over long period of time making it a cheaper option compared with
the relatively new bio-based production Therefore to enhance the
development of a bio-based economy it is essential that the biological
copycopy UUnniivveerrssiittyy ooff PPrreettoorriiaa
6
processes are understood refined and optimised through continuous
research and development (Cok et al 2014)
22 Succinic acid
221 Application of succinic acid
One of the top 12 bio-based platform chemicals recognized by the US DOE
was succinic acid (SA) (Werpy amp Peterson 2004 Bozell amp Peterson 2010)
See Figure 21 for the molecular structure of SA Most of the SA produced to
meet global demand is manufactured through the petroleum route ie it is
produced by the partial oxidation of butane followed by hydrogenation of
the intermediate product which is maleic anhydride However the
expensive conversion costs and non-renewability of this petroleum-based
route for producing SA has limited the SA market to low-cost bulk
application (Xu amp Guo 2010 Beauprez et al 2010)
Figure 21 Succinic acid molecule
Traditionally the application of SA has been limited mainly to four
functional regions its largest area of application is as a surfactant an
additive to a detergent and a foaming agent the second is as an ion chelator
copycopy UUnniivveerrssiittyy ooff PPrreettoorriiaa
7
for preventing corrosion and spot corrosion of metals in the electroplating
industry the third is as an acidulant which is a pH regulator and flavouring
agent in the food industry and the fourth area of application region is in
the pharmaceutical industry specifically in the production of antibiotics
amino acids and vitamins (Xu amp Guo 2010) As a platform chemical it is
also used as a precursor of many commodity or specialty chemicals as seen
in Figure 22 (Zeikus et al 1999)
Figure 22Various chemicals and products derived from succinic acid
(Zeikus et al 1999)
Nevertheless there is potential for the bulk application of SA The key to
the growth of the SA market lies in its derivatives The diamines and diols
that are derived from SA can be used as monomer units of a variety of
Figure 22 Various chemicals and products derived from succinic acid
(Zeikus et al 1999)
copycopy UUnniivveerrssiittyy ooff PPrreettoorriiaa
8
plastics such as polyesters polyamides and polyester amides (Bechthold et
al2008) Among them is the SA derivative 14-butanediol (BDO) It is a
platform chemical for tetrahydrofuran (THF) gamma-butyrolactone (GBL)
and polymers such as polybutylene terephthalate (PBT) and polyurethane
(PU) These chemicals are widely used in the production of engineering
thermoplastics and elastic fibres and because of these applications the
BDO market is expected to increase as the demand for THF and spandex for
sports apparel increase (Grand- View- Research 2014) Another derivative
of SA that is predicted to increase the SA global market is the biodegradable
polybutylene succinate (PBS) and its copolymers PBS polymers have a
range of applications as supermarket bags packaging film mulch film and
other disposable articles Owing to the steady growth of the market for
biodegradable plastic the demand for PBS is expected to increase rapidly
which in turn could grow the SA market (ICIS 2012)
222 Succinic acid market
The global SA market in 2011 was estimated to be worth US$240 million
and it is projected to reach US$836 million by 2018 (Transparency-Market-
Research 2014) due to the development of the bio-SA Consumption of
petroleum-based SA in manufacturing various other chemicals is restricted
due to unpredictability of price and carbon footprints These concerns
however are advancing the progression of biological manufacturing of SA
The major drivers for this growth will be the high cost of crude oil the rise
in carbon footprints and an interest in producing ldquogreenrdquo chemicals Newer
applications of SA as PBS BDO plasticizers and polyesters polyols will fast-
track the future growth of the bio-SA market However the higher price of
bio-SA and the lengthy extraction processes are the primary factors that
copycopy UUnniivveerrssiittyy ooff PPrreettoorriiaa
9
will restrain the market growth for the next few years although the market
is expected to grow at a significant rate over the next seven years (Allied
Market Research 2014)
At present there are numerous institutions researching the development of
SA through bio-based raw materials and there are companies that are
already manufacturing bio-SA for commercial purposes The list of major
companies involved in the production of bio-SA includes BioAmber
Myraint DSM Mitsui amp Co Mitsubishi BASF Roquette Freacuterese SA Purac
and Reverdia In 2013 the global bio-SA market volume was approximately
51 100 tons and in seven years it is expected to reach a market volume of
710 000 tons In that same year BDO is predicted to emerge as the largest
application segment for bio-SA as it will replace maleic anhydride in the
production of BDO every 1MT of maleic anhydride will be replaced by
12MT of bio-SA (Allied Market Research 2014)
223 Bio-based SA production
Bio-SA which has the same structure as petroleum-based SA is produced
by the fermentation of a carbohydrate using a natural producer or an
engineered organism The feedstock used for the production of bio-based
succinic acid can be wheat maize glucose lignocellulosic-derived sugar or
sorghum grain processed to starch (BioConSepT 2013)
Compared with the petroleum-based process the fermentation process has
the advantages of mild operating conditions independence of the fossil
feedstock and fixation of CO2 and with development of genetic engineering
metabolic modification of microbial strains and improvement of
copycopy UUnniivveerrssiittyy ooff PPrreettoorriiaa
10
purification technology the fermentative production of SA from renewable
resources can be more cost-effective than the fossil-based processes (Xu amp
Guo 2010)
To date various microorganisms have been reported to produce SA such
as typical gastrointestinal bacteria and rumen bacteria and some
lactobacillus strains (Kaneuchi Seki amp Komagata 1988 Beauprez et al
2010) Among them Actinobacillus succinogenes (Guettler Rumler amp Jain
1999) Anaerobiospirillum succiniciproducens (Oh et al 2008) Mannheimia
succiniciproducens (Lee et al 2000) and genetically modified Escherichia
coli (Lin Bennet amp San 2005) are the most promising strains for producing
SA at high yields Fungi species such as Aspergillus niger Aspergillus
fumigatus Byssochlamys nivea Lentinus degener Paecilomyces varioti
Penicillium viniferum and yeast Saccharomyces cerevisia also produce
succinic acid but not in high concentrations or yields (Song amp Lee 2006)
Nevertheless for industrial applications A succinogenes stands out because
it is by far the most studied wild strain (Brink amp Nicol 2014) and its ability
to produce high concentrations of SA naturally from a broad range of
carbon sources (Guettler et al 1999 McKinlay Vieille amp Zeikus 2007)
further makes it ideal for commercial applications
23 Actinobacillus succinogenes
231 Description of microorganism
A succinogenes a Gram-negative rod-shaped and non-motile bacterium
isolated from bovine rumen (Guettler et al 1999) is considered to be one
copycopy UUnniivveerrssiittyy ooff PPrreettoorriiaa
11
of the top natural SA producing microorganisms (McKinlay et al 2007
Brink amp Nicol 2014) It produces SA as part of a mixed acid fermentation in
which acetic acid (AA) formic acid (FA) and ethanol are the by-products It
is capable of digesting a wide range of carbon sources such as glucose
fructose mannitol arabitol sorbitol sucrose xylose and arabinose under
anaerobic conditions (Van der Werf et a 1997) but most laboratory
experiments use glucose fructose xylose and sucrose as carbon substrates
A succinogenes grows optimally at moderate temperatures (37 degC to 39 degC)
and it is facultative anaerobic ie it can survive in the presence or absence
of oxygen Furthermore it is capnophilic because its growth is enhanced at
increased CO2 concentrations (Guettler et al 1999) and it is a
chemoheterotroph that grows optimally at pH ranging from 6 to 74
232 Metabolic pathway
As stated earlier A succinogenes is a promising candidate for industrial SA
production However in addition to producing SA it also produces formic
acid (FA) acetic acid (AA) and sometimes ethanol The summarised version
of the metabolic pathway for A succinogenes is shown in Figure 23
A succinogenes ferments glucose to phosphoenolpyruvate (PEP) by
glycolysis PEP is thought to serve as the point of divergence between the
FA AA and ethanol producing pathway (C3 pathway) and the SA producing
(C4) pathway The path from glucose to PEP is neutral overall in terms of
adenosine triphosphate (ATP) production but one-third of nicotinamide
adenine dinucleotide (NADH) is produced per cmol of glucose consumed
copycopy UUnniivveerrssiittyy ooff PPrreettoorriiaa
12
C4 metabolic pathway (reverse tricarboxylic pathway)
Overall this pathway leads to the formation of SA and two molecules of
NADH and one molecule of CO2 must be consumed to form one molecule of
SA Ideally one would prefer the carbon flux to follow this route to attain
homosuccinate production
The key enzyme in this pathway is PEP carboxykinase because it pushes
the carbon flux from PEP to oxaloacetate which later on becomes SA This
enzyme is regulated by CO2 levels ie the level of CO2 available to A
succinogenes will have an influence on the SA production of the organism
(Van der Werf et al 1997) Hence it will be imperative to achieve correct
extracellular and intracellular CO2 levels during SA production
C3 metabolic pathway
However the C3 pathway cannot be avoided due to the redox requirement
of the cell In this pathway PEP is converted to pyruvate by pyruvate
kinase generating one molecule of ATP during the process Pyruvate is
then converted to acetyl-CoA by either pyruvate dehydrogenase (PDH)
andor pyruvate-formatelyase (PFL)
Pyruvate conversion with PDH results in one molecule of CO2 and one
molecule of NADH being formed alongside one molecule of AA With PFL
FA is produced instead of CO2 and NADH but FA can be further broken
down to CO2 and NADH by the enzyme formate dehydrogenase (FDH)
copycopy UUnniivveerrssiittyy ooff PPrreettoorriiaa
13
The FDH activity (encoded by the fdhF gene in A succinogenes) is known to
occur only under the following conditions (Spector 2009)
Absence of an electron acceptor such as oxygen or nitrate
Acidic pH conditions
Presence of FA
PFL expression is stated to be dependent upon two glycolysis enzyme
activities namely phosphoglucoisomerase and phosphofructokinase
Interestingly the expression of PFL and FDH enzymes is reported to
increase under carbon energy source starvation (Spector 2009)
Acetyl-CoA is the branch point at which both ethanol and AA are later
formed In this process a molecule of ATP is produced per molecule of AA
formed For one molecule of ethanol formed two molecules of NADH are
absorbed However ethanol formation can be reduced if there is
intracellular availability of CO2 to the organism (Van der Werf et al 1997)
copycopy UUnniivveerrssiittyy ooff PPrreettoorriiaa
14
Figure 23 Simplified metabolic network of A succinogenes (based on
McKinlay et al (2007)
copycopy UUnniivveerrssiittyy ooff PPrreettoorriiaa
15
Pentose phosphate pathway (PPP)
Figure 23 gives a simplified version of the metabolic pathway of A
succinogenes However several studies have noted that the pentose
phosphate pathway is an additional pathway for the A succinogenes (Brink
amp Nicol 2014 Bradfield amp Nicol 2014 Van der Werf et al 1997 McKinlay
et al 2007 McKinlay et al 2005) McKinlay (2007) stated that the PPP
only contributed 20 to the NADPH required for the organismrsquos growth
But Bradfield amp Nicol (2014) and Brink amp Nicol (2014) postulated that the
contribution of the PPP could increase and be more than predicted when
the organism enters the maintenance phase or non-growth phase
According to Ruumlhl et al (2012) a resting non-growing Bacillus subtilis cell
showed constant metabolic activity without cell growth which lead to an
apparent overproduction of nicotinamide adenine dinucleotide phosphate
(NADPH) (via the PPP) which is then converted by transhydrogenase into
NADH Bradfield amp Nicol (2014) claim that it is possible that this can also
occur with A succinogenes as it does possess the transhydrogenase The
analysis by Bradfield amp Nicol (2014) indicated an under-prediction of the
YAASA for the growth metabolism (associated with NADH ldquolossesrdquo) while an
over-prediction of the YAASA is achieved for the maintenance metabolism
(associated with NADH ldquogainrdquo) This could imply that different metabolic
pathways are employed under growth and maintenance conditions
Medium contributions were previously considered as the source for the
NADH disparities during the maintenance phase but this reasoning can be
ruled out given the results of the study done by Brink amp Nicol (2014) in
which the same medium resulted in opposite redox balance trends with
regard to the growth and non-growth phases
copycopy UUnniivveerrssiittyy ooff PPrreettoorriiaa
16
24 SA yield considerations
The theoretical maximum yield of SA on a carbon substrate through
fermentation can be determined by considering the net metabolic pathway
involved and a redox balance as illustrated by Villadsen Nielsen amp Lideacuten
(2011 159-163) The overall black box stoichiometry in converting glucose
to SA with no biomass and no by-product formation is
C6H12O6 + 120788
120789CO2rarr
120783120784
120789C4H6O4 +
120788
120789H2O (21)
From Equation 21 the theoretical maximum yield of succinic acid on
glucose (YGLSA) is 112 gmiddotg-1 However it is not possible to achieve the
maximum yield because actual SA yield will depend on the active metabolic
pathway of the organism and the associated product distribution To
determine the maximum YGLSA possible with by-product formation a redox
balance is required
Pyruvate metabolism
Assuming that there is no carbon flux to cell growth and if only the PDH
enzyme is active or FDH converting all FA the overall black box
stoichiometry in converting glucose to SA and AA with no biomass
formation is
C6H12O6 + 120784
120785CO2rarr
120786
120785C4H6O4 +
120784
120785C2H4O2 (22)
Since no FA is formed the YAAFA will be 0 gmiddotg-1 This pathway releases one
molecule of NADH for every molecule of AA produced (see Figure 24) The
copycopy UUnniivveerrssiittyy ooff PPrreettoorriiaa
17
NADH would be consumed by the C4 pathway to produce SA and then the
theoretical YGLSA would be 088 gmiddotg-1
Figure 24 Simplified metabolic network of A succinogenes (PDH
active)
On the other hand if only the PFL enzyme is active both FA and AA will be
formed (see Figure 25) The overall black box stoichiometry in converting
glucose to SA AA and FA with no biomass formation is
C6H12O6 + CO2rarrC4H6O4 +C2H4O2 + CH2O2 (23)
For every molecule of FA formed a molecule of AA will be produced so the
YAAFA will be 076 gmiddotg-1 As a result YGLSA will be 066 gmiddotg-1 If both PFL and
FDH enzymes are active then FA will be broken down to produce CO2 and
NADH which will result in YAAFA being 0 gmiddotg-1 and YGLSA being 088 gmiddotg-1
copycopy UUnniivveerrssiittyy ooff PPrreettoorriiaa
18
Figure 25 Simplified metabolic network of A succinogenes (PFL
active)
Nevertheless as mentioned by Van Heerden amp Nicol (2013a)the maximum
theoretical yield of SA can be obtained through the metabolic engineering
of A succinogenes This can be achieved by manipulating the organism to
use the oxidative part of the tricarboxylic acid (TCA) cycle under anaerobic
conditions (see Figure 26a)
copycopy UUnniivveerrssiittyy ooff PPrreettoorriiaa
19
Figure 26 (a) Simplified metabolic network of A succinogenes
(oxidative TCA cycle active) (b) Simplified metabolic network of A
succinogenes (glyoxylate bypass active)
Alternatively the glyoxylate bypass can be utilised (Figure 26b) to give the
same result For both these scenarios the mass-based SA-to-glucose ratio is
112 gmiddotg-1 which is the maximum theoretical yield of SA that can be
achieved
25 Nitrogen source for A succinogenes
The composition of the growth medium is a key factor in microbial
fermentations An important element of the fermentation medium which
will be essential for the growth of the organism is the nitrogen source
In the rumen A succinogenes is surrounded by a massive source of
nutrients which allow the organism to thrive But outside the rumen more
specifically in the laboratory or in an industrial fermentation setup
copycopy UUnniivveerrssiittyy ooff PPrreettoorriiaa
20
nutrients important for growth of the organism must be provided Since
A succinogenes is auxotrophic it requires certain amino acids and vitamins
to be provided for growth and SA production McKinlay et al (2010)
determined the essential vitamins required for the growth to be nicotinic
acid pantothenate pyridoxine and thiamine and the needed amino acids to
be cysteine glutamate and methionine Furthermore they concluded that
it is able to grow without biotin supplementation
By contrast Xi et al (2012) declared the essential vitamins to be only biotin
and nicotinic acid and the essential amino acids to be only glutamate and
methionine Nevertheless the addition of these defined components makes
the growth medium expensive for industrial use (Shuler amp Kargi 2002 52)
This collection of vitamins and amino acids is thought to be better
introduced to the organism in a complex form (eg yeast extract or corn
steep liquor) where the components and concentration of the nitrogen-
carrying compounds are unknown A complex form of nitrogen source is
less expensive than a defined form and it is said to produce higher cell
growth compared with media with a defined nitrogen source (Shuler amp
Kargi 2002 52)
Batch fermentation studies
Table 21 lists batch studies that investigated alternative nitrogen sources
for SA production and A succinogenes growth From the studies that used
only one type of nitrogen source (either YE or YE amp CSL or CSL amp vitamins)
it can be seen that studies that used only YE generally had a lower YGLSA
compared with the studies that used a combination of YE and CSL as the
nitrogen source Addition of vitamins (Yan et al 2013) to CSL produced SA
copycopy UUnniivveerrssiittyy ooff PPrreettoorriiaa
21
yields and cell growth that were better than the results produced by the YE
and CSL combination
Studies that compared different nitrogen sources within the same study
such as Jiang et al (2010) and Shen et al (2015) compared the
performance of several nitrogen sources inorganic and organic and
observed the following
Inorganic nitrogen sources such as (NH4)2SO4 or NH4Cl were the
worst performing with regard to cell growth and SA yield (Jiang et al
2010)
YE as the only nitrogen source in a growth medium produced the
highest SA yield and the highest dry cell weight (DCW) in comparison
with other nitrogen sources (Jiang et al 2010 Shen et al 2015)
CSL a by-product of corn starch production as the only nitrogen
source in a growth medium was the second best performer (Jiang et
al 2010 Shen et al 2015)
CSL medium did not achieve full carbon substrate conversion
compared with YE medium at the end of the batch fermentation
(Jiang et al 2010 Shen et al 2015)
These studies suggested that the most promising nitrogen source in terms
of A succinogenes growth and SA yield from carbon substrate was yeast
extract (YE) YE is said to have various vitamins amino acids minerals and
trace metals that are necessary to stimulate the growth of A succinogenes
and synthesize its metabolites (Kasprow Lange amp Kirwan 1998) Although
YE is considered to be the best source of nitrogen its price ranges from
US$350kg to US$67kg (Kwon et al 2000 Sridee et al 2011) while the
copycopy UUnniivveerrssiittyy ooff PPrreettoorriiaa
22
price of CSL ranges from US$007kg to US$0075kg (Davis et al 2013)
which makes YE an expensive and unfeasible nitrogen source for long-term
industrial fermentation (Jiang et al 2010 Xi et al 2013 Shen et al 2015)
and CSL an economically viable alternative to YE The feasibility of CSL
feasibility as a nitrogen source was also investigated using microorganisms
such as Mannheimia succiniciproducens (MBEL55E) and Anaerobiospirillum
succiniciproducens Those studies (Lee et al 2000 2002) came to the same
conclusion as Jiang et al (2010) and Shen et al (2015) the inexpensive CSL
can replace the expensive YE as a nitrogen source to promote cell growth
and SA production
A possible reason why CSL proved to be second best to YE is because CSL
contained the cofactor biotin which is considered to be vitally important
for the metabolism of protein lipid and carbohydrate (Xi et al 2012) The
biotin content in CSL is 1 mgmiddotkg-1 and this is said to be sufficient to make a
significant contribution to the nutritional requirement of A succinogenes or
other microorganisms (Nghiem et al 1996) However Jiang et al (2010)
and Shen et al (2015) noticed that with CSL as a nitrogen source in
contrast to YE as the nitrogen source there was a significant amount of
residual glucose that remained at the end of the batch fermentation Shen
et al (2015) suggest that CSL may lack trace elements and certain nitrogen-
containing compounds that prevent A succinogenes from meeting its
normal physiological needs Another reason could be that the batch
fermentation time was not long enough for the CSL medium to reach full
carbohydrate consumption Since no profile of the variables over time was
given for these studies it is hard to determine whether the residual glucose
found in the CSL medium was due to a lack of nutrients or productivity
reduction
copycopy UUnniivveerrssiittyy ooff PPrreettoorriiaa
23
Xi et al (2013) stated that the heme and CSL combination in the production
medium improved SA production by creating a more reductive
environment (the initial redox potential was very low when heme was
added to the medium)
copycopy UUnniivveerrssiittyy ooff PPrreettoorriiaa
24
Table 21 Batch fermentation studies of A succinogenes using different nitrogen sources namely YE and CSL
Study Model Nitrogen source (gmiddotL-1)
Carbon Source
CSo (gmiddotL-1)
CSA (gmiddotL-1)
YGLSA
(gmiddotg-1) YAASA
(gmiddotg-1) YAAFA
(gmiddotg-1)
DCW
(gmiddotg-1)
Gunnarsson
Karakashevamp
Angelidaki (2014)
130Z YE(20) Synthetic
hydrolysate
36 30 083 86 058 25
Zhen et al (2009)
CGMCC
1593
YE(15) Straw
hydrolysate
58 455 0807 7583 083 56
Corona-Gonzalez et
al (2008)
130Z YE(10) Glucose 547 338 062 52 11 37
Liu et al (2008)
CGMCC
1593
YE(10) Sugarcane
molasses
644 464 072 77 3 5
Yan et al (2013)
CCTCC
M2012
036
CSL(25) amp
vitamins
mixture
Glucose 50 39 085 - - -
copycopy UUnniivveerrssiittyy ooff PPrreettoorriiaa
25
Study Model Nitrogen source (gmiddotL-1)
Carbon Source
CSo (gmiddotL-1)
CSA (gmiddotL-1)
YGLSA
(gmiddotg-1) YAASA
(gmiddotg-1) YAAFA
(gmiddotg-1)
DCW
(gmiddotg-1)
CCTCC
M2012
036
CSL(25) amp
vitamins
mixture
Glucose 100 881 088 - - -
Jiang et al (2014)
CGMCC
1716
YE(10) amp
CSL(5)
mixture
Sucrose 100 55 069 11 09 3
Chen et al (2010)
NJ113 YE(10) amp
CSL(5)
mixture
Glucose 50 42 084 - - -
Urbance et al
(2004)
130Z YE(6) amp
CSL (10)
mixture
Glucose 40 339 087 - - -
Urbance et al
(2003)
130Z YE(6) amp
CSL(10)
mixture
Glucose
20 174 087 - - -
copycopy UUnniivveerrssiittyy ooff PPrreettoorriiaa
26
Study Model Nitrogen source (gmiddotL-1)
Carbon Source
CSo (gmiddotL-1)
CSA (gmiddotL-1)
YGLSA
(gmiddotg-1) YAASA
(gmiddotg-1) YAAFA
(gmiddotg-1)
DCW
(gmiddotg-1)
Shen et al (2015) GXAS1
37
YE(12) Sugarcane
molasses
70 546 078 75 5 38
CSL(206) Sugarcane
molasses
70 479 068 76 573 3
Xi et al (2013)
NJ113 YE(10) amp
CSL(75)
mixture
Glucose 30 171 057 372 - 37
CSL (15) Glucose 30 151 050 458 - 31
CSL (15) amp
heme (0001)
mixture
Glucose 30 217 072 493 - 33
Jiang et al (2010)
NJ113 YE(15) Glucose 70 487 070 - - 45
CSL(15) Glucose 70 96 014 - - 21
copycopy UUnniivveerrssiittyy ooff PPrreettoorriiaa
27
Continuous fermentation studies
To date all continuous fermentation studies except the study done by Yan
et al (2014) used a combination YE and CSL (based on the revised SA
medium by Urbance et al 2003) as nitrogen sources None of these studies
investigated on the effect of varying the nitrogen sources type or the
concentration on SA productivity and cell growth In Table 22 it can be
seen that with a fixed combination of YE and CSL growth medium Maharaj
et al (2014) achieved the highest SA yield on glucose mass ratio and
highest SA concentration However Yan et al (2014) reported even YGLSA
and SA concentration and they used a combination of the inexpensive CSL
and defined vitamins
26 Continuous fermentation
In an economic context the need to produce large volumes of product is the
main reason for the selection of the continuous reactor mode preferably
one in which a wild strain acts as the biocatalyst to diminish mutation
problems (Villadsen et al 2011 384) Continuous systems are
advantageous also on a monetary scale because they have lower capital and
labour costs in comparison with batch production systems and since
continuous processes are time independent constant product quality is
more attainable compared with batch or fed-batch processes (Villadsen et
al 2011 384)
A unique aspect of continuous operation is the formation of biofilm which
is inevitable during pro-longed A succinogenes fermentations (Van
Heerden amp Nicol 2013 Maharaj amp Nicol 2014 Urbance et al 2003
copycopy UUnniivveerrssiittyy ooff PPrreettoorriiaa
28
Bradfield amp Nicol 2014 Brink amp Nicol 2014) Biofilms are microbial cell
layers that are embedded in self-produced exopolysacharide (EPS) which is
prone to attaching to surfaces Reactors with biofilms can be operated for
longer periods of time and are very economical because of the self-
immobilizing nature of A succinogenes which results in high volumetric
productivities (Rosche et al 2009)
It is well-known that the growth of A succinogenes is inhibited by the total
concentration of acids in the medium (Corona-Gonzaacutelez et al 2008 Lin et
al 2008 Urbance et al 2004) and therefore at a low throughput (or D)
growth of the organism will be slow since that is when high yields and acid
concentrations are found At a high D the biofilm is established at a quicker
rate but process instability is more severe (Maharaj amp Nicol 2014) The
excessive biofilm shedding at this point does not allow the system to reach
steady state easily and maintain it At a low D the effects seen with a high D
are not observed According to Bradfield amp Nicol (2014) the concentrations
produced at a low D are linked to the maintenance phase and therefore
only a small fraction of the biomass is replicating which allows the system
to reach and maintain steady state (Maharaj amp Nicol 2014)
copycopy UUnniivveerrssiittyy ooff PPrreettoorriiaa
29
Table 22 Continuous fermentation studies of A succinogenes using different nitrogen sources namely YE and CSL
Study Organism model
Nitrogen source
Dilution CSo (gmiddotL-1)
CSA (gmiddotL-1)
YGLSA
(gmiddotg-1) YAASA
(gmiddotg-1) YAAFA
(gmiddotg-1)
DCW
(gmiddotg-1)
Maharaj et al
(2014)
130Z YE(6) amp
CSL(10)
0054
071
326
141
09
080
-
-
-
-
-
-
Yan et al
(2014)
CCTCC
M2012036
CSL(25) amp
vitamins
01-04 188-
3996
084-
092
- - -
001-01 422-
636
072-
085
- - -
Van Heerden
and Nicol
(2013b)
130Z YE(6) amp
CSL(10)
049 13 071 25 077 -
Urbance et al
(2004)
130Z
YE(6) amp
CSL(10)
085
104
076
-
-
-
copycopy UUnniivveerrssiittyy ooff PPrreettoorriiaa
30
3 Materials and Methods
31 Microorganism and growth
Microorganism
In this study Actinobacillus succinogenes 130Z (DSM No 22257 or ATCC
No 55618) was used It was obtained from the German Collection of
Microorganisms and Cell Cultures (Braunschweig Germany) The culture
was stored in a cryopreservation solution at a temperature of ndash75 degC
Inoculum preparation
Inoculum was prepared by transferring 1 ml of the preserved culture to a
vial containing 15 ml of sterilized tryptone soy broth (TSB) The vial was
sealed and stored in an incubator at 37 degC with a shaker speed of 100 rpm
for a duration of 16ndash24 h The broth was later tested for contamination and
usability by performing an analysis with high-performance liquid
chromatography (HPLC) If the broth contained lactic acid or ethanol it was
considered to be contaminated and if a considerable amount of SA was
found in the broth then the culture was deemed to be viable
32 Fermentation media
All chemicals used to make the fermentation medium were obtained from
Merck KgaA (Darmstadt Germany) unless otherwise indicated The feed
medium consisted of three parts a growth medium a phosphate buffer and
copycopy UUnniivveerrssiittyy ooff PPrreettoorriiaa
31
a glucose solution The fermentation medium is based on the composition
proposed by Urbance et al (2003)
Six different growth media were used during the fermentation runs each
medium were composed of a different type andor concentration of
nitrogen sources The first medium used only yeast extract (YE) as the
nitrogen source and the last medium used only corn steep liquor (CSL) The
first run had approximately 33 gmiddotL-1of D-glucose added to the medium and
the last run had approximately 45 gmiddotL-1 of D-glucose added to the medium
Table 31 gives details of the components and the respective concentrations
used to make the feed media CO2(g) (Afrox Johannesburg South Africa)
was fed into the recycle line at 10 vvm to serve as the inorganic carbon
source
copycopy UUnniivveerrssiittyy ooff PPrreettoorriiaa
32
Table 31 Specifications of feed mediaa used during fermentations
Medium
1
Medium
2
Medium
3
Medium
4
Medium
5
Medium
6
Glucose (gmiddotL-1)
Runs 1 amp 2 33 33 33 33 33 33
Run 3 45 45 45 45 45 45
Growth (gmiddotL-1)
YE 16 10 6 3 1 0
CSL 0 6 10 13 15 16
YE ( of YE in
N2 source)d
100 625 375 1875 625 0
NaCl 1 1 1 1 1 1
MgCl2middot6H2O 02 02 02 02 02 02
CaCl22H2O 02 02 02 02 02 02
CH₃COONa 136 136 136 136 136 136
Na2Smiddot9H2O 016 016 016 016 016 016
Antifoam Ybc 1 1 1 1 1 1
Phosphate (gmiddotL-1)
K2HPO4 16 16 16 16 16 16
KH2PO4 32 32 32 32 32 32
a Based on Urbance et al (2003)
b Antifoam from Sigma-Aldrich St Louis USA
c Concentration is in mlmiddotL-1
d YE in N2 source is the of YE in the total complex nitrogen source in the medium
The concentration of the total complex nitrogen source (a combination of CSL and
powder YE) was 16 gmiddotL-1 throughout the fermentations for all runs
copycopy UUnniivveerrssiittyy ooff PPrreettoorriiaa
33
33 Bioreactor
The bioreactor pictured in Figure 31 (a amp b) was a glass cylindrical body
set between an aluminium base and head with an external recycle line to
provide agitation The working volume of the reactor (including recycle)
was 356 mL The liquid level in the reactor was maintained by using a
peristaltic pump on the product line All pumps used in the system were
peristaltic pumps A wooden stick covered in terry cloth was inserted in the
glass cylindrical body for biofilm attachment In fermentation run1 and
run2 one stick was used and in fermentation run 3 three sticks were used
CO2 flow rates were controlled using Brooks 5850S mass flow controllers
(Brooks Instrument Hungary) and the CO2 entered the reactor via an inlet
in the recycle line which was connected to a 02 μm PTFE membrane filter
(Midisart 2000 Sartorius Goumlttingen Germany) The gas exited the system
through a filter with the same specifications as mentioned earlier
connected to the foam-trap
The pH was measured using a CPS 71D-7TB21 glass combination probe
(Endress+Hauser Gerlingen Germany) held within a stainless-steel holder
connected in-line within the recycle stream Maintaining the pH at 68
required the use of a Liquiline CM442 (Endress+Hauser Gerlingen
Germany) in which an internal relay controlled the dosing of 10 M
unsterilized NaOH in an onndashoff fashion Temperature was controlled in a
similar fashion a hotplate was used to provide the heat required to
maintain the temperature at 37 degC For better control of temperature
fluctuations the hotplate was linked to the National Instrument (NI)
module The NI module is further discussed in Section 35
copycopy UUnniivveerrssiittyy ooff PPrreettoorriiaa
34
Figure 31a) Simplified schematic of bioreactor setup
No Description
1 Gas filter
2 Foam-trap 3 Medium
reservoir 1 4 Antifoam
reservoir 5 Medium
reservoir 2 6 Inoculation
septum 7 Reactor body 8 Hot plate 9 Temperature
control 10 pH probe 11 Product
reservoir 12 NaOH reservoir 13 CO2 cylinder 14 Controller 15 Recycle pump 16 Dosing pump
17 Gas flow controller
8
7
2
3
4
5
11
12
13
17
T pH
6
C
DAQ
PC
1
9 10
14
15
16
copycopy UUnniivveerrssiittyy ooff PPrreettoorriiaa
35
Figure 31b) Bioreactor setup
copycopy UUnniivveerrssiittyy ooff PPrreettoorriiaa
36
34 Fermentation procedure
The three parts of the fermentation medium (growth medium buffer and
glucose) were prepared in separate bottles and were autoclaved at 121degC
for 60 minutes To prevent unwanted reactions amongst the medium
components the three parts of the medium were only mixed once the
bottles had cooled to room temperature (approx 24 degC) The reactor
system (excluding NaOH) was also autoclaved at the same temperature and
duration as stated above
The first fermentation medium (see Table 31) was used to start up the
fermentation It had only YE as the nitrogen source This was done to form
a substantial amount of biofilm for full glucose consumption The feed
setup was then connected to the sterile reactor system with a sterile
coupling The coupling consisted of a U-connection one half of which was
fixed to the feed setup and the other half to the reactor system Each half of
the connection had a ball valve to isolate the system from the external
environment The half connections were then coupled and placed in an oil
bath at 140 degC for 20 minutes The reactor was then filled with medium and
once the temperature and pH had stabilized to 37degC and 68 respectively
10 mL of inoculum was injected into the reactor through a silicon septum
attached to the reactor head
Fermentations were started off by operating the system at batch conditions
for 17 hours and then changing to continuous operation at a low dilution
rate This allowed for cell accumulation and prevented cell washout
Addition of antifoam into the reactor was only done when deemed
necessary The recycle flow rate was kept constant at 500 mLmiddotmin-1 in all
fermentations to maintain similar shear conditions The CO2 flow rate was
copycopy UUnniivveerrssiittyy ooff PPrreettoorriiaa
37
set at a vvm of 10 as it seemed sufficient to maintain CO2 saturation in the
reactor After a few days of operation biofilm appeared on internal surface
of the bioreactor as well as the wooden stick covered in terry cloth which
was inserted into the glass cylinder as the intended surface for biofilm
attachment
Controlled variables
Dilution rates for the fermentation runs were determined using the first
fermentation medium Once biofilm had formed in the reactor after a few
days of continuous operation the dilution rate was adjusted until 95 of
initial glucose had been consumed For R3 90 was the target for glucose
consumption The dilution rate was fixed for the entire experimental run if
the above mentioned glucose consumption stayed more or less constant for
three days or more
Media change during fermentation
Similar to the feed connection to the reactor the different medium setups
were connected to the sterile reactor system with another sterile coupling
The half connections were then coupled and the U-connection was placed
in an oil bath at 140 degC for 40 minutes
35 Online monitoring
Monitoring of the process was performed in a similar fashion to that of Van
Heerden and Nicol (2013b) in which the time-averaged NaOH dosing
copycopy UUnniivveerrssiittyy ooff PPrreettoorriiaa
38
fraction was linked to a productivity factor allowing an estimated SA
concentration to be calculated in real-time A LabVIEW (NI module)
program was used to monitor and control the reactor The program was
linked to the reactor instrumentation using a cDAQ-9184 data acquisition
device (National Instruments Hungary) with voltage and current input
modules and a current output module Temperature dosing and antifoam
flowrates were controlled with the program Temperature pH gas flow
rates and the time-averaged dosing of NaOH were recorded through the
program
36 Analytical methods
HPLC analysis
High-performance liquid chromatography (HPLC) was used to determine
the concentrations of glucose SA and other organic acids Analyses were
done using an Agilent 1260 Infinity HPLC (Agilent Technologies USA)
equipped with an RI detector and a 300 mm times 78 mm Aminex HPX-87 H
ion-exchange column (Bio-Rad Laboratories USA) The mobile phase (03
mLmiddotL-1 and 11 mLmiddotL-1H2SO4) flowrate was 06 mLmiddotmin-1 and the column
temperature was 60degC
Suspended cell analysis
Once the reactor had reached a steady state the product stream was
collected in a bottle that was kept in a small bar refrigerator The product
bottle was kept cool to prevent further growth of cells and metabolic
activity and depending on the dilution rate the duration of the collection
period varied from 12 to 72 hours The collected volume was then
copycopy UUnniivveerrssiittyy ooff PPrreettoorriiaa
39
thoroughly mixed and a 12 mL sample was collected for suspended cell
analysis This was performed by splitting the 12 mL sample into 12 x 1 mL
samples and centrifuging at 4000 rpm for 2 minutes The samples were
centrifuged three times and after each centrifugation the supernatant was
poured out and the cell precipitate washed in distilled water Following the
third centrifugation the cell precipitates were transferred to an empty
glass vial that had been measured beforehand The cell precipitates were
then dried to a constant weight in an 85 degC oven
Mass balance analysis
Overall mass balances were performed to assess the accuracy of each
sample The mass balances were performed by comparing the
stoichiometric amount of glucose required to achieve the experimental
concentrations of SA AA and FA with the experimental amount of glucose
consumed
37 Steady state check
When the time-averaged dosing profile constructed by the LabVIEW
program ceased to fluctuate by a 5 standard deviation of the average
dosing flow it was assumed that the system had reached pseudo-steady
state and the product stream was sampled To further ascertain steady
state the glucose and organic acid concentrations in product samples
frequently taken over a certain period were compared and if negligible
differences were found between the sample data the system was
confirmed to be at steady state
copycopy UUnniivveerrssiittyy ooff PPrreettoorriiaa
40
38 Summary of fermentation
Results were obtained over three continuous fermentation runs Several
other runs were attempted but did not provide any results that were
valuable due to upsets encountered in the system The three runs
mentioned in Table 32 were conducted to prove the repeatability of trends
observed in the first fermentation run
Table 32 Summary of fermentation runs performed
Five different mediums each with a glucose concentration of 33 gmiddotL-1 were
used in fermentation run 1 (R1) This gave an indication of what the
general trend would be of the product distribution The dilution rate was
adjusted until steady state was achieved with only 5 of initial glucose
concentration as residual for the first medium Therefore with the 33 gmiddotL-1
initial glucose a Df of 008 h-1 was set Fermentation run 2 (R2) was
conducted to prove the repeatability of the trend seen in R1 Fermentation
run 3 (R3) was conducted with six different media at a glucose
concentration of 45 gmiddotL-1 and 90 glucose conversion was only achieved
when the Df was lowered to 0041 h-1
Run Operating
hours (h)
Glucose
(gmiddotL-1)
Df
(h-1) Medium No
1 1 008 33 0080 1 2 3 4 5 -
2 1 104 33 0045 1 3 5 - - -
3 1 272 45 0041 1 2 3 4 5 6
copycopy UUnniivveerrssiittyy ooff PPrreettoorriiaa
41
Biofilm attachment and appearance
Approximately 72 hours after inoculation of the bioreactor biofilm started
forming on the glass wall of the reactor A substantial amount of biofilm
inside the bioreactor only formed after plusmn 330 operating hours The
structure and the amount of the biofilm varied throughout the
fermentations and it appeared that the biofilm was dependent on the
following
the surface to which it is attached
the history of the fermentation
the composition of the fermentation medium
Figure 32 (a) shows the bioreactor before inoculation and without cell
attachment After operation for more than 330 hours using only YE as the
nitrogen source a thick mass of biofilm had formed as shown in Figure
32 (b) However as the CSL concentration on the fermentation medium
increased more biofilm started to shed and eventually when only CSL was
used at the nitrogen source there was almost no biofilm attachment on the
glass surface of the bioreactor (as seen in Figure 32 (c))
Although there was not much biofilm on the glass surface there was
biofilm on the internals of the reactor (the wooden sticks covered in terry
cloth) Figure 33 (a amp b) illustrates the sticks covered in biomass at the end
of the fermentations
copycopy UUnniivveerrssiittyy ooff PPrreettoorriiaa
42
Figure 32 a) Bioreactor before inoculation b) Biofilm growth using
only YE as nitrogen source c) Bioreactor with only CSL as nitrogen source
(a) (b) (c)
copycopy UUnniivveerrssiittyy ooff PPrreettoorriiaa
43
Figure 33 a) Internal support for biofilm attachment (at the end of
fermentation run 1) b)Internal supports for biofilm attachment (at the end
of fermentation run 3)
(a) (b)
copycopy UUnniivveerrssiittyy ooff PPrreettoorriiaa
44
4 Results and Discussion
41 Experimental strategy for different runs
The objective of R1 (fermentation run 1) was to find steady state data that
could be analysed to understand the influence of YE and CSL on the growth
and productivity of A succinogenes As seen in Table 31 the media used in
the experiments differed from each other regarding the concentrations of
CSL and YE but the total complex nitrogen source concentration in the
media remained constant The intended experimental plan was to report
the steady state product concentrations as the concentration of YE in the
growth medium varied (ie as the YE concentration decreased and the CSL
concentration increased) R2 (fermentation run 2) which followed the
same procedure as R1 was conducted to prove that the data found in R1
was repeatable R3 (fermentation run 3) was an attempt to achieve high SA
concentrations following the same experimental plan as R1 except that R3
used a high initial glucose feed concentration and had additional internal
support to increase the surface area available for biofilm attachments
All fermentations began with a growth medium that contained only YE as
the nitrogen source (100 YE) and once a healthy and stable biofilm had
formed the growth media were changed according to the procedure
explained in Section 34 Fermentation procedure
Initially R1 had a high biomass content and activity (when only YE was in
the fermentation medium) and as the YE content in the growth medium
decreased the biomass activity decreased R2 was effectively a repetition
of R1 but due to the low initial biomass activity the dilution rate was
adjusted to have approx 95 glucose conversion (when the growth
copycopy UUnniivveerrssiittyy ooff PPrreettoorriiaa
45
medium had only YE as the nitrogen source) Despite the increased surface
area for biofilm attachment the biomass in R3 struggled to achieve the
same activity as R1 Initially the SA concentration was slightly higher but
eventually the results of R3 coincided with those of R2 when CSL was
introduced into the growth medium The dilution rate for R3 could have
been lowered further to reach higher product concentrations but it was
decided not to do this due to time constraints for achieving steady state
Table 41 gives the steady state results for all three runs
copycopy UUnniivveerrssiittyy ooff PPrreettoorriiaa
46
Table 41 Steady state data for the three continuous fermentation runs
Dilution
(h-1)
SA
(gmiddotL-1) AA (gmiddotL-1) FA (gmiddotL-1)
PYR
(gmiddotL-1)
Δ GLC
(gmiddotL-1)
YE ( in nitrogen
source)
Black box mass
balance ()
Average black box
mass balance ()
Average black box
mass balance ()
with DCW
Fermentation run 1
008 1731 814 608 048 3041 10000 8529
008 1685 816 619 050 3067 10000 8347
009 1671 800 612 051 3059 10000 8269 8382
008 1860 702 449 066 2916 6250 8777
008 1872 667 435 079 2917 6250 8716 8747 9581
008 1764 492 263 045 2619 3750 8343
008 1792 494 251 033 2596 3750 8473
008 1778 498 259 031 2596 3750 8441 8419
008 1691 359 183 178 2152 1875 9646
008 1696 349 168 175 2223 1875 9278
008 1669 353 170 172 2107 1875 9687 9537
008 1565 239 064 224 1855 625 9935
008 1411 192 048 290 1808 625 9459
008 1328 176 056 293 1822 625 8921 9438
copycopy UUnniivveerrssiittyy ooff PPrreettoorriiaa
47
Dilution
(h-1)
SA
(gmiddotL-1) AA (gmiddotL-1) FA (gmiddotL-1)
PYR
(gmiddotL-1)
Δ GLC
(gmiddotL-1)
YE ( in nitrogen
source)
Black box mass
balance ()
Average black box
mass balance ()
Average black box
mass balance ()
with DCW
Fermentation Run 2
004 1780 852 569 051 2954 10000 9023
004 1853 878 569 044 2972 10000 9256
004 1874 897 585 040 3004 10000 9287 9189
004 1796 564 248 042 2489 3750 9154
004 1759 582 263 035 2354 3750 9616
004 1760 570 228 038 2561 3750 8760 9177
004 1175 290 071 201 1447 625 10575
004 1106 289 074 199 1455 625 10081
004 1080 283 071 202 1390 625 10357 10338
Fermentation Run 3
004 2253 1022 493 026 3695 10000 8686
004 2257 1009 499 023 3673 10000 8711
004 2205 976 477 025 3656 10000 8522 8640 9138
004 1927 787 298 000 3043 6250 8538
004 1970 803 306 007 3221 6250 8266
004 1991 820 335 005 3242 6250 8344 8383 9213
004 1785 604 128 063 2998 3750 8583
copycopy UUnniivveerrssiittyy ooff PPrreettoorriiaa
48
Dilution
(h-1)
SA
(gmiddotL-1) AA (gmiddotL-1) FA (gmiddotL-1)
PYR
(gmiddotL-1)
Δ GLC
(gmiddotL-1)
YE ( in nitrogen
source)
Black box mass
balance ()
Average black box
mass balance ()
Average black box
mass balance ()
with DCW
004 1879 615 131 069 3092 3750 8572 8568 8974
004 1635 493 028 067 2635 1875 8718
004 1628 486 022 077 2605 1875 8644
004 1578 455 036 080 2664 1875 8431 8598 9919
004 1159 295 000 082 1489 625 9255
004 1110 286 000 098 1955 625 8545
004 1104 275 000 099 1419 625 9630
004 1044 259 000 114 1433 625 8908 9085 11240
004 817 137 000 177 1582 000 6186
004 709 086 000 237 1425 000 8691
004 725 072 000 249 1457 000 6140
004 712 080 000 273 1271 000 7161 7045 7234
copycopy UUnniivveerrssiittyy ooff PPrreettoorriiaa
49
Mass balances or redox balances were performed on all the samples and
the average closures of the steady state samples are shown in Table 41
Mass balance closure did increase as the YE content decreased In R3
DCWs were taken to see if the mass balance closure would reach 100
Including the DCWs significantly improved the mass balance but did not
close it Anything above 90 was considered a proper closure and most
figures that were below 100 may indicate unknown metabolites or non-
perfect analysis of acids and sugars
42 Productivity analysis
Figure 41 shows the average concentrations of SA AA and FA in the
product streams at steady state for all fermentation runs For a clear
comparison of the metabolite concentrations of all the fermentation runs
the results were put into a single plot despite the differences in dilution
rate and glucose feed concentration The reasons for the difference in
dilution rates were explained in Section 41
copycopy UUnniivveerrssiittyy ooff PPrreettoorriiaa
50
R1
R2
R3
SA
FA
AA
Figure 41
(See Table 31)
Figure 42 depicts how SA productivity and the glucose consumption rate
changed as the YE concentration decreased
0
2
4
6
8
10
12
14
16
18
20
22
24
0 10 20 30 40 50 60 70 80 90 100
Co
nce
ntr
atio
n(g
middotL-1
)
YE in Nitrogen Source
Figure 41 Product concentration profiles for SA AA and FA of
A succinogenes as the YE in the growth media varied
The total nitrogen source (combination of YE and CSL) concentration in the
growth medium stayed constant at 16 gmiddotL-1only the concentrations of YE (powder
form) and CSL (liquid form) varied
Commented [B1] In order for the very long captions for Figures 41 to 46 NOT to show in the automatic List of Figures Ive converted the detailed descriptions to normal text
copycopy UUnniivveerrssiittyy ooff PPrreettoorriiaa
51
R1
R2
R3
Productivity SA
Glucose
consumption rate
Figure 42SA productivity profile and glucose consumption rat
A succinogenes as the YE in the growth media varied
(See Table 31)
SA concentration decreased as the concentration of YE was reduced in the
medium When only YE was used as the nitrogen source which is an ideal
ingredient for A succinogenes growth and SA productivity the highest SA
concentration for R2 and R3 was achieved For R1 the SA concentration
was at its highest when the 625 of YE medium was used Despite the
difference in glucose concentration SA concentrations for R1 R2 and R3
0
02
04
06
08
1
12
14
16
18
2
22
24
26
28
3
0
02
04
06
08
1
12
14
16
0 10 20 30 40 50 60 70 80 90 100
Glu
cose
co
nsu
mp
tio
n r
ate
(gL
hr)
Pro
du
ctiv
ity
SA
(gmiddotL
-1middoth
r-1))
of YE in Nitrogen source
Figure 42 SA productivity profile and glucose consumption rate
profiles of A succinogenes as the YE in the growth media varied
The total nitrogen source (combination of YE and CSL) concentration in the
growth medium stayed constant at 16 gmiddotL-1 only the concentrations of YE
(powder form) and CSL(liquid form) varied
copycopy UUnniivveerrssiittyy ooff PPrreettoorriiaa
52
were similar when CSL was added to the medium R3 started with a high SA
concentration as expected but then quickly dropped and displayed the
trend observed in R1 and R2 AA and FA both decreased as the YE content
in the medium decreased for all runs The concentrations for both FA and
AA more or less matched in all runs irrespective of the dilution rate and
the glucose feed concentration When only CSL was used as the nitrogen
source in the growth medium in R3 no FA was produced
The SA productivity trend shown in Figure 42 is the same as the SA
concentration profile The highest SA productivity obtained in this study
was 158 gmiddotL-1middoth-1 when a 625 YE medium was used as the nitrogen
source From Figure 42 it should be clear that the productivities of R1
were almost twice as high as the productivities of R2 The same can be said
for the glucose consumption rates for R1 and R2 This is because the
dilution rate of R1 was also twice as much as the dilution rate of R2
According to Maharaj et al (2014) a decrease in dilution should lead to an
increase in product concentrations and yields R1 and R2 do not follow that
trend Instead their product concentrations profile matched A possible
reason for the inconsistency in the trends could be that there was less
biofilm activity in R2 for an unknown reason compared with the biofilm
activity in R1 resulting in a product concentrations profile match instead of
higher product concentrations in R2 compared with the profile for R1
43 Analysis of product distribution
Metabolite concentrations were used to determine and study the product
distributions YAASA YAAFA and YGLSA of the three fermentations
copycopy UUnniivveerrssiittyy ooff PPrreettoorriiaa
53
In Section 24 the theoretical metabolic flux limitations were discussed and
it was noted that in the absence of biomass formation the maximum
theoretical values for YAASA and YGLSA should be 393gmiddotg-1 and 088 gmiddotg-1
respectively These yields would only be achieved if no FA was produced
ie if only PDH was active However if the PFL route was active and all of
the FA was converted to CO2 and NADH by FDH then the maximum
theoretical yields mentioned earlier could be still achieved If biomass is
produced then a portion of the glucose in the growth medium would be
directed to the anabolic pathway which would influence the carbon
distribution resulting in maximum yields less than those given above
It is illustrated in Figure 43 that YAASA should vary between 197 gmiddotgminus1 (for
YAAFA = 077 gmiddotgminus1) and 393 gmiddotg-1 (for YAAFA = 0 gmiddotgminus1) Using only YE as the
nitrogen source the experimental yields for all runs matched the maximum
theoretical yields that were obtained when only the PFL enzyme was
active As the nitrogen source content varied (ie CSL concentration
increased and YE concentration decreased) YAASA increased and YAAFA
decreased thus indicating a shift in the metabolic flux distribution YAASA for
R2 and R3 were similar throughout the runs so was YAAFA However when
the YE concentration in the nitrogen source was 1875 for R1 and R3
YAASA exceeded the maximum theoretical yield while YAAFA was still in the
range of 0 gmiddotg-1 to 077 gmiddotg-1 The highest YAASA achieved in this study was 83
gmiddotg-1 and the lowest YAAFA was 0 gmiddotg-1 as seen in Figure 43 these yields
were obtained in R3 when only CSL was used as the nitrogen source
Certain batch studies in A succinogenes also achieved a YAASA that exceeded
the maximum theoretical yield (see Section 26 Table 21) but those
studies used YE as the nitrogen source whereas in this study it was
copycopy UUnniivveerrssiittyy ooff PPrreettoorriiaa
54
achieved using only CSL Xi et al (2013) was the only study (batch
fermentation) mentioned in Table 21 that used only CSL as the nitrogen
source with glucose as the carbon substrate and exceeded the maximum
theoretical YAASA They attained a YAASA of 458 gmiddotg-1
copycopy UUnniivveerrssiittyy ooff PPrreettoorriiaa
55
R1
R2
R3
SAAA
FAAA
Figure 43 Experimental yields plotted with the maximum theoretical yields
profile of A succinogenes as YE in medium changes
Considering the flux at the pyruvate node YAAFA decreased and was
approaching zero as the CSL concentration in the nitrogen source
increased as seen in Figure 43 This could be an outcome of an increase in
either PDH or FDH activity or a decrease in activity for both PDH and PFL
resulting in an increased concentration of pyruvate in the product stream
Figure 44 illustrates how the pyruvate concentration increased as the CSL
concentration in the growth medium increased
0
05
1
15
2
25
3
35
4
45
5
55
6
65
7
75
8
85
9
0 10 20 30 40 50 60 70 80 90 100
Mas
s ra
tio
(g
g-1)
YE in Nitrogen Source
SAAA max (PFL)
FAAA max (PFL)
SAAA max (PDH)
FAAA max (PDH)
Figure 43 Experimental yields plotted with the maximum theoretical
yields profile of A succinogenes as YE in medium changes
The total nitrogen source (combination of YE and CSL) concentration in the
growth medium stayed constant at 16 gmiddotL-1 only the concentrations of YE
(powder form) and CSL(liquid form) varied
copycopy UUnniivveerrssiittyy ooff PPrreettoorriiaa
56
(See Table 31)
According to the redox balance it is expected that YAASA would increase as
YAAFA decreased and in this study the same development was observed
This could be linked to the increasing CSL concentration in the nitrogen
source in this study Bradfield amp Nicol (2014) suggested that there could be
an additional reducing power that produced the yields that were achieved
Using carbon and redox balances they noticed in their study that the
experimental YAASA values exceeded the predicted values suggesting that an
increase in PDH or FDH activity was not the only contribution to the
increase in YAASA and that additional reducing power was present The same
0
02
04
06
08
1
12
14
16
18
2
22
24
26
28
3
0 10 20 30 40 50 60 70 80 90 100
Co
nce
ntr
atio
n(g
L)
YE in Nitrogen Source
PYR R1
PYR R2
PYR R3
Figure 44 Pyruvate concentration profile of A succinogenes as YE in
medium changes
The total nitrogen source (combination of YE and CSL) concentration in the
growth medium stayed constant at 16 gmiddotL-1 only the concentrations of YE
(powder form) and CSL(liquid form) varied
copycopy UUnniivveerrssiittyy ooff PPrreettoorriiaa
57
explanation can be applied to this study as seen in Figure 43 The increase
in the YAASA is influenced by the decrease in the YAAFA ratio although it is not
sufficient to reach the expected ratios (according to the redox balance)
(See Table 31)
Figure 45 illustrates the NADH consumed per NADH produced for all
fermentation runs The NADH consumed (mol NADHmiddotcmol glucose-1) was
calculated as follow
09
1
11
12
13
14
15
16
17
18
19
2
0 10 20 30 40 50 60 70 80 90 100
NA
DH
Co
nsu
med
NA
DH
Pro
du
ced
of YE in Nitrogen source
NADH R1
NADH R2
NADH R3
Figure 45 NADH ratio consumed during production of A succinogenes
as YE in medium changes
The total nitrogen source (combination of YE and CSL) concentration in the
growth medium stayed constant at 16 gmiddotL-1 only the concentrations of YE
(powder form) and CSL(liquid form) varied
copycopy UUnniivveerrssiittyy ooff PPrreettoorriiaa
58
2119862119878119860119872119872119878119860
6∆119866119871119862119872119872119866119871119862
frasl (41)
Using Figure 2 Equation 41 was generated The only pathway that
consumed NADH was the path that converted PEP to SA where 2 molecules
of NADH were consumed to produce 1 molecule of SA
The NADH (mol NADHmiddotcmol glucose-1) produced was calculated as follow
(119862119878119860
119872119872119878119860+
2119862119860119860
119872119872119860119860minus
119862119865119860
119872119872119865119860)
6∆119866119871119862
119872119872119866119871119862
frasl (42)
The path from glucose to PEP produced 2 molecules of NADH per one
glucose molecule consumed and from PYR to AA 1 molecule of NADH per
one AA molecule was produced All the inputs for these equations were the
product concentrations obtained from the experimental runs
In Figure 45 it is noted that for all the fermentation runs the ratio of NADH
consumed to NADH produced increased as the concentration of YE in the
growth medium increased Nevertheless there is a clear dissimilarity
between the three runs In R3 the NADH production was higher than the
consumption for all growth media except when only CSL was used as the
nitrogen source R2 and R3 in comparison with R1 did not display a
massive imbalance in the NADH ratio and R1 was the only run where NADH
consumed over produced ratio consistently increased significantly as the
YE content in the growth medium increased It appears that the additional
NADH generation capability of R1 was not fully present in R2 and R3 and
possibly the strains used in R2 and R3 had altered production
copycopy UUnniivveerrssiittyy ooff PPrreettoorriiaa
59
characteristics compared with the original strain Nevertheless the R1
results coincide with the observation of both Bradfield amp Nicol (2014) and
Brink amp Nicol (2014) which was that there was an ldquoexcessrdquo of NADH that
was consumed during the maintenance phasenon-growth phase resulting
in a high YAASA
copycopy UUnniivveerrssiittyy ooff PPrreettoorriiaa
60
(See Table 31)
Figure 46 illustrates the yield of SA on glucose for R1 This graph shows
how the flux from glucose to SA increases as the CSL concentration in the
growth medium increases The trend observed in Figure 46 can be linked
to the ldquoexcessrdquo NADH that favours the production of SA Xi et al (2013)
observed that using only CSL as the nitrogen source provided high
selectivity towards SA (458 gmiddotgminus1) in comparison with other by-products
On the other hand CSL with heme provided a high glucose-to-SA flux
(072 gmiddotgminus1) and a much higher YAASA (493 gmiddotgminus1) A similar observation was
04
043
046
049
052
055
058
061
064
067
07
073
076
079
082
085
088
0 10 20 30 40 50 60 70 80 90 100
Mas
s ra
tio
(g
g-1)
YE in Nitrogen Source
SAGL R1
SAGL max(PFL)SAGL max(PDH)
Figure 46 Mass ratio of succinic acid over glucose profile of
A succinogenes as YE in medium changes
The total nitrogen source (combination of YE and CSL) concentration in the
growth medium stayed constant at 16 gmiddotL-1 only the concentrations of YE
(powder form) and CSL(liquid form) varied
copycopy UUnniivveerrssiittyy ooff PPrreettoorriiaa
61
documented by Yan et al (2013) Xi et al (2012) tried to explain this
observation in their study by stating that CSL contained cofactor biotin
which promoted the high SA selectivity
It is reasonable to postulate that there is an ingredient in CSL that may
trigger or enhance the activity of an additional metabolic pathway known
as the pentose phosphate pathway (PPP) to produce high carbon flux to SA
and high SA selectivity The idea of PPP as the source of the additional
reducing power stems from the findings of Bradfield and Nicol (2014)
Their analysis has shown that if the NADPH generated in the PPP cycle is
converted to NADH in order to supply redox to the SA pathway then high
SA selectivity can be achieved A succinogenes has the transhydrogenase
that allows PPP to be active and as mentioned earlier the presence or
absence of one or more ingredients in CSL may allow this enzyme to be
active consequently activating the PPP as well
Xi et al (2012) did mention biotin as the culprit for the high SA selectivity
They investigated the influence of biotin on A succinogenes growth and SA
productivity by varying the biotin concentration in a chemically defined
medium There was no SA production and cell growth was severely
inhibited when biotin was absent from the growth medium They reported
a high SA yield in their study but their data for AA concentration YGLAA and
YAASA were inconsistent with their observed product concentrations The
following example is extracted from their results In the experiment using
8 mg L-1biotin the glucose consumed was 300 g L-1 CSA = 194 g L-1 CAA =
32 g L-1 YGLAA = 0203 g g-1 and YAASA = 61 g g-1 However the YGLAA should
have been 0107 gmiddotg-1 if CAA was reported correctly but if the value for YAASA
was used as the value of CAA then the reported YGLAA would be correct
copycopy UUnniivveerrssiittyy ooff PPrreettoorriiaa
62
Nevertheless because of the inconsistency of the data it cannot be
concluded that biotin did play a role in gaining a high SA yield
Either the presence or absence of a component in a growth medium can
influence the enzymatic activity of a pathway and this concept should be
used to postulate explanations for the results obtained in this study
A breakdown of the constituents of CSL and YE could help in identifying the
ingredients in CSL that may have triggered or enhanced the activity of the
PPP Since both CSL and YE are complex media and there is no definite
information on the ingredients it is hard to fully confirm the following
theory
Xiao et al (2013) did a study on the constituents of CSL and stated that any
grade of CSL has the following amino acids isoleucine asparagine
methionine lysine proline and aspartic acid YE was reported by an
industrial data sheet (Organotechniereg SAS France) to have a high
content of the following alanine isoleucine leucine methionine
phenylalanine tyrosine and valine Although there are common amino
acids shared between CSL and YE there is one amino acid YE has that is
absent from CSL namely leucine This could be a reason why CSL could be
related to the excess NADH
Leucine in Ecoli is said to repress the transhydrogenase activity which in
turn represses the PPP (Gerolimatos amp Hanson 1978) This could be true
for A succinogenes since it also has the transhydrogenase for PPP as
mentioned in Section 23 A succinogenes with only YE as the nitrogen
source produced yields that were expected according to the carbon and
redox balance It can be postulated that as the YE content reduce the
copycopy UUnniivveerrssiittyy ooff PPrreettoorriiaa
63
leucine content decreased and the activity of the transhydrogenase
increased causing additional NADH to be generated from the enhanced
PPP resulting in improved yields
copycopy UUnniivveerrssiittyy ooff PPrreettoorriiaa
64
5 Conclusions
The complex nitrogen requirements of non-growing A succinogenes
biofilms were evaluated The study restricted itself to the use of YE and CSL
as nitrogen sources The SA productivity yields and titre were the variables
assessed
The YE concentration was decreased while simultaneously increasing the
CSL concentration in the medium Although this led to a decrease in the
steady state productivity of the organism overall SA selectivity increased
The production of certain metabolites such as SA and pyruvate also
increased while FA and AA concentrations decreased in the increasing
absence of YE This led to an increase in the SA to AA mass ratio and to a
decrease in the FA to AA mass ratio When zero amounts of YE were in the
growth medium no FA was produced
Three fermentation runs were performed The highest SA concentration in
this study was 2257gmiddotL-1 when only YE was used as the nitrogen source in
the growth medium and the highest SA productivity obtained in this study
was 158 gmiddotL-1middoth-1 when a combination of YE(625) and CSL(375) was
used as the nitrogen sourceThe highest SA to AA mass ratio achieved was
83 gmiddotg-1 when only CSL was used as the nitrogen source The FA to AA
mass ratio was consistently less than 077 gmiddotg-1 approaching 0 gmiddotg-1 as the
CSL concentration in the nitrogen source increased
Lower FA to AA mass ratio values were not fully responsible for the
increase in the SA to AA mass ratio The surplus NADH required is provided
copycopy UUnniivveerrssiittyy ooff PPrreettoorriiaa
65
by the activation or enhancement of an alternative metabolic pathway ie
the pentose phosphate pathway
The observations made in this study bolster the idea of using a combination
of YE and CSL where YE is the minor component as the nitrogen source for
commercialisation of bio-based succinic acid production using
Asuccinogenes as the catalyst
copycopy UUnniivveerrssiittyy ooff PPrreettoorriiaa
66
6 References
Allied Market Research (2014) ldquoWorld bio succinic acid market ndash
Opportunities and forecasts 2013ndash2020rdquo [Online]
httpswwwalliedmarketresearchcombio-succinic-acid-market
Beauprez JJ De Mey M and Soetaert WK (2010) ldquoMicrobial succinic acid
production natural versus metabolic engineered producersrdquo Process
Biochem451103ndash1114
Bechthold I Bretz K Kabasci S Kopitzky R and Springer A (2008)
ldquoSuccinic acid a new platform chemical for biobased polymers from
renewable resourcesrdquo Chem Eng Technol 31647ndash654
BioConSepT (2013) ldquoDetermination of market potential for selected
platform chemicalsrdquo [Online] httpwwwbioconsepteuwp-
contentuploadsBioConSepT_Market-potential-for-selected-platform-
chemicals_ppt1pdf
Bozell JJ and Petersen GR (2010) ldquoTechnology development for the
production of biobased products from biorefinery carbohydrates ndash the US
Department of Energyrsquos ldquoTop 10rdquorevisitedrdquo Green Chem 12539ndash554
Bradfield MFA and Nicol W (2014) ldquoContinuous succinic acid production
by Actinobacillus succinogenes in a biofilm reactor steady-state metabolic
flux variationrdquo Biochem Eng J 851ndash7
copycopy UUnniivveerrssiittyy ooff PPrreettoorriiaa
67
Brink HG and Nicol W (2014) ldquoSuccinic acid production with Actinobacillus
succinogenes Rate and yield analysis of chemostat and biofilm culturesrdquo
Microb Cell Fact 13111-122
Chen K Jiang M Wei P Yao J and Wu H (2010)rdquoSuccinic acid production
from acid hydrolysate of corn fiber by Actinobacillus succinogenesrdquo Appl
Biochem Biotechnol 160477ndash485
Cok B Tsiropoulos I Roes AL and Patel MK (2014) ldquoSuccinic acid
production derived from carbohydrates An energy and greenhouse gas
assessment of a platform chemical toward a bio-based economyrdquo Biofuels
Bioprod Bioref 816-29
Corona-Gonzaacutelez RI Bories A Gonzaacutelez Alvarez V and Pelayo-Ortiz C
(2008) ldquoKinetic study of succinic acid production by Actinobacillus
succinogenes ZT-130rdquo Process Biochem 431047ndash1053
Davis R Tao L Tan ECD Biddy MJ Beckham GT Scarlata C Jacobson J
Cafferty K Ross J Lukas J Knorr D and Schoen P(2013) ldquoProcess Design
and Economics for the Conversion of Lignocellulosic Biomass to
Hydrocarbons Dilute-Acid and Enzymatic Deconstruction of Biomass to
Sugars and Biological Conversion of Sugars to Hydrocarbonsrdquo NREL Report
No TP-5100-60223 [Online]
httpwwwnrelgovdocsfy14osti60223pdf
Gerolimatos B and Hanson RL (1978) ldquoRepression of Escherichia coli
pyridine nucleotide transhydrogenase by leucinerdquo J Bacteriol 134(2)394-
400
copycopy UUnniivveerrssiittyy ooff PPrreettoorriiaa
68
Grand-View-Research (2015) ldquoBio-Succinic Acid Market Analysis by
Application (BDO Polyester Polyols PBSPBST Plasticizers Alkyd Resins)
and Segment Forecasts to 2020ldquo [Online]
httpwwwgrandviewresearchcomindustry-analysisbio-succinic-acid-
market ISBN Code 978-1-68038-085-9
Guettler M Rumler D and Jain M (1999) ldquoActinobacillus succinogenes sp
nov a novel succinic-acid-producing strain from the bovine rumenrdquo Int J
Syst Bacteriol 49207ndash216
Gunnarsson IB Karakashev D and Angelidaki I (2014) ldquoSuccinic acid
production by fermentation of Jerusalem artichoke tuberhydrolysate with
Actinobacillus succinogenes 130Zrdquo Ind Crops-Prod 62125ndash129
ICIS (2012)rdquoChemical industry awaits for bio-succinic acid potentialrdquo
[Online]
httpwwwiciscomArticles201201309527521chemical+industry+
awaits+for+biosuccinic+acid+potentialhtml
Jiang M Chen K Liu Z Wei P Ying H and Chang H (2010) ldquoSuccinic acid
production by Actinobacillus succinogenes using spent Brewers yeast
hydrolysate as a nitrogen sourcerdquo Appl Biochem Biotechnol 160 244ndash
254
Jiang M Dai W Xi Y Wu M Kong X Ma J Min Zhang M Chen K and Wei
P (2014) ldquoSuccinic acid production from sucrose by Actinobacillus
succinogenes NJ113rdquo BioresourTechnol 153327ndash332
copycopy UUnniivveerrssiittyy ooff PPrreettoorriiaa
69
Kaneuchi C Seki M and Komagata K (1988) ldquoProduction of succinic acid
from citric acid and related acids by Lactobacillus strainsrdquo Appl Environ
Microbiol 543053ndash3056
Kasprow RP Lange AJ and Kirwan DJ (1998)ldquoCorrelation of fermentation
yield with yeast extract composition as characterized by near-infrared
spectroscopyrdquo Biotechnol Prog 14318minus325
Kwon S Lee PC Lee EG Chang YK and Chang N (2000) ldquoProduction of
lactic acid by Lactobacillus rhamnosus with Vitamin-supplemented soybean
hydrolysaterdquo Enzyme Microb Technol 26209-215
Lee PC Lee WG Kwon S Lee SY and Chang HN (2000) ldquoBatch and
continuous cultivation of Anaerobiospirillum succiniciproducens for the
production of succinic acid from wheyrdquo Appl Microbiol Biotechnol 5423ndash
27
Lee PC Lee SY Hong SH and Chang HN (2002) ldquoIsolation and
characterization of a new succinic acid-producing bacterium Mannheimia
succiniciproducens MBEL55E from bovine rumenrdquo Appl Microbiol
Biotechnol 58(5)663ndash668
Lin H Bennett GN and San KY (2005) ldquoFed-batch culture of a
metabolically engineered Escherichia coli strain designed for high-level
succinate production and yield under aerobic conditions rdquoBiotechnol
Bioeng 90775ndash779
copycopy UUnniivveerrssiittyy ooff PPrreettoorriiaa
70
Lin SKC Du C Koutinas A Wang R amp Webb C (2008) ldquoSubstrate and
product inhibition kinetics in succinic acid production by Actinobacillus
succinogenesrdquo Biochem Eng J 41(2)128ndash135
Liu YP Zheng P Sun ZH Ni Y Dong JJ and Zhu LL (2008) ldquoEconomical
succinic acid production from cane molasses by Actinobacillus
succinogenesrdquo Bioresour Technol 991736ndash1742
Maharaj K Bradfield MFA and Nicol W (2014) ldquoSuccinic acid-producing
biofilms of Actinobacillus succinogenes Reproducibility stability and
productivityrdquo Appl Microbiol Biotechnol 98(17)7379ndash7386
McKinlay JB Zeikus JG amp Vieille C (2005) ldquoInsights into Actinobacillus
succinogenes fermentative metabolism in a chemically defined growth
mediumrdquo Appl Environ Microbiol 71(11) 6651ndash6656
McKinlay JB Vieille C and Zeikus JG (2007) ldquoProspects for a bio-based
succinate industryrdquo Appl Microbiol Biotechnol 76727ndash740
McKinlay JB Laivenieks M Schindler BD McKinlay A Siddaramappa S
Challacombe JF Lowry SR Clum A Lapidus AL and Burkhart KB (2010)
ldquoA genomic perspective on the potential of Actinobacillus succinogenes for
industrial succinate productionrdquo BMC Genomics 11 (1) 680
Nghiem NP Davison BH Suttle BE and Richardson GR (1997)
ldquoProduction of succinic acid by Anaerobiospirillum succiniciproducensrdquo Appl
Biochem Biotechnol 63ndash65 565ndash576
copycopy UUnniivveerrssiittyy ooff PPrreettoorriiaa
71
Oh I Lee H Park C Lee SY and Lee J (2008) ldquoSuccinic acid production by
continuous fermentation process using Mannheimia succiniciproducens
LPK7rdquo J Microbiol Biotechnol 18908ndash912
Organotechniereg SAS (2008) ldquoTechnical Data Sheet Yeast Extract 19512rdquo
[Online] httpwwworganotechniecomdoc_en19512pdf [accessed 22
November 2015]
Rosche B Li XZ Hauer B Schmid A and Buehler K (2009) ldquoMicrobial
biofilms A concept for industrial catalysisrdquo Trends Biotechnol 27636ndash43
DOI 101016jtibtech200908001
Ruumlhl M Le Coq D Aymerich S and Sauer U (2012) ldquo13C-flux analysis
reveals NADPH balancing transhydrogenation cycles in stationary phase of
nitrogen-starving Bacillus subtilisrdquo JBiolChem 287(33) 27959ndash27970
Shen N Qin Y Wang Q Liao S Zhu J Zhu Q Mi H Adhikari B Wei Y and
Huang R (2015) ldquoProduction of succinic acid from sugarcane molasses
supplemented with a mixture of corn steep liquor powder and peanut meal
as nitrogen sources by Actinobacillus succinogenesrdquo Appl Microbiol 60544-
551
Shuler M and Kargi F (2002) ldquoBioprocess Engineering Basic Conceptsrdquo 2nd
ed Prentice Hall New York
Song H and Lee SY (2006) ldquoProduction of succinic acid by bacterial
fermentationrdquo Enzyme MicrobTechnol 39-(3)352ndash361
copycopy UUnniivveerrssiittyy ooff PPrreettoorriiaa
72
Spector MP (2009) ldquoMetabolism central (intermediary)rdquo in M Schaechter
(Ed) Encyclopedia of Microbiology 3rd ed Academic Press Oxford 242ndash
264
Sridee W Laopaiboon L Jaisil P and Laopaiboon P (2011) ldquoThe use of
dried spent yeast as a low-cost nitrogen supplement in ethanol
fermentation from sweet sorghum juice under very high gravity
conditionsrdquo Electron JBiotechnol14(6)1-15
Transparency-Market-Research (2014) ldquoSuccinic acid market for 14-bdo
resin coatings dyes amp inks pharmaceutical polyurethane food
plasticizers cosmetics solvents amp lubricants and de-icing solutions
applications-Global industry analysis size share growth trends and
forecast 2012ndash2018rdquo [Online]
httpwwwtransparencymarketresearchcomsuccinic-acidhtml
Urbance SE Pometto AL DiSpirito A and Demirci A (2003) ldquoMedium
evaluation and plastic composite support ingredient selection for biofilm
formation and succinic acid production by Actinobacillus succinogenesrdquo
Food Biotechnol 17(1)53ndash65
Urbance SE Pometto AL DiSpirito A and Denli Y (2004) ldquoEvaluation of
succinic acid continuous and repeat-batch biofilm fermentation by
Actinobacillus succinogenes using plastic composite support bioreactorsrdquo
ApplMicrobiolBiotechnol 65 (6)664ndash70
Van der Werf MJ Guettler MV Jain MK and Zeikus JG (1997)
ldquoEnvironmental and physiological factors affecting the succinate product
copycopy UUnniivveerrssiittyy ooff PPrreettoorriiaa
73
ratio during carbohydrate fermentation by Actinobacillus sp 130Zrdquo Arch
Microbiol 167332ndash342
Van Heerden CD and Nicol W (2013a) ldquoContinuous and batch cultures of
Escherichia coli KJ134 for succinic acid fermentation Metabolic flux
distributions and production characteristicsrdquo Microb Cell Fact 12-(1) 80-
90
Van Heerden CD and Nicol W (2013b) ldquoContinuous succinic acid
fermentation by Actinobacillus succinogenesrdquo Biochem EngJ 735ndash11
Villadsen J Nielsen J amp Lideacuten G (2011) ldquoBioreaction Engineering
Principlesrdquo 3rd ed Springer US Boston MA
Werpy T and Petersen G (2004) ldquoTop value added chemicals from
biomass Vol 1 Results of screening for potential candidates from sugars
and synthesis gasrdquo National Renewable Energy Lab Golden CO US
Xi Y Chen K Xu R Zhang J Bai X Jiang M Wei P and Chen J (2012)
ldquoEffect of biotin and a similar compound on succinic acid fermentation by
Actinobacillus succinogenes in a chemically defined mediumrdquo Biochem Eng
J 6987ndash92
Xi Y Chen K Dai W Ma J Zhang M Jiang M Wei P and Ouyang PK
(2013) ldquoSuccinic acid production by Actinobacillus succinogenes NJ113
using corn steep liquor powder as nitrogen sourcerdquo Bioresour Technol
136 775ndash779
copycopy UUnniivveerrssiittyy ooff PPrreettoorriiaa
74
Xiao X Hou Y Liu Y Liu Y Zhao H Dong L Du J Wang Y Bai G and Luo
G (2013) ldquoClassification and analysis of corn steep liquor by UPLCQ-TOF
MS and HPLCrdquo Talanta 107344ndash348
Xu J and Guo B (2010) ldquoMicrobial succinic acid its polymer poly(butylene
succinate) and applicationsrdquo Plastics from Bacteria Natural Functions and
Applications Microbiology Monographs Vol 14 Springer Verlag
BerlinHeidelberg DOI 101007978-3-642-03287514
Yan Q Zheng P Dong JJ and Sun ZH (2013) ldquoA fibrous bed bioreactor to
improve the productivity of succinic acid by Actinobacillus succinogenesrdquo
JChemTechnolBiotechnol 89(11)1760-1766DOI101002jctb4257
Yan Q Zheng P Tao S and Donga J (2014) ldquoFermentation process for
continuous production of succinic acid in a fibrous bed bioreactorrdquo
Biochem Eng J 9192-98
Zeikus JG Jain MK and Elankovan P (1999) ldquoBiotechnology of succinic acid
production and markets for derived industrial productsrdquo Appl Microbiol
Biotechnol 51545ndash552
Zheng P Dong J Sun Z Ni Y and Fang L (2009) ldquoFermentative production
of succinic acid from straw hydrolysate by Actinobacillus succinogenesrdquo
Bioresour Technol 100 2425ndash2429
copycopy UUnniivveerrssiittyy ooff PPrreettoorriiaa

3
fermentation (Xi et al 2013 Jiang et al 2010 Shen et al 2015 Yan et al
2013) Nevertheless none of these studies distinguished between the
nitrogen requirements for growth-related and non-growth-related SA
production It is well known that the specific growth rate of A succinogenes
is severely inhibited by the accumulation of organic acids in the
fermentation broth (Corona-Gonzaacutelez et al 2008) and that the specific
growth rate approaches zero above an SA titre in the vicinity of 10-15 gmiddotL-1
(Brink amp Nicol 2014) Most batch fermentations reach a final SA
concentration well in excess of this critical SA concentration thus
indicating that a significant fraction of the SA in these studies is produced
under non-growth or maintenance conditions and that the nutrient
requirements for the non-growth production phase might be different to
those of the growth phase in all likelihood less severe
In order to study the non-growth nutrient requirements of A succinogenes
steady state would be ideal this can be achieved through a continuous
mode of operation Maharaj Bradfield and Nicol (2014) have clearly
demonstrated that prolonged steady state operation of A succinogenes
under non-growth conditions is feasible and stable The concentrations of
organic acids in the fermentation broth can be manipulated by altering the
throughput (or dilution rate) in order to induce non-growth production of
SA Another beneficial factor with continuous operations is biofilms which
are unavoidably formed in long-term continuous fermentations and can
significantly enhance productivity as observed by Van Heerden and Nicol
(2013b)
This study aims to evaluate the complex nitrogen requirements of non-
growing A succinogenes biofilms Nitrogen sources used in this study will
copycopy UUnniivveerrssiittyy ooff PPrreettoorriiaa
4
be restricted to YE and CSL since they are the most common sources of
nitrogen sources used in the literature and because of the potential
economic advantage of using CSL Initial biomass accumulation will be
achieved by using only YE for rapid growth of the micro-organism Once
non-growth production of SA commences the YE content will be reduced
and the CSL content will be increased The total complex nitrogen source
concentration in the feed will be maintained at a constant value of 16 gmiddotL-1
throughout the experiments however the percentage of YE in the total
complex nitrogen source will decrease over time Throughout the study the
change in nitrogen source will be referred to as YE in the nitrogen
source At a fixed dilution rate (at a chosen initial SA concentration) for the
whole run productivity and product distribution as a function of YE in
the nitrogen source will be assessed
copycopy UUnniivveerrssiittyy ooff PPrreettoorriiaa
5
2 Literature survey
21 Bio-based chemicals
Bio-based chemicals are platform and intermediate chemicals derived from
biomass feedstocks The US Department of Energy (DOE) identified 300
potential bio-based platform chemicals but most of the proposed
chemicals did not have sufficient market potential nor was it economical to
produce them Only 30 chemicals were considered to be relevant since they
had the potential to replace non-bio-based chemicals and out of those 30
chemicals only 12 building block chemicals were identified as being the
most important because of their potential market chemical derivatives and
synthesis pathways (Werpy amp Peterson 2004)
The importance for bio-based production of fuels and chemicals arises
from the need to move away from petroleum-based production The
depletion of non-renewable feedstocks and the strong demand by
consumers for environmentally friendly energy sources has made the
production of fuels and chemicals from biomass feedstocks to be a
sustainable alternative to the petrochemical production route Government
and industry are now interested in bio-based resources and production and
they understand that to form a sustainable global economy a bio-based
industry should substitute the current petroleum-based routes to produces
fuels and chemicals (Cok et al 2014) However to have a bio-based
economy for the development of highly efficient and cost effective bio-
refineries is essential Petrochemical production has been optimised and
refined over long period of time making it a cheaper option compared with
the relatively new bio-based production Therefore to enhance the
development of a bio-based economy it is essential that the biological
copycopy UUnniivveerrssiittyy ooff PPrreettoorriiaa
6
processes are understood refined and optimised through continuous
research and development (Cok et al 2014)
22 Succinic acid
221 Application of succinic acid
One of the top 12 bio-based platform chemicals recognized by the US DOE
was succinic acid (SA) (Werpy amp Peterson 2004 Bozell amp Peterson 2010)
See Figure 21 for the molecular structure of SA Most of the SA produced to
meet global demand is manufactured through the petroleum route ie it is
produced by the partial oxidation of butane followed by hydrogenation of
the intermediate product which is maleic anhydride However the
expensive conversion costs and non-renewability of this petroleum-based
route for producing SA has limited the SA market to low-cost bulk
application (Xu amp Guo 2010 Beauprez et al 2010)
Figure 21 Succinic acid molecule
Traditionally the application of SA has been limited mainly to four
functional regions its largest area of application is as a surfactant an
additive to a detergent and a foaming agent the second is as an ion chelator
copycopy UUnniivveerrssiittyy ooff PPrreettoorriiaa
7
for preventing corrosion and spot corrosion of metals in the electroplating
industry the third is as an acidulant which is a pH regulator and flavouring
agent in the food industry and the fourth area of application region is in
the pharmaceutical industry specifically in the production of antibiotics
amino acids and vitamins (Xu amp Guo 2010) As a platform chemical it is
also used as a precursor of many commodity or specialty chemicals as seen
in Figure 22 (Zeikus et al 1999)
Figure 22Various chemicals and products derived from succinic acid
(Zeikus et al 1999)
Nevertheless there is potential for the bulk application of SA The key to
the growth of the SA market lies in its derivatives The diamines and diols
that are derived from SA can be used as monomer units of a variety of
Figure 22 Various chemicals and products derived from succinic acid
(Zeikus et al 1999)
copycopy UUnniivveerrssiittyy ooff PPrreettoorriiaa
8
plastics such as polyesters polyamides and polyester amides (Bechthold et
al2008) Among them is the SA derivative 14-butanediol (BDO) It is a
platform chemical for tetrahydrofuran (THF) gamma-butyrolactone (GBL)
and polymers such as polybutylene terephthalate (PBT) and polyurethane
(PU) These chemicals are widely used in the production of engineering
thermoplastics and elastic fibres and because of these applications the
BDO market is expected to increase as the demand for THF and spandex for
sports apparel increase (Grand- View- Research 2014) Another derivative
of SA that is predicted to increase the SA global market is the biodegradable
polybutylene succinate (PBS) and its copolymers PBS polymers have a
range of applications as supermarket bags packaging film mulch film and
other disposable articles Owing to the steady growth of the market for
biodegradable plastic the demand for PBS is expected to increase rapidly
which in turn could grow the SA market (ICIS 2012)
222 Succinic acid market
The global SA market in 2011 was estimated to be worth US$240 million
and it is projected to reach US$836 million by 2018 (Transparency-Market-
Research 2014) due to the development of the bio-SA Consumption of
petroleum-based SA in manufacturing various other chemicals is restricted
due to unpredictability of price and carbon footprints These concerns
however are advancing the progression of biological manufacturing of SA
The major drivers for this growth will be the high cost of crude oil the rise
in carbon footprints and an interest in producing ldquogreenrdquo chemicals Newer
applications of SA as PBS BDO plasticizers and polyesters polyols will fast-
track the future growth of the bio-SA market However the higher price of
bio-SA and the lengthy extraction processes are the primary factors that
copycopy UUnniivveerrssiittyy ooff PPrreettoorriiaa
9
will restrain the market growth for the next few years although the market
is expected to grow at a significant rate over the next seven years (Allied
Market Research 2014)
At present there are numerous institutions researching the development of
SA through bio-based raw materials and there are companies that are
already manufacturing bio-SA for commercial purposes The list of major
companies involved in the production of bio-SA includes BioAmber
Myraint DSM Mitsui amp Co Mitsubishi BASF Roquette Freacuterese SA Purac
and Reverdia In 2013 the global bio-SA market volume was approximately
51 100 tons and in seven years it is expected to reach a market volume of
710 000 tons In that same year BDO is predicted to emerge as the largest
application segment for bio-SA as it will replace maleic anhydride in the
production of BDO every 1MT of maleic anhydride will be replaced by
12MT of bio-SA (Allied Market Research 2014)
223 Bio-based SA production
Bio-SA which has the same structure as petroleum-based SA is produced
by the fermentation of a carbohydrate using a natural producer or an
engineered organism The feedstock used for the production of bio-based
succinic acid can be wheat maize glucose lignocellulosic-derived sugar or
sorghum grain processed to starch (BioConSepT 2013)
Compared with the petroleum-based process the fermentation process has
the advantages of mild operating conditions independence of the fossil
feedstock and fixation of CO2 and with development of genetic engineering
metabolic modification of microbial strains and improvement of
copycopy UUnniivveerrssiittyy ooff PPrreettoorriiaa
10
purification technology the fermentative production of SA from renewable
resources can be more cost-effective than the fossil-based processes (Xu amp
Guo 2010)
To date various microorganisms have been reported to produce SA such
as typical gastrointestinal bacteria and rumen bacteria and some
lactobacillus strains (Kaneuchi Seki amp Komagata 1988 Beauprez et al
2010) Among them Actinobacillus succinogenes (Guettler Rumler amp Jain
1999) Anaerobiospirillum succiniciproducens (Oh et al 2008) Mannheimia
succiniciproducens (Lee et al 2000) and genetically modified Escherichia
coli (Lin Bennet amp San 2005) are the most promising strains for producing
SA at high yields Fungi species such as Aspergillus niger Aspergillus
fumigatus Byssochlamys nivea Lentinus degener Paecilomyces varioti
Penicillium viniferum and yeast Saccharomyces cerevisia also produce
succinic acid but not in high concentrations or yields (Song amp Lee 2006)
Nevertheless for industrial applications A succinogenes stands out because
it is by far the most studied wild strain (Brink amp Nicol 2014) and its ability
to produce high concentrations of SA naturally from a broad range of
carbon sources (Guettler et al 1999 McKinlay Vieille amp Zeikus 2007)
further makes it ideal for commercial applications
23 Actinobacillus succinogenes
231 Description of microorganism
A succinogenes a Gram-negative rod-shaped and non-motile bacterium
isolated from bovine rumen (Guettler et al 1999) is considered to be one
copycopy UUnniivveerrssiittyy ooff PPrreettoorriiaa
11
of the top natural SA producing microorganisms (McKinlay et al 2007
Brink amp Nicol 2014) It produces SA as part of a mixed acid fermentation in
which acetic acid (AA) formic acid (FA) and ethanol are the by-products It
is capable of digesting a wide range of carbon sources such as glucose
fructose mannitol arabitol sorbitol sucrose xylose and arabinose under
anaerobic conditions (Van der Werf et a 1997) but most laboratory
experiments use glucose fructose xylose and sucrose as carbon substrates
A succinogenes grows optimally at moderate temperatures (37 degC to 39 degC)
and it is facultative anaerobic ie it can survive in the presence or absence
of oxygen Furthermore it is capnophilic because its growth is enhanced at
increased CO2 concentrations (Guettler et al 1999) and it is a
chemoheterotroph that grows optimally at pH ranging from 6 to 74
232 Metabolic pathway
As stated earlier A succinogenes is a promising candidate for industrial SA
production However in addition to producing SA it also produces formic
acid (FA) acetic acid (AA) and sometimes ethanol The summarised version
of the metabolic pathway for A succinogenes is shown in Figure 23
A succinogenes ferments glucose to phosphoenolpyruvate (PEP) by
glycolysis PEP is thought to serve as the point of divergence between the
FA AA and ethanol producing pathway (C3 pathway) and the SA producing
(C4) pathway The path from glucose to PEP is neutral overall in terms of
adenosine triphosphate (ATP) production but one-third of nicotinamide
adenine dinucleotide (NADH) is produced per cmol of glucose consumed
copycopy UUnniivveerrssiittyy ooff PPrreettoorriiaa
12
C4 metabolic pathway (reverse tricarboxylic pathway)
Overall this pathway leads to the formation of SA and two molecules of
NADH and one molecule of CO2 must be consumed to form one molecule of
SA Ideally one would prefer the carbon flux to follow this route to attain
homosuccinate production
The key enzyme in this pathway is PEP carboxykinase because it pushes
the carbon flux from PEP to oxaloacetate which later on becomes SA This
enzyme is regulated by CO2 levels ie the level of CO2 available to A
succinogenes will have an influence on the SA production of the organism
(Van der Werf et al 1997) Hence it will be imperative to achieve correct
extracellular and intracellular CO2 levels during SA production
C3 metabolic pathway
However the C3 pathway cannot be avoided due to the redox requirement
of the cell In this pathway PEP is converted to pyruvate by pyruvate
kinase generating one molecule of ATP during the process Pyruvate is
then converted to acetyl-CoA by either pyruvate dehydrogenase (PDH)
andor pyruvate-formatelyase (PFL)
Pyruvate conversion with PDH results in one molecule of CO2 and one
molecule of NADH being formed alongside one molecule of AA With PFL
FA is produced instead of CO2 and NADH but FA can be further broken
down to CO2 and NADH by the enzyme formate dehydrogenase (FDH)
copycopy UUnniivveerrssiittyy ooff PPrreettoorriiaa
13
The FDH activity (encoded by the fdhF gene in A succinogenes) is known to
occur only under the following conditions (Spector 2009)
Absence of an electron acceptor such as oxygen or nitrate
Acidic pH conditions
Presence of FA
PFL expression is stated to be dependent upon two glycolysis enzyme
activities namely phosphoglucoisomerase and phosphofructokinase
Interestingly the expression of PFL and FDH enzymes is reported to
increase under carbon energy source starvation (Spector 2009)
Acetyl-CoA is the branch point at which both ethanol and AA are later
formed In this process a molecule of ATP is produced per molecule of AA
formed For one molecule of ethanol formed two molecules of NADH are
absorbed However ethanol formation can be reduced if there is
intracellular availability of CO2 to the organism (Van der Werf et al 1997)
copycopy UUnniivveerrssiittyy ooff PPrreettoorriiaa
14
Figure 23 Simplified metabolic network of A succinogenes (based on
McKinlay et al (2007)
copycopy UUnniivveerrssiittyy ooff PPrreettoorriiaa
15
Pentose phosphate pathway (PPP)
Figure 23 gives a simplified version of the metabolic pathway of A
succinogenes However several studies have noted that the pentose
phosphate pathway is an additional pathway for the A succinogenes (Brink
amp Nicol 2014 Bradfield amp Nicol 2014 Van der Werf et al 1997 McKinlay
et al 2007 McKinlay et al 2005) McKinlay (2007) stated that the PPP
only contributed 20 to the NADPH required for the organismrsquos growth
But Bradfield amp Nicol (2014) and Brink amp Nicol (2014) postulated that the
contribution of the PPP could increase and be more than predicted when
the organism enters the maintenance phase or non-growth phase
According to Ruumlhl et al (2012) a resting non-growing Bacillus subtilis cell
showed constant metabolic activity without cell growth which lead to an
apparent overproduction of nicotinamide adenine dinucleotide phosphate
(NADPH) (via the PPP) which is then converted by transhydrogenase into
NADH Bradfield amp Nicol (2014) claim that it is possible that this can also
occur with A succinogenes as it does possess the transhydrogenase The
analysis by Bradfield amp Nicol (2014) indicated an under-prediction of the
YAASA for the growth metabolism (associated with NADH ldquolossesrdquo) while an
over-prediction of the YAASA is achieved for the maintenance metabolism
(associated with NADH ldquogainrdquo) This could imply that different metabolic
pathways are employed under growth and maintenance conditions
Medium contributions were previously considered as the source for the
NADH disparities during the maintenance phase but this reasoning can be
ruled out given the results of the study done by Brink amp Nicol (2014) in
which the same medium resulted in opposite redox balance trends with
regard to the growth and non-growth phases
copycopy UUnniivveerrssiittyy ooff PPrreettoorriiaa
16
24 SA yield considerations
The theoretical maximum yield of SA on a carbon substrate through
fermentation can be determined by considering the net metabolic pathway
involved and a redox balance as illustrated by Villadsen Nielsen amp Lideacuten
(2011 159-163) The overall black box stoichiometry in converting glucose
to SA with no biomass and no by-product formation is
C6H12O6 + 120788
120789CO2rarr
120783120784
120789C4H6O4 +
120788
120789H2O (21)
From Equation 21 the theoretical maximum yield of succinic acid on
glucose (YGLSA) is 112 gmiddotg-1 However it is not possible to achieve the
maximum yield because actual SA yield will depend on the active metabolic
pathway of the organism and the associated product distribution To
determine the maximum YGLSA possible with by-product formation a redox
balance is required
Pyruvate metabolism
Assuming that there is no carbon flux to cell growth and if only the PDH
enzyme is active or FDH converting all FA the overall black box
stoichiometry in converting glucose to SA and AA with no biomass
formation is
C6H12O6 + 120784
120785CO2rarr
120786
120785C4H6O4 +
120784
120785C2H4O2 (22)
Since no FA is formed the YAAFA will be 0 gmiddotg-1 This pathway releases one
molecule of NADH for every molecule of AA produced (see Figure 24) The
copycopy UUnniivveerrssiittyy ooff PPrreettoorriiaa
17
NADH would be consumed by the C4 pathway to produce SA and then the
theoretical YGLSA would be 088 gmiddotg-1
Figure 24 Simplified metabolic network of A succinogenes (PDH
active)
On the other hand if only the PFL enzyme is active both FA and AA will be
formed (see Figure 25) The overall black box stoichiometry in converting
glucose to SA AA and FA with no biomass formation is
C6H12O6 + CO2rarrC4H6O4 +C2H4O2 + CH2O2 (23)
For every molecule of FA formed a molecule of AA will be produced so the
YAAFA will be 076 gmiddotg-1 As a result YGLSA will be 066 gmiddotg-1 If both PFL and
FDH enzymes are active then FA will be broken down to produce CO2 and
NADH which will result in YAAFA being 0 gmiddotg-1 and YGLSA being 088 gmiddotg-1
copycopy UUnniivveerrssiittyy ooff PPrreettoorriiaa
18
Figure 25 Simplified metabolic network of A succinogenes (PFL
active)
Nevertheless as mentioned by Van Heerden amp Nicol (2013a)the maximum
theoretical yield of SA can be obtained through the metabolic engineering
of A succinogenes This can be achieved by manipulating the organism to
use the oxidative part of the tricarboxylic acid (TCA) cycle under anaerobic
conditions (see Figure 26a)
copycopy UUnniivveerrssiittyy ooff PPrreettoorriiaa
19
Figure 26 (a) Simplified metabolic network of A succinogenes
(oxidative TCA cycle active) (b) Simplified metabolic network of A
succinogenes (glyoxylate bypass active)
Alternatively the glyoxylate bypass can be utilised (Figure 26b) to give the
same result For both these scenarios the mass-based SA-to-glucose ratio is
112 gmiddotg-1 which is the maximum theoretical yield of SA that can be
achieved
25 Nitrogen source for A succinogenes
The composition of the growth medium is a key factor in microbial
fermentations An important element of the fermentation medium which
will be essential for the growth of the organism is the nitrogen source
In the rumen A succinogenes is surrounded by a massive source of
nutrients which allow the organism to thrive But outside the rumen more
specifically in the laboratory or in an industrial fermentation setup
copycopy UUnniivveerrssiittyy ooff PPrreettoorriiaa
20
nutrients important for growth of the organism must be provided Since
A succinogenes is auxotrophic it requires certain amino acids and vitamins
to be provided for growth and SA production McKinlay et al (2010)
determined the essential vitamins required for the growth to be nicotinic
acid pantothenate pyridoxine and thiamine and the needed amino acids to
be cysteine glutamate and methionine Furthermore they concluded that
it is able to grow without biotin supplementation
By contrast Xi et al (2012) declared the essential vitamins to be only biotin
and nicotinic acid and the essential amino acids to be only glutamate and
methionine Nevertheless the addition of these defined components makes
the growth medium expensive for industrial use (Shuler amp Kargi 2002 52)
This collection of vitamins and amino acids is thought to be better
introduced to the organism in a complex form (eg yeast extract or corn
steep liquor) where the components and concentration of the nitrogen-
carrying compounds are unknown A complex form of nitrogen source is
less expensive than a defined form and it is said to produce higher cell
growth compared with media with a defined nitrogen source (Shuler amp
Kargi 2002 52)
Batch fermentation studies
Table 21 lists batch studies that investigated alternative nitrogen sources
for SA production and A succinogenes growth From the studies that used
only one type of nitrogen source (either YE or YE amp CSL or CSL amp vitamins)
it can be seen that studies that used only YE generally had a lower YGLSA
compared with the studies that used a combination of YE and CSL as the
nitrogen source Addition of vitamins (Yan et al 2013) to CSL produced SA
copycopy UUnniivveerrssiittyy ooff PPrreettoorriiaa
21
yields and cell growth that were better than the results produced by the YE
and CSL combination
Studies that compared different nitrogen sources within the same study
such as Jiang et al (2010) and Shen et al (2015) compared the
performance of several nitrogen sources inorganic and organic and
observed the following
Inorganic nitrogen sources such as (NH4)2SO4 or NH4Cl were the
worst performing with regard to cell growth and SA yield (Jiang et al
2010)
YE as the only nitrogen source in a growth medium produced the
highest SA yield and the highest dry cell weight (DCW) in comparison
with other nitrogen sources (Jiang et al 2010 Shen et al 2015)
CSL a by-product of corn starch production as the only nitrogen
source in a growth medium was the second best performer (Jiang et
al 2010 Shen et al 2015)
CSL medium did not achieve full carbon substrate conversion
compared with YE medium at the end of the batch fermentation
(Jiang et al 2010 Shen et al 2015)
These studies suggested that the most promising nitrogen source in terms
of A succinogenes growth and SA yield from carbon substrate was yeast
extract (YE) YE is said to have various vitamins amino acids minerals and
trace metals that are necessary to stimulate the growth of A succinogenes
and synthesize its metabolites (Kasprow Lange amp Kirwan 1998) Although
YE is considered to be the best source of nitrogen its price ranges from
US$350kg to US$67kg (Kwon et al 2000 Sridee et al 2011) while the
copycopy UUnniivveerrssiittyy ooff PPrreettoorriiaa
22
price of CSL ranges from US$007kg to US$0075kg (Davis et al 2013)
which makes YE an expensive and unfeasible nitrogen source for long-term
industrial fermentation (Jiang et al 2010 Xi et al 2013 Shen et al 2015)
and CSL an economically viable alternative to YE The feasibility of CSL
feasibility as a nitrogen source was also investigated using microorganisms
such as Mannheimia succiniciproducens (MBEL55E) and Anaerobiospirillum
succiniciproducens Those studies (Lee et al 2000 2002) came to the same
conclusion as Jiang et al (2010) and Shen et al (2015) the inexpensive CSL
can replace the expensive YE as a nitrogen source to promote cell growth
and SA production
A possible reason why CSL proved to be second best to YE is because CSL
contained the cofactor biotin which is considered to be vitally important
for the metabolism of protein lipid and carbohydrate (Xi et al 2012) The
biotin content in CSL is 1 mgmiddotkg-1 and this is said to be sufficient to make a
significant contribution to the nutritional requirement of A succinogenes or
other microorganisms (Nghiem et al 1996) However Jiang et al (2010)
and Shen et al (2015) noticed that with CSL as a nitrogen source in
contrast to YE as the nitrogen source there was a significant amount of
residual glucose that remained at the end of the batch fermentation Shen
et al (2015) suggest that CSL may lack trace elements and certain nitrogen-
containing compounds that prevent A succinogenes from meeting its
normal physiological needs Another reason could be that the batch
fermentation time was not long enough for the CSL medium to reach full
carbohydrate consumption Since no profile of the variables over time was
given for these studies it is hard to determine whether the residual glucose
found in the CSL medium was due to a lack of nutrients or productivity
reduction
copycopy UUnniivveerrssiittyy ooff PPrreettoorriiaa
23
Xi et al (2013) stated that the heme and CSL combination in the production
medium improved SA production by creating a more reductive
environment (the initial redox potential was very low when heme was
added to the medium)
copycopy UUnniivveerrssiittyy ooff PPrreettoorriiaa
24
Table 21 Batch fermentation studies of A succinogenes using different nitrogen sources namely YE and CSL
Study Model Nitrogen source (gmiddotL-1)
Carbon Source
CSo (gmiddotL-1)
CSA (gmiddotL-1)
YGLSA
(gmiddotg-1) YAASA
(gmiddotg-1) YAAFA
(gmiddotg-1)
DCW
(gmiddotg-1)
Gunnarsson
Karakashevamp
Angelidaki (2014)
130Z YE(20) Synthetic
hydrolysate
36 30 083 86 058 25
Zhen et al (2009)
CGMCC
1593
YE(15) Straw
hydrolysate
58 455 0807 7583 083 56
Corona-Gonzalez et
al (2008)
130Z YE(10) Glucose 547 338 062 52 11 37
Liu et al (2008)
CGMCC
1593
YE(10) Sugarcane
molasses
644 464 072 77 3 5
Yan et al (2013)
CCTCC
M2012
036
CSL(25) amp
vitamins
mixture
Glucose 50 39 085 - - -
copycopy UUnniivveerrssiittyy ooff PPrreettoorriiaa
25
Study Model Nitrogen source (gmiddotL-1)
Carbon Source
CSo (gmiddotL-1)
CSA (gmiddotL-1)
YGLSA
(gmiddotg-1) YAASA
(gmiddotg-1) YAAFA
(gmiddotg-1)
DCW
(gmiddotg-1)
CCTCC
M2012
036
CSL(25) amp
vitamins
mixture
Glucose 100 881 088 - - -
Jiang et al (2014)
CGMCC
1716
YE(10) amp
CSL(5)
mixture
Sucrose 100 55 069 11 09 3
Chen et al (2010)
NJ113 YE(10) amp
CSL(5)
mixture
Glucose 50 42 084 - - -
Urbance et al
(2004)
130Z YE(6) amp
CSL (10)
mixture
Glucose 40 339 087 - - -
Urbance et al
(2003)
130Z YE(6) amp
CSL(10)
mixture
Glucose
20 174 087 - - -
copycopy UUnniivveerrssiittyy ooff PPrreettoorriiaa
26
Study Model Nitrogen source (gmiddotL-1)
Carbon Source
CSo (gmiddotL-1)
CSA (gmiddotL-1)
YGLSA
(gmiddotg-1) YAASA
(gmiddotg-1) YAAFA
(gmiddotg-1)
DCW
(gmiddotg-1)
Shen et al (2015) GXAS1
37
YE(12) Sugarcane
molasses
70 546 078 75 5 38
CSL(206) Sugarcane
molasses
70 479 068 76 573 3
Xi et al (2013)
NJ113 YE(10) amp
CSL(75)
mixture
Glucose 30 171 057 372 - 37
CSL (15) Glucose 30 151 050 458 - 31
CSL (15) amp
heme (0001)
mixture
Glucose 30 217 072 493 - 33
Jiang et al (2010)
NJ113 YE(15) Glucose 70 487 070 - - 45
CSL(15) Glucose 70 96 014 - - 21
copycopy UUnniivveerrssiittyy ooff PPrreettoorriiaa
27
Continuous fermentation studies
To date all continuous fermentation studies except the study done by Yan
et al (2014) used a combination YE and CSL (based on the revised SA
medium by Urbance et al 2003) as nitrogen sources None of these studies
investigated on the effect of varying the nitrogen sources type or the
concentration on SA productivity and cell growth In Table 22 it can be
seen that with a fixed combination of YE and CSL growth medium Maharaj
et al (2014) achieved the highest SA yield on glucose mass ratio and
highest SA concentration However Yan et al (2014) reported even YGLSA
and SA concentration and they used a combination of the inexpensive CSL
and defined vitamins
26 Continuous fermentation
In an economic context the need to produce large volumes of product is the
main reason for the selection of the continuous reactor mode preferably
one in which a wild strain acts as the biocatalyst to diminish mutation
problems (Villadsen et al 2011 384) Continuous systems are
advantageous also on a monetary scale because they have lower capital and
labour costs in comparison with batch production systems and since
continuous processes are time independent constant product quality is
more attainable compared with batch or fed-batch processes (Villadsen et
al 2011 384)
A unique aspect of continuous operation is the formation of biofilm which
is inevitable during pro-longed A succinogenes fermentations (Van
Heerden amp Nicol 2013 Maharaj amp Nicol 2014 Urbance et al 2003
copycopy UUnniivveerrssiittyy ooff PPrreettoorriiaa
28
Bradfield amp Nicol 2014 Brink amp Nicol 2014) Biofilms are microbial cell
layers that are embedded in self-produced exopolysacharide (EPS) which is
prone to attaching to surfaces Reactors with biofilms can be operated for
longer periods of time and are very economical because of the self-
immobilizing nature of A succinogenes which results in high volumetric
productivities (Rosche et al 2009)
It is well-known that the growth of A succinogenes is inhibited by the total
concentration of acids in the medium (Corona-Gonzaacutelez et al 2008 Lin et
al 2008 Urbance et al 2004) and therefore at a low throughput (or D)
growth of the organism will be slow since that is when high yields and acid
concentrations are found At a high D the biofilm is established at a quicker
rate but process instability is more severe (Maharaj amp Nicol 2014) The
excessive biofilm shedding at this point does not allow the system to reach
steady state easily and maintain it At a low D the effects seen with a high D
are not observed According to Bradfield amp Nicol (2014) the concentrations
produced at a low D are linked to the maintenance phase and therefore
only a small fraction of the biomass is replicating which allows the system
to reach and maintain steady state (Maharaj amp Nicol 2014)
copycopy UUnniivveerrssiittyy ooff PPrreettoorriiaa
29
Table 22 Continuous fermentation studies of A succinogenes using different nitrogen sources namely YE and CSL
Study Organism model
Nitrogen source
Dilution CSo (gmiddotL-1)
CSA (gmiddotL-1)
YGLSA
(gmiddotg-1) YAASA
(gmiddotg-1) YAAFA
(gmiddotg-1)
DCW
(gmiddotg-1)
Maharaj et al
(2014)
130Z YE(6) amp
CSL(10)
0054
071
326
141
09
080
-
-
-
-
-
-
Yan et al
(2014)
CCTCC
M2012036
CSL(25) amp
vitamins
01-04 188-
3996
084-
092
- - -
001-01 422-
636
072-
085
- - -
Van Heerden
and Nicol
(2013b)
130Z YE(6) amp
CSL(10)
049 13 071 25 077 -
Urbance et al
(2004)
130Z
YE(6) amp
CSL(10)
085
104
076
-
-
-
copycopy UUnniivveerrssiittyy ooff PPrreettoorriiaa
30
3 Materials and Methods
31 Microorganism and growth
Microorganism
In this study Actinobacillus succinogenes 130Z (DSM No 22257 or ATCC
No 55618) was used It was obtained from the German Collection of
Microorganisms and Cell Cultures (Braunschweig Germany) The culture
was stored in a cryopreservation solution at a temperature of ndash75 degC
Inoculum preparation
Inoculum was prepared by transferring 1 ml of the preserved culture to a
vial containing 15 ml of sterilized tryptone soy broth (TSB) The vial was
sealed and stored in an incubator at 37 degC with a shaker speed of 100 rpm
for a duration of 16ndash24 h The broth was later tested for contamination and
usability by performing an analysis with high-performance liquid
chromatography (HPLC) If the broth contained lactic acid or ethanol it was
considered to be contaminated and if a considerable amount of SA was
found in the broth then the culture was deemed to be viable
32 Fermentation media
All chemicals used to make the fermentation medium were obtained from
Merck KgaA (Darmstadt Germany) unless otherwise indicated The feed
medium consisted of three parts a growth medium a phosphate buffer and
copycopy UUnniivveerrssiittyy ooff PPrreettoorriiaa
31
a glucose solution The fermentation medium is based on the composition
proposed by Urbance et al (2003)
Six different growth media were used during the fermentation runs each
medium were composed of a different type andor concentration of
nitrogen sources The first medium used only yeast extract (YE) as the
nitrogen source and the last medium used only corn steep liquor (CSL) The
first run had approximately 33 gmiddotL-1of D-glucose added to the medium and
the last run had approximately 45 gmiddotL-1 of D-glucose added to the medium
Table 31 gives details of the components and the respective concentrations
used to make the feed media CO2(g) (Afrox Johannesburg South Africa)
was fed into the recycle line at 10 vvm to serve as the inorganic carbon
source
copycopy UUnniivveerrssiittyy ooff PPrreettoorriiaa
32
Table 31 Specifications of feed mediaa used during fermentations
Medium
1
Medium
2
Medium
3
Medium
4
Medium
5
Medium
6
Glucose (gmiddotL-1)
Runs 1 amp 2 33 33 33 33 33 33
Run 3 45 45 45 45 45 45
Growth (gmiddotL-1)
YE 16 10 6 3 1 0
CSL 0 6 10 13 15 16
YE ( of YE in
N2 source)d
100 625 375 1875 625 0
NaCl 1 1 1 1 1 1
MgCl2middot6H2O 02 02 02 02 02 02
CaCl22H2O 02 02 02 02 02 02
CH₃COONa 136 136 136 136 136 136
Na2Smiddot9H2O 016 016 016 016 016 016
Antifoam Ybc 1 1 1 1 1 1
Phosphate (gmiddotL-1)
K2HPO4 16 16 16 16 16 16
KH2PO4 32 32 32 32 32 32
a Based on Urbance et al (2003)
b Antifoam from Sigma-Aldrich St Louis USA
c Concentration is in mlmiddotL-1
d YE in N2 source is the of YE in the total complex nitrogen source in the medium
The concentration of the total complex nitrogen source (a combination of CSL and
powder YE) was 16 gmiddotL-1 throughout the fermentations for all runs
copycopy UUnniivveerrssiittyy ooff PPrreettoorriiaa
33
33 Bioreactor
The bioreactor pictured in Figure 31 (a amp b) was a glass cylindrical body
set between an aluminium base and head with an external recycle line to
provide agitation The working volume of the reactor (including recycle)
was 356 mL The liquid level in the reactor was maintained by using a
peristaltic pump on the product line All pumps used in the system were
peristaltic pumps A wooden stick covered in terry cloth was inserted in the
glass cylindrical body for biofilm attachment In fermentation run1 and
run2 one stick was used and in fermentation run 3 three sticks were used
CO2 flow rates were controlled using Brooks 5850S mass flow controllers
(Brooks Instrument Hungary) and the CO2 entered the reactor via an inlet
in the recycle line which was connected to a 02 μm PTFE membrane filter
(Midisart 2000 Sartorius Goumlttingen Germany) The gas exited the system
through a filter with the same specifications as mentioned earlier
connected to the foam-trap
The pH was measured using a CPS 71D-7TB21 glass combination probe
(Endress+Hauser Gerlingen Germany) held within a stainless-steel holder
connected in-line within the recycle stream Maintaining the pH at 68
required the use of a Liquiline CM442 (Endress+Hauser Gerlingen
Germany) in which an internal relay controlled the dosing of 10 M
unsterilized NaOH in an onndashoff fashion Temperature was controlled in a
similar fashion a hotplate was used to provide the heat required to
maintain the temperature at 37 degC For better control of temperature
fluctuations the hotplate was linked to the National Instrument (NI)
module The NI module is further discussed in Section 35
copycopy UUnniivveerrssiittyy ooff PPrreettoorriiaa
34
Figure 31a) Simplified schematic of bioreactor setup
No Description
1 Gas filter
2 Foam-trap 3 Medium
reservoir 1 4 Antifoam
reservoir 5 Medium
reservoir 2 6 Inoculation
septum 7 Reactor body 8 Hot plate 9 Temperature
control 10 pH probe 11 Product
reservoir 12 NaOH reservoir 13 CO2 cylinder 14 Controller 15 Recycle pump 16 Dosing pump
17 Gas flow controller
8
7
2
3
4
5
11
12
13
17
T pH
6
C
DAQ
PC
1
9 10
14
15
16
copycopy UUnniivveerrssiittyy ooff PPrreettoorriiaa
35
Figure 31b) Bioreactor setup
copycopy UUnniivveerrssiittyy ooff PPrreettoorriiaa
36
34 Fermentation procedure
The three parts of the fermentation medium (growth medium buffer and
glucose) were prepared in separate bottles and were autoclaved at 121degC
for 60 minutes To prevent unwanted reactions amongst the medium
components the three parts of the medium were only mixed once the
bottles had cooled to room temperature (approx 24 degC) The reactor
system (excluding NaOH) was also autoclaved at the same temperature and
duration as stated above
The first fermentation medium (see Table 31) was used to start up the
fermentation It had only YE as the nitrogen source This was done to form
a substantial amount of biofilm for full glucose consumption The feed
setup was then connected to the sterile reactor system with a sterile
coupling The coupling consisted of a U-connection one half of which was
fixed to the feed setup and the other half to the reactor system Each half of
the connection had a ball valve to isolate the system from the external
environment The half connections were then coupled and placed in an oil
bath at 140 degC for 20 minutes The reactor was then filled with medium and
once the temperature and pH had stabilized to 37degC and 68 respectively
10 mL of inoculum was injected into the reactor through a silicon septum
attached to the reactor head
Fermentations were started off by operating the system at batch conditions
for 17 hours and then changing to continuous operation at a low dilution
rate This allowed for cell accumulation and prevented cell washout
Addition of antifoam into the reactor was only done when deemed
necessary The recycle flow rate was kept constant at 500 mLmiddotmin-1 in all
fermentations to maintain similar shear conditions The CO2 flow rate was
copycopy UUnniivveerrssiittyy ooff PPrreettoorriiaa
37
set at a vvm of 10 as it seemed sufficient to maintain CO2 saturation in the
reactor After a few days of operation biofilm appeared on internal surface
of the bioreactor as well as the wooden stick covered in terry cloth which
was inserted into the glass cylinder as the intended surface for biofilm
attachment
Controlled variables
Dilution rates for the fermentation runs were determined using the first
fermentation medium Once biofilm had formed in the reactor after a few
days of continuous operation the dilution rate was adjusted until 95 of
initial glucose had been consumed For R3 90 was the target for glucose
consumption The dilution rate was fixed for the entire experimental run if
the above mentioned glucose consumption stayed more or less constant for
three days or more
Media change during fermentation
Similar to the feed connection to the reactor the different medium setups
were connected to the sterile reactor system with another sterile coupling
The half connections were then coupled and the U-connection was placed
in an oil bath at 140 degC for 40 minutes
35 Online monitoring
Monitoring of the process was performed in a similar fashion to that of Van
Heerden and Nicol (2013b) in which the time-averaged NaOH dosing
copycopy UUnniivveerrssiittyy ooff PPrreettoorriiaa
38
fraction was linked to a productivity factor allowing an estimated SA
concentration to be calculated in real-time A LabVIEW (NI module)
program was used to monitor and control the reactor The program was
linked to the reactor instrumentation using a cDAQ-9184 data acquisition
device (National Instruments Hungary) with voltage and current input
modules and a current output module Temperature dosing and antifoam
flowrates were controlled with the program Temperature pH gas flow
rates and the time-averaged dosing of NaOH were recorded through the
program
36 Analytical methods
HPLC analysis
High-performance liquid chromatography (HPLC) was used to determine
the concentrations of glucose SA and other organic acids Analyses were
done using an Agilent 1260 Infinity HPLC (Agilent Technologies USA)
equipped with an RI detector and a 300 mm times 78 mm Aminex HPX-87 H
ion-exchange column (Bio-Rad Laboratories USA) The mobile phase (03
mLmiddotL-1 and 11 mLmiddotL-1H2SO4) flowrate was 06 mLmiddotmin-1 and the column
temperature was 60degC
Suspended cell analysis
Once the reactor had reached a steady state the product stream was
collected in a bottle that was kept in a small bar refrigerator The product
bottle was kept cool to prevent further growth of cells and metabolic
activity and depending on the dilution rate the duration of the collection
period varied from 12 to 72 hours The collected volume was then
copycopy UUnniivveerrssiittyy ooff PPrreettoorriiaa
39
thoroughly mixed and a 12 mL sample was collected for suspended cell
analysis This was performed by splitting the 12 mL sample into 12 x 1 mL
samples and centrifuging at 4000 rpm for 2 minutes The samples were
centrifuged three times and after each centrifugation the supernatant was
poured out and the cell precipitate washed in distilled water Following the
third centrifugation the cell precipitates were transferred to an empty
glass vial that had been measured beforehand The cell precipitates were
then dried to a constant weight in an 85 degC oven
Mass balance analysis
Overall mass balances were performed to assess the accuracy of each
sample The mass balances were performed by comparing the
stoichiometric amount of glucose required to achieve the experimental
concentrations of SA AA and FA with the experimental amount of glucose
consumed
37 Steady state check
When the time-averaged dosing profile constructed by the LabVIEW
program ceased to fluctuate by a 5 standard deviation of the average
dosing flow it was assumed that the system had reached pseudo-steady
state and the product stream was sampled To further ascertain steady
state the glucose and organic acid concentrations in product samples
frequently taken over a certain period were compared and if negligible
differences were found between the sample data the system was
confirmed to be at steady state
copycopy UUnniivveerrssiittyy ooff PPrreettoorriiaa
40
38 Summary of fermentation
Results were obtained over three continuous fermentation runs Several
other runs were attempted but did not provide any results that were
valuable due to upsets encountered in the system The three runs
mentioned in Table 32 were conducted to prove the repeatability of trends
observed in the first fermentation run
Table 32 Summary of fermentation runs performed
Five different mediums each with a glucose concentration of 33 gmiddotL-1 were
used in fermentation run 1 (R1) This gave an indication of what the
general trend would be of the product distribution The dilution rate was
adjusted until steady state was achieved with only 5 of initial glucose
concentration as residual for the first medium Therefore with the 33 gmiddotL-1
initial glucose a Df of 008 h-1 was set Fermentation run 2 (R2) was
conducted to prove the repeatability of the trend seen in R1 Fermentation
run 3 (R3) was conducted with six different media at a glucose
concentration of 45 gmiddotL-1 and 90 glucose conversion was only achieved
when the Df was lowered to 0041 h-1
Run Operating
hours (h)
Glucose
(gmiddotL-1)
Df
(h-1) Medium No
1 1 008 33 0080 1 2 3 4 5 -
2 1 104 33 0045 1 3 5 - - -
3 1 272 45 0041 1 2 3 4 5 6
copycopy UUnniivveerrssiittyy ooff PPrreettoorriiaa
41
Biofilm attachment and appearance
Approximately 72 hours after inoculation of the bioreactor biofilm started
forming on the glass wall of the reactor A substantial amount of biofilm
inside the bioreactor only formed after plusmn 330 operating hours The
structure and the amount of the biofilm varied throughout the
fermentations and it appeared that the biofilm was dependent on the
following
the surface to which it is attached
the history of the fermentation
the composition of the fermentation medium
Figure 32 (a) shows the bioreactor before inoculation and without cell
attachment After operation for more than 330 hours using only YE as the
nitrogen source a thick mass of biofilm had formed as shown in Figure
32 (b) However as the CSL concentration on the fermentation medium
increased more biofilm started to shed and eventually when only CSL was
used at the nitrogen source there was almost no biofilm attachment on the
glass surface of the bioreactor (as seen in Figure 32 (c))
Although there was not much biofilm on the glass surface there was
biofilm on the internals of the reactor (the wooden sticks covered in terry
cloth) Figure 33 (a amp b) illustrates the sticks covered in biomass at the end
of the fermentations
copycopy UUnniivveerrssiittyy ooff PPrreettoorriiaa
42
Figure 32 a) Bioreactor before inoculation b) Biofilm growth using
only YE as nitrogen source c) Bioreactor with only CSL as nitrogen source
(a) (b) (c)
copycopy UUnniivveerrssiittyy ooff PPrreettoorriiaa
43
Figure 33 a) Internal support for biofilm attachment (at the end of
fermentation run 1) b)Internal supports for biofilm attachment (at the end
of fermentation run 3)
(a) (b)
copycopy UUnniivveerrssiittyy ooff PPrreettoorriiaa
44
4 Results and Discussion
41 Experimental strategy for different runs
The objective of R1 (fermentation run 1) was to find steady state data that
could be analysed to understand the influence of YE and CSL on the growth
and productivity of A succinogenes As seen in Table 31 the media used in
the experiments differed from each other regarding the concentrations of
CSL and YE but the total complex nitrogen source concentration in the
media remained constant The intended experimental plan was to report
the steady state product concentrations as the concentration of YE in the
growth medium varied (ie as the YE concentration decreased and the CSL
concentration increased) R2 (fermentation run 2) which followed the
same procedure as R1 was conducted to prove that the data found in R1
was repeatable R3 (fermentation run 3) was an attempt to achieve high SA
concentrations following the same experimental plan as R1 except that R3
used a high initial glucose feed concentration and had additional internal
support to increase the surface area available for biofilm attachments
All fermentations began with a growth medium that contained only YE as
the nitrogen source (100 YE) and once a healthy and stable biofilm had
formed the growth media were changed according to the procedure
explained in Section 34 Fermentation procedure
Initially R1 had a high biomass content and activity (when only YE was in
the fermentation medium) and as the YE content in the growth medium
decreased the biomass activity decreased R2 was effectively a repetition
of R1 but due to the low initial biomass activity the dilution rate was
adjusted to have approx 95 glucose conversion (when the growth
copycopy UUnniivveerrssiittyy ooff PPrreettoorriiaa
45
medium had only YE as the nitrogen source) Despite the increased surface
area for biofilm attachment the biomass in R3 struggled to achieve the
same activity as R1 Initially the SA concentration was slightly higher but
eventually the results of R3 coincided with those of R2 when CSL was
introduced into the growth medium The dilution rate for R3 could have
been lowered further to reach higher product concentrations but it was
decided not to do this due to time constraints for achieving steady state
Table 41 gives the steady state results for all three runs
copycopy UUnniivveerrssiittyy ooff PPrreettoorriiaa
46
Table 41 Steady state data for the three continuous fermentation runs
Dilution
(h-1)
SA
(gmiddotL-1) AA (gmiddotL-1) FA (gmiddotL-1)
PYR
(gmiddotL-1)
Δ GLC
(gmiddotL-1)
YE ( in nitrogen
source)
Black box mass
balance ()
Average black box
mass balance ()
Average black box
mass balance ()
with DCW
Fermentation run 1
008 1731 814 608 048 3041 10000 8529
008 1685 816 619 050 3067 10000 8347
009 1671 800 612 051 3059 10000 8269 8382
008 1860 702 449 066 2916 6250 8777
008 1872 667 435 079 2917 6250 8716 8747 9581
008 1764 492 263 045 2619 3750 8343
008 1792 494 251 033 2596 3750 8473
008 1778 498 259 031 2596 3750 8441 8419
008 1691 359 183 178 2152 1875 9646
008 1696 349 168 175 2223 1875 9278
008 1669 353 170 172 2107 1875 9687 9537
008 1565 239 064 224 1855 625 9935
008 1411 192 048 290 1808 625 9459
008 1328 176 056 293 1822 625 8921 9438
copycopy UUnniivveerrssiittyy ooff PPrreettoorriiaa
47
Dilution
(h-1)
SA
(gmiddotL-1) AA (gmiddotL-1) FA (gmiddotL-1)
PYR
(gmiddotL-1)
Δ GLC
(gmiddotL-1)
YE ( in nitrogen
source)
Black box mass
balance ()
Average black box
mass balance ()
Average black box
mass balance ()
with DCW
Fermentation Run 2
004 1780 852 569 051 2954 10000 9023
004 1853 878 569 044 2972 10000 9256
004 1874 897 585 040 3004 10000 9287 9189
004 1796 564 248 042 2489 3750 9154
004 1759 582 263 035 2354 3750 9616
004 1760 570 228 038 2561 3750 8760 9177
004 1175 290 071 201 1447 625 10575
004 1106 289 074 199 1455 625 10081
004 1080 283 071 202 1390 625 10357 10338
Fermentation Run 3
004 2253 1022 493 026 3695 10000 8686
004 2257 1009 499 023 3673 10000 8711
004 2205 976 477 025 3656 10000 8522 8640 9138
004 1927 787 298 000 3043 6250 8538
004 1970 803 306 007 3221 6250 8266
004 1991 820 335 005 3242 6250 8344 8383 9213
004 1785 604 128 063 2998 3750 8583
copycopy UUnniivveerrssiittyy ooff PPrreettoorriiaa
48
Dilution
(h-1)
SA
(gmiddotL-1) AA (gmiddotL-1) FA (gmiddotL-1)
PYR
(gmiddotL-1)
Δ GLC
(gmiddotL-1)
YE ( in nitrogen
source)
Black box mass
balance ()
Average black box
mass balance ()
Average black box
mass balance ()
with DCW
004 1879 615 131 069 3092 3750 8572 8568 8974
004 1635 493 028 067 2635 1875 8718
004 1628 486 022 077 2605 1875 8644
004 1578 455 036 080 2664 1875 8431 8598 9919
004 1159 295 000 082 1489 625 9255
004 1110 286 000 098 1955 625 8545
004 1104 275 000 099 1419 625 9630
004 1044 259 000 114 1433 625 8908 9085 11240
004 817 137 000 177 1582 000 6186
004 709 086 000 237 1425 000 8691
004 725 072 000 249 1457 000 6140
004 712 080 000 273 1271 000 7161 7045 7234
copycopy UUnniivveerrssiittyy ooff PPrreettoorriiaa
49
Mass balances or redox balances were performed on all the samples and
the average closures of the steady state samples are shown in Table 41
Mass balance closure did increase as the YE content decreased In R3
DCWs were taken to see if the mass balance closure would reach 100
Including the DCWs significantly improved the mass balance but did not
close it Anything above 90 was considered a proper closure and most
figures that were below 100 may indicate unknown metabolites or non-
perfect analysis of acids and sugars
42 Productivity analysis
Figure 41 shows the average concentrations of SA AA and FA in the
product streams at steady state for all fermentation runs For a clear
comparison of the metabolite concentrations of all the fermentation runs
the results were put into a single plot despite the differences in dilution
rate and glucose feed concentration The reasons for the difference in
dilution rates were explained in Section 41
copycopy UUnniivveerrssiittyy ooff PPrreettoorriiaa
50
R1
R2
R3
SA
FA
AA
Figure 41
(See Table 31)
Figure 42 depicts how SA productivity and the glucose consumption rate
changed as the YE concentration decreased
0
2
4
6
8
10
12
14
16
18
20
22
24
0 10 20 30 40 50 60 70 80 90 100
Co
nce
ntr
atio
n(g
middotL-1
)
YE in Nitrogen Source
Figure 41 Product concentration profiles for SA AA and FA of
A succinogenes as the YE in the growth media varied
The total nitrogen source (combination of YE and CSL) concentration in the
growth medium stayed constant at 16 gmiddotL-1only the concentrations of YE (powder
form) and CSL (liquid form) varied
Commented [B1] In order for the very long captions for Figures 41 to 46 NOT to show in the automatic List of Figures Ive converted the detailed descriptions to normal text
copycopy UUnniivveerrssiittyy ooff PPrreettoorriiaa
51
R1
R2
R3
Productivity SA
Glucose
consumption rate
Figure 42SA productivity profile and glucose consumption rat
A succinogenes as the YE in the growth media varied
(See Table 31)
SA concentration decreased as the concentration of YE was reduced in the
medium When only YE was used as the nitrogen source which is an ideal
ingredient for A succinogenes growth and SA productivity the highest SA
concentration for R2 and R3 was achieved For R1 the SA concentration
was at its highest when the 625 of YE medium was used Despite the
difference in glucose concentration SA concentrations for R1 R2 and R3
0
02
04
06
08
1
12
14
16
18
2
22
24
26
28
3
0
02
04
06
08
1
12
14
16
0 10 20 30 40 50 60 70 80 90 100
Glu
cose
co
nsu
mp
tio
n r
ate
(gL
hr)
Pro
du
ctiv
ity
SA
(gmiddotL
-1middoth
r-1))
of YE in Nitrogen source
Figure 42 SA productivity profile and glucose consumption rate
profiles of A succinogenes as the YE in the growth media varied
The total nitrogen source (combination of YE and CSL) concentration in the
growth medium stayed constant at 16 gmiddotL-1 only the concentrations of YE
(powder form) and CSL(liquid form) varied
copycopy UUnniivveerrssiittyy ooff PPrreettoorriiaa
52
were similar when CSL was added to the medium R3 started with a high SA
concentration as expected but then quickly dropped and displayed the
trend observed in R1 and R2 AA and FA both decreased as the YE content
in the medium decreased for all runs The concentrations for both FA and
AA more or less matched in all runs irrespective of the dilution rate and
the glucose feed concentration When only CSL was used as the nitrogen
source in the growth medium in R3 no FA was produced
The SA productivity trend shown in Figure 42 is the same as the SA
concentration profile The highest SA productivity obtained in this study
was 158 gmiddotL-1middoth-1 when a 625 YE medium was used as the nitrogen
source From Figure 42 it should be clear that the productivities of R1
were almost twice as high as the productivities of R2 The same can be said
for the glucose consumption rates for R1 and R2 This is because the
dilution rate of R1 was also twice as much as the dilution rate of R2
According to Maharaj et al (2014) a decrease in dilution should lead to an
increase in product concentrations and yields R1 and R2 do not follow that
trend Instead their product concentrations profile matched A possible
reason for the inconsistency in the trends could be that there was less
biofilm activity in R2 for an unknown reason compared with the biofilm
activity in R1 resulting in a product concentrations profile match instead of
higher product concentrations in R2 compared with the profile for R1
43 Analysis of product distribution
Metabolite concentrations were used to determine and study the product
distributions YAASA YAAFA and YGLSA of the three fermentations
copycopy UUnniivveerrssiittyy ooff PPrreettoorriiaa
53
In Section 24 the theoretical metabolic flux limitations were discussed and
it was noted that in the absence of biomass formation the maximum
theoretical values for YAASA and YGLSA should be 393gmiddotg-1 and 088 gmiddotg-1
respectively These yields would only be achieved if no FA was produced
ie if only PDH was active However if the PFL route was active and all of
the FA was converted to CO2 and NADH by FDH then the maximum
theoretical yields mentioned earlier could be still achieved If biomass is
produced then a portion of the glucose in the growth medium would be
directed to the anabolic pathway which would influence the carbon
distribution resulting in maximum yields less than those given above
It is illustrated in Figure 43 that YAASA should vary between 197 gmiddotgminus1 (for
YAAFA = 077 gmiddotgminus1) and 393 gmiddotg-1 (for YAAFA = 0 gmiddotgminus1) Using only YE as the
nitrogen source the experimental yields for all runs matched the maximum
theoretical yields that were obtained when only the PFL enzyme was
active As the nitrogen source content varied (ie CSL concentration
increased and YE concentration decreased) YAASA increased and YAAFA
decreased thus indicating a shift in the metabolic flux distribution YAASA for
R2 and R3 were similar throughout the runs so was YAAFA However when
the YE concentration in the nitrogen source was 1875 for R1 and R3
YAASA exceeded the maximum theoretical yield while YAAFA was still in the
range of 0 gmiddotg-1 to 077 gmiddotg-1 The highest YAASA achieved in this study was 83
gmiddotg-1 and the lowest YAAFA was 0 gmiddotg-1 as seen in Figure 43 these yields
were obtained in R3 when only CSL was used as the nitrogen source
Certain batch studies in A succinogenes also achieved a YAASA that exceeded
the maximum theoretical yield (see Section 26 Table 21) but those
studies used YE as the nitrogen source whereas in this study it was
copycopy UUnniivveerrssiittyy ooff PPrreettoorriiaa
54
achieved using only CSL Xi et al (2013) was the only study (batch
fermentation) mentioned in Table 21 that used only CSL as the nitrogen
source with glucose as the carbon substrate and exceeded the maximum
theoretical YAASA They attained a YAASA of 458 gmiddotg-1
copycopy UUnniivveerrssiittyy ooff PPrreettoorriiaa
55
R1
R2
R3
SAAA
FAAA
Figure 43 Experimental yields plotted with the maximum theoretical yields
profile of A succinogenes as YE in medium changes
Considering the flux at the pyruvate node YAAFA decreased and was
approaching zero as the CSL concentration in the nitrogen source
increased as seen in Figure 43 This could be an outcome of an increase in
either PDH or FDH activity or a decrease in activity for both PDH and PFL
resulting in an increased concentration of pyruvate in the product stream
Figure 44 illustrates how the pyruvate concentration increased as the CSL
concentration in the growth medium increased
0
05
1
15
2
25
3
35
4
45
5
55
6
65
7
75
8
85
9
0 10 20 30 40 50 60 70 80 90 100
Mas
s ra
tio
(g
g-1)
YE in Nitrogen Source
SAAA max (PFL)
FAAA max (PFL)
SAAA max (PDH)
FAAA max (PDH)
Figure 43 Experimental yields plotted with the maximum theoretical
yields profile of A succinogenes as YE in medium changes
The total nitrogen source (combination of YE and CSL) concentration in the
growth medium stayed constant at 16 gmiddotL-1 only the concentrations of YE
(powder form) and CSL(liquid form) varied
copycopy UUnniivveerrssiittyy ooff PPrreettoorriiaa
56
(See Table 31)
According to the redox balance it is expected that YAASA would increase as
YAAFA decreased and in this study the same development was observed
This could be linked to the increasing CSL concentration in the nitrogen
source in this study Bradfield amp Nicol (2014) suggested that there could be
an additional reducing power that produced the yields that were achieved
Using carbon and redox balances they noticed in their study that the
experimental YAASA values exceeded the predicted values suggesting that an
increase in PDH or FDH activity was not the only contribution to the
increase in YAASA and that additional reducing power was present The same
0
02
04
06
08
1
12
14
16
18
2
22
24
26
28
3
0 10 20 30 40 50 60 70 80 90 100
Co
nce
ntr
atio
n(g
L)
YE in Nitrogen Source
PYR R1
PYR R2
PYR R3
Figure 44 Pyruvate concentration profile of A succinogenes as YE in
medium changes
The total nitrogen source (combination of YE and CSL) concentration in the
growth medium stayed constant at 16 gmiddotL-1 only the concentrations of YE
(powder form) and CSL(liquid form) varied
copycopy UUnniivveerrssiittyy ooff PPrreettoorriiaa
57
explanation can be applied to this study as seen in Figure 43 The increase
in the YAASA is influenced by the decrease in the YAAFA ratio although it is not
sufficient to reach the expected ratios (according to the redox balance)
(See Table 31)
Figure 45 illustrates the NADH consumed per NADH produced for all
fermentation runs The NADH consumed (mol NADHmiddotcmol glucose-1) was
calculated as follow
09
1
11
12
13
14
15
16
17
18
19
2
0 10 20 30 40 50 60 70 80 90 100
NA
DH
Co
nsu
med
NA
DH
Pro
du
ced
of YE in Nitrogen source
NADH R1
NADH R2
NADH R3
Figure 45 NADH ratio consumed during production of A succinogenes
as YE in medium changes
The total nitrogen source (combination of YE and CSL) concentration in the
growth medium stayed constant at 16 gmiddotL-1 only the concentrations of YE
(powder form) and CSL(liquid form) varied
copycopy UUnniivveerrssiittyy ooff PPrreettoorriiaa
58
2119862119878119860119872119872119878119860
6∆119866119871119862119872119872119866119871119862
frasl (41)
Using Figure 2 Equation 41 was generated The only pathway that
consumed NADH was the path that converted PEP to SA where 2 molecules
of NADH were consumed to produce 1 molecule of SA
The NADH (mol NADHmiddotcmol glucose-1) produced was calculated as follow
(119862119878119860
119872119872119878119860+
2119862119860119860
119872119872119860119860minus
119862119865119860
119872119872119865119860)
6∆119866119871119862
119872119872119866119871119862
frasl (42)
The path from glucose to PEP produced 2 molecules of NADH per one
glucose molecule consumed and from PYR to AA 1 molecule of NADH per
one AA molecule was produced All the inputs for these equations were the
product concentrations obtained from the experimental runs
In Figure 45 it is noted that for all the fermentation runs the ratio of NADH
consumed to NADH produced increased as the concentration of YE in the
growth medium increased Nevertheless there is a clear dissimilarity
between the three runs In R3 the NADH production was higher than the
consumption for all growth media except when only CSL was used as the
nitrogen source R2 and R3 in comparison with R1 did not display a
massive imbalance in the NADH ratio and R1 was the only run where NADH
consumed over produced ratio consistently increased significantly as the
YE content in the growth medium increased It appears that the additional
NADH generation capability of R1 was not fully present in R2 and R3 and
possibly the strains used in R2 and R3 had altered production
copycopy UUnniivveerrssiittyy ooff PPrreettoorriiaa
59
characteristics compared with the original strain Nevertheless the R1
results coincide with the observation of both Bradfield amp Nicol (2014) and
Brink amp Nicol (2014) which was that there was an ldquoexcessrdquo of NADH that
was consumed during the maintenance phasenon-growth phase resulting
in a high YAASA
copycopy UUnniivveerrssiittyy ooff PPrreettoorriiaa
60
(See Table 31)
Figure 46 illustrates the yield of SA on glucose for R1 This graph shows
how the flux from glucose to SA increases as the CSL concentration in the
growth medium increases The trend observed in Figure 46 can be linked
to the ldquoexcessrdquo NADH that favours the production of SA Xi et al (2013)
observed that using only CSL as the nitrogen source provided high
selectivity towards SA (458 gmiddotgminus1) in comparison with other by-products
On the other hand CSL with heme provided a high glucose-to-SA flux
(072 gmiddotgminus1) and a much higher YAASA (493 gmiddotgminus1) A similar observation was
04
043
046
049
052
055
058
061
064
067
07
073
076
079
082
085
088
0 10 20 30 40 50 60 70 80 90 100
Mas
s ra
tio
(g
g-1)
YE in Nitrogen Source
SAGL R1
SAGL max(PFL)SAGL max(PDH)
Figure 46 Mass ratio of succinic acid over glucose profile of
A succinogenes as YE in medium changes
The total nitrogen source (combination of YE and CSL) concentration in the
growth medium stayed constant at 16 gmiddotL-1 only the concentrations of YE
(powder form) and CSL(liquid form) varied
copycopy UUnniivveerrssiittyy ooff PPrreettoorriiaa
61
documented by Yan et al (2013) Xi et al (2012) tried to explain this
observation in their study by stating that CSL contained cofactor biotin
which promoted the high SA selectivity
It is reasonable to postulate that there is an ingredient in CSL that may
trigger or enhance the activity of an additional metabolic pathway known
as the pentose phosphate pathway (PPP) to produce high carbon flux to SA
and high SA selectivity The idea of PPP as the source of the additional
reducing power stems from the findings of Bradfield and Nicol (2014)
Their analysis has shown that if the NADPH generated in the PPP cycle is
converted to NADH in order to supply redox to the SA pathway then high
SA selectivity can be achieved A succinogenes has the transhydrogenase
that allows PPP to be active and as mentioned earlier the presence or
absence of one or more ingredients in CSL may allow this enzyme to be
active consequently activating the PPP as well
Xi et al (2012) did mention biotin as the culprit for the high SA selectivity
They investigated the influence of biotin on A succinogenes growth and SA
productivity by varying the biotin concentration in a chemically defined
medium There was no SA production and cell growth was severely
inhibited when biotin was absent from the growth medium They reported
a high SA yield in their study but their data for AA concentration YGLAA and
YAASA were inconsistent with their observed product concentrations The
following example is extracted from their results In the experiment using
8 mg L-1biotin the glucose consumed was 300 g L-1 CSA = 194 g L-1 CAA =
32 g L-1 YGLAA = 0203 g g-1 and YAASA = 61 g g-1 However the YGLAA should
have been 0107 gmiddotg-1 if CAA was reported correctly but if the value for YAASA
was used as the value of CAA then the reported YGLAA would be correct
copycopy UUnniivveerrssiittyy ooff PPrreettoorriiaa
62
Nevertheless because of the inconsistency of the data it cannot be
concluded that biotin did play a role in gaining a high SA yield
Either the presence or absence of a component in a growth medium can
influence the enzymatic activity of a pathway and this concept should be
used to postulate explanations for the results obtained in this study
A breakdown of the constituents of CSL and YE could help in identifying the
ingredients in CSL that may have triggered or enhanced the activity of the
PPP Since both CSL and YE are complex media and there is no definite
information on the ingredients it is hard to fully confirm the following
theory
Xiao et al (2013) did a study on the constituents of CSL and stated that any
grade of CSL has the following amino acids isoleucine asparagine
methionine lysine proline and aspartic acid YE was reported by an
industrial data sheet (Organotechniereg SAS France) to have a high
content of the following alanine isoleucine leucine methionine
phenylalanine tyrosine and valine Although there are common amino
acids shared between CSL and YE there is one amino acid YE has that is
absent from CSL namely leucine This could be a reason why CSL could be
related to the excess NADH
Leucine in Ecoli is said to repress the transhydrogenase activity which in
turn represses the PPP (Gerolimatos amp Hanson 1978) This could be true
for A succinogenes since it also has the transhydrogenase for PPP as
mentioned in Section 23 A succinogenes with only YE as the nitrogen
source produced yields that were expected according to the carbon and
redox balance It can be postulated that as the YE content reduce the
copycopy UUnniivveerrssiittyy ooff PPrreettoorriiaa
63
leucine content decreased and the activity of the transhydrogenase
increased causing additional NADH to be generated from the enhanced
PPP resulting in improved yields
copycopy UUnniivveerrssiittyy ooff PPrreettoorriiaa
64
5 Conclusions
The complex nitrogen requirements of non-growing A succinogenes
biofilms were evaluated The study restricted itself to the use of YE and CSL
as nitrogen sources The SA productivity yields and titre were the variables
assessed
The YE concentration was decreased while simultaneously increasing the
CSL concentration in the medium Although this led to a decrease in the
steady state productivity of the organism overall SA selectivity increased
The production of certain metabolites such as SA and pyruvate also
increased while FA and AA concentrations decreased in the increasing
absence of YE This led to an increase in the SA to AA mass ratio and to a
decrease in the FA to AA mass ratio When zero amounts of YE were in the
growth medium no FA was produced
Three fermentation runs were performed The highest SA concentration in
this study was 2257gmiddotL-1 when only YE was used as the nitrogen source in
the growth medium and the highest SA productivity obtained in this study
was 158 gmiddotL-1middoth-1 when a combination of YE(625) and CSL(375) was
used as the nitrogen sourceThe highest SA to AA mass ratio achieved was
83 gmiddotg-1 when only CSL was used as the nitrogen source The FA to AA
mass ratio was consistently less than 077 gmiddotg-1 approaching 0 gmiddotg-1 as the
CSL concentration in the nitrogen source increased
Lower FA to AA mass ratio values were not fully responsible for the
increase in the SA to AA mass ratio The surplus NADH required is provided
copycopy UUnniivveerrssiittyy ooff PPrreettoorriiaa
65
by the activation or enhancement of an alternative metabolic pathway ie
the pentose phosphate pathway
The observations made in this study bolster the idea of using a combination
of YE and CSL where YE is the minor component as the nitrogen source for
commercialisation of bio-based succinic acid production using
Asuccinogenes as the catalyst
copycopy UUnniivveerrssiittyy ooff PPrreettoorriiaa
66
6 References
Allied Market Research (2014) ldquoWorld bio succinic acid market ndash
Opportunities and forecasts 2013ndash2020rdquo [Online]
httpswwwalliedmarketresearchcombio-succinic-acid-market
Beauprez JJ De Mey M and Soetaert WK (2010) ldquoMicrobial succinic acid
production natural versus metabolic engineered producersrdquo Process
Biochem451103ndash1114
Bechthold I Bretz K Kabasci S Kopitzky R and Springer A (2008)
ldquoSuccinic acid a new platform chemical for biobased polymers from
renewable resourcesrdquo Chem Eng Technol 31647ndash654
BioConSepT (2013) ldquoDetermination of market potential for selected
platform chemicalsrdquo [Online] httpwwwbioconsepteuwp-
contentuploadsBioConSepT_Market-potential-for-selected-platform-
chemicals_ppt1pdf
Bozell JJ and Petersen GR (2010) ldquoTechnology development for the
production of biobased products from biorefinery carbohydrates ndash the US
Department of Energyrsquos ldquoTop 10rdquorevisitedrdquo Green Chem 12539ndash554
Bradfield MFA and Nicol W (2014) ldquoContinuous succinic acid production
by Actinobacillus succinogenes in a biofilm reactor steady-state metabolic
flux variationrdquo Biochem Eng J 851ndash7
copycopy UUnniivveerrssiittyy ooff PPrreettoorriiaa
67
Brink HG and Nicol W (2014) ldquoSuccinic acid production with Actinobacillus
succinogenes Rate and yield analysis of chemostat and biofilm culturesrdquo
Microb Cell Fact 13111-122
Chen K Jiang M Wei P Yao J and Wu H (2010)rdquoSuccinic acid production
from acid hydrolysate of corn fiber by Actinobacillus succinogenesrdquo Appl
Biochem Biotechnol 160477ndash485
Cok B Tsiropoulos I Roes AL and Patel MK (2014) ldquoSuccinic acid
production derived from carbohydrates An energy and greenhouse gas
assessment of a platform chemical toward a bio-based economyrdquo Biofuels
Bioprod Bioref 816-29
Corona-Gonzaacutelez RI Bories A Gonzaacutelez Alvarez V and Pelayo-Ortiz C
(2008) ldquoKinetic study of succinic acid production by Actinobacillus
succinogenes ZT-130rdquo Process Biochem 431047ndash1053
Davis R Tao L Tan ECD Biddy MJ Beckham GT Scarlata C Jacobson J
Cafferty K Ross J Lukas J Knorr D and Schoen P(2013) ldquoProcess Design
and Economics for the Conversion of Lignocellulosic Biomass to
Hydrocarbons Dilute-Acid and Enzymatic Deconstruction of Biomass to
Sugars and Biological Conversion of Sugars to Hydrocarbonsrdquo NREL Report
No TP-5100-60223 [Online]
httpwwwnrelgovdocsfy14osti60223pdf
Gerolimatos B and Hanson RL (1978) ldquoRepression of Escherichia coli
pyridine nucleotide transhydrogenase by leucinerdquo J Bacteriol 134(2)394-
400
copycopy UUnniivveerrssiittyy ooff PPrreettoorriiaa
68
Grand-View-Research (2015) ldquoBio-Succinic Acid Market Analysis by
Application (BDO Polyester Polyols PBSPBST Plasticizers Alkyd Resins)
and Segment Forecasts to 2020ldquo [Online]
httpwwwgrandviewresearchcomindustry-analysisbio-succinic-acid-
market ISBN Code 978-1-68038-085-9
Guettler M Rumler D and Jain M (1999) ldquoActinobacillus succinogenes sp
nov a novel succinic-acid-producing strain from the bovine rumenrdquo Int J
Syst Bacteriol 49207ndash216
Gunnarsson IB Karakashev D and Angelidaki I (2014) ldquoSuccinic acid
production by fermentation of Jerusalem artichoke tuberhydrolysate with
Actinobacillus succinogenes 130Zrdquo Ind Crops-Prod 62125ndash129
ICIS (2012)rdquoChemical industry awaits for bio-succinic acid potentialrdquo
[Online]
httpwwwiciscomArticles201201309527521chemical+industry+
awaits+for+biosuccinic+acid+potentialhtml
Jiang M Chen K Liu Z Wei P Ying H and Chang H (2010) ldquoSuccinic acid
production by Actinobacillus succinogenes using spent Brewers yeast
hydrolysate as a nitrogen sourcerdquo Appl Biochem Biotechnol 160 244ndash
254
Jiang M Dai W Xi Y Wu M Kong X Ma J Min Zhang M Chen K and Wei
P (2014) ldquoSuccinic acid production from sucrose by Actinobacillus
succinogenes NJ113rdquo BioresourTechnol 153327ndash332
copycopy UUnniivveerrssiittyy ooff PPrreettoorriiaa
69
Kaneuchi C Seki M and Komagata K (1988) ldquoProduction of succinic acid
from citric acid and related acids by Lactobacillus strainsrdquo Appl Environ
Microbiol 543053ndash3056
Kasprow RP Lange AJ and Kirwan DJ (1998)ldquoCorrelation of fermentation
yield with yeast extract composition as characterized by near-infrared
spectroscopyrdquo Biotechnol Prog 14318minus325
Kwon S Lee PC Lee EG Chang YK and Chang N (2000) ldquoProduction of
lactic acid by Lactobacillus rhamnosus with Vitamin-supplemented soybean
hydrolysaterdquo Enzyme Microb Technol 26209-215
Lee PC Lee WG Kwon S Lee SY and Chang HN (2000) ldquoBatch and
continuous cultivation of Anaerobiospirillum succiniciproducens for the
production of succinic acid from wheyrdquo Appl Microbiol Biotechnol 5423ndash
27
Lee PC Lee SY Hong SH and Chang HN (2002) ldquoIsolation and
characterization of a new succinic acid-producing bacterium Mannheimia
succiniciproducens MBEL55E from bovine rumenrdquo Appl Microbiol
Biotechnol 58(5)663ndash668
Lin H Bennett GN and San KY (2005) ldquoFed-batch culture of a
metabolically engineered Escherichia coli strain designed for high-level
succinate production and yield under aerobic conditions rdquoBiotechnol
Bioeng 90775ndash779
copycopy UUnniivveerrssiittyy ooff PPrreettoorriiaa
70
Lin SKC Du C Koutinas A Wang R amp Webb C (2008) ldquoSubstrate and
product inhibition kinetics in succinic acid production by Actinobacillus
succinogenesrdquo Biochem Eng J 41(2)128ndash135
Liu YP Zheng P Sun ZH Ni Y Dong JJ and Zhu LL (2008) ldquoEconomical
succinic acid production from cane molasses by Actinobacillus
succinogenesrdquo Bioresour Technol 991736ndash1742
Maharaj K Bradfield MFA and Nicol W (2014) ldquoSuccinic acid-producing
biofilms of Actinobacillus succinogenes Reproducibility stability and
productivityrdquo Appl Microbiol Biotechnol 98(17)7379ndash7386
McKinlay JB Zeikus JG amp Vieille C (2005) ldquoInsights into Actinobacillus
succinogenes fermentative metabolism in a chemically defined growth
mediumrdquo Appl Environ Microbiol 71(11) 6651ndash6656
McKinlay JB Vieille C and Zeikus JG (2007) ldquoProspects for a bio-based
succinate industryrdquo Appl Microbiol Biotechnol 76727ndash740
McKinlay JB Laivenieks M Schindler BD McKinlay A Siddaramappa S
Challacombe JF Lowry SR Clum A Lapidus AL and Burkhart KB (2010)
ldquoA genomic perspective on the potential of Actinobacillus succinogenes for
industrial succinate productionrdquo BMC Genomics 11 (1) 680
Nghiem NP Davison BH Suttle BE and Richardson GR (1997)
ldquoProduction of succinic acid by Anaerobiospirillum succiniciproducensrdquo Appl
Biochem Biotechnol 63ndash65 565ndash576
copycopy UUnniivveerrssiittyy ooff PPrreettoorriiaa
71
Oh I Lee H Park C Lee SY and Lee J (2008) ldquoSuccinic acid production by
continuous fermentation process using Mannheimia succiniciproducens
LPK7rdquo J Microbiol Biotechnol 18908ndash912
Organotechniereg SAS (2008) ldquoTechnical Data Sheet Yeast Extract 19512rdquo
[Online] httpwwworganotechniecomdoc_en19512pdf [accessed 22
November 2015]
Rosche B Li XZ Hauer B Schmid A and Buehler K (2009) ldquoMicrobial
biofilms A concept for industrial catalysisrdquo Trends Biotechnol 27636ndash43
DOI 101016jtibtech200908001
Ruumlhl M Le Coq D Aymerich S and Sauer U (2012) ldquo13C-flux analysis
reveals NADPH balancing transhydrogenation cycles in stationary phase of
nitrogen-starving Bacillus subtilisrdquo JBiolChem 287(33) 27959ndash27970
Shen N Qin Y Wang Q Liao S Zhu J Zhu Q Mi H Adhikari B Wei Y and
Huang R (2015) ldquoProduction of succinic acid from sugarcane molasses
supplemented with a mixture of corn steep liquor powder and peanut meal
as nitrogen sources by Actinobacillus succinogenesrdquo Appl Microbiol 60544-
551
Shuler M and Kargi F (2002) ldquoBioprocess Engineering Basic Conceptsrdquo 2nd
ed Prentice Hall New York
Song H and Lee SY (2006) ldquoProduction of succinic acid by bacterial
fermentationrdquo Enzyme MicrobTechnol 39-(3)352ndash361
copycopy UUnniivveerrssiittyy ooff PPrreettoorriiaa
72
Spector MP (2009) ldquoMetabolism central (intermediary)rdquo in M Schaechter
(Ed) Encyclopedia of Microbiology 3rd ed Academic Press Oxford 242ndash
264
Sridee W Laopaiboon L Jaisil P and Laopaiboon P (2011) ldquoThe use of
dried spent yeast as a low-cost nitrogen supplement in ethanol
fermentation from sweet sorghum juice under very high gravity
conditionsrdquo Electron JBiotechnol14(6)1-15
Transparency-Market-Research (2014) ldquoSuccinic acid market for 14-bdo
resin coatings dyes amp inks pharmaceutical polyurethane food
plasticizers cosmetics solvents amp lubricants and de-icing solutions
applications-Global industry analysis size share growth trends and
forecast 2012ndash2018rdquo [Online]
httpwwwtransparencymarketresearchcomsuccinic-acidhtml
Urbance SE Pometto AL DiSpirito A and Demirci A (2003) ldquoMedium
evaluation and plastic composite support ingredient selection for biofilm
formation and succinic acid production by Actinobacillus succinogenesrdquo
Food Biotechnol 17(1)53ndash65
Urbance SE Pometto AL DiSpirito A and Denli Y (2004) ldquoEvaluation of
succinic acid continuous and repeat-batch biofilm fermentation by
Actinobacillus succinogenes using plastic composite support bioreactorsrdquo
ApplMicrobiolBiotechnol 65 (6)664ndash70
Van der Werf MJ Guettler MV Jain MK and Zeikus JG (1997)
ldquoEnvironmental and physiological factors affecting the succinate product
copycopy UUnniivveerrssiittyy ooff PPrreettoorriiaa
73
ratio during carbohydrate fermentation by Actinobacillus sp 130Zrdquo Arch
Microbiol 167332ndash342
Van Heerden CD and Nicol W (2013a) ldquoContinuous and batch cultures of
Escherichia coli KJ134 for succinic acid fermentation Metabolic flux
distributions and production characteristicsrdquo Microb Cell Fact 12-(1) 80-
90
Van Heerden CD and Nicol W (2013b) ldquoContinuous succinic acid
fermentation by Actinobacillus succinogenesrdquo Biochem EngJ 735ndash11
Villadsen J Nielsen J amp Lideacuten G (2011) ldquoBioreaction Engineering
Principlesrdquo 3rd ed Springer US Boston MA
Werpy T and Petersen G (2004) ldquoTop value added chemicals from
biomass Vol 1 Results of screening for potential candidates from sugars
and synthesis gasrdquo National Renewable Energy Lab Golden CO US
Xi Y Chen K Xu R Zhang J Bai X Jiang M Wei P and Chen J (2012)
ldquoEffect of biotin and a similar compound on succinic acid fermentation by
Actinobacillus succinogenes in a chemically defined mediumrdquo Biochem Eng
J 6987ndash92
Xi Y Chen K Dai W Ma J Zhang M Jiang M Wei P and Ouyang PK
(2013) ldquoSuccinic acid production by Actinobacillus succinogenes NJ113
using corn steep liquor powder as nitrogen sourcerdquo Bioresour Technol
136 775ndash779
copycopy UUnniivveerrssiittyy ooff PPrreettoorriiaa
74
Xiao X Hou Y Liu Y Liu Y Zhao H Dong L Du J Wang Y Bai G and Luo
G (2013) ldquoClassification and analysis of corn steep liquor by UPLCQ-TOF
MS and HPLCrdquo Talanta 107344ndash348
Xu J and Guo B (2010) ldquoMicrobial succinic acid its polymer poly(butylene
succinate) and applicationsrdquo Plastics from Bacteria Natural Functions and
Applications Microbiology Monographs Vol 14 Springer Verlag
BerlinHeidelberg DOI 101007978-3-642-03287514
Yan Q Zheng P Dong JJ and Sun ZH (2013) ldquoA fibrous bed bioreactor to
improve the productivity of succinic acid by Actinobacillus succinogenesrdquo
JChemTechnolBiotechnol 89(11)1760-1766DOI101002jctb4257
Yan Q Zheng P Tao S and Donga J (2014) ldquoFermentation process for
continuous production of succinic acid in a fibrous bed bioreactorrdquo
Biochem Eng J 9192-98
Zeikus JG Jain MK and Elankovan P (1999) ldquoBiotechnology of succinic acid
production and markets for derived industrial productsrdquo Appl Microbiol
Biotechnol 51545ndash552
Zheng P Dong J Sun Z Ni Y and Fang L (2009) ldquoFermentative production
of succinic acid from straw hydrolysate by Actinobacillus succinogenesrdquo
Bioresour Technol 100 2425ndash2429
copycopy UUnniivveerrssiittyy ooff PPrreettoorriiaa

4
be restricted to YE and CSL since they are the most common sources of
nitrogen sources used in the literature and because of the potential
economic advantage of using CSL Initial biomass accumulation will be
achieved by using only YE for rapid growth of the micro-organism Once
non-growth production of SA commences the YE content will be reduced
and the CSL content will be increased The total complex nitrogen source
concentration in the feed will be maintained at a constant value of 16 gmiddotL-1
throughout the experiments however the percentage of YE in the total
complex nitrogen source will decrease over time Throughout the study the
change in nitrogen source will be referred to as YE in the nitrogen
source At a fixed dilution rate (at a chosen initial SA concentration) for the
whole run productivity and product distribution as a function of YE in
the nitrogen source will be assessed
copycopy UUnniivveerrssiittyy ooff PPrreettoorriiaa
5
2 Literature survey
21 Bio-based chemicals
Bio-based chemicals are platform and intermediate chemicals derived from
biomass feedstocks The US Department of Energy (DOE) identified 300
potential bio-based platform chemicals but most of the proposed
chemicals did not have sufficient market potential nor was it economical to
produce them Only 30 chemicals were considered to be relevant since they
had the potential to replace non-bio-based chemicals and out of those 30
chemicals only 12 building block chemicals were identified as being the
most important because of their potential market chemical derivatives and
synthesis pathways (Werpy amp Peterson 2004)
The importance for bio-based production of fuels and chemicals arises
from the need to move away from petroleum-based production The
depletion of non-renewable feedstocks and the strong demand by
consumers for environmentally friendly energy sources has made the
production of fuels and chemicals from biomass feedstocks to be a
sustainable alternative to the petrochemical production route Government
and industry are now interested in bio-based resources and production and
they understand that to form a sustainable global economy a bio-based
industry should substitute the current petroleum-based routes to produces
fuels and chemicals (Cok et al 2014) However to have a bio-based
economy for the development of highly efficient and cost effective bio-
refineries is essential Petrochemical production has been optimised and
refined over long period of time making it a cheaper option compared with
the relatively new bio-based production Therefore to enhance the
development of a bio-based economy it is essential that the biological
copycopy UUnniivveerrssiittyy ooff PPrreettoorriiaa
6
processes are understood refined and optimised through continuous
research and development (Cok et al 2014)
22 Succinic acid
221 Application of succinic acid
One of the top 12 bio-based platform chemicals recognized by the US DOE
was succinic acid (SA) (Werpy amp Peterson 2004 Bozell amp Peterson 2010)
See Figure 21 for the molecular structure of SA Most of the SA produced to
meet global demand is manufactured through the petroleum route ie it is
produced by the partial oxidation of butane followed by hydrogenation of
the intermediate product which is maleic anhydride However the
expensive conversion costs and non-renewability of this petroleum-based
route for producing SA has limited the SA market to low-cost bulk
application (Xu amp Guo 2010 Beauprez et al 2010)
Figure 21 Succinic acid molecule
Traditionally the application of SA has been limited mainly to four
functional regions its largest area of application is as a surfactant an
additive to a detergent and a foaming agent the second is as an ion chelator
copycopy UUnniivveerrssiittyy ooff PPrreettoorriiaa
7
for preventing corrosion and spot corrosion of metals in the electroplating
industry the third is as an acidulant which is a pH regulator and flavouring
agent in the food industry and the fourth area of application region is in
the pharmaceutical industry specifically in the production of antibiotics
amino acids and vitamins (Xu amp Guo 2010) As a platform chemical it is
also used as a precursor of many commodity or specialty chemicals as seen
in Figure 22 (Zeikus et al 1999)
Figure 22Various chemicals and products derived from succinic acid
(Zeikus et al 1999)
Nevertheless there is potential for the bulk application of SA The key to
the growth of the SA market lies in its derivatives The diamines and diols
that are derived from SA can be used as monomer units of a variety of
Figure 22 Various chemicals and products derived from succinic acid
(Zeikus et al 1999)
copycopy UUnniivveerrssiittyy ooff PPrreettoorriiaa
8
plastics such as polyesters polyamides and polyester amides (Bechthold et
al2008) Among them is the SA derivative 14-butanediol (BDO) It is a
platform chemical for tetrahydrofuran (THF) gamma-butyrolactone (GBL)
and polymers such as polybutylene terephthalate (PBT) and polyurethane
(PU) These chemicals are widely used in the production of engineering
thermoplastics and elastic fibres and because of these applications the
BDO market is expected to increase as the demand for THF and spandex for
sports apparel increase (Grand- View- Research 2014) Another derivative
of SA that is predicted to increase the SA global market is the biodegradable
polybutylene succinate (PBS) and its copolymers PBS polymers have a
range of applications as supermarket bags packaging film mulch film and
other disposable articles Owing to the steady growth of the market for
biodegradable plastic the demand for PBS is expected to increase rapidly
which in turn could grow the SA market (ICIS 2012)
222 Succinic acid market
The global SA market in 2011 was estimated to be worth US$240 million
and it is projected to reach US$836 million by 2018 (Transparency-Market-
Research 2014) due to the development of the bio-SA Consumption of
petroleum-based SA in manufacturing various other chemicals is restricted
due to unpredictability of price and carbon footprints These concerns
however are advancing the progression of biological manufacturing of SA
The major drivers for this growth will be the high cost of crude oil the rise
in carbon footprints and an interest in producing ldquogreenrdquo chemicals Newer
applications of SA as PBS BDO plasticizers and polyesters polyols will fast-
track the future growth of the bio-SA market However the higher price of
bio-SA and the lengthy extraction processes are the primary factors that
copycopy UUnniivveerrssiittyy ooff PPrreettoorriiaa
9
will restrain the market growth for the next few years although the market
is expected to grow at a significant rate over the next seven years (Allied
Market Research 2014)
At present there are numerous institutions researching the development of
SA through bio-based raw materials and there are companies that are
already manufacturing bio-SA for commercial purposes The list of major
companies involved in the production of bio-SA includes BioAmber
Myraint DSM Mitsui amp Co Mitsubishi BASF Roquette Freacuterese SA Purac
and Reverdia In 2013 the global bio-SA market volume was approximately
51 100 tons and in seven years it is expected to reach a market volume of
710 000 tons In that same year BDO is predicted to emerge as the largest
application segment for bio-SA as it will replace maleic anhydride in the
production of BDO every 1MT of maleic anhydride will be replaced by
12MT of bio-SA (Allied Market Research 2014)
223 Bio-based SA production
Bio-SA which has the same structure as petroleum-based SA is produced
by the fermentation of a carbohydrate using a natural producer or an
engineered organism The feedstock used for the production of bio-based
succinic acid can be wheat maize glucose lignocellulosic-derived sugar or
sorghum grain processed to starch (BioConSepT 2013)
Compared with the petroleum-based process the fermentation process has
the advantages of mild operating conditions independence of the fossil
feedstock and fixation of CO2 and with development of genetic engineering
metabolic modification of microbial strains and improvement of
copycopy UUnniivveerrssiittyy ooff PPrreettoorriiaa
10
purification technology the fermentative production of SA from renewable
resources can be more cost-effective than the fossil-based processes (Xu amp
Guo 2010)
To date various microorganisms have been reported to produce SA such
as typical gastrointestinal bacteria and rumen bacteria and some
lactobacillus strains (Kaneuchi Seki amp Komagata 1988 Beauprez et al
2010) Among them Actinobacillus succinogenes (Guettler Rumler amp Jain
1999) Anaerobiospirillum succiniciproducens (Oh et al 2008) Mannheimia
succiniciproducens (Lee et al 2000) and genetically modified Escherichia
coli (Lin Bennet amp San 2005) are the most promising strains for producing
SA at high yields Fungi species such as Aspergillus niger Aspergillus
fumigatus Byssochlamys nivea Lentinus degener Paecilomyces varioti
Penicillium viniferum and yeast Saccharomyces cerevisia also produce
succinic acid but not in high concentrations or yields (Song amp Lee 2006)
Nevertheless for industrial applications A succinogenes stands out because
it is by far the most studied wild strain (Brink amp Nicol 2014) and its ability
to produce high concentrations of SA naturally from a broad range of
carbon sources (Guettler et al 1999 McKinlay Vieille amp Zeikus 2007)
further makes it ideal for commercial applications
23 Actinobacillus succinogenes
231 Description of microorganism
A succinogenes a Gram-negative rod-shaped and non-motile bacterium
isolated from bovine rumen (Guettler et al 1999) is considered to be one
copycopy UUnniivveerrssiittyy ooff PPrreettoorriiaa
11
of the top natural SA producing microorganisms (McKinlay et al 2007
Brink amp Nicol 2014) It produces SA as part of a mixed acid fermentation in
which acetic acid (AA) formic acid (FA) and ethanol are the by-products It
is capable of digesting a wide range of carbon sources such as glucose
fructose mannitol arabitol sorbitol sucrose xylose and arabinose under
anaerobic conditions (Van der Werf et a 1997) but most laboratory
experiments use glucose fructose xylose and sucrose as carbon substrates
A succinogenes grows optimally at moderate temperatures (37 degC to 39 degC)
and it is facultative anaerobic ie it can survive in the presence or absence
of oxygen Furthermore it is capnophilic because its growth is enhanced at
increased CO2 concentrations (Guettler et al 1999) and it is a
chemoheterotroph that grows optimally at pH ranging from 6 to 74
232 Metabolic pathway
As stated earlier A succinogenes is a promising candidate for industrial SA
production However in addition to producing SA it also produces formic
acid (FA) acetic acid (AA) and sometimes ethanol The summarised version
of the metabolic pathway for A succinogenes is shown in Figure 23
A succinogenes ferments glucose to phosphoenolpyruvate (PEP) by
glycolysis PEP is thought to serve as the point of divergence between the
FA AA and ethanol producing pathway (C3 pathway) and the SA producing
(C4) pathway The path from glucose to PEP is neutral overall in terms of
adenosine triphosphate (ATP) production but one-third of nicotinamide
adenine dinucleotide (NADH) is produced per cmol of glucose consumed
copycopy UUnniivveerrssiittyy ooff PPrreettoorriiaa
12
C4 metabolic pathway (reverse tricarboxylic pathway)
Overall this pathway leads to the formation of SA and two molecules of
NADH and one molecule of CO2 must be consumed to form one molecule of
SA Ideally one would prefer the carbon flux to follow this route to attain
homosuccinate production
The key enzyme in this pathway is PEP carboxykinase because it pushes
the carbon flux from PEP to oxaloacetate which later on becomes SA This
enzyme is regulated by CO2 levels ie the level of CO2 available to A
succinogenes will have an influence on the SA production of the organism
(Van der Werf et al 1997) Hence it will be imperative to achieve correct
extracellular and intracellular CO2 levels during SA production
C3 metabolic pathway
However the C3 pathway cannot be avoided due to the redox requirement
of the cell In this pathway PEP is converted to pyruvate by pyruvate
kinase generating one molecule of ATP during the process Pyruvate is
then converted to acetyl-CoA by either pyruvate dehydrogenase (PDH)
andor pyruvate-formatelyase (PFL)
Pyruvate conversion with PDH results in one molecule of CO2 and one
molecule of NADH being formed alongside one molecule of AA With PFL
FA is produced instead of CO2 and NADH but FA can be further broken
down to CO2 and NADH by the enzyme formate dehydrogenase (FDH)
copycopy UUnniivveerrssiittyy ooff PPrreettoorriiaa
13
The FDH activity (encoded by the fdhF gene in A succinogenes) is known to
occur only under the following conditions (Spector 2009)
Absence of an electron acceptor such as oxygen or nitrate
Acidic pH conditions
Presence of FA
PFL expression is stated to be dependent upon two glycolysis enzyme
activities namely phosphoglucoisomerase and phosphofructokinase
Interestingly the expression of PFL and FDH enzymes is reported to
increase under carbon energy source starvation (Spector 2009)
Acetyl-CoA is the branch point at which both ethanol and AA are later
formed In this process a molecule of ATP is produced per molecule of AA
formed For one molecule of ethanol formed two molecules of NADH are
absorbed However ethanol formation can be reduced if there is
intracellular availability of CO2 to the organism (Van der Werf et al 1997)
copycopy UUnniivveerrssiittyy ooff PPrreettoorriiaa
14
Figure 23 Simplified metabolic network of A succinogenes (based on
McKinlay et al (2007)
copycopy UUnniivveerrssiittyy ooff PPrreettoorriiaa
15
Pentose phosphate pathway (PPP)
Figure 23 gives a simplified version of the metabolic pathway of A
succinogenes However several studies have noted that the pentose
phosphate pathway is an additional pathway for the A succinogenes (Brink
amp Nicol 2014 Bradfield amp Nicol 2014 Van der Werf et al 1997 McKinlay
et al 2007 McKinlay et al 2005) McKinlay (2007) stated that the PPP
only contributed 20 to the NADPH required for the organismrsquos growth
But Bradfield amp Nicol (2014) and Brink amp Nicol (2014) postulated that the
contribution of the PPP could increase and be more than predicted when
the organism enters the maintenance phase or non-growth phase
According to Ruumlhl et al (2012) a resting non-growing Bacillus subtilis cell
showed constant metabolic activity without cell growth which lead to an
apparent overproduction of nicotinamide adenine dinucleotide phosphate
(NADPH) (via the PPP) which is then converted by transhydrogenase into
NADH Bradfield amp Nicol (2014) claim that it is possible that this can also
occur with A succinogenes as it does possess the transhydrogenase The
analysis by Bradfield amp Nicol (2014) indicated an under-prediction of the
YAASA for the growth metabolism (associated with NADH ldquolossesrdquo) while an
over-prediction of the YAASA is achieved for the maintenance metabolism
(associated with NADH ldquogainrdquo) This could imply that different metabolic
pathways are employed under growth and maintenance conditions
Medium contributions were previously considered as the source for the
NADH disparities during the maintenance phase but this reasoning can be
ruled out given the results of the study done by Brink amp Nicol (2014) in
which the same medium resulted in opposite redox balance trends with
regard to the growth and non-growth phases
copycopy UUnniivveerrssiittyy ooff PPrreettoorriiaa
16
24 SA yield considerations
The theoretical maximum yield of SA on a carbon substrate through
fermentation can be determined by considering the net metabolic pathway
involved and a redox balance as illustrated by Villadsen Nielsen amp Lideacuten
(2011 159-163) The overall black box stoichiometry in converting glucose
to SA with no biomass and no by-product formation is
C6H12O6 + 120788
120789CO2rarr
120783120784
120789C4H6O4 +
120788
120789H2O (21)
From Equation 21 the theoretical maximum yield of succinic acid on
glucose (YGLSA) is 112 gmiddotg-1 However it is not possible to achieve the
maximum yield because actual SA yield will depend on the active metabolic
pathway of the organism and the associated product distribution To
determine the maximum YGLSA possible with by-product formation a redox
balance is required
Pyruvate metabolism
Assuming that there is no carbon flux to cell growth and if only the PDH
enzyme is active or FDH converting all FA the overall black box
stoichiometry in converting glucose to SA and AA with no biomass
formation is
C6H12O6 + 120784
120785CO2rarr
120786
120785C4H6O4 +
120784
120785C2H4O2 (22)
Since no FA is formed the YAAFA will be 0 gmiddotg-1 This pathway releases one
molecule of NADH for every molecule of AA produced (see Figure 24) The
copycopy UUnniivveerrssiittyy ooff PPrreettoorriiaa
17
NADH would be consumed by the C4 pathway to produce SA and then the
theoretical YGLSA would be 088 gmiddotg-1
Figure 24 Simplified metabolic network of A succinogenes (PDH
active)
On the other hand if only the PFL enzyme is active both FA and AA will be
formed (see Figure 25) The overall black box stoichiometry in converting
glucose to SA AA and FA with no biomass formation is
C6H12O6 + CO2rarrC4H6O4 +C2H4O2 + CH2O2 (23)
For every molecule of FA formed a molecule of AA will be produced so the
YAAFA will be 076 gmiddotg-1 As a result YGLSA will be 066 gmiddotg-1 If both PFL and
FDH enzymes are active then FA will be broken down to produce CO2 and
NADH which will result in YAAFA being 0 gmiddotg-1 and YGLSA being 088 gmiddotg-1
copycopy UUnniivveerrssiittyy ooff PPrreettoorriiaa
18
Figure 25 Simplified metabolic network of A succinogenes (PFL
active)
Nevertheless as mentioned by Van Heerden amp Nicol (2013a)the maximum
theoretical yield of SA can be obtained through the metabolic engineering
of A succinogenes This can be achieved by manipulating the organism to
use the oxidative part of the tricarboxylic acid (TCA) cycle under anaerobic
conditions (see Figure 26a)
copycopy UUnniivveerrssiittyy ooff PPrreettoorriiaa
19
Figure 26 (a) Simplified metabolic network of A succinogenes
(oxidative TCA cycle active) (b) Simplified metabolic network of A
succinogenes (glyoxylate bypass active)
Alternatively the glyoxylate bypass can be utilised (Figure 26b) to give the
same result For both these scenarios the mass-based SA-to-glucose ratio is
112 gmiddotg-1 which is the maximum theoretical yield of SA that can be
achieved
25 Nitrogen source for A succinogenes
The composition of the growth medium is a key factor in microbial
fermentations An important element of the fermentation medium which
will be essential for the growth of the organism is the nitrogen source
In the rumen A succinogenes is surrounded by a massive source of
nutrients which allow the organism to thrive But outside the rumen more
specifically in the laboratory or in an industrial fermentation setup
copycopy UUnniivveerrssiittyy ooff PPrreettoorriiaa
20
nutrients important for growth of the organism must be provided Since
A succinogenes is auxotrophic it requires certain amino acids and vitamins
to be provided for growth and SA production McKinlay et al (2010)
determined the essential vitamins required for the growth to be nicotinic
acid pantothenate pyridoxine and thiamine and the needed amino acids to
be cysteine glutamate and methionine Furthermore they concluded that
it is able to grow without biotin supplementation
By contrast Xi et al (2012) declared the essential vitamins to be only biotin
and nicotinic acid and the essential amino acids to be only glutamate and
methionine Nevertheless the addition of these defined components makes
the growth medium expensive for industrial use (Shuler amp Kargi 2002 52)
This collection of vitamins and amino acids is thought to be better
introduced to the organism in a complex form (eg yeast extract or corn
steep liquor) where the components and concentration of the nitrogen-
carrying compounds are unknown A complex form of nitrogen source is
less expensive than a defined form and it is said to produce higher cell
growth compared with media with a defined nitrogen source (Shuler amp
Kargi 2002 52)
Batch fermentation studies
Table 21 lists batch studies that investigated alternative nitrogen sources
for SA production and A succinogenes growth From the studies that used
only one type of nitrogen source (either YE or YE amp CSL or CSL amp vitamins)
it can be seen that studies that used only YE generally had a lower YGLSA
compared with the studies that used a combination of YE and CSL as the
nitrogen source Addition of vitamins (Yan et al 2013) to CSL produced SA
copycopy UUnniivveerrssiittyy ooff PPrreettoorriiaa
21
yields and cell growth that were better than the results produced by the YE
and CSL combination
Studies that compared different nitrogen sources within the same study
such as Jiang et al (2010) and Shen et al (2015) compared the
performance of several nitrogen sources inorganic and organic and
observed the following
Inorganic nitrogen sources such as (NH4)2SO4 or NH4Cl were the
worst performing with regard to cell growth and SA yield (Jiang et al
2010)
YE as the only nitrogen source in a growth medium produced the
highest SA yield and the highest dry cell weight (DCW) in comparison
with other nitrogen sources (Jiang et al 2010 Shen et al 2015)
CSL a by-product of corn starch production as the only nitrogen
source in a growth medium was the second best performer (Jiang et
al 2010 Shen et al 2015)
CSL medium did not achieve full carbon substrate conversion
compared with YE medium at the end of the batch fermentation
(Jiang et al 2010 Shen et al 2015)
These studies suggested that the most promising nitrogen source in terms
of A succinogenes growth and SA yield from carbon substrate was yeast
extract (YE) YE is said to have various vitamins amino acids minerals and
trace metals that are necessary to stimulate the growth of A succinogenes
and synthesize its metabolites (Kasprow Lange amp Kirwan 1998) Although
YE is considered to be the best source of nitrogen its price ranges from
US$350kg to US$67kg (Kwon et al 2000 Sridee et al 2011) while the
copycopy UUnniivveerrssiittyy ooff PPrreettoorriiaa
22
price of CSL ranges from US$007kg to US$0075kg (Davis et al 2013)
which makes YE an expensive and unfeasible nitrogen source for long-term
industrial fermentation (Jiang et al 2010 Xi et al 2013 Shen et al 2015)
and CSL an economically viable alternative to YE The feasibility of CSL
feasibility as a nitrogen source was also investigated using microorganisms
such as Mannheimia succiniciproducens (MBEL55E) and Anaerobiospirillum
succiniciproducens Those studies (Lee et al 2000 2002) came to the same
conclusion as Jiang et al (2010) and Shen et al (2015) the inexpensive CSL
can replace the expensive YE as a nitrogen source to promote cell growth
and SA production
A possible reason why CSL proved to be second best to YE is because CSL
contained the cofactor biotin which is considered to be vitally important
for the metabolism of protein lipid and carbohydrate (Xi et al 2012) The
biotin content in CSL is 1 mgmiddotkg-1 and this is said to be sufficient to make a
significant contribution to the nutritional requirement of A succinogenes or
other microorganisms (Nghiem et al 1996) However Jiang et al (2010)
and Shen et al (2015) noticed that with CSL as a nitrogen source in
contrast to YE as the nitrogen source there was a significant amount of
residual glucose that remained at the end of the batch fermentation Shen
et al (2015) suggest that CSL may lack trace elements and certain nitrogen-
containing compounds that prevent A succinogenes from meeting its
normal physiological needs Another reason could be that the batch
fermentation time was not long enough for the CSL medium to reach full
carbohydrate consumption Since no profile of the variables over time was
given for these studies it is hard to determine whether the residual glucose
found in the CSL medium was due to a lack of nutrients or productivity
reduction
copycopy UUnniivveerrssiittyy ooff PPrreettoorriiaa
23
Xi et al (2013) stated that the heme and CSL combination in the production
medium improved SA production by creating a more reductive
environment (the initial redox potential was very low when heme was
added to the medium)
copycopy UUnniivveerrssiittyy ooff PPrreettoorriiaa
24
Table 21 Batch fermentation studies of A succinogenes using different nitrogen sources namely YE and CSL
Study Model Nitrogen source (gmiddotL-1)
Carbon Source
CSo (gmiddotL-1)
CSA (gmiddotL-1)
YGLSA
(gmiddotg-1) YAASA
(gmiddotg-1) YAAFA
(gmiddotg-1)
DCW
(gmiddotg-1)
Gunnarsson
Karakashevamp
Angelidaki (2014)
130Z YE(20) Synthetic
hydrolysate
36 30 083 86 058 25
Zhen et al (2009)
CGMCC
1593
YE(15) Straw
hydrolysate
58 455 0807 7583 083 56
Corona-Gonzalez et
al (2008)
130Z YE(10) Glucose 547 338 062 52 11 37
Liu et al (2008)
CGMCC
1593
YE(10) Sugarcane
molasses
644 464 072 77 3 5
Yan et al (2013)
CCTCC
M2012
036
CSL(25) amp
vitamins
mixture
Glucose 50 39 085 - - -
copycopy UUnniivveerrssiittyy ooff PPrreettoorriiaa
25
Study Model Nitrogen source (gmiddotL-1)
Carbon Source
CSo (gmiddotL-1)
CSA (gmiddotL-1)
YGLSA
(gmiddotg-1) YAASA
(gmiddotg-1) YAAFA
(gmiddotg-1)
DCW
(gmiddotg-1)
CCTCC
M2012
036
CSL(25) amp
vitamins
mixture
Glucose 100 881 088 - - -
Jiang et al (2014)
CGMCC
1716
YE(10) amp
CSL(5)
mixture
Sucrose 100 55 069 11 09 3
Chen et al (2010)
NJ113 YE(10) amp
CSL(5)
mixture
Glucose 50 42 084 - - -
Urbance et al
(2004)
130Z YE(6) amp
CSL (10)
mixture
Glucose 40 339 087 - - -
Urbance et al
(2003)
130Z YE(6) amp
CSL(10)
mixture
Glucose
20 174 087 - - -
copycopy UUnniivveerrssiittyy ooff PPrreettoorriiaa
26
Study Model Nitrogen source (gmiddotL-1)
Carbon Source
CSo (gmiddotL-1)
CSA (gmiddotL-1)
YGLSA
(gmiddotg-1) YAASA
(gmiddotg-1) YAAFA
(gmiddotg-1)
DCW
(gmiddotg-1)
Shen et al (2015) GXAS1
37
YE(12) Sugarcane
molasses
70 546 078 75 5 38
CSL(206) Sugarcane
molasses
70 479 068 76 573 3
Xi et al (2013)
NJ113 YE(10) amp
CSL(75)
mixture
Glucose 30 171 057 372 - 37
CSL (15) Glucose 30 151 050 458 - 31
CSL (15) amp
heme (0001)
mixture
Glucose 30 217 072 493 - 33
Jiang et al (2010)
NJ113 YE(15) Glucose 70 487 070 - - 45
CSL(15) Glucose 70 96 014 - - 21
copycopy UUnniivveerrssiittyy ooff PPrreettoorriiaa
27
Continuous fermentation studies
To date all continuous fermentation studies except the study done by Yan
et al (2014) used a combination YE and CSL (based on the revised SA
medium by Urbance et al 2003) as nitrogen sources None of these studies
investigated on the effect of varying the nitrogen sources type or the
concentration on SA productivity and cell growth In Table 22 it can be
seen that with a fixed combination of YE and CSL growth medium Maharaj
et al (2014) achieved the highest SA yield on glucose mass ratio and
highest SA concentration However Yan et al (2014) reported even YGLSA
and SA concentration and they used a combination of the inexpensive CSL
and defined vitamins
26 Continuous fermentation
In an economic context the need to produce large volumes of product is the
main reason for the selection of the continuous reactor mode preferably
one in which a wild strain acts as the biocatalyst to diminish mutation
problems (Villadsen et al 2011 384) Continuous systems are
advantageous also on a monetary scale because they have lower capital and
labour costs in comparison with batch production systems and since
continuous processes are time independent constant product quality is
more attainable compared with batch or fed-batch processes (Villadsen et
al 2011 384)
A unique aspect of continuous operation is the formation of biofilm which
is inevitable during pro-longed A succinogenes fermentations (Van
Heerden amp Nicol 2013 Maharaj amp Nicol 2014 Urbance et al 2003
copycopy UUnniivveerrssiittyy ooff PPrreettoorriiaa
28
Bradfield amp Nicol 2014 Brink amp Nicol 2014) Biofilms are microbial cell
layers that are embedded in self-produced exopolysacharide (EPS) which is
prone to attaching to surfaces Reactors with biofilms can be operated for
longer periods of time and are very economical because of the self-
immobilizing nature of A succinogenes which results in high volumetric
productivities (Rosche et al 2009)
It is well-known that the growth of A succinogenes is inhibited by the total
concentration of acids in the medium (Corona-Gonzaacutelez et al 2008 Lin et
al 2008 Urbance et al 2004) and therefore at a low throughput (or D)
growth of the organism will be slow since that is when high yields and acid
concentrations are found At a high D the biofilm is established at a quicker
rate but process instability is more severe (Maharaj amp Nicol 2014) The
excessive biofilm shedding at this point does not allow the system to reach
steady state easily and maintain it At a low D the effects seen with a high D
are not observed According to Bradfield amp Nicol (2014) the concentrations
produced at a low D are linked to the maintenance phase and therefore
only a small fraction of the biomass is replicating which allows the system
to reach and maintain steady state (Maharaj amp Nicol 2014)
copycopy UUnniivveerrssiittyy ooff PPrreettoorriiaa
29
Table 22 Continuous fermentation studies of A succinogenes using different nitrogen sources namely YE and CSL
Study Organism model
Nitrogen source
Dilution CSo (gmiddotL-1)
CSA (gmiddotL-1)
YGLSA
(gmiddotg-1) YAASA
(gmiddotg-1) YAAFA
(gmiddotg-1)
DCW
(gmiddotg-1)
Maharaj et al
(2014)
130Z YE(6) amp
CSL(10)
0054
071
326
141
09
080
-
-
-
-
-
-
Yan et al
(2014)
CCTCC
M2012036
CSL(25) amp
vitamins
01-04 188-
3996
084-
092
- - -
001-01 422-
636
072-
085
- - -
Van Heerden
and Nicol
(2013b)
130Z YE(6) amp
CSL(10)
049 13 071 25 077 -
Urbance et al
(2004)
130Z
YE(6) amp
CSL(10)
085
104
076
-
-
-
copycopy UUnniivveerrssiittyy ooff PPrreettoorriiaa
30
3 Materials and Methods
31 Microorganism and growth
Microorganism
In this study Actinobacillus succinogenes 130Z (DSM No 22257 or ATCC
No 55618) was used It was obtained from the German Collection of
Microorganisms and Cell Cultures (Braunschweig Germany) The culture
was stored in a cryopreservation solution at a temperature of ndash75 degC
Inoculum preparation
Inoculum was prepared by transferring 1 ml of the preserved culture to a
vial containing 15 ml of sterilized tryptone soy broth (TSB) The vial was
sealed and stored in an incubator at 37 degC with a shaker speed of 100 rpm
for a duration of 16ndash24 h The broth was later tested for contamination and
usability by performing an analysis with high-performance liquid
chromatography (HPLC) If the broth contained lactic acid or ethanol it was
considered to be contaminated and if a considerable amount of SA was
found in the broth then the culture was deemed to be viable
32 Fermentation media
All chemicals used to make the fermentation medium were obtained from
Merck KgaA (Darmstadt Germany) unless otherwise indicated The feed
medium consisted of three parts a growth medium a phosphate buffer and
copycopy UUnniivveerrssiittyy ooff PPrreettoorriiaa
31
a glucose solution The fermentation medium is based on the composition
proposed by Urbance et al (2003)
Six different growth media were used during the fermentation runs each
medium were composed of a different type andor concentration of
nitrogen sources The first medium used only yeast extract (YE) as the
nitrogen source and the last medium used only corn steep liquor (CSL) The
first run had approximately 33 gmiddotL-1of D-glucose added to the medium and
the last run had approximately 45 gmiddotL-1 of D-glucose added to the medium
Table 31 gives details of the components and the respective concentrations
used to make the feed media CO2(g) (Afrox Johannesburg South Africa)
was fed into the recycle line at 10 vvm to serve as the inorganic carbon
source
copycopy UUnniivveerrssiittyy ooff PPrreettoorriiaa
32
Table 31 Specifications of feed mediaa used during fermentations
Medium
1
Medium
2
Medium
3
Medium
4
Medium
5
Medium
6
Glucose (gmiddotL-1)
Runs 1 amp 2 33 33 33 33 33 33
Run 3 45 45 45 45 45 45
Growth (gmiddotL-1)
YE 16 10 6 3 1 0
CSL 0 6 10 13 15 16
YE ( of YE in
N2 source)d
100 625 375 1875 625 0
NaCl 1 1 1 1 1 1
MgCl2middot6H2O 02 02 02 02 02 02
CaCl22H2O 02 02 02 02 02 02
CH₃COONa 136 136 136 136 136 136
Na2Smiddot9H2O 016 016 016 016 016 016
Antifoam Ybc 1 1 1 1 1 1
Phosphate (gmiddotL-1)
K2HPO4 16 16 16 16 16 16
KH2PO4 32 32 32 32 32 32
a Based on Urbance et al (2003)
b Antifoam from Sigma-Aldrich St Louis USA
c Concentration is in mlmiddotL-1
d YE in N2 source is the of YE in the total complex nitrogen source in the medium
The concentration of the total complex nitrogen source (a combination of CSL and
powder YE) was 16 gmiddotL-1 throughout the fermentations for all runs
copycopy UUnniivveerrssiittyy ooff PPrreettoorriiaa
33
33 Bioreactor
The bioreactor pictured in Figure 31 (a amp b) was a glass cylindrical body
set between an aluminium base and head with an external recycle line to
provide agitation The working volume of the reactor (including recycle)
was 356 mL The liquid level in the reactor was maintained by using a
peristaltic pump on the product line All pumps used in the system were
peristaltic pumps A wooden stick covered in terry cloth was inserted in the
glass cylindrical body for biofilm attachment In fermentation run1 and
run2 one stick was used and in fermentation run 3 three sticks were used
CO2 flow rates were controlled using Brooks 5850S mass flow controllers
(Brooks Instrument Hungary) and the CO2 entered the reactor via an inlet
in the recycle line which was connected to a 02 μm PTFE membrane filter
(Midisart 2000 Sartorius Goumlttingen Germany) The gas exited the system
through a filter with the same specifications as mentioned earlier
connected to the foam-trap
The pH was measured using a CPS 71D-7TB21 glass combination probe
(Endress+Hauser Gerlingen Germany) held within a stainless-steel holder
connected in-line within the recycle stream Maintaining the pH at 68
required the use of a Liquiline CM442 (Endress+Hauser Gerlingen
Germany) in which an internal relay controlled the dosing of 10 M
unsterilized NaOH in an onndashoff fashion Temperature was controlled in a
similar fashion a hotplate was used to provide the heat required to
maintain the temperature at 37 degC For better control of temperature
fluctuations the hotplate was linked to the National Instrument (NI)
module The NI module is further discussed in Section 35
copycopy UUnniivveerrssiittyy ooff PPrreettoorriiaa
34
Figure 31a) Simplified schematic of bioreactor setup
No Description
1 Gas filter
2 Foam-trap 3 Medium
reservoir 1 4 Antifoam
reservoir 5 Medium
reservoir 2 6 Inoculation
septum 7 Reactor body 8 Hot plate 9 Temperature
control 10 pH probe 11 Product
reservoir 12 NaOH reservoir 13 CO2 cylinder 14 Controller 15 Recycle pump 16 Dosing pump
17 Gas flow controller
8
7
2
3
4
5
11
12
13
17
T pH
6
C
DAQ
PC
1
9 10
14
15
16
copycopy UUnniivveerrssiittyy ooff PPrreettoorriiaa
35
Figure 31b) Bioreactor setup
copycopy UUnniivveerrssiittyy ooff PPrreettoorriiaa
36
34 Fermentation procedure
The three parts of the fermentation medium (growth medium buffer and
glucose) were prepared in separate bottles and were autoclaved at 121degC
for 60 minutes To prevent unwanted reactions amongst the medium
components the three parts of the medium were only mixed once the
bottles had cooled to room temperature (approx 24 degC) The reactor
system (excluding NaOH) was also autoclaved at the same temperature and
duration as stated above
The first fermentation medium (see Table 31) was used to start up the
fermentation It had only YE as the nitrogen source This was done to form
a substantial amount of biofilm for full glucose consumption The feed
setup was then connected to the sterile reactor system with a sterile
coupling The coupling consisted of a U-connection one half of which was
fixed to the feed setup and the other half to the reactor system Each half of
the connection had a ball valve to isolate the system from the external
environment The half connections were then coupled and placed in an oil
bath at 140 degC for 20 minutes The reactor was then filled with medium and
once the temperature and pH had stabilized to 37degC and 68 respectively
10 mL of inoculum was injected into the reactor through a silicon septum
attached to the reactor head
Fermentations were started off by operating the system at batch conditions
for 17 hours and then changing to continuous operation at a low dilution
rate This allowed for cell accumulation and prevented cell washout
Addition of antifoam into the reactor was only done when deemed
necessary The recycle flow rate was kept constant at 500 mLmiddotmin-1 in all
fermentations to maintain similar shear conditions The CO2 flow rate was
copycopy UUnniivveerrssiittyy ooff PPrreettoorriiaa
37
set at a vvm of 10 as it seemed sufficient to maintain CO2 saturation in the
reactor After a few days of operation biofilm appeared on internal surface
of the bioreactor as well as the wooden stick covered in terry cloth which
was inserted into the glass cylinder as the intended surface for biofilm
attachment
Controlled variables
Dilution rates for the fermentation runs were determined using the first
fermentation medium Once biofilm had formed in the reactor after a few
days of continuous operation the dilution rate was adjusted until 95 of
initial glucose had been consumed For R3 90 was the target for glucose
consumption The dilution rate was fixed for the entire experimental run if
the above mentioned glucose consumption stayed more or less constant for
three days or more
Media change during fermentation
Similar to the feed connection to the reactor the different medium setups
were connected to the sterile reactor system with another sterile coupling
The half connections were then coupled and the U-connection was placed
in an oil bath at 140 degC for 40 minutes
35 Online monitoring
Monitoring of the process was performed in a similar fashion to that of Van
Heerden and Nicol (2013b) in which the time-averaged NaOH dosing
copycopy UUnniivveerrssiittyy ooff PPrreettoorriiaa
38
fraction was linked to a productivity factor allowing an estimated SA
concentration to be calculated in real-time A LabVIEW (NI module)
program was used to monitor and control the reactor The program was
linked to the reactor instrumentation using a cDAQ-9184 data acquisition
device (National Instruments Hungary) with voltage and current input
modules and a current output module Temperature dosing and antifoam
flowrates were controlled with the program Temperature pH gas flow
rates and the time-averaged dosing of NaOH were recorded through the
program
36 Analytical methods
HPLC analysis
High-performance liquid chromatography (HPLC) was used to determine
the concentrations of glucose SA and other organic acids Analyses were
done using an Agilent 1260 Infinity HPLC (Agilent Technologies USA)
equipped with an RI detector and a 300 mm times 78 mm Aminex HPX-87 H
ion-exchange column (Bio-Rad Laboratories USA) The mobile phase (03
mLmiddotL-1 and 11 mLmiddotL-1H2SO4) flowrate was 06 mLmiddotmin-1 and the column
temperature was 60degC
Suspended cell analysis
Once the reactor had reached a steady state the product stream was
collected in a bottle that was kept in a small bar refrigerator The product
bottle was kept cool to prevent further growth of cells and metabolic
activity and depending on the dilution rate the duration of the collection
period varied from 12 to 72 hours The collected volume was then
copycopy UUnniivveerrssiittyy ooff PPrreettoorriiaa
39
thoroughly mixed and a 12 mL sample was collected for suspended cell
analysis This was performed by splitting the 12 mL sample into 12 x 1 mL
samples and centrifuging at 4000 rpm for 2 minutes The samples were
centrifuged three times and after each centrifugation the supernatant was
poured out and the cell precipitate washed in distilled water Following the
third centrifugation the cell precipitates were transferred to an empty
glass vial that had been measured beforehand The cell precipitates were
then dried to a constant weight in an 85 degC oven
Mass balance analysis
Overall mass balances were performed to assess the accuracy of each
sample The mass balances were performed by comparing the
stoichiometric amount of glucose required to achieve the experimental
concentrations of SA AA and FA with the experimental amount of glucose
consumed
37 Steady state check
When the time-averaged dosing profile constructed by the LabVIEW
program ceased to fluctuate by a 5 standard deviation of the average
dosing flow it was assumed that the system had reached pseudo-steady
state and the product stream was sampled To further ascertain steady
state the glucose and organic acid concentrations in product samples
frequently taken over a certain period were compared and if negligible
differences were found between the sample data the system was
confirmed to be at steady state
copycopy UUnniivveerrssiittyy ooff PPrreettoorriiaa
40
38 Summary of fermentation
Results were obtained over three continuous fermentation runs Several
other runs were attempted but did not provide any results that were
valuable due to upsets encountered in the system The three runs
mentioned in Table 32 were conducted to prove the repeatability of trends
observed in the first fermentation run
Table 32 Summary of fermentation runs performed
Five different mediums each with a glucose concentration of 33 gmiddotL-1 were
used in fermentation run 1 (R1) This gave an indication of what the
general trend would be of the product distribution The dilution rate was
adjusted until steady state was achieved with only 5 of initial glucose
concentration as residual for the first medium Therefore with the 33 gmiddotL-1
initial glucose a Df of 008 h-1 was set Fermentation run 2 (R2) was
conducted to prove the repeatability of the trend seen in R1 Fermentation
run 3 (R3) was conducted with six different media at a glucose
concentration of 45 gmiddotL-1 and 90 glucose conversion was only achieved
when the Df was lowered to 0041 h-1
Run Operating
hours (h)
Glucose
(gmiddotL-1)
Df
(h-1) Medium No
1 1 008 33 0080 1 2 3 4 5 -
2 1 104 33 0045 1 3 5 - - -
3 1 272 45 0041 1 2 3 4 5 6
copycopy UUnniivveerrssiittyy ooff PPrreettoorriiaa
41
Biofilm attachment and appearance
Approximately 72 hours after inoculation of the bioreactor biofilm started
forming on the glass wall of the reactor A substantial amount of biofilm
inside the bioreactor only formed after plusmn 330 operating hours The
structure and the amount of the biofilm varied throughout the
fermentations and it appeared that the biofilm was dependent on the
following
the surface to which it is attached
the history of the fermentation
the composition of the fermentation medium
Figure 32 (a) shows the bioreactor before inoculation and without cell
attachment After operation for more than 330 hours using only YE as the
nitrogen source a thick mass of biofilm had formed as shown in Figure
32 (b) However as the CSL concentration on the fermentation medium
increased more biofilm started to shed and eventually when only CSL was
used at the nitrogen source there was almost no biofilm attachment on the
glass surface of the bioreactor (as seen in Figure 32 (c))
Although there was not much biofilm on the glass surface there was
biofilm on the internals of the reactor (the wooden sticks covered in terry
cloth) Figure 33 (a amp b) illustrates the sticks covered in biomass at the end
of the fermentations
copycopy UUnniivveerrssiittyy ooff PPrreettoorriiaa
42
Figure 32 a) Bioreactor before inoculation b) Biofilm growth using
only YE as nitrogen source c) Bioreactor with only CSL as nitrogen source
(a) (b) (c)
copycopy UUnniivveerrssiittyy ooff PPrreettoorriiaa
43
Figure 33 a) Internal support for biofilm attachment (at the end of
fermentation run 1) b)Internal supports for biofilm attachment (at the end
of fermentation run 3)
(a) (b)
copycopy UUnniivveerrssiittyy ooff PPrreettoorriiaa
44
4 Results and Discussion
41 Experimental strategy for different runs
The objective of R1 (fermentation run 1) was to find steady state data that
could be analysed to understand the influence of YE and CSL on the growth
and productivity of A succinogenes As seen in Table 31 the media used in
the experiments differed from each other regarding the concentrations of
CSL and YE but the total complex nitrogen source concentration in the
media remained constant The intended experimental plan was to report
the steady state product concentrations as the concentration of YE in the
growth medium varied (ie as the YE concentration decreased and the CSL
concentration increased) R2 (fermentation run 2) which followed the
same procedure as R1 was conducted to prove that the data found in R1
was repeatable R3 (fermentation run 3) was an attempt to achieve high SA
concentrations following the same experimental plan as R1 except that R3
used a high initial glucose feed concentration and had additional internal
support to increase the surface area available for biofilm attachments
All fermentations began with a growth medium that contained only YE as
the nitrogen source (100 YE) and once a healthy and stable biofilm had
formed the growth media were changed according to the procedure
explained in Section 34 Fermentation procedure
Initially R1 had a high biomass content and activity (when only YE was in
the fermentation medium) and as the YE content in the growth medium
decreased the biomass activity decreased R2 was effectively a repetition
of R1 but due to the low initial biomass activity the dilution rate was
adjusted to have approx 95 glucose conversion (when the growth
copycopy UUnniivveerrssiittyy ooff PPrreettoorriiaa
45
medium had only YE as the nitrogen source) Despite the increased surface
area for biofilm attachment the biomass in R3 struggled to achieve the
same activity as R1 Initially the SA concentration was slightly higher but
eventually the results of R3 coincided with those of R2 when CSL was
introduced into the growth medium The dilution rate for R3 could have
been lowered further to reach higher product concentrations but it was
decided not to do this due to time constraints for achieving steady state
Table 41 gives the steady state results for all three runs
copycopy UUnniivveerrssiittyy ooff PPrreettoorriiaa
46
Table 41 Steady state data for the three continuous fermentation runs
Dilution
(h-1)
SA
(gmiddotL-1) AA (gmiddotL-1) FA (gmiddotL-1)
PYR
(gmiddotL-1)
Δ GLC
(gmiddotL-1)
YE ( in nitrogen
source)
Black box mass
balance ()
Average black box
mass balance ()
Average black box
mass balance ()
with DCW
Fermentation run 1
008 1731 814 608 048 3041 10000 8529
008 1685 816 619 050 3067 10000 8347
009 1671 800 612 051 3059 10000 8269 8382
008 1860 702 449 066 2916 6250 8777
008 1872 667 435 079 2917 6250 8716 8747 9581
008 1764 492 263 045 2619 3750 8343
008 1792 494 251 033 2596 3750 8473
008 1778 498 259 031 2596 3750 8441 8419
008 1691 359 183 178 2152 1875 9646
008 1696 349 168 175 2223 1875 9278
008 1669 353 170 172 2107 1875 9687 9537
008 1565 239 064 224 1855 625 9935
008 1411 192 048 290 1808 625 9459
008 1328 176 056 293 1822 625 8921 9438
copycopy UUnniivveerrssiittyy ooff PPrreettoorriiaa
47
Dilution
(h-1)
SA
(gmiddotL-1) AA (gmiddotL-1) FA (gmiddotL-1)
PYR
(gmiddotL-1)
Δ GLC
(gmiddotL-1)
YE ( in nitrogen
source)
Black box mass
balance ()
Average black box
mass balance ()
Average black box
mass balance ()
with DCW
Fermentation Run 2
004 1780 852 569 051 2954 10000 9023
004 1853 878 569 044 2972 10000 9256
004 1874 897 585 040 3004 10000 9287 9189
004 1796 564 248 042 2489 3750 9154
004 1759 582 263 035 2354 3750 9616
004 1760 570 228 038 2561 3750 8760 9177
004 1175 290 071 201 1447 625 10575
004 1106 289 074 199 1455 625 10081
004 1080 283 071 202 1390 625 10357 10338
Fermentation Run 3
004 2253 1022 493 026 3695 10000 8686
004 2257 1009 499 023 3673 10000 8711
004 2205 976 477 025 3656 10000 8522 8640 9138
004 1927 787 298 000 3043 6250 8538
004 1970 803 306 007 3221 6250 8266
004 1991 820 335 005 3242 6250 8344 8383 9213
004 1785 604 128 063 2998 3750 8583
copycopy UUnniivveerrssiittyy ooff PPrreettoorriiaa
48
Dilution
(h-1)
SA
(gmiddotL-1) AA (gmiddotL-1) FA (gmiddotL-1)
PYR
(gmiddotL-1)
Δ GLC
(gmiddotL-1)
YE ( in nitrogen
source)
Black box mass
balance ()
Average black box
mass balance ()
Average black box
mass balance ()
with DCW
004 1879 615 131 069 3092 3750 8572 8568 8974
004 1635 493 028 067 2635 1875 8718
004 1628 486 022 077 2605 1875 8644
004 1578 455 036 080 2664 1875 8431 8598 9919
004 1159 295 000 082 1489 625 9255
004 1110 286 000 098 1955 625 8545
004 1104 275 000 099 1419 625 9630
004 1044 259 000 114 1433 625 8908 9085 11240
004 817 137 000 177 1582 000 6186
004 709 086 000 237 1425 000 8691
004 725 072 000 249 1457 000 6140
004 712 080 000 273 1271 000 7161 7045 7234
copycopy UUnniivveerrssiittyy ooff PPrreettoorriiaa
49
Mass balances or redox balances were performed on all the samples and
the average closures of the steady state samples are shown in Table 41
Mass balance closure did increase as the YE content decreased In R3
DCWs were taken to see if the mass balance closure would reach 100
Including the DCWs significantly improved the mass balance but did not
close it Anything above 90 was considered a proper closure and most
figures that were below 100 may indicate unknown metabolites or non-
perfect analysis of acids and sugars
42 Productivity analysis
Figure 41 shows the average concentrations of SA AA and FA in the
product streams at steady state for all fermentation runs For a clear
comparison of the metabolite concentrations of all the fermentation runs
the results were put into a single plot despite the differences in dilution
rate and glucose feed concentration The reasons for the difference in
dilution rates were explained in Section 41
copycopy UUnniivveerrssiittyy ooff PPrreettoorriiaa
50
R1
R2
R3
SA
FA
AA
Figure 41
(See Table 31)
Figure 42 depicts how SA productivity and the glucose consumption rate
changed as the YE concentration decreased
0
2
4
6
8
10
12
14
16
18
20
22
24
0 10 20 30 40 50 60 70 80 90 100
Co
nce
ntr
atio
n(g
middotL-1
)
YE in Nitrogen Source
Figure 41 Product concentration profiles for SA AA and FA of
A succinogenes as the YE in the growth media varied
The total nitrogen source (combination of YE and CSL) concentration in the
growth medium stayed constant at 16 gmiddotL-1only the concentrations of YE (powder
form) and CSL (liquid form) varied
Commented [B1] In order for the very long captions for Figures 41 to 46 NOT to show in the automatic List of Figures Ive converted the detailed descriptions to normal text
copycopy UUnniivveerrssiittyy ooff PPrreettoorriiaa
51
R1
R2
R3
Productivity SA
Glucose
consumption rate
Figure 42SA productivity profile and glucose consumption rat
A succinogenes as the YE in the growth media varied
(See Table 31)
SA concentration decreased as the concentration of YE was reduced in the
medium When only YE was used as the nitrogen source which is an ideal
ingredient for A succinogenes growth and SA productivity the highest SA
concentration for R2 and R3 was achieved For R1 the SA concentration
was at its highest when the 625 of YE medium was used Despite the
difference in glucose concentration SA concentrations for R1 R2 and R3
0
02
04
06
08
1
12
14
16
18
2
22
24
26
28
3
0
02
04
06
08
1
12
14
16
0 10 20 30 40 50 60 70 80 90 100
Glu
cose
co
nsu
mp
tio
n r
ate
(gL
hr)
Pro
du
ctiv
ity
SA
(gmiddotL
-1middoth
r-1))
of YE in Nitrogen source
Figure 42 SA productivity profile and glucose consumption rate
profiles of A succinogenes as the YE in the growth media varied
The total nitrogen source (combination of YE and CSL) concentration in the
growth medium stayed constant at 16 gmiddotL-1 only the concentrations of YE
(powder form) and CSL(liquid form) varied
copycopy UUnniivveerrssiittyy ooff PPrreettoorriiaa
52
were similar when CSL was added to the medium R3 started with a high SA
concentration as expected but then quickly dropped and displayed the
trend observed in R1 and R2 AA and FA both decreased as the YE content
in the medium decreased for all runs The concentrations for both FA and
AA more or less matched in all runs irrespective of the dilution rate and
the glucose feed concentration When only CSL was used as the nitrogen
source in the growth medium in R3 no FA was produced
The SA productivity trend shown in Figure 42 is the same as the SA
concentration profile The highest SA productivity obtained in this study
was 158 gmiddotL-1middoth-1 when a 625 YE medium was used as the nitrogen
source From Figure 42 it should be clear that the productivities of R1
were almost twice as high as the productivities of R2 The same can be said
for the glucose consumption rates for R1 and R2 This is because the
dilution rate of R1 was also twice as much as the dilution rate of R2
According to Maharaj et al (2014) a decrease in dilution should lead to an
increase in product concentrations and yields R1 and R2 do not follow that
trend Instead their product concentrations profile matched A possible
reason for the inconsistency in the trends could be that there was less
biofilm activity in R2 for an unknown reason compared with the biofilm
activity in R1 resulting in a product concentrations profile match instead of
higher product concentrations in R2 compared with the profile for R1
43 Analysis of product distribution
Metabolite concentrations were used to determine and study the product
distributions YAASA YAAFA and YGLSA of the three fermentations
copycopy UUnniivveerrssiittyy ooff PPrreettoorriiaa
53
In Section 24 the theoretical metabolic flux limitations were discussed and
it was noted that in the absence of biomass formation the maximum
theoretical values for YAASA and YGLSA should be 393gmiddotg-1 and 088 gmiddotg-1
respectively These yields would only be achieved if no FA was produced
ie if only PDH was active However if the PFL route was active and all of
the FA was converted to CO2 and NADH by FDH then the maximum
theoretical yields mentioned earlier could be still achieved If biomass is
produced then a portion of the glucose in the growth medium would be
directed to the anabolic pathway which would influence the carbon
distribution resulting in maximum yields less than those given above
It is illustrated in Figure 43 that YAASA should vary between 197 gmiddotgminus1 (for
YAAFA = 077 gmiddotgminus1) and 393 gmiddotg-1 (for YAAFA = 0 gmiddotgminus1) Using only YE as the
nitrogen source the experimental yields for all runs matched the maximum
theoretical yields that were obtained when only the PFL enzyme was
active As the nitrogen source content varied (ie CSL concentration
increased and YE concentration decreased) YAASA increased and YAAFA
decreased thus indicating a shift in the metabolic flux distribution YAASA for
R2 and R3 were similar throughout the runs so was YAAFA However when
the YE concentration in the nitrogen source was 1875 for R1 and R3
YAASA exceeded the maximum theoretical yield while YAAFA was still in the
range of 0 gmiddotg-1 to 077 gmiddotg-1 The highest YAASA achieved in this study was 83
gmiddotg-1 and the lowest YAAFA was 0 gmiddotg-1 as seen in Figure 43 these yields
were obtained in R3 when only CSL was used as the nitrogen source
Certain batch studies in A succinogenes also achieved a YAASA that exceeded
the maximum theoretical yield (see Section 26 Table 21) but those
studies used YE as the nitrogen source whereas in this study it was
copycopy UUnniivveerrssiittyy ooff PPrreettoorriiaa
54
achieved using only CSL Xi et al (2013) was the only study (batch
fermentation) mentioned in Table 21 that used only CSL as the nitrogen
source with glucose as the carbon substrate and exceeded the maximum
theoretical YAASA They attained a YAASA of 458 gmiddotg-1
copycopy UUnniivveerrssiittyy ooff PPrreettoorriiaa
55
R1
R2
R3
SAAA
FAAA
Figure 43 Experimental yields plotted with the maximum theoretical yields
profile of A succinogenes as YE in medium changes
Considering the flux at the pyruvate node YAAFA decreased and was
approaching zero as the CSL concentration in the nitrogen source
increased as seen in Figure 43 This could be an outcome of an increase in
either PDH or FDH activity or a decrease in activity for both PDH and PFL
resulting in an increased concentration of pyruvate in the product stream
Figure 44 illustrates how the pyruvate concentration increased as the CSL
concentration in the growth medium increased
0
05
1
15
2
25
3
35
4
45
5
55
6
65
7
75
8
85
9
0 10 20 30 40 50 60 70 80 90 100
Mas
s ra
tio
(g
g-1)
YE in Nitrogen Source
SAAA max (PFL)
FAAA max (PFL)
SAAA max (PDH)
FAAA max (PDH)
Figure 43 Experimental yields plotted with the maximum theoretical
yields profile of A succinogenes as YE in medium changes
The total nitrogen source (combination of YE and CSL) concentration in the
growth medium stayed constant at 16 gmiddotL-1 only the concentrations of YE
(powder form) and CSL(liquid form) varied
copycopy UUnniivveerrssiittyy ooff PPrreettoorriiaa
56
(See Table 31)
According to the redox balance it is expected that YAASA would increase as
YAAFA decreased and in this study the same development was observed
This could be linked to the increasing CSL concentration in the nitrogen
source in this study Bradfield amp Nicol (2014) suggested that there could be
an additional reducing power that produced the yields that were achieved
Using carbon and redox balances they noticed in their study that the
experimental YAASA values exceeded the predicted values suggesting that an
increase in PDH or FDH activity was not the only contribution to the
increase in YAASA and that additional reducing power was present The same
0
02
04
06
08
1
12
14
16
18
2
22
24
26
28
3
0 10 20 30 40 50 60 70 80 90 100
Co
nce
ntr
atio
n(g
L)
YE in Nitrogen Source
PYR R1
PYR R2
PYR R3
Figure 44 Pyruvate concentration profile of A succinogenes as YE in
medium changes
The total nitrogen source (combination of YE and CSL) concentration in the
growth medium stayed constant at 16 gmiddotL-1 only the concentrations of YE
(powder form) and CSL(liquid form) varied
copycopy UUnniivveerrssiittyy ooff PPrreettoorriiaa
57
explanation can be applied to this study as seen in Figure 43 The increase
in the YAASA is influenced by the decrease in the YAAFA ratio although it is not
sufficient to reach the expected ratios (according to the redox balance)
(See Table 31)
Figure 45 illustrates the NADH consumed per NADH produced for all
fermentation runs The NADH consumed (mol NADHmiddotcmol glucose-1) was
calculated as follow
09
1
11
12
13
14
15
16
17
18
19
2
0 10 20 30 40 50 60 70 80 90 100
NA
DH
Co
nsu
med
NA
DH
Pro
du
ced
of YE in Nitrogen source
NADH R1
NADH R2
NADH R3
Figure 45 NADH ratio consumed during production of A succinogenes
as YE in medium changes
The total nitrogen source (combination of YE and CSL) concentration in the
growth medium stayed constant at 16 gmiddotL-1 only the concentrations of YE
(powder form) and CSL(liquid form) varied
copycopy UUnniivveerrssiittyy ooff PPrreettoorriiaa
58
2119862119878119860119872119872119878119860
6∆119866119871119862119872119872119866119871119862
frasl (41)
Using Figure 2 Equation 41 was generated The only pathway that
consumed NADH was the path that converted PEP to SA where 2 molecules
of NADH were consumed to produce 1 molecule of SA
The NADH (mol NADHmiddotcmol glucose-1) produced was calculated as follow
(119862119878119860
119872119872119878119860+
2119862119860119860
119872119872119860119860minus
119862119865119860
119872119872119865119860)
6∆119866119871119862
119872119872119866119871119862
frasl (42)
The path from glucose to PEP produced 2 molecules of NADH per one
glucose molecule consumed and from PYR to AA 1 molecule of NADH per
one AA molecule was produced All the inputs for these equations were the
product concentrations obtained from the experimental runs
In Figure 45 it is noted that for all the fermentation runs the ratio of NADH
consumed to NADH produced increased as the concentration of YE in the
growth medium increased Nevertheless there is a clear dissimilarity
between the three runs In R3 the NADH production was higher than the
consumption for all growth media except when only CSL was used as the
nitrogen source R2 and R3 in comparison with R1 did not display a
massive imbalance in the NADH ratio and R1 was the only run where NADH
consumed over produced ratio consistently increased significantly as the
YE content in the growth medium increased It appears that the additional
NADH generation capability of R1 was not fully present in R2 and R3 and
possibly the strains used in R2 and R3 had altered production
copycopy UUnniivveerrssiittyy ooff PPrreettoorriiaa
59
characteristics compared with the original strain Nevertheless the R1
results coincide with the observation of both Bradfield amp Nicol (2014) and
Brink amp Nicol (2014) which was that there was an ldquoexcessrdquo of NADH that
was consumed during the maintenance phasenon-growth phase resulting
in a high YAASA
copycopy UUnniivveerrssiittyy ooff PPrreettoorriiaa
60
(See Table 31)
Figure 46 illustrates the yield of SA on glucose for R1 This graph shows
how the flux from glucose to SA increases as the CSL concentration in the
growth medium increases The trend observed in Figure 46 can be linked
to the ldquoexcessrdquo NADH that favours the production of SA Xi et al (2013)
observed that using only CSL as the nitrogen source provided high
selectivity towards SA (458 gmiddotgminus1) in comparison with other by-products
On the other hand CSL with heme provided a high glucose-to-SA flux
(072 gmiddotgminus1) and a much higher YAASA (493 gmiddotgminus1) A similar observation was
04
043
046
049
052
055
058
061
064
067
07
073
076
079
082
085
088
0 10 20 30 40 50 60 70 80 90 100
Mas
s ra
tio
(g
g-1)
YE in Nitrogen Source
SAGL R1
SAGL max(PFL)SAGL max(PDH)
Figure 46 Mass ratio of succinic acid over glucose profile of
A succinogenes as YE in medium changes
The total nitrogen source (combination of YE and CSL) concentration in the
growth medium stayed constant at 16 gmiddotL-1 only the concentrations of YE
(powder form) and CSL(liquid form) varied
copycopy UUnniivveerrssiittyy ooff PPrreettoorriiaa
61
documented by Yan et al (2013) Xi et al (2012) tried to explain this
observation in their study by stating that CSL contained cofactor biotin
which promoted the high SA selectivity
It is reasonable to postulate that there is an ingredient in CSL that may
trigger or enhance the activity of an additional metabolic pathway known
as the pentose phosphate pathway (PPP) to produce high carbon flux to SA
and high SA selectivity The idea of PPP as the source of the additional
reducing power stems from the findings of Bradfield and Nicol (2014)
Their analysis has shown that if the NADPH generated in the PPP cycle is
converted to NADH in order to supply redox to the SA pathway then high
SA selectivity can be achieved A succinogenes has the transhydrogenase
that allows PPP to be active and as mentioned earlier the presence or
absence of one or more ingredients in CSL may allow this enzyme to be
active consequently activating the PPP as well
Xi et al (2012) did mention biotin as the culprit for the high SA selectivity
They investigated the influence of biotin on A succinogenes growth and SA
productivity by varying the biotin concentration in a chemically defined
medium There was no SA production and cell growth was severely
inhibited when biotin was absent from the growth medium They reported
a high SA yield in their study but their data for AA concentration YGLAA and
YAASA were inconsistent with their observed product concentrations The
following example is extracted from their results In the experiment using
8 mg L-1biotin the glucose consumed was 300 g L-1 CSA = 194 g L-1 CAA =
32 g L-1 YGLAA = 0203 g g-1 and YAASA = 61 g g-1 However the YGLAA should
have been 0107 gmiddotg-1 if CAA was reported correctly but if the value for YAASA
was used as the value of CAA then the reported YGLAA would be correct
copycopy UUnniivveerrssiittyy ooff PPrreettoorriiaa
62
Nevertheless because of the inconsistency of the data it cannot be
concluded that biotin did play a role in gaining a high SA yield
Either the presence or absence of a component in a growth medium can
influence the enzymatic activity of a pathway and this concept should be
used to postulate explanations for the results obtained in this study
A breakdown of the constituents of CSL and YE could help in identifying the
ingredients in CSL that may have triggered or enhanced the activity of the
PPP Since both CSL and YE are complex media and there is no definite
information on the ingredients it is hard to fully confirm the following
theory
Xiao et al (2013) did a study on the constituents of CSL and stated that any
grade of CSL has the following amino acids isoleucine asparagine
methionine lysine proline and aspartic acid YE was reported by an
industrial data sheet (Organotechniereg SAS France) to have a high
content of the following alanine isoleucine leucine methionine
phenylalanine tyrosine and valine Although there are common amino
acids shared between CSL and YE there is one amino acid YE has that is
absent from CSL namely leucine This could be a reason why CSL could be
related to the excess NADH
Leucine in Ecoli is said to repress the transhydrogenase activity which in
turn represses the PPP (Gerolimatos amp Hanson 1978) This could be true
for A succinogenes since it also has the transhydrogenase for PPP as
mentioned in Section 23 A succinogenes with only YE as the nitrogen
source produced yields that were expected according to the carbon and
redox balance It can be postulated that as the YE content reduce the
copycopy UUnniivveerrssiittyy ooff PPrreettoorriiaa
63
leucine content decreased and the activity of the transhydrogenase
increased causing additional NADH to be generated from the enhanced
PPP resulting in improved yields
copycopy UUnniivveerrssiittyy ooff PPrreettoorriiaa
64
5 Conclusions
The complex nitrogen requirements of non-growing A succinogenes
biofilms were evaluated The study restricted itself to the use of YE and CSL
as nitrogen sources The SA productivity yields and titre were the variables
assessed
The YE concentration was decreased while simultaneously increasing the
CSL concentration in the medium Although this led to a decrease in the
steady state productivity of the organism overall SA selectivity increased
The production of certain metabolites such as SA and pyruvate also
increased while FA and AA concentrations decreased in the increasing
absence of YE This led to an increase in the SA to AA mass ratio and to a
decrease in the FA to AA mass ratio When zero amounts of YE were in the
growth medium no FA was produced
Three fermentation runs were performed The highest SA concentration in
this study was 2257gmiddotL-1 when only YE was used as the nitrogen source in
the growth medium and the highest SA productivity obtained in this study
was 158 gmiddotL-1middoth-1 when a combination of YE(625) and CSL(375) was
used as the nitrogen sourceThe highest SA to AA mass ratio achieved was
83 gmiddotg-1 when only CSL was used as the nitrogen source The FA to AA
mass ratio was consistently less than 077 gmiddotg-1 approaching 0 gmiddotg-1 as the
CSL concentration in the nitrogen source increased
Lower FA to AA mass ratio values were not fully responsible for the
increase in the SA to AA mass ratio The surplus NADH required is provided
copycopy UUnniivveerrssiittyy ooff PPrreettoorriiaa
65
by the activation or enhancement of an alternative metabolic pathway ie
the pentose phosphate pathway
The observations made in this study bolster the idea of using a combination
of YE and CSL where YE is the minor component as the nitrogen source for
commercialisation of bio-based succinic acid production using
Asuccinogenes as the catalyst
copycopy UUnniivveerrssiittyy ooff PPrreettoorriiaa
66
6 References
Allied Market Research (2014) ldquoWorld bio succinic acid market ndash
Opportunities and forecasts 2013ndash2020rdquo [Online]
httpswwwalliedmarketresearchcombio-succinic-acid-market
Beauprez JJ De Mey M and Soetaert WK (2010) ldquoMicrobial succinic acid
production natural versus metabolic engineered producersrdquo Process
Biochem451103ndash1114
Bechthold I Bretz K Kabasci S Kopitzky R and Springer A (2008)
ldquoSuccinic acid a new platform chemical for biobased polymers from
renewable resourcesrdquo Chem Eng Technol 31647ndash654
BioConSepT (2013) ldquoDetermination of market potential for selected
platform chemicalsrdquo [Online] httpwwwbioconsepteuwp-
contentuploadsBioConSepT_Market-potential-for-selected-platform-
chemicals_ppt1pdf
Bozell JJ and Petersen GR (2010) ldquoTechnology development for the
production of biobased products from biorefinery carbohydrates ndash the US
Department of Energyrsquos ldquoTop 10rdquorevisitedrdquo Green Chem 12539ndash554
Bradfield MFA and Nicol W (2014) ldquoContinuous succinic acid production
by Actinobacillus succinogenes in a biofilm reactor steady-state metabolic
flux variationrdquo Biochem Eng J 851ndash7
copycopy UUnniivveerrssiittyy ooff PPrreettoorriiaa
67
Brink HG and Nicol W (2014) ldquoSuccinic acid production with Actinobacillus
succinogenes Rate and yield analysis of chemostat and biofilm culturesrdquo
Microb Cell Fact 13111-122
Chen K Jiang M Wei P Yao J and Wu H (2010)rdquoSuccinic acid production
from acid hydrolysate of corn fiber by Actinobacillus succinogenesrdquo Appl
Biochem Biotechnol 160477ndash485
Cok B Tsiropoulos I Roes AL and Patel MK (2014) ldquoSuccinic acid
production derived from carbohydrates An energy and greenhouse gas
assessment of a platform chemical toward a bio-based economyrdquo Biofuels
Bioprod Bioref 816-29
Corona-Gonzaacutelez RI Bories A Gonzaacutelez Alvarez V and Pelayo-Ortiz C
(2008) ldquoKinetic study of succinic acid production by Actinobacillus
succinogenes ZT-130rdquo Process Biochem 431047ndash1053
Davis R Tao L Tan ECD Biddy MJ Beckham GT Scarlata C Jacobson J
Cafferty K Ross J Lukas J Knorr D and Schoen P(2013) ldquoProcess Design
and Economics for the Conversion of Lignocellulosic Biomass to
Hydrocarbons Dilute-Acid and Enzymatic Deconstruction of Biomass to
Sugars and Biological Conversion of Sugars to Hydrocarbonsrdquo NREL Report
No TP-5100-60223 [Online]
httpwwwnrelgovdocsfy14osti60223pdf
Gerolimatos B and Hanson RL (1978) ldquoRepression of Escherichia coli
pyridine nucleotide transhydrogenase by leucinerdquo J Bacteriol 134(2)394-
400
copycopy UUnniivveerrssiittyy ooff PPrreettoorriiaa
68
Grand-View-Research (2015) ldquoBio-Succinic Acid Market Analysis by
Application (BDO Polyester Polyols PBSPBST Plasticizers Alkyd Resins)
and Segment Forecasts to 2020ldquo [Online]
httpwwwgrandviewresearchcomindustry-analysisbio-succinic-acid-
market ISBN Code 978-1-68038-085-9
Guettler M Rumler D and Jain M (1999) ldquoActinobacillus succinogenes sp
nov a novel succinic-acid-producing strain from the bovine rumenrdquo Int J
Syst Bacteriol 49207ndash216
Gunnarsson IB Karakashev D and Angelidaki I (2014) ldquoSuccinic acid
production by fermentation of Jerusalem artichoke tuberhydrolysate with
Actinobacillus succinogenes 130Zrdquo Ind Crops-Prod 62125ndash129
ICIS (2012)rdquoChemical industry awaits for bio-succinic acid potentialrdquo
[Online]
httpwwwiciscomArticles201201309527521chemical+industry+
awaits+for+biosuccinic+acid+potentialhtml
Jiang M Chen K Liu Z Wei P Ying H and Chang H (2010) ldquoSuccinic acid
production by Actinobacillus succinogenes using spent Brewers yeast
hydrolysate as a nitrogen sourcerdquo Appl Biochem Biotechnol 160 244ndash
254
Jiang M Dai W Xi Y Wu M Kong X Ma J Min Zhang M Chen K and Wei
P (2014) ldquoSuccinic acid production from sucrose by Actinobacillus
succinogenes NJ113rdquo BioresourTechnol 153327ndash332
copycopy UUnniivveerrssiittyy ooff PPrreettoorriiaa
69
Kaneuchi C Seki M and Komagata K (1988) ldquoProduction of succinic acid
from citric acid and related acids by Lactobacillus strainsrdquo Appl Environ
Microbiol 543053ndash3056
Kasprow RP Lange AJ and Kirwan DJ (1998)ldquoCorrelation of fermentation
yield with yeast extract composition as characterized by near-infrared
spectroscopyrdquo Biotechnol Prog 14318minus325
Kwon S Lee PC Lee EG Chang YK and Chang N (2000) ldquoProduction of
lactic acid by Lactobacillus rhamnosus with Vitamin-supplemented soybean
hydrolysaterdquo Enzyme Microb Technol 26209-215
Lee PC Lee WG Kwon S Lee SY and Chang HN (2000) ldquoBatch and
continuous cultivation of Anaerobiospirillum succiniciproducens for the
production of succinic acid from wheyrdquo Appl Microbiol Biotechnol 5423ndash
27
Lee PC Lee SY Hong SH and Chang HN (2002) ldquoIsolation and
characterization of a new succinic acid-producing bacterium Mannheimia
succiniciproducens MBEL55E from bovine rumenrdquo Appl Microbiol
Biotechnol 58(5)663ndash668
Lin H Bennett GN and San KY (2005) ldquoFed-batch culture of a
metabolically engineered Escherichia coli strain designed for high-level
succinate production and yield under aerobic conditions rdquoBiotechnol
Bioeng 90775ndash779
copycopy UUnniivveerrssiittyy ooff PPrreettoorriiaa
70
Lin SKC Du C Koutinas A Wang R amp Webb C (2008) ldquoSubstrate and
product inhibition kinetics in succinic acid production by Actinobacillus
succinogenesrdquo Biochem Eng J 41(2)128ndash135
Liu YP Zheng P Sun ZH Ni Y Dong JJ and Zhu LL (2008) ldquoEconomical
succinic acid production from cane molasses by Actinobacillus
succinogenesrdquo Bioresour Technol 991736ndash1742
Maharaj K Bradfield MFA and Nicol W (2014) ldquoSuccinic acid-producing
biofilms of Actinobacillus succinogenes Reproducibility stability and
productivityrdquo Appl Microbiol Biotechnol 98(17)7379ndash7386
McKinlay JB Zeikus JG amp Vieille C (2005) ldquoInsights into Actinobacillus
succinogenes fermentative metabolism in a chemically defined growth
mediumrdquo Appl Environ Microbiol 71(11) 6651ndash6656
McKinlay JB Vieille C and Zeikus JG (2007) ldquoProspects for a bio-based
succinate industryrdquo Appl Microbiol Biotechnol 76727ndash740
McKinlay JB Laivenieks M Schindler BD McKinlay A Siddaramappa S
Challacombe JF Lowry SR Clum A Lapidus AL and Burkhart KB (2010)
ldquoA genomic perspective on the potential of Actinobacillus succinogenes for
industrial succinate productionrdquo BMC Genomics 11 (1) 680
Nghiem NP Davison BH Suttle BE and Richardson GR (1997)
ldquoProduction of succinic acid by Anaerobiospirillum succiniciproducensrdquo Appl
Biochem Biotechnol 63ndash65 565ndash576
copycopy UUnniivveerrssiittyy ooff PPrreettoorriiaa
71
Oh I Lee H Park C Lee SY and Lee J (2008) ldquoSuccinic acid production by
continuous fermentation process using Mannheimia succiniciproducens
LPK7rdquo J Microbiol Biotechnol 18908ndash912
Organotechniereg SAS (2008) ldquoTechnical Data Sheet Yeast Extract 19512rdquo
[Online] httpwwworganotechniecomdoc_en19512pdf [accessed 22
November 2015]
Rosche B Li XZ Hauer B Schmid A and Buehler K (2009) ldquoMicrobial
biofilms A concept for industrial catalysisrdquo Trends Biotechnol 27636ndash43
DOI 101016jtibtech200908001
Ruumlhl M Le Coq D Aymerich S and Sauer U (2012) ldquo13C-flux analysis
reveals NADPH balancing transhydrogenation cycles in stationary phase of
nitrogen-starving Bacillus subtilisrdquo JBiolChem 287(33) 27959ndash27970
Shen N Qin Y Wang Q Liao S Zhu J Zhu Q Mi H Adhikari B Wei Y and
Huang R (2015) ldquoProduction of succinic acid from sugarcane molasses
supplemented with a mixture of corn steep liquor powder and peanut meal
as nitrogen sources by Actinobacillus succinogenesrdquo Appl Microbiol 60544-
551
Shuler M and Kargi F (2002) ldquoBioprocess Engineering Basic Conceptsrdquo 2nd
ed Prentice Hall New York
Song H and Lee SY (2006) ldquoProduction of succinic acid by bacterial
fermentationrdquo Enzyme MicrobTechnol 39-(3)352ndash361
copycopy UUnniivveerrssiittyy ooff PPrreettoorriiaa
72
Spector MP (2009) ldquoMetabolism central (intermediary)rdquo in M Schaechter
(Ed) Encyclopedia of Microbiology 3rd ed Academic Press Oxford 242ndash
264
Sridee W Laopaiboon L Jaisil P and Laopaiboon P (2011) ldquoThe use of
dried spent yeast as a low-cost nitrogen supplement in ethanol
fermentation from sweet sorghum juice under very high gravity
conditionsrdquo Electron JBiotechnol14(6)1-15
Transparency-Market-Research (2014) ldquoSuccinic acid market for 14-bdo
resin coatings dyes amp inks pharmaceutical polyurethane food
plasticizers cosmetics solvents amp lubricants and de-icing solutions
applications-Global industry analysis size share growth trends and
forecast 2012ndash2018rdquo [Online]
httpwwwtransparencymarketresearchcomsuccinic-acidhtml
Urbance SE Pometto AL DiSpirito A and Demirci A (2003) ldquoMedium
evaluation and plastic composite support ingredient selection for biofilm
formation and succinic acid production by Actinobacillus succinogenesrdquo
Food Biotechnol 17(1)53ndash65
Urbance SE Pometto AL DiSpirito A and Denli Y (2004) ldquoEvaluation of
succinic acid continuous and repeat-batch biofilm fermentation by
Actinobacillus succinogenes using plastic composite support bioreactorsrdquo
ApplMicrobiolBiotechnol 65 (6)664ndash70
Van der Werf MJ Guettler MV Jain MK and Zeikus JG (1997)
ldquoEnvironmental and physiological factors affecting the succinate product
copycopy UUnniivveerrssiittyy ooff PPrreettoorriiaa
73
ratio during carbohydrate fermentation by Actinobacillus sp 130Zrdquo Arch
Microbiol 167332ndash342
Van Heerden CD and Nicol W (2013a) ldquoContinuous and batch cultures of
Escherichia coli KJ134 for succinic acid fermentation Metabolic flux
distributions and production characteristicsrdquo Microb Cell Fact 12-(1) 80-
90
Van Heerden CD and Nicol W (2013b) ldquoContinuous succinic acid
fermentation by Actinobacillus succinogenesrdquo Biochem EngJ 735ndash11
Villadsen J Nielsen J amp Lideacuten G (2011) ldquoBioreaction Engineering
Principlesrdquo 3rd ed Springer US Boston MA
Werpy T and Petersen G (2004) ldquoTop value added chemicals from
biomass Vol 1 Results of screening for potential candidates from sugars
and synthesis gasrdquo National Renewable Energy Lab Golden CO US
Xi Y Chen K Xu R Zhang J Bai X Jiang M Wei P and Chen J (2012)
ldquoEffect of biotin and a similar compound on succinic acid fermentation by
Actinobacillus succinogenes in a chemically defined mediumrdquo Biochem Eng
J 6987ndash92
Xi Y Chen K Dai W Ma J Zhang M Jiang M Wei P and Ouyang PK
(2013) ldquoSuccinic acid production by Actinobacillus succinogenes NJ113
using corn steep liquor powder as nitrogen sourcerdquo Bioresour Technol
136 775ndash779
copycopy UUnniivveerrssiittyy ooff PPrreettoorriiaa
74
Xiao X Hou Y Liu Y Liu Y Zhao H Dong L Du J Wang Y Bai G and Luo
G (2013) ldquoClassification and analysis of corn steep liquor by UPLCQ-TOF
MS and HPLCrdquo Talanta 107344ndash348
Xu J and Guo B (2010) ldquoMicrobial succinic acid its polymer poly(butylene
succinate) and applicationsrdquo Plastics from Bacteria Natural Functions and
Applications Microbiology Monographs Vol 14 Springer Verlag
BerlinHeidelberg DOI 101007978-3-642-03287514
Yan Q Zheng P Dong JJ and Sun ZH (2013) ldquoA fibrous bed bioreactor to
improve the productivity of succinic acid by Actinobacillus succinogenesrdquo
JChemTechnolBiotechnol 89(11)1760-1766DOI101002jctb4257
Yan Q Zheng P Tao S and Donga J (2014) ldquoFermentation process for
continuous production of succinic acid in a fibrous bed bioreactorrdquo
Biochem Eng J 9192-98
Zeikus JG Jain MK and Elankovan P (1999) ldquoBiotechnology of succinic acid
production and markets for derived industrial productsrdquo Appl Microbiol
Biotechnol 51545ndash552
Zheng P Dong J Sun Z Ni Y and Fang L (2009) ldquoFermentative production
of succinic acid from straw hydrolysate by Actinobacillus succinogenesrdquo
Bioresour Technol 100 2425ndash2429
copycopy UUnniivveerrssiittyy ooff PPrreettoorriiaa
5
2 Literature survey
21 Bio-based chemicals
Bio-based chemicals are platform and intermediate chemicals derived from
biomass feedstocks The US Department of Energy (DOE) identified 300
potential bio-based platform chemicals but most of the proposed
chemicals did not have sufficient market potential nor was it economical to
produce them Only 30 chemicals were considered to be relevant since they
had the potential to replace non-bio-based chemicals and out of those 30
chemicals only 12 building block chemicals were identified as being the
most important because of their potential market chemical derivatives and
synthesis pathways (Werpy amp Peterson 2004)
The importance for bio-based production of fuels and chemicals arises
from the need to move away from petroleum-based production The
depletion of non-renewable feedstocks and the strong demand by
consumers for environmentally friendly energy sources has made the
production of fuels and chemicals from biomass feedstocks to be a
sustainable alternative to the petrochemical production route Government
and industry are now interested in bio-based resources and production and
they understand that to form a sustainable global economy a bio-based
industry should substitute the current petroleum-based routes to produces
fuels and chemicals (Cok et al 2014) However to have a bio-based
economy for the development of highly efficient and cost effective bio-
refineries is essential Petrochemical production has been optimised and
refined over long period of time making it a cheaper option compared with
the relatively new bio-based production Therefore to enhance the
development of a bio-based economy it is essential that the biological
copycopy UUnniivveerrssiittyy ooff PPrreettoorriiaa
6
processes are understood refined and optimised through continuous
research and development (Cok et al 2014)
22 Succinic acid
221 Application of succinic acid
One of the top 12 bio-based platform chemicals recognized by the US DOE
was succinic acid (SA) (Werpy amp Peterson 2004 Bozell amp Peterson 2010)
See Figure 21 for the molecular structure of SA Most of the SA produced to
meet global demand is manufactured through the petroleum route ie it is
produced by the partial oxidation of butane followed by hydrogenation of
the intermediate product which is maleic anhydride However the
expensive conversion costs and non-renewability of this petroleum-based
route for producing SA has limited the SA market to low-cost bulk
application (Xu amp Guo 2010 Beauprez et al 2010)
Figure 21 Succinic acid molecule
Traditionally the application of SA has been limited mainly to four
functional regions its largest area of application is as a surfactant an
additive to a detergent and a foaming agent the second is as an ion chelator
copycopy UUnniivveerrssiittyy ooff PPrreettoorriiaa
7
for preventing corrosion and spot corrosion of metals in the electroplating
industry the third is as an acidulant which is a pH regulator and flavouring
agent in the food industry and the fourth area of application region is in
the pharmaceutical industry specifically in the production of antibiotics
amino acids and vitamins (Xu amp Guo 2010) As a platform chemical it is
also used as a precursor of many commodity or specialty chemicals as seen
in Figure 22 (Zeikus et al 1999)
Figure 22Various chemicals and products derived from succinic acid
(Zeikus et al 1999)
Nevertheless there is potential for the bulk application of SA The key to
the growth of the SA market lies in its derivatives The diamines and diols
that are derived from SA can be used as monomer units of a variety of
Figure 22 Various chemicals and products derived from succinic acid
(Zeikus et al 1999)
copycopy UUnniivveerrssiittyy ooff PPrreettoorriiaa
8
plastics such as polyesters polyamides and polyester amides (Bechthold et
al2008) Among them is the SA derivative 14-butanediol (BDO) It is a
platform chemical for tetrahydrofuran (THF) gamma-butyrolactone (GBL)
and polymers such as polybutylene terephthalate (PBT) and polyurethane
(PU) These chemicals are widely used in the production of engineering
thermoplastics and elastic fibres and because of these applications the
BDO market is expected to increase as the demand for THF and spandex for
sports apparel increase (Grand- View- Research 2014) Another derivative
of SA that is predicted to increase the SA global market is the biodegradable
polybutylene succinate (PBS) and its copolymers PBS polymers have a
range of applications as supermarket bags packaging film mulch film and
other disposable articles Owing to the steady growth of the market for
biodegradable plastic the demand for PBS is expected to increase rapidly
which in turn could grow the SA market (ICIS 2012)
222 Succinic acid market
The global SA market in 2011 was estimated to be worth US$240 million
and it is projected to reach US$836 million by 2018 (Transparency-Market-
Research 2014) due to the development of the bio-SA Consumption of
petroleum-based SA in manufacturing various other chemicals is restricted
due to unpredictability of price and carbon footprints These concerns
however are advancing the progression of biological manufacturing of SA
The major drivers for this growth will be the high cost of crude oil the rise
in carbon footprints and an interest in producing ldquogreenrdquo chemicals Newer
applications of SA as PBS BDO plasticizers and polyesters polyols will fast-
track the future growth of the bio-SA market However the higher price of
bio-SA and the lengthy extraction processes are the primary factors that
copycopy UUnniivveerrssiittyy ooff PPrreettoorriiaa
9
will restrain the market growth for the next few years although the market
is expected to grow at a significant rate over the next seven years (Allied
Market Research 2014)
At present there are numerous institutions researching the development of
SA through bio-based raw materials and there are companies that are
already manufacturing bio-SA for commercial purposes The list of major
companies involved in the production of bio-SA includes BioAmber
Myraint DSM Mitsui amp Co Mitsubishi BASF Roquette Freacuterese SA Purac
and Reverdia In 2013 the global bio-SA market volume was approximately
51 100 tons and in seven years it is expected to reach a market volume of
710 000 tons In that same year BDO is predicted to emerge as the largest
application segment for bio-SA as it will replace maleic anhydride in the
production of BDO every 1MT of maleic anhydride will be replaced by
12MT of bio-SA (Allied Market Research 2014)
223 Bio-based SA production
Bio-SA which has the same structure as petroleum-based SA is produced
by the fermentation of a carbohydrate using a natural producer or an
engineered organism The feedstock used for the production of bio-based
succinic acid can be wheat maize glucose lignocellulosic-derived sugar or
sorghum grain processed to starch (BioConSepT 2013)
Compared with the petroleum-based process the fermentation process has
the advantages of mild operating conditions independence of the fossil
feedstock and fixation of CO2 and with development of genetic engineering
metabolic modification of microbial strains and improvement of
copycopy UUnniivveerrssiittyy ooff PPrreettoorriiaa
10
purification technology the fermentative production of SA from renewable
resources can be more cost-effective than the fossil-based processes (Xu amp
Guo 2010)
To date various microorganisms have been reported to produce SA such
as typical gastrointestinal bacteria and rumen bacteria and some
lactobacillus strains (Kaneuchi Seki amp Komagata 1988 Beauprez et al
2010) Among them Actinobacillus succinogenes (Guettler Rumler amp Jain
1999) Anaerobiospirillum succiniciproducens (Oh et al 2008) Mannheimia
succiniciproducens (Lee et al 2000) and genetically modified Escherichia
coli (Lin Bennet amp San 2005) are the most promising strains for producing
SA at high yields Fungi species such as Aspergillus niger Aspergillus
fumigatus Byssochlamys nivea Lentinus degener Paecilomyces varioti
Penicillium viniferum and yeast Saccharomyces cerevisia also produce
succinic acid but not in high concentrations or yields (Song amp Lee 2006)
Nevertheless for industrial applications A succinogenes stands out because
it is by far the most studied wild strain (Brink amp Nicol 2014) and its ability
to produce high concentrations of SA naturally from a broad range of
carbon sources (Guettler et al 1999 McKinlay Vieille amp Zeikus 2007)
further makes it ideal for commercial applications
23 Actinobacillus succinogenes
231 Description of microorganism
A succinogenes a Gram-negative rod-shaped and non-motile bacterium
isolated from bovine rumen (Guettler et al 1999) is considered to be one
copycopy UUnniivveerrssiittyy ooff PPrreettoorriiaa
11
of the top natural SA producing microorganisms (McKinlay et al 2007
Brink amp Nicol 2014) It produces SA as part of a mixed acid fermentation in
which acetic acid (AA) formic acid (FA) and ethanol are the by-products It
is capable of digesting a wide range of carbon sources such as glucose
fructose mannitol arabitol sorbitol sucrose xylose and arabinose under
anaerobic conditions (Van der Werf et a 1997) but most laboratory
experiments use glucose fructose xylose and sucrose as carbon substrates
A succinogenes grows optimally at moderate temperatures (37 degC to 39 degC)
and it is facultative anaerobic ie it can survive in the presence or absence
of oxygen Furthermore it is capnophilic because its growth is enhanced at
increased CO2 concentrations (Guettler et al 1999) and it is a
chemoheterotroph that grows optimally at pH ranging from 6 to 74
232 Metabolic pathway
As stated earlier A succinogenes is a promising candidate for industrial SA
production However in addition to producing SA it also produces formic
acid (FA) acetic acid (AA) and sometimes ethanol The summarised version
of the metabolic pathway for A succinogenes is shown in Figure 23
A succinogenes ferments glucose to phosphoenolpyruvate (PEP) by
glycolysis PEP is thought to serve as the point of divergence between the
FA AA and ethanol producing pathway (C3 pathway) and the SA producing
(C4) pathway The path from glucose to PEP is neutral overall in terms of
adenosine triphosphate (ATP) production but one-third of nicotinamide
adenine dinucleotide (NADH) is produced per cmol of glucose consumed
copycopy UUnniivveerrssiittyy ooff PPrreettoorriiaa
12
C4 metabolic pathway (reverse tricarboxylic pathway)
Overall this pathway leads to the formation of SA and two molecules of
NADH and one molecule of CO2 must be consumed to form one molecule of
SA Ideally one would prefer the carbon flux to follow this route to attain
homosuccinate production
The key enzyme in this pathway is PEP carboxykinase because it pushes
the carbon flux from PEP to oxaloacetate which later on becomes SA This
enzyme is regulated by CO2 levels ie the level of CO2 available to A
succinogenes will have an influence on the SA production of the organism
(Van der Werf et al 1997) Hence it will be imperative to achieve correct
extracellular and intracellular CO2 levels during SA production
C3 metabolic pathway
However the C3 pathway cannot be avoided due to the redox requirement
of the cell In this pathway PEP is converted to pyruvate by pyruvate
kinase generating one molecule of ATP during the process Pyruvate is
then converted to acetyl-CoA by either pyruvate dehydrogenase (PDH)
andor pyruvate-formatelyase (PFL)
Pyruvate conversion with PDH results in one molecule of CO2 and one
molecule of NADH being formed alongside one molecule of AA With PFL
FA is produced instead of CO2 and NADH but FA can be further broken
down to CO2 and NADH by the enzyme formate dehydrogenase (FDH)
copycopy UUnniivveerrssiittyy ooff PPrreettoorriiaa
13
The FDH activity (encoded by the fdhF gene in A succinogenes) is known to
occur only under the following conditions (Spector 2009)
Absence of an electron acceptor such as oxygen or nitrate
Acidic pH conditions
Presence of FA
PFL expression is stated to be dependent upon two glycolysis enzyme
activities namely phosphoglucoisomerase and phosphofructokinase
Interestingly the expression of PFL and FDH enzymes is reported to
increase under carbon energy source starvation (Spector 2009)
Acetyl-CoA is the branch point at which both ethanol and AA are later
formed In this process a molecule of ATP is produced per molecule of AA
formed For one molecule of ethanol formed two molecules of NADH are
absorbed However ethanol formation can be reduced if there is
intracellular availability of CO2 to the organism (Van der Werf et al 1997)
copycopy UUnniivveerrssiittyy ooff PPrreettoorriiaa
14
Figure 23 Simplified metabolic network of A succinogenes (based on
McKinlay et al (2007)
copycopy UUnniivveerrssiittyy ooff PPrreettoorriiaa
15
Pentose phosphate pathway (PPP)
Figure 23 gives a simplified version of the metabolic pathway of A
succinogenes However several studies have noted that the pentose
phosphate pathway is an additional pathway for the A succinogenes (Brink
amp Nicol 2014 Bradfield amp Nicol 2014 Van der Werf et al 1997 McKinlay
et al 2007 McKinlay et al 2005) McKinlay (2007) stated that the PPP
only contributed 20 to the NADPH required for the organismrsquos growth
But Bradfield amp Nicol (2014) and Brink amp Nicol (2014) postulated that the
contribution of the PPP could increase and be more than predicted when
the organism enters the maintenance phase or non-growth phase
According to Ruumlhl et al (2012) a resting non-growing Bacillus subtilis cell
showed constant metabolic activity without cell growth which lead to an
apparent overproduction of nicotinamide adenine dinucleotide phosphate
(NADPH) (via the PPP) which is then converted by transhydrogenase into
NADH Bradfield amp Nicol (2014) claim that it is possible that this can also
occur with A succinogenes as it does possess the transhydrogenase The
analysis by Bradfield amp Nicol (2014) indicated an under-prediction of the
YAASA for the growth metabolism (associated with NADH ldquolossesrdquo) while an
over-prediction of the YAASA is achieved for the maintenance metabolism
(associated with NADH ldquogainrdquo) This could imply that different metabolic
pathways are employed under growth and maintenance conditions
Medium contributions were previously considered as the source for the
NADH disparities during the maintenance phase but this reasoning can be
ruled out given the results of the study done by Brink amp Nicol (2014) in
which the same medium resulted in opposite redox balance trends with
regard to the growth and non-growth phases
copycopy UUnniivveerrssiittyy ooff PPrreettoorriiaa
16
24 SA yield considerations
The theoretical maximum yield of SA on a carbon substrate through
fermentation can be determined by considering the net metabolic pathway
involved and a redox balance as illustrated by Villadsen Nielsen amp Lideacuten
(2011 159-163) The overall black box stoichiometry in converting glucose
to SA with no biomass and no by-product formation is
C6H12O6 + 120788
120789CO2rarr
120783120784
120789C4H6O4 +
120788
120789H2O (21)
From Equation 21 the theoretical maximum yield of succinic acid on
glucose (YGLSA) is 112 gmiddotg-1 However it is not possible to achieve the
maximum yield because actual SA yield will depend on the active metabolic
pathway of the organism and the associated product distribution To
determine the maximum YGLSA possible with by-product formation a redox
balance is required
Pyruvate metabolism
Assuming that there is no carbon flux to cell growth and if only the PDH
enzyme is active or FDH converting all FA the overall black box
stoichiometry in converting glucose to SA and AA with no biomass
formation is
C6H12O6 + 120784
120785CO2rarr
120786
120785C4H6O4 +
120784
120785C2H4O2 (22)
Since no FA is formed the YAAFA will be 0 gmiddotg-1 This pathway releases one
molecule of NADH for every molecule of AA produced (see Figure 24) The
copycopy UUnniivveerrssiittyy ooff PPrreettoorriiaa
17
NADH would be consumed by the C4 pathway to produce SA and then the
theoretical YGLSA would be 088 gmiddotg-1
Figure 24 Simplified metabolic network of A succinogenes (PDH
active)
On the other hand if only the PFL enzyme is active both FA and AA will be
formed (see Figure 25) The overall black box stoichiometry in converting
glucose to SA AA and FA with no biomass formation is
C6H12O6 + CO2rarrC4H6O4 +C2H4O2 + CH2O2 (23)
For every molecule of FA formed a molecule of AA will be produced so the
YAAFA will be 076 gmiddotg-1 As a result YGLSA will be 066 gmiddotg-1 If both PFL and
FDH enzymes are active then FA will be broken down to produce CO2 and
NADH which will result in YAAFA being 0 gmiddotg-1 and YGLSA being 088 gmiddotg-1
copycopy UUnniivveerrssiittyy ooff PPrreettoorriiaa
18
Figure 25 Simplified metabolic network of A succinogenes (PFL
active)
Nevertheless as mentioned by Van Heerden amp Nicol (2013a)the maximum
theoretical yield of SA can be obtained through the metabolic engineering
of A succinogenes This can be achieved by manipulating the organism to
use the oxidative part of the tricarboxylic acid (TCA) cycle under anaerobic
conditions (see Figure 26a)
copycopy UUnniivveerrssiittyy ooff PPrreettoorriiaa
19
Figure 26 (a) Simplified metabolic network of A succinogenes
(oxidative TCA cycle active) (b) Simplified metabolic network of A
succinogenes (glyoxylate bypass active)
Alternatively the glyoxylate bypass can be utilised (Figure 26b) to give the
same result For both these scenarios the mass-based SA-to-glucose ratio is
112 gmiddotg-1 which is the maximum theoretical yield of SA that can be
achieved
25 Nitrogen source for A succinogenes
The composition of the growth medium is a key factor in microbial
fermentations An important element of the fermentation medium which
will be essential for the growth of the organism is the nitrogen source
In the rumen A succinogenes is surrounded by a massive source of
nutrients which allow the organism to thrive But outside the rumen more
specifically in the laboratory or in an industrial fermentation setup
copycopy UUnniivveerrssiittyy ooff PPrreettoorriiaa
20
nutrients important for growth of the organism must be provided Since
A succinogenes is auxotrophic it requires certain amino acids and vitamins
to be provided for growth and SA production McKinlay et al (2010)
determined the essential vitamins required for the growth to be nicotinic
acid pantothenate pyridoxine and thiamine and the needed amino acids to
be cysteine glutamate and methionine Furthermore they concluded that
it is able to grow without biotin supplementation
By contrast Xi et al (2012) declared the essential vitamins to be only biotin
and nicotinic acid and the essential amino acids to be only glutamate and
methionine Nevertheless the addition of these defined components makes
the growth medium expensive for industrial use (Shuler amp Kargi 2002 52)
This collection of vitamins and amino acids is thought to be better
introduced to the organism in a complex form (eg yeast extract or corn
steep liquor) where the components and concentration of the nitrogen-
carrying compounds are unknown A complex form of nitrogen source is
less expensive than a defined form and it is said to produce higher cell
growth compared with media with a defined nitrogen source (Shuler amp
Kargi 2002 52)
Batch fermentation studies
Table 21 lists batch studies that investigated alternative nitrogen sources
for SA production and A succinogenes growth From the studies that used
only one type of nitrogen source (either YE or YE amp CSL or CSL amp vitamins)
it can be seen that studies that used only YE generally had a lower YGLSA
compared with the studies that used a combination of YE and CSL as the
nitrogen source Addition of vitamins (Yan et al 2013) to CSL produced SA
copycopy UUnniivveerrssiittyy ooff PPrreettoorriiaa
21
yields and cell growth that were better than the results produced by the YE
and CSL combination
Studies that compared different nitrogen sources within the same study
such as Jiang et al (2010) and Shen et al (2015) compared the
performance of several nitrogen sources inorganic and organic and
observed the following
Inorganic nitrogen sources such as (NH4)2SO4 or NH4Cl were the
worst performing with regard to cell growth and SA yield (Jiang et al
2010)
YE as the only nitrogen source in a growth medium produced the
highest SA yield and the highest dry cell weight (DCW) in comparison
with other nitrogen sources (Jiang et al 2010 Shen et al 2015)
CSL a by-product of corn starch production as the only nitrogen
source in a growth medium was the second best performer (Jiang et
al 2010 Shen et al 2015)
CSL medium did not achieve full carbon substrate conversion
compared with YE medium at the end of the batch fermentation
(Jiang et al 2010 Shen et al 2015)
These studies suggested that the most promising nitrogen source in terms
of A succinogenes growth and SA yield from carbon substrate was yeast
extract (YE) YE is said to have various vitamins amino acids minerals and
trace metals that are necessary to stimulate the growth of A succinogenes
and synthesize its metabolites (Kasprow Lange amp Kirwan 1998) Although
YE is considered to be the best source of nitrogen its price ranges from
US$350kg to US$67kg (Kwon et al 2000 Sridee et al 2011) while the
copycopy UUnniivveerrssiittyy ooff PPrreettoorriiaa
22
price of CSL ranges from US$007kg to US$0075kg (Davis et al 2013)
which makes YE an expensive and unfeasible nitrogen source for long-term
industrial fermentation (Jiang et al 2010 Xi et al 2013 Shen et al 2015)
and CSL an economically viable alternative to YE The feasibility of CSL
feasibility as a nitrogen source was also investigated using microorganisms
such as Mannheimia succiniciproducens (MBEL55E) and Anaerobiospirillum
succiniciproducens Those studies (Lee et al 2000 2002) came to the same
conclusion as Jiang et al (2010) and Shen et al (2015) the inexpensive CSL
can replace the expensive YE as a nitrogen source to promote cell growth
and SA production
A possible reason why CSL proved to be second best to YE is because CSL
contained the cofactor biotin which is considered to be vitally important
for the metabolism of protein lipid and carbohydrate (Xi et al 2012) The
biotin content in CSL is 1 mgmiddotkg-1 and this is said to be sufficient to make a
significant contribution to the nutritional requirement of A succinogenes or
other microorganisms (Nghiem et al 1996) However Jiang et al (2010)
and Shen et al (2015) noticed that with CSL as a nitrogen source in
contrast to YE as the nitrogen source there was a significant amount of
residual glucose that remained at the end of the batch fermentation Shen
et al (2015) suggest that CSL may lack trace elements and certain nitrogen-
containing compounds that prevent A succinogenes from meeting its
normal physiological needs Another reason could be that the batch
fermentation time was not long enough for the CSL medium to reach full
carbohydrate consumption Since no profile of the variables over time was
given for these studies it is hard to determine whether the residual glucose
found in the CSL medium was due to a lack of nutrients or productivity
reduction
copycopy UUnniivveerrssiittyy ooff PPrreettoorriiaa
23
Xi et al (2013) stated that the heme and CSL combination in the production
medium improved SA production by creating a more reductive
environment (the initial redox potential was very low when heme was
added to the medium)
copycopy UUnniivveerrssiittyy ooff PPrreettoorriiaa
24
Table 21 Batch fermentation studies of A succinogenes using different nitrogen sources namely YE and CSL
Study Model Nitrogen source (gmiddotL-1)
Carbon Source
CSo (gmiddotL-1)
CSA (gmiddotL-1)
YGLSA
(gmiddotg-1) YAASA
(gmiddotg-1) YAAFA
(gmiddotg-1)
DCW
(gmiddotg-1)
Gunnarsson
Karakashevamp
Angelidaki (2014)
130Z YE(20) Synthetic
hydrolysate
36 30 083 86 058 25
Zhen et al (2009)
CGMCC
1593
YE(15) Straw
hydrolysate
58 455 0807 7583 083 56
Corona-Gonzalez et
al (2008)
130Z YE(10) Glucose 547 338 062 52 11 37
Liu et al (2008)
CGMCC
1593
YE(10) Sugarcane
molasses
644 464 072 77 3 5
Yan et al (2013)
CCTCC
M2012
036
CSL(25) amp
vitamins
mixture
Glucose 50 39 085 - - -
copycopy UUnniivveerrssiittyy ooff PPrreettoorriiaa
25
Study Model Nitrogen source (gmiddotL-1)
Carbon Source
CSo (gmiddotL-1)
CSA (gmiddotL-1)
YGLSA
(gmiddotg-1) YAASA
(gmiddotg-1) YAAFA
(gmiddotg-1)
DCW
(gmiddotg-1)
CCTCC
M2012
036
CSL(25) amp
vitamins
mixture
Glucose 100 881 088 - - -
Jiang et al (2014)
CGMCC
1716
YE(10) amp
CSL(5)
mixture
Sucrose 100 55 069 11 09 3
Chen et al (2010)
NJ113 YE(10) amp
CSL(5)
mixture
Glucose 50 42 084 - - -
Urbance et al
(2004)
130Z YE(6) amp
CSL (10)
mixture
Glucose 40 339 087 - - -
Urbance et al
(2003)
130Z YE(6) amp
CSL(10)
mixture
Glucose
20 174 087 - - -
copycopy UUnniivveerrssiittyy ooff PPrreettoorriiaa
26
Study Model Nitrogen source (gmiddotL-1)
Carbon Source
CSo (gmiddotL-1)
CSA (gmiddotL-1)
YGLSA
(gmiddotg-1) YAASA
(gmiddotg-1) YAAFA
(gmiddotg-1)
DCW
(gmiddotg-1)
Shen et al (2015) GXAS1
37
YE(12) Sugarcane
molasses
70 546 078 75 5 38
CSL(206) Sugarcane
molasses
70 479 068 76 573 3
Xi et al (2013)
NJ113 YE(10) amp
CSL(75)
mixture
Glucose 30 171 057 372 - 37
CSL (15) Glucose 30 151 050 458 - 31
CSL (15) amp
heme (0001)
mixture
Glucose 30 217 072 493 - 33
Jiang et al (2010)
NJ113 YE(15) Glucose 70 487 070 - - 45
CSL(15) Glucose 70 96 014 - - 21
copycopy UUnniivveerrssiittyy ooff PPrreettoorriiaa
27
Continuous fermentation studies
To date all continuous fermentation studies except the study done by Yan
et al (2014) used a combination YE and CSL (based on the revised SA
medium by Urbance et al 2003) as nitrogen sources None of these studies
investigated on the effect of varying the nitrogen sources type or the
concentration on SA productivity and cell growth In Table 22 it can be
seen that with a fixed combination of YE and CSL growth medium Maharaj
et al (2014) achieved the highest SA yield on glucose mass ratio and
highest SA concentration However Yan et al (2014) reported even YGLSA
and SA concentration and they used a combination of the inexpensive CSL
and defined vitamins
26 Continuous fermentation
In an economic context the need to produce large volumes of product is the
main reason for the selection of the continuous reactor mode preferably
one in which a wild strain acts as the biocatalyst to diminish mutation
problems (Villadsen et al 2011 384) Continuous systems are
advantageous also on a monetary scale because they have lower capital and
labour costs in comparison with batch production systems and since
continuous processes are time independent constant product quality is
more attainable compared with batch or fed-batch processes (Villadsen et
al 2011 384)
A unique aspect of continuous operation is the formation of biofilm which
is inevitable during pro-longed A succinogenes fermentations (Van
Heerden amp Nicol 2013 Maharaj amp Nicol 2014 Urbance et al 2003
copycopy UUnniivveerrssiittyy ooff PPrreettoorriiaa
28
Bradfield amp Nicol 2014 Brink amp Nicol 2014) Biofilms are microbial cell
layers that are embedded in self-produced exopolysacharide (EPS) which is
prone to attaching to surfaces Reactors with biofilms can be operated for
longer periods of time and are very economical because of the self-
immobilizing nature of A succinogenes which results in high volumetric
productivities (Rosche et al 2009)
It is well-known that the growth of A succinogenes is inhibited by the total
concentration of acids in the medium (Corona-Gonzaacutelez et al 2008 Lin et
al 2008 Urbance et al 2004) and therefore at a low throughput (or D)
growth of the organism will be slow since that is when high yields and acid
concentrations are found At a high D the biofilm is established at a quicker
rate but process instability is more severe (Maharaj amp Nicol 2014) The
excessive biofilm shedding at this point does not allow the system to reach
steady state easily and maintain it At a low D the effects seen with a high D
are not observed According to Bradfield amp Nicol (2014) the concentrations
produced at a low D are linked to the maintenance phase and therefore
only a small fraction of the biomass is replicating which allows the system
to reach and maintain steady state (Maharaj amp Nicol 2014)
copycopy UUnniivveerrssiittyy ooff PPrreettoorriiaa
29
Table 22 Continuous fermentation studies of A succinogenes using different nitrogen sources namely YE and CSL
Study Organism model
Nitrogen source
Dilution CSo (gmiddotL-1)
CSA (gmiddotL-1)
YGLSA
(gmiddotg-1) YAASA
(gmiddotg-1) YAAFA
(gmiddotg-1)
DCW
(gmiddotg-1)
Maharaj et al
(2014)
130Z YE(6) amp
CSL(10)
0054
071
326
141
09
080
-
-
-
-
-
-
Yan et al
(2014)
CCTCC
M2012036
CSL(25) amp
vitamins
01-04 188-
3996
084-
092
- - -
001-01 422-
636
072-
085
- - -
Van Heerden
and Nicol
(2013b)
130Z YE(6) amp
CSL(10)
049 13 071 25 077 -
Urbance et al
(2004)
130Z
YE(6) amp
CSL(10)
085
104
076
-
-
-
copycopy UUnniivveerrssiittyy ooff PPrreettoorriiaa
30
3 Materials and Methods
31 Microorganism and growth
Microorganism
In this study Actinobacillus succinogenes 130Z (DSM No 22257 or ATCC
No 55618) was used It was obtained from the German Collection of
Microorganisms and Cell Cultures (Braunschweig Germany) The culture
was stored in a cryopreservation solution at a temperature of ndash75 degC
Inoculum preparation
Inoculum was prepared by transferring 1 ml of the preserved culture to a
vial containing 15 ml of sterilized tryptone soy broth (TSB) The vial was
sealed and stored in an incubator at 37 degC with a shaker speed of 100 rpm
for a duration of 16ndash24 h The broth was later tested for contamination and
usability by performing an analysis with high-performance liquid
chromatography (HPLC) If the broth contained lactic acid or ethanol it was
considered to be contaminated and if a considerable amount of SA was
found in the broth then the culture was deemed to be viable
32 Fermentation media
All chemicals used to make the fermentation medium were obtained from
Merck KgaA (Darmstadt Germany) unless otherwise indicated The feed
medium consisted of three parts a growth medium a phosphate buffer and
copycopy UUnniivveerrssiittyy ooff PPrreettoorriiaa
31
a glucose solution The fermentation medium is based on the composition
proposed by Urbance et al (2003)
Six different growth media were used during the fermentation runs each
medium were composed of a different type andor concentration of
nitrogen sources The first medium used only yeast extract (YE) as the
nitrogen source and the last medium used only corn steep liquor (CSL) The
first run had approximately 33 gmiddotL-1of D-glucose added to the medium and
the last run had approximately 45 gmiddotL-1 of D-glucose added to the medium
Table 31 gives details of the components and the respective concentrations
used to make the feed media CO2(g) (Afrox Johannesburg South Africa)
was fed into the recycle line at 10 vvm to serve as the inorganic carbon
source
copycopy UUnniivveerrssiittyy ooff PPrreettoorriiaa
32
Table 31 Specifications of feed mediaa used during fermentations
Medium
1
Medium
2
Medium
3
Medium
4
Medium
5
Medium
6
Glucose (gmiddotL-1)
Runs 1 amp 2 33 33 33 33 33 33
Run 3 45 45 45 45 45 45
Growth (gmiddotL-1)
YE 16 10 6 3 1 0
CSL 0 6 10 13 15 16
YE ( of YE in
N2 source)d
100 625 375 1875 625 0
NaCl 1 1 1 1 1 1
MgCl2middot6H2O 02 02 02 02 02 02
CaCl22H2O 02 02 02 02 02 02
CH₃COONa 136 136 136 136 136 136
Na2Smiddot9H2O 016 016 016 016 016 016
Antifoam Ybc 1 1 1 1 1 1
Phosphate (gmiddotL-1)
K2HPO4 16 16 16 16 16 16
KH2PO4 32 32 32 32 32 32
a Based on Urbance et al (2003)
b Antifoam from Sigma-Aldrich St Louis USA
c Concentration is in mlmiddotL-1
d YE in N2 source is the of YE in the total complex nitrogen source in the medium
The concentration of the total complex nitrogen source (a combination of CSL and
powder YE) was 16 gmiddotL-1 throughout the fermentations for all runs
copycopy UUnniivveerrssiittyy ooff PPrreettoorriiaa
33
33 Bioreactor
The bioreactor pictured in Figure 31 (a amp b) was a glass cylindrical body
set between an aluminium base and head with an external recycle line to
provide agitation The working volume of the reactor (including recycle)
was 356 mL The liquid level in the reactor was maintained by using a
peristaltic pump on the product line All pumps used in the system were
peristaltic pumps A wooden stick covered in terry cloth was inserted in the
glass cylindrical body for biofilm attachment In fermentation run1 and
run2 one stick was used and in fermentation run 3 three sticks were used
CO2 flow rates were controlled using Brooks 5850S mass flow controllers
(Brooks Instrument Hungary) and the CO2 entered the reactor via an inlet
in the recycle line which was connected to a 02 μm PTFE membrane filter
(Midisart 2000 Sartorius Goumlttingen Germany) The gas exited the system
through a filter with the same specifications as mentioned earlier
connected to the foam-trap
The pH was measured using a CPS 71D-7TB21 glass combination probe
(Endress+Hauser Gerlingen Germany) held within a stainless-steel holder
connected in-line within the recycle stream Maintaining the pH at 68
required the use of a Liquiline CM442 (Endress+Hauser Gerlingen
Germany) in which an internal relay controlled the dosing of 10 M
unsterilized NaOH in an onndashoff fashion Temperature was controlled in a
similar fashion a hotplate was used to provide the heat required to
maintain the temperature at 37 degC For better control of temperature
fluctuations the hotplate was linked to the National Instrument (NI)
module The NI module is further discussed in Section 35
copycopy UUnniivveerrssiittyy ooff PPrreettoorriiaa
34
Figure 31a) Simplified schematic of bioreactor setup
No Description
1 Gas filter
2 Foam-trap 3 Medium
reservoir 1 4 Antifoam
reservoir 5 Medium
reservoir 2 6 Inoculation
septum 7 Reactor body 8 Hot plate 9 Temperature
control 10 pH probe 11 Product
reservoir 12 NaOH reservoir 13 CO2 cylinder 14 Controller 15 Recycle pump 16 Dosing pump
17 Gas flow controller
8
7
2
3
4
5
11
12
13
17
T pH
6
C
DAQ
PC
1
9 10
14
15
16
copycopy UUnniivveerrssiittyy ooff PPrreettoorriiaa
35
Figure 31b) Bioreactor setup
copycopy UUnniivveerrssiittyy ooff PPrreettoorriiaa
36
34 Fermentation procedure
The three parts of the fermentation medium (growth medium buffer and
glucose) were prepared in separate bottles and were autoclaved at 121degC
for 60 minutes To prevent unwanted reactions amongst the medium
components the three parts of the medium were only mixed once the
bottles had cooled to room temperature (approx 24 degC) The reactor
system (excluding NaOH) was also autoclaved at the same temperature and
duration as stated above
The first fermentation medium (see Table 31) was used to start up the
fermentation It had only YE as the nitrogen source This was done to form
a substantial amount of biofilm for full glucose consumption The feed
setup was then connected to the sterile reactor system with a sterile
coupling The coupling consisted of a U-connection one half of which was
fixed to the feed setup and the other half to the reactor system Each half of
the connection had a ball valve to isolate the system from the external
environment The half connections were then coupled and placed in an oil
bath at 140 degC for 20 minutes The reactor was then filled with medium and
once the temperature and pH had stabilized to 37degC and 68 respectively
10 mL of inoculum was injected into the reactor through a silicon septum
attached to the reactor head
Fermentations were started off by operating the system at batch conditions
for 17 hours and then changing to continuous operation at a low dilution
rate This allowed for cell accumulation and prevented cell washout
Addition of antifoam into the reactor was only done when deemed
necessary The recycle flow rate was kept constant at 500 mLmiddotmin-1 in all
fermentations to maintain similar shear conditions The CO2 flow rate was
copycopy UUnniivveerrssiittyy ooff PPrreettoorriiaa
37
set at a vvm of 10 as it seemed sufficient to maintain CO2 saturation in the
reactor After a few days of operation biofilm appeared on internal surface
of the bioreactor as well as the wooden stick covered in terry cloth which
was inserted into the glass cylinder as the intended surface for biofilm
attachment
Controlled variables
Dilution rates for the fermentation runs were determined using the first
fermentation medium Once biofilm had formed in the reactor after a few
days of continuous operation the dilution rate was adjusted until 95 of
initial glucose had been consumed For R3 90 was the target for glucose
consumption The dilution rate was fixed for the entire experimental run if
the above mentioned glucose consumption stayed more or less constant for
three days or more
Media change during fermentation
Similar to the feed connection to the reactor the different medium setups
were connected to the sterile reactor system with another sterile coupling
The half connections were then coupled and the U-connection was placed
in an oil bath at 140 degC for 40 minutes
35 Online monitoring
Monitoring of the process was performed in a similar fashion to that of Van
Heerden and Nicol (2013b) in which the time-averaged NaOH dosing
copycopy UUnniivveerrssiittyy ooff PPrreettoorriiaa
38
fraction was linked to a productivity factor allowing an estimated SA
concentration to be calculated in real-time A LabVIEW (NI module)
program was used to monitor and control the reactor The program was
linked to the reactor instrumentation using a cDAQ-9184 data acquisition
device (National Instruments Hungary) with voltage and current input
modules and a current output module Temperature dosing and antifoam
flowrates were controlled with the program Temperature pH gas flow
rates and the time-averaged dosing of NaOH were recorded through the
program
36 Analytical methods
HPLC analysis
High-performance liquid chromatography (HPLC) was used to determine
the concentrations of glucose SA and other organic acids Analyses were
done using an Agilent 1260 Infinity HPLC (Agilent Technologies USA)
equipped with an RI detector and a 300 mm times 78 mm Aminex HPX-87 H
ion-exchange column (Bio-Rad Laboratories USA) The mobile phase (03
mLmiddotL-1 and 11 mLmiddotL-1H2SO4) flowrate was 06 mLmiddotmin-1 and the column
temperature was 60degC
Suspended cell analysis
Once the reactor had reached a steady state the product stream was
collected in a bottle that was kept in a small bar refrigerator The product
bottle was kept cool to prevent further growth of cells and metabolic
activity and depending on the dilution rate the duration of the collection
period varied from 12 to 72 hours The collected volume was then
copycopy UUnniivveerrssiittyy ooff PPrreettoorriiaa
39
thoroughly mixed and a 12 mL sample was collected for suspended cell
analysis This was performed by splitting the 12 mL sample into 12 x 1 mL
samples and centrifuging at 4000 rpm for 2 minutes The samples were
centrifuged three times and after each centrifugation the supernatant was
poured out and the cell precipitate washed in distilled water Following the
third centrifugation the cell precipitates were transferred to an empty
glass vial that had been measured beforehand The cell precipitates were
then dried to a constant weight in an 85 degC oven
Mass balance analysis
Overall mass balances were performed to assess the accuracy of each
sample The mass balances were performed by comparing the
stoichiometric amount of glucose required to achieve the experimental
concentrations of SA AA and FA with the experimental amount of glucose
consumed
37 Steady state check
When the time-averaged dosing profile constructed by the LabVIEW
program ceased to fluctuate by a 5 standard deviation of the average
dosing flow it was assumed that the system had reached pseudo-steady
state and the product stream was sampled To further ascertain steady
state the glucose and organic acid concentrations in product samples
frequently taken over a certain period were compared and if negligible
differences were found between the sample data the system was
confirmed to be at steady state
copycopy UUnniivveerrssiittyy ooff PPrreettoorriiaa
40
38 Summary of fermentation
Results were obtained over three continuous fermentation runs Several
other runs were attempted but did not provide any results that were
valuable due to upsets encountered in the system The three runs
mentioned in Table 32 were conducted to prove the repeatability of trends
observed in the first fermentation run
Table 32 Summary of fermentation runs performed
Five different mediums each with a glucose concentration of 33 gmiddotL-1 were
used in fermentation run 1 (R1) This gave an indication of what the
general trend would be of the product distribution The dilution rate was
adjusted until steady state was achieved with only 5 of initial glucose
concentration as residual for the first medium Therefore with the 33 gmiddotL-1
initial glucose a Df of 008 h-1 was set Fermentation run 2 (R2) was
conducted to prove the repeatability of the trend seen in R1 Fermentation
run 3 (R3) was conducted with six different media at a glucose
concentration of 45 gmiddotL-1 and 90 glucose conversion was only achieved
when the Df was lowered to 0041 h-1
Run Operating
hours (h)
Glucose
(gmiddotL-1)
Df
(h-1) Medium No
1 1 008 33 0080 1 2 3 4 5 -
2 1 104 33 0045 1 3 5 - - -
3 1 272 45 0041 1 2 3 4 5 6
copycopy UUnniivveerrssiittyy ooff PPrreettoorriiaa
41
Biofilm attachment and appearance
Approximately 72 hours after inoculation of the bioreactor biofilm started
forming on the glass wall of the reactor A substantial amount of biofilm
inside the bioreactor only formed after plusmn 330 operating hours The
structure and the amount of the biofilm varied throughout the
fermentations and it appeared that the biofilm was dependent on the
following
the surface to which it is attached
the history of the fermentation
the composition of the fermentation medium
Figure 32 (a) shows the bioreactor before inoculation and without cell
attachment After operation for more than 330 hours using only YE as the
nitrogen source a thick mass of biofilm had formed as shown in Figure
32 (b) However as the CSL concentration on the fermentation medium
increased more biofilm started to shed and eventually when only CSL was
used at the nitrogen source there was almost no biofilm attachment on the
glass surface of the bioreactor (as seen in Figure 32 (c))
Although there was not much biofilm on the glass surface there was
biofilm on the internals of the reactor (the wooden sticks covered in terry
cloth) Figure 33 (a amp b) illustrates the sticks covered in biomass at the end
of the fermentations
copycopy UUnniivveerrssiittyy ooff PPrreettoorriiaa
42
Figure 32 a) Bioreactor before inoculation b) Biofilm growth using
only YE as nitrogen source c) Bioreactor with only CSL as nitrogen source
(a) (b) (c)
copycopy UUnniivveerrssiittyy ooff PPrreettoorriiaa
43
Figure 33 a) Internal support for biofilm attachment (at the end of
fermentation run 1) b)Internal supports for biofilm attachment (at the end
of fermentation run 3)
(a) (b)
copycopy UUnniivveerrssiittyy ooff PPrreettoorriiaa
44
4 Results and Discussion
41 Experimental strategy for different runs
The objective of R1 (fermentation run 1) was to find steady state data that
could be analysed to understand the influence of YE and CSL on the growth
and productivity of A succinogenes As seen in Table 31 the media used in
the experiments differed from each other regarding the concentrations of
CSL and YE but the total complex nitrogen source concentration in the
media remained constant The intended experimental plan was to report
the steady state product concentrations as the concentration of YE in the
growth medium varied (ie as the YE concentration decreased and the CSL
concentration increased) R2 (fermentation run 2) which followed the
same procedure as R1 was conducted to prove that the data found in R1
was repeatable R3 (fermentation run 3) was an attempt to achieve high SA
concentrations following the same experimental plan as R1 except that R3
used a high initial glucose feed concentration and had additional internal
support to increase the surface area available for biofilm attachments
All fermentations began with a growth medium that contained only YE as
the nitrogen source (100 YE) and once a healthy and stable biofilm had
formed the growth media were changed according to the procedure
explained in Section 34 Fermentation procedure
Initially R1 had a high biomass content and activity (when only YE was in
the fermentation medium) and as the YE content in the growth medium
decreased the biomass activity decreased R2 was effectively a repetition
of R1 but due to the low initial biomass activity the dilution rate was
adjusted to have approx 95 glucose conversion (when the growth
copycopy UUnniivveerrssiittyy ooff PPrreettoorriiaa
45
medium had only YE as the nitrogen source) Despite the increased surface
area for biofilm attachment the biomass in R3 struggled to achieve the
same activity as R1 Initially the SA concentration was slightly higher but
eventually the results of R3 coincided with those of R2 when CSL was
introduced into the growth medium The dilution rate for R3 could have
been lowered further to reach higher product concentrations but it was
decided not to do this due to time constraints for achieving steady state
Table 41 gives the steady state results for all three runs
copycopy UUnniivveerrssiittyy ooff PPrreettoorriiaa
46
Table 41 Steady state data for the three continuous fermentation runs
Dilution
(h-1)
SA
(gmiddotL-1) AA (gmiddotL-1) FA (gmiddotL-1)
PYR
(gmiddotL-1)
Δ GLC
(gmiddotL-1)
YE ( in nitrogen
source)
Black box mass
balance ()
Average black box
mass balance ()
Average black box
mass balance ()
with DCW
Fermentation run 1
008 1731 814 608 048 3041 10000 8529
008 1685 816 619 050 3067 10000 8347
009 1671 800 612 051 3059 10000 8269 8382
008 1860 702 449 066 2916 6250 8777
008 1872 667 435 079 2917 6250 8716 8747 9581
008 1764 492 263 045 2619 3750 8343
008 1792 494 251 033 2596 3750 8473
008 1778 498 259 031 2596 3750 8441 8419
008 1691 359 183 178 2152 1875 9646
008 1696 349 168 175 2223 1875 9278
008 1669 353 170 172 2107 1875 9687 9537
008 1565 239 064 224 1855 625 9935
008 1411 192 048 290 1808 625 9459
008 1328 176 056 293 1822 625 8921 9438
copycopy UUnniivveerrssiittyy ooff PPrreettoorriiaa
47
Dilution
(h-1)
SA
(gmiddotL-1) AA (gmiddotL-1) FA (gmiddotL-1)
PYR
(gmiddotL-1)
Δ GLC
(gmiddotL-1)
YE ( in nitrogen
source)
Black box mass
balance ()
Average black box
mass balance ()
Average black box
mass balance ()
with DCW
Fermentation Run 2
004 1780 852 569 051 2954 10000 9023
004 1853 878 569 044 2972 10000 9256
004 1874 897 585 040 3004 10000 9287 9189
004 1796 564 248 042 2489 3750 9154
004 1759 582 263 035 2354 3750 9616
004 1760 570 228 038 2561 3750 8760 9177
004 1175 290 071 201 1447 625 10575
004 1106 289 074 199 1455 625 10081
004 1080 283 071 202 1390 625 10357 10338
Fermentation Run 3
004 2253 1022 493 026 3695 10000 8686
004 2257 1009 499 023 3673 10000 8711
004 2205 976 477 025 3656 10000 8522 8640 9138
004 1927 787 298 000 3043 6250 8538
004 1970 803 306 007 3221 6250 8266
004 1991 820 335 005 3242 6250 8344 8383 9213
004 1785 604 128 063 2998 3750 8583
copycopy UUnniivveerrssiittyy ooff PPrreettoorriiaa
48
Dilution
(h-1)
SA
(gmiddotL-1) AA (gmiddotL-1) FA (gmiddotL-1)
PYR
(gmiddotL-1)
Δ GLC
(gmiddotL-1)
YE ( in nitrogen
source)
Black box mass
balance ()
Average black box
mass balance ()
Average black box
mass balance ()
with DCW
004 1879 615 131 069 3092 3750 8572 8568 8974
004 1635 493 028 067 2635 1875 8718
004 1628 486 022 077 2605 1875 8644
004 1578 455 036 080 2664 1875 8431 8598 9919
004 1159 295 000 082 1489 625 9255
004 1110 286 000 098 1955 625 8545
004 1104 275 000 099 1419 625 9630
004 1044 259 000 114 1433 625 8908 9085 11240
004 817 137 000 177 1582 000 6186
004 709 086 000 237 1425 000 8691
004 725 072 000 249 1457 000 6140
004 712 080 000 273 1271 000 7161 7045 7234
copycopy UUnniivveerrssiittyy ooff PPrreettoorriiaa
49
Mass balances or redox balances were performed on all the samples and
the average closures of the steady state samples are shown in Table 41
Mass balance closure did increase as the YE content decreased In R3
DCWs were taken to see if the mass balance closure would reach 100
Including the DCWs significantly improved the mass balance but did not
close it Anything above 90 was considered a proper closure and most
figures that were below 100 may indicate unknown metabolites or non-
perfect analysis of acids and sugars
42 Productivity analysis
Figure 41 shows the average concentrations of SA AA and FA in the
product streams at steady state for all fermentation runs For a clear
comparison of the metabolite concentrations of all the fermentation runs
the results were put into a single plot despite the differences in dilution
rate and glucose feed concentration The reasons for the difference in
dilution rates were explained in Section 41
copycopy UUnniivveerrssiittyy ooff PPrreettoorriiaa
50
R1
R2
R3
SA
FA
AA
Figure 41
(See Table 31)
Figure 42 depicts how SA productivity and the glucose consumption rate
changed as the YE concentration decreased
0
2
4
6
8
10
12
14
16
18
20
22
24
0 10 20 30 40 50 60 70 80 90 100
Co
nce
ntr
atio
n(g
middotL-1
)
YE in Nitrogen Source
Figure 41 Product concentration profiles for SA AA and FA of
A succinogenes as the YE in the growth media varied
The total nitrogen source (combination of YE and CSL) concentration in the
growth medium stayed constant at 16 gmiddotL-1only the concentrations of YE (powder
form) and CSL (liquid form) varied
Commented [B1] In order for the very long captions for Figures 41 to 46 NOT to show in the automatic List of Figures Ive converted the detailed descriptions to normal text
copycopy UUnniivveerrssiittyy ooff PPrreettoorriiaa
51
R1
R2
R3
Productivity SA
Glucose
consumption rate
Figure 42SA productivity profile and glucose consumption rat
A succinogenes as the YE in the growth media varied
(See Table 31)
SA concentration decreased as the concentration of YE was reduced in the
medium When only YE was used as the nitrogen source which is an ideal
ingredient for A succinogenes growth and SA productivity the highest SA
concentration for R2 and R3 was achieved For R1 the SA concentration
was at its highest when the 625 of YE medium was used Despite the
difference in glucose concentration SA concentrations for R1 R2 and R3
0
02
04
06
08
1
12
14
16
18
2
22
24
26
28
3
0
02
04
06
08
1
12
14
16
0 10 20 30 40 50 60 70 80 90 100
Glu
cose
co
nsu
mp
tio
n r
ate
(gL
hr)
Pro
du
ctiv
ity
SA
(gmiddotL
-1middoth
r-1))
of YE in Nitrogen source
Figure 42 SA productivity profile and glucose consumption rate
profiles of A succinogenes as the YE in the growth media varied
The total nitrogen source (combination of YE and CSL) concentration in the
growth medium stayed constant at 16 gmiddotL-1 only the concentrations of YE
(powder form) and CSL(liquid form) varied
copycopy UUnniivveerrssiittyy ooff PPrreettoorriiaa
52
were similar when CSL was added to the medium R3 started with a high SA
concentration as expected but then quickly dropped and displayed the
trend observed in R1 and R2 AA and FA both decreased as the YE content
in the medium decreased for all runs The concentrations for both FA and
AA more or less matched in all runs irrespective of the dilution rate and
the glucose feed concentration When only CSL was used as the nitrogen
source in the growth medium in R3 no FA was produced
The SA productivity trend shown in Figure 42 is the same as the SA
concentration profile The highest SA productivity obtained in this study
was 158 gmiddotL-1middoth-1 when a 625 YE medium was used as the nitrogen
source From Figure 42 it should be clear that the productivities of R1
were almost twice as high as the productivities of R2 The same can be said
for the glucose consumption rates for R1 and R2 This is because the
dilution rate of R1 was also twice as much as the dilution rate of R2
According to Maharaj et al (2014) a decrease in dilution should lead to an
increase in product concentrations and yields R1 and R2 do not follow that
trend Instead their product concentrations profile matched A possible
reason for the inconsistency in the trends could be that there was less
biofilm activity in R2 for an unknown reason compared with the biofilm
activity in R1 resulting in a product concentrations profile match instead of
higher product concentrations in R2 compared with the profile for R1
43 Analysis of product distribution
Metabolite concentrations were used to determine and study the product
distributions YAASA YAAFA and YGLSA of the three fermentations
copycopy UUnniivveerrssiittyy ooff PPrreettoorriiaa
53
In Section 24 the theoretical metabolic flux limitations were discussed and
it was noted that in the absence of biomass formation the maximum
theoretical values for YAASA and YGLSA should be 393gmiddotg-1 and 088 gmiddotg-1
respectively These yields would only be achieved if no FA was produced
ie if only PDH was active However if the PFL route was active and all of
the FA was converted to CO2 and NADH by FDH then the maximum
theoretical yields mentioned earlier could be still achieved If biomass is
produced then a portion of the glucose in the growth medium would be
directed to the anabolic pathway which would influence the carbon
distribution resulting in maximum yields less than those given above
It is illustrated in Figure 43 that YAASA should vary between 197 gmiddotgminus1 (for
YAAFA = 077 gmiddotgminus1) and 393 gmiddotg-1 (for YAAFA = 0 gmiddotgminus1) Using only YE as the
nitrogen source the experimental yields for all runs matched the maximum
theoretical yields that were obtained when only the PFL enzyme was
active As the nitrogen source content varied (ie CSL concentration
increased and YE concentration decreased) YAASA increased and YAAFA
decreased thus indicating a shift in the metabolic flux distribution YAASA for
R2 and R3 were similar throughout the runs so was YAAFA However when
the YE concentration in the nitrogen source was 1875 for R1 and R3
YAASA exceeded the maximum theoretical yield while YAAFA was still in the
range of 0 gmiddotg-1 to 077 gmiddotg-1 The highest YAASA achieved in this study was 83
gmiddotg-1 and the lowest YAAFA was 0 gmiddotg-1 as seen in Figure 43 these yields
were obtained in R3 when only CSL was used as the nitrogen source
Certain batch studies in A succinogenes also achieved a YAASA that exceeded
the maximum theoretical yield (see Section 26 Table 21) but those
studies used YE as the nitrogen source whereas in this study it was
copycopy UUnniivveerrssiittyy ooff PPrreettoorriiaa
54
achieved using only CSL Xi et al (2013) was the only study (batch
fermentation) mentioned in Table 21 that used only CSL as the nitrogen
source with glucose as the carbon substrate and exceeded the maximum
theoretical YAASA They attained a YAASA of 458 gmiddotg-1
copycopy UUnniivveerrssiittyy ooff PPrreettoorriiaa
55
R1
R2
R3
SAAA
FAAA
Figure 43 Experimental yields plotted with the maximum theoretical yields
profile of A succinogenes as YE in medium changes
Considering the flux at the pyruvate node YAAFA decreased and was
approaching zero as the CSL concentration in the nitrogen source
increased as seen in Figure 43 This could be an outcome of an increase in
either PDH or FDH activity or a decrease in activity for both PDH and PFL
resulting in an increased concentration of pyruvate in the product stream
Figure 44 illustrates how the pyruvate concentration increased as the CSL
concentration in the growth medium increased
0
05
1
15
2
25
3
35
4
45
5
55
6
65
7
75
8
85
9
0 10 20 30 40 50 60 70 80 90 100
Mas
s ra
tio
(g
g-1)
YE in Nitrogen Source
SAAA max (PFL)
FAAA max (PFL)
SAAA max (PDH)
FAAA max (PDH)
Figure 43 Experimental yields plotted with the maximum theoretical
yields profile of A succinogenes as YE in medium changes
The total nitrogen source (combination of YE and CSL) concentration in the
growth medium stayed constant at 16 gmiddotL-1 only the concentrations of YE
(powder form) and CSL(liquid form) varied
copycopy UUnniivveerrssiittyy ooff PPrreettoorriiaa
56
(See Table 31)
According to the redox balance it is expected that YAASA would increase as
YAAFA decreased and in this study the same development was observed
This could be linked to the increasing CSL concentration in the nitrogen
source in this study Bradfield amp Nicol (2014) suggested that there could be
an additional reducing power that produced the yields that were achieved
Using carbon and redox balances they noticed in their study that the
experimental YAASA values exceeded the predicted values suggesting that an
increase in PDH or FDH activity was not the only contribution to the
increase in YAASA and that additional reducing power was present The same
0
02
04
06
08
1
12
14
16
18
2
22
24
26
28
3
0 10 20 30 40 50 60 70 80 90 100
Co
nce
ntr
atio
n(g
L)
YE in Nitrogen Source
PYR R1
PYR R2
PYR R3
Figure 44 Pyruvate concentration profile of A succinogenes as YE in
medium changes
The total nitrogen source (combination of YE and CSL) concentration in the
growth medium stayed constant at 16 gmiddotL-1 only the concentrations of YE
(powder form) and CSL(liquid form) varied
copycopy UUnniivveerrssiittyy ooff PPrreettoorriiaa
57
explanation can be applied to this study as seen in Figure 43 The increase
in the YAASA is influenced by the decrease in the YAAFA ratio although it is not
sufficient to reach the expected ratios (according to the redox balance)
(See Table 31)
Figure 45 illustrates the NADH consumed per NADH produced for all
fermentation runs The NADH consumed (mol NADHmiddotcmol glucose-1) was
calculated as follow
09
1
11
12
13
14
15
16
17
18
19
2
0 10 20 30 40 50 60 70 80 90 100
NA
DH
Co
nsu
med
NA
DH
Pro
du
ced
of YE in Nitrogen source
NADH R1
NADH R2
NADH R3
Figure 45 NADH ratio consumed during production of A succinogenes
as YE in medium changes
The total nitrogen source (combination of YE and CSL) concentration in the
growth medium stayed constant at 16 gmiddotL-1 only the concentrations of YE
(powder form) and CSL(liquid form) varied
copycopy UUnniivveerrssiittyy ooff PPrreettoorriiaa
58
2119862119878119860119872119872119878119860
6∆119866119871119862119872119872119866119871119862
frasl (41)
Using Figure 2 Equation 41 was generated The only pathway that
consumed NADH was the path that converted PEP to SA where 2 molecules
of NADH were consumed to produce 1 molecule of SA
The NADH (mol NADHmiddotcmol glucose-1) produced was calculated as follow
(119862119878119860
119872119872119878119860+
2119862119860119860
119872119872119860119860minus
119862119865119860
119872119872119865119860)
6∆119866119871119862
119872119872119866119871119862
frasl (42)
The path from glucose to PEP produced 2 molecules of NADH per one
glucose molecule consumed and from PYR to AA 1 molecule of NADH per
one AA molecule was produced All the inputs for these equations were the
product concentrations obtained from the experimental runs
In Figure 45 it is noted that for all the fermentation runs the ratio of NADH
consumed to NADH produced increased as the concentration of YE in the
growth medium increased Nevertheless there is a clear dissimilarity
between the three runs In R3 the NADH production was higher than the
consumption for all growth media except when only CSL was used as the
nitrogen source R2 and R3 in comparison with R1 did not display a
massive imbalance in the NADH ratio and R1 was the only run where NADH
consumed over produced ratio consistently increased significantly as the
YE content in the growth medium increased It appears that the additional
NADH generation capability of R1 was not fully present in R2 and R3 and
possibly the strains used in R2 and R3 had altered production
copycopy UUnniivveerrssiittyy ooff PPrreettoorriiaa
59
characteristics compared with the original strain Nevertheless the R1
results coincide with the observation of both Bradfield amp Nicol (2014) and
Brink amp Nicol (2014) which was that there was an ldquoexcessrdquo of NADH that
was consumed during the maintenance phasenon-growth phase resulting
in a high YAASA
copycopy UUnniivveerrssiittyy ooff PPrreettoorriiaa
60
(See Table 31)
Figure 46 illustrates the yield of SA on glucose for R1 This graph shows
how the flux from glucose to SA increases as the CSL concentration in the
growth medium increases The trend observed in Figure 46 can be linked
to the ldquoexcessrdquo NADH that favours the production of SA Xi et al (2013)
observed that using only CSL as the nitrogen source provided high
selectivity towards SA (458 gmiddotgminus1) in comparison with other by-products
On the other hand CSL with heme provided a high glucose-to-SA flux
(072 gmiddotgminus1) and a much higher YAASA (493 gmiddotgminus1) A similar observation was
04
043
046
049
052
055
058
061
064
067
07
073
076
079
082
085
088
0 10 20 30 40 50 60 70 80 90 100
Mas
s ra
tio
(g
g-1)
YE in Nitrogen Source
SAGL R1
SAGL max(PFL)SAGL max(PDH)
Figure 46 Mass ratio of succinic acid over glucose profile of
A succinogenes as YE in medium changes
The total nitrogen source (combination of YE and CSL) concentration in the
growth medium stayed constant at 16 gmiddotL-1 only the concentrations of YE
(powder form) and CSL(liquid form) varied
copycopy UUnniivveerrssiittyy ooff PPrreettoorriiaa
61
documented by Yan et al (2013) Xi et al (2012) tried to explain this
observation in their study by stating that CSL contained cofactor biotin
which promoted the high SA selectivity
It is reasonable to postulate that there is an ingredient in CSL that may
trigger or enhance the activity of an additional metabolic pathway known
as the pentose phosphate pathway (PPP) to produce high carbon flux to SA
and high SA selectivity The idea of PPP as the source of the additional
reducing power stems from the findings of Bradfield and Nicol (2014)
Their analysis has shown that if the NADPH generated in the PPP cycle is
converted to NADH in order to supply redox to the SA pathway then high
SA selectivity can be achieved A succinogenes has the transhydrogenase
that allows PPP to be active and as mentioned earlier the presence or
absence of one or more ingredients in CSL may allow this enzyme to be
active consequently activating the PPP as well
Xi et al (2012) did mention biotin as the culprit for the high SA selectivity
They investigated the influence of biotin on A succinogenes growth and SA
productivity by varying the biotin concentration in a chemically defined
medium There was no SA production and cell growth was severely
inhibited when biotin was absent from the growth medium They reported
a high SA yield in their study but their data for AA concentration YGLAA and
YAASA were inconsistent with their observed product concentrations The
following example is extracted from their results In the experiment using
8 mg L-1biotin the glucose consumed was 300 g L-1 CSA = 194 g L-1 CAA =
32 g L-1 YGLAA = 0203 g g-1 and YAASA = 61 g g-1 However the YGLAA should
have been 0107 gmiddotg-1 if CAA was reported correctly but if the value for YAASA
was used as the value of CAA then the reported YGLAA would be correct
copycopy UUnniivveerrssiittyy ooff PPrreettoorriiaa
62
Nevertheless because of the inconsistency of the data it cannot be
concluded that biotin did play a role in gaining a high SA yield
Either the presence or absence of a component in a growth medium can
influence the enzymatic activity of a pathway and this concept should be
used to postulate explanations for the results obtained in this study
A breakdown of the constituents of CSL and YE could help in identifying the
ingredients in CSL that may have triggered or enhanced the activity of the
PPP Since both CSL and YE are complex media and there is no definite
information on the ingredients it is hard to fully confirm the following
theory
Xiao et al (2013) did a study on the constituents of CSL and stated that any
grade of CSL has the following amino acids isoleucine asparagine
methionine lysine proline and aspartic acid YE was reported by an
industrial data sheet (Organotechniereg SAS France) to have a high
content of the following alanine isoleucine leucine methionine
phenylalanine tyrosine and valine Although there are common amino
acids shared between CSL and YE there is one amino acid YE has that is
absent from CSL namely leucine This could be a reason why CSL could be
related to the excess NADH
Leucine in Ecoli is said to repress the transhydrogenase activity which in
turn represses the PPP (Gerolimatos amp Hanson 1978) This could be true
for A succinogenes since it also has the transhydrogenase for PPP as
mentioned in Section 23 A succinogenes with only YE as the nitrogen
source produced yields that were expected according to the carbon and
redox balance It can be postulated that as the YE content reduce the
copycopy UUnniivveerrssiittyy ooff PPrreettoorriiaa
63
leucine content decreased and the activity of the transhydrogenase
increased causing additional NADH to be generated from the enhanced
PPP resulting in improved yields
copycopy UUnniivveerrssiittyy ooff PPrreettoorriiaa
64
5 Conclusions
The complex nitrogen requirements of non-growing A succinogenes
biofilms were evaluated The study restricted itself to the use of YE and CSL
as nitrogen sources The SA productivity yields and titre were the variables
assessed
The YE concentration was decreased while simultaneously increasing the
CSL concentration in the medium Although this led to a decrease in the
steady state productivity of the organism overall SA selectivity increased
The production of certain metabolites such as SA and pyruvate also
increased while FA and AA concentrations decreased in the increasing
absence of YE This led to an increase in the SA to AA mass ratio and to a
decrease in the FA to AA mass ratio When zero amounts of YE were in the
growth medium no FA was produced
Three fermentation runs were performed The highest SA concentration in
this study was 2257gmiddotL-1 when only YE was used as the nitrogen source in
the growth medium and the highest SA productivity obtained in this study
was 158 gmiddotL-1middoth-1 when a combination of YE(625) and CSL(375) was
used as the nitrogen sourceThe highest SA to AA mass ratio achieved was
83 gmiddotg-1 when only CSL was used as the nitrogen source The FA to AA
mass ratio was consistently less than 077 gmiddotg-1 approaching 0 gmiddotg-1 as the
CSL concentration in the nitrogen source increased
Lower FA to AA mass ratio values were not fully responsible for the
increase in the SA to AA mass ratio The surplus NADH required is provided
copycopy UUnniivveerrssiittyy ooff PPrreettoorriiaa
65
by the activation or enhancement of an alternative metabolic pathway ie
the pentose phosphate pathway
The observations made in this study bolster the idea of using a combination
of YE and CSL where YE is the minor component as the nitrogen source for
commercialisation of bio-based succinic acid production using
Asuccinogenes as the catalyst
copycopy UUnniivveerrssiittyy ooff PPrreettoorriiaa
66
6 References
Allied Market Research (2014) ldquoWorld bio succinic acid market ndash
Opportunities and forecasts 2013ndash2020rdquo [Online]
httpswwwalliedmarketresearchcombio-succinic-acid-market
Beauprez JJ De Mey M and Soetaert WK (2010) ldquoMicrobial succinic acid
production natural versus metabolic engineered producersrdquo Process
Biochem451103ndash1114
Bechthold I Bretz K Kabasci S Kopitzky R and Springer A (2008)
ldquoSuccinic acid a new platform chemical for biobased polymers from
renewable resourcesrdquo Chem Eng Technol 31647ndash654
BioConSepT (2013) ldquoDetermination of market potential for selected
platform chemicalsrdquo [Online] httpwwwbioconsepteuwp-
contentuploadsBioConSepT_Market-potential-for-selected-platform-
chemicals_ppt1pdf
Bozell JJ and Petersen GR (2010) ldquoTechnology development for the
production of biobased products from biorefinery carbohydrates ndash the US
Department of Energyrsquos ldquoTop 10rdquorevisitedrdquo Green Chem 12539ndash554
Bradfield MFA and Nicol W (2014) ldquoContinuous succinic acid production
by Actinobacillus succinogenes in a biofilm reactor steady-state metabolic
flux variationrdquo Biochem Eng J 851ndash7
copycopy UUnniivveerrssiittyy ooff PPrreettoorriiaa
67
Brink HG and Nicol W (2014) ldquoSuccinic acid production with Actinobacillus
succinogenes Rate and yield analysis of chemostat and biofilm culturesrdquo
Microb Cell Fact 13111-122
Chen K Jiang M Wei P Yao J and Wu H (2010)rdquoSuccinic acid production
from acid hydrolysate of corn fiber by Actinobacillus succinogenesrdquo Appl
Biochem Biotechnol 160477ndash485
Cok B Tsiropoulos I Roes AL and Patel MK (2014) ldquoSuccinic acid
production derived from carbohydrates An energy and greenhouse gas
assessment of a platform chemical toward a bio-based economyrdquo Biofuels
Bioprod Bioref 816-29
Corona-Gonzaacutelez RI Bories A Gonzaacutelez Alvarez V and Pelayo-Ortiz C
(2008) ldquoKinetic study of succinic acid production by Actinobacillus
succinogenes ZT-130rdquo Process Biochem 431047ndash1053
Davis R Tao L Tan ECD Biddy MJ Beckham GT Scarlata C Jacobson J
Cafferty K Ross J Lukas J Knorr D and Schoen P(2013) ldquoProcess Design
and Economics for the Conversion of Lignocellulosic Biomass to
Hydrocarbons Dilute-Acid and Enzymatic Deconstruction of Biomass to
Sugars and Biological Conversion of Sugars to Hydrocarbonsrdquo NREL Report
No TP-5100-60223 [Online]
httpwwwnrelgovdocsfy14osti60223pdf
Gerolimatos B and Hanson RL (1978) ldquoRepression of Escherichia coli
pyridine nucleotide transhydrogenase by leucinerdquo J Bacteriol 134(2)394-
400
copycopy UUnniivveerrssiittyy ooff PPrreettoorriiaa
68
Grand-View-Research (2015) ldquoBio-Succinic Acid Market Analysis by
Application (BDO Polyester Polyols PBSPBST Plasticizers Alkyd Resins)
and Segment Forecasts to 2020ldquo [Online]
httpwwwgrandviewresearchcomindustry-analysisbio-succinic-acid-
market ISBN Code 978-1-68038-085-9
Guettler M Rumler D and Jain M (1999) ldquoActinobacillus succinogenes sp
nov a novel succinic-acid-producing strain from the bovine rumenrdquo Int J
Syst Bacteriol 49207ndash216
Gunnarsson IB Karakashev D and Angelidaki I (2014) ldquoSuccinic acid
production by fermentation of Jerusalem artichoke tuberhydrolysate with
Actinobacillus succinogenes 130Zrdquo Ind Crops-Prod 62125ndash129
ICIS (2012)rdquoChemical industry awaits for bio-succinic acid potentialrdquo
[Online]
httpwwwiciscomArticles201201309527521chemical+industry+
awaits+for+biosuccinic+acid+potentialhtml
Jiang M Chen K Liu Z Wei P Ying H and Chang H (2010) ldquoSuccinic acid
production by Actinobacillus succinogenes using spent Brewers yeast
hydrolysate as a nitrogen sourcerdquo Appl Biochem Biotechnol 160 244ndash
254
Jiang M Dai W Xi Y Wu M Kong X Ma J Min Zhang M Chen K and Wei
P (2014) ldquoSuccinic acid production from sucrose by Actinobacillus
succinogenes NJ113rdquo BioresourTechnol 153327ndash332
copycopy UUnniivveerrssiittyy ooff PPrreettoorriiaa
69
Kaneuchi C Seki M and Komagata K (1988) ldquoProduction of succinic acid
from citric acid and related acids by Lactobacillus strainsrdquo Appl Environ
Microbiol 543053ndash3056
Kasprow RP Lange AJ and Kirwan DJ (1998)ldquoCorrelation of fermentation
yield with yeast extract composition as characterized by near-infrared
spectroscopyrdquo Biotechnol Prog 14318minus325
Kwon S Lee PC Lee EG Chang YK and Chang N (2000) ldquoProduction of
lactic acid by Lactobacillus rhamnosus with Vitamin-supplemented soybean
hydrolysaterdquo Enzyme Microb Technol 26209-215
Lee PC Lee WG Kwon S Lee SY and Chang HN (2000) ldquoBatch and
continuous cultivation of Anaerobiospirillum succiniciproducens for the
production of succinic acid from wheyrdquo Appl Microbiol Biotechnol 5423ndash
27
Lee PC Lee SY Hong SH and Chang HN (2002) ldquoIsolation and
characterization of a new succinic acid-producing bacterium Mannheimia
succiniciproducens MBEL55E from bovine rumenrdquo Appl Microbiol
Biotechnol 58(5)663ndash668
Lin H Bennett GN and San KY (2005) ldquoFed-batch culture of a
metabolically engineered Escherichia coli strain designed for high-level
succinate production and yield under aerobic conditions rdquoBiotechnol
Bioeng 90775ndash779
copycopy UUnniivveerrssiittyy ooff PPrreettoorriiaa
70
Lin SKC Du C Koutinas A Wang R amp Webb C (2008) ldquoSubstrate and
product inhibition kinetics in succinic acid production by Actinobacillus
succinogenesrdquo Biochem Eng J 41(2)128ndash135
Liu YP Zheng P Sun ZH Ni Y Dong JJ and Zhu LL (2008) ldquoEconomical
succinic acid production from cane molasses by Actinobacillus
succinogenesrdquo Bioresour Technol 991736ndash1742
Maharaj K Bradfield MFA and Nicol W (2014) ldquoSuccinic acid-producing
biofilms of Actinobacillus succinogenes Reproducibility stability and
productivityrdquo Appl Microbiol Biotechnol 98(17)7379ndash7386
McKinlay JB Zeikus JG amp Vieille C (2005) ldquoInsights into Actinobacillus
succinogenes fermentative metabolism in a chemically defined growth
mediumrdquo Appl Environ Microbiol 71(11) 6651ndash6656
McKinlay JB Vieille C and Zeikus JG (2007) ldquoProspects for a bio-based
succinate industryrdquo Appl Microbiol Biotechnol 76727ndash740
McKinlay JB Laivenieks M Schindler BD McKinlay A Siddaramappa S
Challacombe JF Lowry SR Clum A Lapidus AL and Burkhart KB (2010)
ldquoA genomic perspective on the potential of Actinobacillus succinogenes for
industrial succinate productionrdquo BMC Genomics 11 (1) 680
Nghiem NP Davison BH Suttle BE and Richardson GR (1997)
ldquoProduction of succinic acid by Anaerobiospirillum succiniciproducensrdquo Appl
Biochem Biotechnol 63ndash65 565ndash576
copycopy UUnniivveerrssiittyy ooff PPrreettoorriiaa
71
Oh I Lee H Park C Lee SY and Lee J (2008) ldquoSuccinic acid production by
continuous fermentation process using Mannheimia succiniciproducens
LPK7rdquo J Microbiol Biotechnol 18908ndash912
Organotechniereg SAS (2008) ldquoTechnical Data Sheet Yeast Extract 19512rdquo
[Online] httpwwworganotechniecomdoc_en19512pdf [accessed 22
November 2015]
Rosche B Li XZ Hauer B Schmid A and Buehler K (2009) ldquoMicrobial
biofilms A concept for industrial catalysisrdquo Trends Biotechnol 27636ndash43
DOI 101016jtibtech200908001
Ruumlhl M Le Coq D Aymerich S and Sauer U (2012) ldquo13C-flux analysis
reveals NADPH balancing transhydrogenation cycles in stationary phase of
nitrogen-starving Bacillus subtilisrdquo JBiolChem 287(33) 27959ndash27970
Shen N Qin Y Wang Q Liao S Zhu J Zhu Q Mi H Adhikari B Wei Y and
Huang R (2015) ldquoProduction of succinic acid from sugarcane molasses
supplemented with a mixture of corn steep liquor powder and peanut meal
as nitrogen sources by Actinobacillus succinogenesrdquo Appl Microbiol 60544-
551
Shuler M and Kargi F (2002) ldquoBioprocess Engineering Basic Conceptsrdquo 2nd
ed Prentice Hall New York
Song H and Lee SY (2006) ldquoProduction of succinic acid by bacterial
fermentationrdquo Enzyme MicrobTechnol 39-(3)352ndash361
copycopy UUnniivveerrssiittyy ooff PPrreettoorriiaa
72
Spector MP (2009) ldquoMetabolism central (intermediary)rdquo in M Schaechter
(Ed) Encyclopedia of Microbiology 3rd ed Academic Press Oxford 242ndash
264
Sridee W Laopaiboon L Jaisil P and Laopaiboon P (2011) ldquoThe use of
dried spent yeast as a low-cost nitrogen supplement in ethanol
fermentation from sweet sorghum juice under very high gravity
conditionsrdquo Electron JBiotechnol14(6)1-15
Transparency-Market-Research (2014) ldquoSuccinic acid market for 14-bdo
resin coatings dyes amp inks pharmaceutical polyurethane food
plasticizers cosmetics solvents amp lubricants and de-icing solutions
applications-Global industry analysis size share growth trends and
forecast 2012ndash2018rdquo [Online]
httpwwwtransparencymarketresearchcomsuccinic-acidhtml
Urbance SE Pometto AL DiSpirito A and Demirci A (2003) ldquoMedium
evaluation and plastic composite support ingredient selection for biofilm
formation and succinic acid production by Actinobacillus succinogenesrdquo
Food Biotechnol 17(1)53ndash65
Urbance SE Pometto AL DiSpirito A and Denli Y (2004) ldquoEvaluation of
succinic acid continuous and repeat-batch biofilm fermentation by
Actinobacillus succinogenes using plastic composite support bioreactorsrdquo
ApplMicrobiolBiotechnol 65 (6)664ndash70
Van der Werf MJ Guettler MV Jain MK and Zeikus JG (1997)
ldquoEnvironmental and physiological factors affecting the succinate product
copycopy UUnniivveerrssiittyy ooff PPrreettoorriiaa
73
ratio during carbohydrate fermentation by Actinobacillus sp 130Zrdquo Arch
Microbiol 167332ndash342
Van Heerden CD and Nicol W (2013a) ldquoContinuous and batch cultures of
Escherichia coli KJ134 for succinic acid fermentation Metabolic flux
distributions and production characteristicsrdquo Microb Cell Fact 12-(1) 80-
90
Van Heerden CD and Nicol W (2013b) ldquoContinuous succinic acid
fermentation by Actinobacillus succinogenesrdquo Biochem EngJ 735ndash11
Villadsen J Nielsen J amp Lideacuten G (2011) ldquoBioreaction Engineering
Principlesrdquo 3rd ed Springer US Boston MA
Werpy T and Petersen G (2004) ldquoTop value added chemicals from
biomass Vol 1 Results of screening for potential candidates from sugars
and synthesis gasrdquo National Renewable Energy Lab Golden CO US
Xi Y Chen K Xu R Zhang J Bai X Jiang M Wei P and Chen J (2012)
ldquoEffect of biotin and a similar compound on succinic acid fermentation by
Actinobacillus succinogenes in a chemically defined mediumrdquo Biochem Eng
J 6987ndash92
Xi Y Chen K Dai W Ma J Zhang M Jiang M Wei P and Ouyang PK
(2013) ldquoSuccinic acid production by Actinobacillus succinogenes NJ113
using corn steep liquor powder as nitrogen sourcerdquo Bioresour Technol
136 775ndash779
copycopy UUnniivveerrssiittyy ooff PPrreettoorriiaa
74
Xiao X Hou Y Liu Y Liu Y Zhao H Dong L Du J Wang Y Bai G and Luo
G (2013) ldquoClassification and analysis of corn steep liquor by UPLCQ-TOF
MS and HPLCrdquo Talanta 107344ndash348
Xu J and Guo B (2010) ldquoMicrobial succinic acid its polymer poly(butylene
succinate) and applicationsrdquo Plastics from Bacteria Natural Functions and
Applications Microbiology Monographs Vol 14 Springer Verlag
BerlinHeidelberg DOI 101007978-3-642-03287514
Yan Q Zheng P Dong JJ and Sun ZH (2013) ldquoA fibrous bed bioreactor to
improve the productivity of succinic acid by Actinobacillus succinogenesrdquo
JChemTechnolBiotechnol 89(11)1760-1766DOI101002jctb4257
Yan Q Zheng P Tao S and Donga J (2014) ldquoFermentation process for
continuous production of succinic acid in a fibrous bed bioreactorrdquo
Biochem Eng J 9192-98
Zeikus JG Jain MK and Elankovan P (1999) ldquoBiotechnology of succinic acid
production and markets for derived industrial productsrdquo Appl Microbiol
Biotechnol 51545ndash552
Zheng P Dong J Sun Z Ni Y and Fang L (2009) ldquoFermentative production
of succinic acid from straw hydrolysate by Actinobacillus succinogenesrdquo
Bioresour Technol 100 2425ndash2429
copycopy UUnniivveerrssiittyy ooff PPrreettoorriiaa

6
processes are understood refined and optimised through continuous
research and development (Cok et al 2014)
22 Succinic acid
221 Application of succinic acid
One of the top 12 bio-based platform chemicals recognized by the US DOE
was succinic acid (SA) (Werpy amp Peterson 2004 Bozell amp Peterson 2010)
See Figure 21 for the molecular structure of SA Most of the SA produced to
meet global demand is manufactured through the petroleum route ie it is
produced by the partial oxidation of butane followed by hydrogenation of
the intermediate product which is maleic anhydride However the
expensive conversion costs and non-renewability of this petroleum-based
route for producing SA has limited the SA market to low-cost bulk
application (Xu amp Guo 2010 Beauprez et al 2010)
Figure 21 Succinic acid molecule
Traditionally the application of SA has been limited mainly to four
functional regions its largest area of application is as a surfactant an
additive to a detergent and a foaming agent the second is as an ion chelator
copycopy UUnniivveerrssiittyy ooff PPrreettoorriiaa
7
for preventing corrosion and spot corrosion of metals in the electroplating
industry the third is as an acidulant which is a pH regulator and flavouring
agent in the food industry and the fourth area of application region is in
the pharmaceutical industry specifically in the production of antibiotics
amino acids and vitamins (Xu amp Guo 2010) As a platform chemical it is
also used as a precursor of many commodity or specialty chemicals as seen
in Figure 22 (Zeikus et al 1999)
Figure 22Various chemicals and products derived from succinic acid
(Zeikus et al 1999)
Nevertheless there is potential for the bulk application of SA The key to
the growth of the SA market lies in its derivatives The diamines and diols
that are derived from SA can be used as monomer units of a variety of
Figure 22 Various chemicals and products derived from succinic acid
(Zeikus et al 1999)
copycopy UUnniivveerrssiittyy ooff PPrreettoorriiaa
8
plastics such as polyesters polyamides and polyester amides (Bechthold et
al2008) Among them is the SA derivative 14-butanediol (BDO) It is a
platform chemical for tetrahydrofuran (THF) gamma-butyrolactone (GBL)
and polymers such as polybutylene terephthalate (PBT) and polyurethane
(PU) These chemicals are widely used in the production of engineering
thermoplastics and elastic fibres and because of these applications the
BDO market is expected to increase as the demand for THF and spandex for
sports apparel increase (Grand- View- Research 2014) Another derivative
of SA that is predicted to increase the SA global market is the biodegradable
polybutylene succinate (PBS) and its copolymers PBS polymers have a
range of applications as supermarket bags packaging film mulch film and
other disposable articles Owing to the steady growth of the market for
biodegradable plastic the demand for PBS is expected to increase rapidly
which in turn could grow the SA market (ICIS 2012)
222 Succinic acid market
The global SA market in 2011 was estimated to be worth US$240 million
and it is projected to reach US$836 million by 2018 (Transparency-Market-
Research 2014) due to the development of the bio-SA Consumption of
petroleum-based SA in manufacturing various other chemicals is restricted
due to unpredictability of price and carbon footprints These concerns
however are advancing the progression of biological manufacturing of SA
The major drivers for this growth will be the high cost of crude oil the rise
in carbon footprints and an interest in producing ldquogreenrdquo chemicals Newer
applications of SA as PBS BDO plasticizers and polyesters polyols will fast-
track the future growth of the bio-SA market However the higher price of
bio-SA and the lengthy extraction processes are the primary factors that
copycopy UUnniivveerrssiittyy ooff PPrreettoorriiaa
9
will restrain the market growth for the next few years although the market
is expected to grow at a significant rate over the next seven years (Allied
Market Research 2014)
At present there are numerous institutions researching the development of
SA through bio-based raw materials and there are companies that are
already manufacturing bio-SA for commercial purposes The list of major
companies involved in the production of bio-SA includes BioAmber
Myraint DSM Mitsui amp Co Mitsubishi BASF Roquette Freacuterese SA Purac
and Reverdia In 2013 the global bio-SA market volume was approximately
51 100 tons and in seven years it is expected to reach a market volume of
710 000 tons In that same year BDO is predicted to emerge as the largest
application segment for bio-SA as it will replace maleic anhydride in the
production of BDO every 1MT of maleic anhydride will be replaced by
12MT of bio-SA (Allied Market Research 2014)
223 Bio-based SA production
Bio-SA which has the same structure as petroleum-based SA is produced
by the fermentation of a carbohydrate using a natural producer or an
engineered organism The feedstock used for the production of bio-based
succinic acid can be wheat maize glucose lignocellulosic-derived sugar or
sorghum grain processed to starch (BioConSepT 2013)
Compared with the petroleum-based process the fermentation process has
the advantages of mild operating conditions independence of the fossil
feedstock and fixation of CO2 and with development of genetic engineering
metabolic modification of microbial strains and improvement of
copycopy UUnniivveerrssiittyy ooff PPrreettoorriiaa
10
purification technology the fermentative production of SA from renewable
resources can be more cost-effective than the fossil-based processes (Xu amp
Guo 2010)
To date various microorganisms have been reported to produce SA such
as typical gastrointestinal bacteria and rumen bacteria and some
lactobacillus strains (Kaneuchi Seki amp Komagata 1988 Beauprez et al
2010) Among them Actinobacillus succinogenes (Guettler Rumler amp Jain
1999) Anaerobiospirillum succiniciproducens (Oh et al 2008) Mannheimia
succiniciproducens (Lee et al 2000) and genetically modified Escherichia
coli (Lin Bennet amp San 2005) are the most promising strains for producing
SA at high yields Fungi species such as Aspergillus niger Aspergillus
fumigatus Byssochlamys nivea Lentinus degener Paecilomyces varioti
Penicillium viniferum and yeast Saccharomyces cerevisia also produce
succinic acid but not in high concentrations or yields (Song amp Lee 2006)
Nevertheless for industrial applications A succinogenes stands out because
it is by far the most studied wild strain (Brink amp Nicol 2014) and its ability
to produce high concentrations of SA naturally from a broad range of
carbon sources (Guettler et al 1999 McKinlay Vieille amp Zeikus 2007)
further makes it ideal for commercial applications
23 Actinobacillus succinogenes
231 Description of microorganism
A succinogenes a Gram-negative rod-shaped and non-motile bacterium
isolated from bovine rumen (Guettler et al 1999) is considered to be one
copycopy UUnniivveerrssiittyy ooff PPrreettoorriiaa
11
of the top natural SA producing microorganisms (McKinlay et al 2007
Brink amp Nicol 2014) It produces SA as part of a mixed acid fermentation in
which acetic acid (AA) formic acid (FA) and ethanol are the by-products It
is capable of digesting a wide range of carbon sources such as glucose
fructose mannitol arabitol sorbitol sucrose xylose and arabinose under
anaerobic conditions (Van der Werf et a 1997) but most laboratory
experiments use glucose fructose xylose and sucrose as carbon substrates
A succinogenes grows optimally at moderate temperatures (37 degC to 39 degC)
and it is facultative anaerobic ie it can survive in the presence or absence
of oxygen Furthermore it is capnophilic because its growth is enhanced at
increased CO2 concentrations (Guettler et al 1999) and it is a
chemoheterotroph that grows optimally at pH ranging from 6 to 74
232 Metabolic pathway
As stated earlier A succinogenes is a promising candidate for industrial SA
production However in addition to producing SA it also produces formic
acid (FA) acetic acid (AA) and sometimes ethanol The summarised version
of the metabolic pathway for A succinogenes is shown in Figure 23
A succinogenes ferments glucose to phosphoenolpyruvate (PEP) by
glycolysis PEP is thought to serve as the point of divergence between the
FA AA and ethanol producing pathway (C3 pathway) and the SA producing
(C4) pathway The path from glucose to PEP is neutral overall in terms of
adenosine triphosphate (ATP) production but one-third of nicotinamide
adenine dinucleotide (NADH) is produced per cmol of glucose consumed
copycopy UUnniivveerrssiittyy ooff PPrreettoorriiaa
12
C4 metabolic pathway (reverse tricarboxylic pathway)
Overall this pathway leads to the formation of SA and two molecules of
NADH and one molecule of CO2 must be consumed to form one molecule of
SA Ideally one would prefer the carbon flux to follow this route to attain
homosuccinate production
The key enzyme in this pathway is PEP carboxykinase because it pushes
the carbon flux from PEP to oxaloacetate which later on becomes SA This
enzyme is regulated by CO2 levels ie the level of CO2 available to A
succinogenes will have an influence on the SA production of the organism
(Van der Werf et al 1997) Hence it will be imperative to achieve correct
extracellular and intracellular CO2 levels during SA production
C3 metabolic pathway
However the C3 pathway cannot be avoided due to the redox requirement
of the cell In this pathway PEP is converted to pyruvate by pyruvate
kinase generating one molecule of ATP during the process Pyruvate is
then converted to acetyl-CoA by either pyruvate dehydrogenase (PDH)
andor pyruvate-formatelyase (PFL)
Pyruvate conversion with PDH results in one molecule of CO2 and one
molecule of NADH being formed alongside one molecule of AA With PFL
FA is produced instead of CO2 and NADH but FA can be further broken
down to CO2 and NADH by the enzyme formate dehydrogenase (FDH)
copycopy UUnniivveerrssiittyy ooff PPrreettoorriiaa
13
The FDH activity (encoded by the fdhF gene in A succinogenes) is known to
occur only under the following conditions (Spector 2009)
Absence of an electron acceptor such as oxygen or nitrate
Acidic pH conditions
Presence of FA
PFL expression is stated to be dependent upon two glycolysis enzyme
activities namely phosphoglucoisomerase and phosphofructokinase
Interestingly the expression of PFL and FDH enzymes is reported to
increase under carbon energy source starvation (Spector 2009)
Acetyl-CoA is the branch point at which both ethanol and AA are later
formed In this process a molecule of ATP is produced per molecule of AA
formed For one molecule of ethanol formed two molecules of NADH are
absorbed However ethanol formation can be reduced if there is
intracellular availability of CO2 to the organism (Van der Werf et al 1997)
copycopy UUnniivveerrssiittyy ooff PPrreettoorriiaa
14
Figure 23 Simplified metabolic network of A succinogenes (based on
McKinlay et al (2007)
copycopy UUnniivveerrssiittyy ooff PPrreettoorriiaa
15
Pentose phosphate pathway (PPP)
Figure 23 gives a simplified version of the metabolic pathway of A
succinogenes However several studies have noted that the pentose
phosphate pathway is an additional pathway for the A succinogenes (Brink
amp Nicol 2014 Bradfield amp Nicol 2014 Van der Werf et al 1997 McKinlay
et al 2007 McKinlay et al 2005) McKinlay (2007) stated that the PPP
only contributed 20 to the NADPH required for the organismrsquos growth
But Bradfield amp Nicol (2014) and Brink amp Nicol (2014) postulated that the
contribution of the PPP could increase and be more than predicted when
the organism enters the maintenance phase or non-growth phase
According to Ruumlhl et al (2012) a resting non-growing Bacillus subtilis cell
showed constant metabolic activity without cell growth which lead to an
apparent overproduction of nicotinamide adenine dinucleotide phosphate
(NADPH) (via the PPP) which is then converted by transhydrogenase into
NADH Bradfield amp Nicol (2014) claim that it is possible that this can also
occur with A succinogenes as it does possess the transhydrogenase The
analysis by Bradfield amp Nicol (2014) indicated an under-prediction of the
YAASA for the growth metabolism (associated with NADH ldquolossesrdquo) while an
over-prediction of the YAASA is achieved for the maintenance metabolism
(associated with NADH ldquogainrdquo) This could imply that different metabolic
pathways are employed under growth and maintenance conditions
Medium contributions were previously considered as the source for the
NADH disparities during the maintenance phase but this reasoning can be
ruled out given the results of the study done by Brink amp Nicol (2014) in
which the same medium resulted in opposite redox balance trends with
regard to the growth and non-growth phases
copycopy UUnniivveerrssiittyy ooff PPrreettoorriiaa
16
24 SA yield considerations
The theoretical maximum yield of SA on a carbon substrate through
fermentation can be determined by considering the net metabolic pathway
involved and a redox balance as illustrated by Villadsen Nielsen amp Lideacuten
(2011 159-163) The overall black box stoichiometry in converting glucose
to SA with no biomass and no by-product formation is
C6H12O6 + 120788
120789CO2rarr
120783120784
120789C4H6O4 +
120788
120789H2O (21)
From Equation 21 the theoretical maximum yield of succinic acid on
glucose (YGLSA) is 112 gmiddotg-1 However it is not possible to achieve the
maximum yield because actual SA yield will depend on the active metabolic
pathway of the organism and the associated product distribution To
determine the maximum YGLSA possible with by-product formation a redox
balance is required
Pyruvate metabolism
Assuming that there is no carbon flux to cell growth and if only the PDH
enzyme is active or FDH converting all FA the overall black box
stoichiometry in converting glucose to SA and AA with no biomass
formation is
C6H12O6 + 120784
120785CO2rarr
120786
120785C4H6O4 +
120784
120785C2H4O2 (22)
Since no FA is formed the YAAFA will be 0 gmiddotg-1 This pathway releases one
molecule of NADH for every molecule of AA produced (see Figure 24) The
copycopy UUnniivveerrssiittyy ooff PPrreettoorriiaa
17
NADH would be consumed by the C4 pathway to produce SA and then the
theoretical YGLSA would be 088 gmiddotg-1
Figure 24 Simplified metabolic network of A succinogenes (PDH
active)
On the other hand if only the PFL enzyme is active both FA and AA will be
formed (see Figure 25) The overall black box stoichiometry in converting
glucose to SA AA and FA with no biomass formation is
C6H12O6 + CO2rarrC4H6O4 +C2H4O2 + CH2O2 (23)
For every molecule of FA formed a molecule of AA will be produced so the
YAAFA will be 076 gmiddotg-1 As a result YGLSA will be 066 gmiddotg-1 If both PFL and
FDH enzymes are active then FA will be broken down to produce CO2 and
NADH which will result in YAAFA being 0 gmiddotg-1 and YGLSA being 088 gmiddotg-1
copycopy UUnniivveerrssiittyy ooff PPrreettoorriiaa
18
Figure 25 Simplified metabolic network of A succinogenes (PFL
active)
Nevertheless as mentioned by Van Heerden amp Nicol (2013a)the maximum
theoretical yield of SA can be obtained through the metabolic engineering
of A succinogenes This can be achieved by manipulating the organism to
use the oxidative part of the tricarboxylic acid (TCA) cycle under anaerobic
conditions (see Figure 26a)
copycopy UUnniivveerrssiittyy ooff PPrreettoorriiaa
19
Figure 26 (a) Simplified metabolic network of A succinogenes
(oxidative TCA cycle active) (b) Simplified metabolic network of A
succinogenes (glyoxylate bypass active)
Alternatively the glyoxylate bypass can be utilised (Figure 26b) to give the
same result For both these scenarios the mass-based SA-to-glucose ratio is
112 gmiddotg-1 which is the maximum theoretical yield of SA that can be
achieved
25 Nitrogen source for A succinogenes
The composition of the growth medium is a key factor in microbial
fermentations An important element of the fermentation medium which
will be essential for the growth of the organism is the nitrogen source
In the rumen A succinogenes is surrounded by a massive source of
nutrients which allow the organism to thrive But outside the rumen more
specifically in the laboratory or in an industrial fermentation setup
copycopy UUnniivveerrssiittyy ooff PPrreettoorriiaa
20
nutrients important for growth of the organism must be provided Since
A succinogenes is auxotrophic it requires certain amino acids and vitamins
to be provided for growth and SA production McKinlay et al (2010)
determined the essential vitamins required for the growth to be nicotinic
acid pantothenate pyridoxine and thiamine and the needed amino acids to
be cysteine glutamate and methionine Furthermore they concluded that
it is able to grow without biotin supplementation
By contrast Xi et al (2012) declared the essential vitamins to be only biotin
and nicotinic acid and the essential amino acids to be only glutamate and
methionine Nevertheless the addition of these defined components makes
the growth medium expensive for industrial use (Shuler amp Kargi 2002 52)
This collection of vitamins and amino acids is thought to be better
introduced to the organism in a complex form (eg yeast extract or corn
steep liquor) where the components and concentration of the nitrogen-
carrying compounds are unknown A complex form of nitrogen source is
less expensive than a defined form and it is said to produce higher cell
growth compared with media with a defined nitrogen source (Shuler amp
Kargi 2002 52)
Batch fermentation studies
Table 21 lists batch studies that investigated alternative nitrogen sources
for SA production and A succinogenes growth From the studies that used
only one type of nitrogen source (either YE or YE amp CSL or CSL amp vitamins)
it can be seen that studies that used only YE generally had a lower YGLSA
compared with the studies that used a combination of YE and CSL as the
nitrogen source Addition of vitamins (Yan et al 2013) to CSL produced SA
copycopy UUnniivveerrssiittyy ooff PPrreettoorriiaa
21
yields and cell growth that were better than the results produced by the YE
and CSL combination
Studies that compared different nitrogen sources within the same study
such as Jiang et al (2010) and Shen et al (2015) compared the
performance of several nitrogen sources inorganic and organic and
observed the following
Inorganic nitrogen sources such as (NH4)2SO4 or NH4Cl were the
worst performing with regard to cell growth and SA yield (Jiang et al
2010)
YE as the only nitrogen source in a growth medium produced the
highest SA yield and the highest dry cell weight (DCW) in comparison
with other nitrogen sources (Jiang et al 2010 Shen et al 2015)
CSL a by-product of corn starch production as the only nitrogen
source in a growth medium was the second best performer (Jiang et
al 2010 Shen et al 2015)
CSL medium did not achieve full carbon substrate conversion
compared with YE medium at the end of the batch fermentation
(Jiang et al 2010 Shen et al 2015)
These studies suggested that the most promising nitrogen source in terms
of A succinogenes growth and SA yield from carbon substrate was yeast
extract (YE) YE is said to have various vitamins amino acids minerals and
trace metals that are necessary to stimulate the growth of A succinogenes
and synthesize its metabolites (Kasprow Lange amp Kirwan 1998) Although
YE is considered to be the best source of nitrogen its price ranges from
US$350kg to US$67kg (Kwon et al 2000 Sridee et al 2011) while the
copycopy UUnniivveerrssiittyy ooff PPrreettoorriiaa
22
price of CSL ranges from US$007kg to US$0075kg (Davis et al 2013)
which makes YE an expensive and unfeasible nitrogen source for long-term
industrial fermentation (Jiang et al 2010 Xi et al 2013 Shen et al 2015)
and CSL an economically viable alternative to YE The feasibility of CSL
feasibility as a nitrogen source was also investigated using microorganisms
such as Mannheimia succiniciproducens (MBEL55E) and Anaerobiospirillum
succiniciproducens Those studies (Lee et al 2000 2002) came to the same
conclusion as Jiang et al (2010) and Shen et al (2015) the inexpensive CSL
can replace the expensive YE as a nitrogen source to promote cell growth
and SA production
A possible reason why CSL proved to be second best to YE is because CSL
contained the cofactor biotin which is considered to be vitally important
for the metabolism of protein lipid and carbohydrate (Xi et al 2012) The
biotin content in CSL is 1 mgmiddotkg-1 and this is said to be sufficient to make a
significant contribution to the nutritional requirement of A succinogenes or
other microorganisms (Nghiem et al 1996) However Jiang et al (2010)
and Shen et al (2015) noticed that with CSL as a nitrogen source in
contrast to YE as the nitrogen source there was a significant amount of
residual glucose that remained at the end of the batch fermentation Shen
et al (2015) suggest that CSL may lack trace elements and certain nitrogen-
containing compounds that prevent A succinogenes from meeting its
normal physiological needs Another reason could be that the batch
fermentation time was not long enough for the CSL medium to reach full
carbohydrate consumption Since no profile of the variables over time was
given for these studies it is hard to determine whether the residual glucose
found in the CSL medium was due to a lack of nutrients or productivity
reduction
copycopy UUnniivveerrssiittyy ooff PPrreettoorriiaa
23
Xi et al (2013) stated that the heme and CSL combination in the production
medium improved SA production by creating a more reductive
environment (the initial redox potential was very low when heme was
added to the medium)
copycopy UUnniivveerrssiittyy ooff PPrreettoorriiaa
24
Table 21 Batch fermentation studies of A succinogenes using different nitrogen sources namely YE and CSL
Study Model Nitrogen source (gmiddotL-1)
Carbon Source
CSo (gmiddotL-1)
CSA (gmiddotL-1)
YGLSA
(gmiddotg-1) YAASA
(gmiddotg-1) YAAFA
(gmiddotg-1)
DCW
(gmiddotg-1)
Gunnarsson
Karakashevamp
Angelidaki (2014)
130Z YE(20) Synthetic
hydrolysate
36 30 083 86 058 25
Zhen et al (2009)
CGMCC
1593
YE(15) Straw
hydrolysate
58 455 0807 7583 083 56
Corona-Gonzalez et
al (2008)
130Z YE(10) Glucose 547 338 062 52 11 37
Liu et al (2008)
CGMCC
1593
YE(10) Sugarcane
molasses
644 464 072 77 3 5
Yan et al (2013)
CCTCC
M2012
036
CSL(25) amp
vitamins
mixture
Glucose 50 39 085 - - -
copycopy UUnniivveerrssiittyy ooff PPrreettoorriiaa
25
Study Model Nitrogen source (gmiddotL-1)
Carbon Source
CSo (gmiddotL-1)
CSA (gmiddotL-1)
YGLSA
(gmiddotg-1) YAASA
(gmiddotg-1) YAAFA
(gmiddotg-1)
DCW
(gmiddotg-1)
CCTCC
M2012
036
CSL(25) amp
vitamins
mixture
Glucose 100 881 088 - - -
Jiang et al (2014)
CGMCC
1716
YE(10) amp
CSL(5)
mixture
Sucrose 100 55 069 11 09 3
Chen et al (2010)
NJ113 YE(10) amp
CSL(5)
mixture
Glucose 50 42 084 - - -
Urbance et al
(2004)
130Z YE(6) amp
CSL (10)
mixture
Glucose 40 339 087 - - -
Urbance et al
(2003)
130Z YE(6) amp
CSL(10)
mixture
Glucose
20 174 087 - - -
copycopy UUnniivveerrssiittyy ooff PPrreettoorriiaa
26
Study Model Nitrogen source (gmiddotL-1)
Carbon Source
CSo (gmiddotL-1)
CSA (gmiddotL-1)
YGLSA
(gmiddotg-1) YAASA
(gmiddotg-1) YAAFA
(gmiddotg-1)
DCW
(gmiddotg-1)
Shen et al (2015) GXAS1
37
YE(12) Sugarcane
molasses
70 546 078 75 5 38
CSL(206) Sugarcane
molasses
70 479 068 76 573 3
Xi et al (2013)
NJ113 YE(10) amp
CSL(75)
mixture
Glucose 30 171 057 372 - 37
CSL (15) Glucose 30 151 050 458 - 31
CSL (15) amp
heme (0001)
mixture
Glucose 30 217 072 493 - 33
Jiang et al (2010)
NJ113 YE(15) Glucose 70 487 070 - - 45
CSL(15) Glucose 70 96 014 - - 21
copycopy UUnniivveerrssiittyy ooff PPrreettoorriiaa
27
Continuous fermentation studies
To date all continuous fermentation studies except the study done by Yan
et al (2014) used a combination YE and CSL (based on the revised SA
medium by Urbance et al 2003) as nitrogen sources None of these studies
investigated on the effect of varying the nitrogen sources type or the
concentration on SA productivity and cell growth In Table 22 it can be
seen that with a fixed combination of YE and CSL growth medium Maharaj
et al (2014) achieved the highest SA yield on glucose mass ratio and
highest SA concentration However Yan et al (2014) reported even YGLSA
and SA concentration and they used a combination of the inexpensive CSL
and defined vitamins
26 Continuous fermentation
In an economic context the need to produce large volumes of product is the
main reason for the selection of the continuous reactor mode preferably
one in which a wild strain acts as the biocatalyst to diminish mutation
problems (Villadsen et al 2011 384) Continuous systems are
advantageous also on a monetary scale because they have lower capital and
labour costs in comparison with batch production systems and since
continuous processes are time independent constant product quality is
more attainable compared with batch or fed-batch processes (Villadsen et
al 2011 384)
A unique aspect of continuous operation is the formation of biofilm which
is inevitable during pro-longed A succinogenes fermentations (Van
Heerden amp Nicol 2013 Maharaj amp Nicol 2014 Urbance et al 2003
copycopy UUnniivveerrssiittyy ooff PPrreettoorriiaa
28
Bradfield amp Nicol 2014 Brink amp Nicol 2014) Biofilms are microbial cell
layers that are embedded in self-produced exopolysacharide (EPS) which is
prone to attaching to surfaces Reactors with biofilms can be operated for
longer periods of time and are very economical because of the self-
immobilizing nature of A succinogenes which results in high volumetric
productivities (Rosche et al 2009)
It is well-known that the growth of A succinogenes is inhibited by the total
concentration of acids in the medium (Corona-Gonzaacutelez et al 2008 Lin et
al 2008 Urbance et al 2004) and therefore at a low throughput (or D)
growth of the organism will be slow since that is when high yields and acid
concentrations are found At a high D the biofilm is established at a quicker
rate but process instability is more severe (Maharaj amp Nicol 2014) The
excessive biofilm shedding at this point does not allow the system to reach
steady state easily and maintain it At a low D the effects seen with a high D
are not observed According to Bradfield amp Nicol (2014) the concentrations
produced at a low D are linked to the maintenance phase and therefore
only a small fraction of the biomass is replicating which allows the system
to reach and maintain steady state (Maharaj amp Nicol 2014)
copycopy UUnniivveerrssiittyy ooff PPrreettoorriiaa
29
Table 22 Continuous fermentation studies of A succinogenes using different nitrogen sources namely YE and CSL
Study Organism model
Nitrogen source
Dilution CSo (gmiddotL-1)
CSA (gmiddotL-1)
YGLSA
(gmiddotg-1) YAASA
(gmiddotg-1) YAAFA
(gmiddotg-1)
DCW
(gmiddotg-1)
Maharaj et al
(2014)
130Z YE(6) amp
CSL(10)
0054
071
326
141
09
080
-
-
-
-
-
-
Yan et al
(2014)
CCTCC
M2012036
CSL(25) amp
vitamins
01-04 188-
3996
084-
092
- - -
001-01 422-
636
072-
085
- - -
Van Heerden
and Nicol
(2013b)
130Z YE(6) amp
CSL(10)
049 13 071 25 077 -
Urbance et al
(2004)
130Z
YE(6) amp
CSL(10)
085
104
076
-
-
-
copycopy UUnniivveerrssiittyy ooff PPrreettoorriiaa
30
3 Materials and Methods
31 Microorganism and growth
Microorganism
In this study Actinobacillus succinogenes 130Z (DSM No 22257 or ATCC
No 55618) was used It was obtained from the German Collection of
Microorganisms and Cell Cultures (Braunschweig Germany) The culture
was stored in a cryopreservation solution at a temperature of ndash75 degC
Inoculum preparation
Inoculum was prepared by transferring 1 ml of the preserved culture to a
vial containing 15 ml of sterilized tryptone soy broth (TSB) The vial was
sealed and stored in an incubator at 37 degC with a shaker speed of 100 rpm
for a duration of 16ndash24 h The broth was later tested for contamination and
usability by performing an analysis with high-performance liquid
chromatography (HPLC) If the broth contained lactic acid or ethanol it was
considered to be contaminated and if a considerable amount of SA was
found in the broth then the culture was deemed to be viable
32 Fermentation media
All chemicals used to make the fermentation medium were obtained from
Merck KgaA (Darmstadt Germany) unless otherwise indicated The feed
medium consisted of three parts a growth medium a phosphate buffer and
copycopy UUnniivveerrssiittyy ooff PPrreettoorriiaa
31
a glucose solution The fermentation medium is based on the composition
proposed by Urbance et al (2003)
Six different growth media were used during the fermentation runs each
medium were composed of a different type andor concentration of
nitrogen sources The first medium used only yeast extract (YE) as the
nitrogen source and the last medium used only corn steep liquor (CSL) The
first run had approximately 33 gmiddotL-1of D-glucose added to the medium and
the last run had approximately 45 gmiddotL-1 of D-glucose added to the medium
Table 31 gives details of the components and the respective concentrations
used to make the feed media CO2(g) (Afrox Johannesburg South Africa)
was fed into the recycle line at 10 vvm to serve as the inorganic carbon
source
copycopy UUnniivveerrssiittyy ooff PPrreettoorriiaa
32
Table 31 Specifications of feed mediaa used during fermentations
Medium
1
Medium
2
Medium
3
Medium
4
Medium
5
Medium
6
Glucose (gmiddotL-1)
Runs 1 amp 2 33 33 33 33 33 33
Run 3 45 45 45 45 45 45
Growth (gmiddotL-1)
YE 16 10 6 3 1 0
CSL 0 6 10 13 15 16
YE ( of YE in
N2 source)d
100 625 375 1875 625 0
NaCl 1 1 1 1 1 1
MgCl2middot6H2O 02 02 02 02 02 02
CaCl22H2O 02 02 02 02 02 02
CH₃COONa 136 136 136 136 136 136
Na2Smiddot9H2O 016 016 016 016 016 016
Antifoam Ybc 1 1 1 1 1 1
Phosphate (gmiddotL-1)
K2HPO4 16 16 16 16 16 16
KH2PO4 32 32 32 32 32 32
a Based on Urbance et al (2003)
b Antifoam from Sigma-Aldrich St Louis USA
c Concentration is in mlmiddotL-1
d YE in N2 source is the of YE in the total complex nitrogen source in the medium
The concentration of the total complex nitrogen source (a combination of CSL and
powder YE) was 16 gmiddotL-1 throughout the fermentations for all runs
copycopy UUnniivveerrssiittyy ooff PPrreettoorriiaa
33
33 Bioreactor
The bioreactor pictured in Figure 31 (a amp b) was a glass cylindrical body
set between an aluminium base and head with an external recycle line to
provide agitation The working volume of the reactor (including recycle)
was 356 mL The liquid level in the reactor was maintained by using a
peristaltic pump on the product line All pumps used in the system were
peristaltic pumps A wooden stick covered in terry cloth was inserted in the
glass cylindrical body for biofilm attachment In fermentation run1 and
run2 one stick was used and in fermentation run 3 three sticks were used
CO2 flow rates were controlled using Brooks 5850S mass flow controllers
(Brooks Instrument Hungary) and the CO2 entered the reactor via an inlet
in the recycle line which was connected to a 02 μm PTFE membrane filter
(Midisart 2000 Sartorius Goumlttingen Germany) The gas exited the system
through a filter with the same specifications as mentioned earlier
connected to the foam-trap
The pH was measured using a CPS 71D-7TB21 glass combination probe
(Endress+Hauser Gerlingen Germany) held within a stainless-steel holder
connected in-line within the recycle stream Maintaining the pH at 68
required the use of a Liquiline CM442 (Endress+Hauser Gerlingen
Germany) in which an internal relay controlled the dosing of 10 M
unsterilized NaOH in an onndashoff fashion Temperature was controlled in a
similar fashion a hotplate was used to provide the heat required to
maintain the temperature at 37 degC For better control of temperature
fluctuations the hotplate was linked to the National Instrument (NI)
module The NI module is further discussed in Section 35
copycopy UUnniivveerrssiittyy ooff PPrreettoorriiaa
34
Figure 31a) Simplified schematic of bioreactor setup
No Description
1 Gas filter
2 Foam-trap 3 Medium
reservoir 1 4 Antifoam
reservoir 5 Medium
reservoir 2 6 Inoculation
septum 7 Reactor body 8 Hot plate 9 Temperature
control 10 pH probe 11 Product
reservoir 12 NaOH reservoir 13 CO2 cylinder 14 Controller 15 Recycle pump 16 Dosing pump
17 Gas flow controller
8
7
2
3
4
5
11
12
13
17
T pH
6
C
DAQ
PC
1
9 10
14
15
16
copycopy UUnniivveerrssiittyy ooff PPrreettoorriiaa
35
Figure 31b) Bioreactor setup
copycopy UUnniivveerrssiittyy ooff PPrreettoorriiaa
36
34 Fermentation procedure
The three parts of the fermentation medium (growth medium buffer and
glucose) were prepared in separate bottles and were autoclaved at 121degC
for 60 minutes To prevent unwanted reactions amongst the medium
components the three parts of the medium were only mixed once the
bottles had cooled to room temperature (approx 24 degC) The reactor
system (excluding NaOH) was also autoclaved at the same temperature and
duration as stated above
The first fermentation medium (see Table 31) was used to start up the
fermentation It had only YE as the nitrogen source This was done to form
a substantial amount of biofilm for full glucose consumption The feed
setup was then connected to the sterile reactor system with a sterile
coupling The coupling consisted of a U-connection one half of which was
fixed to the feed setup and the other half to the reactor system Each half of
the connection had a ball valve to isolate the system from the external
environment The half connections were then coupled and placed in an oil
bath at 140 degC for 20 minutes The reactor was then filled with medium and
once the temperature and pH had stabilized to 37degC and 68 respectively
10 mL of inoculum was injected into the reactor through a silicon septum
attached to the reactor head
Fermentations were started off by operating the system at batch conditions
for 17 hours and then changing to continuous operation at a low dilution
rate This allowed for cell accumulation and prevented cell washout
Addition of antifoam into the reactor was only done when deemed
necessary The recycle flow rate was kept constant at 500 mLmiddotmin-1 in all
fermentations to maintain similar shear conditions The CO2 flow rate was
copycopy UUnniivveerrssiittyy ooff PPrreettoorriiaa
37
set at a vvm of 10 as it seemed sufficient to maintain CO2 saturation in the
reactor After a few days of operation biofilm appeared on internal surface
of the bioreactor as well as the wooden stick covered in terry cloth which
was inserted into the glass cylinder as the intended surface for biofilm
attachment
Controlled variables
Dilution rates for the fermentation runs were determined using the first
fermentation medium Once biofilm had formed in the reactor after a few
days of continuous operation the dilution rate was adjusted until 95 of
initial glucose had been consumed For R3 90 was the target for glucose
consumption The dilution rate was fixed for the entire experimental run if
the above mentioned glucose consumption stayed more or less constant for
three days or more
Media change during fermentation
Similar to the feed connection to the reactor the different medium setups
were connected to the sterile reactor system with another sterile coupling
The half connections were then coupled and the U-connection was placed
in an oil bath at 140 degC for 40 minutes
35 Online monitoring
Monitoring of the process was performed in a similar fashion to that of Van
Heerden and Nicol (2013b) in which the time-averaged NaOH dosing
copycopy UUnniivveerrssiittyy ooff PPrreettoorriiaa
38
fraction was linked to a productivity factor allowing an estimated SA
concentration to be calculated in real-time A LabVIEW (NI module)
program was used to monitor and control the reactor The program was
linked to the reactor instrumentation using a cDAQ-9184 data acquisition
device (National Instruments Hungary) with voltage and current input
modules and a current output module Temperature dosing and antifoam
flowrates were controlled with the program Temperature pH gas flow
rates and the time-averaged dosing of NaOH were recorded through the
program
36 Analytical methods
HPLC analysis
High-performance liquid chromatography (HPLC) was used to determine
the concentrations of glucose SA and other organic acids Analyses were
done using an Agilent 1260 Infinity HPLC (Agilent Technologies USA)
equipped with an RI detector and a 300 mm times 78 mm Aminex HPX-87 H
ion-exchange column (Bio-Rad Laboratories USA) The mobile phase (03
mLmiddotL-1 and 11 mLmiddotL-1H2SO4) flowrate was 06 mLmiddotmin-1 and the column
temperature was 60degC
Suspended cell analysis
Once the reactor had reached a steady state the product stream was
collected in a bottle that was kept in a small bar refrigerator The product
bottle was kept cool to prevent further growth of cells and metabolic
activity and depending on the dilution rate the duration of the collection
period varied from 12 to 72 hours The collected volume was then
copycopy UUnniivveerrssiittyy ooff PPrreettoorriiaa
39
thoroughly mixed and a 12 mL sample was collected for suspended cell
analysis This was performed by splitting the 12 mL sample into 12 x 1 mL
samples and centrifuging at 4000 rpm for 2 minutes The samples were
centrifuged three times and after each centrifugation the supernatant was
poured out and the cell precipitate washed in distilled water Following the
third centrifugation the cell precipitates were transferred to an empty
glass vial that had been measured beforehand The cell precipitates were
then dried to a constant weight in an 85 degC oven
Mass balance analysis
Overall mass balances were performed to assess the accuracy of each
sample The mass balances were performed by comparing the
stoichiometric amount of glucose required to achieve the experimental
concentrations of SA AA and FA with the experimental amount of glucose
consumed
37 Steady state check
When the time-averaged dosing profile constructed by the LabVIEW
program ceased to fluctuate by a 5 standard deviation of the average
dosing flow it was assumed that the system had reached pseudo-steady
state and the product stream was sampled To further ascertain steady
state the glucose and organic acid concentrations in product samples
frequently taken over a certain period were compared and if negligible
differences were found between the sample data the system was
confirmed to be at steady state
copycopy UUnniivveerrssiittyy ooff PPrreettoorriiaa
40
38 Summary of fermentation
Results were obtained over three continuous fermentation runs Several
other runs were attempted but did not provide any results that were
valuable due to upsets encountered in the system The three runs
mentioned in Table 32 were conducted to prove the repeatability of trends
observed in the first fermentation run
Table 32 Summary of fermentation runs performed
Five different mediums each with a glucose concentration of 33 gmiddotL-1 were
used in fermentation run 1 (R1) This gave an indication of what the
general trend would be of the product distribution The dilution rate was
adjusted until steady state was achieved with only 5 of initial glucose
concentration as residual for the first medium Therefore with the 33 gmiddotL-1
initial glucose a Df of 008 h-1 was set Fermentation run 2 (R2) was
conducted to prove the repeatability of the trend seen in R1 Fermentation
run 3 (R3) was conducted with six different media at a glucose
concentration of 45 gmiddotL-1 and 90 glucose conversion was only achieved
when the Df was lowered to 0041 h-1
Run Operating
hours (h)
Glucose
(gmiddotL-1)
Df
(h-1) Medium No
1 1 008 33 0080 1 2 3 4 5 -
2 1 104 33 0045 1 3 5 - - -
3 1 272 45 0041 1 2 3 4 5 6
copycopy UUnniivveerrssiittyy ooff PPrreettoorriiaa
41
Biofilm attachment and appearance
Approximately 72 hours after inoculation of the bioreactor biofilm started
forming on the glass wall of the reactor A substantial amount of biofilm
inside the bioreactor only formed after plusmn 330 operating hours The
structure and the amount of the biofilm varied throughout the
fermentations and it appeared that the biofilm was dependent on the
following
the surface to which it is attached
the history of the fermentation
the composition of the fermentation medium
Figure 32 (a) shows the bioreactor before inoculation and without cell
attachment After operation for more than 330 hours using only YE as the
nitrogen source a thick mass of biofilm had formed as shown in Figure
32 (b) However as the CSL concentration on the fermentation medium
increased more biofilm started to shed and eventually when only CSL was
used at the nitrogen source there was almost no biofilm attachment on the
glass surface of the bioreactor (as seen in Figure 32 (c))
Although there was not much biofilm on the glass surface there was
biofilm on the internals of the reactor (the wooden sticks covered in terry
cloth) Figure 33 (a amp b) illustrates the sticks covered in biomass at the end
of the fermentations
copycopy UUnniivveerrssiittyy ooff PPrreettoorriiaa
42
Figure 32 a) Bioreactor before inoculation b) Biofilm growth using
only YE as nitrogen source c) Bioreactor with only CSL as nitrogen source
(a) (b) (c)
copycopy UUnniivveerrssiittyy ooff PPrreettoorriiaa
43
Figure 33 a) Internal support for biofilm attachment (at the end of
fermentation run 1) b)Internal supports for biofilm attachment (at the end
of fermentation run 3)
(a) (b)
copycopy UUnniivveerrssiittyy ooff PPrreettoorriiaa
44
4 Results and Discussion
41 Experimental strategy for different runs
The objective of R1 (fermentation run 1) was to find steady state data that
could be analysed to understand the influence of YE and CSL on the growth
and productivity of A succinogenes As seen in Table 31 the media used in
the experiments differed from each other regarding the concentrations of
CSL and YE but the total complex nitrogen source concentration in the
media remained constant The intended experimental plan was to report
the steady state product concentrations as the concentration of YE in the
growth medium varied (ie as the YE concentration decreased and the CSL
concentration increased) R2 (fermentation run 2) which followed the
same procedure as R1 was conducted to prove that the data found in R1
was repeatable R3 (fermentation run 3) was an attempt to achieve high SA
concentrations following the same experimental plan as R1 except that R3
used a high initial glucose feed concentration and had additional internal
support to increase the surface area available for biofilm attachments
All fermentations began with a growth medium that contained only YE as
the nitrogen source (100 YE) and once a healthy and stable biofilm had
formed the growth media were changed according to the procedure
explained in Section 34 Fermentation procedure
Initially R1 had a high biomass content and activity (when only YE was in
the fermentation medium) and as the YE content in the growth medium
decreased the biomass activity decreased R2 was effectively a repetition
of R1 but due to the low initial biomass activity the dilution rate was
adjusted to have approx 95 glucose conversion (when the growth
copycopy UUnniivveerrssiittyy ooff PPrreettoorriiaa
45
medium had only YE as the nitrogen source) Despite the increased surface
area for biofilm attachment the biomass in R3 struggled to achieve the
same activity as R1 Initially the SA concentration was slightly higher but
eventually the results of R3 coincided with those of R2 when CSL was
introduced into the growth medium The dilution rate for R3 could have
been lowered further to reach higher product concentrations but it was
decided not to do this due to time constraints for achieving steady state
Table 41 gives the steady state results for all three runs
copycopy UUnniivveerrssiittyy ooff PPrreettoorriiaa
46
Table 41 Steady state data for the three continuous fermentation runs
Dilution
(h-1)
SA
(gmiddotL-1) AA (gmiddotL-1) FA (gmiddotL-1)
PYR
(gmiddotL-1)
Δ GLC
(gmiddotL-1)
YE ( in nitrogen
source)
Black box mass
balance ()
Average black box
mass balance ()
Average black box
mass balance ()
with DCW
Fermentation run 1
008 1731 814 608 048 3041 10000 8529
008 1685 816 619 050 3067 10000 8347
009 1671 800 612 051 3059 10000 8269 8382
008 1860 702 449 066 2916 6250 8777
008 1872 667 435 079 2917 6250 8716 8747 9581
008 1764 492 263 045 2619 3750 8343
008 1792 494 251 033 2596 3750 8473
008 1778 498 259 031 2596 3750 8441 8419
008 1691 359 183 178 2152 1875 9646
008 1696 349 168 175 2223 1875 9278
008 1669 353 170 172 2107 1875 9687 9537
008 1565 239 064 224 1855 625 9935
008 1411 192 048 290 1808 625 9459
008 1328 176 056 293 1822 625 8921 9438
copycopy UUnniivveerrssiittyy ooff PPrreettoorriiaa
47
Dilution
(h-1)
SA
(gmiddotL-1) AA (gmiddotL-1) FA (gmiddotL-1)
PYR
(gmiddotL-1)
Δ GLC
(gmiddotL-1)
YE ( in nitrogen
source)
Black box mass
balance ()
Average black box
mass balance ()
Average black box
mass balance ()
with DCW
Fermentation Run 2
004 1780 852 569 051 2954 10000 9023
004 1853 878 569 044 2972 10000 9256
004 1874 897 585 040 3004 10000 9287 9189
004 1796 564 248 042 2489 3750 9154
004 1759 582 263 035 2354 3750 9616
004 1760 570 228 038 2561 3750 8760 9177
004 1175 290 071 201 1447 625 10575
004 1106 289 074 199 1455 625 10081
004 1080 283 071 202 1390 625 10357 10338
Fermentation Run 3
004 2253 1022 493 026 3695 10000 8686
004 2257 1009 499 023 3673 10000 8711
004 2205 976 477 025 3656 10000 8522 8640 9138
004 1927 787 298 000 3043 6250 8538
004 1970 803 306 007 3221 6250 8266
004 1991 820 335 005 3242 6250 8344 8383 9213
004 1785 604 128 063 2998 3750 8583
copycopy UUnniivveerrssiittyy ooff PPrreettoorriiaa
48
Dilution
(h-1)
SA
(gmiddotL-1) AA (gmiddotL-1) FA (gmiddotL-1)
PYR
(gmiddotL-1)
Δ GLC
(gmiddotL-1)
YE ( in nitrogen
source)
Black box mass
balance ()
Average black box
mass balance ()
Average black box
mass balance ()
with DCW
004 1879 615 131 069 3092 3750 8572 8568 8974
004 1635 493 028 067 2635 1875 8718
004 1628 486 022 077 2605 1875 8644
004 1578 455 036 080 2664 1875 8431 8598 9919
004 1159 295 000 082 1489 625 9255
004 1110 286 000 098 1955 625 8545
004 1104 275 000 099 1419 625 9630
004 1044 259 000 114 1433 625 8908 9085 11240
004 817 137 000 177 1582 000 6186
004 709 086 000 237 1425 000 8691
004 725 072 000 249 1457 000 6140
004 712 080 000 273 1271 000 7161 7045 7234
copycopy UUnniivveerrssiittyy ooff PPrreettoorriiaa
49
Mass balances or redox balances were performed on all the samples and
the average closures of the steady state samples are shown in Table 41
Mass balance closure did increase as the YE content decreased In R3
DCWs were taken to see if the mass balance closure would reach 100
Including the DCWs significantly improved the mass balance but did not
close it Anything above 90 was considered a proper closure and most
figures that were below 100 may indicate unknown metabolites or non-
perfect analysis of acids and sugars
42 Productivity analysis
Figure 41 shows the average concentrations of SA AA and FA in the
product streams at steady state for all fermentation runs For a clear
comparison of the metabolite concentrations of all the fermentation runs
the results were put into a single plot despite the differences in dilution
rate and glucose feed concentration The reasons for the difference in
dilution rates were explained in Section 41
copycopy UUnniivveerrssiittyy ooff PPrreettoorriiaa
50
R1
R2
R3
SA
FA
AA
Figure 41
(See Table 31)
Figure 42 depicts how SA productivity and the glucose consumption rate
changed as the YE concentration decreased
0
2
4
6
8
10
12
14
16
18
20
22
24
0 10 20 30 40 50 60 70 80 90 100
Co
nce
ntr
atio
n(g
middotL-1
)
YE in Nitrogen Source
Figure 41 Product concentration profiles for SA AA and FA of
A succinogenes as the YE in the growth media varied
The total nitrogen source (combination of YE and CSL) concentration in the
growth medium stayed constant at 16 gmiddotL-1only the concentrations of YE (powder
form) and CSL (liquid form) varied
Commented [B1] In order for the very long captions for Figures 41 to 46 NOT to show in the automatic List of Figures Ive converted the detailed descriptions to normal text
copycopy UUnniivveerrssiittyy ooff PPrreettoorriiaa
51
R1
R2
R3
Productivity SA
Glucose
consumption rate
Figure 42SA productivity profile and glucose consumption rat
A succinogenes as the YE in the growth media varied
(See Table 31)
SA concentration decreased as the concentration of YE was reduced in the
medium When only YE was used as the nitrogen source which is an ideal
ingredient for A succinogenes growth and SA productivity the highest SA
concentration for R2 and R3 was achieved For R1 the SA concentration
was at its highest when the 625 of YE medium was used Despite the
difference in glucose concentration SA concentrations for R1 R2 and R3
0
02
04
06
08
1
12
14
16
18
2
22
24
26
28
3
0
02
04
06
08
1
12
14
16
0 10 20 30 40 50 60 70 80 90 100
Glu
cose
co
nsu
mp
tio
n r
ate
(gL
hr)
Pro
du
ctiv
ity
SA
(gmiddotL
-1middoth
r-1))
of YE in Nitrogen source
Figure 42 SA productivity profile and glucose consumption rate
profiles of A succinogenes as the YE in the growth media varied
The total nitrogen source (combination of YE and CSL) concentration in the
growth medium stayed constant at 16 gmiddotL-1 only the concentrations of YE
(powder form) and CSL(liquid form) varied
copycopy UUnniivveerrssiittyy ooff PPrreettoorriiaa
52
were similar when CSL was added to the medium R3 started with a high SA
concentration as expected but then quickly dropped and displayed the
trend observed in R1 and R2 AA and FA both decreased as the YE content
in the medium decreased for all runs The concentrations for both FA and
AA more or less matched in all runs irrespective of the dilution rate and
the glucose feed concentration When only CSL was used as the nitrogen
source in the growth medium in R3 no FA was produced
The SA productivity trend shown in Figure 42 is the same as the SA
concentration profile The highest SA productivity obtained in this study
was 158 gmiddotL-1middoth-1 when a 625 YE medium was used as the nitrogen
source From Figure 42 it should be clear that the productivities of R1
were almost twice as high as the productivities of R2 The same can be said
for the glucose consumption rates for R1 and R2 This is because the
dilution rate of R1 was also twice as much as the dilution rate of R2
According to Maharaj et al (2014) a decrease in dilution should lead to an
increase in product concentrations and yields R1 and R2 do not follow that
trend Instead their product concentrations profile matched A possible
reason for the inconsistency in the trends could be that there was less
biofilm activity in R2 for an unknown reason compared with the biofilm
activity in R1 resulting in a product concentrations profile match instead of
higher product concentrations in R2 compared with the profile for R1
43 Analysis of product distribution
Metabolite concentrations were used to determine and study the product
distributions YAASA YAAFA and YGLSA of the three fermentations
copycopy UUnniivveerrssiittyy ooff PPrreettoorriiaa
53
In Section 24 the theoretical metabolic flux limitations were discussed and
it was noted that in the absence of biomass formation the maximum
theoretical values for YAASA and YGLSA should be 393gmiddotg-1 and 088 gmiddotg-1
respectively These yields would only be achieved if no FA was produced
ie if only PDH was active However if the PFL route was active and all of
the FA was converted to CO2 and NADH by FDH then the maximum
theoretical yields mentioned earlier could be still achieved If biomass is
produced then a portion of the glucose in the growth medium would be
directed to the anabolic pathway which would influence the carbon
distribution resulting in maximum yields less than those given above
It is illustrated in Figure 43 that YAASA should vary between 197 gmiddotgminus1 (for
YAAFA = 077 gmiddotgminus1) and 393 gmiddotg-1 (for YAAFA = 0 gmiddotgminus1) Using only YE as the
nitrogen source the experimental yields for all runs matched the maximum
theoretical yields that were obtained when only the PFL enzyme was
active As the nitrogen source content varied (ie CSL concentration
increased and YE concentration decreased) YAASA increased and YAAFA
decreased thus indicating a shift in the metabolic flux distribution YAASA for
R2 and R3 were similar throughout the runs so was YAAFA However when
the YE concentration in the nitrogen source was 1875 for R1 and R3
YAASA exceeded the maximum theoretical yield while YAAFA was still in the
range of 0 gmiddotg-1 to 077 gmiddotg-1 The highest YAASA achieved in this study was 83
gmiddotg-1 and the lowest YAAFA was 0 gmiddotg-1 as seen in Figure 43 these yields
were obtained in R3 when only CSL was used as the nitrogen source
Certain batch studies in A succinogenes also achieved a YAASA that exceeded
the maximum theoretical yield (see Section 26 Table 21) but those
studies used YE as the nitrogen source whereas in this study it was
copycopy UUnniivveerrssiittyy ooff PPrreettoorriiaa
54
achieved using only CSL Xi et al (2013) was the only study (batch
fermentation) mentioned in Table 21 that used only CSL as the nitrogen
source with glucose as the carbon substrate and exceeded the maximum
theoretical YAASA They attained a YAASA of 458 gmiddotg-1
copycopy UUnniivveerrssiittyy ooff PPrreettoorriiaa
55
R1
R2
R3
SAAA
FAAA
Figure 43 Experimental yields plotted with the maximum theoretical yields
profile of A succinogenes as YE in medium changes
Considering the flux at the pyruvate node YAAFA decreased and was
approaching zero as the CSL concentration in the nitrogen source
increased as seen in Figure 43 This could be an outcome of an increase in
either PDH or FDH activity or a decrease in activity for both PDH and PFL
resulting in an increased concentration of pyruvate in the product stream
Figure 44 illustrates how the pyruvate concentration increased as the CSL
concentration in the growth medium increased
0
05
1
15
2
25
3
35
4
45
5
55
6
65
7
75
8
85
9
0 10 20 30 40 50 60 70 80 90 100
Mas
s ra
tio
(g
g-1)
YE in Nitrogen Source
SAAA max (PFL)
FAAA max (PFL)
SAAA max (PDH)
FAAA max (PDH)
Figure 43 Experimental yields plotted with the maximum theoretical
yields profile of A succinogenes as YE in medium changes
The total nitrogen source (combination of YE and CSL) concentration in the
growth medium stayed constant at 16 gmiddotL-1 only the concentrations of YE
(powder form) and CSL(liquid form) varied
copycopy UUnniivveerrssiittyy ooff PPrreettoorriiaa
56
(See Table 31)
According to the redox balance it is expected that YAASA would increase as
YAAFA decreased and in this study the same development was observed
This could be linked to the increasing CSL concentration in the nitrogen
source in this study Bradfield amp Nicol (2014) suggested that there could be
an additional reducing power that produced the yields that were achieved
Using carbon and redox balances they noticed in their study that the
experimental YAASA values exceeded the predicted values suggesting that an
increase in PDH or FDH activity was not the only contribution to the
increase in YAASA and that additional reducing power was present The same
0
02
04
06
08
1
12
14
16
18
2
22
24
26
28
3
0 10 20 30 40 50 60 70 80 90 100
Co
nce
ntr
atio
n(g
L)
YE in Nitrogen Source
PYR R1
PYR R2
PYR R3
Figure 44 Pyruvate concentration profile of A succinogenes as YE in
medium changes
The total nitrogen source (combination of YE and CSL) concentration in the
growth medium stayed constant at 16 gmiddotL-1 only the concentrations of YE
(powder form) and CSL(liquid form) varied
copycopy UUnniivveerrssiittyy ooff PPrreettoorriiaa
57
explanation can be applied to this study as seen in Figure 43 The increase
in the YAASA is influenced by the decrease in the YAAFA ratio although it is not
sufficient to reach the expected ratios (according to the redox balance)
(See Table 31)
Figure 45 illustrates the NADH consumed per NADH produced for all
fermentation runs The NADH consumed (mol NADHmiddotcmol glucose-1) was
calculated as follow
09
1
11
12
13
14
15
16
17
18
19
2
0 10 20 30 40 50 60 70 80 90 100
NA
DH
Co
nsu
med
NA
DH
Pro
du
ced
of YE in Nitrogen source
NADH R1
NADH R2
NADH R3
Figure 45 NADH ratio consumed during production of A succinogenes
as YE in medium changes
The total nitrogen source (combination of YE and CSL) concentration in the
growth medium stayed constant at 16 gmiddotL-1 only the concentrations of YE
(powder form) and CSL(liquid form) varied
copycopy UUnniivveerrssiittyy ooff PPrreettoorriiaa
58
2119862119878119860119872119872119878119860
6∆119866119871119862119872119872119866119871119862
frasl (41)
Using Figure 2 Equation 41 was generated The only pathway that
consumed NADH was the path that converted PEP to SA where 2 molecules
of NADH were consumed to produce 1 molecule of SA
The NADH (mol NADHmiddotcmol glucose-1) produced was calculated as follow
(119862119878119860
119872119872119878119860+
2119862119860119860
119872119872119860119860minus
119862119865119860
119872119872119865119860)
6∆119866119871119862
119872119872119866119871119862
frasl (42)
The path from glucose to PEP produced 2 molecules of NADH per one
glucose molecule consumed and from PYR to AA 1 molecule of NADH per
one AA molecule was produced All the inputs for these equations were the
product concentrations obtained from the experimental runs
In Figure 45 it is noted that for all the fermentation runs the ratio of NADH
consumed to NADH produced increased as the concentration of YE in the
growth medium increased Nevertheless there is a clear dissimilarity
between the three runs In R3 the NADH production was higher than the
consumption for all growth media except when only CSL was used as the
nitrogen source R2 and R3 in comparison with R1 did not display a
massive imbalance in the NADH ratio and R1 was the only run where NADH
consumed over produced ratio consistently increased significantly as the
YE content in the growth medium increased It appears that the additional
NADH generation capability of R1 was not fully present in R2 and R3 and
possibly the strains used in R2 and R3 had altered production
copycopy UUnniivveerrssiittyy ooff PPrreettoorriiaa
59
characteristics compared with the original strain Nevertheless the R1
results coincide with the observation of both Bradfield amp Nicol (2014) and
Brink amp Nicol (2014) which was that there was an ldquoexcessrdquo of NADH that
was consumed during the maintenance phasenon-growth phase resulting
in a high YAASA
copycopy UUnniivveerrssiittyy ooff PPrreettoorriiaa
60
(See Table 31)
Figure 46 illustrates the yield of SA on glucose for R1 This graph shows
how the flux from glucose to SA increases as the CSL concentration in the
growth medium increases The trend observed in Figure 46 can be linked
to the ldquoexcessrdquo NADH that favours the production of SA Xi et al (2013)
observed that using only CSL as the nitrogen source provided high
selectivity towards SA (458 gmiddotgminus1) in comparison with other by-products
On the other hand CSL with heme provided a high glucose-to-SA flux
(072 gmiddotgminus1) and a much higher YAASA (493 gmiddotgminus1) A similar observation was
04
043
046
049
052
055
058
061
064
067
07
073
076
079
082
085
088
0 10 20 30 40 50 60 70 80 90 100
Mas
s ra
tio
(g
g-1)
YE in Nitrogen Source
SAGL R1
SAGL max(PFL)SAGL max(PDH)
Figure 46 Mass ratio of succinic acid over glucose profile of
A succinogenes as YE in medium changes
The total nitrogen source (combination of YE and CSL) concentration in the
growth medium stayed constant at 16 gmiddotL-1 only the concentrations of YE
(powder form) and CSL(liquid form) varied
copycopy UUnniivveerrssiittyy ooff PPrreettoorriiaa
61
documented by Yan et al (2013) Xi et al (2012) tried to explain this
observation in their study by stating that CSL contained cofactor biotin
which promoted the high SA selectivity
It is reasonable to postulate that there is an ingredient in CSL that may
trigger or enhance the activity of an additional metabolic pathway known
as the pentose phosphate pathway (PPP) to produce high carbon flux to SA
and high SA selectivity The idea of PPP as the source of the additional
reducing power stems from the findings of Bradfield and Nicol (2014)
Their analysis has shown that if the NADPH generated in the PPP cycle is
converted to NADH in order to supply redox to the SA pathway then high
SA selectivity can be achieved A succinogenes has the transhydrogenase
that allows PPP to be active and as mentioned earlier the presence or
absence of one or more ingredients in CSL may allow this enzyme to be
active consequently activating the PPP as well
Xi et al (2012) did mention biotin as the culprit for the high SA selectivity
They investigated the influence of biotin on A succinogenes growth and SA
productivity by varying the biotin concentration in a chemically defined
medium There was no SA production and cell growth was severely
inhibited when biotin was absent from the growth medium They reported
a high SA yield in their study but their data for AA concentration YGLAA and
YAASA were inconsistent with their observed product concentrations The
following example is extracted from their results In the experiment using
8 mg L-1biotin the glucose consumed was 300 g L-1 CSA = 194 g L-1 CAA =
32 g L-1 YGLAA = 0203 g g-1 and YAASA = 61 g g-1 However the YGLAA should
have been 0107 gmiddotg-1 if CAA was reported correctly but if the value for YAASA
was used as the value of CAA then the reported YGLAA would be correct
copycopy UUnniivveerrssiittyy ooff PPrreettoorriiaa
62
Nevertheless because of the inconsistency of the data it cannot be
concluded that biotin did play a role in gaining a high SA yield
Either the presence or absence of a component in a growth medium can
influence the enzymatic activity of a pathway and this concept should be
used to postulate explanations for the results obtained in this study
A breakdown of the constituents of CSL and YE could help in identifying the
ingredients in CSL that may have triggered or enhanced the activity of the
PPP Since both CSL and YE are complex media and there is no definite
information on the ingredients it is hard to fully confirm the following
theory
Xiao et al (2013) did a study on the constituents of CSL and stated that any
grade of CSL has the following amino acids isoleucine asparagine
methionine lysine proline and aspartic acid YE was reported by an
industrial data sheet (Organotechniereg SAS France) to have a high
content of the following alanine isoleucine leucine methionine
phenylalanine tyrosine and valine Although there are common amino
acids shared between CSL and YE there is one amino acid YE has that is
absent from CSL namely leucine This could be a reason why CSL could be
related to the excess NADH
Leucine in Ecoli is said to repress the transhydrogenase activity which in
turn represses the PPP (Gerolimatos amp Hanson 1978) This could be true
for A succinogenes since it also has the transhydrogenase for PPP as
mentioned in Section 23 A succinogenes with only YE as the nitrogen
source produced yields that were expected according to the carbon and
redox balance It can be postulated that as the YE content reduce the
copycopy UUnniivveerrssiittyy ooff PPrreettoorriiaa
63
leucine content decreased and the activity of the transhydrogenase
increased causing additional NADH to be generated from the enhanced
PPP resulting in improved yields
copycopy UUnniivveerrssiittyy ooff PPrreettoorriiaa
64
5 Conclusions
The complex nitrogen requirements of non-growing A succinogenes
biofilms were evaluated The study restricted itself to the use of YE and CSL
as nitrogen sources The SA productivity yields and titre were the variables
assessed
The YE concentration was decreased while simultaneously increasing the
CSL concentration in the medium Although this led to a decrease in the
steady state productivity of the organism overall SA selectivity increased
The production of certain metabolites such as SA and pyruvate also
increased while FA and AA concentrations decreased in the increasing
absence of YE This led to an increase in the SA to AA mass ratio and to a
decrease in the FA to AA mass ratio When zero amounts of YE were in the
growth medium no FA was produced
Three fermentation runs were performed The highest SA concentration in
this study was 2257gmiddotL-1 when only YE was used as the nitrogen source in
the growth medium and the highest SA productivity obtained in this study
was 158 gmiddotL-1middoth-1 when a combination of YE(625) and CSL(375) was
used as the nitrogen sourceThe highest SA to AA mass ratio achieved was
83 gmiddotg-1 when only CSL was used as the nitrogen source The FA to AA
mass ratio was consistently less than 077 gmiddotg-1 approaching 0 gmiddotg-1 as the
CSL concentration in the nitrogen source increased
Lower FA to AA mass ratio values were not fully responsible for the
increase in the SA to AA mass ratio The surplus NADH required is provided
copycopy UUnniivveerrssiittyy ooff PPrreettoorriiaa
65
by the activation or enhancement of an alternative metabolic pathway ie
the pentose phosphate pathway
The observations made in this study bolster the idea of using a combination
of YE and CSL where YE is the minor component as the nitrogen source for
commercialisation of bio-based succinic acid production using
Asuccinogenes as the catalyst
copycopy UUnniivveerrssiittyy ooff PPrreettoorriiaa
66
6 References
Allied Market Research (2014) ldquoWorld bio succinic acid market ndash
Opportunities and forecasts 2013ndash2020rdquo [Online]
httpswwwalliedmarketresearchcombio-succinic-acid-market
Beauprez JJ De Mey M and Soetaert WK (2010) ldquoMicrobial succinic acid
production natural versus metabolic engineered producersrdquo Process
Biochem451103ndash1114
Bechthold I Bretz K Kabasci S Kopitzky R and Springer A (2008)
ldquoSuccinic acid a new platform chemical for biobased polymers from
renewable resourcesrdquo Chem Eng Technol 31647ndash654
BioConSepT (2013) ldquoDetermination of market potential for selected
platform chemicalsrdquo [Online] httpwwwbioconsepteuwp-
contentuploadsBioConSepT_Market-potential-for-selected-platform-
chemicals_ppt1pdf
Bozell JJ and Petersen GR (2010) ldquoTechnology development for the
production of biobased products from biorefinery carbohydrates ndash the US
Department of Energyrsquos ldquoTop 10rdquorevisitedrdquo Green Chem 12539ndash554
Bradfield MFA and Nicol W (2014) ldquoContinuous succinic acid production
by Actinobacillus succinogenes in a biofilm reactor steady-state metabolic
flux variationrdquo Biochem Eng J 851ndash7
copycopy UUnniivveerrssiittyy ooff PPrreettoorriiaa
67
Brink HG and Nicol W (2014) ldquoSuccinic acid production with Actinobacillus
succinogenes Rate and yield analysis of chemostat and biofilm culturesrdquo
Microb Cell Fact 13111-122
Chen K Jiang M Wei P Yao J and Wu H (2010)rdquoSuccinic acid production
from acid hydrolysate of corn fiber by Actinobacillus succinogenesrdquo Appl
Biochem Biotechnol 160477ndash485
Cok B Tsiropoulos I Roes AL and Patel MK (2014) ldquoSuccinic acid
production derived from carbohydrates An energy and greenhouse gas
assessment of a platform chemical toward a bio-based economyrdquo Biofuels
Bioprod Bioref 816-29
Corona-Gonzaacutelez RI Bories A Gonzaacutelez Alvarez V and Pelayo-Ortiz C
(2008) ldquoKinetic study of succinic acid production by Actinobacillus
succinogenes ZT-130rdquo Process Biochem 431047ndash1053
Davis R Tao L Tan ECD Biddy MJ Beckham GT Scarlata C Jacobson J
Cafferty K Ross J Lukas J Knorr D and Schoen P(2013) ldquoProcess Design
and Economics for the Conversion of Lignocellulosic Biomass to
Hydrocarbons Dilute-Acid and Enzymatic Deconstruction of Biomass to
Sugars and Biological Conversion of Sugars to Hydrocarbonsrdquo NREL Report
No TP-5100-60223 [Online]
httpwwwnrelgovdocsfy14osti60223pdf
Gerolimatos B and Hanson RL (1978) ldquoRepression of Escherichia coli
pyridine nucleotide transhydrogenase by leucinerdquo J Bacteriol 134(2)394-
400
copycopy UUnniivveerrssiittyy ooff PPrreettoorriiaa
68
Grand-View-Research (2015) ldquoBio-Succinic Acid Market Analysis by
Application (BDO Polyester Polyols PBSPBST Plasticizers Alkyd Resins)
and Segment Forecasts to 2020ldquo [Online]
httpwwwgrandviewresearchcomindustry-analysisbio-succinic-acid-
market ISBN Code 978-1-68038-085-9
Guettler M Rumler D and Jain M (1999) ldquoActinobacillus succinogenes sp
nov a novel succinic-acid-producing strain from the bovine rumenrdquo Int J
Syst Bacteriol 49207ndash216
Gunnarsson IB Karakashev D and Angelidaki I (2014) ldquoSuccinic acid
production by fermentation of Jerusalem artichoke tuberhydrolysate with
Actinobacillus succinogenes 130Zrdquo Ind Crops-Prod 62125ndash129
ICIS (2012)rdquoChemical industry awaits for bio-succinic acid potentialrdquo
[Online]
httpwwwiciscomArticles201201309527521chemical+industry+
awaits+for+biosuccinic+acid+potentialhtml
Jiang M Chen K Liu Z Wei P Ying H and Chang H (2010) ldquoSuccinic acid
production by Actinobacillus succinogenes using spent Brewers yeast
hydrolysate as a nitrogen sourcerdquo Appl Biochem Biotechnol 160 244ndash
254
Jiang M Dai W Xi Y Wu M Kong X Ma J Min Zhang M Chen K and Wei
P (2014) ldquoSuccinic acid production from sucrose by Actinobacillus
succinogenes NJ113rdquo BioresourTechnol 153327ndash332
copycopy UUnniivveerrssiittyy ooff PPrreettoorriiaa
69
Kaneuchi C Seki M and Komagata K (1988) ldquoProduction of succinic acid
from citric acid and related acids by Lactobacillus strainsrdquo Appl Environ
Microbiol 543053ndash3056
Kasprow RP Lange AJ and Kirwan DJ (1998)ldquoCorrelation of fermentation
yield with yeast extract composition as characterized by near-infrared
spectroscopyrdquo Biotechnol Prog 14318minus325
Kwon S Lee PC Lee EG Chang YK and Chang N (2000) ldquoProduction of
lactic acid by Lactobacillus rhamnosus with Vitamin-supplemented soybean
hydrolysaterdquo Enzyme Microb Technol 26209-215
Lee PC Lee WG Kwon S Lee SY and Chang HN (2000) ldquoBatch and
continuous cultivation of Anaerobiospirillum succiniciproducens for the
production of succinic acid from wheyrdquo Appl Microbiol Biotechnol 5423ndash
27
Lee PC Lee SY Hong SH and Chang HN (2002) ldquoIsolation and
characterization of a new succinic acid-producing bacterium Mannheimia
succiniciproducens MBEL55E from bovine rumenrdquo Appl Microbiol
Biotechnol 58(5)663ndash668
Lin H Bennett GN and San KY (2005) ldquoFed-batch culture of a
metabolically engineered Escherichia coli strain designed for high-level
succinate production and yield under aerobic conditions rdquoBiotechnol
Bioeng 90775ndash779
copycopy UUnniivveerrssiittyy ooff PPrreettoorriiaa
70
Lin SKC Du C Koutinas A Wang R amp Webb C (2008) ldquoSubstrate and
product inhibition kinetics in succinic acid production by Actinobacillus
succinogenesrdquo Biochem Eng J 41(2)128ndash135
Liu YP Zheng P Sun ZH Ni Y Dong JJ and Zhu LL (2008) ldquoEconomical
succinic acid production from cane molasses by Actinobacillus
succinogenesrdquo Bioresour Technol 991736ndash1742
Maharaj K Bradfield MFA and Nicol W (2014) ldquoSuccinic acid-producing
biofilms of Actinobacillus succinogenes Reproducibility stability and
productivityrdquo Appl Microbiol Biotechnol 98(17)7379ndash7386
McKinlay JB Zeikus JG amp Vieille C (2005) ldquoInsights into Actinobacillus
succinogenes fermentative metabolism in a chemically defined growth
mediumrdquo Appl Environ Microbiol 71(11) 6651ndash6656
McKinlay JB Vieille C and Zeikus JG (2007) ldquoProspects for a bio-based
succinate industryrdquo Appl Microbiol Biotechnol 76727ndash740
McKinlay JB Laivenieks M Schindler BD McKinlay A Siddaramappa S
Challacombe JF Lowry SR Clum A Lapidus AL and Burkhart KB (2010)
ldquoA genomic perspective on the potential of Actinobacillus succinogenes for
industrial succinate productionrdquo BMC Genomics 11 (1) 680
Nghiem NP Davison BH Suttle BE and Richardson GR (1997)
ldquoProduction of succinic acid by Anaerobiospirillum succiniciproducensrdquo Appl
Biochem Biotechnol 63ndash65 565ndash576
copycopy UUnniivveerrssiittyy ooff PPrreettoorriiaa
71
Oh I Lee H Park C Lee SY and Lee J (2008) ldquoSuccinic acid production by
continuous fermentation process using Mannheimia succiniciproducens
LPK7rdquo J Microbiol Biotechnol 18908ndash912
Organotechniereg SAS (2008) ldquoTechnical Data Sheet Yeast Extract 19512rdquo
[Online] httpwwworganotechniecomdoc_en19512pdf [accessed 22
November 2015]
Rosche B Li XZ Hauer B Schmid A and Buehler K (2009) ldquoMicrobial
biofilms A concept for industrial catalysisrdquo Trends Biotechnol 27636ndash43
DOI 101016jtibtech200908001
Ruumlhl M Le Coq D Aymerich S and Sauer U (2012) ldquo13C-flux analysis
reveals NADPH balancing transhydrogenation cycles in stationary phase of
nitrogen-starving Bacillus subtilisrdquo JBiolChem 287(33) 27959ndash27970
Shen N Qin Y Wang Q Liao S Zhu J Zhu Q Mi H Adhikari B Wei Y and
Huang R (2015) ldquoProduction of succinic acid from sugarcane molasses
supplemented with a mixture of corn steep liquor powder and peanut meal
as nitrogen sources by Actinobacillus succinogenesrdquo Appl Microbiol 60544-
551
Shuler M and Kargi F (2002) ldquoBioprocess Engineering Basic Conceptsrdquo 2nd
ed Prentice Hall New York
Song H and Lee SY (2006) ldquoProduction of succinic acid by bacterial
fermentationrdquo Enzyme MicrobTechnol 39-(3)352ndash361
copycopy UUnniivveerrssiittyy ooff PPrreettoorriiaa
72
Spector MP (2009) ldquoMetabolism central (intermediary)rdquo in M Schaechter
(Ed) Encyclopedia of Microbiology 3rd ed Academic Press Oxford 242ndash
264
Sridee W Laopaiboon L Jaisil P and Laopaiboon P (2011) ldquoThe use of
dried spent yeast as a low-cost nitrogen supplement in ethanol
fermentation from sweet sorghum juice under very high gravity
conditionsrdquo Electron JBiotechnol14(6)1-15
Transparency-Market-Research (2014) ldquoSuccinic acid market for 14-bdo
resin coatings dyes amp inks pharmaceutical polyurethane food
plasticizers cosmetics solvents amp lubricants and de-icing solutions
applications-Global industry analysis size share growth trends and
forecast 2012ndash2018rdquo [Online]
httpwwwtransparencymarketresearchcomsuccinic-acidhtml
Urbance SE Pometto AL DiSpirito A and Demirci A (2003) ldquoMedium
evaluation and plastic composite support ingredient selection for biofilm
formation and succinic acid production by Actinobacillus succinogenesrdquo
Food Biotechnol 17(1)53ndash65
Urbance SE Pometto AL DiSpirito A and Denli Y (2004) ldquoEvaluation of
succinic acid continuous and repeat-batch biofilm fermentation by
Actinobacillus succinogenes using plastic composite support bioreactorsrdquo
ApplMicrobiolBiotechnol 65 (6)664ndash70
Van der Werf MJ Guettler MV Jain MK and Zeikus JG (1997)
ldquoEnvironmental and physiological factors affecting the succinate product
copycopy UUnniivveerrssiittyy ooff PPrreettoorriiaa
73
ratio during carbohydrate fermentation by Actinobacillus sp 130Zrdquo Arch
Microbiol 167332ndash342
Van Heerden CD and Nicol W (2013a) ldquoContinuous and batch cultures of
Escherichia coli KJ134 for succinic acid fermentation Metabolic flux
distributions and production characteristicsrdquo Microb Cell Fact 12-(1) 80-
90
Van Heerden CD and Nicol W (2013b) ldquoContinuous succinic acid
fermentation by Actinobacillus succinogenesrdquo Biochem EngJ 735ndash11
Villadsen J Nielsen J amp Lideacuten G (2011) ldquoBioreaction Engineering
Principlesrdquo 3rd ed Springer US Boston MA
Werpy T and Petersen G (2004) ldquoTop value added chemicals from
biomass Vol 1 Results of screening for potential candidates from sugars
and synthesis gasrdquo National Renewable Energy Lab Golden CO US
Xi Y Chen K Xu R Zhang J Bai X Jiang M Wei P and Chen J (2012)
ldquoEffect of biotin and a similar compound on succinic acid fermentation by
Actinobacillus succinogenes in a chemically defined mediumrdquo Biochem Eng
J 6987ndash92
Xi Y Chen K Dai W Ma J Zhang M Jiang M Wei P and Ouyang PK
(2013) ldquoSuccinic acid production by Actinobacillus succinogenes NJ113
using corn steep liquor powder as nitrogen sourcerdquo Bioresour Technol
136 775ndash779
copycopy UUnniivveerrssiittyy ooff PPrreettoorriiaa
74
Xiao X Hou Y Liu Y Liu Y Zhao H Dong L Du J Wang Y Bai G and Luo
G (2013) ldquoClassification and analysis of corn steep liquor by UPLCQ-TOF
MS and HPLCrdquo Talanta 107344ndash348
Xu J and Guo B (2010) ldquoMicrobial succinic acid its polymer poly(butylene
succinate) and applicationsrdquo Plastics from Bacteria Natural Functions and
Applications Microbiology Monographs Vol 14 Springer Verlag
BerlinHeidelberg DOI 101007978-3-642-03287514
Yan Q Zheng P Dong JJ and Sun ZH (2013) ldquoA fibrous bed bioreactor to
improve the productivity of succinic acid by Actinobacillus succinogenesrdquo
JChemTechnolBiotechnol 89(11)1760-1766DOI101002jctb4257
Yan Q Zheng P Tao S and Donga J (2014) ldquoFermentation process for
continuous production of succinic acid in a fibrous bed bioreactorrdquo
Biochem Eng J 9192-98
Zeikus JG Jain MK and Elankovan P (1999) ldquoBiotechnology of succinic acid
production and markets for derived industrial productsrdquo Appl Microbiol
Biotechnol 51545ndash552
Zheng P Dong J Sun Z Ni Y and Fang L (2009) ldquoFermentative production
of succinic acid from straw hydrolysate by Actinobacillus succinogenesrdquo
Bioresour Technol 100 2425ndash2429
copycopy UUnniivveerrssiittyy ooff PPrreettoorriiaa