continuous quality improvement in afterschool settings …cypq.org/sites/cypq.org/files/ypqitech...
TRANSCRIPT

Center for YouthDavid P. Weikart
Program Quality
The David P. Weikart Center for Youth Program Quality is a division of
CONTINUOUS QUALITY IMPROVEMENT IN AFTERSCHOOL SETTINGS:Impact findings from the Youth Program Quality Intervention study
Charles SmithTom Akiva
Samantha SugarThomas Devaney
David P. Weikart Center for Youth Program Quality
Yun-Jia LoKenneth Frank
Michigan State University
Stephen C. PeckKai S. Cortina
University of Michigan
This report is based on a grant awarded by the William T. Grant Foundation.

Continuous Quality Improvement in Afterschool Settings
i
Acknowledgements This study represents a collaborative effort of state agencies, school districts, local intermediary organizations, and most importantly, afterschool program providers. We appreciate the willingness of many individuals and organizations to volunteer for the study, participate in the professional development, and respond to requests for data, feedback, and access to program settings. Karen Pittman and David Gleason assured organizational and financial supports for the study team to complete its work. Advice regarding intervention design and delivery was provided by Dominique Arrieux, Dale Blyth, David Hansen, Reed Larson, Deborah Moore, Lisa Pelle, and Lorraine Thoreson. Joe Bertoletti, Julie Blazevski, Monica Jones, Stephanie Love, and Lee Pearson supported implementation of the study design, data collection and data management. During the analysis phase, we were also fortunate to have the advice of technical consultants and grantees from the W. T. Grant Setting Research Group, especially Howard Bloom, Steve Raudenbush, and Andres Martinez. We also benefitted greatly from review of an early draft of the manuscript by Howard Bloom, Joe Durlak, Cliff Johnson, Rebecca Maynard, Steve Raudenbush, and Nicole Yohalem. These comments were very helpful, although we accept all responsibility for the final product. Finally, we wish to extend special thanks to Bob Granger, president of the William T. Grant Foundation for his encouragement of our work, and for inviting us to attend grantee meetings in Washington, D.C., where we had the opportunity to meet other researchers, practitioners and policy advocates working in the after-school arena. This exposure made for a better study. This study was funded by the William T. Grant Foundation, grant number 7352.
Disclosure of Potential Conflict of Interest The research team for this study was located at the David P. Weikart Center for Youth Program Quality at the Forum for Youth Investment. The Weikart Center is also the primary distributor of the Youth Program Quality Intervention, the primary object of study.
Suggested Citation Smith, C., Akiva, T., Sugar, S. A., Lo, Y. J., Frank, K. A., Peck, S. C., Cortina, K. S. & Devaney, T. (2012). Continuous quality improvement in afterschool settings: Impact findings from the Youth Program Quality Intervention study. Washington, DC: Forum for Youth Investment.
Information about the Study This document may be retrieved from www.cypq.org/ypqi. Additional questions about this study or related work may be addressed to: Charles Smith, Ph.D. David P. Weikart Center for Youth Program Quality 124 Pearl Street, Suite 601, Ypsilanti, Michigan 48198 Email: [email protected]

ii
Table of Contents Acknowledgements ................................................................................................................................................................ i List of Tables ......................................................................................................................................................................... vi List of Figures ....................................................................................................................................................................... ix CHAPTER 1 OVERVIEW ................................................................................................................................................ 1
A. Background ................................................................................................................................................................. 2 a. Instructional Quality in Afterschool Settings ...................................................................................................... 4 b. Improving Instruction with Training and Coaching ......................................................................................... 5 c. Managing for Continuous Improvement ............................................................................................................ 6 d. Quality Accountability and Improvement Policies ............................................................................................ 7 e. Summary ................................................................................................................................................................... 9
B. Theory of Action, Research Questions, and Study Summary .............................................................................. 9 a. Theory of Action ..................................................................................................................................................... 9 b. Questions Addressed ............................................................................................................................................ 11 c. Study Summary ...................................................................................................................................................... 12
CHAPTER 2 STUDY DESIGN ...................................................................................................................................... 16
A. Recruitment, Randomization, and Site Retention .............................................................................................. 16 a. Recruitment ............................................................................................................................................................ 16 b. Randomization ..................................................................................................................................................... 18 c. Network Characteristics and Retention of the Site Samples .......................................................................... 19
B. Data Collection Procedures ..................................................................................................................................... 21 a. Program-Wide Data Collection ........................................................................................................................... 22 b. Offering Session Data Collection ........................................................................................................................ 23
C. Baseline Characteristics of the Intervention and Control Groups .................................................................... 24 D. Outcome Measures .................................................................................................................................................. 27
a. Manager Improvement Focus ............................................................................................................................. 27 b. Continuous Improvement Practices ................................................................................................................. 27 c. Instructional Practices Measures ......................................................................................................................... 28 d. Staff Employment Tenure ................................................................................................................................... 28
E. Estimation Methods ................................................................................................................................................. 29 a. Missing Data ........................................................................................................................................................... 30 b. Statistical Precision and Significance Testing ................................................................................................... 31
F. External Validity ....................................................................................................................................................... 31 CHAPTER 3 INTERVENTION DESIGN AND IMPLEMENTATION .......................................................................................................................................... 33
A. Intervention Design Elements and Sequence ...................................................................................................... 33 a. Intervention Supports ........................................................................................................................................... 34 b. Participation in Intervention Supports .............................................................................................................. 34 c. YPQI Continuous Improvement Practices ....................................................................................................... 35 d. Implementation Fidelity ........................................................................................................................................ 36 e. Adaptation .............................................................................................................................................................. 38

Continuous Quality Improvement in Afterschool Settings
iii
B. Estimates for Time and Cost of the YPQI ........................................................................................................... 40 a. Time Required for Intervention and Implementation ..................................................................................... 40 b. Estimated Costs for the YPQI ............................................................................................................................ 41
CHAPTER 4 IMPACT FINDINGS ............................................................................................................................... 42
A. Understanding the Impact Tables .......................................................................................................................... 42 B. Impact on Primary Outcome of Interest ............................................................................................................... 43
a. Impact on Manager Improvement Focus .......................................................................................................... 43 b. Impacts on Manager and Staff Continuous Improvement Practice ............................................................. 43 c. Impact on the Quality of Instruction ................................................................................................................ 45 d. Impacts on Staff Employment Tenure ............................................................................................................. 46
C. Evaluating the YPQI Theory of Action ................................................................................................................ 47 a. Pattern of Impact Across the Instructional Practices ....................................................................................... 47 b. Variability of Impacts Across Networks ............................................................................................................ 49 c. Cascading Effects .................................................................................................................................................. 50
CHAPTER 5 IMPLEMENTATION FINDINGS ..................................................................................................... 53
A. Does Higher Fidelity Implementation of Continuous Improvement Practices Increase the Quality of Instruction? ...................................................................................................................... 54 a. Analytic Approach ................................................................................................................................................. 54 b. Findings .................................................................................................................................................................. 55
B. Do Structural Features Moderate the Effect of Continuous Improvement Practices on Instructional Practices? ....................................................................................................................................... 56 a. Analytic Approach ................................................................................................................................................. 57 b. Findings .................................................................................................................................................................. 57
C. Was Implementation Fidelity Sustained Through the End of the Follow-Up Year? Did Control Group Levels of Implementation Increase After Receiving Access to the YPQI? ................. 58 a. Analytic Approach ................................................................................................................................................. 59 b. Findings .................................................................................................................................................................. 60
REFERENCES ................................................................................................................................................................... 63 APPENDIX A: DETAIL ON YPQI THEORY OF ACTION AND DESIGN ELEMENTS ...................... A-1
A. YPQI Theory of Action ........................................................................................................................................ A-2 a. Box A, Figure 1: Continuous Improvement Practices ................................................................................. A-3 b. Box B: Instructional Practices .......................................................................................................................... A-4
B. Detailed Description of Intervention Supports ............................................................................................... A-6 a. Youth Work Management ................................................................................................................................ A-7 b. Youth Work Methods ....................................................................................................................................... A-8 c. Technical Assistance (TA) Coach Model ........................................................................................................ A-9
APPENDIX B: EXTERNAL VALIDITY ................................................................................................................ B-1
A. Comparison of the YPQI Sample to Samples in Other Studies ...................................................................... B-2 B. By-Network Comparisons of the YPQI Network Samples to Other Network Sites .................................. B-3

iv
APPENDIX C: DETAIL ON DATA COLLECTION AND MEASURES ...................................................... C-1 A. Amount of Data Collected During Baseline and Implementation Years ..................................................... C-2 B. Site Attrition Analyses ........................................................................................................................................... C-4 C. Outcome Measures ................................................................................................................................................ C-6
a. Continuous Improvement Practices ................................................................................................................ C-6 b. Staff Instructional Practices .............................................................................................................................. C-7
D. Comprehensive Summary of Constructs and Indexes from the YPQI Study ........................................... C-12 a. Program-Wide Measures ................................................................................................................................. C-12 b. Program-Offering Session Data Collection ................................................................................................. C-16
APPENDIX D: RELIABILITY OF THE STAFF INSTRUCTIONAL PRACTICES TOTAL SCORE .... D-1
A. Data Collector Training and Reliability Check Findings ................................................................................. D-2 B. Summary Findings from the Youth PQA Reliability Study .................................................................................. D-3
a. Introduction ........................................................................................................................................................ D-3 b. Sample and Data Structure .............................................................................................................................. D-3 c. Measures ................................................................................................................................................................ D-4 d. Theoretical and Observational Models ........................................................................................................... D-4 e. Results .................................................................................................................................................................. D-6 f. Improving the reliability of program offering assessments .......................................................................... D-7
APPENDIX E: DETAILS ON INTERVENTION FIDELITY AND ESTIMATED TIME AND COST FOR THE YPQI ..................................................................................................................................... E-1
A. Manager and Staff Participation in YPQI Supports by Network and Overall ............................................. E-2 B. Implementation of Continuous Improvement Practices .................................................................................. E-5 C. Staff Implementation in the Follow-up Year ..................................................................................................... E-7 D. Estimated Time and Cost for the YPQI ............................................................................................................ E-8
APPENDIX F: HYPOTHESIS TESTING AND ESTIMATION MODELS FOR EXPERIMENTAL AND NON-EXPERIMENTAL ANALYSES ............................................................ F-1
A. Multiple Hypothesis Testing for the Impact Analyses ...................................................................................... F-2 B. Experimental Estimation Models ......................................................................................................................... F-2
a. Manager Continuous Improvement Practices ................................................................................................ F-3 b. Staff Continuous Improvement Practices ....................................................................................................... F-3 c. Staff Instructional Practices .............................................................................................................................. F-5 d. Effects by Network and Tests for Heterogeneity of Impact Between Networks ................................... F-5
C. Non-Experimental Estimation Models ............................................................................................................... F-6 a. Estimation Models for the Implementation Analyses ................................................................................... F-7 b. Estimation Methods for Follow-up Year Growth Analyses ........................................................................ F-9
APPENDIX G: DETAILS ON COVARIATES AND SUPPORTING IMPACT TABLES FOR MANAGER AND STAFF CONTINUOUS IMPROVEMENT PRACTICES ...................................... G-1
A. Unadjusted Mean Outcomes by Group, Baseline and Implementation Year .............................................. G-2 B. Covariates in the Manager and Staff Continuous Improvement Impact Models ........................................ G-4 C. Individual Network Impact Estimates for Manager and Staff Continuous Improvement Practices ....... G-4
a. Manager Continuous Improvement Practices ............................................................................................... G-5
Continuous Quality Improvement in Afterschool Settings
v
b. Staff Continuous Improvement Practices ...................................................................................................... G-5 APPENDIX H: DETAILS ON COVARIATES AND SUPPORTING IMPACT TABLES FOR STAFF INSTRUCTIONAL PRACTICES ...................................................................................................... H-1
A. Covariates in the Instructional Practices Models .............................................................................................. H-2 B. Unadjusted Mean Outcomes by Group, Baseline, and Implementation Years ........................................... H-4 C. Individual Network Impact Estimates for Staff Instructional Practices ....................................................... H-5
APPENDIX I: MANAGER AND STAFF EMPLOYMENT TENURE ............................................................. I-1
A. Hypotheses Involving Manager and Staff Turnover .......................................................................................... I-2 B. Defining and Tracking Manager and Staff Tenure ............................................................................................. I-3 C. Manager and Staff Employment Tenure in the YPQI Study ............................................................................ I-4
a. Manager Employment Tenure in the YPQI Study ......................................................................................... I-4 b. Staff Employment Tenure in the YPQI Study ................................................................................................ I-5
APPENDIX J: DETAILS AND SUPPORTING TABLES FOR IMPLEMENTATION ANALYSES ........ J-1
A. Does Higher Fidelity Implementation of Continuous Improvement Practices Increase the Quality of Instruction? ..................................................................................................................... J-2
B. Do Structural Features Moderate the Effect of Continuous Improvement on the Quality of Instruction? ............................................................................................................................... J-3

vi
List of Tables Table 2.1 Content Offerings across Baseline Sites ......................................................................................................... 17 Table 2.2 Program Objectives .......................................................................................................................................... 18 Table 2.3. Network Characteristics, Baseline Year (2006-07) ..................................................................................... 20 Table 2.4. Number of Sites in Sample at Baseline and Implementation Years,
by Network and Experimental Status ........................................................................................................... 21 Table 2.5. Data Collected by Measure and Year ............................................................................................................. 22 Table 2.6. Characteristics of the Manager and Staff Samples at Baseline ................................................................... 24 Table 2.7. Characteristics of Youth in the Offering Session Sample at Baseline ...................................................... 25 Table 2.8. Characteristics of the Offering Session Sample at Baseline ....................................................................... 26 Table 2.9. Baseline Differences for Outcome Measures ............................................................................................... 29 Table 3.1. Timeline for Delivery of Supports and Implementation of Continuous Improvement Practices ...... 33 Table 3.2. Percent of Managers Who Participated in Intervention Supports ........................................................... 35 Table 3.3. Implementation Fidelity By Network and Overall – Percentages of Managers, Staff,
and Sites with High Implementation or Non-Implementation ............................................................... 38 Table 3.4. Instructional Practices Selected for Improvement by the Intervention Group ...................................... 40 Table 4.1. Estimated Impact of the Intervention on Manager Improvement Focus ............................................... 43 Table 4.2. Estimated Impact of the Intervention on Manager and Staff Continuous Improvement Practices ... 45 Table 4.3. Estimated Impact of the Intervention on Staff Instructional Practices Total Score ............................ 46 Table 4.4. Estimated Impact of the Intervention on Staff Employment Tenure ..................................................... 47 Table 4.5. Estimated Impact of the Intervention on Staff Instructional Practices Scales ...................................... 49 Table 4.6. Cascading Effects .............................................................................................................................................. 51 Table 4.7. Comparative Impact of the YPQI to Related Interventions ..................................................................... 52 Table 5.1. Estimated Influence of Staff Continuous Improvement Practices
on the Quality of Staff Instruction ................................................................................................................ 56 Table 5.2. Moderation Effects of Manager Turnover, Staff Education Level, and Youth-Adult Ratio
on the Association Between Staff Continuous Improvement Practices and Staff Instructional Practices ............................................................................................................................................................. 58
Table 5.3. Manager Improvement Focus at Three Time Points .................................................................................. 60 Table 5.4. Staff Engagement in Continuous Improvement at Three Time Points ................................................... 61 Table 5.5. Staff Employment Tenure at Three Time Points ....................................................................................... 62 Table A-1. Descriptions of TA Coaching Activities ...................................................................................................... A-9 Table B-1. Comparison of Education Levels and Turnover: The YPQI Sample
and Five Other Afterschool Research Samples ....................................................................................... B-3 Table B-2. YPQI Network Profiles ............................................................................................................................... B-4 Table C-1. Data Collected During Baseline Year by Instrument, Network, and Experimental Status .............. C-2 Table C-2. Data Received During Implementation Year by Instrument, Network, and Experimental Status . C-3

Continuous Quality Improvement in Afterschool Settings
vii
Table C-3. Data Received During the Follow-up Year by Instrument, Network, and Experimental Status .... C-3 Table C-4. Baseline Differences Between Sites Retained and Sites Dropped
During the Implementation Year .............................................................................................................. C-5 Table C-5. Measures of Continuous Improvement Practices for Managers and Staff ......................................... C-7 Table C-6. Measures of Staff Instructional Practices ................................................................................................. C-8 Table D-1. Rater Reliability - Percentage Agreement for the Overall Youth PQA Observation Protocol,
Baseline and Implementation Years ........................................................................................................... D-2 Table D-2. Design of the Youth PQA Reliability Study ............................................................................................ D-4 Table D-3. Variance Decomposition for Total Score ............................................................................................................... D-7 Table D-4. Effect of Number of Raters and Number of Program Offerings on Reliability for Total Score ... D-7 Table E-1. Manager and Staff Participation in YPQI: Percent of Managers and Staff
Attending YPQI Off-Site Trainings ......................................................................................................... E-3 Table E-2. Receipt of Services from a TA Coach in the Intervention Group
During the Implementation Year ............................................................................................................... E-4 Table E-3. Continuous Improvement Practices Implementation: Managers and Staff ....................................... E-5 Table E-4. Manager and Staff Reports of Training Attendance at Youth Work Methods – Baseline and
Implementation Years by Group ............................................................................................................... E-6 Table E-5. Manager and Staff Reports of Youth PQA Use – Baseline and Implementation Years by
Intervention Group ...................................................................................................................................... E-6 Table E-6. Implementation Fidelity in the Follow-up Year: Percentage of Sites with 2 or More Staff
Implementing Continuous Improvement Practices ................................................................................ E-7 Table E-7. Time Estimates: Number of Hours necessary for Full Participation in YPQI Supports
and Full Implementation of Continuous Improvement Practices ....................................................... E-8 Table E-8. Cost (in 2008 U.S. Dollars) of YPQI Intervention During Baseline and Implementation Years,
Overall and by Support Category ............................................................................................................... E-9 Table F-1. A priori and Exploratory Hypotheses for the YPQI Study .................................................................... F-2 Table G-1. Unadjusted Manager Continuous Improvement Practice Scores
for the Implementation Year, Overall, and by Network ....................................................................... G-3 Table G-2. Unadjusted Staff Continuous Improvement Practices Scores
for the Baseline and Implementation Years, Overall, and by Network ............................................... G-3 Table G-3. Staff Survey Measures Used as Pre-tests in the
Manager Continuous Improvement Practice Impact Model ................................................................. G-4 Table G-4. Estimated Impact on Manager Continuous Improvement Practices, by Network………………G-5 Table G-5. Estimated Impact on Staff Continuous Improvement Practices, by Network, all Networks ......... G-6 Table H-1. Characteristics of the Offering Sample: Content and Age of Youth .................................................. H-4 Table H-2. Staff Instructional Practices Total Score: Unadjusted Means
by Network and Intervention Group for Baseline and Implementation Year .................................. H-5 Table H-3. Individual Network Impact Estimates for Staff Instructional Practices Total Score ....................... H-5 Table H-4. Individual Network Impact Estimates for the Staff Disposition Scale .............................................. H-6 Table H-5. Individual Network Impact Estimates for the Welcoming Scale ........................................................ H-6

viii
Table H-6. Individual Network Impact Estimates for the Inclusion Scale ............................................................ H-6 Table H-7. Individual Network Impact Estimates for the Conflict Resolution Scale .......................................... H-6 Table H-8. Individual Network Impact Estimates for the Skill Building Scale ..................................................... H-7 Table H-9. Individual Network Impact Estimates for the Grouping Scale ........................................................... H-7 Table H-10. Individual Network Impact Estimates for the Planning Scale ........................................................... H-7 Table H-11. Individual Network Impact Estimates for the Choice Scale .............................................................. H-7 Table H-12. Individual Network Impact Estimates for the Reflection Scale ......................................................... H-8 Table I-1. Percentage of Staff Completing YPQI Surveys at the Beginning of the Baseline Year
and the End of the Implementation Year ................................................................................................. I-3 Table I-2. Manager 10-Month and 2-Year Tenure by Study Year ............................................................................. I-4 Table I-3. All Staff 10-Month and 2-Year Tenure by Study Year .............................................................................. I-6 Table I-4. Employment Tenure for Staff Who Work 20 Hours or More Each Week ........................................... I-7 Table I-5. Correlations for Manager and Staff Employment Tenure ......................................................................... I-7 Table J-1. Instrumental Variable Model: Step 1 ............................................................................................................. J-2 Table J-2. Instrumental Variable Model: Step 2 ............................................................................................................. J-3 Table J-3. Moderation Effects .......................................................................................................................................... J-4

Continuous Quality Improvement in Afterschool Settings
ix
List of Figures Figure 1.1. Pyramid of Instructional Quality ..................................................................................................................... 5 Figure 1.2. YPQI Theory of Action ................................................................................................................................. 10 Figure 1.3. YPQI Study Design Summary ....................................................................................................................... 14 Figure 1.4. Definition of Key Terms ............................................................................................................................... 15 Figure A-1. Detailed YPQI Theory of Action ............................................................................................................. A-3 Figure A-2. Excerpt from Youth Work Methods Guidebook .................................................................................. A-5 Figure C-1. Staff Instructional Practices Scales and Items ......................................................................................... C-9 Figure F-1. Experimental Impact Model: Manager Continuous Improvement Practices .................................... F-3 Figure F-2. Experimental Impact Model: Staff Continuous Improvement Practices ............................................ F-4 Figure F-3. Experimental Impact Model: Staff Instructional Practices ................................................................... F-5 Figure F-4. Experimental Impact by Networks Model: Staff Instructional Practices ........................................... F-6 Figure F-5. Instrumental Variables Analysis Step 1 ..................................................................................................... F-8 Figure F-6. Instrumental Variables Analysis Step 2 ..................................................................................................... F-8 Figure F-7. Manager Improvement Focus Growth Model ........................................................................................ F-9 Figure H-1: Description of Content Codes used with the Offering Sample .......................................................... H-3

1
Chapter 1
Overview The range of organized activities offered during out-of-school time (OST) has grown tremendously in recent years (Pittman, Tolman, & Yohalem, 2005). Funding for large-scale afterschool programs has also increased, including the one billion dollar annual federal 21st Century Community Learning Center (CCLC) program (U.S. Department of Education, 2011) and the state of California’s $550 Million After School Education and Safety Program (California AfterSchool Network, 2007-2011). Today, participation in organized activities is a normative experience, with the majority of the nation’s youth reporting attendance at least once a week in some OST activities (Duffett & Johnson, 2004; Mahoney, Harris, & Eccles, 2006). Research in this field has grown as well, particularly in the last decade. By far, most of this research has focused on the academic, developmental, and behavioral outcomes of participation in various organized activities. In contrast, very little rigorous research has focused on program quality and even less attention has been given to the critical task of building capacity in the afterschool workforce to consistently deliver high-quality OST experiences for youth.
This report summarizes findings from the three-year Youth Program Quality Intervention Study conducted by the David P. Weikart Center for Youth Program Quality at the Forum for Youth Investment. The research took place between 2006 and 2009 and was supported by funding from the William T. Grant Foundation.1 The study was designed to examine the impact of the Youth Program Quality Intervention (YPQI) in school and community-based sites serving youth aged 10 to 18 during the afterschool hours. The YPQI is a data-driven continuous improvement intervention2 anchored by a standardized assessment for the quality of afterschool instruction. The YPQI Study was designed to assess the impact of continuous improvement practices and to extend understanding of how, where and why continuous improvement interventions might work.
Although the YPQI Study was designed to test a number of specific hypotheses related to impact and implementation, the results from the study are also intended to inform a number of field-level questions which pertain more directly to policies enacted by public sector agencies, private foundations, and community-based organizations. These questions include the following:
• Can the quality of instruction in afterschool settings be improved systematically by building the capacity of site managers to lead a data-driven continuous improvement process?
• Can the intervention model be carried out using resources normally available to public agencies and community-based organizations and under conditions of extreme variation in the structure, purposes, and funding of afterschool programs?
• Will afterschool organizations choose to implement continuous improvement intervention under lower stakes conditions where compliance is focused on the improvement process rather than attainment of pre-determined levels of quality?
1 Grant # 7352, Title: Youth Program Quality Intervention, Principal Investigator: Dr. Charles Smith. 2 The term continuous improvement is used in business, education, and other areas to signify ongoing efforts to improve quality in terms of products, services, or processes.
Continuous Quality Improvement in Afterschool Settings
2
Chapter 1 is divided into two sections. The first reviews research literature and the second introduces the intervention theory of action and the study’s research questions. Chapter 2 outlines the study design, methods, sample, instrumentation, and approach to estimating impact. Chapter 3 describes implementation of the YPQI design elements. Chapters 4 and 5 provide focal findings from the study. Detailed appendices supplement the information and analyses presented in the main body of the report. The study period was approximately 28 months, and this technical report presents findings from the full study period: baseline year (spring 2007), implementation year (2007-2008), and follow-up year (2008-2009).
Background As investments in the afterschool field have grown over the past decade, so too has the body of theory and empirical evidence suggesting that OST settings can serve as important developmental contexts for youth (for review, see Mahoney, Vandell, Simpkins, & Zarrett, 2009). Afterschool settings can provide childcare for working parents, safe places for youth during OST, and assistance with homework completion, services that are important to parents and policy makers alike (Halpern, 2003). Organized activities during OST can also provide opportunities for youth to experience a rich array of content – cultural, artistic, scientific, recreational and natural – that is available in communities but not usually in schools and not to all households due to cost of time, transportation, and tuition (Pedersen & Seidman, 2005). Afterschool settings can also provide exposure to instructional methods less focused on memorization and test preparation which animate school day routines, and more focused on individual youths’ needs, interests, imagination, and time (Halpern, 2003).3 There is also substantial evidence that afterschool participation can positively impact academic, behavioral, and attitudinal outcomes (Durlak, Weissberg, & Pachan, 2010; Lauer et al., 2006) as well as specific cognitive, social-emotional and civic skills (e.g., Larson, 2000).
A substantial literature in developmental science suggests that individuals who become interested in and motivated by the activities of a setting increase their learning and development (Csikszentmihalyi & Larson, 1984; Gottfried, Fleming, & Gottfried, 2001; Guay, Boggiano, & Vallerand, 2001; Pearce & Larson, 2010; Shernoff & Vandell, 2010). Research on motivation (e.g., Deci & Ryan, 1985, 2000) suggests that engagement during learning experiences is increased when learning environments address basic needs for physical safety, emotional support, competence, and autonomy. More specifically, engaging instructional practices that combine positive affect, concentration and moderately-difficult effort, and adult modeling and co-participation in the learning task can promote skill development and skill integration in multiple domains (Fischer & Bidell, 2006; Shernoff & Vandell, 2007; Vygotsky, 1978).
High-quality afterschool programs may in fact be defined by these engaging elements of instruction: rich content options rooted in community resources, instructional methods focused on individuation, and adult supports. In several studies, afterschool settings have been associated with higher levels of youth engagement than either school day settings (Hansen & Larson, 2009; Larson, Walker, & Pearce, 2005; Pearce & Larson, 2010) or unstructured time with peers (Vandell et al., 2005), and heightened levels of
3 See the discussion in Chapter 2. Our experience suggests that “academic enrichment” is the most widely endorsed priority of afterschool programs by afterschool program staff and reflects the commitment to support delivery of school related content using methods that compliment rather than replicate those used during the school day.

3
youth engagement in afterschool has been associated with higher academic performance (Shernoff & Vandell, 2010).
Yet it is clear that not all afterschool contexts offer developmentally powerful experiences. Numerous smaller evaluation studies suggest that afterschool impacts vary and that afterschool settings that lack elements of instructional quality are unlikely to enhance academic or developmental outcomes (Durlak, Weisburg, & Pachan, 2010; Lauer et al, 2006; Granger, 2008). The large-scale experimental studies that have been conducted on the federally funded 21st Century Community Learning Centers Program have found few effects on academic achievement and mixed impacts on other developmental outcomes (Black, Doolittle, Zhu, Unterman, & Grossman, 2008; James-Burdumy et al., 2005). Following educational literature, there is likely a relationship between uneven or low instructional quality in afterschool settings and these weak effects (Cohen, Raudenbush, & Loewenberg Ball, 2003).
For these reasons, the primary impact of interest in the YPQI study is staff instructional practices, defined as the behaviors staff perform in point-of-service settings where youth afterschool experiences occurs. As with most OST researchers, our long-term aim is greater understanding of the relationship of OST and positive youth outcomes; indeed, youth outcome data was collected in the YPQI, and these exploratory findings regarding youth outcomes have been summarized elsewhere.4 However, full understanding of the role of OST in young people’s lives requires substantial consideration of the ability of organizations to consistently produce youth experiences that are likely to lead to both engagement and skill-building.
The idea that instructional quality matters, and that education organizations can be refocused on producing high-quality instruction, is gaining traction throughout the field. Research, funding, and policy-making communities have all endorsed efforts to introduce quality accountability and improvement policies into afterschool networks (Grossman, Lind, Hayes, McMaken, & Gersick, 2009; Metz, Goldsmith & Arbreton, 2008; Princiotta & Fortune, 2009), and a growing number of intermediary organizations are engaged in supporting these policies (Collaborative for Building Afterschool Systems, 2007; Keller, 2010). However, despite this pattern of policy innovation, relatively few intervention designs explicitly address the complex, multilevel nature of afterschool organizations (Durlak & Dupre, 2008), particularly the role that managers may play in driving and sustaining site level improvements. To date, no experimental studies have been conducted to examine the impact of continuous improvement interventions in the afterschool field (Gardner, Roth, & Brooks-Gunn, 2009), and the field lacks evidence regarding the impact, sustainability, scalability, and effective components of interventions designed to produce continuous quality improvement.
The current study addresses this knowledge gap. In the remainder of this section, we review the research literature on continuous improvement of instructional quality as context for the YPQI theory of action and intervention design. We also discuss the relationship between the YPQI design elements and recent innovations in quality accountability and improvement policies in the out-of-school time field.
4 See Akiva, Cortina & Smith (in submission); Akiva, 2012; Akiva, Brummet, Sugar, & Smith (2011); Sugar, Hansen, Wallace, Bertoletti, & Akiva (2010); Akiva, 2009.
Continuous Quality Improvement in Afterschool Settings
4
Instructional Quality in Afterschool Settings Instructional quality is defined by program content and staff behaviors that shape youth experience and is arguably one of the most important features of education settings (Blyth, 2006; Pianta & Hamre, 2009). Instructional quality is particularly important for the afterschool field as both public policies (e.g., 21st Century Community Learning Centers; Mcallion, 2003) and private organizational missions (e.g., Camp Fire USA standards; Camp Fire USA, 2010) are increasingly focused on the positive development and learning of the youth that they serve. However, the unique strength of afterschool as a learning context – great freedom in both the selection of program content and in the determination of qualified instructors – also provides powerful challenges to the definition of high-quality instruction.5 Because content and staffing changes frequently, afterschool organizations often cannot rely upon either content-based definitions of instructional quality (Shulman, 1986) or qualification-based definitions of instructional quality such as a teacher certification. For these reasons, even academically-focused programs have attempted to define quality in terms of more generic and content neutral practices (Institute for Educational Sciences, 2009).
Fortunately, there is wide agreement about generic instructional practices likely to provide positive developmental and learning experiences for youth from an extensive body of school day research (cf. Bransford, Brown, & Cocking, 1999; Eccles & Midgley, 1989; Marzano, 2001) and a small afterschool literature (cf. Grossman, Goldsmith, Sheldon, & Arbeton, 2009; Miller, 2005; Smith, Akiva, & Henry, 2006). Fundamental to these definitions of instructional quality is the idea that adult-child interactions and youth engagement are primary drivers of positive development and learning (Eccles & Gootman, 2002; Larson, Rickman, Gibbons, & Walker, 2009; Pianta & Hamre, 2009). Additional research suggests that high-quality instruction has a hierarchical structure in the sense that establishing a context with supports for physical and emotional safety provides a foundation for higher levels of task engagement and performance (Marzano, 1998; Pianta 2007; Ryan & Deci, 2000; Maslow, 1943).
The definition of instructional quality used in the YPQI is depicted in Figure 1.1 and reflects the domains assessed by the Youth Program Quality Assessment, a standardized observational measure of instructional practice for afterschool and other settings (HighScope, 2005; Smith, Akiva, & Henry, 2006). Figure 1.1 describes staff behaviors that, when enacted together as an instructional approach, support youth engagement with program content and development of skills over time. The pyramid shape of the figure represents the implicit hierarchy in the definition of high-quality instruction; that is, safety and adult and material supports are necessary foundations for higher level interaction and engagement.
Although theory and empirical evidence about instructional quality is increasing, implementation remains inconsistent. Research suggests that many afterschool programs offer only moderate levels of emotional support and very few settings consistently engage youth in cooperative learning and higher-order cognitive work (Granger, Durlak, Yohalem, & Reisner, 2007; Smith, Peck, Denault, Blazevski, & Akiva, 2010). Similar findings exist for early childhood education (Mashburn et al., 2008; Peisner-Feinberg et al., 2000), school-age care (Zellman, Perlaman, Le, & Setodji, 2008), elementary school 5 See Smith & Van Egeren (2008) for a discussion of content and provider diversity in afterschool programs in the state of Michigan’s 21st Century Community Learning Centers Program. During the 2005-2006 school year over 90,000 slots of instruction were delivered by external vendors, primarily in schools, over an extensive range of content, and overwhelmingly by staff who were not certified teachers.

5
Figure 1.1. Pyramid of Instructional Quality
(Pianta, Belsky, Houts, Morrison, & NICHD Study of Early Child Care and Youth Development, 2007), and secondary school settings (Larson & Hansen, 2005; Marks, 2000). A question of central importance to the field then is: What is required to improve instructional quality in afterschool settings?
Improving Instruction with Training and Coaching Training and coaching for teachers and youth workers are widely used forms of professional development for improving the quality of instruction (e.g., Hill, 2007). Dissatisfaction with one-shot trainings (i.e., training workshops without follow-up supports) has led to the identification of several features of effective professional development, including: duration over multiple sessions, active learning methods, an explicit focus on how children learn, greater recognition of learning needs for departmental and/or cross-district teams, and inclusion of additional relevant staff (Desimone, 2009; Garet, Porter, Desimone, Birman, & Yoon, 2001).
However, while professional development interventions are evolving toward more contextual and collaborative approaches focused on measureable adult learning and performance change, the experimental record regarding the effectiveness of training and coaching interventions for front-line instructional staff is small and inconclusive. Recent meta-analyses of experimental and quasi-experimental studies in the education field suggest that training and coaching interventions for teachers have a mixed record of effects on child learning in the areas of literacy, mathematics, and science instruction (Blank, de las Alas, & Smith, 2008; Kennedy, 1998; Yoon, Duncan, Lee, Scarloss, & Shapley, 2007). Answers to critical formative questions about the impact of training and coaching on teacher instructional practices are rare (Kennedy, 1998; Yoon et al., 2007), and findings that do exist in this area are mixed (Blank et al.,

Continuous Quality Improvement in Afterschool Settings
6
2008).6 For example, one recent teacher practice intervention in Head Start, which used validated training content and on-site coaching, demonstrated effects on instructional practices (Raver, Jones, Li-Grinning, Metzger, Champion, & Sardin, 2008), whereas another recent intervention for elementary literacy with similarly research-based training content and extensive on-site coaching showed null effects (Garet, Cronen, Eaton, Kurki, Ludwig et al., 2008). A meta-analysis from the childcare field indicates that the type and intensity of professional development can affect the quality of adult-child interactions as well as child outcomes (Fukkink & Lont, 2007).
A further challenge to the effectiveness of professional development for instructors in the afterschool field is posed by high rates of turnover, often approaching 50% each year. Even if training and coaching interventions for front-line staff were effective, it is unclear how this investment might be sustained over time, and no studies that we reviewed analyzed the effect of professional development for teachers over time.
Managing for Continuous Improvement A growing body of theory and research suggests that site managers, or school principals, can play an important role in changing instructional practices and, ultimately, child achievement (cf., Saunders, Goldenberg, & Gallimore, 2009; Waters, Marzano, & McNulty, 2003). Throughout this report, we employ the phrase continuous improvement to describe organizational features and management practices thought to influence the quality of youth experience at the point of service (i.e., the setting where staff-youth interaction and instruction occurs; see Smith et al., 2010). Across several research literatures, effective continuous improvement practices include: (1) site managers who are focused on improving quality in point of service settings; (2) high and clear expectations by and for staff about instructional practices; (3) technologies of assessment and feedback on performance; (4) in-service training to build professional knowledge and skills; and (5) opportunities for staff participation in decision making through site-based teams.7 These continuous improvement practices represent efforts to permanently change the skill base, culture, technical capacities, and cooperative routines of schools (cf. Fullan, 2008; Joyce & Showers, 2002). More importantly, they acknowledge the multilevel nature of education settings (Raudenbush & Bryk, 2002; Talbert & McLaughlin, 1999) in the sense that education organizations are not just clusters of settings in which instruction is delivered to youth (e.g., classrooms, afterschool program offerings). Education and human service organizations are also made up of settings where managers and staff meet to plan and evaluate services, deploy resources, build capacities, and support staff learning. Further, these organizational settings exist within a broader context of policy decisions and priorities made by higher levels of administration.
In recent years, continuous improvement has become a kind of social movement for education and human services organizations (cf. Fullan, 2008; Kaplan & Norton, 1996; Schmoker, 1996). The small experimental and quasi-experimental record from school day and early childhood literature suggests that 6 No meta-analytic findings are available for the impact of professional development on teacher instructional practices. The reviews discussed in this section included studies that were evaluated for effects on child outcomes, and instructional effects were not the primary focus of the meta-analytic review. 7 A review of research literature in these areas is beyond the scope of this report. We argue that similar concepts are defined in different literatures on school leadership (Fullan, 2008; Leithwood, Louis, Anderson & Wahlstrom, 2004), professional learning communities (InPraxis, 2006; Marks & Louis, 1999), and data-driven change in schools (Halverson, Grigg, Prichett & Thomas, 2005; Mason, 2003).

7
comprehensive school reform models that empower principals and site teams with clear expectations and feedback can improve instructional practices (Rowan, Correnti, Miller, & Camburn, 2009); that interventions designed to support school principals as instructional leaders can increase time spent on instructional improvement as well as student achievement (Saunders, Goldenburg & Gallimore, 2009); and that instructional performance feedback and best practice exemplars can produce positive effects on both preschool instruction and child development (Pianta, Mashburn, Downer, Hamre, & Justice, 2008). Similarly, two comprehensive literature reviews from the promotion and prevention fields identify conditions that are likely to affect implementation of evidence-based practices (Fixsen, Naoom, Blasé, Friedman, & Wallace, 2005; Durlak & DuPre, 2008). First, reviewers noted that an explicit focus on how point-of-service settings are nested within higher levels of organizational and policy contexts is a critical conceptual frame for advancing intervention science because interventions must take account of how “systems trump programs” (Fixsen et al., 2005, p.66) in the sense that policy priorities and organizational capacities appear to have a substantial effect on implementation at the point-of-service level of setting where adults meet children and youth. Second, both reviews noted the importance of routine assessment and performance feedback regarding implementation of practices at the point of service. Notably, very few evaluation studies in the prevention and promotion field have included either intervention models that address organization capacities for continuous improvement or measures of these capacities. Further, neither review located any experimental evaluations of standardized performance assessment and feedback to practitioners in the field of prevention and promotion.
In the afterschool field, few experimental studies have measured organizational capacities or characteristics of the policy context, and even fewer have sought to evaluate intervention models that included continuous improvement practices of site managers (Durlak et al., 2007; Gardner, Roth & Brooks-Gunn, 2009). However, several non-experimental studies have been conducted, each focused on the link between continuous improvement practices and dimensions of program performance (Sheldon & Hopkins, 2008; Miles, 2006; Reisner, White, Russell, & Birmingham, 2004; Metz, Goldsmith & Arbreton, 2008; Spielberger & Lockaby, 2008). These non-experimental findings suggest that continuous improvement interventions can produce positive effects at the point of service. For example, one study in a large afterschool system demonstrated relationships between continuous improvement practices - observational data collection, improvement planning, and training and coaching for instructional staff - and literacy achievement (Sheldon & Hopkins, 2008).
Quality Accountability and Improvement Policies As investments in out-of-school time have increased, so too have efforts to maximize returns through the use of quality accountability and improvement policies.8 Philanthropies have invested in development of these policies in large urban places like Chicago, Providence, Palm Beach County, and New York City (Collaboration for Building Afterschool Systems, 2007; Spielberger & Lockaby, 2008; Wallace Foundation, 2008) and have articulated quality improvement standards for their portfolios of funded individual programs (United Way of America, 2009). Quality accountability and improvement policies are prevalent
8 For the purposes of this discussion, we classify Quality Improvement Systems (QIS), Quality Rating Systems (QRS), and Quality Rating and Improvement Systems (QRIS) as several types in a broader family of quality accountability and improvement policies.

Continuous Quality Improvement in Afterschool Settings
8
in publicly funded early childhood, school age care, and afterschool systems where over the past decade federal and state funding for quality assurance has grown substantially.9
Paralleling discussions of value-added policies in public education, quality assurance policies in the afterschool field can be differentiated by the level of “stakes” that organizations and staff encounter (Hill, 2009; Smith & Akiva, 2008). Many early childhood and school-age care systems employ higher-stakes approaches in which public disclosure of quality ratings is meant to drive quality improvement within programs. The incentives driving improvement efforts are shaped by publicity of performance data and the activation of customer choice to undersubscribe and eventually close settings that are of low quality or do not improve (Zellman, Perlman, Le, & Setodji, 2008). In higher-stakes models, “accountabilities” (i.e., the things organizations are accountable for) are focused on attainment of specific performance levels typically designated by ratings for the quality of point-of-service settings. There are growing concerns, however, about the reliability of performance measures and the availability of improvement supports, both of which may be necessary elements for high stakes accountability systems to drive efficacious improvement behaviors (Tout et al., 2009; Zellman et al., 2008).
“Lower” stakes accountability policies are more common in the afterschool field, particularly in local (e.g., city or county) and state-based networks (e.g., 21st CCLC; CBASS, 2007; Smith et al., 2008, Spielberger et al., 2008). Lower stakes policies typically require production of performance data but do not require publicity to activate consumer choice or require that low performing staff be removed. Rather, lower stakes models require evidence of data-driven improvement planning by a site-based team. Because site managers are accountable for elements of an improvement process, rather than specific thresholds of performance as determined by a quality rating, we refer to this policy model as “lower stakes” (Smith & Akiva, 2008; Smith, Akiva, Arrieux, & Jones, 2006; Smith, Devaney, Akiva, & Sugar, 2009).
The common design elements across all of these policy models, higher and lower stakes alike, are standardized observational assessment of instructional environments and the use of these data for improvement of services to children and youth. The YPQI was designed around these same elements and directly addresses a number of additional attributes of effective quality accountability and improvement described in an emerging literature.10 However, the YPQI Study was explicitly designed to evaluate a continuous improvement intervention deployed under the assumptions of the lower stakes model and is perhaps most valuable when understood in that context because there is so little evaluation evidence available on lower stakes policy designs.
9 In 2007, over 36 states were either implementing or piloting rating and improvement policies in early childhood or school age care networks, with a mix of states employing voluntary or mandatory participation (US Department of Health and Human Services, 2007). In the federally funded 21st Century Community Learning Centers program, at least ten states (and several city- or community-level initiatives including such centers) have adopted the YPQI as a quality assurance model. At present, no good estimate exists for the number of sites, staff, children, and families who are affected by these policy models, but it could easily number over 10,000 child care and afterschool sites across the United States. 10 The National Child Care Information Center names the following characteristics of effective quality rating systems: (a) standards beyond licensing regulations, (b) accountability policies based on assessment and monitoring, (c) program and practitioner outreach and support, and (d) financing incentives specifically linked to compliance with quality standards (United States Department of Health and Human Services, 2007). Tout, Zaslow, Halle, & Forry (2009) suggested that the following factors may limit the impact of such policies: (a) small differences in structure and design (e.g., using different monitoring measures) make cross-site and network comparisons difficult; (b) coordination of improvement supports/momentum is blocked by lack of coordination across agencies, services, and data systems; and (c) policies lack clarity about goals, timeframe, and expectations for actual improvement.
9
Summary The afterschool field suffers from a lack of continuous improvement intervention models capable of addressing the complex, multilevel nature of afterschool organizations and the transience of the afterschool workforce. The YPQI was designed to fit the needs of the field for a site-level continuous improvement model, and the YPQI Study was designed to address knowledge gaps about how to improve afterschool program performance using quality accountability and improvement policies.
The YPQI definition of instructional quality is designed to fit the unique characteristics of the afterschool field – diverse content, diverse staff expertise, and frequently short tenure. Rather than intervening exclusively with training for instructional staff, the YPQI attempts to build the capacity of site managers to introduce and sustain continuous improvement practices based on the standardized assessment of instructional performances. In terms of policy, the intervention was designed to fit a lower stakes quality accountability and improvement system in which site managers are accountable for leading and supporting their staff in the work of continuous improvement – as an alternative to publicizing data for consumer choice or requiring attainment of specific scores.
Theory of Action, Research Questions, and Study Summary
Theory of Action In afterschool settings, instruction delivered at the point of service is embedded within an organization, which itself is embedded within a larger policy context where authority and resources are distributed. The multilevel nature of afterschool programs is analogous to that of schools (Bidwell & Kasarda, 1985; Talbert & McLaughlin, 1999) and other environments where groups of youth are led by adults for learning purposes. Actors within this structure play roles across levels. Site managers, for example, have responsibilities in both the policy and organizational settings. Similarly, instructional staff members act as program planners in the organizational setting and as instructors at the point of service. The manner in which managers and staff navigate their cross-level responsibilities mediates the flow of organizational operations as well as interventions or reforms which are introduced.
Using prior theory and empirical findings from multiple disciplines, including prior evaluations of the YPQI (Smith et al., 2008; Spielberger & Lockaby, 2008), we developed a theory of action describing a multilevel continuous improvement intervention with application in the afterschool field. The theory of action, summarized in Figure 1.2 and described in detail in Appendix A (see Figure A-1), suggests that policy directives and resources targeted at site managers’ capacity for continuous improvement will produce higher levels of staff engagement in these continuous improvement practices, resulting in improvements at the point of service where instruction is delivered to youth. The theory of action further posits that the chain of effects produced by the intervention model – across levels of setting from policy

Continuous Quality Improvement in Afterschool Settings
10
to organization to point of service – will ultimately increase youth content engagement and skill development.11
More specifically, the YPQI is expected to produce effects in the following way. In the first step, a site manager receives messages from network leaders that the YPQI supports (i.e., training, technical assistance and coaching) are important, or required, and engages with these supports. Next, the manager enacts the continuous improvement intervention through a sequence of quality assessment and data-driven planning with a site team at the organization level of setting, followed by a sequence of instructional methods training and coaching focused on improving individual staff performances at the point-of-service level of setting. Each step of this sequence utilizes the Youth Program Quality Assessment (Youth PQA; HighScope, 2005), a standardized, instructional assessment instrument. Finally, the YPQI theory of action suggests that the multilevel impacts of the YPQI will be mediated by managers’ and staffs’ enactment of and engagement with intervention components within each level of setting. Note that both site managers and staff have roles in each of two settings, and the successful “cascade” of causal effects requires a reciprocal pattern of enactment and engagement within and across each level of setting.
Figure 1.2 – YPQI Theory of Action
Evaluations of the YPQI have been conducted as part of the quality accountability and improvement system implemented in Palm Beach County, Florida (Smith et al., 2008; Spielberger & Lockaby, 2006; Spielberger & Lockaby, 2008). These evaluations suggest that:
11 This step requires a description of developmental dynamics that occur within point of service setting: High-quality instruction produces youth engagement during a given session. Quality instruction and youth engagement across multiple sessions produces mastery experiences in various skill domains. These content-specific mastery experiences in the afterschool context produce longer-term skill development and corresponding skill transfer outside of the afterschool setting.
ManagerreceivesaccountabilitymessagesandattendsYPQItraining
Managerenactscontinuousimprovementpractices
Staffengagesincontinuousimprovementpractices
Staffenactsinstructionalpractices
Proximaloutcomes:youthengagewithinstruction
Policycontext
Organizationsetting
Point‐of‐servicesetting
11
• The YPQI training, technical assistance, and coaching sequence was fully utilized by program staff and local agencies, suggesting that the necessary level of participation was feasible for afterschool site managers and staff;
• The YPQI training, technical assistance, and coaching sequence was successfully delivered by a local intermediary, suggesting that the demands of delivery were not too high for an organization that was not the intervention developer;
• Site managers found the Youth PQA and YPQI trainings useful and endorsed the lower stakes policy approach including external assessors and annual submission of self-assessment data and improvement plans;
• Pre- to post-intervention change in quality of instruction occurred in areas selected for improvement by site teams, suggesting that the continuous improvement intervention produced instructional improvement that was detectable by the standardized observational measure (Youth PQA), and correspondingly;
• The Youth PQA was sensitive enough to capture change in the instructional response to the continuous improvement intervention.
With this prior research in hand, the current study was initiated to subject the YPQI to evaluation using experimental methods.
Questions Addressed In the YPQI Study, we addressed questions related to both impact and implementation. In general, impact questions were addressed through confirmatory analyses in the sense that the study was designed to test specific hypotheses about changes in afterschool programs. In this report, we evaluate the following hypotheses regarding impact of the YPQI on afterschool settings:
• Assignment to the intervention group will cause site managers to increase their focus on improving instruction.
• Assignment to the intervention group will increase manager enactment of four continuous improvement practices.
• Assignment to the intervention group will increase staff engagement in four continuous improvement practices.
• Assignment to the intervention group will cause the quality of instructional practices available during afterschool program offerings to improve.
• Assignment to the intervention group will cause the length of staff employment tenure to increase.
We evaluate the first three hypotheses by comparing behavioral outcomes for site managers and staff assigned to the intervention group with a control group that did not receive the YPQI; we evaluate the

Continuous Quality Improvement in Afterschool Settings
12
fourth hypothesis by comparing measures of instructional quality from the intervention group with the control group; and we address the fifth hypothesis by comparing the number of months intervention group staff have worked at the site to the number of months that control group staff have worked at the site. Among these experimental questions, the one regarding the YPQI impact on instructional quality is our central focus.
Whereas impact findings address the questions related to “did it work?”, the YPQI Study also addresses important questions related to implementation. These questions are critical to understanding how, why, and under what circumstances the YPQI is likely to produce impacts. In this report, we address the following research questions related to implementation of the YPQI in afterschool settings:
• What was the range of implementation of continuous improvement practices across both the intervention and control group sites?
• Does the estimated pattern of impact reflect the intentions of intervention site teams as evidenced by improvement plans?
• Does the estimated pattern of impact vary across afterschool policy contexts?
• How does the magnitude of estimated impact compare to studies of other similar interventions?
• Is higher fidelity implementation of continuous improvement practices associated with higher quality instruction?
• How robust is the site-level relationship between continuous improvement and instructional quality across sites with differing structural features?
• During the follow-up year when participation in the YPQI was voluntary for both the intervention and control groups:
o Was implementation of continuous improvement practices maintained in the intervention group?
o Did the control group implement continuous improvement practices at higher levels?
Study Summary The YPQI Study was designed to evaluate the impact of assignment to an intervention group receiving YPQI training, technical assistance, and coaching. To answer the primary impact question, we focus on the comparison of instructional quality in the intervention group and in the control group or counterfactual condition – what would have happened to the intervention group if no YPQI had occurred. The randomly assigned control group in the study was allowed to conduct “business as usual” which means that the performance of the group assigned to the YPQI was compared to control group sites that were also often implementing YPQI-like practices. Impact findings presented in this report represent the intent to treat (ITT), which means all impact estimates reflect the impact of assignment to the intervention condition, despite the fact that: (a) at the time of outcome data collection, not all

13
managers had fully participated in the YPQI training, technical assistance, and coaching (e.g., managers who were hired during the implementation year); and (b) some sites in the control group were implementing YPQI-like practices. The ITT estimate of impact on instructional practices can reasonably be interpreted as the level of effect that would be achieved through a lower stakes quality accountability and improvement policy that included the YPQI as a site-level improvement intervention.
The first year (Baseline Year, 2006-2007) of the YPQI included: (a) network and site recruitment, (b) baseline data collection, (c) random assignment of sites to intervention and waitlisted control conditions, and (d) introduction of the continuous improvement intervention to site managers. The second year (Implementation Year, 2007-2008) of the study included: full implementation of the intervention and the collection of the experimental wave of data at the end of the implementation year. The third year (Follow-up Year, 2008-2009) included: introduction of the YPQI to the waitlisted control group as well as follow-up data collection for the purpose of evaluating the sustainability of YPQI implementation in the intervention group.
An overview of the Youth Program Quality Intervention (YPQI) study design and outcome measures is provided in Figure 1.3. Definitions of key terms used in the report are presented in Figure 1.4. Chapter 2 provides detailed description of the study design, sample, measures, and efficacy of randomization.
The YPQI Study research design offers several strengths in comparison to prior research on instructional improvement. First, the intervention was deployed in a diverse sample of afterschool networks and sites and implemented using resources similar to those available in many public agencies and private organizations supporting afterschool programs. The study and its findings therefore avoid the limitations associated with more tightly controlled efficacy trials which pose challenges for replication or implementation at scale (Wayne, Yoon, Zhu, Cronen & Garet, 2008). Second, our design acknowledges and measures ambient exposure to YPQI-like supports (i.e., training, technical assistance, and coaching) in the control group (Wayne et al., 2008) and the contrast data presented in Chapter 3 strengthen our argument that intervention group managers participated in YPQI-like supports at higher levels than their counterparts assigned to the control condition. Also, in Chapter 5, we depart from the experimental framework and investigate the association between continuous improvement practices and the quality of instruction in all sites, regardless of assignment. Third, use of the Youth PQA as both an element of the intervention and as the primary measure of instructional quality: (a) limits the threat of bias endemic to studies that rely exclusively on self-reports of instructional knowledge and practices to demonstrate effects and (b) increases the chances of finding effects on the outcome of interest due to alignment between the intervention and measures used to detect effects (Fukkink & Lont, 2007).

Continuous Quality Improvement in Afterschool Settings
14
Figure 1.3. YPQI Study Design Summary
• Participants: Eighty-seven afterschool sites participated in the study. Each site employed one full-time manager and between two and ten staff, and served an average of 245 youth annually. Sites were nested within five afterschool networks, each representing a different type of afterschool system, funding source, and policy context. Networks were recruited for the study based on their ability to champion the work, deliver eligible sites, and support local delivery of YPQI training, technical assistance, and coaching. Program offerings covered a wide-range of content areas including leadership, art, academic enrichment, sports, music, and theater.
• Research Design: Within each of the five networks, between 17 and 21 afterschool sites were randomly assigned to either the intervention or control group. The full sample included 43 programs in the intervention group and 44 programs in the control group. Survey data were collected from managers, staff, and youth in all programs prior to randomization (spring 2007), at the end of the implementation year (spring 2008), and again at the end of the follow-up year (spring 2009 – no youth data). External observers rated instructional practices during afterschool program offerings at baseline and at the end of the implementation year. Nearly all data utilized for this report were collected from both intervention and control groups. Because staff were nested within sites and sites were nested within networks, effects for the study were estimated using multilevel statistical models.
• Outcomes Analyzed: Following the hypothesized chain of effects in the YPQI theory of action, this study presents impact estimates for two intermediate outcomes (manager and staff continuous improvement practices) and one primary outcome (instructional quality). Impact findings are also presented for length of staff tenure. A variety of exploratory analyses related to implementation are also presented.

15
Figure 1.4. Definition of Key Terms
• Continuous Improvement Practices – Sequence of management practices including quality
assessment and data-driven planning with a site team at the organizational level of setting, followed by a sequence of training in instructional methods and instructional coaching focused on improving individual staff performances at the point-of-service level of setting. Each step utilizes the Youth Program Quality Assessment (Youth PQA; HighScope, 2005), a standardized assessment of instructional practices.
• Instructional Practices – Set of practices delivered by staff during program offerings (See Figure 1.1). Focal practices in the outcome measure included: staff disposition, welcoming, inclusion, conflict resolution, active skill building, grouping, choice, planning, and reflection.
• Network – A set of afterschool sites that share both geographic proximity (e.g., all within a certain state) and a policy context that defines a type of program (e.g. 21st Century Community Learning Centers). The YPQI study included five networks.
• Site – Location where an afterschool program takes place. Sites were the unit of random assignment in the YPQI study (N=87).
• Policy Context – The policy rules, resources, and administrative environments that guide a network of afterschool sites.
• Organization Setting – Level of setting where managers and program staff meet to discuss, plan, and evaluate delivery of afterschool programs (e.g., staff meetings).
• Point-of-Service Setting – Level of setting where adults deliver instruction to youth during program offerings.
• Program Offerings – A point of service setting where consistent groupings of adults and youth meet over multiple sessions for the same learning purpose (e.g., an 8th grade poetry workshop that meets for a set time each week after school). The Youth Program Quality Assessment was used to assess the quality of staff instruction during program offerings in this study.
• Youth Program Quality Assessment (Youth PQA) – A standardized, diagnostic assessment that measures instructional quality during program offering sessions (HighScope, 2005).
• YPQI Supports – Training, technical assistance and coaching delivered to site managers and staff to build capacity to implement continuous improvement practices.
• Technical Assistance (TA) Coach – Locally recruited professionals who provided assistance to YPQI site managers to use supports and implement continuous improvement practices.

Continuous Quality Improvement in Afterschool Settings
16
Chapter 2
Study Design The Youth Program Quality Intervention Study was conducted in 87 afterschool sites randomly assigned to intervention and control conditions within 5 afterschool networks. This chapter describes: (1) network- and site-level recruitment procedures; (2) the randomization process; (3) sample characteristics at baseline; (4) the measures and estimation methods used to produce impact estimates; and (5) external validity.
Recruitment, Randomization, and Site Retention In this section we describe the process of network and site recruitment and randomization. We also discuss rates of site retention in the study sample from baseline through the implementation and follow-up years. We suggest that randomization procedures were effective and not unduly weakened by site attrition.
Recruitment We intentionally recruited a diverse group of networks into the study in order to test the effectiveness of the YPQI across a heterogeneous group of afterschool policy systems. Afterschool networks were recruited into the study if the network was interested in developing a quality accountability and improvement policy based on the YPQI and could meet the following conditions: recruit 20 independent afterschool sites, half of which would agree to assignment to a wait list for 16 months; provide a network champion to build local support for the study; provide a network coordinator to manage sites’ participation in the study as outlined in a Memorandum of Understanding; host training and technical assistance events; contribute funds for staff time to participate in the YPQI if that was part of normal expectations in the network; recruit data collectors with no current or past connections to the study sites and who were blind to assignment; and agree not sponsor or promote YPQI-like services to the control sites during the baseline and implementation years. 12
Sites within each network were also required to satisfy eligibility criteria in order to join the study. Specifically, eligible sites were required to: hold programming in a consistent location for most sessions; provide services for youth on at least a weekly basis on at least a nine-month school year cycle; serve youth primarily ages 10 and older; serve no more than an average of 60 youth, aged 10 and older, per day13; be regionally clustered so that program staff from intervention sites could commute to training and meeting locations in 1 ½ hours or less; and finally, have site managers willing to be assigned into the wait list group for 16 months.
Participating sites offered a wide range of content and goals for their youth. Table 2.1 describes the most common types of content offerings listed by site managers. Most sites offered programming in multiple areas for youth. In particular, for each of the following content areas, managers at over 90% of sites reported offering: leadership, reading, life skills, art, and/or physical fitness. When asked to rank order 12 Networks agreed to withhold YPQI-like professional development from all sites during the implementation year. However, control group sites were not barred from pursuing any form of professional development, YPQI-like or otherwise, on their own. 13 Network A’s total daily enrollment exceeded this guideline because these programs served large numbers of children under the age of 10. Network A sites’ entire staff participated in the YPQI training, technical assistance, and coaching but only offerings for youth aged 10 or older were included in the study sample.

17
their site’s program objectives (Table 2.2), well over half listed academic support as their primary aim; however, substantial numbers included other goals as well.
Table 2.1 Content Offerings across Baseline Sites
Percentage of sites (N=87 site managers) Example program offerings
Leadership 97 Planning team for events, youth advisory board
Reading 96 Vowels, spelling
Life Skills 95 Discuss race and culture tension
Art 93 Scrapbooking, clay
Physical Fitness 91 Walleyball, gym
Technology/Computers 90 Typing & navigating skills, video production
Math 89 Ratios, counts re: food drive donations
Community Service 89 Christmas gifts to those in shelters
Sports 86 Basketball, baseball
Creative Writing 78 Journaling
Cooking 77 Recipes and cookie dip
Science 76 Laws of motion, inertia experiments
Dance 71 Hip Hop class
Music 71 History of Pop Music, Guitar lessons
Theater 69 Rehearsed 3 acts for musical play Annie
Poetry 49 Forms of poetry lesson
Building/Shop 35 Lego robotics, building a tower out of paper
SOURCE: Manager Program-Wide Survey baseline year (2006-07). Examples of program-offering titles from Program-Offering Session Observation, baseline (2006-2007) and implementation years (2007-08).

Continuous Quality Improvement in Afterschool Settings
18
Table 2.2 Program Objectives
N=100 site managers
Academic Support
Social/civic development
Artistic development
Sports & Recreation
Other (computer skills, self-esteem, parent
workshop, etc.)
Objective 1 (%) 56 29 2 6 7
Objective 2 (%) 63 18 3 11 4
Objective 3 (%) 27 32 10 27 5
SOURCE: Manager Program-Wide Survey baseline year (2006-07). NOTES: Academic support is made up of two categories that were combined: “academic support” and “homework help”. For this reason the percentages in the academic support column add up to greater than 100%. To spur interest in participation, network champions actively promoted the benefits of adopting the YPQI. Recruitment messages included descriptions of: the opportunity to be involved in cutting-edge research; financial incentives for participation14; no cost access to all YPQI training, technical assistance, and coaching; and finally, access to site and network level data following the completion of the study and in accordance with privacy assurances.
Randomization The YPQI study employs a cluster randomized design with blocking (Bloom, 2004; Raudenbush, Martinez & Spybrook, 2005). In this design the site, or “cluster” of individual staff and youth working in a specific building to deliver an afterschool program, was the unit of random assignment. Sites were randomly assigned to intervention and control conditions within each of five different networks, or “blocks” of sites, with each network representing a distinctly different funding and policy context. Treating afterschool sites as the unit of randomization is a particularly good fit for the afterschool field for two reasons. First, in afterschool programs, it would be very difficult to isolate the effect of assigning individual staff or youth within a site because staff tend to work in teams and groupings of staff and youth tend to change frequently. The second reason for treating sites as the unit of randomization is that, in the afterschool field, sites and site managers tend to have much lower levels of attrition than either staff or youth, dramatically increasing the likelihood of sample retention over time. Blocking random assignment within each network is a useful design strategy for a similar reason: By randomly assigning sites to an intervention and control condition within each network, it is possible to protect the integrity of random assignment if one of the networks experiences a catastrophic change in funding, voluntarily withdraws from the study,or otherwise fails to comply with documented research procedures.15 If one of the networks is removed from the study, this attrition does not threaten the experimental conditions in each of the other networks.
14 Sites were provided modest incentives. In the baseline and implementation years, each site received a $150 incentive. At the end of the implementation year, an additional $75 incentive was allotted to treatment group sites who interacted with a TA Coach. Incentives were pooled with additional funds in three networks to match typical incentive levels for professional development: Network A provided an additional $350 per site; networks C and D provided an additional $100 per site. 15 Such an incident did occur. Observational data for most of the control group in Network E was destroyed, requiring exclusion of this network in the impact analyses for staff instructional practices.

19
Network Characteristics and Retention of Sites The five afterschool networks recruited to participate in the YPQI study have the following characteristics:
• Network A is an afterschool system located in a large urban school district with all sites located in elementary school buildings. This system serves a largely middle-class population, requires fees for participation by most youth, and, in policy language, is characterized as a school age care provider. Authority over programs and staff in this system can be characterized as high, since the school district employs all program staff, routinely compels participation in professional development, and has the capacity to pay for staff to attend professional development trainings.
• Network B is an afterschool system funded by a state Department of Education 21st Century Community Learning Center (CCLC) grant. Sampled sites in this system are mainly located in small cities or rural areas, serve low-income populations, and do not charge a fee for participation. Participating sites were located in middle school and high school buildings. Authority over programs and staff in this system can be characterized as moderate. Although network leadership frequently provides professional development opportunities for site staff, it has no authority to compel attendance and does not pay staff to attend trainings.
• Network C is an afterschool system comprised of various community-based providers, many of which are independent nonprofits. Much of the programming in this network is run by the YMCA, Boys and Girls Clubs, and local faith-based organizations. Sites are predominantly urban, serve at-risk youth, and are housed in various community-based locations. Authority over programs can be characterized as low. Network C does not routinely offer coordinated professional development activities or pay for staff to participate.
• Network D is an afterschool system comprised of school-based clubs located primarily in a mix of rural and urban settings and serving a demographically wide spectrum of youth. Note that the school-based sites in this network are not funded through the federal 21st CCLC program. Authority over sites in this network can be characterized as low. Network D does not routinely offer coordinated professional development activities or pay for staff to attend.
• Network E is an afterschool system that is funded by a state Department of Human Services. Sampled sites in this network are a mix of urban and rural and serve both at-risk and middle income youth. Sites are typically housed in schools but may be managed by community-based organizations. Authority over sites in this network can be characterized as high. The state Department of Human Services can compel staff to participate in professional development activities and does pay for staff to attend trainings.
Table 2.3 presents additional characteristics for each of the five networks included in the study demonstrating diversity in terms of type, program priorities, enrollment, location, and youth demographics.
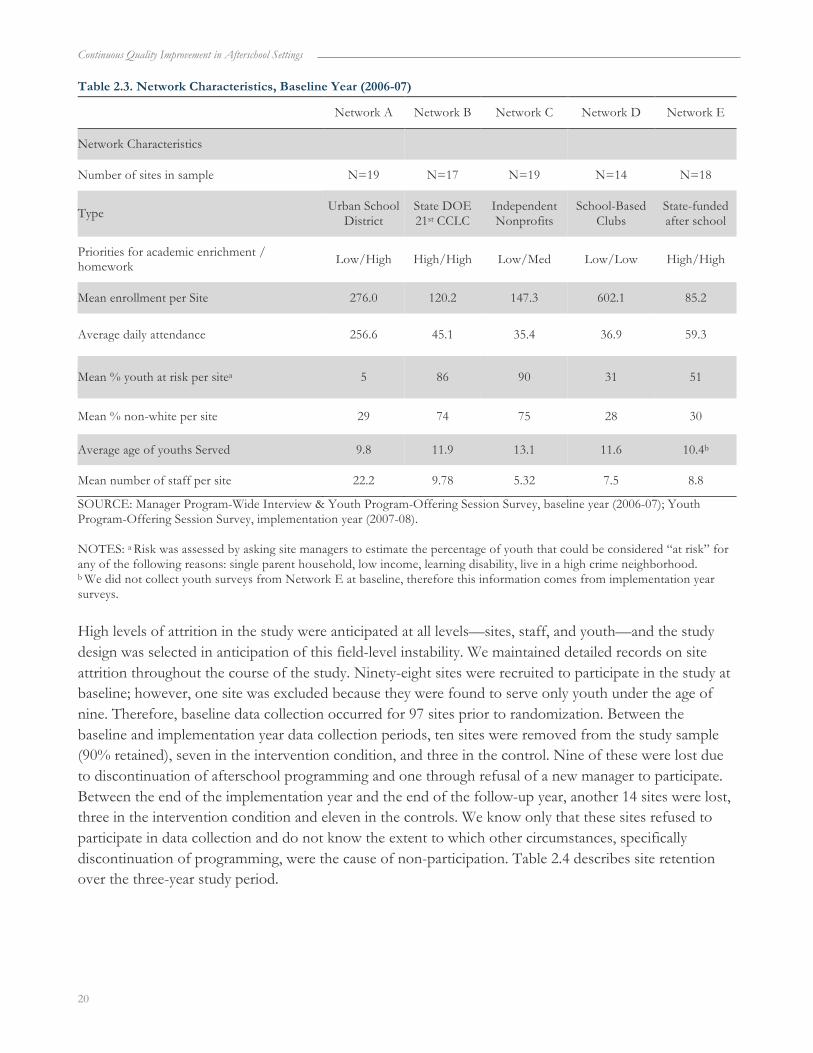
Continuous Quality Improvement in Afterschool Settings
20
Table 2.3. Network Characteristics, Baseline Year (2006-07)
Network A Network B Network C Network D Network E
Network Characteristics
Number of sites in sample N=19 N=17 N=19 N=14 N=18
Type Urban School District
State DOE 21st CCLC
Independent Nonprofits
School-Based Clubs
State-funded after school
Priorities for academic enrichment / homework Low/High High/High Low/Med Low/Low High/High
Mean enrollment per Site 276.0 120.2 147.3 602.1 85.2
Average daily attendance 256.6 45.1 35.4 36.9 59.3
Mean % youth at risk per sitea 5 86 90 31 51
Mean % non-white per site 29 74 75 28 30
Average age of youths Served 9.8 11.9 13.1 11.6 10.4b
Mean number of staff per site 22.2 9.78 5.32 7.5 8.8
SOURCE: Manager Program-Wide Interview & Youth Program-Offering Session Survey, baseline year (2006-07); Youth Program-Offering Session Survey, implementation year (2007-08). NOTES: a Risk was assessed by asking site managers to estimate the percentage of youth that could be considered “at risk” for any of the following reasons: single parent household, low income, learning disability, live in a high crime neighborhood. b We did not collect youth surveys from Network E at baseline, therefore this information comes from implementation year surveys. High levels of attrition in the study were anticipated at all levels—sites, staff, and youth—and the study design was selected in anticipation of this field-level instability. We maintained detailed records on site attrition throughout the course of the study. Ninety-eight sites were recruited to participate in the study at baseline; however, one site was excluded because they were found to serve only youth under the age of nine. Therefore, baseline data collection occurred for 97 sites prior to randomization. Between the baseline and implementation year data collection periods, ten sites were removed from the study sample (90% retained), seven in the intervention condition, and three in the control. Nine of these were lost due to discontinuation of afterschool programming and one through refusal of a new manager to participate. Between the end of the implementation year and the end of the follow-up year, another 14 sites were lost, three in the intervention condition and eleven in the controls. We know only that these sites refused to participate in data collection and do not know the extent to which other circumstances, specifically discontinuation of programming, were the cause of non-participation. Table 2.4 describes site retention over the three-year study period.

21
Table 2.4. Number of Sites in Sample at Baseline and Implementation Years, by Network and Experimental Status
Network A Network B Network C Network D Network E Overall
Int Con Int Con Int Con Int Con Int Con Int Con
Baseline (Winter 2006-07) 10 10 10 9 11 10 9 8 10 10 50 47
Implementation (Spring 2008) 9 10 9 8 9 10 8 6 8 10 43 44
Follow-up (Spring 2009) 8 9 9 8 8 7 7 3 8 6 40 33
NOTES: Information is based on examining all sources of data across all years of data collection. For more information on staff tenure, please see Appendix I. Int = Intervention Group; Con = Control Group.
Two primary concerns are raised by this pattern of attrition: the overall proportion of sites lost and a higher level of attrition in the intervention group during the implementation year. We are particularly concerned with attrition at the end of the implementation year because this was when the impact of the YPQI was assessed, and high or differential rates of attrition threaten the internal validity of the study. We adopted two strategies to assess the extent to which site attrition during the implementation year threatened group equivalence created by randomization. First, we removed the 10 sites that were lost during the implementation year from the baseline sample and tested for baseline differences between the assigned groups. Differences were assessed on 17 characteristics – all covariates and outcome measures used in any of the analytic models described in this report – and only one test produced a statistically significant difference. These results are reflected in Tables 2.6, 2.7, and 2.8. As a second strategy, we tested for baseline differences on the same characteristics between the ten sites that were lost between baseline and the end of the implementation year and the remaining sample of 87 sites. Of the 29 tests that were conducted, statistically significant differences were detected in only two (See Appendix C, Table C-4). From these analyses, we conclude that attrition from the site sample between the baseline and end of the implementation years are unlikely to introduce bias into our estimates of impact.
Data Collection Procedures Data collection procedures were designed to measure attitudes, knowledge, and behaviors in reference to two different types of experiences. First, program-wide data were collected for all participants at the site with reference to generalized or total experience of working at and attending the site. Second program offering data were collected at each site during two sampled program-offering sessions with reference to the proximal experience of instruction during that specific session. Afterschool program-offering sessions are defined as microsettings where consistent groupings of adults and youth meet over multiple sessions for the same learning purpose (e.g., an 8th grade poetry workshop that meets for a set time each week after school).
Table 2.5 describes the number of instruments that were completed and the timing of each administration across the three years of the study. Appendix C provides detail regarding data collection and a full list of all measures used in the study.

Continuous Quality Improvement in Afterschool Settings
22
Table 2.5. Data Collected by Measure and Year
Baseline Year Winter 2006-07
Implementation Year Spring 2008
Follow-up Year Spring 2009
Int Con Int Con Int Con
Program-wide Data
(All staff and youth)
Manager Survey 42 44 43 43 37 35
Manager Telephone Interview 40 47 34 40 37 NA
Staff Survey 238 194 183 186 162 148
Youth Survey NA NA 564 558 NA NA
Staff Roster NA NA NA NA 27 32
Program-offering Session Data
(Staff and youth present during observed program offering)
Observational Rating 84 90 81 70 NA NA
Staff Practices Survey 104 131 100 115 NA NA
Youth Engagement Survey 272 476 543 633 NA NA
SOURCE: Program-Wide Manager Interview; Manager Survey; Staff Survey. Offering session Staff Survey; Youth Survey; and Observation. Int = Intervention Group; Con = Control Group. NOTES: Offering session youth surveys were not collected in Network E at baseline due to delays in approval of human subjects protections by the state agency administering the afterschool network. Data for program offering observations for Network E at the end of the implementation year were lost due to catastrophic circumstances with the organization hired to conduct site visits.
Program-Wide Data Collection Program-wide data collection included surveys of all site managers, staff, and youth who were either working at or attending the program during a two week data collection window. We mailed all three program-wide surveys (manager, staff, and youth) and administration protocols directly to the site manager who designated a time for all staff and students to complete surveys. Manager interviews were conducted by trained interviewers. The manager interview required 30-60 minutes to complete via telephone, the manager survey required approximately 30 minutes to complete, and the staff and youth surveys both required about 25 minutes to complete. All program-wide surveys and manager interviews were conducted within one month of the program offering data collection.

23
Offering Session Data Collection Offering session data collection included a staff survey, a youth survey, and an observational rating. All three measures focused on experiences during each of two program-offering sessions that were sampled at each site.16 Staff surveys required about 10 minutes to complete, whereas the youth surveys required about 15 minutes to complete. Staff and youth surveys were administered by the observational data collector at the end of the program-offering session.
The observational measure of staff instruction was conducted by a single trained rater using the Youth Program Quality Assessment Form A (Youth PQA; HighScope, 2005).17 Collection of sufficient anecdotal data to produce a score for the Youth PQA Form A requires observation during one entire session of a program offering, usually 1-2 hours. The rater generates a running record of events that occur during the program-offering session, focused on the behaviors of staff. After the observation period the rater uses the written record to score the entire instrument. Training for external raters has been developed for the instrument (Blazevski & Smith, 2007), and data collectors for the study were required to achieve at least 80% perfect agreement at the item level with “gold standard” scores for a set of training videos. A detailed discussion of rater reliability is provided in Appendix D.
Raters were not affiliated with any sites in the sample and were blind to intervention or control group assignment. Data collectors contacted site managers not more than two weeks in advance to obtain a schedule of program offerings available during a target week. Each sampled program-offering session was led by a different staff so that ratings represented two unique staff performances. Once the list of program offerings was obtained for a site, a random selection process was used to select program-offering sessions that met the following criteria. Offerings were: for youth aged 10 or older; at least 45 minutes in length; attended by at least four youth; “typical” and not something special offered on an irregular basis; not “snack time”, “open gym”, or “homework/tutoring;” and not delivered by vendors or volunteer staff.
However, the selection process for program-offering sessions frequently did not work as planned. For example, in about 15% of cases, the scheduled offering did not occur, and the rater observed another offering that was available that day.
Baseline Characteristics of the Intervention and Control Groups 16 The study sample targeted small- to medium-sized programs (not more than 60 students in attendance on any given day). We reasoned that two offering session ratings would represent instructional practices for a site. In a prior study where larger sites had more observational ratings, we randomly selected two ratings per site and compared them to mean site ratings composed of 3-7 ratings per site. There were no statistically significant differences (Smith, Akiva, Blazevski & Pelle, 2008). 17 Two findings from prior research supported our decision to use a single rating of a single session of an offering, rather than averaging across program offerings within a site. First, test-retest correlations (separated by at least two weeks) for Youth PQA Form A scores produced by the same trained rater during two sessions of the same offering (N=26) ranged between .63 and .89 suggesting that the quality of staff performances is relatively stable over short intervals. Similar patterns of short-term stability have been demonstrated with other observation-based measures of staff practices (Yohalem, Wilson-Ahlstrom, Fischer, & Shinn, 2007; NICHD, 2005). Second, prior research also reveals that staff scores vary substantially across staff within the same organization, suggesting that individual staff performances are a meaningful unit of analysis. Similar to research on teacher performance in school settings (Nye, Konstantopoulos, & Hedges, 2004), intraclass correlations for unconditional HLM models using various samples of Youth PQA data suggest that between 60% of quality score variance occurs within organizations and between program-offering leaders (Smith et al., 2006). For a future study, we would likely increase the number of ratings per site. See discussion of reliability analyses in Appendix D.

Continuous Quality Improvement in Afterschool Settings
24
Tables 2.6 through 2.8 describe the baseline characteristics of managers, staff, youth, and program-offering sessions for the sample of 87 sites used to estimate impact. Table 2.6 provides baseline group comparisons for manager and staff education, staff weekly hours, and staff monthly income. Table 2.7 provides baseline group comparisons for youth gender and age, parent education, and participation in other afterschool activities. At baseline, youth were only surveyed during the two sampled program-offering sessions at each site, and these comparisons reflect the characteristics of youth in attendance during these sessions. Table 2.8 provides baseline group comparisons for characteristics of program offerings in the sample of two offering sessions per site. These characteristics include content delivered during the program-offering sessions, age groups served, and youth-to-adult ratio. None of the group differences presented in Tables 2.6 through 2.8 were statistically significant, suggesting that randomization effectively equated the groups.
Table 2.6. Characteristics of the Manager and Staff Samples at Baseline
Intervention Control p-value
Manager Characteristics N=42 N=44
Education (percent) 0.65a
Less than Bachelors degree 27.5 25.6
Bachelors degree or higher 72.5 74.4
Masters degree or higher 22.5 18.6
Direct Staff Characteristics N=238 N=194
Education (percent) 0.27a
Less than Bachelors degree 64.0 57.4
Bachelors degree or higher 36.1 42.6
Masters degree or higher 8.3 10.2
Number of hours worked per week 18.5 16.4 0.42b
Monthly income (percent) 0.11a
Less than $100 3.1 2.3
$100-$499 51.5 41.6
$500-$999 35.0 45.7
$1000 or more 10.4 10.4
SOURCE: Manager Program-Wide Survey, baseline year (2006-07) and Staff Program-Wide Survey, baseline year (2006-07). NOTES: Values in the columns represent unadjusted means for the groups. a Significance tests for categorical variables are designed-adjusted F-tests of the difference in distributions. b The HLM model was used to determine whether means for the study groups were equal.

25
Table 2.7. Characteristics of Youth in the Offering Session Sample at Baseline Intervention
(N=272) Control (N=476) p-value
Youth Characteristics
Gender (percent) 0.94a
Male 44 41
Female 57 59
Age (years) 0.97b
Youth Age 11.2 11.1
Parent Education (percent) 0.84a
Less than high school diploma 11 11
High school diploma/GED 12 14
Some college 13 18
College degree 63 58
Other afterschool (percent) 0.58a
Participate in other afterschool activities 73 69
SOURCE: Youth Offering Session Survey, baseline year (2006-07). NOTES: Values in the columns represent unadjusted means for the groups. Does not include Network E as no child survey data was collected in Network E at baseline due to delays in approval of human subjects protections by the state agency administering the afterschool network. a Significance tests for categorical variables are design-adjusted F-tests of the difference in distributions. b The HLM model was used to determine whether means for the study groups were equal.

Continuous Quality Improvement in Afterschool Settings
26
Table 2.8. Characteristics of the Offering Session Sample at Baseline
Baseline Year - Winter 2007
Intervention N=90 (offerings)
Control N=84 (offerings) p-valuea
Content Area (% of offerings)
Homework/Tutoring 12 14 .62
Academics 7 7 .90
Arts & Enrichment 44 38 .44
Life Skills, Character Education, and Health 18 27 .18
Sports 7 6 .67
Outside Informal Time 4 1 .28
Computers/Technology 2 3 .71
Others 14 10 .39
Age group served (% of offerings)b
Elementary 62 60 .77
Middle School 40 42 .78
High School 10 6 .35
Youth-Adult Ratio 11.4 to 1 10.4 to 1 0.56
SOURCE: Staff Program-Wide Survey, baseline year (2006-07) and Offering Session Observation, baseline year (2006-07). NOTES: Values in the columns represent unadjusted means for the groups. All differences in table are non-significant. a Significance tests for categorical variables are designed-adjusted F-tests of the difference in distributions. b Totals to more than 100% as multiple age groups could be served in a single program-offering session.

27
Outcome Measures The quality of instructional practice is the primary outcome of interest for the YPQI study. However, we also evaluate impact hypotheses related to the entire YPQI theory of action, including Manager Improvement Focus, Manager Continuous Improvement Practices, Staff Continuous Improvement Practices, Staff Instructional Quality, and Staff Employment Tenure.
Although it is likely that staff knowledge, beliefs, and attitudes change as a result of the intervention, this report is focused on measurement of behavior, with most items making up the outcome measures focused directly on identifiable practices. Observational methods are used to measure instructional practices, due to our lack of confidence in staff self-reports in this area. We did rely on manager and staff self-reports of continuous improvement practices; however, we kept these self-report items anchored firmly in identifiable behaviors that are widely known in the field. We believe that behaviorally-anchored items are less susceptible to both misinterpretation by survey respondents and to differential response bias between the intervention and control groups due to exposure to the intervention. Appendix C provides additional discussion and descriptive detail regarding all of the outcome measures.
Manager Improvement Focus The measure for manager improvement focus asks managers to identify improvement priorities for their site over the previous year. For this dichotomous variable, an improvement area was coded 1 if it was aligned with content of the instructional practices measure (described below) and 0 if it was not. As described in Table 2.9, at baseline few sites were working to directly improve their quality of instruction. Approximately 11% of site managers’ named at least one improvement area focused on the quality of instructional practices.
Continuous Improvement Practices The measures of continuous improvement practices for the study were designed to represent the level of implementation of four core continuous improvement practices named by the YPQI theory of action: (a) site team assessment of instructional quality (i.e., observation during program-offering sessions, collection of written anecdotal evidence, and use of an assessment tool/rubric to produce a score); (b) site team improvement planning using data; (c) staff receipt of performance feedback about instruction following program-offering sessions; and (d) manager and staff attendance at trainings for specific instructional skills. Each of the four practices were measured by single or multiple item indexes aligned to each practice. Each index score was standardized to range between 0 and 1. Each equally weighted index score was then averaged to create the continuous improvement practice score, ranging from 0-1. For the impact analyses the Manager Continuous Improvement Score was composed as an index of elements a, b, and d above. The Staff Continuous Improvement Score was composed of all four elements listed above. Appendix C provides a detailed description of the continuous improvement index scores as well as a discussion of reliability for these measures.
Table 2.9 provides baseline means for the Staff Continuous Improvement Practices score. On average, site staff were implementing approximately two of the four continuous improvement practices. Control group staff were implementing continuous improvement practices at a higher rate than intervention group staff and this difference was statistically significant. This was one of the few statistically significant differences

Continuous Quality Improvement in Afterschool Settings
28
across all variables tested, so for this reason the baseline Staff Continuous Improvement Practices score was included as a covariate in impact models.
Instructional Practices Measures Ten measures of instructional practices were used in the study: (1) Staff Instructional Practices Total Score, and (2-10) nine skill-specific scales that compose the Total Score (Staff Disposition, Welcoming Atmosphere, Inclusion, Conflict Resolution, Active Skill Building, Support for Group Participation, Opportunities to Make Choices, Opportunities for Planning, and Opportunities for Reflection). Each of these measures was derived from the Youth PQA Form A (HighScope, 2005). Appendix C provides measurement rubrics and descriptive data, including alpha-type reliability coefficients, for the YPQI study sample. Appendix D presents results of a reliability study designed to rigorously examine the facets of measurement error in the Staff Instructional Practices Total Score, to estimate the proportion of error variance associated with each facet, and to produce a reliability coefficient representing the ratio of total score variance to the true score variance.18 Evidence for construct and criterion validity for the instructional practices measures is provided in Smith, Peck, Denault, Blazevski, and Akiva (2010). Evidence of predictive validity is provided in Akiva, Brummet, Sugar, and Smith (2011) and Smith and Hohmann (2005).
The Staff Instructional Practices Total Score is calculated by averaging 23 equally weighted items, each describing a unique instructional practice, into the nine skill-specific scales and then averaging across these scales to produce a total score. The total score and nine skill specific scales employ a five-point measurement scale ranging between 1 and 5 where 1 refers to the absence of a practice, 3 refers to the informal presence of a practice or availability of the practice to only some youth, and 5 refers to intentional delivery of the practice by the staff to all youth in the program-offering session.
As described in Table 2.9, there were no statistically significant differences between intervention and control groups on the primary instructional practice measures at baseline. For the Staff Instructional Practices Total Score, study sites attained an average score of 3.6 on a scale ranging from 1 to 5.
Staff Employment Tenure For Staff Employment Tenure, we created two dichotomous variables for within-year and cross-year tenure, based on responses from staff surveys regarding the length of time they had been employed in their current position. These dichotomous variables represent whether or not staff had been in their current position for more than 10 months and for two or more years. Tenure of 10 months or more describes staff short-term employment stability within a program year. Tenure of two or more years describes staff short-term employment stability across program years.19
18 Results from the Youth PQA Reliability Study (Cortina & Smith, 2010) described in Appendix D suggest that differences in the Staff Instructional Practices Total Score across offering sessions are a substantively important source of measurement error. This is true of other widely used observational assessment tools (Schochet, 2009). However, as noted in Garet et al., (2008, p. 19), because the Staff Instructional Practices scores are dependent variables in the impact analyses, the within staff error variance associated with different offering sessions should be averaged across staff. This means that the primary effect of this unreliability in the outcome measure is to reduce the precision of impact estimates but does not introduce systematic bias. 19 Details regarding hypotheses, measures, and analyses of staff tenure are provided in Appendix I. Manager tenure was also measured using the same approach. However, our hypothesis for managers was different. In Chapter 5, we use manager short-term tenure data

29
Table 2.9 provides baseline staff tenure data by group. There were no statistically significant differences. Among staff who participated in baseline data collection, about 73% say they have been at the site for more than ten months and 50% say they have been there for two or more years.
Table 2.9. Baseline Differences for Outcome Measures
Intervention Control p-valuea
Manager Improvement Focus N=42 0.09
N=44 0.10
0.93
Staff Continuous Improvement Practices N=238
0.53
N=194
0.58 0.05*
Staff Instructional Practices Total Score N=84 3.57
N=90 3.59
0.80
Staff Tenure
N=238 N=194
More than 10 months 0.71 0.75 0.39
2 years or more 0.51 0.47 0.34
SOURCE: Staff Program-Wide Survey, baseline year (2006-07) and Offering Session Observation, baseline year (2006-07). NOTES: Values in the columns represent unadjusted means for the groups. The p < .05 level is indicated by an asterisk.a An independent samples t-test was used to test for differences of means.
Estimation Methods The YPQI study employs random assignment of afterschool sites to two study conditions, one group assigned to participation in the YPQI and the other to a control condition. The average outcome for the control group provides an estimate of what would have happened in intervention group sites if they had not been assigned to participate in YPQI. Comparing outcomes for the two groups provides an unbiased estimate of the impact of the YPQI. To improve precision of impact estimates, the study design also includes blocking on each of five networks in which randomly assigned sites are nested. In all statistical models, these networks are treated as fixed effects, meaning that we assume that outcome variance explained by the networks is constant across networks.20 Given this design, the YPQI study can be viewed as five small randomized studies that are pooled together to increase statistical power to detect effects. Our approach to estimating impact was to estimate an average effect across networks as the primary confirmatory finding. Next, we used the statistical model to simultaneously estimate the impact for each
to test a moderation hypothesis, namely that manager turnover would negatively affect the association between staff engagement in continuous improvement and staff instructional quality. 20 We ran a series of three-level unconditional models that treated networks as random effects. Because very little variance in the instructional practices score occurred between networks at level three, we decided to treat network membership as a fixed effect at level two of a two-level model.

Continuous Quality Improvement in Afterschool Settings
30
network and used a small sample statistic to test for heterogeneity in the pattern of impact between each network. Because there was even dispersion in site attrition, networks were weighted evenly in estimating network-level impacts. Additional information about estimation methods and models is provided in Appendix F.
Impact of assignment to the YPQI on manager practices are produced using OLS regression. Impacts of assignment to the YPQI on staff continuous improvement practices and instructional practices are estimated with two-level hierarchical models. For staff continuous improvement practices, the number of staff nested within each site varied between 1 and 16. For instructional quality, exactly two observational ratings of staff instruction were sampled from each site.
Experimental analyses included all available data for all staff at all sites assigned to each condition. These estimates provide an intent-to-treat (ITT) analysis of the impact of the YPQI on staff performance at the organization and point-of-service levels of settings. In other words, impact estimates reflect the impact of the YPQI on all sites in the study, regardless of the actual level of participation in YPQI training, technical assistance, and coaching and regardless of the level of implementation of continuous improvement practices by managers at their sites. Because the intervention was delivered under circumstances that could be considered typical in many agencies and organizations (See discussion in Chapter 3), the ITT estimate of impact on instructional practices can reasonably be interpreted as the level of effect that would be achieved through a lower stakes quality accountability and improvement policy that included the YPQI as its site level intervention design.
We included covariates in the models to improve the precision of estimates. As expected, staff attrition was high from the baseline to implementation year so baseline scores (pre-tests) are aggregated to the site level (level 2) in our multilevel models.
• Covariates for the manager continuous improvement practices models included: baseline education level of the manager, the total number of youth enrolled at the site at baseline, baseline staff input to organizational decision-making, and baseline staff experience with data collection.
• Covariates for the staff continuous improvement practices models included: baseline scores for Staff Continuous Improvement Practices (pre-test), baseline manager education, and baseline staff education.
• Covariates for the staff instructional practices models included: baseline Staff Instructional Practices Total Score (pre-test) and two characteristics of the observed program offerings: content of the offering and age group served during the offering.21
Missing Data In general our approach to missing data was to omit cases where the outcome data were missing and impute data for covariates. For all analyses with missing cases due to missing outcome data, ANOVA tests were conducted on baseline measures to determine if there were statistically significant differences
21 Appendix G describes how the content and age group variables were constructed and discusses issues related to inclusion of covariates measured after the onset of the intervention.

31
between cases with and without missing outcome data. No statistically significant results were found. The only analyses that required imputation of data for missing covariates were the implementation analyses in Chapter 5.
Statistical Precision and Significance Testing The minimum detectable effect (MDE) is the smallest true effect that a study design is likely able to discern. Sample sizes were determined by estimations based on MDE for Staff Instructional Practices Total Score. We expected instructional practice measures to have the smallest effect sizes because the primary target of the intervention supports was the site manager - with effects cascading to the point-of-service setting as described in the YPQI theory of action. The study was designed with an 80% chance of detecting a moderate sized effect at the 95% confidence level (power level of .8 and alpha level of .05). This is based on the following assumptions for a three-level multi-site cluster randomized design as presented in Raudenbush et al. (2005): 5 networks; 20 sites randomly assigned within each network; 2 observational ratings per site; intraclass correlation of .1122; and contribution of covariates of .14, primarily representing the pre-test. Retrospective information from the study roughly matched these assumptions. The actual intraclass correlation and covariance coefficients were underestimates, whereas the actual sample size was lower due to site attrition and loss of observational rating data for one entire network.
Two-tailed tests were used to assess statistical significance of all impact estimates in this report. For all significance tests, an asterisk denotes statistical significance at the p < .05 level and exact p-values are also included in many tables. The statistical significance of a finding provides information on the likelihood of detecting a parameter of the same or greater magnitude in a sample drawn randomly from a population in which the true parameter value is zero. Lack of statistical significance can occur both because the estimate does not differ from zero and due to low statistical power to detect effects. Statistical significance does not indicate whether or not a finding is substantively important and, for this reason, we also both report standardized effect sizes, and explain findings in terms of the meaning of their original scale of measurement. Standardized effect sizes provide information on how much difference there is between the intervention and control groups and, in this report, most tables report standardized effect sizes based on the Cohen’s-d calculation where the control group mean is subtracted from the intervention group mean and then divided by the standard deviation for the control group at baseline (Cohen, 1988).
External Validity The sample from the YPQI was not directly representative of any larger population and therefore it is inappropriate to draw firm conclusions about external validity of our findings. However, we aimed to involve a wide variety of ‘everyday’ afterschool programs – the kinds that are found throughout the United States – and the YPQI sample was specifically selected from a wide diversity of afterschool networks. Indeed, this intentional selection of widely varied program types and circumstances was designed to support analyses of the effects of that variation on program impacts, as described in Chapters 4 and 5.
22 The intraclass correlation coefficient (ICC) is the ratio of between-site variance to total variance, adjusted for blocking (see translation equations in Raudenbush, Spybrook, Liu, & Congdon, 2005, p. 91). The ICC was calculated based on cluster-level ICCs from the Youth PQA Validation Study where between-site variance for instructional practice scales ranged between 22% and 55% of the total variance.

Continuous Quality Improvement in Afterschool Settings
32
For some limited perspective on how well the YPQI findings might apply outside of the study sample, the best we can do is to compare to other populations of afterschool programs in two ways. First, we compare characteristics of the overall YPQI sample to other large samples from the afterschool evaluation literature. Second, we compare three of the network samples to characteristics of all remaining sites in the larger network from which the study sample was drawn. Data tables providing comparisons on staff education and tenure are provided in Appendix B. Based on comparisons to samples from a number of other studies, we suggest that, like the YPQI Study sample, other afterschool program samples also have (a) manager and staff educational profiles that vary widely and (b) fairly high rates of manager and staff turnover each year. Based on comparing characteristics of three network samples to aggregate characteristics from the overall network of sites from which the sample was drawn, we concluded that the YPQI network samples did not markedly differ from the population from which they were draw.

33
Chapter 3
Intervention Design and Implementation In this chapter, we specify primary elements of the YPQI design, describe the level of participation in, and implementation of, these design elements during the study, and estimate associated costs and staff time. Appendix A provides additional detail on the intervention elements. Appendix E provides additional detail on fidelity of implementation and cost and time estimates related to implementation.
Intervention Design Elements and Sequence The YPQI included two primary design elements: intervention supports and continuous improvement practices.23 Intervention supports are training, technical assistance, coaching, and quality assessment services delivered by external consultants to afterschool program managers and staff. Continuous improvement practices refer to a sequence of four core practices that are implemented by site managers in the organization setting: (1) self-assessment of instructional quality, (2) data-driven planning using self- and external assessment data, (3) performance feedback for staff following program-offering sessions, and simultaneously, (4) coordination of staff participation in aligned training modules focusing on specific instructional methods (e.g., the skills and practices defined in Figure 1.1). Importantly, each of the intervention supports and core practices includes use of the Youth PQA Form A (HighScope, 2005).
Intervention supports were delivered over the course of two school years, beginning in early March 2007 and ending in June 2008. Table 3.1 shows the sequence for both participation in the intervention supports and implementation of the continuous improvement practices.24
Table 3.1. Timeline for Delivery of Supports and Implementation of Continuous Improvement Practices Baseline Year Implementation Year
Winter 2007
Spring 2007
Summer 2007
Fall 2007
Winter/ Spring 2008
Participation in Intervention Supports Commitment and support of network leaders X External assessment using a standardized observational measure
(Youth PQA Form A) X
Youth Work Management Training Sequence Kick-off meeting/webinar X X PQA Basics X X Planning with Data X Instructional Coaching X YPQI TA Coaches are trained to support site managers X Manager receives support from TA Coach to implement
continuous improvement practices X
23 This formulation draws upon the “interactive systems framework for dissemination and implementation” associated with the Getting to Outcomes intervention (Wandersman, Duffy, Flaspohler, Noonan, Lubell, Stillman et al., 2008) where the “support system” describes the training and technical assistance available at the policy level to support implementation of intervention practices in specific sites. 24 Subsequent implementations of the YPQI have been undertaken using a number of different timelines suggesting variability in the amount of time necessary to deliver the sequence of supports and implement the four core practices.
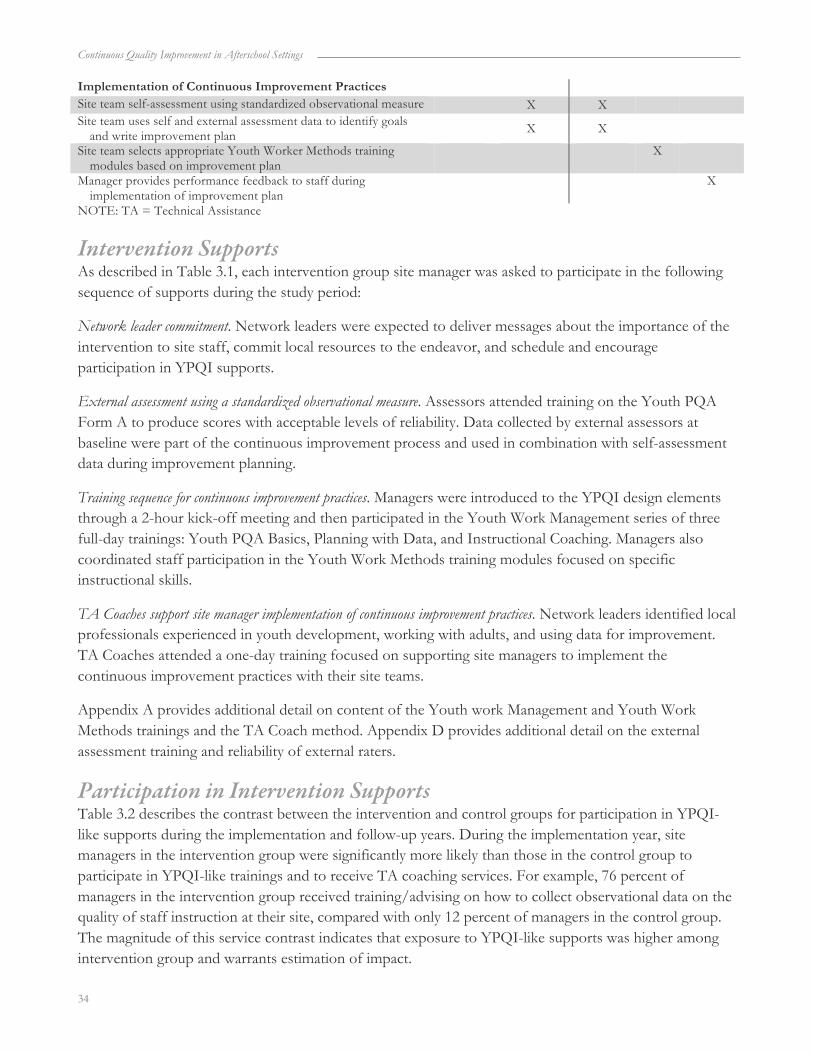
Continuous Quality Improvement in Afterschool Settings
34
Implementation of Continuous Improvement Practices Site team self-assessment using standardized observational measure X X Site team uses self and external assessment data to identify goals
and write improvement plan X X
Site team selects appropriate Youth Worker Methods training modules based on improvement plan
X
Manager provides performance feedback to staff during implementation of improvement plan
X
NOTE: TA = Technical Assistance
Intervention Supports As described in Table 3.1, each intervention group site manager was asked to participate in the following sequence of supports during the study period:
Network leader commitment. Network leaders were expected to deliver messages about the importance of the intervention to site staff, commit local resources to the endeavor, and schedule and encourage participation in YPQI supports.
External assessment using a standardized observational measure. Assessors attended training on the Youth PQA Form A to produce scores with acceptable levels of reliability. Data collected by external assessors at baseline were part of the continuous improvement process and used in combination with self-assessment data during improvement planning.
Training sequence for continuous improvement practices. Managers were introduced to the YPQI design elements through a 2-hour kick-off meeting and then participated in the Youth Work Management series of three full-day trainings: Youth PQA Basics, Planning with Data, and Instructional Coaching. Managers also coordinated staff participation in the Youth Work Methods training modules focused on specific instructional skills.
TA Coaches support site manager implementation of continuous improvement practices. Network leaders identified local professionals experienced in youth development, working with adults, and using data for improvement. TA Coaches attended a one-day training focused on supporting site managers to implement the continuous improvement practices with their site teams.
Appendix A provides additional detail on content of the Youth work Management and Youth Work Methods trainings and the TA Coach method. Appendix D provides additional detail on the external assessment training and reliability of external raters.
Participation in Intervention Supports Table 3.2 describes the contrast between the intervention and control groups for participation in YPQI-like supports during the implementation and follow-up years. During the implementation year, site managers in the intervention group were significantly more likely than those in the control group to participate in YPQI-like trainings and to receive TA coaching services. For example, 76 percent of managers in the intervention group received training/advising on how to collect observational data on the quality of staff instruction at their site, compared with only 12 percent of managers in the control group. The magnitude of this service contrast indicates that exposure to YPQI-like supports was higher among intervention group and warrants estimation of impact.

35
Appendix E (Tables E-1 and E-2) provides detail on the participation of intervention site managers in YPQI supports. For managers, the highest overall level of participation was in the YPQI kickoff meeting (85% of managers) and PQA Basics (87%). The lowest level of participation was in the Youth Worker Methods training (62%), although participation in this training was optional for managers who sent staff from their site. One network achieved nearly 100 percent participation by site managers in all intervention supports. TA Coaches maintained service logs detailing the amount and type of contact they had with each site, which could include consulting, modeling, observation, and re-training. In total, TA Coaches spent an average of 10 hours in contact with each intervention site over the course of the implementation year.
Table 3.2. Percent of Managers Who Participated in Intervention Supports
Implementation year percent participation
Follow-up year percent participation
Int
(n=43) Con
(n=43) p-value Int
(n=36) Con
(n=33) p-value
Training or advising on how to collect observational data about the quality of staff performances with youth
76 12 .00 42 36 .66
Training or advising on how to create a quality improvement plan with/for your staff
76 19 .00 56 52 .74
Training or advising on how to coach your staff by observing their work with youth and then providing written feedback
88 21 .00 39 24 .20
On-site session(s) with an advisor or coach to strategize and plan about quality improvement at your site
78 23 .00 53 55 .89
SOURCE: Manager Program-Wide Survey, implementation year (2007-08) and follow-up year (2008-2009) NOTES: Int = Intervention Group; Con = Control Group.
During the follow-up year, when both the intervention and control groups had voluntary access to the intervention, participation in YPQI-like training and technical assistance was substantially higher for both groups than for the control group during the implementation year. This indicates that (a) intervention group sites chose to participate even though they were not obligated to do so, and (b) many control group sites opted to attend the training when invited.
YPQI Continuous Improvement Practices Each site manager in the intervention group was asked to implement four continuous improvement practices at their sites. These practices directly correspond to the items in the Continuous Improvement Practices measures described in Chapter 2.

Continuous Quality Improvement in Afterschool Settings
36
Site team conducts self-assessment using the standardized observational measure.25 Each program manager assembled a site team of two to four staff to conduct self-assessment of program-offering sessions using the Youth PQA Form A. Team members either attended the Youth PQA Basics training or received training from a manager or teammate who attended the training. Members of site teams, led by the site manager, then observed multiple offerings and held a scoring meeting to reach consensus and score a single rating combining evidence from multiple offerings observed (Note the self-assessment ratings produced by these teams were distinct from the reliable ratings produced through external assessment of an individual offering).
Site team uses assessment data to identify goals and write improvement plan. Site managers and up to one staff attended the Planning with Data workshop where they identified “gaps” between external and self-assessment ratings of instructional quality, developed a narrative story of their site’s score profile, and discussed how to manage individual improvement. After interpreting the data, team members wrote an improvement plan to improve instruction and manage a change process. Site teams used these plans to infuse new practices or increase frequency of existing instructional practices into activity plans and curricula.
Site team selects Youth Work Methods training modules based on improvement plan. Youth Work Methods are 2-3 hour stand-alone training modules, each aligned with one or more items on the Youth PQA Form A (Figure 1.1). These trainings were delivered through 1- or 2-day summits in which participants could attend two or three modules aligned with their improvement plans.
Manager provides performance feedback to staff. Based on skills learned through the Instructional Coaching training, managers supported staff plans to improve their instructional practice. Managers employed structured observation and performance feedback, a strength-based technique in which managers used the Youth PQA Form A to guide staff through a reflective discussion of their instructional practices and progress toward goals described in the site’s improvement plan.
Implementation Fidelity This section describes implementation of continuous improvement practices.26 The YPQI Theory of Action (Figure A-1) suggests that high fidelity implementation consists of a reciprocal pattern of manager enactment of continuous improvement practices and staff engagement with these practices in order to optimize improvements in the quality of instruction. High implementation for managers was defined as implementing all three practices counted in the Manager Continuous Improvement Practices score. High implementation for staff was defined as at least two staff at the site implementing at least three of the four practices counted in the Staff Continuous Improvement Practices score. Implementation of continuous improvement at the highest levels of fidelity, or full implementation, is defined as the co-occurrence of high implementation by the manager and high implementation by the staff at the same site. Appendix E provides additional detail on levels of implementation by network and group. 25 Consequential validity evidence for use of the Youth PQA as a self-assessment in afterschool programs is provided in Smith (2005a). 26 Note that in this section we describe unadjusted counts of manager and staff continuous improvement behaviors as indicators of implementation fidelity. In the impact and implementation analyses conducted in chapters 4 and 5, the same data sources are used to construct the Manager Continuous Improvement Practices score and the Staff Continuous Improvement Practices Score as outcome measures in regression adjusted impact and instrumental variables models.

37
As described in Table 3.3, substantial implementation of continuous improvement practices occurred in both the intervention and the control groups. Fewer intervention group managers were non-implementing and substantially more were high implementing when compared to managers in the control group. For staff, the overall pattern is similar but the differences between intervention and control groups are smaller. The bottom panel of Table 3.3 describes the percentage of sites with full implementation.
From Table 3.3, several additional observations are of interest: First, it is clear that there was substantial variation in implementation of continuous improvement practices across all groups in all networks. For example, the control group staff in Network A implemented at higher levels than the intervention group staff in Networks B and D. Second, Network A was clearly the highest implementing network, with 100% high implementation among managers and 67% of sites attaining full implementation, suggesting that the YPQI site-level model can be fully implemented in an afterschool system. Network D had the lowest level of full implementation at the end of the implementation year.27 Finally, the implementation of continuous improvement practices was extremely high for staff in the Network B control group which inflates the overall mean for percent of control group sites with higher staff implementation (see discussion of Network B controls in Chapter 4).
27 However, the pattern of baseline to implementation year change described in appendix Table G-2 reveals that the intervention group in network D had the lowest Staff Continuous Improvement scores in the entire sample at baseline and made the largest gain between baseline and the end of the implementation year. This suggests that Network D was also one of the highest implementing sites relative to its baseline state.

Continuous Quality Improvement in Afterschool Settings
38
Table 3.3. Implementation Fidelity by Network and Overall – Percentages of Managers, Staff, and Sites with High Implementation or Non-Implementation
Manager Continuous Improvement Index
Network A Network B Network C Network D Network E Overall
Int
N=9 Con N=8
Int N=9
Con N=8
Int N=10
Con N=8
Int N=7
Con N=6
Int N=7
Con N=7
Int N=37
Con N=42
Percent managers non-implementation
0 50 0 38 20 38 0 33 0 43 4 40
Percent managers high implementation
100 13 44 25 50 13 29 0 43 29 53 16
Staff Continuous Improvement Index
Network A Network B Network C Network D Network E Overall
Int
N=60 Con
N=70 Int
N=33 Con
N=27 Int
N=47 Con
N=17 Int
N=19 Con
N=18 Int
N=19 Con
N=48 Int
N=177 Con
N=180
Percent staff non-implementation
5 16 12 15 17 24 26 22 5 13 13 18
Percent staff high implementation
53 27 24 44 32 12 21 6 58 29 38 23
Sites with “full” implementation
Network A Network B Network C Network D Network E Overall
Int
N=9 Con
N=10 Int
N=9 Con N=8
Int N=9
Con N=7
Int N=7
Con N=6
Int N=7
Con N=8
Int N=41
Con N=39
Percent sites with high implementation
67 13 25 14 22 0 0 0 29 33 29 12
SOURCE: Program wide manager and staff surveys, implementation year. NOTES: Non-implementation refers to managers and staff that reported using none of the continuous improvement practices during the implementation year. Manager high implementation refers to the site manager reporting enactment of all three of the measured manager continuous improvement practices. Staff high implementation refers to sites where at least two staff report implementation of 3 or 4 of the staff continuous improvement practices. Full implementation refers to sites with high implementation for both managers and staff. Int = Intervention Group; Con = Control Group.
Percentages in the overall column are an average across the individual network percentages for that group.
Adaptation The YPQI design explicitly requires adaptation at all three levels of the YPQI Theory of Action. For example, at the policy level where the YPQI supports were delivered, each network used different strategies to recruit sites into the intervention, ranging from requiring participation to monetary incentives to open calls for volunteers with no incentives attached. At the organization level of setting, sites were also allowed to modify certain aspects of the four continuous improvement practices (e.g., composition of the self-assessment team) to meet local needs. At the point-of-service level of setting, sites were afforded great flexibility to target instructional improvement areas and design improvement responses according to site priorities, expertise, curriculum and student needs.

39
Rather than leaving adaptation decisions completely in the hands of intervention group participants, key principles28guided the process through the terms of the original site MOU and through the intervention supports. Adaptations that failed to reinforce these key principals were actively discouraged. Key principles for the YPQI included:
• Use of the Youth PQA as a process standard for high quality instruction;
• Use of instructional quality ratings data from both self-assessment teams and external raters;
• Use of instructional quality ratings data during each practice in the continuous improvement sequence;
• Use of a site team for self-assessment and improvement planning to achieve a reciprocal pattern manager enactment and staff engagement in continuous improvement practices;
• Provision of choice to staff about which areas to improve and how to incorporate improved instructional practices into curricula and activity plans as an incentive for staff to engage.
Although the YPQI does not provide explicit guidance about how, where, and when to implement improved instructional practices, it does require that site teams select improvement areas. During the implementation year, site teams selected between two and five improvement goals, which included instructional practices (typically aligned with Youth PQA scales), but often also included other topics not directly related to instruction (e.g., modifying enrollment practices). Table 3.4 describes the focal content of quality improvement plans developed during the Planning with Data trainings. The table highlights the number of improvement goals that were aligned with the component scales of the Staff Instructional Practice Total Score. Improvement areas aligned with the specific instructional practices measured by the Instructional Practices Total Score (the primary outcome of interest in the YPQI Study) were cited a total of 66 times across all program improvement plans developed during the implementation year.
28 Discussing educational innovation and scaling, Brown and Campione (1996) emphasized the importance of distinguishing key principles from surface procedures. Key principles are defined as the core ideas of an innovation or intervention, whereas surface procedures are various ways those core ideas may manifest. Although healthy adaptation may occur in surface procedures, it is critical to avoid lethal mutations, or adaptations that no longer reflect key principles (Brown & Campione, 1996).

Continuous Quality Improvement in Afterschool Settings
40
Table 3.4. Instructional Practices Selected for Improvement by the Intervention Group Instructional Practices Measured by the Instructional Practices Total Score
Number of times practice was selected
across 43 Improvement Plans
Staff Disposition NA
Welcoming 2
Inclusion 10
Conflict Resolution 5
Skill Building 5
Grouping 4
Planning 14
Choice 9
Reflection 17
SOURCE: Program Improvement Plans, implementation year (2007-08)
Estimates for Time and Cost of the YPQI
Time Required for Intervention and Implementation The YPQI study was not designed to produce complete information about the amount of time committed to participation in intervention supports and implementation of continuous improvement practices. However, we did acquire sufficient information, including data from other YPQI-based demonstration projects, to estimate the time commitments required. The estimates that follow are based on the assumption that one site manager and three staff (four persons in total at the site) participate in supports and implement core practices. Appendix E provides a more detailed description of how we estimated manager and staff time commitments.
Based on the YPQI design and data from subsequent YPQI demonstrations, to achieve full implementation site managers needed to spend approximately 52 hours participating in the intervention supports and implementing the four core practices through the end of the implementation year. This estimate is comprised of the following components: 25 hours participating in live or online trainings; 10 hours of contact with a TA Coach via phone, email, or in person; 12 hours leading site teams through continuous improvement processes (i.e., quality assessment, improvement planning, and performance feedback with individual staff); and 5 hours involved in miscellaneous meetings or activities (e.g., kick-off meetings, staff meetings, phone calls).
Site managers were also asked to engage additional staff at the site, so we also produced time estimates for other members of the site team: one lead staff who is more fully involved in YPQI supports and two additional staff who participate in the continuous improvement practice as implemented at the site. On average, the three staff members were estimated to spend a combined total of 71 hours participating in the
41
supports and implementing continuous improvement practices (41 hours for a lead staff member and 15 hours each for two additional staff). This estimate is comprised of 39 hours of total staff time committed to training (25 hours for the lead staff member and 7 hours each for two additional staff) and 32 hours committed to implementing the four continuous improvement practices.
Based on these estimates, for a site team of one manager and three staff, participation in the YPQI supports and implementation of the four continuous improvement practice requires a total commitment of 123 hours; or roughly 30 hours per person over the 18 month study period. These per person time estimates are low in comparison to other training-based interventions in education and child care. In fact, the total training time required for a site team in YPQI study (64 hours) is comparable to the amount of training and coaching that several other interventions require for a single teacher or caregiver.29
Estimated Costs for the YPQI To assist afterschool networks in planning to implement similar interventions, we estimated the cost of the YPQI by using the 2008 per unit costs for the supports (i.e., training, technical assistance, and coaching) and applying these costs to the actual services delivered in each of the five networks. The total cost of providing the YPQI to the intervention group in all five networks during the baseline and implementation years was $278,750.30
However, the YPQI was delivered to 10 sites or fewer per network during the baseline and implementation year, which represent underutilization of training capacity and overestimation of travel and staff costs. If the intervention had been scaled up to 25 sites per network to make full use of available training capacity actually delivered during the study period, the cost of the intervention would be approximately $3,028 per site and $333 per staff member, including all added costs for training materials. Unit costs and estimating assumptions are described in Appendix E.
29 In reviewing several experimental interventions with positive effects cited in Chapter 1, the amount of time spent in training, with a coach or reviewing video, to achieve these effects was substantial: For the nine rigorous studies reviewed by Yoon et al. (2007), the average amount of time in training for a single teacher was 53 hours. For the Head Start study (Raver et al., 2008), the time spent in training was 30 hours and up to 80 hours was spent with a coach. For the elementary literacy study (Garet, Cronen, Eaton, Kurki, Ludwig et al., 2008), 45 hours was spent in training and an average of 62 hours was spent with a coach. In the child care meta-analysis (Fukkink & Lont, 2007), teachers spent an average of 55 hours in training. In evaluation of My Teaching Partner (Pianta et al., 2008), perhaps the only education intervention driven by standardized assessment of instructional practice, teachers participated in sequences of videotaping their own practice and reviewing with a consultant an average of 14 times over the academic year and visited an average of 118 web pages that described the intervention activities and 24 web pages that provided video instructional exemplars. 30 This would translate to $55,750 per network, and approximately $5,750 per site. However, these numbers do not represent realistic costs as discussed in the next paragraph.

Continuous Quality Improvement in Afterschool Settings
42
Chapter 4
Impact Findings Chapter 3 demonstrated that more YPQI-like supports were delivered to the intervention group than to the control group during the implementation year. The YPQI theory of action (Figure A-1) suggests that the effect of these intervention supports will cascade across levels of setting, from the policy setting (e.g., Youth Work Management training sequence) to the organization setting (e.g., four continuous improvement practices) to the point-of-service setting (e.g., instructional practices). To evaluate the YPQI theory of action, this chapter describes impact findings at each step in the hypothesized cascade of effects, providing confirmatory tests of five a priori hypotheses. We also utilize the experimental design to explore the variability of impact on specific instructional practices and between networks. At the end of the chapter, we compare the effect size for staff instructional practices, the study’s primary outcome of interest, to effects in other comparable interventions outside the afterschool field.
Appendix F describes the estimation models used in Chapters 4 and 5. Detail on baseline covariates included in the models, unadjusted group means for each of the outcome measures, and supplementary impact tables with by-network estimates are included in Appendices G and H.
Understanding the Impact Tables Whenever a table in this chapter displays estimated impacts—the control group mean subtracted from the intervention group mean—we include the adjusted mean outcome levels for both the intervention and control groups used to calculate the impact estimate. These adjusted means provide context for interpreting the estimated differences. Mean outcome levels and impacts were estimated using regression models that utilized all available observations from intervention and control groups, including information on baseline covariates. Networks were weighted equally in all estimation models. We tested for variability of impact estimates across networks for each of the study outcomes. Analysis of the variability of impact estimates across networks is important because the average finding across networks may hide differences in the effectiveness of YPQI in different conditions to the extent that the magnitude of effects differs across networks.
The tables display an effect size and p-value for each impact estimate. The method used to produce the effect size is described in the notes to each impact table and in Chapter 2. The p-value indicates the probability of obtaining an impact as large as the estimated impact by chance alone, if in fact there was no true impact. Results are considered statistically significant if the p-value is .05 or lower. Results that are not statistically significant may have occurred due to chance and thus do not provide strong evidence about the impact of the YPQI. Where appropriate, the tables in this chapter report the number of level-2 cases removed from the analyses due to missing outcome data at level 1.
The results presented in this chapter are based on an intent-to-treat (ITT) analysis that includes all sites in the sample at the end of the implementation year. Thus, the impact estimates reflect the impact of assignment to the intervention condition, despite the fact that: (a) At the time of outcome data collection, not all managers or staff in the intervention group had received a full dose of the intervention (e.g.,

43
managers and staff who were hired after YPQI implementation began), and (b) some sites in the control group were implementing YPQI-like practices. These issues bias the analysis against finding intervention effects; therefore, the estimates presented in this section may be conservative.
Impact on Primary Outcomes of Interest In this section, we examine the impact of the intervention on managers’ improvement focus and enactment of continuous improvement practices with their site teams.
Impact on Manager Improvement Focus Although the YPQI theory of action suggests that continuous improvement practices cause improved quality of instruction, research on school reform reminds us that the focus of continuous improvement efforts must be directed toward an instructional objective if instruction is to change (Elmore, 2004). To assess the areas in which managers focused their improvement efforts, we asked them to list their top improvement priorities during the implementation year. We coded these responses to reflect alignment with instructional practices and then created a dichotomous outcome variable indicating whether or not a manager had reported at least one instructional improvement choice that was aligned with an instructional practice. We used a logistic regression model to predict improvement focus with the following covariates: education level of the manager and manager improvement focus at baseline (pre-test). Networks were modeled as fixed effects.
Impact findings for Manager Improvement Focus are presented in Table 4.1. The odds that managers assigned to the intervention group would mention an instructional objective was 2.34 times greater than the odds for managers in the control group. This estimated impact was statistically significant. Prior to the intervention, 10% of manager in the intervention group and 13% of managers in the control group indicated an instructional improvement focus. After the intervention, 43% of the managers in the intervention group and 24% of the managers in the control group indicated such a focus.
Table 4.1. Estimated Impact of the Intervention on Manager Improvement Focus
Intervention (Percent)
Control (Percent)
Impact (Percent)
Effect Size (Odds Ratio)
Statistical Significance of
Impact (p-value)
Manager Improvement Focus
43 24 19* 2.34 0.02
N = 61 Managers (36 missing cases). * p < .05 SOURCE: Manager Program-Wide Survey, baseline and implementation years (2006-07).
Impacts on Manager and Staff Continuous Improvement Practices The Manager Continuous Improvement Practices score was constructed from self-reports that managers enacted team-based self-assessment of instructional quality, team-based planning using data, and attendance at trainings focused on instructional methods. The Staff Continuous Improvement Practice score included self reports of engagement in these three practices as well as receipt of performance feedback by a manager.

Continuous Quality Improvement in Afterschool Settings
44
The impact of the intervention on Manager Continuous Improvement Practices was estimated using an OLS regression model. To improve precision of the estimates, four baseline covariates were included: education level of the manager, the total number of youth enrolled at the site, staff input in organizational decision-making, and staff experience with data collection.31 Networks were modeled as fixed effects. The model is described in Appendix Figure F-1.
The impact of the intervention on Staff Continuous Improvement Practices was estimated using a two-level hierarchical linear model with staff nested within sites. Baseline covariates for this model included: education level of the manager, education level of the staff, and a baseline measure of staff continuous improvement practices. The model is described in Appendix Figure F-2.
Table 4.2 summarizes the impacts of the intervention on manager and staff continuous improvement practices. Overall, we found that managers in afterschool sites randomly assigned to the intervention group had higher levels of enactment of continuous improvement practices than did managers assigned to the control group, with a standardized effect size of 0.98. This estimated impact was statistically significant. In practical terms, this means that, on average, intervention site managers implemented one more of the three practices (i.e., program self-assessment, improvement planning, and methods training) than they would have without the intervention. If we consider managers that achieved high implementation of continuous improvement practices, 53% of intervention group managers reported enacting all three of the practices, whereas only 16% of control group managers reported enacting all three of the practices.
Staff members in afterschool sites randomly assigned to the intervention group enacted continuous improvement practices at higher levels than did staff at sites that were assigned to the control group, with a standardized effect size of 0.52. This estimated impact was statistically significant. In practical terms, this effect size can be interpreted as the implementation of roughly one more of the four continuous improvement practices by staff at about two-thirds of the sites. If we consider sites where at least two staff achieved high implementation of continuous improvement practices (See Appendix E), 38% of sites in the intervention group reported at least two staff engaging in all four of the practices, whereas only 23% of sites in the control group reported at least two staff engaging in all four of the practices.
31 Because no pre-test on Manager Continuous Improvement Practices was available at the baseline, these measures - Staff Input in Organizational Decision-Making, and Staff Experience with Data Collection - reporting staff experience with practices the site manager would likely lead were used as an approximate pre-test. See Appendix Table G-3 for description of these measures.

45
Table 4.2. Estimated Impact of the Intervention on Manager and Staff Continuous Improvement Practices
Intervention Control Impact Effect Size of Impact
Statistical Significance of
Impact (p-value)
Manager Continuous Improvement Practices
1.03 0.71 0.32* 0.98 <0.001
Staff Continuous Improvement Practices
0.68 0.54 0.15* 0.52 0.003
Manager N = 79 (8 missing cases). Staff N = 330, from 71 sites (17 sites were missing from level two; 39 staff were missing from level one). * p < .05 SOURCE: Manager Program-Wide Survey, implementation year (2007-08); Staff Program-Wide Survey, implementation year (2007-2008) NOTES: The intervention and control columns provide estimates for regression adjusted means for the two experimental conditions at the end of the implementation year. The Impact column reflects the simple difference between estimated intervention and control group means. For Manager Continuous Improvement Practices, the effect size of impact was calculated by dividing the impact by the pooled (cross-network) standard deviation for the control group. For Staff Continuous Improvement Practices the effect size of impact was calculated by dividing the impact by √(SigmaSq.+Tau of Control Group). Sigma Sq. is the variance at level 1 (between program offerings) and Tau is the variance at level 2 (between sites). An alternate effect size for Staff Continuous Improvement Practices of d = 0.86 was calculated by dividing the impact by √Tau of Control Group. The p-value reflects a test of statistical significance for the impact estimate in the regression model.
The ICC for the Staff Continuous Improvement Practices score was 0.25. The ICC was produced using an unconditional HLM model and calculating SigmaSq./(SigmaSq.+ Tau).
Impact on Quality of Instruction As described in Chapter 2, the Staff Instructional Practices Total Score is a mean for nine evenly weighted component scales (i.e., Staff Disposition, Welcoming, Inclusion, Conflict Resolution, Skill Building, Grouping, Planning, Choice, and Reflection). For the Staff Instructional Practices Total Score, impacts were estimated using a two-level hierarchal linear model with staff nested within sites and four blocks32 treated as fixed effects. The model includes the following covariates at level 1: program-offering content (i.e., arts and enrichment, life skills, or other) and the age level of youth observed in the offering (i.e., elementary, middle, or high school).33 At level two the baseline Staff Instructional Practices Total Score (pre-test) was included to improve the precision of the impact estimates. The model is described in Appendix Figure F-3.
Table 4.3 summarizes the impact findings for the Staff Instructional Practices Total Score. Staff in afterschool sites randomly assigned to the intervention group exhibited higher levels of instructional quality than did staff in the control group, with a standardized effect size of 0.55. This estimated impact was statistically significant. In practical terms, this effect size can be interpreted as an average increase of
32 Note, four rather than five blocks are included in these analyses due to missing staff instructional data for Network E (See note 16 and discussion in Chapter 2). 33 These level-1 covariates are characteristics of the offerings sampled at the end of the implementation year and are included to control for the effects of selection bias in the offering sample. While we attempted to randomly sample offerings within sites, this process was problematic due to the instability of programming in afterschool sites. See Appendix H for descriptive information for the program offering and age group characteristics of the intervention and control groups.

Continuous Quality Improvement in Afterschool Settings
46
one level on two of the nine practices (or an increase of two levels on one practice). For example, this change could represent a site improving skill building and planning opportunities for youth by 1 point on the 5-point Youth PQA scale. If we consider program offerings that achieved a high level of instructional quality, 65% of intervention group staff received a mean Staff Instructional Practices Total Score of 4 or higher (on a scale range of 1 to 5), whereas only 39% reported equally high levels of instructional quality in the control group.
Table 4.3. Estimated Impact of the Intervention on Staff Instructional Practices Total Score
Intervention Control Impact Effect Size of Impact
Statistical Significance of Impact (p-value)
Staff Instructional Practices, Total Score 3.66 3.35 0.31* 0.55 0.003
Sample Size: 68 sites and 137 program offerings (0 omitted level-2 [site] cases; 0 omitted level-1 [program offering] cases). * p < .05 SOURCE: Program Offering Session Observation, implementation year (2007-08). NOTES: The intervention and control columns provide estimates for regression-adjusted means for the two experimental conditions at the end of the implementation year. The Impact column reflects the simple difference between estimated intervention and control group means. The effect size of impact was calculated by dividing the impact by √(SigmaSq.+Tau of Control Group). Sigma Sq. is the variance at level 1 (between program offerings) and Tau is the variance at level 2 (between sites). An alternate effect size of d=0.88 for Staff Instructional Practices was calculated by dividing the impact by √Tau of Control Group. The p-value reflects a test of statistical significance for the impact estimate in the regression model.
The ICC for the Staff Instructional Practices Total Score was 0.17. This ICC was produced using unconditional HLM models and calculating SigmaSq./(SigmaSq.+ Tau).
The site-level sample of 68 is used in these analyses (rather than the total site sample of 87) due to loss of data in Network E, requiring elimination of Network E from these analyses. See note 16.
Impacts on Staff Employment Tenure We examined impacts on staff tenure of employment at the end of the implementation year as an indication of YPQI effects on turnover. Two measures of staff employment tenure were developed to assess the stability of staffing at study sites both (a) during the implementation year and (b) from the baseline year through the end of the implementation year. The 10-months-or-more measure indicates whether or not staff were present during the entire implementation year, the intervention period with the highest requirements for staff participation. The 2-years-or-more measure indicates that staff were employed during both the baseline and implementation years. Because our interest was in whether staff did or did not remain employed through the end of each period, both of the measures were constructed as dichotomous variables.
YPQI impacts on staff 10-month or more and 2-years or more tenure were estimated using a two-level logistic regression model with networks treated as fixed effects. The model included the following covariates to improve precision of estimates: Staff Education and the corresponding 10-month or 2-year tenure at baseline.
Table 4.4 provides impacts on staff tenure at 10-month and 2-year time points. It is estimated that the intervention resulted in a 10 percentage point increase in the likelihood that staff would stay in their jobs
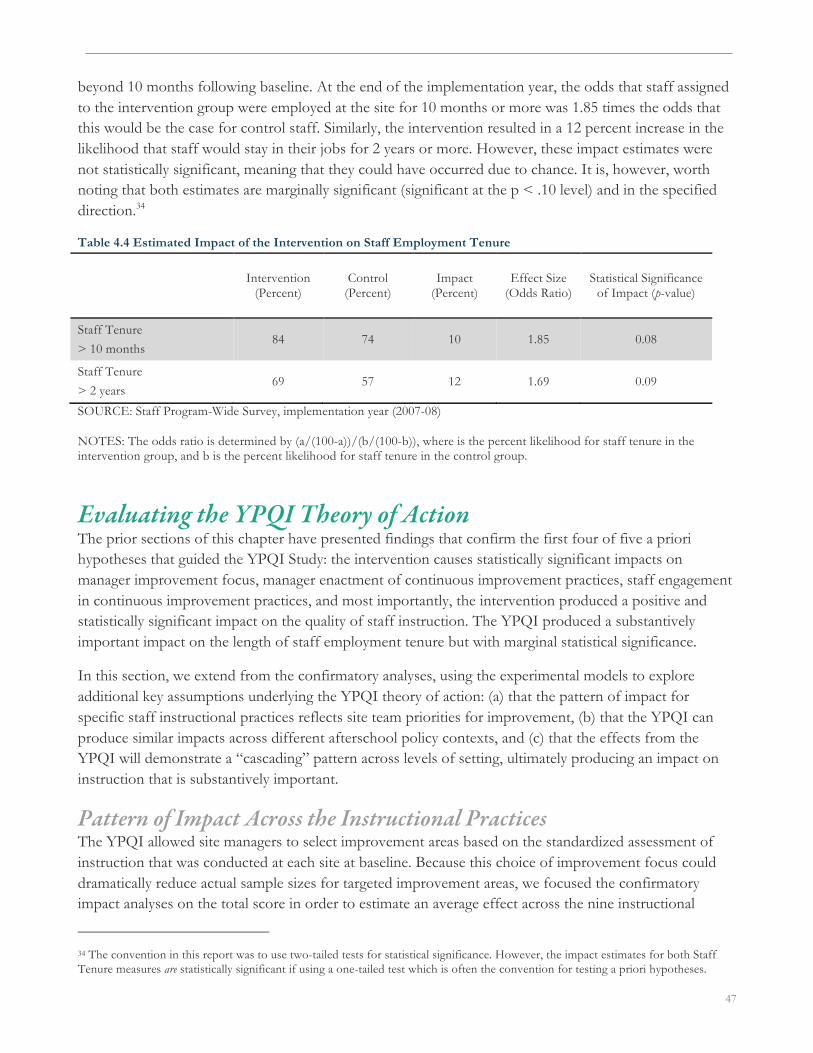
47
beyond 10 months following baseline. At the end of the implementation year, the odds that staff assigned to the intervention group were employed at the site for 10 months or more was 1.85 times the odds that this would be the case for control staff. Similarly, the intervention resulted in a 12 percent increase in the likelihood that staff would stay in their jobs for 2 years or more. However, these impact estimates were not statistically significant, meaning that they could have occurred due to chance. It is, however, worth noting that both estimates are marginally significant (significant at the p < .10 level) and in the specified direction.34
Table 4.4 Estimated Impact of the Intervention on Staff Employment Tenure
Intervention (Percent)
Control (Percent)
Impact (Percent)
Effect Size (Odds Ratio)
Statistical Significance of Impact (p-value)
Staff Tenure > 10 months
84 74 10 1.85 0.08
Staff Tenure > 2 years
69 57 12 1.69 0.09
SOURCE: Staff Program-Wide Survey, implementation year (2007-08) NOTES: The odds ratio is determined by (a/(100-a))/(b/(100-b)), where is the percent likelihood for staff tenure in the intervention group, and b is the percent likelihood for staff tenure in the control group.
Evaluating the YPQI Theory of Action The prior sections of this chapter have presented findings that confirm the first four of five a priori hypotheses that guided the YPQI Study: the intervention causes statistically significant impacts on manager improvement focus, manager enactment of continuous improvement practices, staff engagement in continuous improvement practices, and most importantly, the intervention produced a positive and statistically significant impact on the quality of staff instruction. The YPQI produced a substantively important impact on the length of staff employment tenure but with marginal statistical significance.
In this section, we extend from the confirmatory analyses, using the experimental models to explore additional key assumptions underlying the YPQI theory of action: (a) that the pattern of impact for specific staff instructional practices reflects site team priorities for improvement, (b) that the YPQI can produce similar impacts across different afterschool policy contexts, and (c) that the effects from the YPQI will demonstrate a “cascading” pattern across levels of setting, ultimately producing an impact on instruction that is substantively important.
Pattern of Impact Across the Instructional Practices The YPQI allowed site managers to select improvement areas based on the standardized assessment of instruction that was conducted at each site at baseline. Because this choice of improvement focus could dramatically reduce actual sample sizes for targeted improvement areas, we focused the confirmatory impact analyses on the total score in order to estimate an average effect across the nine instructional
34 The convention in this report was to use two-tailed tests for statistical significance. However, the impact estimates for both Staff Tenure measures are statistically significant if using a one-tailed test which is often the convention for testing a priori hypotheses.

Continuous Quality Improvement in Afterschool Settings
48
practices. In this section, we provide findings for the impact of the YPQI on specific instructional practices that make up the total score. These findings are useful for two purposes. First, they describe the specific practices that drive the impact estimates for the Staff Instructional Practices Total Score in Table 4.3. Second, it is useful to consider the pattern of effects in relation to the intentional choices by site managers about which specific instructional practices to improve.35 The estimation model is described in Appendix Figure F-3.
Impact findings for the nine measures of specific instructional practices are presented in Table 4.5 and can be summarized as follows. Staff in afterschool sites randomly assigned to the intervention group exhibited higher levels of instructional quality on all nine of the measures of specific instructional practices. Estimated impacts for four of these scales – Staff Disposition, Inclusion, Choice, and Planning – were statistically significant. The other five scales each demonstrated positive effect sizes, ranging from 0.03 to 0.30, but the estimated impacts were not statistically significant.
Based on these analyses, it appears that improvements in Staff Disposition, Inclusion, Choice, and especially Planning were the primary drivers of the impact estimates for the total scores. Table 4.5 can be compared to the improvement goals for the intervention group provided in Table 3.4 of Chapter 3. The largest effect sizes in Table 4.5 (not including Staff Disposition which was not available to managers as an improvement choice) – Inclusion, Planning, and Choice – were among the most frequently selected improvement areas at the beginning of the implementation year. The smallest effect sizes in Table 4.5 – grouping, welcoming, skill building, and conflict resolution – were the least frequently selected improvement areas. In contrast to this general pattern of alignment between improvement areas selected by site managers and effect sizes for the whole sample, the instructional practice of Reflection was the most frequently selected improvement area and one of the smallest effect sizes; however, this small average effect appears to be due largely to a negative effect in a single network.36
35 In a prior non-experimental study of the YPQI in 36 sites, improvement areas selected by site managers were the areas in which the greatest levels of instructional improvement occurred between the beginning and end of the intervention year (Smith, Akiva, Blazevski, & Pelle, 2008). 36 By-network impact analyses revealed that Network C had a large negative impact for the Reflection scale (d = -0.45), whereas impact estimates for the other networks were positive, ranging from d = 0.28 to d = 0.59 for the Reflection scale. With the Reflection scale removed, effect sizes correlate with frequency of selection for improvement plans at r = .8.

49
Table 4.5. Estimated Impact of the Intervention on Staff Instructional Practices Scales
Construct Intervention Control Impact Effect Size of Impact
Statistical Significance of
Impact (p-value) Staff Disposition 4.62 4.25 0.37* 0.44 0.03
Welcoming 4.85 4.73 0.13 0.23 0.27
Inclusion 4.20 3.89 0.31* 0.43 0.03
Conflict Resolution 4.62 4.32 0.30 0.36 0.08
Skill Building 3.86 3.63 0.24 0.27 0.18
Grouping 2.56 2.53 0.03 0.02 0.93
Planning 2.19 1.55 0.64* 0.59 0.003
Choice 3.74 3.15 0.59* 0.42 0.03
Reflection 2.25 1.99 0.26 0.23 0.23
Sample Size: 68 sites and 137 program offerings (0 omitted level two cases; 0 omitted level one cases). * p < .05 SOURCE: Offering Session Observation, implementation year (2007-08). NOTES: The intervention and control columns provide estimates for regression adjusted means for the two experimental conditions at the end of the implementation year. The Impact column reflects the simple difference between estimated intervention and control group means. The effect size of impact was calculated by dividing the impact by √(SigmaSq.+Tau of Control Group). Sigma Sq. is the variance at level 1 (between program offerings) and Tau is the variance at level 2 (between sites). An alternate effect size was calculated by dividing the impact by √Tau of Control Group. The alternate effect size for Staff Disposition = 0.58, Welcoming = 0.31, Inclusion = 0.57, Conflict Resolution = 0.68, Skill Building = 0.51, Grouping = 0.10, Planning = 4.22, Choice = 1.29, and Reflection = 0.78. The p-value reflects a test of statistical significance for the impact estimate in the regression model. The site level sample of 68 is used in these analyses (rather than the total site sample of 87) due to loss of data in Network E, requiring elimination of Network E in these analyses.
Due to the multiple tests in Table 4.5, we have to consider the increased likelihood of Type I error. If we used the Bonferroni adjustment for p-values to adjust the threshold for statistical significance – dividing the p < .05 threshold by the number of comparisons, or nine in this case—only measures with a p-value < .006 are considered statistically significant. Using this criterion, only the Planning scale was statistically significant.
Variability of Impacts Across Networks According to the YPQI theory of action, the YPQI should be equally effective across the five different policy contexts represented by the five afterschool networks. By averaging across different impact estimates for individual networks, we run the risk of obscuring our understanding of the actual impact of the YPQI. Further, because the YPQI study was designed to include afterschool networks that represent diverse afterschool policies, differences in impact across networks may shed light on policy contexts where the intervention is more or less effective.
We examined impacts by network for three outcomes: Manager Continuous Improvement Practices, Staff Continuous Improvement Practices, and the Staff Instructional Practices Total Score. The models used to estimate by-network impacts are described in Appendix Table F-4. By-network impact tables for manager and staff continuous improvement practices are provided in Appendix G, and by-network impact tables for staff instructional practices are provided in Appendix H. Once the by-network models were identified, we conducted omnibus chi-square tests to evaluate the hypothesis that there were not differences between networks.

Continuous Quality Improvement in Afterschool Settings
50
No significant differences in the magnitude of impact estimates between networks were detected for Manager Continuous Improvement Practices or the Staff Instructional Practices Total Score. The only significant differences detected were for the Staff Continuous Improvement Practices score. Specifically, Network B appears to be an outlier with a network effect size of -0.071 for this outcome. Given this finding, we re-estimated the impact model for the four remaining networks and conducted second omnibus test for significant differences between the by-network impact estimates. Differences between the remaining four networks were not different than zero. The average impact of the YPQI on staff continuous improvement practices increases from a standardized effect size of 0.52 (with Network B) to a standardized effect size of 0.76 (with Network B removed).
Our examination of the raw Network B data separately for the intervention and control group revealed that intervention group staff in Network B did engage in substantially more continuous improvement practices from baseline to the end of the implementation year (See Appendix Table G-2). However, staff in control group sites participated in even greater numbers of continuous improvement practices and demonstrated greater increases over the implementation year than the intervention group. Control group staff in Network B were “defiers” (Gennetian, Morris, Bos & Bloom, 2005) who actually implemented more YPQI-like practices with their staff than the intervention group, thus leading to a null effect on staff continuous improvement practices despite actual gains by staff in the intervention group. When we recalculated the effect size for Network B based on the assumption of no change in the control group between baseline and the end of the implementation year, the effect size was positive and substantial (d = 0.54).37
Cascading Effects This chapter describes positive effects associated with assignment to the intervention condition for continuous improvement practices and instructional quality in afterschool settings. With one exception, effect sizes for each outcome were similar across the five networks. Because few intervention studies in the afterschool or school day fields have been conducted that both (a) focus primarily on measuring instructional change and (b) test interventions that address multiple levels of setting, we lack an empirical base with which to contextualize these findings. In this section, we address two questions regarding the pattern and magnitude of the effect sizes from our impact analyses.
Does the pattern of effects fit the YPQI theory of action? The YPQI theory of action describes cascading effects; that is, effects that cross levels (e.g., from organization to point of service) and that flow to increasingly large numbers of units due to the nested structure of settings and individual roles (cf., Seidman, in press, for a discussion of the application of cascade theory to social setting research). According to the YPQI theory of action, effects from the YPQI should cascade across the organizational and instructional levels of setting by influencing patterns of enactment and engagement in continuous improvement practice by managers and staff, resulting in higher quality instruction at the point of service. Table 4.6 presents standardized effect sizes for each of the levels and roles described in the YPQI theory of action. Because the YPQI theory of action includes the policy context as a level, where site managers engage with
37 Caveat: Given that the control group conducted “business as usual,” there was likely to be a change on this measure between baseline and the end of the implementation year; consequently, this comparison must be interpreted with caution.

51
accountability messages and supports, we included an effect size for participation in YPQI-like supports (e.g., training, technical assistance, and coaching) to represent the effect of the YPQI on the experience of managers engaging with the policy context. The declining “cascade” of standardized effect sizes conforms to the YPQI theory of action; that is, the effect of the intervention on the outcome variable becomes weaker as the setting level of the outcome variable becomes further removed from the policy context. The stronger claim that effects more proximal to the intervention are the cause of impacts at subsequent levels (instruction) is clearly more difficult to substantiate. In Chapter 5, we use non-experimental methods to test the hypothesis that variation in implementation of continuous improvement practices by staff is a cross-level driver of variation in the quality of instruction. Support for this hypothesis would be consistent with the YPQI theory of action and our causal claims about the transmission of intervention effects across levels of setting.
Table 4.6. Cascading Effects Effect Size of
Impact Policy Context
Manager engagement in YPQI training 1.87a
Organizational level of setting
Manager enactment of continuous improvement practice 0.98b
Staff engagement in continuous improvement practice 0.52b
Instructional level of setting
Staff enactment of instruction quality 0.55c
SOURCE: Manager Program-Wide Survey, implementation year (2007-08), Staff Program-Wide Survey, implementation year (2007-08), and Offering Session Observation, implementation year (2007-08). NOTES: Effect sizes provided here are standardized by dividing the experimental group difference in means by the standard deviation of the control group. a Effect size calculated from data on the service contrast during the implementation year provided in Table 3.2. b Effect size provided in Table 4.2. c Effect size provided in Table 4.3.
What is a large effect on instructional practice? The effect sizes presented in this report should be understood within the limited record of prior experimental studies focused on changing instructional practices. Cohen (1988) presented guidance about the magnitude of effect sizes, which is now widely used for interpretation. However, Cohen (1988) suggested that effect size magnitudes should be considered in the context of the area of behavioral science in which studies are conducted, and recent guidance on the topic emphasizes that interpretation of standardized effect sizes should be grounded in empirical benchmarks “relevant to the intervention, target population, and outcome measure being considered” (Hill, Bloom, Black, & Lipsey, 2007, p. 1). We suggest two empirical benchmarks of particular interest: (1) the size of standardized effects on instruction in other studies of instructional change that employed observation-based measures and (2) the size of standardized effects on instruction in studies that also demonstrated effects on child outcomes. The first benchmark relates to cost efficiency and the second to the ultimate purpose of the YPQI.
In the three experimental studies focused on instructional change described in Chapter 3 (Fukkink & Lont, 2007; Raver et al., 2008; Garet et al., 2008), standardized effect sizes for instructional practices were comparable to those in the YPQI for instructional impact (see Table 4.7). Although all these interventions were of greater intensity than the YPQI (see discussion in Chapter 3, Note 30), they all used training- and

Continuous Quality Improvement in Afterschool Settings
52
coaching-based intervention models and assessed instructional outcomes using observational measures. However, these intervention models differed from the YPQI in one critical respect: The interventions were targeted directly at instructional staff, rather than site managers, and did not rely upon an intermediary individual, the site manager, to carry the effect of the intervention. In sum, the magnitude of effects on instruction in the YPQI study appear to be similar in magnitude to those achieved by other interventions focused on improving instruction.
As to the second empirical benchmark, we have little prior evidence about the size of an effect on instruction necessary to produce an effect on a child-level outcome. To date, no meta-analytic studies of experimental effects on the quality of school-day instruction have been completed. A recent meta-analysis of staff training interventions in child-care settings generated an overall effect size of d = 0.52 for impact on instructional practices for all studies reviewed, and a “cascading” effect of d = 0.70 on instructional practices in several studies that also produced statistically significant effects at the child level (Fukkink & Lont, 2007). With this limited and case-specific information, we are unable to offer any normative suggestions regarding how large an instructional effect size must be to cascade into effects on child cognitive or social and emotional outcomes, except that they should probably be large.
Table 4.7. Comparative Impact of the YPQI to Related Interventions
Study Effect Size (Measure) Intensity of intervention “Cascading”
effect?
YPQI d = 0.55 (Youth PQA; instructional quality)
40 hours training and coaching total for 1 manager & 2 staff YES
Child Care Meta-Analysis (Fukkink & Lont, 2007)
d = 0.52 (Various quality of care) Average 55 hours in training NO
Head Start (Raver et al., 2008)
d = 0.52 - 0.89 (CLASS: behavior mgmt, teacher
sensitivity, positive climate)
30 hours training and up to 80 hours coaching per teacher NO
Elementary Literacy (Garret et al., 2008)
d = 0.53 (Teacher led explicit instruction)
45 hours training and 62 hours coaching NO
NOTES: Youth PQA = Youth Program Quality Assessment; CLASS = Classroom Assessment Scoring System.

53
Chapter 5
Implementation Findings Whereas findings in Chapter 4 were consistent with the YPQI theory of action and support the hypothesis that assignment to the YPQI caused change in outcomes at both the organization and point-of-service levels of setting, analyses in this chapter address the possibility that intervention effects may vary as a function of implementation. Specifically, we investigate (a) the relationship between implementation fidelity and instructional practices, (b) how well this relationship holds up across challenging conditions, and (c) the sustainability of implementation over time. Additional detail and supporting tables for analyses and findings presented in this chapter are provided in Appendix J.
Following the discussion of YPQI design elements in Chapter 3, we use the term implementation to refer to manager enactment of and staff engagement with continuous improvement practices. Whereas manager and staff continuous improvement practices were treated as outcomes in Chapter 4, here we are concerned with the intensity with which managers and staff implemented these practices in order to produce point-of-service level effects on the quality of instruction.
All analyses in this chapter are non-experimental and, although less reliable and robust than the confirmatory impact analyses presented in the previous chapter, they offer important insight into issues relevant to adoption of the YPQI as a site level improvement model for use in quality improvement systems. All analyses in this chapter include the combined sample of intervention and control group sites. Although a focus on implementation implies a concern with behavior in the intervention group, we include both groups for several reasons. First, because the control group implemented YPQI-like practices at substantial levels, the control group can contribute both variation on measured variables and additional sample size to increase the power of our analyses. Second, the YPQI continuous improvement practices are relatively generic, and our interest is most fundamentally in the type and intensity of continuous improvement practice necessary to produce effects rather than in practices that are “branded” through association with the YPQI. Finally, the extension of our implementation sample to include practices that were not produced under guidance by the intervention team or its field consultants improves our confidence in the scalability of the intervention model under typical circumstances.
Chapter 5 is organized around three research questions. First, we attempt to understand the effects of higher fidelity implementation in terms of the linear association between the four continuous improvement practices and the quality of instruction. Next, we attempt to identify optimal conditions under which YPQI effects might be achieved by exploring moderation effects of three structural features of afterschool programs – manager turnover, staff education, and youth-adult ratio – on the association between implementation and instructional quality. Third, we address the issue of sustainability by estimating the growth trajectory for YPQI continuous improvement practices and staff employment tenure from the baseline year through the end of the implementation year, and ultimately, through the end of the follow-up year.

Continuous Quality Improvement in Afterschool Settings
54
Does Higher Fidelity Implementation of Continuous Improvement Practices Increase the Quality of Instruction? In Chapter 4, we presented results that support the hypothesis that the YPQI produces a cascade of effects across setting levels as predicted by the YPQI theory of action (see Figure A-1), noting that the experimental design could not provide evidence that each effect in the cascade caused the next, but only that each effect was caused by assignment to the intervention. This section directly addresses the issue of cross-level effects and provides an exploration of the role that staff play as carriers of the YPQI effect from the organization setting to the point-of-service setting. That is, we examine how higher fidelity implementation of continuous improvement practices (defined by the site-level mean for the Staff Continuous Improvement Practices score) is related to the quality of instruction at that site.38
Although the YPQI explicitly targets site managers, the role that staff play in implementation of the four continuous improvement practices is important both as a source of validation for the YPQI’s cross-level theory of action, as well as for policy. Although numerous accountability and improvement policies mandate production of performance data, few require creation of a site team to both produce and act upon this data.39 As discussed in Chapter 1, this is a key difference between higher and lower stakes accountability policies, the impact of which has not yet been fully explored. The YPQI study provides a rare opportunity to test the effectiveness of a lower stakes model with an experimental design and standards for practice at both the organizational and point-of-service levels of setting. If staff engagement in the four continuous improvement practices can be shown to play their hypothesized mediating role between site assignment to the intervention and instructional quality, then the study provides some validation for lower stakes accountability models that emphasize collective staff accountability for improvement in contrast to higher stakes, sanction-based models that focus accountability on publicity of quality ratings.
Analytic Approach Because analyses in this section are non-experimental, the primary threat to the finding of association between staff continuous improvement practices and instructional quality is the omission of a confounding variable; that is, unmeasured attributes of staff that may be a hidden cause(s) of instructional practice scores. To reduce potential bias in the estimate of this association, we employed an instrumental variables (IV) approach designed to reduce the impact of selection bias or unmeasured predictors (Gennetian, Morris, Bos, & Bloom, 2005). The IV approach employs a two-step estimation model. In the first step of the regression model, experimental assignment condition is used as an “instrument” to purge the Staff Continuous Improvement Practices score of unwanted bias. In the second step, this disattenuated score is then modeled as a predictor for the Staff Instructional Practices Total Score, yielding an estimate of the effect of YPQI continuous improvement practices on the quality of instructional practice for each site. For the second stage estimation model, we used a two-level hierarchical model with
38 In this section, we describe linear relationships. However, non-linear questions are also of interest; specifically, whether or not full implementation – simultaneous use of all four continuous improvement practices by managers – is more highly related to high instructional quality than partial implementation. These hypotheses and findings are discussed in Smith, Pearson, Peck, and Denault (2008, paper presented at the conference for the American Educational Research Association). 39 A site team of manager and staff implementing the four continuous improvement practices could also be called a professional learning community. See note 8.

55
four40 networks (blocks) modeled at level 2 as fixed effects. The Staff Continuous Improvement Practices score was the primary predictor of interest, and the Staff Instructional Practices Total score was the outcome. These measures are identical to those used in the Chapter 4 impact analyses, with the important exception that the Staff Continuous Improvement Practices score has been disattenuated using the IV approach. Estimation models are described in Appendix Figures F-5 and F-6. Regression output is provided in Appendix J.
As a parallel analytic step, we also attempted to quantify the robustness of the inference that staff continuous improvement practices are related to instructional quality. Following Frank (2000), we conducted a sensitivity analyses to understand how strong of a predictor an unmeasured variable would have to be, relative to the Staff Instructional Practices Total score pre-test, to invalidate the inference of association between the Staff Continuous Improvement Practices score and the Staff Instructional Practices Total Score.
Findings Analyses for this section produced two sets of findings: those from the instrumental variables analysis and those from the sensitivity analysis.
Instrumental Variable Findings. Table 5.1 provides unstandardized regression coefficients for versions of the Staff Continuous Improvement Practices score in each of two separate hierarchal linear models. The first row of Table 5.1 provides the coefficient for the unadjusted Staff Continuous Improvement Practices score as a predictor of staff instructional quality. The second row provides the coefficient for the disattenuated Staff Continuous Improvement Practices score produced through the IV approach. The coefficient obtained through the IV approach is larger than the coefficient obtained using the raw-score approach. Substantively, the IV finding indicates that a one-unit change in the Staff Continuous Improvement Practices score is associated with approximately a one point change in the Staff Instructional Practices Total score. This approximately one point change is more than three times as large as the mean effect of assignment to the YPQI intervention group as described in Table 4.3 in Chapter 4.
These results suggest that degree of implementation plays a substantial role in the impact of the YPQI. For example, sites that fully implement the YPQI are likely to see an increase in the quality of staff instructional practices twice as large as sites that only partially implement the YPQI.
40 As described in Chapter 2, data from only four networks were available due to the loss of instructional quality data in Network E.

Continuous Quality Improvement in Afterschool Settings
56
Table 5.1. Estimated Influence of Staff Continuous Improvement Practices on the Quality of Staff Instruction
Unstandardized Regression Coefficient for Staff Continuous Improvement Practices as a Predictor of
Staff Instructional Quality (Standard Error)
Unadjusted Predictor 0.65* (.27)
IV Predictor 1.12** (.41) Sample Size: Raw Score Analyses – 68 sites and 137 program offerings (0 omitted level 2 cases and 0 omitted level 1 cases)
* p < .05. ** p < .01 SOURCE: Staff Program-Wide Survey and Program Offering Session Observation, implementation year (2007-08). NOTES: Coefficients and standard errors were produced using a two-level HLM model with covariates for program offering content, age-level, and network effects (identical to the experimental model for staff instructional quality in Table 4.2). Outcome is Staff Instructional Practices Total score. For the IV model, the two-step sequence was designed to disattenuate the Staff Continuous Improvement score as a predictor of Staff Instructional Practices Total Score.
Robustness of Implementation Findings. Our sensitivity analysis suggests that an unmeasured confounding variable would have to be correlated at roughly r = .44 with the Staff Continuous Improvement Practices score and with the Staff Instructional Practices Total Score to invalidate the inference of association.41 Put another way, 33% of the estimate would have to be due to bias, or 33% of the data (16 level-2 cases) would have to be replaced with cases for which the null hypothesis (i.e., no association) was true in order to invalidate the inference (Frank & Min, 2007). The impact of an unmeasured confounding variable in the model predicting Staff Instructional Practices Total score would have to be 14 times greater than the impact of the pre-test in order to invalidate the inference of association between staff continuous improvement and staff instructional practices. This finding suggests that we are unlikely to identify an omitted variable that would eliminate the association between staff engagement in continuous improvement practices and the quality of instruction.
Do Structural Features Moderate the Effect of Continuous Improvement Practices on Instructional Practices? Findings from the prior section suggest that fidelity of staff implementation of continuous improvement practices is associated with higher quality instruction, supporting a key assumption in the YPQI theory of action. In this section, we attempt to inform our understanding of the robustness of the YPQI across the widely varied circumstances of individual afterschool sites by focusing on the conditions that might optimize or undermine the association between staff engagement in the four continuous improvement practices and staff enactment of high quality instruction. Specifically, we extend the IV estimation model developed in the prior section to assess whether three structural features of afterschool programs – site manager turnover, staff education level, and youth-adult ratio - moderate the association between the Staff 41 An unmeasured confounding variable would have to correlate with both the implementation predictor (Staff Continuous Improvement Practices) and the outcome (Staff Instructional Practices) at r = .44 to invalidate the inference of association between the predictor and the outcome. As a comparison, the Staff Instructional Practices Total score at baseline (pre-test for the outcome) is correlated r = .02 (p = .84, N= 87) with the predictor and r = .57 (p = < .001, N=87) with the outcome. To estimate the necessary impact of a potential confound on the inference of association, we square the estimate of impact for a confound (r = .44), which equals .19, and compare this number to the impact of the baseline pre-test (r = .02 times r = 0.57) which equals 0.012 (See Frank, 2000).

57
Continuous Improvement Practices score and the Staff Instructional Practices Total score.42 Moderation refers to the idea that the strength of association between two variables may differ at different levels of a third variable. For example, it is possible that the association between Staff Continuous Improvement Practices and Staff Instructional Practices might be quite strong at sites where youth-adult ratios are low but disappear altogether at sites where a few staff struggle to manage large groups of youth.
Analytic Approach To test for moderation effects, we extend the IV estimation model developed in the prior section by adding a measure for the main effect of each structural feature – manager turnover during the implementation year, average staff education level at the site, and average youth-adult ratio in program offerings at the site – and an interaction term for each structural feature and the Staff Continuous Improvement Practices score. Following Baron & Kenny (1986), the interaction term is a cross-product of the (centered) Staff Continuous Improvement Practices score and the specific structural feature of interest. Coefficients on the interaction terms provide directional sign and point estimates for the moderation effect. Note that our tests of statistical significance are potentially under-powered due to small sample sizes. A separate moderation model was estimated for each of the three structural features. Regression output for the three models is provided in Appendix J.
Findings None of the three moderation effects attained statistical significance. The coefficient for manager turnover during the implementation year on the association between staff continuous improvement and instructional quality during afterschool program offerings was negative. Higher average levels of staff education at the site had a positive coefficient for the association between staff continuous improvement and instructional quality during afterschool program offerings. The coefficient for lower average youth-adult ratios at the site on the association between staff continuous improvement and instructional quality during afterschool program offerings was positive.
Table 5.2 provides regression coefficients and standard errors for each of the interaction terms designed to identify moderation. Although the moderation effect for each structural feature carried a directional sign that was expected, the overall strength of association between the moderator and the outcome was weaker in each case than the effect size for the main effect of staff continuous improvement in Table 5.1. These analyses suggest that whereas moderation effects may exist, they are not powerful sources of influence on the association between staff engagement in continuous improvement and the quality of instruction in afterschool programs. Framed in a positive sense, the YPQI appears to be robust across several challenging structural features.
42 The three structural features were selected because they have each been targets of public policy based on the theory that low staff education, high youth-adult ratios, and high levels of turnover are barriers to program quality. See discussion of structural features and their relation to instructional practices in Mashburn et al. (2008) and Pianta et al. (2008).

Continuous Quality Improvement in Afterschool Settings
58
Table 5.2 Moderation Effects of Manager Turnover, Staff Education Level, and Youth-Adult Ratio on the Association Between Staff Continuous Improvement Practices and Staff Instructional Practices Level-2 Unstandardized
Regression Coefficient on the Interaction Term (SE)
Staff Continuous Improvement Practices X Manager turnover -0.55 (0.85)
Staff Continuous Improvement Practices X Staff education 0.33 (0.30)
Staff Continuous Improvement Practices X Youth-adult ratio 0.01 (0.07)
Sample Size: 63 sites and 127 program offerings (5 omitted level-2 cases and 10 omitted level-1 cases) SOURCE: Staff Program-Wide Survey, 2007-08 and Youth Program Quality Assessment, Form A, 2007-08 NOTES: Coefficients and standard errors were produced using a two-level HLM model with covariates. Outcome is Staff Instructional Practices. Manager turnover is a dichotomous variable coded 1=turnover during the implementation year. Staff education is five level variable where 1=less than high school, 2=high school or GED, 3=some college or an Associate’s degree, 4= Bachelor’s degree, 5= Master’s degree or higher. Youth-adult ratio is an interval level variable created by dividing the number of youth in the program offering by the number of staff delivering instruction during the offering.
Was Implementation Fidelity Sustained Through the End of the Follow-Up Year? Did Control Group Levels of Implementation Increase After Receiving Access to the YPQI? If the YPQI had positive effects on sites in a given network at the end of the implementation year, it is important to know whether those effects could be sustained over time. For example, because fidelity of implementation of staff continuous improvement practices was raised to a higher level as a result of assignment to the YPQI, we want to know if that level of implementation was maintained in the intervention group at the end of the next year when implementation of these practices was voluntary and modest incentives were withdrawn. If levels of effects achieved at the end of the implementation year were maintained in the intervention group, this offers support to the YPQI theory of action which suggests that if the YPQI can change features of behavior settings (e.g., use of a standardized assessment of instruction), the influence of these changes will persist despite changes in the external environment and internal staffing (See discussion in Appendix A).
Further, if the control group was also given voluntary access to the YPQI trainings during the follow-up year, would their level of implementation rise to the same level as the intervention group? By answering this question, we capture additional information about the sustainability of YPQI in Networks where new programs may be introduced to the YPQI over a period of years on a voluntary basis. We hypothesized that control group use of YPQI practices would increase with access to the YPQI supports during the follow-up year, though we lack a confirmatory research design.
To address these questions, we compare data collected at three time points in each of three successive years: baseline, end of the implementation year, and end of the follow-up year. Specifically, we examine trends over time on three of the outcomes from Chapter 4—manager improvement focus, staff

59
engagement in continuous improvement practices, and staff employment tenure of two years or more.43 We are particularly interested in understanding (a) the extent to which site-level means for these outcomes in the intervention group were maintained from the end of the implementation year to the end of the follow-up year and (b) the extent to which site-level means changed in the control group after they received access to the intervention. In contrast to the experimental questions addressed in Chapter 4, which were focused on differences between the intervention and control groups, to address the questions posed in this section we examine changes in levels of the three outcomes over time within each group.
During the follow-up year, control group sites were given access to the YPQI, but participation was voluntary and incentives withdrawn. Intervention group sites were also invited to voluntarily continue participating in YPQI trainings. No additional services, other than the YPQI training sequence, were offered to any of the five networks by the Weikart Center. In chapter 3, Table 3.2 presents levels of participation in YPQI-like training for the two groups during the implementation and follow-up years. Three observations from Table 3.2 are of present interest. First, the contrast in participation for the implementation year was large, suggesting that a substantially larger percentage of intervention group managers were exposed to the YPQI supports compared to control group managers. Second, the intervention group utilization of YPQI training declined from the end of the implementation year, and the utilization in the control group increased substantially, making the two groups roughly equal by the end of the follow-up year. Finally, it appears that utilization of YPQI-like training was higher for both groups at the end of the follow-up year than levels of utilization by the control group before they were allowed access to the YPQI. This last observation suggests that the intervention was still activated in the networks during the follow-up year and available to have an effect on intervention and control group managers.
Analytic approach Our primary strategy was to estimate regression-adjusted probabilities or means at each time point for each of the three outcomes using linear and logistic regression models that estimated growth in each outcome over the baseline. Logistic models yielded regression-adjusted probabilities for Manager Improvement Focus and Staff Employment Tenure at each time point for the intervention group and for the control group separately. A two-level linear model yielded regression-adjusted means for the Staff Continuous Improvement Practices score at each time point for the intervention group and for the control group separately. In each model, the intercept term represents the baseline value for the outcome, and dichotomous variables indicating mean-level deviations from the baseline were included for each of the ensuing two time points. Regression coefficients on the dichotomous variable for each subsequent time point represented the regression-adjusted difference for that time point above or below the intercept, depending on the sign. Significance tests associated with the regression coefficients indicate whether the difference in means between the baseline and each of the two later time-points for the given outcome variable is statistically significant. Networks were treated as fixed effects, and no covariates were included. Estimation models are described in Appendix Figure F-7.
43 Extensive data were collected on specific YPQI practices for the treatment group only. However, this section is focused on findings for both the treatment and wait-list groups so we only report on data that are available for both groups at all three time points. Due to expense, we did not collect data on staff instructional practices during the follow-up year.

Continuous Quality Improvement in Afterschool Settings
60
Findings Analyses to assess growth over three time points yielded three sets of findings: those associated with manager improvement focus, staff continuous improvement practice, and staff tenure.
Manager Improvement Focus. Table 5.3 presents logistic regression results for Manager Improvement Focus at three time points. Odds ratios provide the primary effect size for the model. For the intervention group, Table 5.3 indicates that the odds that managers selected instructional issues as the focus of improvement efforts was 7.29 times greater at the end of the implementation year than at baseline. This is a substantial increase, suggesting that after taking part in the YPQI, managers are more likely to see management of point-of-service quality as part of their job and as an important area for the organization.
The results shown in Table 5.3 also indicate that the odds that managers in the intervention group selected instructional issues as the focus of improvement efforts were 4 times greater at the end of the follow-up year than at baseline. Although the level of Manager Improvement Focus declined from the implementation year to the end of the follow-up year, the intervention group’s heightened focus on instructional improvement was still apparent one year after the end of the YPQI.
For the control group, the odds that managers selected instructional issues as the focus of improvement efforts was 5.6 times greater at the end of the follow-up year than at baseline. As sites had access to YPQI supports after implementation and before follow-up, this finding supports our hypothesis that YPQI practices would occur in the control group with voluntary access to the YPQI.
Table 5.3 Manager Improvement Focus at Three Time Points Intervention Group
Probability SE Odds Ratio p-value
Baseline .10 - - -
Implementation Year .45 .62 7.29* 0.001
Follow-up Year .31 .68 4.00* 0.04
Sample Size: 150 site manager cases (baseline N=50; implementation N=50; follow-up N=50)
Control Group
Probability SE Odds Ratio p-value
Baseline .13 - - -
Implementation Year .22 .62 2.00 0.27
Follow-up Year (Control sites had access to YPQI)
.44 .62 5.60* 0.005
Sample Size: 141 site manager cases (baseline N=41; implementation N=41; follow-up N=41)
* p < .05 SOURCE: Manager Program-Wide Survey, baseline – implementation – follow-up years (2006-08). NOTES: The probability column provides estimates for regression adjusted means for the two experimental conditions at year of data collection. They are calculated by using the logistic function Probability=EXP^(a+bx)/(1+EXP^(a+bx)), where a is the intercept and b is the estimated coefficient of x. a+bx is the predicted outcome based on our setting.
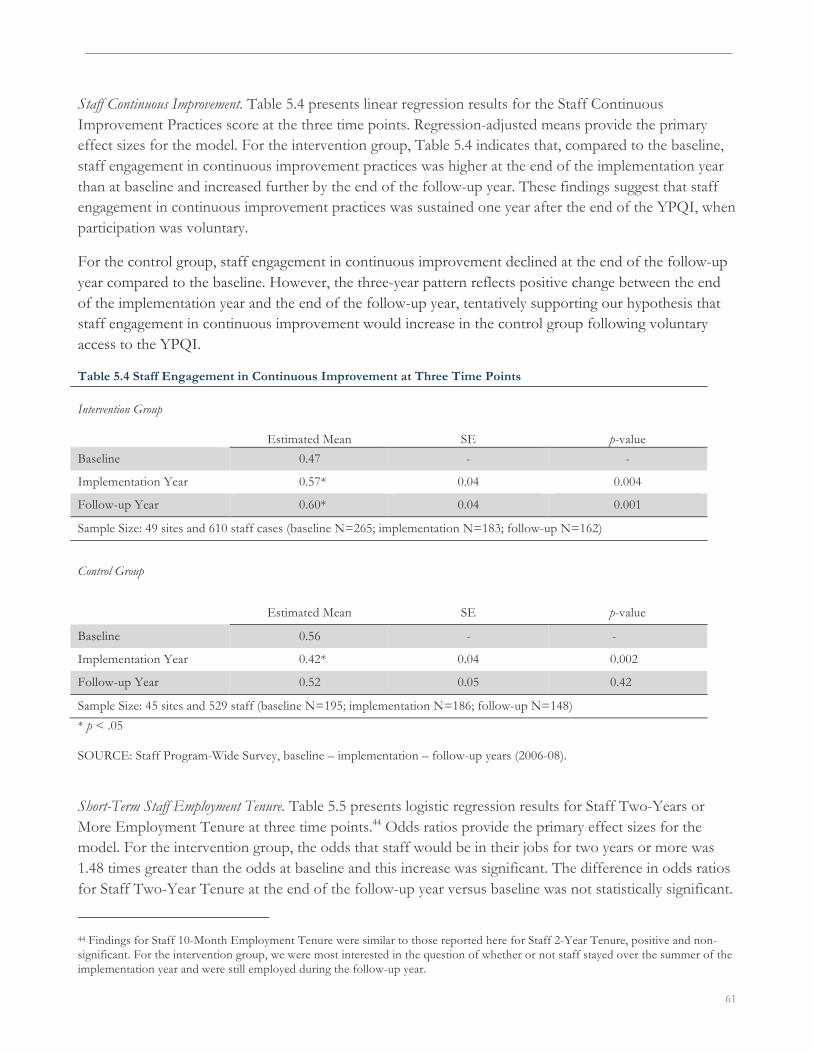
61
Staff Continuous Improvement. Table 5.4 presents linear regression results for the Staff Continuous Improvement Practices score at the three time points. Regression-adjusted means provide the primary effect sizes for the model. For the intervention group, Table 5.4 indicates that, compared to the baseline, staff engagement in continuous improvement practices was higher at the end of the implementation year than at baseline and increased further by the end of the follow-up year. These findings suggest that staff engagement in continuous improvement practices was sustained one year after the end of the YPQI, when participation was voluntary.
For the control group, staff engagement in continuous improvement declined at the end of the follow-up year compared to the baseline. However, the three-year pattern reflects positive change between the end of the implementation year and the end of the follow-up year, tentatively supporting our hypothesis that staff engagement in continuous improvement would increase in the control group following voluntary access to the YPQI.
Table 5.4 Staff Engagement in Continuous Improvement at Three Time Points Intervention Group Estimated Mean SE p-value
Baseline 0.47 - -
Implementation Year 0.57* 0.04 0.004
Follow-up Year 0.60* 0.04 0.001
Sample Size: 49 sites and 610 staff cases (baseline N=265; implementation N=183; follow-up N=162)
Control Group
Estimated Mean SE p-value
Baseline 0.56 - -
Implementation Year 0.42* 0.04 0.002
Follow-up Year 0.52 0.05 0.42
Sample Size: 45 sites and 529 staff (baseline N=195; implementation N=186; follow-up N=148)
* p < .05 SOURCE: Staff Program-Wide Survey, baseline – implementation – follow-up years (2006-08).
Short-Term Staff Employment Tenure. Table 5.5 presents logistic regression results for Staff Two-Years or More Employment Tenure at three time points.44 Odds ratios provide the primary effect sizes for the model. For the intervention group, the odds that staff would be in their jobs for two years or more was 1.48 times greater than the odds at baseline and this increase was significant. The difference in odds ratios for Staff Two-Year Tenure at the end of the follow-up year versus baseline was not statistically significant.
44 Findings for Staff 10-Month Employment Tenure were similar to those reported here for Staff 2-Year Tenure, positive and non-significant. For the intervention group, we were most interested in the question of whether or not staff stayed over the summer of the implementation year and were still employed during the follow-up year.

Continuous Quality Improvement in Afterschool Settings
62
However, the overall trend in these findings suggests that staff tenure increased at the end of the implementation year and that these levels of staff employment tenure were still apparent one year after the end of the YPQI.
For the control group, Staff 2-Year Tenure increased substantially at the end of the follow-up year compared to the baseline. This difference was statistically significant and supports our hypothesis that YPQI effects would increase in the control group following access to the YPQI.
Table 5.5 Staff Employment Tenure at Three Time Points Intervention Group Probability SE Odds Ratio p-value
Baseline .53 - - -
Implementation Year .62 .20 1.48* 0.05
Follow-up Year .62 .21 1.47 0.06
Sample: 49 Sites and 610 Staff cases
Control Group
Probability SE Odds Ratio p-value
Baseline .47 - - -
Implementation Year .56 .21 1.44 0.08
Follow-up Year .62 .22 1.85* 0.006
Sample: 45 Sites and 529 Staff cases SOURCE: Staff Program-Wide Survey, baseline – implementation – follow-up years (2006-08). NOTES: The probability column provides estimates for regression adjusted means for the two experimental conditions at year of data collection. They are calculated by using the logistic function, Probability = EXP^(a+bx)/(1+EXP^(a+bx)), where a is the intercept and b is the estimated coefficient of x. a+bx is the predicted outcome based on our setting.

63
References Akiva, T. (2012, March). Involving youth in running youth programs: How common and what does it do for youth?
Paper accepted for the biennial meeting of the Society for Research on Adolescence, Vancouver, BC. Akiva, T. (2009, April). Unpacking support for belongingness in youth programs: A multilevel, mixed methods study.
Poster at the biennial meeting of the Society for Research on Child Development, Denver, CO. Akiva, T., Brummet, Q., Sugar, S., & Smith, C. (2011, April). Staff instructional practices, youth
engagement, and belonging in out-of-school time programs. In Shernoff, D. J. (Chair), Advances in out-of-school time research: Examining the variables important for successful OST programming and experiences. Paper symposium conducted at the annual meeting of the American Educational Research Association, New Orleans, LA.
Akiva, T., Cortina, K. S., & Smith, C. (under review). Youth experience of program involvement:
Belonging and cognitive engagement in organized activities. Akiva, T., Pearson, L., Sugar, S., Peck, S. C., Smith, C., & Denault, A. (2010, March). Linking after-school
instructional practices to youth engagement: A pattern-centered approach. In Hoxie, A. E. (Chair), Features of After-School Programs Related to Positive Youth Development, Symposium conducted at the biennial meeting of the Society for Research on Adolescence, Philadelphia, PA.
Barker, R. G. (1968). Ecological Psychology: Palo Alto, CA: Stanford University Press. Baron, R. M. K., D. A. (1986). The moderator-mediator variable distinction in social psychological
research: Conceptual, strategic, and statistical considerations. Journal of Personality and Social Psychology, 51, 1173-1182.
Beckett, M., Borman, G., Capizzano, J., Parsley, D., Ross, S., Schirm, A., & Taylor, J. (2009). Structuring
out-of-school time to improve academic achievement: A practice guide. Washington, DC: National Center for Education Evaluation and Regional Assistance, Institute of Education Sciences, U.S. Department of Education.
Bidwell, C. E., & Kasarda, J. D. (1985). The organization and its ecosystem: A theory of structuring organizations.
Greenwich, Connecticut and London, England: JAI Press. Black, A. R., Doolittle, F., Zhu, P., Unterman, R., Grossman, J. B., & Warner, E. (2008). The evaluation of
enhanced academic instruction in after-school programs: Findings after the first year of implementation. Washington, DC: Institute of Educational Sciences National Center for Education Evaluation and Regional Assistance.
Blank, R. K., de las Alas, N., & Smith, C. (2008). Does teacher professional development have effects on teaching and
learning? Analysis of evaluation findings from programs for mathematics and science teachers in 14 states. Washington, DC: Council of Chief State School Officers.
Blazevski, J., & Smith, C. (2007). Inter-rater reliability on the youth program quality assessment. Ypsilanti, MI:
HighScope Educational Research Foundation. Bloom, H. (2004). Randomizing groups to evaluate place-based programs. Unpublished manuscript.

Continuous Quality Improvement in Afterschool Settings
64
Blyth, D. (2006). Toward a new paradigm for youth development. New Directions for Youth Development:
Rethinking Programs for Youth in the Middle Years (112), 25-44. Bransford, J. D., Brown, A. L., & Cocking, R. R. (1999). How people learn: Brain, mind, experience, and school.
Washington, DC: National Academy Press. Brown, A., & Campione, J. (1996). Psychological theory and the design of innovative learning
environments: On procedures, principles, and systems. In L. Schauble & R. Glaser (Eds.), Innovations in learning: New environments for education (pp. 289-325). Mahwah, NJ: Erlbaum.
California AfterSchool Network. (2007-2011). California AfterSchool Network, from
http://www.afterschoolnetwork.org/ Camp Fire USA. (2010). Mission/Core Values. Retrieved from
http://www.campfireusa.org/Mission_and_Core_Values.aspx Cohen, D. K., Raudenbush, S. W., & Loewenberg Ball, D. (2003). Resources, Instruction, and Research.
Educational Evaluation and Policy Analysis, 25, 119-142. Cohen, J. (1988). Statistical power analysis for the behavioral sciences (2nd ed.). Hillsdale, NJ: Erlbaum. Collaborative for Building Afterschool Systems. (2007). Shaping the future of afterschool: The role of intermediaries
in bringing quality afterschool systems to scale. New York: The Afterschool Corporation. Cortina, K. S. & Smith, C. (2010). Youth PQA Reliability Study. Unpublished report. Cronbach, L. J., Gleser, G. C., Nanda, H., & Rajaratnam, N. (1972). The dependability of behavioral measures:
Theory of generalizability for scores and profiles. New York: John Wiley. Csikszentmihalyi, M., Larson, R. (1984). Being adolescent. New York: Basics Books. Deci, E. L., & Ryan, R. M. (1985). Instrinsic motivation and self-determination in human behavior. New York:
Plenum. Deci, E. L., & Ryan, R. M. (2000). The “what” and “why” of goal pursuits: Human needs and self-
determination of behavior. Psychological Inquiry, 11, 227-268. Dennehy, J., & Noam, G. G. (2005). Strengthening after-school programs for all children and youth: The Massachusetts
out-of-school time workforce. Boston, MA: Boston After School & Beyond. Desimone, L. (2009). Improving impact studies of teachers' professional development: Toward better
conceptualizations and measures. Educational researcher 38, 181-199. Diamantopoulos, A. (2008). Formative indicators: Introduction to the special issue. Journal of Business
Research, 61, 1201-1202. Diamantopoulos, A., Riefler, P., & Roth, K. P. (2008). Advancing formative measurement models. Journal
of Business Research, 61, 1203-1218.

65
Diamantopoulos, A., & Siguaw, J. A. (2006). Formative versus reflective indicators in organizational
measure development: A comparison and empirical illustration. British Journal of Management, 17, 263-282.
Duffett, A., & Johnson, J. (2004). All work and no play? Listening to what KIDS and PARENTS really want
from out-of-school time. New York: Public Agenda and the Wallace Foundation. Durlak, J. A., & DuPre, E. P. (2008). Implementation matters: A review of research on the influence of
implementation on program outcomes and the factors affecting implementation. American Journal of Community Psychology, 41, 327-350.
Durlak, J. A., Taylor, R. D., Kawashima, K., Pachan, M. K., DuPre, E. P., Celio, C. I., et al. (2007). Effects
of positive youth development programs on school, family and community systems. American Journal of Community Psychology, 39, 269-286.
Durlak, J. A., Weissberg, R. P., & Pachan, M. K. (2010). A meta-analysis of after-school programs that
seek to promote personal and social skills in children and adolescents. American Journal Community Psychology, 45, 294-309.
Eccles, J., & Gootman, J. (Eds.). (2002). Community programs to promote youth development. Washington, DC:
National Academy Press. Eccles, J., & Midgley, C. (1989). Stage/environment fit: Developmentally appropriate classrooms for
young adolescents. In R. E. Ames C. Ames (Eds.). Research on Motivation and Education, 33, 139-186. Elmore, R. F. (2004). School reform from the inside out: Policy, practice, & performance. Cambridge, MA: Harvard
Education Press. Elmore, R. F. (2008). Improving the instructional core. Harvard University: Graduate School of Education. Fischer, K. W., & Bidell, T. R. (2006). Dynamic development of action, thought, and emotion (6th ed. Vol. 1). New
York: Wiley. Fixsen, D. L., Naoom, S. F., Blasé, K. A., Friedman, R. M., & Wallace, F. (2005). Implementation research: A
synthesis of the literature (No. 231). Tampa, Fl: University of South Florida, Louis de la Parte Florida Mental Health Institute, The National Implementation Research Network.
Frank, K. A. (2000). Impact of a confounding variable on a regression coefficient. Sociological Methods &
Research, 29, 147-194. Frank, K. A., & Min, K. (2007). Indices of robustness for sample representation. Sociological Methodology, 37,
349-392. Fukkink, R. G., & Lont, A. (2007). Does training matter? A meta-analysis and review of caregiver training
studies. Early Childhood Research Quarterly, 22, 294-311. Fullan, M. (2008). The six secrets of change: What the best leaders do to help their organizations survive and thrive. San
Francisco, CA: John Wiley & Sons, Inc.

Continuous Quality Improvement in Afterschool Settings
66
Fullan, M. (2008). What’s worth fighting for in the principalship (2nd Ed.). New York: Teachers College Press and Ontario: Ontario Principals Council.
Gambone, M. A., & Arbreton, A. J. (1997). Safe havens: The contributions of youth organizations to healthy
adolescent development. Philadelphia, PA: Public/Private Ventures. Gambone, M. A., Klem, A. M., & Connel, J. P. (2002). Finding out what matters for youth: Testing key links in a
community action framework for youth development. Philadelphia: Youth Development Strategies Inc. & Institute for Research and Reform in Education.
Gardner, M., Roth, J. L., & Brooks-Gunn, J. (2009). Can afterschool programs level the playing field for
disadvantaged youth? EQUITY MATTERS: Research Review No. 4. New York: Teachers College, Columbia University.
Garet, M. S., Cronen, S., Eaton, M., Kurki, A., Ludwig, M., Jones, W., et al. (2008). The impact of two
professional development interventions on early reading instruction and achievement. Washington, DC: National Center for Education Evaluation and Regional Assistance, Institute of Education Sciences, U.S. Department of Education.
Garet, M. S., Porter, A. C., Desimone, L., Birman, B. F., & Yoon, K. S. (2001). What makes professional
development effective? Results from a national sample of teachers. American Educational Research Journal, 38, 915-945.
Gennetian, L., Morris, P., Bos, J., & Bloom, H. (2005). Coupling the nonexperimental technique of
instrumental variables with experimental data to learn how programs create impacts. In H. Bloom (Ed.), Moving to the next level: Combining experimental and non-experimental methods to advance employment policy research. New York, NY: Russell Sage Foundation.
Gottfried, A. E., Fleming, J. S., & Gottfried, A. W. (2001). Continuity of academic instrinsic motivation
from childhood through late adolescence: A longitudinal study. Journal of Educational Psychology, 93, 3-13. Granger, R. (2008). After-school programs and academics: Implications for policy, practice and research. New York:
William T. Grant Foundation. Granger, R., Durlak, J.A., Yohalem, N., & Reisner, E. (2007). Improving after-school program quality.
Unpublished manuscript, New York, NY. Grossman, J. B., Goldsmith, J., Sheldon, J., & Arbreton, A. J. A. (2009). Assessing after-school settings.
New Directions for Youth Development (121), 89-108. Grossman, J. B., Lind, C., Hayes, C., McMaken, J., & Gersick, A. (2009). The cost of quality out of school time
programs. Philadelphia, PA: Public/ Private Ventures. Guay, F., Boggiano, A. K., & Vallerand, R. J. (2001). Autonomy support, intrinsic motivation, and
perceived competence: Conceptual and empirical linkages. Personality and Social Psychology Bulletin, 27, 643-650.
Halpern, R. (2003). Making play work: The promise of after-school programs for low-income children. New York:
Teachers College Press.

67
Halverson, R., Grigg, J., Prichett, R., & Thomas, C. (2005). The new instructional leadership: Creating data-driven
instructional systems in schools. Madison, WI: Wisconsin Center for Education Research, University of Wisconsin-Madison.
Hansen, D. M., & Larson, R. W. (2007). Amplifiers of developmental and negative experiences in
organized activities: Dosage, motivation, lead roles, and adult-youth ratios. Journal of Applied Developmental Psychology, 28, 360-374.
HighScope Educational Research Foundation. (2005). Youth PQA program quality assessment: Administration
manual. Ypsilanti, MI: HighScope Press. Hill, C. J., Bloom, H. S., Black, A. R., & Lipsey, M. W. (2008). Empirical benchmarks for interpreting
effect sizes in research. Child Development Perspectives, 2, 172-177. Ilfeld, E. M. (1996). Learning comes to life: An active learning program for teens. Ypsilanti, MI: HighScope Press. InPraxis Group Inc. (2006). Professional learning communities: An exploration. Edmonton, Alberta: Alberta
Education, School Improvement Branch. James-Burdumy, S., Dynarski, M., Moore, M., Deke, J., Mansfield, W., Pistorino & C., et al. (2005). When
schools stay open late: The national evaluation of the 21st century community learning centers program final report. Washington, DC: U.S. Department of Education, Institute of Education Sciences, National Center for Education Evaluation and Regional Assistance.
Joyce, B., & Showers, B. (2002). Student achievement through staff development. Alexandria, VA: Association for
Supervision and Curriculum Development. Kaplan, R. S., & Norton, D. P. (1996). The balanced scorecard: translating strategy into action. Cambridge, MA:
Harvard Business School Press. Keller, E. (2010). Cutting costs, keeping quality: Financing strategies for youth-serving organizations in a difficult economy.
New York: The Finance Project. Kennedy, M. (1998). Form and substance in inservice teacher education: Madison, WI: University of Wisconsin-
Madison. Khashu, A., & Dougherty, N. (2007). Staffing practices of high-quality after-school programs. New York: The
After-School Corporation. Larson, R. (2000). Toward a psychology of positive youth development. American Psychologist, 55, 170-183. Larson, R., & Hansen, D. (2005). The development of strategic thinking: Learning to impact human
systems in a youth activism program. Human Development, 48, 327-349. Larson, R., Rickman, A. N., Gibbons, C. M., & Walker, K. C. (2009). Practitioner expertise: Creating
quality within the daily tumble of events in youth settings. New Directions for Youth Development, 121, 71-88.

Continuous Quality Improvement in Afterschool Settings
68
Larson, R., Walker, K., & Pearce, N. (2005). A comparison of youth-driven and adult-driven youth programs: Balancing inputs from youth and adults. Journal of Community Psychology, 33, 57-74.
Lauer, P. A., Akiba, M., Wilkerson, S. B., Apthorp, H. S., Snow, D., & Martin-Glenn, M. L. (2006). Out-
of-school time programs: A meta-analysis of effects for at-risk students. Review of educational research, 76, 275-313.
Leithwood, K., Louis, K., Anderson, S., & Wahlstrom, K. (2004). How leadership influences student learning:
University of Minnesota, University of Toronto & The Wallace Foundation. Mahoney, J. L., Harris, A. L., & Eccles, J. S. (2006). Organized activity participation, positive youth
development, and the over-scheduling hypothesis. Social Policy Report: Giving Child and Youth Development Knowledge Away, 20, 3-32.
Mahoney, J. L., Vandell, D. L., Simpkins, S., & Zarrett, N. (2009). Adolescent out-of-school activities. In
R. M. Lerner & L. Steinberg (Eds.), Handbook of adolescent psychology, 3rd Ed. (pp. 228-269). New York: Wiley.
Marks, H. M. (2000). Student engagement in instructional activity: Patterns in the elementary, middle, and
high school years. American Educational Research Journal, 37, 153-184. Marks, H. M., & Louis, K. S. (1999). Teacher empowerment and the capacity for organizational learning.
Educational Administration Quarterly, 35, 707-750. Marzano, R. J. (1998). A theory-based meta-analysis of research on instruction. Aurora, CO: Mid-continent
Regional Educational Laboratory. Marzano, R. J. (2001). Designing a new taxonomy of educational objectives. Thousand Oaks, CA: Corwin. Mashburn, A. J., Pianta, R. C., Hamre, B. K., Downer, J. T., Barbarin, O. A., Bryant, D., et al. (2008).
Measures of classroom quality in prekindergarten and children's development of academic, language, and social skills. Child Development, 79, 732-749.
Maslow, A. H. (1943). A theory of human motivation. Psychological Review, 50, 370-396. Mason, S. A. (2003). Learning from data: The roles of professional learning communities. Paper presented at the
American Educational Research Association. Chicago, IL. McCallion, G. (2003). 21st Century Community Learning Centers in P.L. 107-110: Background and Funding.
Retrieved from https://www.policyarchive.org/bitstream/handle/10207/1327/RL31240_20020304.pdf.
McCartney, K., & Rosenthal, R. (2000). Effect size, practical importance, and social policy for children.
Child Development, 71, 173-180. Metz, R. A., Goldsmith, J., & Arbreton, A. J. A. (2008). Putting it all together: Guiding principles for quality after-
school programs serving preteens. Philadelphia, PA: Public/Private Ventures.

69
Miles, M. (2006). Good stories aren’t enough: Becoming outcomes-driven in workforce development. Philadelphia, PA: Public/Private Ventures.
Miller, B. M. (2005). Pathways to success for youth: What counts in afterschool – Massachusetts After-School Research
Study (MARS). Arlington, MA: Intercultural Center for Research in Education & National Institute on Out-of School Time.
Moodle. (2009). Moodle.org: open-source community-based tools for learning. Retrieved 09-21-09, from
http://moodle.org Nee, J., Howe, P., Schmidt, C., & Cole, P. (2006). Understanding the afterschool workforce: Opportunities and
challenges for an emerging profession. Houston, TX: National AfterSchool Association. Nye, B., Konstantopoulos, S., & Hedges, L. (2004). How large are teacher effects? Educational Evaluation
and Policy Analysis, 26, 237-257. Oden, S., Kelly, M. A., Ma, Z., & Weikart, D. P. (1992). Challenging the potential: Programs for talented
disadvantaged youth. Ypsilanti, MI: HighScope Press. Pearce, N. J., & Larson, R. W. (2010). How teens become engaged in youth development programs: The
process of motivational change in a civic activism organization. Applied Developmental Science, 10, 121-131.
Pedersen, S., & Seidman, E. (2005) Contexts and correlates of out-of-school activity participation among
low-income urban adolescents. In J. Mahoney, R. W. Larson & J. S. Eccles (Eds.), Organized activities as contexts of development: Extracurricular activities, after-school and community programs (pp. 65-84). Mahwah, NJ: Erlbaum.
Peisner-Feinberg, E. S., Burchinal, M. R., Clifford, R. M., Culkin, M. L., Howes, C., Kagan, S. L., et al.
(2000). The children of the cost, quality, and outcomes study go to school: Technical report. Chapel Hill, NC: Frank Porter Graham Child Development Center, University of North Carolina at Chapel Hill.
Pianta, R., & Hamre, B. (2009). Conceptualization, measurement, and improvement of classroom
processes: Standardized observation can leverage capacity. Educational Researcher, 38, 109-119. Pianta, R., Mashburn, A., Downer, J., Hamre, B., & Justice, L. (2008). Effects of web-mediated
professional development resources on teacher-child interactions in pre-kindergarten classrooms. Early Childhood Research Quarterly, 23, 431-451.
Pianta, R. C., & NICHD ECCRN. (in press). Developmental science and education: The NICHD study of
early child care and youth development - Findings from elementary school. In R. V. Kail (Ed.), Advances in child development and behavior. New York: Elsevier.
Pittman, K., Tolman, J., & Yohalem, N. (2005). Devleoping a comprehensive agenda for the out-of-
school hours: Lessons and challenges across cities. In J. L. Mahoney, R. W. Larson & J. S. Eccles (Eds.), Organized activities as context of development: Extracurricular activities, after-school and community programs. Mahwah, NJ: Erlbaum.

Continuous Quality Improvement in Afterschool Settings
70
Princiotta, D., & Fortune, A. (2009). The quality imperative: A state guide to achieving the promise of extended learning opportunities: Council of Chief State School Officers & National Governors Association Center for Best Practices.
Prochaska, J. O., & DiClemente, C. C. (1982). Transtheoretical therapy toward a more integrative model
of change. Psychotherapy: Theory, Research and Practice, 19, 276-287. Raudenbush, S. W., & Bryk, A. S. (2002). Hierarchical linear models: Applications and data analysis methods (2nd
ed.). Newbury Park, CA: Sage. Raudenbush, S. W., Martinez, A., Bloom, H., Zhu, P., & Lin, F. (2008a). An eight-step paradigm for studying the
reliability of group-level measures. University of Chicago, University of Michigan, MDRC. Raudenbush, S. W., Martinez, A., Bloom, H., Zhu, P., & Lin, F. (2008b). The reliability of group-level measures
and the power of group-randomized studies. Chicago, IL: University of Chicago, University of Michigan, MDRC.
Raudenbush, S., Martinez, A., & Spybrook, J. (2005). Strategies for improving precision in group-randomized
experiments. Chicago, IL: University of Chicago, University of Michigan. Raudenbush, S., Spybrook, J., Liu, X.-f., & Congdon, R. (2005). Optimal design for longitudinal and
multilevel research [Software]. Available from www.wtgrantfoundation.org. Raver, C. C., Jones, S. M., Li-Grining, C. P., Metzger, M., Champion, K. M., & Sardin, L. (2008).
Improving preschool classroom processes: Preliminary findings from a randomized trial implemented in Head Start settings. Early Childhood Research Quarterly, 23, 10-26.
Reisner, E. R., White, R. N., Russell, C. A., & Birmingham, J. (2004). Building quality, scale, and effectiveness in
after-school programs: New York: The After-School Corporation. Rowan, B., Correnti, R., Miller, R. J., & Camburn, E. (2009). School improvement by design: Lessons from a study
of comprehensive school reform programs. Consortium for Policy Research in Education. Ruiz, D. M., Gremler, D. D., Washburn, J. H., & Carrion, G. C. (2008). Service value revisited: Specifying
a higher-order, formative measure. Journal of Business Research, 61, 1278-1291. Ryan, R. M. & Deci, E. L. (2000). Self-determination theory and the facilitation of intrinsic motivation,
social development, and well-being. American Psychologist, 55, 67-78. Saunders, W., Goldenberg, C., & Gallimore, R. (2009). Increasing achievement by focusing in grade-level
teams on improving classroom learning: A prospective, quasi-experimental study of title 1 schools. American Educational Research Journal, 46, 1006-1033.
Schmoker, M. (1996). Results: The key to continuous school improvement. Alexandria, VA: Association for
Supervision and Curriculum Development. Schochet, P. Z. (2009). Do typical RCTs of education interventions have sufficient statistical power for linking impacts on
teacher practice and student achievement outcomes? Washington, DC: Institute of Education Sciences.

71
Schoggen, P. (1989). Behavior settings: a revision and extension of Roger G. Barker’s ecological psychology. Stanford, CA: Stanford University Press.
Seidman, E. (in press). An emerging action science of social settings. American Journal of Community
Psychology. Sheldon, J., & Hopkins, L. (2008). Supporting success: Why and how to improve quality in after-school programs.
Philadelphia, PA: Public/Private Ventures. Shernoff, D. J., & Vandell, D. L. (2007). Engagement in after-school program activities: Quality of
experience from the perspective of participants. Journal of Youth and Adolescence, 36, 891-903. Shernoff, D. J., & Vandell, D. L. (2010). Engagement in after-school programs as a predictor of social
competence and academic performance. American Journal Community Psychology, 45, 325-337. Shulman, L. (1986). Those who understand: Knowledge growth in teaching. Educational Researcher, 15, 4-14. Smith, C. (2005a). Findings from the Self-Assessment Pilot in Michigan 21st Century Learning Centers. Ypsilanti, MI:
HighScope Educational Research Foundation. Smith, C. (2005b). Evidence of effectiveness for training in the HighScope Participatory Learning Approach. Ypsilanti,
MI: HighScope Educational Research Foundation. Smith, C., & Akiva, T. (2008). Quality accountability: Improving fidelity of broad developmentally focused
interventions. In H. Yoshikawa & B. Shinn (Eds.), Transforming Social Settings: Towards Positive Youth Development: Oxford, United Kingdom: Oxford University Press.
Smith, C., Akiva T., Arrieux, D., & Jones, M. M. (2006). Quality at the point of service. New Directions for
Youth Development, 112. 93-108. Smith, C., Akiva, T., Blazevski, J., Pelle, L., & Devaney, T. (2008). Final report on the Palm Beach Quality
Improvement System pilot: Model implementation and program quality improvement in 38 after-school programs. Ypsilanti, MI: HighScope Educational Research Foundation.
Smith, C., Akiva, T., & Henry, B. (2006). Quality in the out-of-school time sector: Insights from the Youth PQA
Validation Study. Paper presented at the Society for Research on Adolescence biennial meeting, San Francisco, CA.
Smith, C., Devaney, T. J., Akiva, T., & Sugar, S. A. (2009). Quality and accountability in the out-of-school-
time sector. New Directions for Youth Development, 121. 109-127. Smith, C., & Hohmann, C. (2005). Full findings from the Youth PQA validation study. Ypsilanti, MI:
HighScope Educational Research Foundation. Smith, C. Peck, S. C., Denault, A., Blazevski, J., & Akiva, T. (2010). Quality at the point of service: profiles
of practice in after-school settings. American Journal of Community Psychology, 45, 358-369. Smith, C., & Van Egeren, L. (2008). Bringing in the community: Partnerships and quality assurance in 21st
Century Learning Centers. Afterschool matters occasional paper series. New York: Robert Bowne Foundation.

Continuous Quality Improvement in Afterschool Settings
72
Spielberger, J., & Lockaby, T. (2006). The Prime Time Initiative of Palm Beach County, Florida - QIS development
process evaluation: Year 2 report. Chicago: Chapin Hall Center for Children at the University of Chicago. Spielberger, J., & Lockaby, T. (2008). Palm Beach County's Prime Time Initiative: Improving the quality of after-
school programs. Chicago: Chapin Hall Center for Children at the University of Chicago. Spielberger, J., Lockaby, T., Mayers, L., & Guterman, K. (2009). Ready for prime time: Implementing a formal
afterschool quality improvement system by Prime Time Palm Beach County, Inc. Chicago: Chapin Hall at the University of Chicago.
Sugar, S., Hansen, D., Wallace, L., Bertoletti, J., & Akiva, T. (2010). Quality matters: The pilot report to the
community. Kansas City, MO: United Way of Greater Kansas City. Talbert, J. E., & McLaughlin, M. W. (1999). Assessing the school environment: Embedded contexts and
bottom-up research strategies. In S. L. Friedman & T. D. Wachs (Eds.), Measuring environment across the life span (pp. 197-227). Washington, DC: American Psychological Association.
Tout, K., Zaslow, M., Halle, T., and Forry, N. (2009). Issues for the next decade of quality rating and improvement
systems. Washington, DC: Office of Planning, Research and Education. United Way of America. (2009). Mobilization Plan Blueprint for Increasing High School Graduation Rates: United
Way of America. U.S. Department of Education. (2011). 21st Century Community Learning Centers, from
http://www2.ed.gov/programs/21stcclc/index.html Vandell, D. L., Shernoff, D. J., Pierce, K. M., Bolt, D. M., Dadisman, K., & Brown, B. B. (2005).
Activities, engagement, and emotion in after-school programs (and elsewhere). New Directions for Youth Development, 105, 121-129.
Vygotsky, L. (1978). Mind in society. Cambridge, MA: Harvard University Press. Wallace Foundation. (2008). A place to grow and learn: A citywide approach to building and sustaining out-of-school
time learning opportunities. New York: The Wallace Foundation. Waters, T., Marzano, R. J., & McNulty, B. (2003). Balanced Leadership: What 30 years of research tells us about the
effects of leadership on student achievement. Denver, CO: Mid-continent Research for Education and Learning (McREL)
Wayne, A., Yoon, K., Zhu, P., Cronen, S., & Garet, M. (2008). Experimenting with teacher professional
development: Motives and methods. Educational Researcher, 37, 469-479. Wicker, A. W. (1992). Making sense of environments. In W. B. Walsh, K. H. Craik & R. H. Price (Eds.),
Person environment psychology (pp. 157-192). Hillsdale, NJ: Lawrence Erlbaum Associates. Wilcox, J. B., Howell, R. D., & Breivik, E. (2008). Questions about formative measurement. Journal of
Business Research, 61, 1219-1228.

73
Yohalem, N., Wilson-Ahlstrom, A., Fischer, S., & Shinn, M. (2007). Measuring youth program quality: A guide to assessment tools. Washington, DC: Forum for Youth Investment.
Yoon, K., Duncan, T., Lee, S., Scarloss, B., & Shapley, K. (2007). Reviewing the evidence on how teacher
professional development affects student achievement. Washington, DC: Institute of Education Sciences, National Center for Education Evaluation and Regional Assistance, Regional Educational Laboratory Southwest.
Zellman, G., Perlman, M., Le, V., & Setodji, C. M. (2008). Assessing the validity of the qualistar early learning
quality rating and improvement system as a tool for improving child-care quality. Santa Monica, CA: RAND.

Continuous Quality Improvement in Afterschool Settings
74

APPENDIX A DETAIL ON YPQI THEORY OF ACTION AND DESIGN ELEMENTS

Continuous Quality Improvement in Afterschool Settings
A- 2
Appendix A
Detail On YPQI Theory Of Action And Design Elements Appendix A describes the Youth Program Quality Intervention (YPQI) theory of action and core design elements, intervention supports and continuous improvement practices.
YPQI Theory of Action The theory of behavior settings, as introduced by Barker (1968) and extended by Schoggen (1989), provides a lens through which to understand the YPQI. Behavior settings are small-scale social systems that are self-generated, bounded by space and time, and have fairly clear boundaries between patterns of behavior that are within and outside of the system (Schoggen, 1989; Wicker, 1992). These structural and material characteristics of settings have a profound impact on the human roles that develop and, consequently, the actions that are taken by the people who inhabit these settings. Behavior setting theory suggests that the forces that reside in a setting regulate behavior to a considerable degree beyond individual sources such as attitudes, beliefs, education level, and background (Barker, 1968). In application to the afterschool field, the theory of behavior settings suggests that, despite turnover of staff and youth in afterschool sites, behavioral norms reside, to some extent, in a setting; for example, norms are embodied by organizational mission statements and written standards for, and expectations of, staff performance. Consistent with this view, the YPQI establishes a performance standard for instruction and continuous improvement of instruction as a pathway to high quality service.
The theory of action that guides the YPQI, pictured in Figure A-1, identifies two behavior settings, the organization and the point-of-service where performance standards are applied. A third level, the policy context is also represented. The YPQI is explicitly designed to produce action at all three levels: (1) adoption of YPQI supports and commitment of resources by network decision makers in the policy context, (2) adoption of four continuous improvement practices in the organization setting, and (3) an instructional approach delivered at the point of service where youth experience occurs. Both the continuous improvement practices and instructional practices are aligned with a standardized assessment so that performance data on instructional quality is the foundation of the design. Although the YPQI is designed to produce change at both the policy and organization-setting levels, the intervention at each of these levels is ultimately focused on improving the quality of staff instruction at the point of service.
The theory of action is made up of cascading effects that involve actors engaging in learning activities at one level, which leads them to enact instructional behaviors at the level below. First, the manager engages in YPQI training and technical assistance (intervention supports) and receives accountability policy messages from network leaders, which leads to the manager enacting continuous improvement practices in the organizational setting. Staff members engage in those continuous improvement practices and, as a result, enact improvements in their instructional practices. Ultimately, these improvements are believed to lead to improved youth engagement with staff instructional practices and corresponding program-offering content.

A-3
Box A and Box B detail the main components of continuous improvement and instructional practices, respectively. These are further explained in the next section.
Figure A-1. Detailed YPQI Theory of Action
Box A, Figure 1: Continuous Improvement Practices Knowledge management theory (Mason, 2003) provides a foundation for our ideas about how continuous improvement practices work. In its simplest formulation, knowledge management theory describes two key transitions - from data to contextualized information and from contextualized information to working knowledge. The transition from objective data to contextualized information happens through interpretation of data inside a site team (i.e., learning community). The translation from information to working knowledge occurs through trial and error experience with improvement that builds expertise about how to achieve high quality or improve services. Each step in this sequence implies high fidelity implementation of continuous improvement practices.
The activities collectively referred to as continuous improvement practices begin with standardized assessment of instructional quality, using the Youth PQA. The Youth PQA is used in two ways: (a) A reliable rater conducts two or more external assessments in two separate program-offering sessions, and (b) a site team including the manager and staff conduct program self-assessment, a process of multiple peer
Manager enacts continuous improvement
practices
Staff engages in continuous improvement
practices
Staff enacts instructional practices
Proximal outcomes: youth engage with instruction
Policy context
Organization setting
Manager receives policy messages and YPQI
supports
Point-of-service setting
BOX A: Continuous improvement practices • Standardized assessment of
instruction • Team-based planning with data • Professional development in
Youth Work Methods based on planned improvement
• TA Coaching and performance feedback based on assessment
BOX B: Instructional practices • Supportive environment through
welcoming, conflict resolution, active learning, skill building
• Peer interaction through grouping & cooperative learning
• Higher order engagement with content through choice, planning and reflection
YPQI Practices Theory of action Levels of setting

Continuous Quality Improvement in Afterschool Settings
A- 4
observations and team-based scoring of the quality rubrics.45 These two assessments are then used for quality improvement planning in which staff identify program strengths and areas to target for improvement. With a program improvement plan in place, staff attend Youth Work Methods trainings that target areas of instructional quality identified for improvement. The implementation of this improvement plan is supported by coaching at two levels: External technical assistance (TA) coaches supports managers to engage with intervention supports and implement continuous improvement practices at the organizational level and site managers are trained to coach individual staff to implement specific instructional practices at the point of service.
Box B: Instructional Practices The instructional approach used by the YPQI is based in positive youth development research (Eccles & Gootman, 2002) and assumes that youth programs have both learning and development purposes. According to our child level theory of change, high-quality instruction produces youth engagement during a given session. Simultaneous presence of high-quality instruction and high youth engagement across multiple sessions produces mastery experiences in a number of domains, depending on content of the program offering sessions. These content-specific mastery experiences in the afterschool context produce longer-term skill development and corresponding skill transfer outside of the afterschool setting. Youth programs provide a context for learning in both academic and non-academic content areas, and for positive development of skills that generalize to areas of an individual’s life outside of the specific offerings and content domains. Instructional practices are staff behaviors performed at the point of service. Figure A-2 contains the introduction to the instructional approach provided in the first few pages of each of the ten printed guidebooks included with the Youth Work Methods training workshops used in the YPQI study.
45 Validation studies for the Youth Program Quality Assessment have been conducted for both the external assessment and program self-assessment methodologies (Smith & Hohmann, 2005; Smith, 2005a)

A-5
Figure A-2: Excerpt from Youth Work Methods Guidebook This youth development series assumes that youth programs are more than places to baby sit young people in the non-school hours, but that they have learning and development purposes. Whether you believe that the purpose of an out-of-school time program is to improve academics, to build life skills, or just to provide a place where kids can hang out and be kids, the approach presented in this series provides the foundations for building a safe and productive environment for youth. In short, the approach is based on the belief that it is a youth worker’s job to set up an environment for youth in which there are met and learning is encouraged—to set up a space in which youth needs are met so that they can thrive!
The youth development approach (as pictured above) has parallels to Maslow’s hierarchy of needs. The pyramid provides a way to organize the many, many things a youth worker does to build a great experience for young people. The parts of the pyramid are explained below, with courses in this series in italics:
▪ Safe Environment – It is sometimes not within your power to make kids feel safe; however, you can do what you can to make sure they are safe. It’s important for young people to feel both physically and emotionally safe. Physical safety is mostly about the space in which your youth program runs and these safety issues are generally dealt with by supervisors or through licensing. Emotional safety on the other hand is a big important thing and it can be hard to establish in many youth environments. One way to move towards an emotionally safe environment is by maintaining structure and clear limits. It’s key to let young people know they can trust you to maintain safety, order, fairness, etc. Ultimately you want to try to create a space in which youth feel like they can “be themselves” without either being laughed at or teased by their peers, or acting in ways that threaten or mislead others.
▪ Supportive Environment – As a youth worker, it is your job to build a supportive environment. You can do this by establishing healthy, productive relationships with youth using the ask-listen-encourage strategies. You can also do this by reframing conflict when conflict situations arise. Finally, you can do this by putting in place the basic learning supports of active learning and scaffolding for success. Active learning is about supporting youth to engage hands-on with their bodies and minds. Scaffolding for success is about presenting youth with relishing challenges and helping them set and meet high expectations.
Supportive Environment
Peer Interaction
Safe Environment
Voice and ChoicePlanning and Reflection
Building CommunityCooperative Learning
Active LearningAsk-Listen-Encourage
Physical Safety Structure & Clear Limits
Reframing ConflictScaffolding for Success
Youth Engagement

Continuous Quality Improvement in Afterschool Settings
A- 6
This approach and the Youth Work Methods trainings were developed in parallel with the Youth PQA Form A measure. The approach was originally developed at the HighScope Institute for IDEAS, a month-long summer workshop for teenagers that operated from 1963-2005 (for a full description of this program see Ilfeld (1996); for a quasi-experimental evaluation of program effectiveness see Oden (1992)). In 1994, through a series of grant-funded initiatives, training based in this approach was developed for program providers in after-school and community-based youth programs. The Youth PQA instrument validation study began in 2001, and the first printed edition of the tool was released in 2005 (HighScope, 2005; Smith, Akiva, & Henry, 2006).
As part of the Youth PQA Validation Study, quasi-experimental analyses were conducted to test the effect of participation in the Youth Worker Methods training on instructional practices and youth engagement. The findings indicated that program staff who attended 4 or more days of training on the HighScope active participatory learning approach scored higher on the Youth PQA than staff who received no training. Further, youth in program offerings lead by instructors who had completed the HighScope training reported higher levels of engagement than youth in program offerings lead by instructors who had not completed this training (Smith, 2005b). The Youth PQA validation study also found statistically significant relationships between observed instructional quality and child outcomes; specifically, Youth PQA scales correlate with the total score and several subscales from the Youth Survey developed by Youth Development Strategies, Inc. (YDSI; Gambone & Arbreton, 1997).
Detailed Description of Intervention Supports In this section we provide detail on the contents of YPQI supports, the trainings and technical assistance that support implementation of continuous improvement practices. First, we describe the Youth Work Management training sequence and the learning goals of each training unit. Next, we discuss the Youth Work Methods training modules. Finally, we review the TA Coaching model used to support site mangers implementing the YPQI.
▪ Peer Interaction – The peer culture that exists is one of the most powerful forces that shapes a youth program—and it can have big impacts on young lives. As an adult, you can positively affect this culture by expectations and routines you put in place. You can help youth get to know each other and treat each other well by using building community techniques. You can help youth have successful experiences together by using cooperative learning techniques.
▪ Youth Engagement – When young people feel safe and experience a sense of belonging, this clears the way for them to experience challenge and pursue learning. Youth engagement is at the top of the pyramid and it consists of two main ideas. First, it’s critical for young people to have voice and choice—that is, a say in how the program operates, and choices about how they spend their time. The other component is planning and reflection—providing young people with plentiful opportunities to set goals, make plans, and to reflect on their experiences.
Putting it all together, the pyramid defines a way of working with young people that is healthy for their growth and development, regardless of the specific content that is being delivered. The Youth Work Methods contained in this guidebook series really work. They’ve been used by countless youth workers for decades with great success. Good luck and enjoy the series!

A-7
Youth Work Management Youth Work Management involved a kick-off event plus a series of three full-day training workshops. Workshop descriptions and learning objectives are as follows:
Kickoff (2-hour live or 1 hour webinar). At this live event, participants were introduced to the overall YPQI sequence and rationale for participating in the initiative. Elements included:
• Theory and rationale for the YPQI
• Details about the YPQI
• Orientation to the online learning tool
Youth PQA Basics (3- to 6-hour online). This online course introduced participants to the Youth PQA and prepared them to conduct program self-assessment. The software, created using the open-source Moodle learning management system (Moodle, 2009), recorded progress so participants could move at their own pace, completing the course through multiple sessions if needed. Online activities included information delivery, interactive elements (e.g., identifying items that fit with anecdotes), quizzes (e.g., watching a video and scoring items), and written assignments for which Weikart Center staff provided feedback. The following elements were included:
• The “quality construct” of the Youth PQA
• The structure of the Youth PQA
• How to use and score the instrument
• How to observe and take rich, precise and objective notes
• How to create anecdotal evidence from notes and fit this evidence to the Youth PQA scoring rubrics
• How to lead a self-assessment process with a staff team
Planning with Data (1-day live). This training was designed to help participants create improvement plans using both their external Youth PQA data and program self-assessment data. The training also emphasized the challenging nature of making real change happen in organizational contexts. Participants left the training with a draft program improvement plan. The training included the following elements:
• Aspects of change and ways to motivate and sustain a successful change initiative
• Understanding individual behavior change using the transtheoretical model (Prochaska & DiClemente, 1982)
• How to create an effective draft program improvement plan, based on data
• How to effectively introduce their staff to the program improvement plan

Continuous Quality Improvement in Afterschool Settings
A- 8
Instructional Coaching (1-day live). This training aimed to prepare managers to support staff attempts to improve instructional practice. This involved (a) the structured Observation and Reflection strategy46, a strength-based form of performance feedback that helps a coach guide staff through their own reflective improvement discussion based on Youth PQA scores, and (b) other strategies for dealing with idiosyncratic issues involved in managing staff. The workshop included the following:
• The instructional coaching framework
• Strategies for establishing respect in a coaching relationship
• Active listening strategies
• The Observation-Reflection Method
Youth Work Methods Youth Work Methods consist of 10 two- to three-hour stand-alone training modules, each aligned with a segment of the Youth PQA.47 These workshops were delivered through one- or two-day summits in which participants could attend two or three of these workshops. Weikart Center staff worked with network leaders to choose Methods modules to include at summits based on the results of the network’s quality assessments and site improvement plans.
Each module follows a sequence of activities: opening activity, central ideas and practice, application, and implementation plan. This sequence emphasizes trying out new behaviors: In the application phase, participants practice behaviors (e.g., encouragement strategies) through role plays or other interactive activities and then make plans for how they will try out the methods when they return to their youth work settings.
The ten Youth Work Methods training modules are as follows:
• Voice & Choice – Focuses on the practice of providing choice within activities and “voice” within the youth program itself.
• Planning and Reflection – Participants learn how to support youth in planning, implementing, and evaluating activities and projects.
• Building Community – Introduces participants to community-building and relationship-building activities.
• Cooperative Learning – Addresses small group work, group forming strategies, and cooperative learning techniques.
• Active Learning – Introduces the practice of providing opportunities for youth to actively explore materials and ideas. The workshop introduces four “ingredients” of active learning as well as methods for creating active environments.
46 A complete description of the Observation and Reflection strategy appears in Weikart Center training materials. Please see www.cypq.org for more information. 47 Quasi-experimental evidence regarding the effectiveness of the Youth Work Methods trainings is provided in Smith, (2005b).

A-9
• Scaffolding for Success – Focuses on strategies for working with youth to find their learning edge (i.e., their optimal level of task challenge or difficulty).
• Ask-Listen-Encourage – Addresses effective question asking, active listening, and use of encouraging statements with youth.
• Reframing Conflict – Introduces an approach for supporting youth in solving their conflicts and problems. The approach includes four main elements: (1) approach calmly, (2) ask youth involved about the cause and possible solutions, (3) encourage youth to consider effects of their actions, and (4) follow-up afterward.
• Structure and Clear Limits – Introduces strategies for setting clear limits and providing a productive program structure.
• Homework Help – Focuses on the effective use of Homework Help time by introducing participants to the relationship ABC’s (Ask and Listen, Be involved, and Connect).
Technical Assistance (TA) Coach Model The TA Coaching element was not originally part of the YPQI but was added with a supplemental proposal in 2008. The purpose of this addition was to improve implementation of the four continuous improvement practices. TA Coaches were recruited locally by network coordinators and provided an average of 10 hours of service to each intervention site. TA Coaching activities are summarized in Table A-1.
The coaching model was developed in partnership with local experts from each of the five networks, beginning with a two-day meeting to develop a TA strategy and tools. This was followed by on-site meetings by a Weikart Center lead consultant to train TA Coaches, finalize TA tools, and plan for local implementation of the TA coaching process.
Table A-1: Descriptions of TA Coaching Activities
TA Coaching activity Description
Consulting Phone, email, or onsite consulting with manager or site team. Might include check-in and revision of program improvement plan, review or revision of steps to achieve goals, or general counsel and support for managers.
Modeling Modeling the Observational-Reflection method for manager, co-leading a staff meeting with manager to revise improvement plan, or modeling youth work best practices for front line staff.
Observation Co-observing program sessions with the site manager and thinking together about how to use coaching or brief in-service training content for direct staff
In-service Training Brief on-site in-service training used to re-introduce a concept or idea from the Youth PQA or the Youth Worker Training Summit

Continuous Quality Improvement in Afterschool Settings
A- 10

APPENDIX B EXTERNAL VALIDITY
Continuous Quality Improvement in Afterschool Settings
B-2
Appendix B
External Validity In this appendix we compare attributes of the YPQI sample to other populations of afterschool programs in two ways. First, we compare characteristics of the overall YPQI sample to other large samples from the afterschool evaluation literature. Second, we compare samples at the network-level (i.e., subsamples of the overall YPQI sample) to characteristics of the remaining sites in the larger network from which the study sample was drawn. Data for this second analysis is available for three of the five networks in the study.
Comparison of the YPQI Sample to Samples in Other Studies Table B-1 compares manager and staff education and turnover levels from the whole YPQI sample to five independent afterschool samples previously described in the afterschool research literature. The five samples were drawn from the following reports:
• The 2004 TASC Evaluation is a report prepared by The After-School Corporation on a study conducted in New York City for 100 schools serving approximately 20,000 youth. The sample includes 1208 staff and 73 site coordinators (Reisner, White, Russell, & Birmingham, 2004).
• The 2005 Achieve Boston report focuses on a citywide initiative aimed at advancing the capacity of the out-of-school time (OST) workforce. The sample includes 3088 leaders, coordinators, and administrators (Dennehy & Noam, 2005).
• The 2005 Massachusetts Afterschool Research Study (MARS) Report included 78 afterschool programs within Massachusetts that were funded by a state office or grant or by a local nonprofit. The sample includes 675 paid staff (Miller, 2005).
• The 2006 School-Age Care Report is a report created for Cornerstone for Kids by the National Afterschool Association (NAA). Its sample includes 4346 afterschool workers somehow associated with NAA and/or their connected organizations (Nee, Howe, Schmidt, & Cole, 2006).
• The 2007 New York City (NYC) 21st Century Community Learning Centers (CCLC) Report was created for Cornerstone for Kids by the After-School Corporation. It is a study of 20 21st CCLC sites in New York City public schools. The sample includes 496 staff and youth workers (Khashu & Dougherty, 2007).

B-3
Table B-1: Comparison of Education Levels and Turnover: The YPQI Sample and Five Other Afterschool Research Samples
2004 TASC Evaluation N=1,281
2005 Achieve Boston
N=3,088
2005 MARS Report N=675
2006 School Age Care N=4,346
2007 NYC 21st CCLC
N=496
2009 YPQI Study
N=460
Education Managers (% of sample)
High school or less NA 6 NA NA NA 12
Some college NA 36 26 NA NA 16
BA or higher 94 52 60 55 NA 73
Direct Staff (% of sample)
High school or less 35 18 NA NA 35 44
Some college 37 49 7 NA 49 16
BA or higher 28 28 48 NA 16 40
Turnover (%)
Managers NA 28 NA NA NA 28
Direct Staff NA 34 22 NA NA 50
SOURCE: Reisner, White, Russell, & Birmingham, 2004; Dennehy & Noam, 2005; Miller, 2005; Nee, Howe, Schmidt, & Cole, 2006; Khashu & Dougherty, 2007; YPQI Manager Program-Wide Survey and Staff Program Wide Survey, baseline (2006-07). NOTE: BA = Bachelor’s degree.
By-Network Comparisons of the YPQI Network Samples to Other Network Sites In this section we compare characteristics of three network samples (N < 20) to the average characteristics of other sites in each respective network. Not all networks produced uniform data across sites so common data for comparisons does not exist for Networks D and E. Appendix table B-2 compares select characteristics from YPQI network samples A, B and C to similar characteristics from their broader networks.

Continuous Quality Improvement in Afterschool Settings
B-4
Table B-2: YPQI Network Profiles Network A Network B Network C
Sample Network Sample Network Sample Network
% Managers: BA or higher 56 NA 91 70 91 88
% Staff: BA or higher 17 NA 67 50 55 43
Avg. length of manager tenure (years)
6.9 NA 2.5 2.8 6.8 3.1
Avg. Daily Attendance (number of youth)
250.1 73.6 45.1 38.7 37.9 28.9
% Non-white 28 NA 76 75 65 54
SOURCE: Sample data from Manager Program-Wide Interview, Manager Program-Wide Survey, and Staff Program-Wide Survey. Network data were provided by network champions or their designees during Winter 2010. NOTES: NA indicates data were not available.

APPENDIX C DETAIL ON DATA COLLECTION AND MEASURES

Continuous Quality Improvement in Afterschool Settings
C-2
Appendix C
Detail on Data Collection and Measures In this appendix, we present information supporting Chapter 2. First, we describe the number of observations, surveys, and interviews completed for each year of data collection (baseline, implementation, and follow-up). Second, we supplement the Chapter 2 discussion regarding the effects of site attrition with results from additional analyses. Third, we provide a detailed description of the primary outcome measures examined in this report. Finally, we provide a descriptive summary of all measures employed in the study.
Amount of Data Collected During Baseline and Implementation Years Tables C-1, C-2, and C-3 provide the number of program-offering session ratings, surveys received, and interviews conducted during baseline, implementation, and follow-up years for the sample overall and by network and intervention-group status.
Table C-1. Data Collected During Baseline Year by Instrument, Network, and Experimental Status Network A Network B Network C Network D Network E Overall Int Con Int Con Int Con Int Con Int Con Int Con
Offerings Observed 20 20 20 19 23 19 15 14 20 20 98 92
Program-wide staff surveys 105 49 42 45 61 28 30 15 27 58 266 195
Program-wide manager surveys 10 10 10 12 11 10 8 9 10 10 49 51
Manager interviews 10 10 11 9 11 10 8 9 10 10 50 48
Staff program- offering session surveys 22 34 32 35 26 24 17 13 25 27 122 133
Youth offering session surveys 168 162 96 181 25 98 24 46 0* 0* 313 487
SOURCE: Manager Program-Wide Interview; Manager Program-Wide Survey; Staff Program-Wide Survey; Staff Offering Session Survey; Youth Offering Session Survey; Offering Session Observation, baseline year (2006-07). NOTES: Asterisk (*) indicates that no data was collected in this network due to delays in the human subjects protection process by administering agency for Network E. Int = Intervention Group; Con = Control Group.

C‐3
Table C-2. Data Received During Implementation Year by Instrument, Network, and Experimental Status Network A Network B Network C Network D Network E Overall Int Con Int Con Int Con Int Con Int Con Int Con
Offerings Observed 18 20 18 15 16 22 14 12 13* 2* 79 71
Program-wide staff surveys 60 73 36 28 47 18 21 19 19 48 183 186
Program-wide manager surveys 9 10 10 9 10 8 7 7 7 9 43 43
Program-wide youth surveys 224 237 123 105 74 58 56 43 87 115 564 558
Manager interviews 9 8 7 7 6 10 6 6 6 9 34 40
Staff program offering session surveys 27 33 25 41 29 33 17 13 6* 1* 104 121
Youth offering session surveys 177 180 147 159 113 178 89 98 17* 18* 543 633
SOURCE: Manager Program-Wide Interview; Manager Program-Wide Survey; Staff Program-Wide Survey; Youth Program-Wide Survey; Staff Offering Session Survey; Youth Offering Session Survey; Offering Session Observation, implementation year (2007-08). NOTES: Asterisk (*) indicates low numbers of cases due to loss of data by the data collection contractor. Network E was omitted from impact analyses for the Staff Instructional Practices outcome due to this loss of data. Int = Intervention Group; Con = Control Group.
Table C-3. Data Received During the Follow-up Year by Instrument, Network, and Experimental Status Network A Network B Network C Network D Network E Overall Int Con Int Con Int Con Int Con Int Con Int Con
Program-wide staff surveys 62 54 34 41 30 14 11 12 25 27 162 148
Program-wide manager surveys 9 11 10 9 6 7 2 2 10 6 37 35
Staff Rosters 7 9 7 7 4 7 2 3 7 6 27 32
Manager interviews (Int group only) 8 NA 9 NA 7 NA 6 NA 7 NA 37 NA
Staff interviews (Int group only) 6 NA 3 NA 3 NA 2 NA 3 NA 17 NA
SOURCE: Manager Program-Wide Interview; Manager Program-Wide Survey; Staff Program-Wide Survey; Staff Rosters; Staff Program-Wide Interview, follow-up year (2008-09). NOTES: NA=Not applicable. During the follow-up year, interviews were focused on YPQI implementation and was not collected in the control group. Int = Intervention Group; Con = Control Group.

Continuous Quality Improvement in Afterschool Settings
C-4
Site Attrition Analyses As described in Chapter 2, 97 sites were recruited into the study, and 10 of these were dropped by the end of the implementation year due to program closure (9 sites) or refusal to participate (1 site). In Chapter 2, we presented evidence that the intervention and control groups were equivalent at baseline with the 10 dropped sites removed from the baseline sample. Here we examine differences between dropped sites and retained sites to understand if sites that dropped were systematically different from those that were retained. This is especially important because more of the dropped sites were from the intervention group (7 of 10 sites). Significance tests were conducted using baseline data for 29 variables listed in Table C-4. Two of these differences were statistically significant, percentage of staff working full time and percentage of elementary-aged children served. Age of youth was included as a covariate in the impact models for instructional quality due to this difference. Overall, we concluded that site attrition during the implementation year does not threaten the validity of inferences about impact. Table C-4 illustrates these findings.
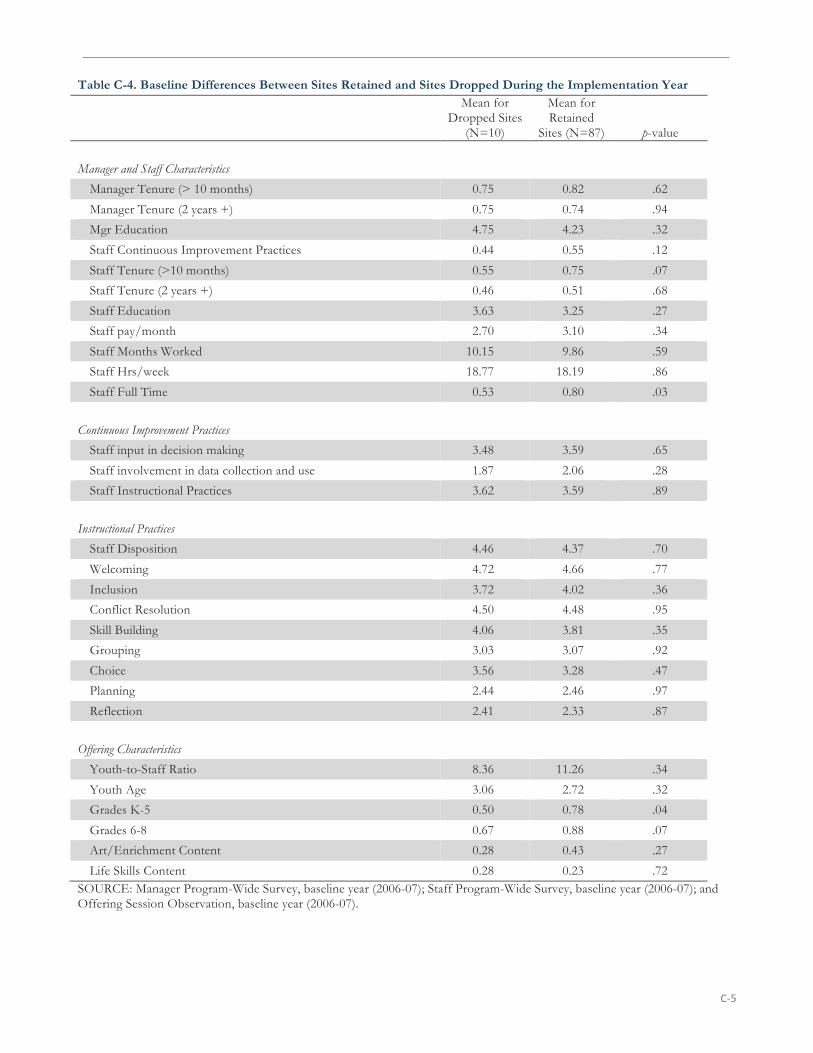
C‐5
Table C-4. Baseline Differences Between Sites Retained and Sites Dropped During the Implementation Year Mean for
Dropped Sites (N=10)
Mean for Retained
Sites (N=87) p-value
Manager and Staff Characteristics
Manager Tenure (> 10 months) 0.75 0.82 .62
Manager Tenure (2 years +) 0.75 0.74 .94
Mgr Education 4.75 4.23 .32
Staff Continuous Improvement Practices 0.44 0.55 .12
Staff Tenure (>10 months) 0.55 0.75 .07
Staff Tenure (2 years +) 0.46 0.51 .68
Staff Education 3.63 3.25 .27
Staff pay/month 2.70 3.10 .34
Staff Months Worked 10.15 9.86 .59
Staff Hrs/week 18.77 18.19 .86
Staff Full Time 0.53 0.80 .03
Continuous Improvement Practices
Staff input in decision making 3.48 3.59 .65
Staff involvement in data collection and use 1.87 2.06 .28
Staff Instructional Practices 3.62 3.59 .89
Instructional Practices
Staff Disposition 4.46 4.37 .70
Welcoming 4.72 4.66 .77
Inclusion 3.72 4.02 .36
Conflict Resolution 4.50 4.48 .95
Skill Building 4.06 3.81 .35
Grouping 3.03 3.07 .92
Choice 3.56 3.28 .47
Planning 2.44 2.46 .97
Reflection 2.41 2.33 .87
Offering Characteristics
Youth-to-Staff Ratio 8.36 11.26 .34
Youth Age 3.06 2.72 .32
Grades K-5 0.50 0.78 .04
Grades 6-8 0.67 0.88 .07
Art/Enrichment Content 0.28 0.43 .27
Life Skills Content 0.28 0.23 .72 SOURCE: Manager Program-Wide Survey, baseline year (2006-07); Staff Program-Wide Survey, baseline year (2006-07); and Offering Session Observation, baseline year (2006-07).

Continuous Quality Improvement in Afterschool Settings
C-6
Outcome Measures
Continuous Improvement Practices The continuous improvement practices measured in the continuous improvement score are: (a) site team assessment of instructional quality (i.e., observation during program-offering sessions, collection of written anecdotal evidence, and use of an assessment tool/rubric to produce a score), (b) site team participation in program planning using instructional assessment data, (c) staff receipt of performance feedback about instruction following program-offering sessions, and (d) manager and staff attendance at trainings for specific instructional skills. The Manager Continuous Improvement Practices score is constructed from components (a), (b), and (d). The Staff Continuous Improvement Practices score is constructed from all four components. Each of the four component measures are single- or multi-item indexes, each standardized to range between 0 and 1. Scores for each equally weighted component were then averaged to create an overall score for both managers and staff, each ranging from 0-1.48 Table C-5 displays the means, standard deviations, and Cronbach’s α (alpha) coefficient of reliability for each component and overall score for manager and staff continuous improvement practices.
48 We treated the component measures as formative indexes, where the indicators are not effects but causes of the named constructs, and the overall score as a “reflective” construct where the interchangeability of the component scores is assumed. For this reason, we provide an alpha for the overall scores but not the component scores. Indexes are an attractive option when indicators represent counts of behaviors – frequency or intensity – and are especially useful in our work because their meaning is more transparent to individual users. However, the science of index creation raises a number of problems for traditional tools used for psychometric evaluation. Namely, because these indicators “add up” to an aggregate practice, they are formative in nature (i.e., the cause rather than effect of a latent construct). In the organizational and business research literature, efforts to measure specific management practices using indexes is growing (Diamantopoulos, 2008). However, aside from using inter-rater reliability estimates from independent raters, little agreement exists about how to assess the reliability of indexes created using formative indicators (See Wilcox, Howell, & Breivik, 2008; Ruiz, Gremler, Washburn, & Carrion, 2008; Diamantopoulos, Riefler, & Roth, 2008).

C‐7
Table C-5. Measures of Continuous Improvement Practices for Managers and Staff Manager Continuous
Improvement Practices (N=85)
Staff Continuous Improvement Practices
(N=369) α M SD α M SD
Continuous Improvement Practices 0.67 0.66 0.34 0.63 0.63 0.29 Instructional Assessment (three dichotomous items) 0.77 0.29 0.49 0.38
- Observed offerings to assess quality? 0.89 0.32 0.45 0.50 - Collected written evidence on program quality? 0.69 0.47 0.39 0.49 - Currently using the Youth PQA or other at site? 0.73 0.45 0.66 0.47
Planning with Instructional Assessment Data
(single dichotomous item) 0.60 0.49 0.49 0.50
- Conducted program planning using quality
assessment data?
0.60 0.49 0.49 0.50
Staff Instructional Method Trainings
(score of 1 if the staff or manager attended at least one of the four trainings listed, and a score of 0 if the staff or manager attended none of the trainings)
0.62 0.49 0.57 0.50
- Developmental Assets (Search Institute) 0.23 0.43 0.35 0.48 - Advancing Youth Development (National Training
Institute)
0.17 0.38 0.28 0.45
- Bringing Yourself to Work (National Institute for Out-of-School Time)
0.14 0.34 0.20 0.40
- HighScope Youth Work Methods or Youth PQA 0.47 0.50 0.43 0.50 Manager Feedback
(two dichotomous items) NA NA 0.95 0.18
- My supervisor gives me good feedback about how
I work with youth.
NA NA 0.87 0.34
- My supervisor is visible during the program offerings that I lead / co-lead.
NA NA 0.83 0.38
SOURCE: Manager Program-Wide Survey, implementation year (2007-08) and Staff Program-Wide Survey, implementation year (2007-08). NOTES: Values in the columns are unadjusted means and standard deviations for the groups. α = Cronbach’s alpha coefficient of reliability. Cronbach’s alpha was used to estimate the internal consistency of the 3 (Manager) or 4 (Staff) components of the Continuous Improvement Practices measure. The Manager Feedback scale is used only in the Staff Continuous Improvement Practice score.
Staff Instructional Practices The primary measure for the quality of staff instructional practices was derived from the Youth Program Quality Assessment (HighScope, 2005). Table C-6 displays means, standard deviations, and Cronbach’s alpha coefficients of reliability for the instructional quality measures. As described in Chapter 2, the Instructional Practices Total score was constructed by averaging items in each scale and then averaging across each of the scales to produce a total score.

Continuous Quality Improvement in Afterschool Settings
C-8
Table C-6. Measures of Staff Instructional Practices N = 151 M SD % Scoring 3
or 5a Staff Instructional Practices Total Score (α = .82)
3.58 0.77 -
Staff Disposition (a = .867) 4.47 0.88 - 1. Staff appear to like their jobs 4.40 1.03 97 2. Staff appear to like the youth they’re working with 4.48 0.99 97 3. Staff appear to like each other 4.53 0.95 98
Welcoming Atmosphere (r = .50) 4.81 0.53 - 1. Staff use a warm tone of voice and respectful language 4.85 0.52 100
2. Staff smile, use friendly gestures, and make eye contact 4.76 0.69 99
Inclusion Practices (α = .72) 4.09 0.85 - 1. Inclusive rather than exclusive climate among youth 3.81 1.37 89
2. Evidence of shared traditions or youth-owned climate 3.98 1.20 95 3. Staff use the names of each youth present 3.91 1.20 97 4. Most youth call each other by name or use each other’s names 2.57 1.38 91 5. Staff support an inclusive rather than exclusive climate among youth 2.65 1.39 93
Conflict Resolution (r = .37) 4.51 0.84 - 1. No instances of bullying, teasing, or taunting 4.41 1.15 94
2. When strong feelings are involved, staff help youth respond appropriately 4.59 0.88 99
Active Skill Building (� = .71) 3.81 0.94 - 1. Staff use active learning tasks (e.g., create/ reformulate materials or ideas) 3.81 1.18 95
2. Staff use activities that balance concrete experiences and abstract concepts 3.97 1.33 91 3. Staff encourage youth to try new skills / improve 3.76 1.74 74 4. Staff are actively involved with youth 4.71 0.75 99 5. Staff use open-ended questions throughout the activity 2.81 1.70 59
Support for group participation (r = .84) 2.70 1.58 - 1. Activities carried out in different groupings 2.21 1.38 49
2. Groups have purpose/goal and members cooperate to accomplish it 2.78 1.91 49
Opportunities to make choices (r = .39) 3.50 1.46 - 1. Opportunities to make content choices 3.34 1.78 68
2. Opportunities to make process choices 3.66 1.73 74
Opportunities for planning (r = .85) 2.03 1.40 - 1. Opportunities to make plans for projects and activities 2.12 1.53 39
2. Opportunities to use multiple planning strategies 1.93 1.38 39
Opportunities to reflect (� = .77) 2.20 1.31 - 1. Opportunities to reflect on work in progress or completed work 2.58 1.80 47
2. Opportunities to reflect on work in multiple ways 2.06 1.30 44 3. Opportunities to make presentations to the whole group 1.97 1.61 29
SOURCE: Offering Session Observation, implementation year (2007-08). NOTES: Values in the columns represent unadjusted means and standard deviations for the groups. α = Cronbach’s alpha coefficient of reliability. r = Pearson’s correlation coefficient, used to represent internal consistency when scales contain only two items. a A score of‘3’ in the Youth PQA represents medium-quality and a ‘5’ represents high-quality.
The published version of the Youth PQA (HighScope, 2005) includes a larger set of items and scales than were included in the Instructional Practices Total Score. The reasoning for our selection of this particular group of items and scales is based on psychometric theory and on prior confirmatory factor analyses

C‐9
(using structural equation modeling [SEM]). Specifically, the published version of the Youth PQA contains items and scales which are “formative” in nature, implying that the scales which are produced do not necessarily yield “reflective” constructs where each item is drawn from a hypothetical universe of items that reflect a common latent construct (Diamantopoulos & Siguaw, 2006; Diamantopoulos, 2008). Rather, the Youth PQA (and likely most other observational measures of instructional practice) contains items that are each independently important pieces of a construct; that is, the given construct may be present where any number of different behaviors/items are present, without the need for each and every possible behavior/item to be observed at approximately the same level as would be the case for reflective items. In any case, traditional approaches to reliability, which assume that all item scores within a given scale rise and fall together, may often be misapplied to setting-level observational measures.49
In two prior studies (Smith, Peck, Denault, Blazevski & Akiva, 2010; Smith, Akiva, Blazevski, Pelle & Devaney, 2008) we used theoretical and empirical methods to define a subset of items and scales that behave like reflective measures (where all items describe overlapping or redundant objects of measurement and arguably represent a latent behavioral construct). Our hope was to minimize the influence of measurement error on power to detect intervention effects in statistical models using an observational method as the outcome measure. Further, improvements to the dimensionality of the instructional measure allow for exploratory analyses of the impact of YPQI on specific dimensions of instructional practice. The eight scales resulting from this prior work were used to construct the Staff Instructional Practices Total Score and are described in Table C-6. An additional six items—three items in the Inclusion scale and three items in the Staff Disposition scale—were added for the YPQI study as a result of our earlier confirmatory efforts to produce reflective scales and dimensional constructs.
Figure C-1 reproduces the scoring rubrics used to create the Staff Instructional Practices Total Score and the nine component scales.
Figure C-1. Staff Instructional Practices Scales and Items Scale “1” Indicator “3” Indicator “5” Indicator Staff Disposition
1 Staff appear to like their jobs. (Low)
Staff appear to like their jobs. (Medium)
Staff appear to like their jobs. (High)
2 Staff appear to like the youth they’re working with. (Low)
Staff appear to like the youth they’re working with. (Medium)
Staff appear to like the youth they’re working with. (High)
3 Staff appear to like each other. (Low)
Staff appear to like each other. (Medium)
Staff appear to like each other. (High)
Welcoming 1 During activities, staff mainly use a
negative tone of voice and disrespectful language.
During activities, staff sometimes use a negative tone of voice and disrespectful language and sometimes use a warm tone of voice and respectful language.
During activities, staff mainly use a warm tone of voice and respectful language.
2 During activities, staff generally frown or scowl, use unfriendly gestures, and avoid eye contact.
During activities, staff sometimes exhibit unfriendly behaviors and sometimes use a friendly approach.
During activities, staff generally smile, use friendly gestures, and make eye contact.
49 See previous note.

Continuous Quality Improvement in Afterschool Settings
C-10
Scale “1” Indicator “3” Indicator “5” Indicator Inclusion
1 Youth exhibit predominantly exclusive relationships, limited to a few individuals or a small clique within the program offering.
Relationships to others in the group are not fully inclusive, but youth know and use one another’s names.
Youth exhibit predominately inclusive relationships with all in the program offering, including newcomers.
2 Youth do not identify with the program offering (e.g., many youth complain about or express dislike of the program offering or activities).
Youth do not strongly identify with the program offering but do not complain or express dislike.
Youth strongly identify with the program offering (e.g., hold one another to established guidelines, use ownership language, such as “our program,” engage in shared traditions such as shared jokes, songs, gestures).
3 Staff only use the names of 2 or fewer youth present.
Staff use the names of at least three but not all youth present.
At some point during the session, staff use the names of each youth present (e.g. staff welcome each youth, calling them by name; staff use youths’ names throughout the course of activities).
4 During the session, youth rarely or never use each other’s names in conversation
During the session, a few youth call each other by name or use each other’s names in conversation.
At some point during the session, most youth call each other by name or use each other’s names in conversation.
5 Staff allow youth to form exclusive
relationships, limited to a few individuals or a small clique within the program offering (e.g., staff does not intervene when youth say or do anything that might result in another youth feeling left out).
Staff inconsistently support the development of an inclusive rather than exclusive climate among youth (e.g., staff may intervene in cases of blatant exclusion, but allow/ignore other forms of exclusion such as formation of cliques).
Staff support the development of an inclusive rather than exclusive climate among youth (e.g., staff intervene if youth say or do anything that might result in another youth feeling left out).
Conflict Resolution
1 One severe incident of bullying occurred (threatening or engaging in violence) or more than one instance of other less severe bullying, teasing, or taunting occurred during the program session.
One instance of bullying, teasing, or taunting occurred during the program session (not involving a real threat of violence as in the previous category).
No instances of bullying, teasing, or taunting occurred during the program session.
2 When youth express strong feelings, staff shame, scold, ignore, and/or punish them.
When strong feelings are involved, staff sometimes help youth respond appropriately.
When strong feelings are involved, staff consistently help youth respond appropriately (e.g., staff encourage youth to brainstorm possible solutions, take time to “cool off,” find an appropriate physical outlet, etc.).
Active Skill Building
1 The activities focus almost exclusively on abstract concepts, providing limited or no related concrete experiences.
The activities focus almost exclusively on concrete experiences, providing limited or no opportunities to engage with related abstract concepts.
The activities balance concrete experiences involving materials, people, and projects (e.g., field trips, experiments, interviews, service trips, creative writing) with

C‐11
Scale “1” Indicator “3” Indicator “5” Indicator abstract concepts (e.g., lectures,
diagrams, formulas).
2 Some youth who try out new skills with imperfect results, errors, or failure are informed of their errors (e.g., “That’s wrong”) and/or are corrected, criticized, made fun of, or punished by staff without explanation.
Some youth who try out new skills receive support from staff who problem-solve with youth despite imperfect results, errors, or failure, and/ or some youth are corrected with an explanation.
All youth who try out new skills receive support from staff despite imperfect results, errors, or failure; staff allow youth to learn from and correct their own mistakes and encourage youth to keep trying to improve their skills.
3 Any skill development is unintentional (e.g., When kids are playing basketball for fun, they may get better, but the focus is not on improving specific basketball skills).
Staff provide some intentional opportunities for development of specific skills (as opposed to activities with just a recreation or ‘having fun’ focus), but only for some of the youth in the session.
Staff provide intentional opportunities for development of specific skills (as opposed to activities with just a recreation or ‘having fun’ focus) for all youth in the session.
4 During activities, no staff are actively involved with youth except for brief introductions, endings, or transitions (e.g., they are physically separated from youth or do not interact with them).
During activities, staff (or some of the staff) are sometimes, or intermittently, actively involved with youth.
During activities, staff are almost always actively involved with youth (e.g., they provide directions, answer questions, work as partners or team members, check in with individuals or small groups).
5 Staff rarely or never ask open-ended questions.
Staff make limited use of open-ended questions (e.g., only use them during certain parts of the activity or repeat the same questions).
Staff make frequent use of open-ended questions (e.g., staff ask open-ended questions throughout the activity and questions are related to the context).
Grouping 1 Session involves only one
grouping—full, small, or individual. Session consists of activities carried out in 2 different groupings—full, small, or individual.
Session consists of activities carried out in at least 3 groupings—full, small, or individual.
2 Staff do not use small groups for activities.
Some or all small groups lack a purpose, or some group members do not cooperate in accomplishing the purpose.
Each small group has a purpose (i.e., goals or tasks to accomplish), and all group members cooperate in accomplishing it.
Choice 1 The activities do not provide
opportunities for all youth to make content choices.
All youth have opportunities to choose among content alternatives, but choices are limited to discrete choices presented by the leader.
All youth have the opportunity to make at least one open-ended content choice within the content framework of the activities (e.g., youth decide topics within a given subject area, subtopics, or aspects of a given topic).
2 The activities do not provide opportunities for all youth to make process choices.
All youth have opportunities to choose among process alternatives, but choices are limited to discrete choices presented by the leader.
All youth have the opportunity to make at least one open-ended process choice (e.g., youth decide roles, order of activities, tools or materials, or how to present results).
Planning 1 Youth do not have opportunities to
make plans for projects or activities. Youth have at least one opportunity to make plans for a project or activity (individual or group).
Youth have multiple opportunities to make plans for projects and activities (individual or group).

Continuous Quality Improvement in Afterschool Settings
C-12
Scale “1” Indicator “3” Indicator “5” Indicator
2 There is no planning for projects or activities, or no identifiable planning strategies are used.
When planning projects or activities, at least one identifiable planning strategy is used.
In the course of planning the projects or activities, 2 or more planning strategies are used (e.g., brainstorming, idea webbing, backwards planning).
Reflection 1 No youth are engaged in an
intentional process of reflecting on what they are doing or have done.
Some youth are engaged in an intentional process of reflecting on what they are doing or have done.
All youth are engaged in an intentional process of reflecting on what they are doing or have done (e.g., writing in journals; reviewing minutes; sharing progress, accomplishments, or feelings about the experience).
2 Some or all youth are not given the opportunity to reflect on their activities.
All youth are given the opportunity to reflect on their activities in at least one way.
All youth are given the opportunity to reflect on their activities in 2 or more ways (e.g., writing, role playing, using media or technology, drawing).
3 No youth have structured opportunities to make presentations to the whole group.
Some youth have structured opportunities to make presentations to the whole group.
In the course of the program offering, all youth have structured opportunities to make presentations to the whole group.
SOURCE: Program-Offering Session Observation, Youth Program Quality Assessment
Comprehensive Summary of Constructs and Indexes from the YPQI Study In this section, we provide a comprehensive list of all constructs and indexes available in data files from the YPQI study. Many of these measures are not employed in this report; however, we provide them here so that readers of the report can better understand the extent of measurement represented by, and patterns of nesting within, the YPQI data files.
As discussed in Chapter 2, measures for the YPQI study were differentiated by the frame of reference for the items. Program-wide measures asked respondents to provide responses in references to the overall experience of participation at the site. These measures were administered to all staff and youth at the program during a specific data collection window. In contrast, program-offering session instruments asked respondents to provide responses in reference to a specific program-offering session. These measures were administered only to staff and youth participating in each of the two sampled program-offering sessions for each site. Again, afterschool program offerings are defined as microsettings where consistent groupings of adults and youth meet over multiple sessions for the same learning purpose (e.g., an 8th grade poetry workshop that meets for a set time each week after school), without regard to content.
Program-Wide Measures Program-wide measures included interviews for managers and surveys for managers, staff, and youth. Administration protocols and timelines for administration of these surveys are described in Chapter 2. In

C‐13
this section, we provide a summary of the measurement constructs included in each of the instruments. Not all constructs were included in all waves of data collection.
Manager Program-Wide Interview
• Youth Involvement/Governance – (6 items) The extent to which youth were consulted on program content, format, physical environment; whether or not youth were involved in leading program offerings, reviewing program plans, hiring staff, program governance, etc.
• Intermediaries and Momentum – (6 items) Managers were asked to describe their relationships with other organizations and intermediaries; whether or not they have support from the leaders in their community, etc.
• Performance Expectations, Metrics, and Feedback – (3 items) Managers were asked what kinds of policies and procedures were in place that communicated program expectations, whether or not the they participate in evaluations of program offerings, etc.
• Feedback on YPQI (Intervention Group Only) – (8 items) Managers were asked about their involvement in the YPQI process: what they found most useful, which things were a waste of time, what they do differently as a result of participation in the study, etc.
Manager Program-Wide Survey
• Background Questions – Name, experience, education, position, hours worked, salary, benefits, program daily attendance and enrollment, supervisor race/ethnicity, and program characteristics such as length of operation, paid staff and tenure, and major site changes.
• Program Purposes – Managers listed six program objectives in the order of their importance. Objectives included – provide academic enrichment, enhance social/civic development, enhance artistic development, facilitate homework completion, provide sports and recreation, other.
• Focal Program Areas – Managers were asked to select the amount of focus their program had on the following content areas: art, music, sports, dance, poetry, cooking, reading, theater, leadership, math, life skills, sewing, physical fitness, science, building/shop, community service, and creative writing.
• Climate – Professional efficacy – management (5 items), role overload (2 items), and depersonalization (2 items).
• Feedback Loop Practices (not intended for scale formation) – Managers were asked to describe three issue areas their site was working on for improvement and then were asked to describe how they addressed each issue area: Improvement areas (3 items), evidence and planning for improvement (5 items), follow-up (3 items), and benefits (4 items).
• Intensity of YPQI Participation (Intervention group only) – Training and technical assistance participation: Youth PQA Basics training, Youth Voice & Governance Course, complete a self-assessment, lead a team of staff to complete a self-assessment, attend the Planning with Data workshop, create an improvement plan, attend the Youth Worker Methods training summit,

Continuous Quality Improvement in Afterschool Settings
C-14
attend the Instructional Coaching training, conduct observation-feedback with at least one staff, meet with a Quality Advisor, and revise the improvement plan.
• Personal/Professional Agency – Shared control - instructional setting (2 items) and shared control - organizational setting (5 items).
• Job Satisfaction (4 items)
• Adoption of New Practices – Adoption of practices – openness (2 items), adoption of practices – requirements (2 items), and adoption of practices – divergence (3 items).
• Quality Beliefs – Adult control (6 items), shared control (5 items), adult modeling (2 items), and emphasis on relationships (2 items).
• Network Policies – Network hiring policies (3 items), observational assessment and training (3 items), and assessment/planning frequency and usefulness (10 items).
• Professional Development (4 items)
• Data-Driven Practices – Involvement in data collection and use (5 items).
• Site Programming Characteristics (4 items)
• Quality Priorities (not intended for scale formation) – Youth engagement, staff support, youth governance, basic safety, and peer interaction.
• Accountability Environment – Network cohesion (7 items), quality focus (2 items), managing change (best practices) (5 items), accountability norms (5 items), and network hiring practices.
• Place-based OST Reform Activity – Penetration of youth advocacy organizations (5 items).
• Open-ended Questions – Managers were asked a series of open-ended questions such as their definition of youth development, their definition of quality, and their program vision.
Staff Program-Wide Survey
• Background – Name, program offerings lead, experience, position, education, pay, hours worked, and benefits.
• Program Purposes – Staff listed six program objectives in the order of their importance. Objectives included: provide academic enrichment, enhance social/civic development, enhance artistic development, facilitate homework completion, provide sports and recreation, and other.
• Climate – Professional efficacy/management (4 items), staff shared values (2 items), staff input in decision-making (3 items), role overload (2 items), depersonalization (2 items), supervisor quality focus (3 items), shared control (general) (4 items), and new employee training practices (3 items).
• Organizational Setting Characteristics - Staff support (collaboration) (5 items) and supervisor support (6 items).
• Personal/Professional Agency - Shared control (instructional setting) (2 items) and shared control (organizational setting) (3 items).

C‐15
• Job Satisfaction – (4 items)
• Adoption of New Practices – Adoption of practices – divergence (3 items).
• Quality Beliefs – Adult control (6 items), adult modeling (2 items), shared control (5 items), and emphasis on relationships (2 items).
• Data-Driven Practices - Assessment – current practice (4 items) and involvement in data collection and use (5 items).
• Site Programming and Quality Characteristics - Quality of planning for youth program sessions (3 items) and quality of staff meetings (4 items).
• Professional Development - Training – amount (6 items) and exposure to evaluation data (5 items).
• Assessment and Planning – Familiarity with after-school standards (2 items), planning accountability (1 item), assessment frequency (5 items), and organizational setting quality (7 items).
• Training and Hiring – Training – recency (5 items) and new employee orientation practices (4 items).
• Improvement Planning and Practices (not intended for scale formation) – Staff were asked to describe three issue areas their site was working on for improvement and then were asked to describe how they addressed each issue area: Improvement areas (3 items), evidence and planning for improvement (5 items), follow-up – general (3 items), follow-up – opportunities to share (5 items), and benefits (4 items).
• Organizational Setting Quality (6 items)
• Intensity of YPQI Participation (Intervention group only) – Training and technical assistance participation: Youth PQA Basics training, Youth Voice & Governance Course, complete a self-assessment, attend the Planning with Data workshop, create an improvement plan, attend the Youth Worker Methods training summit, and meet with a Quality Advisor.
• Open-Ended Questions – Staff were asked a series of open-ended questions such as their definition of youth development, their definition of quality, and their program vision.
Youth Program-Wide Survey
• Quality Features – Emotional safety (1 item), emotional support from staff (4 items), sense of belonging (5 items), goal setting/planning opportunities (2 items), reflection (2 items), and youth voice (6 items).
• Motivation to Attend – Interest (4 items) and challenge (4 items).
• Aggression Norms (10 items)
• Personal and Social Competencies – Self-control (4 items), empathy (4 items), communication (3 items), planning/goal-setting (4 items), and problem solving (3 items).
• Emotional Health – Self-esteem (4 items) and school bonding/attachment (3 items).

Continuous Quality Improvement in Afterschool Settings
C-16
• Background Questions – Age, gender, parent education, attendance at the program, participation in other activities, time spent at home alone, and grades.
• Open-ended Questions – Youth list important things they learned.
Program-Offering Session Data Collection Offering-session measures included the observation-based Youth PQA and surveys for staff and youth. Administration protocols and timelines for administration of these surveys and observation are described in Chapter 2. In this section, we provide a summary of the measurement constructs included in each of the instruments used during each sampled program-offering session. Not all constructs were included in all waves of data collection. In the bulleted lists that follow, the general domain of measurement is followed by each of the scale names falling in that domain. The number of items for each scale is listed parenthetically.
Staff Program-Offering Session Survey
• Program Demographics / At-Risk Population – Name; gender; site name; program name; offering description; position/role in offering session; and staff perception of youth who are at-risk, have a learning disability, and who can successfully complete program activities.
• Instructional Quality (survey items aligned with Youth PQA scales) – Welcoming (1 item), program planning (2 items), skill building (1 item), youth partner with adults (2 items), encouragement (1 item), belonging (1 item), grouping (2 items), youth facilitate and mentor (3 items), planning (1 item), choice (1 item), and reflection (2 items).
Youth Program-Offering Session Survey
• Background – Age, gender, parent education, attendance at the program, participation in other activities, and emotional/physical state upon arrival (5 items).
• Student Outcomes – Interest (2 items), confidence/self-efficacy (1 item), and self-esteem (2 items).
• Student Perception of Program Quality – Emotional safety (1 item), emotional support from staff (2 items), support for skill development/challenge (2 items), organization and planning (2 items), sense of belonging (2 items), emotional support from peers (2 items), shared control (1 item), leadership (2 items), goal setting/planning (2 items), reflection (2 items), and youth voice (2 items).
• Supplemental Measures – Youth engagement (6 items) and support for skill development/challenge (2 items).
• Wave 3 Constructs – Positive affect (5 items), belonging (2 items), program quality (2 items), challenge (4 items), and emotional/physical state upon arrival (5 items).
• Youth Voice – Two open-ended questions.

APPENDIX D RELIABILITY OF THE STAFF INSTRUCTIONAL PRACTICES TOTAL SCORE

Continuous Quality Improvement in Afterschool Settings
D-2
Appendix D
Reliability of the Staff Instructional Practices Total Score This appendix discusses evidence regarding the reliability of the Staff Instructional Practices Total Score. The appendix is divided into two parts. The first describes YPQI data collector training and results from data collector reliability checks. The second summarizes technical findings from the Youth PQA Reliability Study (Cortina & Smith, 2010) conducted using a subsample of YPQI Study data.
Data Collector Training and Reliability Check Findings In the YPQI Study, external observers produced ratings for the quality of instructional practices during afterschool program offerings using the Youth Program Quality Assessment Form A (Youth PQA; HighScope, 2005). Observers were trained to a uniform standard of inter-rater reliability using standardized training procedures, video footage of afterschool program offerings, and gold standard scores against which rater agreement was calculated at the item level (Blazevski & Smith, 2007). The 2.5 day training included a basic introduction to the tool and activities designed to foster the interaction of the trainee with every item on the instrument. This was followed by a day of video scoring practice and, in some instances, a live practice observation. Day three consisted of a reliability check in which assessors observed a 45-minute video from a program offering and scored a complete Youth PQA Form A.
To become endorsed as a reliable assessor, trainees were required to achieve at least 80% perfect agreement at the item level with a set of “gold standard” scores produced by expert raters. That is, the assessors’ ratings had to match the expert scores for at least 51 of 64 items in the Youth PQA Form A. Raters that did not achieve this level of accuracy on the first try completed additional training and reliability checks or did not conduct observations. Table D-1 presents average rater reliability for each network and overall.
Table D-1. Rater Reliability - Percentage Agreement for the Overall Youth PQA Observation Protocol, Baseline and Implementation Years Network A Network B Networks C & D Network E Overall
Baseline Year (n=3)
Implem Year (n=4)
Baseline Year
(n=6)
Implem Year (n=8)
Baseline Year
(n=11)
Implem Year
(n=10)
Baseline Year (n=2)
Implem Year (n=3)
Baseline Year
(n=22)
Implem Year
(n=25) Mean 82.8 93.0 87.5 85.5 76.8 80.4 80.0 81.2 80.8 84.1
Std. Dev. 2.5 5.1 6.6 5.0 8.5 6.4 7.1 1.6 8.3 6.8
Minimum 80.0 87.3 76.7 79.0 56.7 73.2 75.0 80.3 56.7 73.2
Maximum 85.0 98.6 96.7 91.5 88.3 94.4 85.0 83.1 96.7 98.6
SOURCE: Wave 1 and Wave 2 Data Collector Reliability Scores NOTES: Baseline data collection occurred in spring 2007 and Implementation year data collection occurred in spring 2008. Networks C and D were located in the same state and shared a common pool of data collectors. Implem = Implementation,
D-3
Summary Findings from the Youth PQA Reliability Study50
Introduction This section describes a reliability study for the Youth PQA that was conducted in parallel to the primary study. Monitoring the quality of instructional practices requires a theoretically stringent model of measurement that helps disentangle various sources of variability that are confounded in most quality measures (Raudenbush, Martinez, Bloom, Zhu & Lin, 2008). Observational data can be particularly prone to observer bias and erroneous assumptions about the stability of instructional practices for the same staff on different days, leading to unreliability of measures and reduced power in statistical models (Schochet, 2008). Effects of raters and consistency over time can be estimated and controlled for if they vary systematically.
Sample and Data Structure The data used for the reliability study was collected during the implementation year of the YPQI Study in one of the five study networks. The sample consisted of 122 ratings of staff instruction during 61 program offerings days for 32 different afterschool staff/offerings at 19 different afterschool sites.
Unlike the rest of the YPQI data set, this subsample of ratings for staff/offerings included additional observations and paired observers based on the partially crossed data collection design necessary to support these analyses. Specifically, each program offering was observed simultaneously by a team of paired raters on two different days at a time interval of approximately two weeks between observations (four ratings in total for each program offering; two ratings in total for each offering day). There were four teams of raters; the same rater team observed both of the offering days. Each team observed varying numbers of program offerings (between 2 and 14).
Table D-2 summarizes the partially crossed data collection design that crosses offerings, raters, and days, with days nested within offerings and each rater pair nested within a block of offerings.
50 This study was funded as a supplement to the YPQI Study by the William T. Grant Foundation. Data analyses were conducted by Kai Cortina and this section reflects his lead authorship.

Continuous Quality Improvement in Afterschool Settings
D-4
Table D-2: Design of the Youth PQA Reliability Study
Block 1 N=4 offerings
Offering # 1 2 25 26
Rater 1 D1 D2
D1 D2
D1 D2
D1 D2
Rater 2 D1 D2
D1 D2
D1 D2
D1 D2
Block 2 N=14 offerings
Offering # 3 4 7 8 9 10 11 12 13 14 15 16 29 30
Rater 3 D1 D2
D1 D2
D1 D2
D1 D2
D1 D2
D1 D2
D1 D2
D1 D2
D1 D2
D1 D2
D1 D2
D1 D2
D1 D1 D2
Rater 4 D1 D2
D1 D2
D1 D2
D1 D2
D1 D2
D1 D2
D1 D2
D1 D2
D1 D2
D1 D2
D1 D2
D1 D2
D1 D1 D2
Block 3 N=8 offerings
Offering # 5 6 17 18 19 20 31 32
Rater 5 D1 D2
D1 D2
D1 D2
D1 D2
D1 D2
D1 D2
D1 D2
D1
Rater 6 D1 D2
D1 D2
D1 D2
D1 D2
D1 D2
D1 D2
D1 D2
D1
Block 4 N=6 offerings
Offering # 21 22 23 24 27 28
Rater 7 D1 D2
D1 D2
D1 D2
D1 D2
D1
D1 D2
Rater 8 D1 D2
D1 D2
D1 D2
D1 D2
D1
D1 D2
SOURCE: Youth PQA Reliability Study NOTE: Block describes the group of program offerings assigned to each rater pair. D1 refers to the first day observation for that offering. D2 refers to the second day observation for that offering. D1 and D2 always occurred on different days.
Measures For each program-offering day, a rater used the Youth PQA to evaluate instructional practices of the staff leader. In this summary of findings from the Youth PQA Reliability Study, we focus on scores for the Staff Instructional Practices Total Score as described in appendix table C-6. For this subsample, the Staff Instructional Practices Total Score had Cronbach’s alpha coefficient of reliability, � = .61, and an intra-class correlation coefficient, ICC = .7151.
Theoretical and Observational Models Drawing on the seminal work of Cronbach, Gleser, Nanda, and Rajaratnam (1972), Raudenbush, Martinez, Bloom, Zhu, and Lin (2008a) proposed a process for identifying the most salient sources of measurement error in setting measures through multiple and repeated observations. Raudenbush et al. (2008a) distinguish between the comprehensive theoretical model of measurement and the observational model that specifies the sources of variation that can be estimated with the dataset at hand. The observational model is limited with respect to the non-confounded sources of variability that the design
51 The intra-class correlation is a ratio of the variance between paired raters for each offering to the total variance across all raters and was estimated using an unconditional HLM model nesting raters within days.

D-5
allows the researcher to identify. 52 It is also constrained by the complexity of effects that can be estimated empirically with a given dataset (e.g., higher-order interactions).
The Youth PQA Reliability Study was designed to partial out variance in observational scores; to separate “true” variance from identifiable sources of systematic error. Following the guidance of Raudenbush et at. (2008b), the first step towards an appropriate estimation of the reliability is the specification of a theoretical model that is explicit with respect to the error components that affect the measure.
Since the unit of analysis is the assessment of each rater on a given day (i.e., four observations units per offering), our model is expressed as:
<1>
In this model, represents the observation of instructional practices (e.g. Staff Instructional Practices
Total Score) for a specific offering o by rater r on day d. is the overall mean, is the effect of the
offering, and stands for the effect of rater (reflecting the possibility that some raters are generally
more lenient or strict in their assessment than other raters. reflects the difference in days of
observation. Two interaction terms are included: reflects situations in which differences between
raters may be more pronounced in a particular offering and reflects the possibility that differences
between offerings are more pronounced on one day and less pronounced on another day. For purposes of parsimony, we omitted two implied interactions from this equation: we reasoned that (rater by day)
was nonexistent, or at least negligible, and the complex interaction could not be estimated
separately from the residual error term.
Through a few more calculations involving the variances of the terms in equation <1>, we generated the information needed to create an observational model, the next step according to Raudenbush et al. (2008b). For the sake of simplicity, the discussion of the theoretical model above does not integrate the nested structure of the Youth PQA Reliability Study design. However, raters are nested within program offerings. In addition, the most efficient estimator uses weights that reflect the differences in standard error. This can be done by introducing ‘block’ as a design factor and estimating all effects of the theoretical model as nested under block. Note that block is added as an independent random variable for which we assume that the null hypothesis is true in the population if raters as well as offerings were randomly assigned to block. If this holds, it is also not a severe limitation to ignore all the potential interaction terms with block. These terms logically would only reflect random effects that are correctly treated as error. Therefore, the observational model for each rating becomes
<2>
52 These sources of variability are also referred to as facets of measurement. In this study, the facets of measurement that may be associated with error are the staff practices during the offering (true score), the rater, the day, and the two- and three-way interactions that result from combinations of these elements.
ordodordroord ey ++++++= )()( αγαβγβαµ
ordy
µ oα
rβ
dγ
or)(αβ
od)(αγ
rdb )( γ
ordb )( γα
dborbodborbdbrbobord ey )()()()()()( )()( +++++++= αγαβλγβαµ

Continuous Quality Improvement in Afterschool Settings
D-6
The equation to calculate reliability remains unaffected by the nested design as it mainly affects the standard errors for the variance estimates. However, the variance caused by differences between block becomes part of the error variance ( = 1 because each offering belongs to exactly one block and no
information is average across blocks).
<3>
Results The following data analyses using the Youth PQA Reliability Study dataset are based on the model assumption that all variables in the model are random variables. Consistent with this assumption, the variance decomposition approximately adds up to the total variance of the dependent variable. In a true mixed-effect model that includes fixed and random effects, the variance attributable to fixed effects would not be part of the reliability calculation. In the given dataset, the variable Day of Observation could be conceived of as a fixed effect if the two time points are not strictly randomly chosen but represent the beginning phase (within a reasonable time window) and the end of a program offering. In this case, the
expression would disappear from the denominator in <3> because the reliability would be
estimated for the true score variance holding Day of Observation constant (i.e., marginal means). This is related to the conceptual issue of whether ‘quality of an offering’ indicates the quality of a given day or the quality across the duration of the program-offering.
We estimated the variance components for the total scale using three different methods:
a) The MINQUE estimator (i.e., minimum norm quadratic unbiased estimator), which produces estimates that are invariant with respect to the fixed effects. If the data are normally distributed, this method is the most efficient estimator.
b) Interactive maximum likelihood (ML), which produces estimates that are most consistent with the observed data. These estimates can be biased. This method is asymptotically normal.
c) ANOVA Type III sum of squares estimator, which is most sensitive to misspecification of the model or more erratic findings due to small sample size.
For large samples, the three methods produce very similar results. The situation is different with the smaller sample in the Youth PQA Reliability Study, which explains the occasional negative estimate for small, non-significant variance components (see Table D-3). Note that negative variance components were set to zero for the calculation of the percentage of variance, which can cause the total percent of variance to exceed 100 (only for MINQUE and ANOVA). As table D-3 demonstrates, the variance decomposition for the total score does not vary substantially across estimators (MINQUE, ML, & ANOVA). We therefore focus discussion on the ML results because they did not produce negative variance estimates. As expected, program offering is the driving source of variation in the data while the main effects for Rater, Day, and Block contribute close to no variability to the total score. However, there is a large proportion of
oB
oo
e
ooo
o
DRDRB
yREL222222
2
2
)(σσσσσσ
σ
σ
αγγαββλα
α
++
++
++
=••
oD
22αγγ σσ +

D-7
variance explained by the interaction of Offering by Day. Conceptually, this means that the overall quality assessment appears to vary substantially between first and second observation day.53
Table D-3: Variance Decomposition for Total Score
MINQUE
ML
ANOVA III
Effect Variance % Variance % Variance %
Offering (within block) 0.13 34.23 0.15 40.88 0.13 36.07
Rater (within block) 0.01 1.50 0.00 0.00 0.00 0.71
Day 0.00 0.00 0.00 0.00 0.00 0.00
Block 0.04 11.18 0.00 0.00 0.03 8.20
Offering*Rater (within block) 0.04 10.74 0.05 12.89 0.04 11.28
Offering*Day (within block) 0.11 28.06 0.11 30.55 0.11 28.38
Residual 0.06 14.30 0.06 15.68 0.06 15.36
Sum 0.39 100.00 0.35 100.00 0.37 100.00
Reliability (offering) 0.50 0.62 0.53
SOURCE: Youth PQA Reliability Study – Offering Day Observation
Improving the reliability of program offering assessments The formula to calculate the reliability is helpful in projecting how reliability would change if the study design was altered or, in other words, how much the reliability would improve if more observers assessed the quality of a program offering or if observers visited more offerings on different days. This analysis appears in Table D-4. Given the small sample size for variance component analysis, this calculation is mainly for illustration. Nevertheless, this calculation is instructive because it documents that increasing the number of raters in most cases less to improve the reliability of the Staff Instructional Practices Total Score than adding multiple days of observation. This is a direct result of the variance attributable to the interaction of Offering by Day.
Table D-4: Effect of Number of Raters and Number of Program Offerings on Reliability for Total Score
Days per offering
# raters 1 2 4 6 8 10 1 0.41 0.53 0.63 0.67 0.69 0.70
2 0.48 0.62 0.72 0.76 0.78 0.80
4 0.52 0.72 0.78 0.82 0.84 0.86
6 0.54 0.69 0.80 0.84 0.87 0.88
8 0.55 0.70 0.81 0.85 0.88 0.89
10 0.69 0.80 0.81 0.86 0.89 0.90 SOURCE: Youth PQA Reliability Study – Offering Day Observation
53 Note that the full report for the Youth PQA Reliability Study contains variance decomposition analyses for each of the nine component scales. Please contact the Weikart Center for more information.

Continuous Quality Improvement in Afterschool Settings
D-8

APPENDIX E DETAILS ON INTERVENTION FIDELITY AND ESTIMATED TIME AND COST FOR THE YPQI
Continuous Quality Improvement in Afterschool Settings
E-2
Appendix E
Details on Intervention Fidelity and Estimated Time and Cost for the YPQI This appendix supports Chapter 3 and details the extent to which intervention group managers and staff participated in intervention supports and implemented continuous improvement practices. We also provide details supporting estimates of time and cost associated with full participation in the YPQI.
Manager and Staff Participation in YPQI Supports by Network and Overall Table E-1 details intervention group managers’ and staff members’ levels of participation in YPQI training and technical assistance. Two training sequences are represented in the table – the Youth Work Management and the Youth Work Methods series. The Youth Work Management series includes Youth PQA Basics, Planning with Data, and Instructional Coaching, all of which are full-day workshops. The Youth Worker Methods series includes ten 2- to 3-hour training modules, several of which were selected for delivery in each network during a Training Summit. Appendix A provides detailed description for all YPQI training content and coaching methods.
The table indicates whether or not managers and staff attended together or separately, for each network and for the overall intervention sample. Managers were encouraged to bring lead staff to the Youth PQA Basics workshop and to attend a Youth Work Methods Summit with their staff. Network A was the only network to achieve 100% participation in all elements of the YPQI.
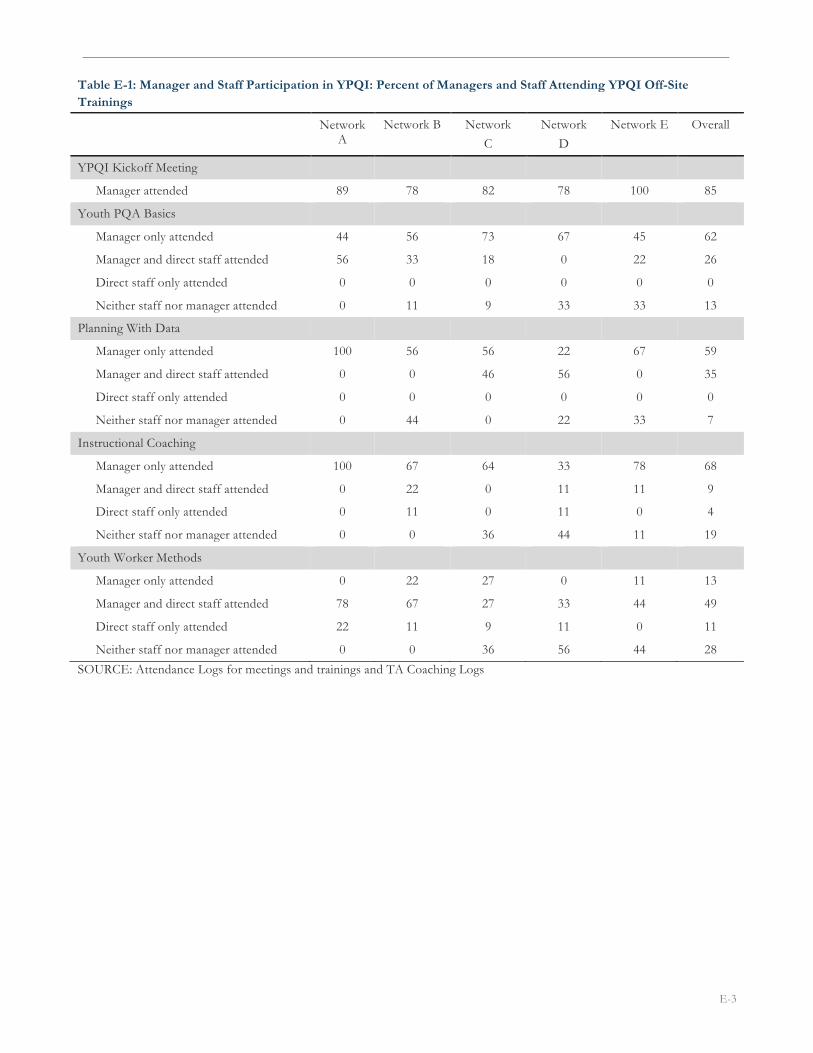
E-3
Table E-1: Manager and Staff Participation in YPQI: Percent of Managers and Staff Attending YPQI Off-Site Trainings
SOURCE: Attendance Logs for meetings and trainings and TA Coaching Logs
Network A
Network B Network C
Network D
Network E Overall
YPQI Kickoff Meeting
Manager attended 89 78 82 78 100 85
Youth PQA Basics
Manager only attended 44 56 73 67 45 62
Manager and direct staff attended 56 33 18 0 22 26
Direct staff only attended 0 0 0 0 0 0
Neither staff nor manager attended 0 11 9 33 33 13
Planning With Data
Manager only attended 100 56 56 22 67 59
Manager and direct staff attended 0 0 46 56 0 35
Direct staff only attended 0 0 0 0 0 0
Neither staff nor manager attended 0 44 0 22 33 7
Instructional Coaching
Manager only attended 100 67 64 33 78 68
Manager and direct staff attended 0 22 0 11 11 9
Direct staff only attended 0 11 0 11 0 4
Neither staff nor manager attended 0 0 36 44 11 19
Youth Worker Methods
Manager only attended 0 22 27 0 11 13
Manager and direct staff attended 78 67 27 33 44 49
Direct staff only attended 22 11 9 11 0 11
Neither staff nor manager attended 0 0 36 56 44 28
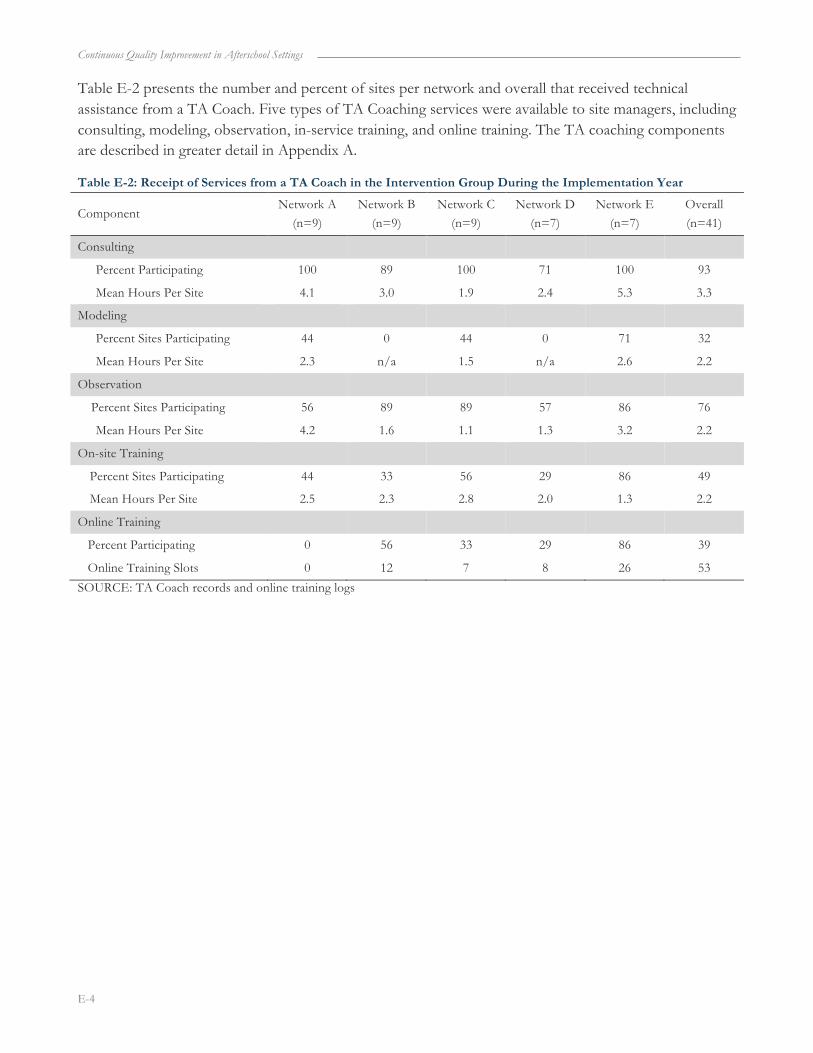
Continuous Quality Improvement in Afterschool Settings
E-4
Table E-2 presents the number and percent of sites per network and overall that received technical assistance from a TA Coach. Five types of TA Coaching services were available to site managers, including consulting, modeling, observation, in-service training, and online training. The TA coaching components are described in greater detail in Appendix A.
Table E-2: Receipt of Services from a TA Coach in the Intervention Group During the Implementation Year
Component Network A
(n=9) Network B
(n=9) Network C
(n=9) Network D
(n=7) Network E
(n=7) Overall (n=41)
Consulting
Percent Participating 100 89 100 71 100 93
Mean Hours Per Site 4.1 3.0 1.9 2.4 5.3 3.3
Modeling
Percent Sites Participating 44 0 44 0 71 32
Mean Hours Per Site 2.3 n/a 1.5 n/a 2.6 2.2
Observation
Percent Sites Participating 56 89 89 57 86 76
Mean Hours Per Site 4.2 1.6 1.1 1.3 3.2 2.2
On-site Training
Percent Sites Participating 44 33 56 29 86 49
Mean Hours Per Site 2.5 2.3 2.8 2.0 1.3 2.2
Online Training
Percent Participating 0 56 33 29 86 39
Online Training Slots 0 12 7 8 26 53
SOURCE: TA Coach records and online training logs

E-5
Implementation of Continuous Improvement Practices In this section, we provide additional information regarding the implementation of continuous improvement practices during the implementation year. Table E-3 displays the percentage of managers and staff implementing continuous improvement practices at different levels of fidelity.
Table E-3. Continuous Improvement Practices Implementation: Managers and Staff
Network A Network B Network C Network D Network E Overall
Manager Continuous Improvement Index
Imp N=9
Con N=8
Imp N=9
Con N=8
Imp N=10
Con N=8
Imp N=7
Con N=6
Imp N=7
Con N=7
Imp N=37
Con N=42
Percent implementing 0 practices 0 50 0 38 20 38 0 33 0 43 4 40
Percent implementing 1 practice
0 25 22 25 0 38 29 67 14 14 13 34
Percent implementing 2 practices 0 13 33 13 30 13 43 0 43 14 32 10
Percent implementing 3 practices
100 13 44 25 50 13 29 0 43 29 53 16
Network A Network B Network C Network D Network E Overall
Staff Continuous Improvement Index
Imp N=60
Con N=70
Imp N=33
Con N=27
Imp N=47
Con N=17
Imp N=19
Con N=18
Imp N=19
Con N=48
Imp N=177
Con N=180
Percent implementing 0 practices 5 16 12 15 17 24 26 22 5 13 13 18
Percent implementing 1 practice
13 30 24 15 26 24 16 44 21 33 20 29
Percent implementing 2 practices 28 29 39 26 26 41 37 28 16 25 29 30
Percent implementing 3 practices
35 10 6 41 17 6 16 0 32 19 21 15
Percent implementing 4 practices 18 16 18 4 15 6 5 6 26 10 17 8

Continuous Quality Improvement in Afterschool Settings
E-6
Table E-4 describes the manager and staff levels of participation in youth work methods related trainings during the baseline and implementation years. Table E-5 provides the percentage of managers and staff reporting that they used the Youth Program Quality Assessment at their site during the baseline and implementation years.
Table E-4. Manager and Staff Reports of Training Attendance at Youth Work Methods – Baseline and Implementation Years by Group
Staff Instructional Method Trainings - Score of 1 if the staff or manager attended at least one of the four trainings listed, and a score of 0 if the staff or manager attended none of the trainings
Baseline Implementation
Managers Staff Managers Staff
Int Con Int Con Int Con Int Con
Developmental Assets (Search Institute) 36 45 18 24 28 19 30 40
Advancing Youth Development (National Training Institute)
11 13 16 19 15 21 45 45
Bringing Yourself to Work (National Institute for Out-of-School Time)
15 4 10 14 21 9 40 40
HighScope Youth Work Methods or Youth PQA
24 11 18 18 88 10 61 24
SOURCE: Manager Program-Wide Survey & Staff Program-Wide Survey, baseline and implementation years (2006-08).
NOTES: Int = Intervention; Con = Control
Table E-5. Manager and Staff Reports of Youth PQA Use – Baseline and Implementation Years by Intervention Group
Baseline Implementation Managers Staff Managers Staff
Int Con Int Con Int Con Int Con Percent using the Youth PQA Form A 29 39 19 31 83 29 81 49
SOURCE: Manager Program-Wide Survey & Staff Program-Wide Survey, baseline and implementation years (2006-08).
NOTES: Int = Intervention; Con = Control
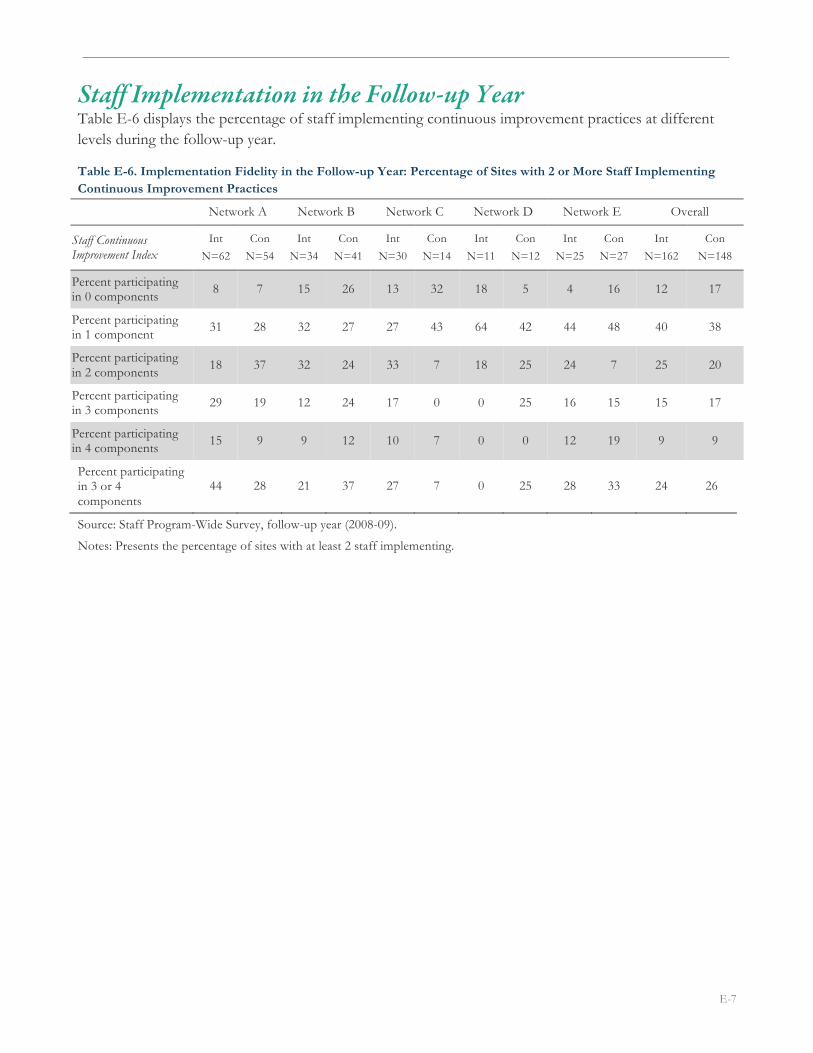
E-7
Staff Implementation in the Follow-up Year Table E-6 displays the percentage of staff implementing continuous improvement practices at different levels during the follow-up year.
Table E-6. Implementation Fidelity in the Follow-up Year: Percentage of Sites with 2 or More Staff Implementing Continuous Improvement Practices
Network A Network B Network C Network D Network E Overall
Staff Continuous Improvement Index
Int
N=62
Con
N=54
Int
N=34
Con
N=41
Int
N=30
Con
N=14
Int
N=11
Con
N=12
Int
N=25
Con
N=27
Int
N=162
Con
N=148
Percent participating in 0 components 8 7 15 26 13 32 18 5 4 16 12 17
Percent participating in 1 component 31 28 32 27 27 43 64 42 44 48 40 38
Percent participating in 2 components 18 37 32 24 33 7 18 25 24 7 25 20
Percent participating in 3 components 29 19 12 24 17 0 0 25 16 15 15 17
Percent participating in 4 components 15 9 9 12 10 7 0 0 12 19 9 9
Percent participating in 3 or 4 components
44 28 21 37 27 7 0 25 28 33 24 26
Source: Staff Program-Wide Survey, follow-up year (2008-09).
Notes: Presents the percentage of sites with at least 2 staff implementing.

Continuous Quality Improvement in Afterschool Settings
E-8
Estimated Time and Cost for the YPQI Table E-7 provides the estimated time commitment for a team of one site manager and three staff to fully participate in YPQI supports and to fully implement the intervention’s continuous improvement practices. Time estimates for participation in the intervention supports were derived from YPQI study records. Because the YPQI Study did not include measures of time to implement continuous improvement practices, these estimates were derived from subsequent YPQI demonstration projects in which site managers were asked to report time to implement the core practices. Estimates do not include the time necessary for carrying out the improvement plan for instruction delivered at the point of service. There are two reasons for this: (1) this process likely varies greatly from site to site, and (2) it is an intentional area for local adaptation within the YPQI model.
Table E-7. Time Estimates: Number of Hours Necessary for Full Participation in YPQI Supports and Full Implementation of Continuous Improvement Practices
Event Manager Lead staff Two additional staff Total
YPQI Kickoff Meeting 3 3 6
PQA Basics Training 4.5 4.5 9
Planning With Data Training 7 7 14
Self Assessment
Setup 2 1 2 5
Observations 1 0.5 1 2.5
Scoring meeting 2 1.5 3 6.5
Score submission 1 1
Finalize plan with team 2 1 2 5
Observation-Reflection 4 1 2 7
YPQI Kickoff Webinar 3 3 6
Youth Worker Methods Training 7 7 14 28
TA Coach
Visits 7 7 14
Phone/email/on-site advising 3 2 2 7
Miscellaneous 5 2 4 11
Total 51.5 40.5 30 122
SOURCE: Intervention supports estimates are from study records and validated with coordinators of these training workshops for YPQI. Continuous improvement estimates are based on survey and anecdotal data from clients in subsequent demonstrations of the YPQI.

E-9
Table E-8 provides detail regarding YPQI costs estimates. The table shows the cost components for training slots, TA Coaching, external assessment, and reports associated with participation in the study. Table E-8 does not include costs associated with staff time to either participate in YPQI supports or to implement continuous improvement practices.
Table E-8. Cost (in 2008 U.S. Dollars) of YPQI Intervention During Baseline and Implementation Years, Overall and by Support Category
Intervention Supports Details Per Site Unit Costs
Kickoff Meetings (incl. webinars)
• 2 Kickoffs (Baseline and Intervention Years)
• 2 Webinars
• 2 site staff/kickoff: $120/slot
• 2 site staff/webinar: $25/slot
Youth PQA-related training
• Online Youth PQA Basics
• Planning with Data
• Instructional Coaching
• 2 slots: $120/slot
• 1 team/site: $250/team
• 2 slots: $120/slot
Youth Work Methods training • 2 Day YWM Summits (6 workshop
offered each day) • 24 slots: $60/slot
Quality Advising and other on-demand technical assistance
• 10 hrs phone/email consulting
• 2 QA Visits, phone/email TA
• 10 hrs: $70/hour
• Quality Advising: $700/site
External Assessment • 2 baseline assessments
• 2 post assessments
• $800 ($400/assessment)
• $800 ($400/assessment)
Site-level reports • Reports for Planning with Data
• Year 3 Reports
• 2 Reports: $500
SOURCE: Weikart Center price list NOTES: hrs = hours; YWM = Youth Work Methods; QA = Quality Advising.

Continuous Quality Improvement in Afterschool Settings
E-10

APPENDIX F HYPOTHESIS TESTING AND ESTIMATION MODELS FOR EXPERIMENTAL AND NON-EXPERIMENTAL ANALYSES

Continuous Quality Improvement in Afterschool Settings
F-2
Appendix F
Hypothesis Testing and Estimation Methods for Experimental and Non-Experimental Analyses This appendix presents a priori and exploratory hypotheses and the estimation models used to test these hypotheses. Experimental findings are presented in Chapter 4 with supporting detail and tables in Appendices G, H, and I. Non-experimental findings are presented in Chapter 5 with detail and supporting tables in Appendix J.
Multiple Hypothesis Testing for the Impact Analyses This study includes five a priori hypotheses: one for manager improvement focus, one for manager enactment of continuous improvement practices, one for staff engagement in continuous improvement practice, and one for staff instructional quality and one for staff employment tenure. A priori hypotheses reflect the primary questions that the study was designed to address and for which statistical significance tests represent a powerful basis for drawing inferences. Because the study has a single primary hypothesis, that YPQI will improve the quality of instruction, we do not make additional adjustments for multiple hypothesis testing.54 Table F-1 summarizes a priori hypotheses for the overall study.
Table F-1. A priori and Exploratory Hypotheses for the YPQI Study
Hypotheses/Questions Outcome Measure Data Source Subgroup Type of Test
Assignment to the YPQI will cause increased manager focus on instruction.
Manager Improvement Focus Manager Survey Full Sample Confirmatory
Assignment to the YPQI will cause increased manager and staff continuous improvement practices.
Manager CI Practice Manager Survey Full Sample Confirmatory
Staff CI Practice Staff Survey Full Sample Confirmatory
Assignment to the YPQI will cause the quality of instructional practices to improve.
Total Score Staff Observation
Full Sample Confirmatory
Assignment to the YPQI will increase staff employment tenure? Staff 10 mo and 2 yr Staff Survey Full Sample Confirmatory
Experimental Estimation Models In this section we provide the estimation models for findings presented in Chapters 4 and 5 and Appendices G , H and J. The study’s research design was shaped specifically by our belief that manager, staff and youth turnover would be high both within each program year and, especially, across program years. For this reason, estimation models use aggregate pre-tests modeled at level 2 in the multilevel estimation models. Further, the change-over-time estimation models described in Chapter 5 are conducted at the site level using site-level means to link sites over time on aggregate levels of individual staff
54 This statement has one exception: We provide Bonferroni adjusted significance tests for the nine exploratory impact estimates for the scales making up the instructional quality total score in Table 4.5.

F-3
characteristics. The challenge of not being able to link cases (i.e., managers, staff, and youth) over time55 led us to believe that our pre-test measures (as level-2 aggregates) would explain relatively small amounts of variance; this consideration, in turn, influenced our decisions about the sample sizes necessary to achieve sufficient power.
Manager Continuous Improvement Practices In order to estimate the impact of assignment to the intervention group on Manager Continuous Improvement Practices, we used the equation provided in Figure F-1. This model was estimated using an OLS regression model.
Figure F-1. Experimental Impact Model: Manager Continuous Improvement Practices
Manager Continuous Improvement Practicesj = β0 + β1(Condition)j + β2(Mgr_Educ)j + β3(Enroll)j + β4(Dec_Make)j +
β5(Data_Coll)j + β6(NetA_Dummy)j + β7(NetC_Dummy)j + β8(NetD_Dummy)j + β9(NetE_Dummy)j + rj
Where: The outcome is the Manager Continuous Improvement Practices score for site j; Condition is an indicator variable coded 1 if the site is in the intervention group, 0 if the site is in the control group; Mgr_Educ is the manager’s education level; Enroll is the total youth enrollment at the site; Dec_Make is a continuous measure of the extent to which staff were involved in organizational decision-making; Data_Coll indicates the extent of staff involvement in data collection. NetA_Dummy is an indicator variable coded 1 if the site is in network A, 0 if the site is in another network; NetC_Dummy is an indicator variable coded 1 if the site is in network C, 0 if the site is in another network; NetD_Dummy is an indicator variable coded 1 if the site is in network D, 0 if the site is in another network; β 0 is the average Manager Continuous Improvement Practices score of
sites in the control group in network B (reference group) after controlling all other variables; β 1 is the intervention impact for sites; β 6 is the network impact for network A; β 7 is the network impact for network C; β 8 is the network impact for network D;
and β 9 is the network impact for network E.
In this model, networks (blocks) were modeled as fixed effects using four dummy variables. The estimated β0 + β1 represents the program impact for the intervention in Network B on Manager Continuous Improvement. The average of estimated impacts for the intervention across the five networks is denoted by β1. To test the contrast on the experimental condition term, we conducted a t-test to determine whether β1 differs from zero. The covariates included in the model include manager education, total youth enrollment in the program, and two scales that reflect organizational practices related to continuous improvement at baseline: staff input in decision making and staff experience in data collection (See Appendix H for details on these pre-test measures).
Staff Continuous Improvement Practices In order to estimate the impact of assignment to the intervention group on Staff Continuous Improvement Practices we used the equation provided in Figure F-2. This model was estimated as a two-level hierarchical model.
55 We expected that youth turnover would be even higher than staff levels, and therefore even more expensive to track, so we did not collect identifiers for our youth-level samples, again employing level-2 aggregate pre-tests in our estimation models.

Continuous Quality Improvement in Afterschool Settings
F-4
Figure F-2. Experimental Impact Model: Staff Continuous Improvement Practices
Staff-level Model (Level 1) Staff Continuous Improvement Practicesij = β0j + β1j(Stf_Educ) ij + rij Site-level Model (Level 2) β0j = γ00 + γ01(Condition)j + γ02(Mgr_Educ)j + γ03(W1_StaffCI)j + γ04(NetA_Dummy)j + γ05(NetC_Dummy)j + γ06(NetD_Dummy)j + γ07 (NetE_Dummy)j + u0j
Where: the outcome is the Staff Continuous Improvement Practices score for staff i in site j; Condition is a site-level indicator variable coded 1 if the site is in the intervention group, 0 if the site is in the control group; Stf_Educ indicates the staff’s education level; Mgr_Educ indicates the manager;s education level; W1_StaffCI is a baseline measure of staff continuous improvement practices; NetA_Dummy is a site-level indicator variable coded 1 if the site is in network A, 0 if the site is in another network; NetC_Dummy is a site-level indicator variable coded 1 if the site is in network C, 0 if the site is in another network; NetD_Dummy is a site-level indicator variable coded 1 if the site is in network D, 0 if the site is in another network; β 0j is the average Staff Continuous Improvement Practices score in program offering level after controlling all other variables and is estimated by the level-2 model; γ00 is the average Staff Continuous Improvement Practices score in the control
group in network B after controlling for staff education (grand mean centered); γ01 is the intervention impact at the site level;
γ04 is the network impact for network A at the site level; γ05 is the network impact for network C at the site level; γ06 is the network impact for network D at the site level; and γ07 is the network impact for network E at the site level.
In this model, networks (blocks) were modeled as fixed effects using four dummy variables. The average of estimated impacts for the intervention across the five networks (blocks) is denoted by γ01. To test the contrast on the experimental condition term, we conducted a t-test to determine whether γ01 differs from zero. The covariates included in the model include staff education, manager education, and a pre-test for staff continuous improvement practices at baseline (See Appendix H for details on these measures). The two error terms in the structure (rij at level 1 and u0j at level-2) reflect the “hierarchical” or “nested” structure of the data; that is, staff/offerings are nested within sites.

F-5
Staff Instructional Practices In order to estimate the impact of assignment to the intervention group on Staff Instructional Practices we used the equation in Figure F-3 for the Staff Instructional Practices Total score, using a two-level hierarchical model. Network (block) E was dropped from this model due to loss of data.
Figure F-3. Experimental Impact Model: Staff Instructional Practices
Program Offering-level Model (Level 1) Staff Instructional Practicesij = β0j + β1j(Art_Enr)ij + β2j(Life_Skl)ij + β3j(GR_4_5)ij +β4j(GR_6_8)ij + rij Site-level Model (Level 2) β0j = γ00 + γ01(Condition)j+ γ02(Pretest )j + γ03(NetA_Dummy)j + γ04(NetC_Dummy)j + γ05(NetD_Dummy)j + u0j
Where: the outcome is the Staff Instructional Practices score for offering i in site j; Art_Enr is a dichotomous variable, coded as 1 if the program offered arts & enrichment content (otherwise coded as 0); Life_Skl is a dichotomous variable, coded as 1 if the program offered life skills content (otherwise coded as 0); GR_4_5 is a dichotomous variable, coded as 1 if the program offering served youth in grades 4 and 5 (otherwise coded as 0); Gr_6_8 is a dichotomous variable, coded as 1 if the program served youth in grades 6-8 (otherwise coded as 0); Condition is a site-level indicator variable coded as 1 if the site is in intervention group, 0 if the site is in control group; Pretest is site-level baseline Staff Instructional Practices score; NetA_Dummy is a site-level indicator variable coded as 1 if the site is in network A, 0 if the site is in another network; NetC_Dummy is a site-level indicator variable coded as 1 if the site is in network C, 0 if the site is in another network; NetD_Dummy is a site-level indicator variable coded as 1 if the site is in network D, 0 if the site is in another network; β 0j is the average Staff Instructional Practices score at the offering level after controlling all other variables and is estimated by the level-2 model; γ00 is the average Staff Instructional Practices score for staff in the control group in network B after controlling
all other variables; γ01 is the intervention impact at the site level; γ03 is the network impact for network A at the site level; γ04 is the network impact for network C at the site level; and γ05 is the network impact for network D at the site level.
In this model, networks (blocks) were modeled as fixed effects using three dummy variables. The average of estimated impacts for the intervention across the four networks is denoted by γ01. The covariates included in the model include site-level baseline Staff Instructional Practices scores, as well as offering characteristics that describe age of youth participating (youth in grades 4 & 5, grades 6-8, or high school) and content of the program offering (Arts & Enrichment, Life Skills, or all other content). The two error terms in the structure (rij at level 1 and u0j at level-2) reflect the “hierarchical” or “nested” structure of the data; that is, staff/offerings are nested within sites.
Effects by Network and Tests for Heterogeneity of Impact Between Networks In order to estimate the impact of assignment to the intervention group for each outcome variable for each network, we used the equations provided in Figures F-1, F-2 and F-3 but with the following modifications: we (a) removed the intercept in the level-2 model, (b) included an extra dichotomous variable for the reference condition (replacing the intercept in original model), and (c) added a set of network-by-condition interaction terms for all networks. These models were estimated as a two-level hierarchical model. Figure F-4 provides the “by-network” estimation model for the Staff Instructional Practices as an example.

Continuous Quality Improvement in Afterschool Settings
F-6
Figure F-4. Experimental Impact by Networks Model: Staff Instructional Practices
Offering-level Model (Level 1) Staff Instructional Practicesij = β0j + β1j(Art_Enr)ij + β2j(Life_Skl)ij + β3j(GR_4_5)ij +β4j(GR_6_8)ij + rij Site-level Model (Level 2) β0j = γ01(Pretest)j + γ02(NetA_Dummy)j + γ03(NetB_Dummy)j + γ04(NetC_Dummy)j + γ05(NetD_Dummy)j + γ06(NetA_Dummy)*(Condition)j + γ07(NetB_Dummy)*(Condition)j + γ08(NetC_Dummy)*(Condition)j +
γ09(NetD_Dummy)*(Condition)j + u0j
Where: the outcome is the Staff Instructional Practices score for program offering i in site j; Art_Enr is a dichotomous variable, coded as 1 if the program offered arts & enrichment content (otherwise coded as 0); Life_Skl is a dichotomous variable, coded as 1 if the program offered life skills content (otherwise coded as 0); GR_4_5 is a dichotomous variable, coded as 1 if the program offering served youth in grades 4 and 5 (otherwise coded as 0); Gr_6_8 is a dichotomous variable, coded as 1 if the program served youth in grades 6-8 (otherwise coded as 0); NetA_Dummy is a site-level indicator variable coded 1 if the site is in network A, 0 if the site is in another network; NetB_Dummy is a site-level indicator variable coded 1 if the site is in network B, 0 if the site is in another network; NetC_Dummy is a site-level indicator variable coded 1 if the site is in network C, 0 if the site is in another network; NetD_Dummy is a site-level indicator variable coded 1 if the site is in network D, 0 if the site is in another network; NetA_Dummy*Condition is a site-level indicator variable coded 1 if the site is in the intervention group and also in network A and 0 otherwise; NetB_Dummy*Condition is a site-level indicator variable coded 1 if the site is in the intervention group and also in network B and 0 otherwise; NetC_Dummy*Condition is a site-level indicator variable coded 1 if the site is in the intervention group and also in network C and 0 otherwise; NetD_Dummy*Condition is a site-level indicator variable coded 1 if the site is in the intervention group and also in network D and 0 othewise; β 0j is the average Staff Instructional Practices score at the offering level after controlling all other variables and is estimated by the level-2 model; γ02 is the network impact for network A at the site level; γ03 is the network impact for
network B at the site level; γ04 is the network impact for network C at the site level; γ05 is the network impact for network D at the site level; γ06 is the intervention impact for network A at the site level; γ07 is the intervention impact for network B at the site
level; γ08 is the intervention impact for network C at the site level; and γ09 is the intervention impact for network D at the site level.
The estimates for γ06, γ07, γ08, and γ09 represent the program impact for the intervention by the corresponding network on Staff Instructional Practices. To test the program impact for the intervention by networks, we conducted t-tests to determine whether γ06, γ07, γ08, and γ09 differ from zero. The covariates included in the model include site-level baseline Staff Instructional Practices scores as well as offering characteristics that describe age of youth participating (youth in grades 4 & 5, grades 6-8, or high school) and content of the offering (Arts & Enrichment, Life Skills, or all other content). The two error terms in the structure (rij at level 1 and u0j at level-2) reflect the “hierarchical” or “nested” structure of the data; that is, staff/offerings are nested within sites.
To test for heterogeneity between impact estimates for the individual networks, we employed an omnibus test of the hypothesis that differences between the network impact estimates were not different from zero. See discussion of results in Appendices G and H. The omnibus test was conducted using the Gamma constraint in the HLM software package.
Non-Experimental Estimation Models In this section, we describe the estimation models used in Chapter 5. First, we describe the two-step instrumental variables (IV) approach and models used to estimate the association between YPQI implementation and instructional quality. Next, we present a sample growth model used to estimate change over time in the level of YPQI implementation.

F-7
Estimation Models for the IV Analyses In order to estimate the impact of Staff Continuous Improvement Practices on Staff Instructional Practices, we used an IV analysis approach with two steps.56 We first estimated predicted values for the Staff Continuous Improvement practices using experimental condition as an instrumental variable. Second, we used these predicted values as a disattenuated predictor for the Staff Instructional Practices Total score. By producing predicted values for staff continuous improvement using condition as an instrumental variable, and with additional covariates, we purge the Staff Continuous Improvement Practices score of error variance related to differential receipt of the intervention (Gennetian, Morris, Bos, & Bloom, 2005, p. 89) due to factors such as selection bias. Randomized treatment assignment is an ideal instrument because it is related to treatment receipt (defined as staff engagement in continuous improvement practices) but related to staff instructional practices only through staff engagement in continuous improvement practices.
Figure F-5 and F-6 present the model used to disattenuate the Staff Continuous Improvement Practices variable, using experimental condition as an instrument. Following the estimation of predicted values for the Staff Continuous Improvement score through the model described in Figure F-5 (step 1), we simply replaced the condition variable with the predicted values for Staff Continuous Improvement; see Figure F-5 (step 2). Regression results for these estimation models are presented in Chapter 5 and Section II of Appendix J.57
In the model in Figure F-5, networks were modeled as fixed effects where γ 00 is the average Staff Continuous Improvement Practices score in control group in Network B after controlling all other variables and γ 02, γ 03, and γ 04 are the differences in staff CI practices between the respective networks and those in Network B; β 0j is the average Staff Continuous Improvement Practices score at the site level after controlling all other variables and is the outcome in the level 2 model; γ 01 is the intervention effect at the site level; γ 05 is the estimated coefficient of staff CI practices pretest; γ 06 is the estimated coefficient of the staff instructional practices pre-test; and γ 07, γ 08, γ 09, γ 10, γ 11, γ 12, γ 13, and γ 14 are the estimated coefficients for the respective covariates.
56 This analytic approach is based on a discussion in Gennetian, Morris, Bos, and Bloom (2005). 57 We conducted a parallel analysis using two-stage least squares (2SLS) in Statistical Analysis System (SAS). Estimates for the Staff Continuous Improvement practices score as a predictor of Staff Instructional practices were nearly the same as those presented in Table 5.1 (B=0.77, SE=0.49) but non-significant (p=.126).

Continuous Quality Improvement in Afterschool Settings
F-8
Figure F-5. Instrumental Variables Analysis Step 1
Staff-level Model (Level 1) Staff Continuous Improvement practicesij = β0j + rij Site-level Model (Level 2) β0j = γ00 + γ01 (Condition)j + γ02 (NetA_Dummy)j + γ03 (NetC_Dummy)j + γ04 (NetD_Dummy)j + γ05 (StaffCI_Pretest)j + γ06
(StaffIns_Pretest)j + γ07 (W1_SharedControl)j + γ08(W1_Enrollment)j + γ09(StaffEduc)j + γ10(ManagerTurnover)j + γ11(Art_Enr)j + γ12(Life_Skl)j + γ13(GR_4_5)j + γ14(GR_6_8)j + u0j Where: the outcome is the Staff Continuous Improvement Practices score for offering i in site j; Condition is a site-level indicator variable coded 1 if the site is in intervention group, 0 if the site is in control group; NetA_Dummy is a site-level indicator variable coded 1 if the site is in network A, 0 if the site is in another network; NetC_Dummy is a site-level indicator variable coded 1 if the site is in network C, 0 if the site is in another network; NetD_Dummy is a site-level indicator variable coded 1 if the site is in network D, 0 if the site is in another network; StaffCI_Pretest is a site-level indicator of baseline staff continuous improvement practices; StaffIns_Pretest is a site-level indicator of baseline staff instructional practices; W1_SharedControl is a site-level indicator of baseline shared control; W1_Enrollment is a site-level indicator of total youth enrollment in the program; StaffEduc is an aggregated site-level variable derived from the offering-level staff education variable; ManagerTurnover is a site-level indicator variable coded =1 if there was supervisor turnover from year 1 to year 2 and 0 otherwise; Art_Enr is an aggregated site-level variable derived from the offering-level arts and enrichment dummy variable; Life_Skl is an aggregated site-level variable derived from the offering-level life skills content variable; GR_4_5 is an aggregated site-level variable derived from the offering-level grades 4-5 dummy variable; GR_6_8 is an aggregated site-level variable derived from the offering-level grade 6 through 8 dummy variable.
Figure F-6. Instrumental Variables Analysis Step 2
Offering-level Model (Level 1) Staff Instructional Practicesij = β0j + β1j(Art_Enr)ij + β2j(Life_Skl)ij + β3j(GR_K_5)ij + β4j(GR_6_8)ij + rij Site-level Model (Level 2) β0j = γ00 + γ01(Condition)j+ γ02(NetA_Dummy)j + γ03(NetC_Dummy)j + γ04(NetD_Dummy)j + γ05 (StaffCI_Pretest)j + γ06 (StaffIns_Pretest)j + γ07 (W1_SharedControl)j + γ08(W1_Enrollment)j + γ09(StaffEduc)j + γ010(ManagerTurnover)j +
γ011(INSTRUMENT)j + u0j
Where: the outcome is the Staff Instructional Practices score for offering i in site j; Art_Enr is an aggregated site-level variable derived from the offering-level arts and enrichment dummy variable ; Life_Skl is an aggregated site-level variable derived from the offering-level life skills dummy variable ; GR_K_5 is an aggregated site-level variable derived from the offering-level grades K-5 dummy variable ; GR_6_8 is an aggregated site-level variable derived from the offering-level grade 6t to 8t dummy variable ; Condition is a site-level indicator variable coded 1 if the site is in the intervention group, 0 if the site is in the control group; NetA_Dummy is a site-level indicator variable coded 1 if the site is in network A, 0 if the site is in another network; NetC_Dummy is a site-level indicator variable coded 1 if the site is in network C, 0 if the site is in another network; NetD_Dummy is a site-level indicator variable coded 1 if the site is in network D, 0 if the site is in another network; StaffCI_Pretest is a site-level indicator of baseline staff continuous improvement practices; StaffIns_Pretest is a site-level indicator of baseline staff instructional practices; W1_SharedControl is a site-level indicator of baseline shared control; W1_Enrollment is a site-level indicator of total youth enrollment in the program; StaffEducis an aggregated site-level variable derived from the offering-level staff education variable; ManagerTurnover is a site-level indicator variable coded 1 if there was supervisor turnover from year 1 to year 2 and 0 otherwise; INSTRUMENT is the disattenuated score for Staff Continuous Improvement Practices.

F-9
In the model in F-6, networks were modeled as fixed effects where γ 00 is the average Staff Instructional Practices score for the control group in Network B after controlling all other variables, and γ 01, γ 02, and γ 03
are the differences in staff CI practices between the respective networks and those in Network B; β 0j is the average Staff Continuous Improvement Practices score at the site level after controlling all other variables and is the outcome in the level-2 model; γ 01 is the intervention effect at the site level; γ 05 is the estimated coefficient for the staff continuous improvement practices pre-test; γ 06 is the estimated coefficient for the staff instructional practices pre-test; and γ 07, γ 08, γ 09, and γ 010 are the estimated coefficients for the covariates.
Estimation Methods for Follow-up Year Growth Analyses In this section, we describe the growth models used to estimate change in implementation between the baseline year and the end of the follow-up year. Growth models were estimated for three outcomes: Manager Improvement Focus, Staff Continuous Improvement Practices, and Staff Short-Term Tenure. Outcomes for these models are described in Chapter 2. These models were identical with the exception of the outcome measures. Detailed description of the Manager Improvement Focus is provided here as an example.
Figure F-7. Manager Improvement Focus Growth Model
Level 1 Model Yj Manager Focus = β0j + β1 (Time 1 Dummy) j + β2 (Time 2 Dummy) j + β3 (Network A Dummy) j + β4 (Network C Dummy) j + β5 (Network D Dummy) j + β6 (Network E Dummy) + rj Where: the outcome is the log odds of observing the response (Manager Improvement Focus indicates whether reported improvement foci included instructional practices) score for site j; Time 1 Dummy is an indicator variable coded 1 for implementation year, 0 if it is not implementation year; Time 2 Dummy is an indicator variable coded 1 for follow-up year, 0 if it is not follow-up year; Network A Dummy is an indicator variable coded 1 if the site is in network A, 0 if the site is in another network; Network C Dummy is an indicator variable coded 1 if the site is in network C, 0 if the site is in another network; Network D Dummy is an indicator variable coded 1 if the site is in network D, 0 if the site is in another network; Network E Dummy is an indicator variable coded 1 if the site is in network E, 0 if the site is in another network; β 0 is the average Manager Improvement Focus score for sites in the baseline year in Network B after controlling all other variables; β 1 is the Time 1 impact for sites; β 2 is the Time 2 impact for sites; β 3 is the network impact for Network A; β 4 is the network impact for Network C; β 5 is the network impact for Network D; and β 6 is the network impact for Network

Continuous Quality Improvement in Afterschool Settings
F-10
APPENDIX G DETAILS ON COVARIATES AND SUPPORTING IMPACT TABLES FOR MANAGER AND STAFF CONTINUOUS IMPROVEMENT PRACTICES

Continuous Quality Improvement in Afterschool Settings
G-2
Appendix G
Details on Covariates and Supporting Impact Tables for Manager and Staff Continuous Improvement Practices In this appendix, we offer additional information to support the impact findings for manager and staff continuous improvement practices presented in Chapter 4. The appendix is divided into three sections. The first presents unadjusted means for the continuous improvement outcome measures overall and by network for the intervention and control groups. The second describes the covariates used in the final impact models. Finally, we provide impact estimates by network for each of the continuous improvement practice measures.
Unadjusted Mean Outcomes by Group, Baseline and Implementation Year Table G-1 provides the unadjusted means for Manager Continuous Improvement Practices during the implementation year. No baseline data were collected on this measure so we only present scores for the end of the implementation year. Items and psychometric details for this outcome measure are provided in Appendix C. Note that Network A site managers in the intervention group achieved 100% implementation of the three continuous improvement practices, suggesting that it is possible to fully implement continuous improvement practices across a network of sites.
Table G-2 provides unadjusted means for the Staff Continuous Improvement Practices scores for the intervention and control groups at baseline and the end of the implementation year. Items and psychometric details for this outcome measure are provided in Appendix C. Two areas of Table G-2 are worth particular attention. First, the network with the highest overall level of staff continuous improvement practices and the greatest overall change from baseline to end of implementation year was network E. Due to data loss, however, this network was excluded from impact analyses for staff instructional practices. Second, Table G-2 demonstrates the presence of “defiers” in Network B (i.e., control sites who implemented YPQI-like practices), which contributes to the null intervention effect for staff continuous improvement practices in Network B.

G-3
Table G-1. Unadjusted Manager Continuous Improvement Practice Scores for the Implementation Year, Overall, and by Network
Manager Continuous Improvement: Implementation Year
Intervention Control
Overall 0.84
(n=42)
0.48 (n=43)
Network A
1.00 (n=9)
0.46 (n=10)
Network B
0.83 (n=9)
0.53 (n=9)
Network C
0.79 (n=8)
0.40 (n=10)
Network D
0.79 (n=7)
0.37 (n=7)
Network E
0.78 (n=7)
0.60 (n=9)
SOURCE: Manager Program-Wide Survey, implementation year (2007-08).
Table G-2. Unadjusted Staff Continuous Improvement Practices Scores for the Baseline and Implementation Years, Overall, and by Network
Staff Continuous Improvement Practices:
BaselineYear
Staff Continuous Improvement Practices: Implementation Year
Intervention Control Intervention Control
Overall
0.52 (n=255)
0.58 (n=178)
0.68 (n=167)
0.58 (n=172)
Network A
0.51 (n=99)
0.57 (n=43)
0.76 (n=56)
0.58 (n=67)
Network B
0.46 (n=40)
0.50 (n=42)
0.60 (n=31)
0.69 (n=24)
Network C
0.57 (n=60)
0.61 (n=28)
0.63 (n=45)
0.48 (n=17)
Network D
0.42 (n=29)
0.58 (n=15)
0.60 (n=18)
0.40 (n=16)
Network E
0.61 (n=27)
0.64 (n=50)
0.79 (n=17)
0.61 (n=48)
SOURCE: Staff Program-Wide Survey, implementation year (2007-08).

Continuous Quality Improvement in Afterschool Settings
G-4
Covariates in the Manager and Staff Continuous Improvement Impact Models This section describes the baseline covariates included in the impact models. Covariates were included to improve precision of estimates and because they represent important areas of capacity in afterschool programs related to human, financial, and organizational resources. Manager Education and Staff Education were collected on the manager and staff baseline surveys and are described in Chapter 2, Table 2.6. Total Youth Enrollment at the site is a continuous variable reported at baseline on the manager interview, ranging between 12 and 4300 (M = 216; SD = 456.10). Staff Input in Decision Making and Staff Involvement in Data Collection and Use were collected on the manager and staff surveys at baseline. These scales are employed as an approximate pre-test for the manager continuous improvement models because they parallel items in the outcome measure. Detail for these scales is provided Table G-3 below.
Table G-3. Staff Survey Measures Used as Pre-tests in the Manager Continuous Improvement Practice Impact Model
M SD
Staff Input in Decision-Making (α =.80) Please respond to the following statements by circling the number that most nearly represents how often each item is true for you: [1=Rarely true, 3=Sometimes true, 5=Always true]
3.48 1.01
I am regularly involved in making decisions that affect our program
I regularly have an active role in planning about our program
I have a significant role in shaping the program’s norms, values, and practices
Staff Involvement in Data Collection and Use (α = .88) In reference to your current program, how often have you: [1=never, 2=once, 3=two or more times]
1.87
0.72
Conducted observation to assess program quality
Collected written anecdotal records of what happens during sessions with youth
Conducted program planning based on assessment data
Prepared presentations based on data from your program
Used data to set program improvement goals
Sample Size: N=460 staff SOURCE: Staff Program-Wide Survey, baseline year (2006-07).
Individual Network Impact Estimates for Manager and Staff Continuous Improvement Practices In this section we present by-network impact estimates for both the Manager Continuous Improvement Practices and Staff Continuous Improvement Practices scores. Models used to estimate impact are described in Appendix F.

G-5
Manager Continuous Improvement Practices Table G-4 presents individual network impact estimates for Manager Continuous Improvement Practices. Although small sample sizes for the individual networks reduce the statistical power of significance tests, all impact estimates are positive and the effects calculated for Networks A and D were large enough to achieve statistical significance at the p < .05 level.58
In the general linear model (GLM) used to estimate findings in this table, a test for heterogeneity of effects by network was conducted. Results of this test indicate that the size of effects for individual networks are not significantly different from each other. Although some of the individual networks achieved effect sizes significantly different from zero (p < .05), this omnibus test suggests that, taken as a group of individual estimates, the intervention produced effects of similar magnitude across the individual networks.
Table G-4. Estimated Impact on Manager Continuous Improvement Practices, by Network
Intervention Control Impact Effect Size of Impacta
Statistical Significance of Impact (p-value)
Network A Effect 0.96 0.48 0.48* 1.49 .003
Network B Effect 0.77 0.55 0.22 0.69 .16
Network C Effect 0.76 0.49 0.27 0.82 .10
Network D Effect 0.74 0.23 0.51* 1.59 .02
Network E Effect 0.83 0.67 0.16 0.49 .37 Sample Size: 79 managers (8 missing cases) SOURCE: Manager Program-Wide Survey, implementation year (2007-08).
aEffect size calculated by taking Impact/Pooled SD of Control Group
Staff Continuous Improvement Practices Table G-5 presents by-network impact estimates for Staff Continuous Improvement Practices. Although small sample sizes for the individual networks dramatically reduce the power of significance tests, the effects for Network A was large enough to achieve statistical significance at the p < .05 level and the effect for Network D was marginally significant (p< .1). Notably, impact estimates are positive for all networks except for Network B.
In the hierarchical linear model (HLM) used to estimate findings in this table, a Gamma test for heterogeneity of effects by network was conducted. Results of this test indicate that the sizes of the effects for the individual networks were significantly different from each other. Specifically, the effect size for Network B appears to be different from all other networks (see discussion in Chapter 4). We removed Network B from the data set and conducted a second omnibus test for differences of impact and found none. This suggests that Network B is an outlier for this outcome and leads us to believe that the YPQI produced homogeneous effects across the other networks. See further discussion of Network B impact estimates for the Staff Continuous Improvement Practices score in Chapter 4.
58 In addition, Network C effects are significant at the p < .05 level if using a one-tailed rather than a two-tailed test.

Continuous Quality Improvement in Afterschool Settings
G-6
Table G-5. Estimated Impact on Staff Continuous Improvement Practices, by Network, all Networks Intervention Control Impact Effect Size of
Impacta Statistical Significance
of Impact (p-value)
Network A Effect 0.76 0.47 0.29* 1.03 .001
Network B Effect 0.66 0.69 -0.03 -0.09 .77
Network C Effect 0.62 0.49 0.13 0.46 .19
Network D Effect 0.64 0.42 0.22 0.79 .07
Network E Effect 0.70 0.58 0.12 0.44 .27
Sample Size: 71 sites and 330 staff (17 omitted level 2 cases; 39 omitted level 1 cases). SOURCE: Staff Program-Wide Survey, implementation year (2007-08). NOTES: aEffect size calculated by taking Impact/√(SigmaSq.+Tau of Control Group) controlling for Staff Education and adjusted for blocking.

APPENDIX H DETAILS ON COVARIATES AND SUPPORTING IMPACT TABLES FOR STAFF INSTRUCTIONAL PRACTICES
Continuous Quality Improvement in Afterschool Settings
H-2
Appendix H
Details on Covariates and Supporting Impact Tables for Staff Instructional Practices This appendix supports the impact findings for the quality of staff instruction outcome described in Chapter 4. The appendix is divided into three sections. First, we provide detail pertaining to covariates used in the impact models. Next, we present unadjusted means for the instructional practice outcome measures. Finally, we provide tables with impact estimates for the four individual networks on each of the instructional practice measures. The models used to estimate impact findings presented in Chapter 4 and this appendix are provided in Appendix F.
Covariates in the Instructional Practices Models Because randomization effectively equated groups at baseline, and because the YPQI study had relatively low sample attrition, our goal for final impact models was simplicity and parsimony. While the final model included the baseline level of the outcome measure (pre-test), program-offering content, and age of youth participating in the offering; several additional covariates were tested and omitted if they did not exhibit statistical significance in the models. Omitted variables included child characteristics (i.e., gender and social-emotional functioning), staff characteristics (i.e., gender, age, and education level), and organizational characteristics (i.e., manager education, total site enrollment, and baseline continuous improvement practices).
Program-offering content was included in the models because this characteristic of offerings has demonstrated modest but significant association with instructional quality in other samples (Akiva, Cortina, & Smith, under review; Smith et al., 2010). Program-offering content was captured by external assessors who were instructed to write a “brief description of the program offering” as a qualitative text note on the observation form. Coders reviewed this content description for each offering and assigned a content code using the coding scheme provided in Figure H-1. Disagreements between coders were resolved through additional discussion to achieve consensus.
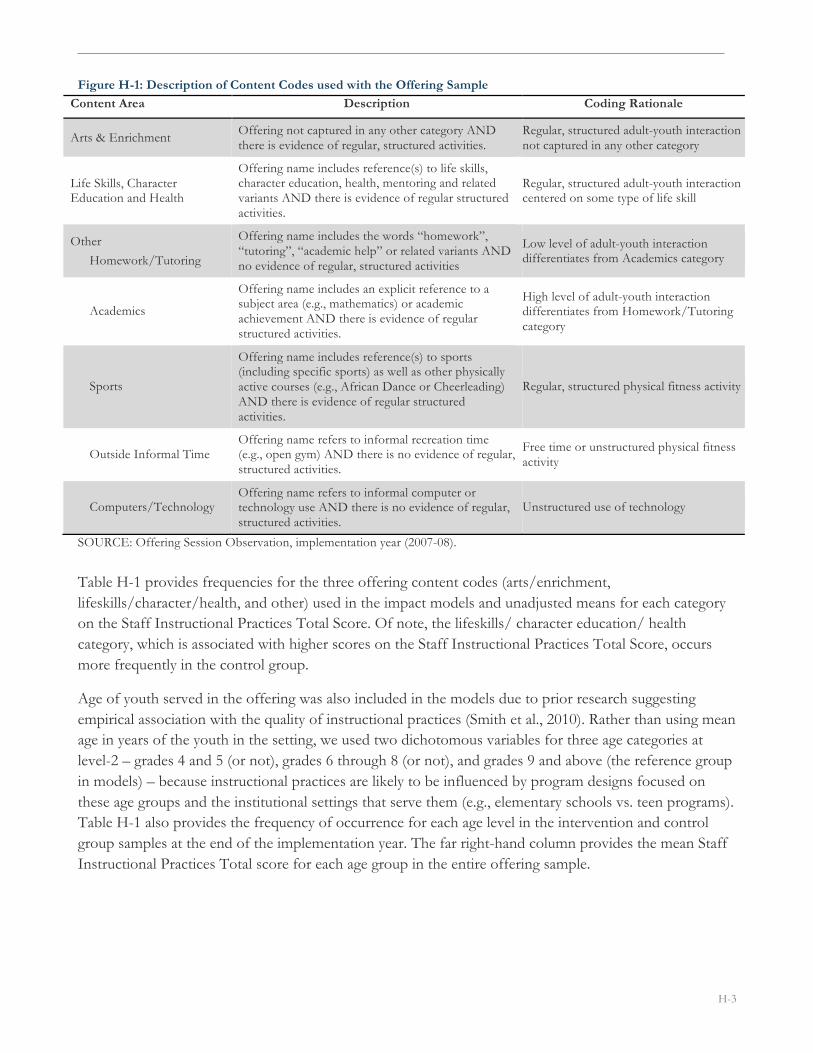
H-3
Figure H-1: Description of Content Codes used with the Offering Sample Content Area Description Coding Rationale
Arts & Enrichment Offering not captured in any other category AND there is evidence of regular, structured activities.
Regular, structured adult-youth interaction not captured in any other category
Life Skills, Character Education and Health
Offering name includes reference(s) to life skills, character education, health, mentoring and related variants AND there is evidence of regular structured activities.
Regular, structured adult-youth interaction centered on some type of life skill
Other Homework/Tutoring
Offering name includes the words “homework”, “tutoring”, “academic help” or related variants AND no evidence of regular, structured activities
Low level of adult-youth interaction differentiates from Academics category
Academics
Offering name includes an explicit reference to a subject area (e.g., mathematics) or academic achievement AND there is evidence of regular structured activities.
High level of adult-youth interaction differentiates from Homework/Tutoring category
Sports
Offering name includes reference(s) to sports (including specific sports) as well as other physically active courses (e.g., African Dance or Cheerleading) AND there is evidence of regular structured activities.
Regular, structured physical fitness activity
Outside Informal Time Offering name refers to informal recreation time (e.g., open gym) AND there is no evidence of regular, structured activities.
Free time or unstructured physical fitness activity
Computers/Technology Offering name refers to informal computer or technology use AND there is no evidence of regular, structured activities.
Unstructured use of technology
SOURCE: Offering Session Observation, implementation year (2007-08).
Table H-1 provides frequencies for the three offering content codes (arts/enrichment, lifeskills/character/health, and other) used in the impact models and unadjusted means for each category on the Staff Instructional Practices Total Score. Of note, the lifeskills/ character education/ health category, which is associated with higher scores on the Staff Instructional Practices Total Score, occurs more frequently in the control group.
Age of youth served in the offering was also included in the models due to prior research suggesting empirical association with the quality of instructional practices (Smith et al., 2010). Rather than using mean age in years of the youth in the setting, we used two dichotomous variables for three age categories at level-2 – grades 4 and 5 (or not), grades 6 through 8 (or not), and grades 9 and above (the reference group in models) – because instructional practices are likely to be influenced by program designs focused on these age groups and the institutional settings that serve them (e.g., elementary schools vs. teen programs). Table H-1 also provides the frequency of occurrence for each age level in the intervention and control group samples at the end of the implementation year. The far right-hand column provides the mean Staff Instructional Practices Total score for each age group in the entire offering sample.

Continuous Quality Improvement in Afterschool Settings
H-4
Table H-1: Characteristics of the Offering Sample: Content and Age of Youth
Point-of-Service Setting
Percent of intervention
offerings (N=81)
Percent of control
offerings (N=70)
p-value for test of
experimental difference
Mean for Instructional
Practices Total Score
Content Area (percent of offerings)
Arts & Enrichment 42.0 40.9 .90a 3.50
Life Skills, Character Education, and Health 13.0* 33.3 .005a 3.78
Other 27.9 34.9 .37a 3.46
Youth Age Level
Elementary 41.6 58.4 .19b 3.55
Middle School 55.1 44.9 .82b 3.59
High School 60.9 39.1 .48b 3.71
SOURCE: Offering Session Observation, implementation year (2007-08). NOTES: a Significance tests were conducted using an independent samples t-test. b Significance tests were conducted using a Chi-Square test.
Unadjusted Mean Outcomes by Group, Baseline, and Implementation Years In this section we provide unadjusted mean outcome scores for staff instructional quality measures. Table H-2 provides unadjusted scores for the Staff Instructional Practices Total score by group for each network at each available time point. Two observations are notable. First, in Table H-2 we present the limited data on instructional practice that we have for Network E (N=9 ratings, 7 intervention and 2 control). The Instructional Practices Total score for Network E declines for programs in both experimental conditions, which may be due to some historical or other outside factor that led all quality scores in that network to decline during the implementation year. However, the decline is much smaller for the intervention group than for the control group, suggesting that there was likely a positive intervention effect in Network E. Second, in Network B, the control group score for the implementation year is the lowest mean score in the entire sample. This is likely an influential source of the large impact estimates for Network B (presented in the next section with Table H-4).

H-5
Table H-2: Staff Instructional Practices Total Score: Unadjusted Means by Network and Intervention Group for Baseline and Implementation Year
Network A Network B Network C Network D Network E
Int Con Int Con Int Con Int Con Int Con
Baseline Year 3.31 3.28 3.41 3.13 3.28 3.42 3.48 3.27 4.48 4.59
Implementation Year 3.78 3.42 3.34 2.93 3.64 3.75 3.62 3.45 4.32 3.89
SOURCE: Offering Session Observation, implementation year (2007-08). NOTE: Baseline scores are calculated in a slightly different way from implementation year scores – not all items used to calculate the total scores were available at both waves of data collection. Int = Intervention Group; Con = Control Group.
Individual Network Impact Estimates for Staff Instructional Practices Tables H-3 through H-12 provide impact estimates by network for the Staff Instructional Practices Total Score (Table H-3) and the component scales of the Total Score (Table H-4 through H-12). The hierarchal linear models (HLM) used to estimate the by-network impacts are described in Appendix F. Small sample sizes for the individual networks reduce the statistical power of significance tests.
In the multilevel model used to produce by-network impact estimates for the Staff Instructional Practices Total score in Table H-4, a test for heterogeneity of effects by network was conducted. Results of this test indicate that differences between the individual networks were not significantly different from zero. Although Networks A and B demonstrated impact estimates that are statistically significantly different from zero (p < .05), this omnibus test suggests that, taken as a group of individual estimates, the intervention produced effects of similar magnitude across the individual networks that were not statistically significantly different from each other. All by-network impact estimates are positive.
Table H-3: Individual Network Impact Estimates for Staff Instructional Practices Total Score
Intervention Control Impact Effect Size of Impacta
Statistical Significance of Impact (p-value)
Network A 3.92 3.51 0.41* 0.73 0.03
Network B 3.35 2.84 0.51* 0.91 0.01
Network C 3.72 3.65 0.07 0.12 0.70
Network D 3.55 3.30 0.25 0.44 0.30
SOURCE: Offering Session Observation, implementation year (2007-08). NOTES: Effect size calculated by taking Impact/SD of Control Group

Continuous Quality Improvement in Afterschool Settings
H-6
Table H-4: Individual Network Impact Estimates for the Staff Disposition Scale Intervention Control Impact Effect Size of
Impact Statistical Significance
of Impact (p-value)
Network A 4.85 4.72 0.13 0.16 0.68
Network B 4.19 3.67 0.52 0.63 0.12
Network C 4.61 4.45 0.16 0.20 0.60
Network D 4.86 3.92 0.94* 1.15 0.02
SOURCE: Offering Session Observation, implementation year (2007-08). NOTES: Effect size calculated by taking Impact/SD of Control Group Table H-5: Individual Network Impact Estimates for the Welcoming Scale Intervention Control Impact Effect Size of
Impact Statistical Significance
of Impact (p-value)
Network A 5.00 4.94 0.05 0.09 0.80
Network B 4.76 4.75 0.01 0.02 0.96
Network C 4.77 4.63 0.14 0.23 0.52
Network D 4.97 4.56 0.41 0.67 0.15
SOURCE: Offering Session Observation, implementation year (2007-08). NOTES: Effect size calculated by taking Impact/SD of Control Group Table H-6: Individual Network Impact Estimates for the Inclusion Scale Construct Intervention Control Impact Effect Size of
Impact Statistical Significance
of Impact (p-value)
Network A 4.80 4.69 0.12 0.13 0.66
Network B 4.05 3.43 0.63* 0.69 0.03
Network C 4.15 3.87 0.27 0.30 0.31
Network D 4.04 3.78 0.26 0.29 0.47
SOURCE: Offering Session Observation, implementation year (2007-08). NOTES: Effect size calculated by taking Impact/SD of Control Group Table H-7: Individual Network Impact Estimates for the Conflict Resolution Scale Intervention Control Impact Effect Size of
Impact Statistical Significance
of Impact (p-value)
Network A 5.04 5.00 0.04 0.04 0.91
Network B 4.68 4.03 0.66 0.74 0.05
Network C 4.51 4.43 0.09 0.10 0.79
Network D 4.40 3.79 0.61 0.68 0.15
SOURCE: Offering Session Observation, implementation year (2007-08). NOTES: Effect size calculated by taking Impact/SD of Control Group

H-7
Table H-8: Individual Network Impact Estimates for the Skill Building Scale Intervention Control Impact Effect Size of
Impact Statistical Significance
of Impact (p-value)
Network A 4.02 3.72 0.30 0.34 0.36
Network B 3.74 3.54 0.20 0.22 0.58
Network C 4.43 4.12 0.32 0.35 0.35
Network D 3.98 3.96 0.02 0.02 0.97
SOURCE: Offering Session Observation, implementation year (2007-08). NOTES: Effect size calculated by taking Impact/SD of Control Group Table H-9: Individual Network Impact Estimates for the Grouping Scale Intervention Control Impact Effect Size of
Impact Statistical Significance
of Impact (p-value)
Network A 3.22 2.22 1.01* 0.77 0.04
Network B 2.59 1.90 0.70 0.53 0.18
Network C 3.06 3.72 -0.70 -0.51 0.21
Network D 2.45 4.77 -2.32* -1.79 0.002
SOURCE: Offering Session Observation, implementation year (2007-08). NOTES: Effect size calculated by taking Impact/SD of Control Group Table H-10: Individual Network Impact Estimates for the Planning Scale Intervention Control Impact Effect Size of
Impact Statistical Significance
of Impact (p-value) Network A 2.42 1.65 0.77 0.76 0.04
Network B 1.89 1.33 0.56 0.55 0.17
Network C 2.93 2.58 0.35 0.35 0.37
Network D 2.42 1.39 1.04* 1.02 0.05
SOURCE: Offering Session Observation, implementation year (2007-08). NOTES: Effect size calculated by taking Impact/SD of Control Group Table H-11: Individual Network Impact Estimates for the Choice Scale Intervention Control Impact Effect Size of
Impact Statistical Significance
of Impact (p-value)
Network A 4.20 3.53 0.67 0.49 0.18
Network B 3.25 2.70 0.55 0.40 0.31
Network C 4.02 3.48 0.54 0.39 0.30
Network D 4.20 3.62 0.58 0.42 0.40
SOURCE: Offering Session Observation, implementation year (2007-08). NOTES: Effect size calculated by taking Impact/SD of Control Group

Continuous Quality Improvement in Afterschool Settings
H-8
Table H-12: Individual Network Impact Estimates for the Reflection Scale Intervention Control Impact Effect Size of
Impact Statistical Significance
of Impact (p-value)
Network A 3.40 2.82 0.58 0.46 0.14
Network B 2.62 1.89 0.73 0.59 0.08
Network C 2.50 3.01 -0.51 -0.40 0.20
Network D 2.11 1.77 0.35 0.28 0.51
SOURCE: Offering Session Observation, implementation year (2007-08). NOTES: Effect size calculated by taking Impact/SD of Control Group

APPENDIX I MANAGER AND STAFF EMPLOYMENT TENURE

Continuous Quality Improvement in Afterschool Settings
I-2
Appendix I
Manager and Staff Employment Tenure For the YPQI study, defining and tracking manager and staff attrition was important despite obvious challenges posed by a workforce characterized by part-time and seasonal employment, external service contracting, and informal working relationships. In this appendix, we provide: (a) greater detail regarding exploratory hypotheses related to manager and staff employment tenure; (b) a working definition which can be operationalized through our data; and (c) supporting tables that describe levels of manager and staff short-term employment tenure throughout the study period. For staff surveyed near the end (April-May) of each of the three program years included in the study, about 25% were hired at some point during the program year in which they were surveyed and about 55% had been employed at the site during both the current and prior program years. These estimates are true for all staff as well as those in the study sample who worked 20 hours or more each week.
Hypotheses Involving Manager and Staff Turnover The YPQI was designed explicitly to achieve effects despite the high staff turnover rates that characterize the afterschool field. The thrust of the intervention lies in manager enactment of continuous improvement practices in partnership with their staff—a model that gives managers the capacity to introduce new staff to these practices at any time. By targeting managers, who represent a more stable workforce in comparison to direct staff, the YPQI attempts to reduce the impact of knowledge and skill loss due to endemic staff turnover. Further, in the less likely event of manager turnover, the intervention inputs for managers were designed to be light, requiring only 4.5 days of training to get managers prepared to begin implementing the YPQI model.
Although it is tempting to simply assume that adoption of the YPQI’s core technology would result in immediate reductions in turnover due to higher levels of engagement in the work of the afterschool site, we also expected turnover to be a moderator, as well as an outcome, of YPQI effects.59 We offer two exploratory hypotheses related to manager and staff turnover during the study period:
• Manager turnover between the baseline and end of the implementation year would not affect YPQI outcomes or the moderation effect of manager turnover would be small;
• Staff turnover would be reduced at the end of the implementation year as a result of assignment to the intervention group.
The first of these exploratory hypotheses is evaluated in Chapter 5; the second hypothesis is evaluated in Chapter 4. Although it may seem unlikely that manager and staff stability would follow different patterns in relation to the YPQI (e.g., our hypotheses suggest that manager employment stability would decrease
59 In the organizational literature, the adoption and implementation of core technology can be negatively affected by the culture and climate of the organization which also affect rates of turnover (e.g., Glisson & James, 2002). Certainly, for some managers, it is possible to imagine that the requirements to participate in the YPQI would result in job conflicts or dissonance with their prior management style that might both reduce implementation fidelity in the treatment group and/or increase rates of manager turnover in the short-term.
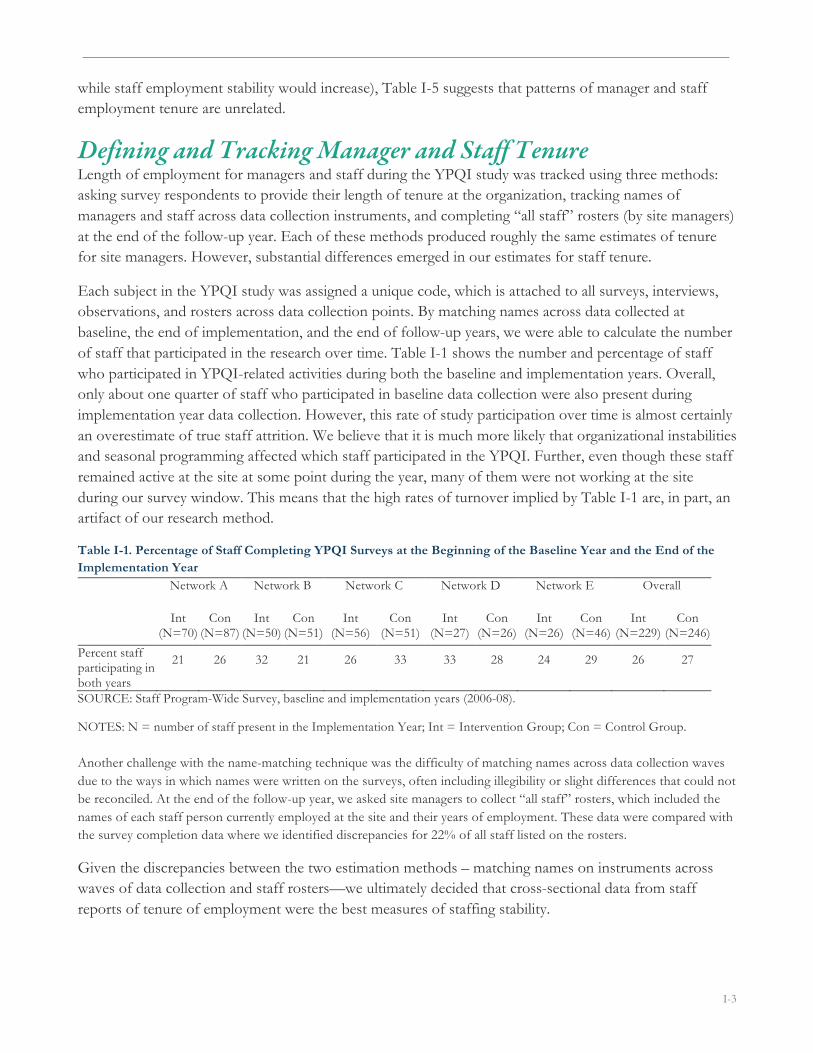
I-3
while staff employment stability would increase), Table I-5 suggests that patterns of manager and staff employment tenure are unrelated.
Defining and Tracking Manager and Staff Tenure Length of employment for managers and staff during the YPQI study was tracked using three methods: asking survey respondents to provide their length of tenure at the organization, tracking names of managers and staff across data collection instruments, and completing “all staff” rosters (by site managers) at the end of the follow-up year. Each of these methods produced roughly the same estimates of tenure for site managers. However, substantial differences emerged in our estimates for staff tenure.
Each subject in the YPQI study was assigned a unique code, which is attached to all surveys, interviews, observations, and rosters across data collection points. By matching names across data collected at baseline, the end of implementation, and the end of follow-up years, we were able to calculate the number of staff that participated in the research over time. Table I-1 shows the number and percentage of staff who participated in YPQI-related activities during both the baseline and implementation years. Overall, only about one quarter of staff who participated in baseline data collection were also present during implementation year data collection. However, this rate of study participation over time is almost certainly an overestimate of true staff attrition. We believe that it is much more likely that organizational instabilities and seasonal programming affected which staff participated in the YPQI. Further, even though these staff remained active at the site at some point during the year, many of them were not working at the site during our survey window. This means that the high rates of turnover implied by Table I-1 are, in part, an artifact of our research method.
Table I-1. Percentage of Staff Completing YPQI Surveys at the Beginning of the Baseline Year and the End of the Implementation Year
Network A Network B Network C Network D Network E Overall
Int (N=70)
Con (N=87)
Int (N=50)
Con (N=51)
Int (N=56)
Con (N=51)
Int (N=27)
Con (N=26)
Int (N=26)
Con (N=46)
Int (N=229)
Con (N=246)
Percent staff participating in both years
21 26 32 21 26 33 33 28 24 29 26 27
SOURCE: Staff Program-Wide Survey, baseline and implementation years (2006-08).
NOTES: N = number of staff present in the Implementation Year; Int = Intervention Group; Con = Control Group. Another challenge with the name-matching technique was the difficulty of matching names across data collection waves due to the ways in which names were written on the surveys, often including illegibility or slight differences that could not be reconciled. At the end of the follow-up year, we asked site managers to collect “all staff” rosters, which included the names of each staff person currently employed at the site and their years of employment. These data were compared with the survey completion data where we identified discrepancies for 22% of all staff listed on the rosters.
Given the discrepancies between the two estimation methods – matching names on instruments across waves of data collection and staff rosters—we ultimately decided that cross-sectional data from staff reports of tenure of employment were the best measures of staffing stability.

Continuous Quality Improvement in Afterschool Settings
I-4
Manager and Staff Employment Tenure in the YPQI Study We defined manager and staff tenure as the amount of time a manager or direct staff member reported working at their current site on the Program-wide Manager and Staff Surveys60. Two employment tenure variables were constructed from self-reported length of employment provided on program-wide manager and staff surveys administered at the end of the baseline, implementation, and follow-up years of the study. First, we identified managers and staff who had been working at their site for at least 10 months, as an indicator of within-year stability. Next, we identified managers and staff who had been working at their site for at least 2 years, as an indicator of cross-year stability. Both of these measures are indicators from staff who were at the program rather than staff who had left. This distinction is important because it is possible that programs could have grown over the study period and added new staff, meaning that a new staff’s appearance during the current program year (hired in the last 10 months or less) or during the last two program years (i.e., stayed in employment for the preceding year but not longer) might not have indicated the replacement of another staff member who had left the site. Importantly, however, we have no reason to believe that staff tenure would differ systematically across experimental assignment conditions, due to any other factor than the experience of the intervention.
Manager Employment Tenure in the YPQI Study Table I-2 presents manager employment tenure at each wave of data collection. Again, these manager reports correspond closely to records of site-level manager turnover maintained by the Weikart Center.
Table I-2: Manager 10-Month and 2-Year Tenure by Study Year Network A Network B Network C Network D Network E Network E
Int Con Int Con Int Con Int Con Int Con Int Con
Baseline N=10 N=10 N=10 N=11 N=11 N=10 N=7 N=9 N=10 N=9 N=48 N=49
Percent more than 10 months
100 100 90 55 73 70 86 89 70 78 83 78
Percent 2 years or more
90 100 80 36 64 60 71 89 70 67 75 69
Implementation N=9 N=10 N=10 N=9 N=10 N=8 N=7 N=7 N=7 N=9 N=43 N=43
Percent more than 10 months
100 100 60 89 80 75 100 86 86 100 84 91
Percent 2 years or more
100 100 60 67 80 75 100 86 71 100 81 86
Follow-up N=8 N=11 N=10 N=9 N=6 N=7 N=2 N=2 N=10 N=6 N=36 N=37
Percent more than 10 months
100 100 80 78 100 86 100 100 90 83 92 89
Percent 2 years or more
100 100 60 44 100 71 50 100 60 83 75 77
SOURCE: Manager Program-Wide Survey, baseline, implementation, and follow-up years (2006-08)
60 On these surveys, respondents were asked to identify the number of years of experience that they have had working at the current site. If they had been there for less than one year, respondents were asked to identify the number of months of experience they had at the site.

I-5
NOTES: Manager tenure was calculated for intervention and control sites in the study at baseline data collection. Percentages are based on manager reports of length of service at their current site.
Staff Employment Tenure in the YPQI Study This section presents descriptive information on the short-term tenure of staff at baseline, implementation, and follow-up years. The data are presented by network and experimental status in Tables I-3 and I-4. Eighty sites are represented in this data out of the possible 87. The average number of staff surveys returned per site is 4.6 with a standard deviation of 3.18 and range of 1 to 16.
In Table I-3, we provide information for all staff in the study, and in Table I-4 we provide information for only staff who self-reported working 20 hours or more each week. For all staff:
• At baseline, 29% of staff in the intervention group and 26% in the control group had been at the site for fewer than 10 months (27% overall).
• At the end of the implementation year, 23% of staff in the intervention group and 30% of staff in the control group had been at the site for fewer than 10 months (26% overall).
• At the end of the follow-up year, 23% of staff in the intervention group and 21% of staff in the control group had been at the site for fewer than 10 months (22% overall).
• At the end of the follow-up year, 13% had been there for 11 months to one year (11% Int; 15% Con), and 24% had been there for more than one year and up to 2 years (24% Int; 23% Con).
For staff who worked 20 hours or more each week:
• At baseline, 29% of staff in the intervention group and 26% in the control group had been at the site for less than 10 months (28% overall).
• At the end of the implementation year, 23% of staff in the intervention group and 28% of staff in the control group had been at the site for less than 10 months (26% overall).
• At the end of the follow-up year, 24% of staff in the intervention group and 23% of staff in the control group had been at the site for less than 10 months (23% overall).
• At the end of the follow-up year, 14% had been there for 11 months up to one year (13% Int; 15% Con), and 24% had been there for more than one year and up to 2 years (23% Int; 24% Con).

Continuous Quality Improvement in Afterschool Settings
I-6
Table I-3: All Staff (part and full time) 10-Month and 2-Year Tenure by Study Year Network A Network B Network C Network D Network E Overall
Int Con Int Con Int Con Int Con Int Con Int Con
Baseline N=103 N=45 N=40 N=45 N=60 N=28 N=29 N=14 N=27 N=56 N=259 N=188
Percent more than 10 months 70 87 73 58 65 61 69 71 93 86 71 74
Percent 2 years or more 56 53 50 42 47 43 45 50 63 46 53 47
Implementation N=59 N=69 N=35 N=25 N=46 N=17 N=20 N=19 N=18 N=47 N=178 N=177
Percent more than 10 months 78 77 83 64 70 59 80 63 83 72 78 71
Percent 2 years or more 59 54 74 60 52 35 60 53 78 66 62 56
Follow-up N=61 N=54 N=33 N=40 N=30 N=14 N=11 N=12 N=25 N=27 N=160 N=147
Percent more than 10 months 85 83 70 60 60 64 82 92 80 100 76 79
Percent 2 years or more 69 61 64 48 40 38 55 58 72 100 49 49
SOURCE: Manager Program-Wide Survey, baseline, implementation, and follow-up years (2006-08) NOTES: Manager tenure was calculated for intervention and control sites in the study at baseline data collection. Percentages are based on manager reports of length of service at their current site. Some sites had more than one manager.

I-7
Table I-4: Employment Tenure for Staff Who Work 20 Hours or More Each Week
Network A Network B Network C Network D Network E Network E
Int Con Int Con Int Con Int Con Int Con Int Con
Baseline N=80 N=35 N=22 N=27 N=2 N=24 N=11 N=12 N=23 N=42 N=188 N=140
Percent more than 10 months 69 89 73 56 63 63 64 67 96 83 71 74
Percent 2 years or more 54 60 36 37 46 46 45 58 61 55 50 51
Implementation N=55 N=65 N=16 N=15 N=34 N=14 N=12 N=14 N=17 N=40 N=134 N=148
Percent more than 10 months 78 75 81 47 68 71 83 71 82 75 77 72
Percent 2 years or more 62 55 69 40 50 43 75 57 76 68 63 56
Follow-up N=50 N=54 N=24 N=27 N=21 N=11 N=8 N=10 N=20 N=25 N=123 N=127
Percent more than 10 months 84 83 67 48 62 64 88 100 75 100 76 79
Percent 2 years or more 64 61 58 33 33 45 63 60 70 100 59 61
SOURCE: Staff Program-Wide Survey, baseline, implementation, and follow-up years (2006-08) NOTES: Staff tenure was calculated for intervention and control sites in the study at baseline data collection. Percentages are based on staff reports of length of service at their current site. Table I-5 presents correlation coefficients for manager and staff short-term tenure. Manager and staff tenure are not correlated in the overall sample.
Table I-5. Correlations for Manager and Staff Short-term Tenure
Mgr: 2 or more years Mgr: More than 10 months Stf: 2 or more years
Mgr: More than 10 months 0.91** - 0.01
Stf: 2 or more years 0.09 0.01 -
Stf: More than 10 months -0.19 0.06 0.81**
SOURCE: Manager Program-Wide Survey and Staff Program-Wide Survey, implementation year (2007-08) NOTES: Sample size: N=80

Continuous Quality Improvement in Afterschool Settings
I-8
APPENDIX J DETAILS AND SUPPORTING TABLES FOR IMPLEMENTATION ANALYSES

Continuous Quality Improvement in Afterschool Settings
J-2
Appendix J
Details and Supporting Tables for Implementation Analyses This appendix is organized around the three research questions that structure Chapter 5 and provides supplemental detail and supporting tables.
Does Higher Fidelity Implementation of Continuous Improvement Practices Increase the Quality of Instruction? In this section we provide supporting detail for estimation of the effect of staff continuous improvement practices on staff instructional practices. Tables J-1 and J-2 provide regression output for the two stage instrumental variable (IV) analyses used to disattenuate the Staff Continuous Improvement Practices score (first step) and then estimate the effect of Staff Continuous Improvement Practices on the Staff Instructional Practices Total score (second step). Estimation models are described in Appendix F.
Table J-1. Instrumental Variable Model: Step 1
Variable (Level 2 variables only) Coefficient Standard Error
Intercept 0.64* 0.09
Status 0.12 0.05
Network A -0.08 0.07
Network C -0.18 0.07
Network D -0.18 0.08
Wave1 Staff Continuous Improvement Practices 0.57* 0.16
Wave1 Staff Instruction Quality Total Score Pretest -0.11* 0.06
Wave1 Shared Control -0.01 0.03
Wave1 Youth Enrollment <-0.01 <0.01
Wave1 Staff Education Level -0.03 0.04
Wave3 Supervisor Turnover From Year1 to Year2 -0.16 0.08
Art & Enrichment Content -0.02 0.08
Life Skills Content -0.02 0.09
4th and 5th Grade 0.02 0.07
6th to 8th Grade 0.07 0.06
SOURCE: Manager Program-Wide Survey, Staff Program-Wide Survey, Youth Program Quality Assessment, implementation year (2007-08) NOTES: * indicates p < .05

J-3
Table J-2. Instrumental Variable Model: Step 2
Variable Coefficient Standard Error
Intercept 3.34* 0.19
Level 2 Variables
Predicted Staff Continuous Improvement Practices for 1st Stage Model
1.12* 0.41
Network A 0.64* 0.20
Network C 0.72* 0.19
Network D 0.45* 0.20
Wave1 Staff Instruction Quality Total Score Pretest 0.39* 0.12
Level 1 Variables
Art & Enrichment Content 0.11 0.10
Life Skills Content 0.36* 0.14
4th and 5th Grade -0.46* 0.14
6th to 8th Grade -0.35 0.14
SOURCE: Manager Program-Wide Survey, Staff Program-Wide Survey, Youth Program Quality Assessment, implementation year (2007-08) NOTES: * indicates p < .05
Do Structural Features Moderate the Effect of Continuous Improvement on the Quality of Instruction? In this section we offer additional detail regarding the moderation effect of structural features on the association between the average level of staff implementation of continuous improvement practices and the quality of instruction during afterschool offerings. Table J-3 provides output for three moderation analyses described in Chapter 5.

Continuous Quality Improvement in Afterschool Settings
J-4
Table J-3. Moderation Effects
Youth-adult ratio Staff Education Manager Turnover
Variable Coefficient Standard
Error Coefficient Standard
Error Coefficient Standard
Error
Intercept 1.92 0.54 2.44 0.54 1.57 0.46
Level 2
Staff CIP 0.61 0.59 -0.44 0.66 0.89* 0.37
Network A 0.58* 0.14 0.59* 0.15 0.56* 0.16
Network C 0.61* 0.14 0.64* 0.15 0.62* 0.16
Network D 0.48* 0.17 0.49* 0.18 0.48* 0.17
Baseline Staff Instructional Practices
0.31* 0.10 0.33* 0.11 0.33* 0.09
Youth-adult ratio -0.02 0.03 — — — —
Staff education — — -0.22 0.13 — —
Manager Turnover — — 0.38 0.46
Staff CIP x Youth-adult ratio
0.01 0.05 — — — —
Staff CIP x Staff education — — 0.34 0.22 — —
Staff CIP x Manager turnover
— — — — -0.55 0.78
S, n
Art & Enrichment Content 0.09 0.11 0.08 0.10 0.08 0.11
Life Skills Content 0.27* 0.10 0.24* 0.10 0.28* 0.10
4th and 5th Grade -0.43* 0.12 -0.46* 0.13 -0.43* 0.12
6th to 8th Grade -0.28* 0.11 -0.25* 0.11 -0.30* 0.12
SOURCE: Manager Program-Wide Survey, Staff Program-Wide Survey, Youth Program Quality Assessment, implementation year (2007-08) NOTES: Staff CIP = Staff Continuous Improvement Practices (the disattenuated variable created in the instrumental variable analysis) * p < .05

Center for YouthDavid P. Weikart
Program Quality