contra costa county detailed map - proposed map: a
TRANSCRIPT

SanRiver
StraitCarquinez
BigBreak
San Leandro Reservoir
Los Vaqueros Reservoir
BrionesReservoir
San Pablo Reservoir
CliftonCourt
Forebay
FranksTract
HonkerBay
SuisunBay
SanPablo
Bay
SanFrancisco
Bay
Sacramento River
Joaquin
Old Riv
er
Naval
ByronAirport
Military OceanTerminal Complex
MtDiablo
Buch-ananAirport
Chevron
Marathon
Philips66
KellerCanyonLandfill
West Co.Landfill
Martinez
MorganTerritory
TassajaraValley
AgriculturalCore
ByronTract
ConeyIsland
QuimbyIsland
OrwoodTract
PalmTract
VealeTract
BixlerTract
HollandTract
JerseyIsland
BradfordIsland
WebbTract
WinterIsland
BrownsIsland
FranklinCanyon
BollingerCanyon Vasco
Hills
Briones
Canyon
SandmoundSlough
Refinery Former
Weapons
Concord
Station
BethelIsland
Kensington
El Sobrante
Rodeo
Crockett
Alamo
Knightsen
DiscoveryBay
Byron
BayPoint
Pacheco
Blackhawk
Diablo
PortCosta
Clyde
NorthRichmond
Saranap
ContraCostaCentre
MtView
VineHill
TaraHills
MontalvinManor
Bayview
EastRichmond Heights
San Miguel
NorthGate
Reliez
AlhambraValley
Rollingwood
ShellRidge
Camino Tassajara
NorrisCanyon
Valley
WALNUTCREEK
AcalanesRidge
CastleHill
HERCULES
PINOLE
RICHMOND
MARTINEZ
CONCORD
PLEASANTHILL
WALNUTCREEK
LAFAYETTE
CLAYTON
ANTIOCHOAKLEY
BRENTWOOD
SANRAMON
ORINDA
MORAGA
ELCERRITO
SAN PABLO
PITTSBURG
DANVILLE
ANTIOCH
}ÿ4
}ÿ24
}ÿ242
}ÿ160
}ÿ4
}ÿ4
}ÿ4
§̈¦80
§̈¦80
567J4
§̈¦580
§̈¦80
§̈¦680
§̈¦680
§̈¦680
§̈¦680
}ÿ4}ÿ4
}ÿ4
}ÿ4
}ÿ24
BERKELEY
OAKLAND
SANFRANCISCO
DUBLIN
ALAMEDA
ALBANY
BENICIA
VALLEJO
SANLEANDRO LIVERMORE
TRACY
DALY CITY CastroValley
MountainHouse
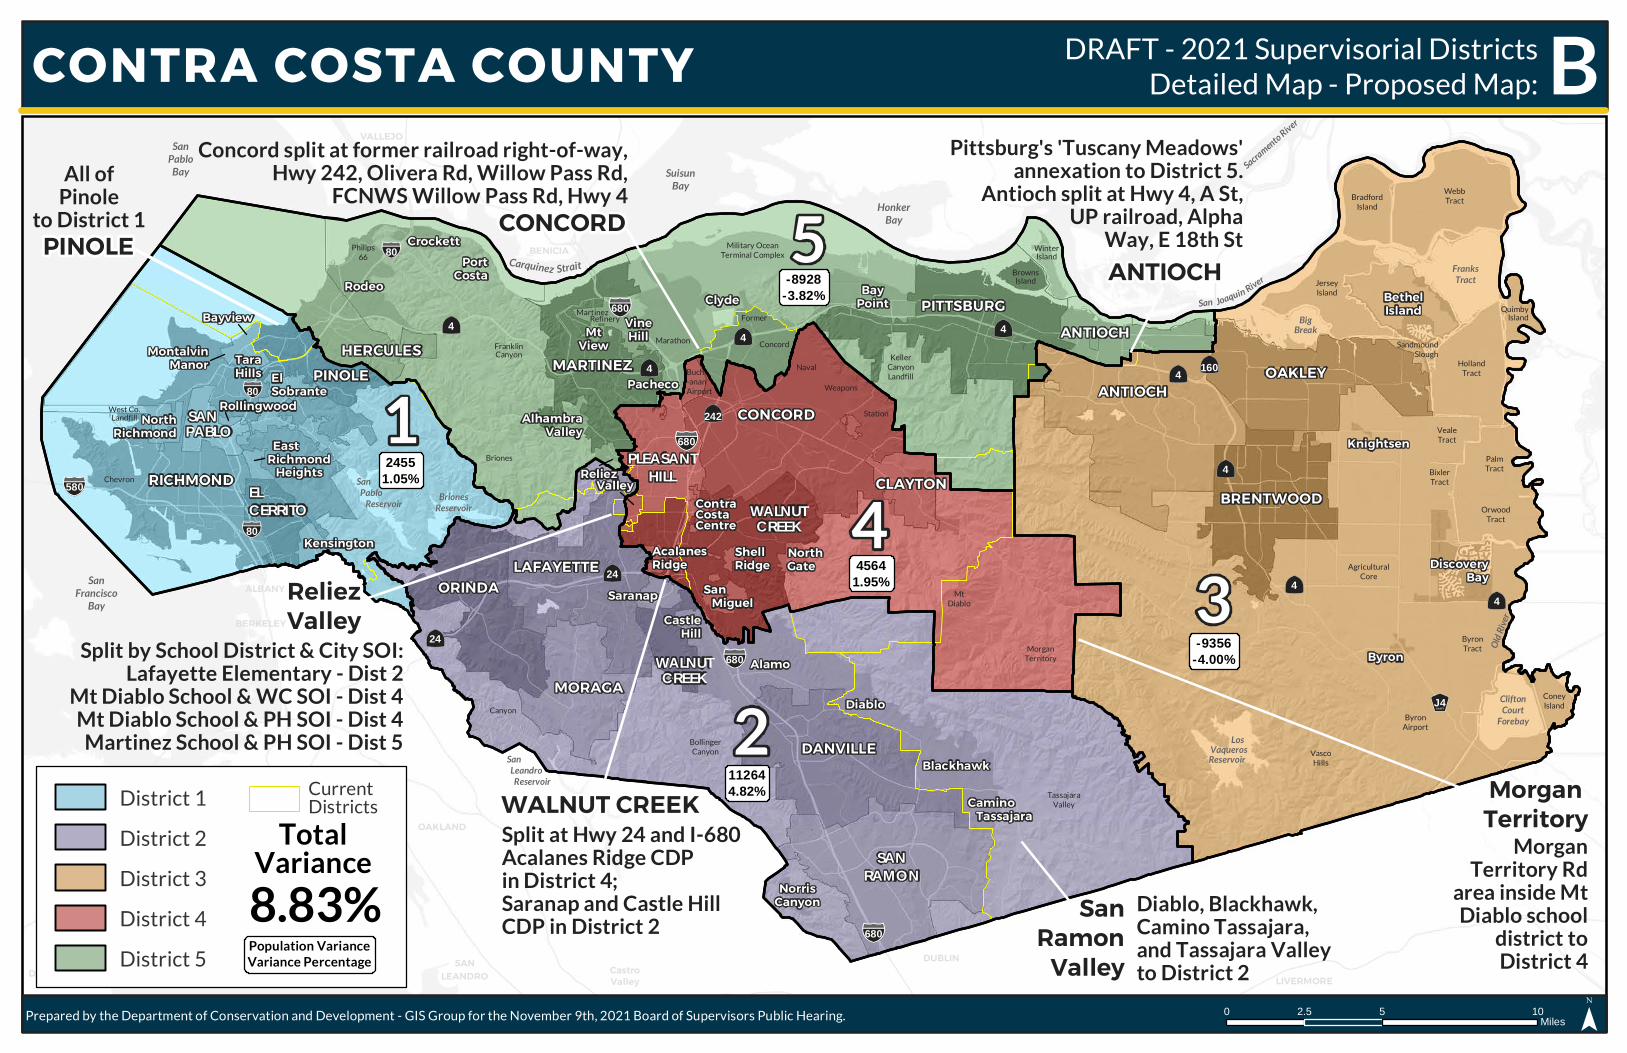
Diablo, Blackhawk, Camino Tassajara, and Tassajara Valleyto District 2
-6762-2.89%
All ofPinole
to District 1
3
1
2
4
5Concord split at former railroad right-of-way,
Hwy 242, Olivera Rd, Willow Pass Rd,FCNWS Willow Pass Rd, Hwy 4
Pittsburg's 'Tuscany Meadows'annexation to District 5.
Antioch split at Hwy 4,Cavallo Rd, Fulton
Shipyard Rd
MorganTerritory Rd
area inside MtDiablo school
district toDistrict 4
Split at Hwy 24 and I-680Acalanes Ridge CDPin District 4;Saranap and Castle HillCDP in District 2
Split by School District & City SOI:Lafayette Elementary - Dist 2
Mt Diablo School & WC SOI - Dist 4Mt Diablo School & PH SOI - Dist 4Martinez School & PH SOI - Dist 5
24551.05%
-11522-4.93%
45641.95%
112644.82%
PINOLECONCORD
ANTIOCH
ReliezValley
WALNUT CREEK
SanRamon
Valley
MorganTerritory
CONTRA COSTA COUNTY
¯0 5 102.5Miles
District 1District 2District 3District 4District 5
CurrentDistricts
Population VarianceVariance Percentage
TotalVariance9.75%
DRAFT - 2021 Supervisorial DistrictsDetailed Map - Proposed Map: A
Prepared by the Department of Conservation and Development - GIS Group for the November 9th, 2021 Board of Supervisors Public Hearing.

CONTRA COSTA COUNTY
352
1 4
Current Supervisorial Boundaries
Demographic AnalysisRace and Ethnicity by District
9.75%2021 PopulationPopulation: 1,168,069Equal Distribution: 233,614Citizen Voting Age Population(CVAP): 761,065
CONCORD1 5
24
3
ANTIOCH
OAKLEY
SANRAMON
RICHMOND
DANVILLE
ORINDA
WALNUTCREEK
PITTSBURG
LAFAYETTE
MARTINEZ
BRENTWOOD
MORAGA
PINOLEHERCULES
PLEASANTHILL CLAYTON
EL CERRITO
SANPABLO
ByronAlamo
Knightsen
BethelIsland
Blackhawk
BayPoint
DiscoveryBay
Rodeo
Diablo
PachecoElSobrante
Saranap
Crockett
CaminoTassajara
Clyde
Kensington
VineHill
Contra CostaCentre
Prepared by the Department of Conservation and Development - GIS Group for the November 9th, 2021 Board of Supervisors Public Hearing.Data Source: 2021 California State Redistricting Data, Adjusted P.L 94-171 Redistrricting Data and block level Citizen Voting Age Population (CVAP)
District 1District 2District 3District 4District 5
Total Population - Race and Ethnicty
Citizen Voting Age Population (CVAP)Race and Ethnicty
Population by DistrictTotal Variance Population Variance Percentage by District
DRAFT - 2021 Supervisorial DistrictsOverview Map and Data - Proposed Map: A
District Population Variance PercentDistrict 1 236,069 2,455 1.05%District 2 244,878 11,264 4.82%District 3 226,852 (6,762) -2.89%District 4 238,178 4,564 1.95%District 5 222,092 (11,522) -4.93%
1.05%4.82%
-2.89%
1.95%
-4.93%-5.0%-2.5%0.0%2.5%5.0%
District 1 District 2 District 3 District 4 District 5
Total Latino White Black Asian Other95,017 51,396 33,307 40,760 15,589
40.2% 21.8% 14.1% 17.3% 6.6%19,799 133,531 3,879 71,377 16,292
8.1% 54.5% 1.6% 29.1% 6.7%71,116 83,123 27,961 27,185 17,467
31.3% 36.6% 12.3% 12.0% 7.7%50,136 126,362 7,113 36,399 18,168
21.0% 53.1% 3.0% 15.3% 7.6%79,357 61,469 26,739 38,827 15,700
35.7% 27.7% 12.0% 17.5% 7.1%315,425 455,881 98,999 214,548 83,216
27.0% 39.0% 8.5% 18.4% 7.1%
District 5 222,092
County 1,168,069
District 3 226,852
District 4 238,178
District 1 236,069
District 2 244,878
Total Latino White Black Asian Other35,145 45,432 27,283 26,038 6,421
25.0% 32.4% 19.4% 18.6% 4.6%9,962 112,518 2,542 31,023 4,632
6.2% 70.0% 1.6% 19.3% 2.9%34,724 73,922 20,294 14,578 7,509
23.0% 48.9% 13.4% 9.7% 5.0%23,526 111,546 5,309 20,243 7,231
14.0% 66.5% 3.2% 12.1% 4.3%34,359 57,680 18,256 23,717 7,175
24.3% 40.9% 12.9% 16.8% 5.1%137,716 401,098 73,684 115,599 32,968
18.1% 52.7% 9.7% 15.2% 4.3%
District 5 141,187
County 761,065
District 2 160,677
District 3 151,027
District 4 167,855
District 1 140,319
SanRiver
StraitCarquinez
BigBreak
San Leandro Reservoir
Los Vaqueros Reservoir
BrionesReservoir
San Pablo Reservoir
CliftonCourt
Forebay
FranksTract
HonkerBay
SuisunBay
SanPablo
Bay
SanFrancisco
Bay
Sacramento River
Joaquin
Old Riv
er
Naval
ByronAirport
Military OceanTerminal Complex
MtDiablo
Buch-ananAirport
Chevron
Marathon
Philips66
KellerCanyonLandfill
West Co.Landfill
Martinez
MorganTerritory
TassajaraValley
AgriculturalCore
ByronTract
ConeyIsland
QuimbyIsland
OrwoodTract
PalmTract
VealeTract
BixlerTract
HollandTract
JerseyIsland
BradfordIsland
WebbTract
WinterIsland
BrownsIsland
FranklinCanyon
BollingerCanyon Vasco
Hills
Briones
Canyon
SandmoundSlough
Refinery Former
Weapons
Concord
Station
BethelIsland
Kensington
El Sobrante
Rodeo
Crockett
Alamo
Knightsen
DiscoveryBay
Byron
BayPoint
Pacheco
Blackhawk
Diablo
PortCosta
Clyde
NorthRichmond
Saranap
ContraCostaCentre
MtView
VineHill
TaraHills
MontalvinManor
Bayview
EastRichmond Heights
San Miguel
NorthGate
Reliez
AlhambraValley
Rollingwood
ShellRidge
Camino Tassajara
NorrisCanyon
Valley
WALNUTCREEK
AcalanesRidge
CastleHill
HERCULES
PINOLE
RICHMOND
MARTINEZ
CONCORD
PLEASANTHILL
WALNUTCREEK
LAFAYETTE
CLAYTON
ANTIOCHOAKLEY
BRENTWOOD
SANRAMON
ORINDA
MORAGA
ELCERRITO
SAN PABLO
PITTSBURG
DANVILLE
ANTIOCH
}ÿ4
}ÿ24
}ÿ242
}ÿ160
}ÿ4
}ÿ4
}ÿ4
§̈¦80
§̈¦80
567J4
§̈¦580
§̈¦80
§̈¦680
§̈¦680
§̈¦680
§̈¦680
}ÿ4}ÿ4
}ÿ4
}ÿ4
}ÿ24
BERKELEY
OAKLAND
SANFRANCISCO
DUBLIN
ALAMEDA
ALBANY
BENICIA
VALLEJO
SANLEANDRO LIVERMORE
TRACY
DALY CITY CastroValley
MountainHouse
Diablo, Blackhawk, Camino Tassajara, and Tassajara Valleyto District 2
-9356-4.00%
All ofPinole
to District 1
3
1
2
4
5Concord split at former railroad right-of-way,
Hwy 242, Olivera Rd, Willow Pass Rd,FCNWS Willow Pass Rd, Hwy 4
Pittsburg's 'Tuscany Meadows'annexation to District 5.
Antioch split at Hwy 4, A St,UP railroad, Alpha
Way, E 18th St
MorganTerritory Rd
area inside MtDiablo school
district toDistrict 4
Split at Hwy 24 and I-680Acalanes Ridge CDPin District 4;Saranap and Castle HillCDP in District 2
Split by School District & City SOI:Lafayette Elementary - Dist 2
Mt Diablo School & WC SOI - Dist 4Mt Diablo School & PH SOI - Dist 4Martinez School & PH SOI - Dist 5
24551.05%
-8928-3.82%
45641.95%
112644.82%
PINOLECONCORD
ANTIOCH
ReliezValley
WALNUT CREEK
SanRamon
Valley
MorganTerritory
CONTRA COSTA COUNTY
¯0 5 102.5Miles
District 1District 2District 3District 4District 5
CurrentDistricts
Population VarianceVariance Percentage
TotalVariance8.83%
DRAFT - 2021 Supervisorial DistrictsDetailed Map - Proposed Map: B
Prepared by the Department of Conservation and Development - GIS Group for the November 9th, 2021 Board of Supervisors Public Hearing.

CONTRA COSTA COUNTY
352
1 4
Current Supervisorial Boundaries
Demographic AnalysisRace and Ethnicity by District
8.83%2021 PopulationPopulation: 1,168,069Equal Distribution: 233,614Citizen Voting Age Population(CVAP): 761,065
CONCORD1 5
24
3
ANTIOCH
OAKLEY
SANRAMON
RICHMOND
DANVILLE
ORINDA
WALNUTCREEK
PITTSBURG
LAFAYETTE
MARTINEZ
BRENTWOOD
MORAGA
PINOLEHERCULES
PLEASANTHILL CLAYTON
EL CERRITO
SANPABLO
ByronAlamo
Knightsen
BethelIsland
Blackhawk
BayPoint
DiscoveryBay
Rodeo
Diablo
PachecoElSobrante
Saranap
Crockett
CaminoTassajara
Clyde
Kensington
VineHill
Contra CostaCentre
Prepared by the Department of Conservation and Development - GIS Group for the November 9th, 2021 Board of Supervisors Public Hearing.Data Source: 2021 California State Redistricting Data, Adjusted P.L 94-171 Redistrricting Data and block level Citizen Voting Age Population (CVAP)
District 1District 2District 3District 4District 5
Total Population - Race and Ethnicty
Citizen Voting Age Population (CVAP)Race and Ethnicty
Population by DistrictTotal Variance Population Variance Percentage by District
DRAFT - 2021 Supervisorial DistrictsOverview Map and Data - Proposed Map: B
District Population Variance PercentDistrict 1 236,069 2,455 1.05%District 2 244,878 11,264 4.82%District 3 224,258 (9,356) -4.00%District 4 238,178 4,564 1.95%District 5 224,686 (8,928) -3.82%
1.05%4.82%
-4.00%
1.95%
-3.82%-5.0%-2.5%0.0%2.5%5.0%
District 1 District 2 District 3 District 4 District 5
Total Latino White Black Asian Other95,017 51,396 33,307 40,760 15,589
40.2% 21.8% 14.1% 17.3% 6.6%19,799 133,531 3,879 71,377 16,292
8.1% 54.5% 1.6% 29.1% 6.7%70,266 82,334 27,292 27,084 17,282
31.3% 36.7% 12.2% 12.1% 7.7%50,136 126,362 7,113 36,399 18,168
21.0% 53.1% 3.0% 15.3% 7.6%80,207 62,258 27,408 38,928 15,885
35.7% 27.7% 12.2% 17.3% 7.1%315,425 455,881 98,999 214,548 83,216
27.0% 39.0% 8.5% 18.4% 7.1%
District 5 224,686
County 1,168,069
District 3 224,258
District 4 238,178
District 1 236,069
District 2 244,878
Total Latino White Black Asian Other35,145 45,432 27,283 26,038 6,421
25.0% 32.4% 19.4% 18.6% 4.6%9,962 112,518 2,542 31,023 4,632
6.2% 70.0% 1.6% 19.3% 2.9%34,529 72,745 19,685 14,568 7,446
23.2% 48.8% 13.2% 9.8% 5.0%23,526 111,546 5,309 20,243 7,231
14.0% 66.5% 3.2% 12.1% 4.3%34,554 58,857 18,865 23,727 7,238
24.1% 41.1% 13.2% 16.6% 5.1%137,716 401,098 73,684 115,599 32,968
18.1% 52.7% 9.7% 15.2% 4.3%
District 5 143,241
County 761,065
District 2 160,677
District 3 148,973
District 4 167,855
District 1 140,319

SanRiver
StraitCarquinez
BigBreak
San Leandro Reservoir
Los Vaqueros Reservoir
BrionesReservoir
San Pablo Reservoir
CliftonCourt
Forebay
FranksTract
HonkerBay
SuisunBay
SanPablo
Bay
SanFrancisco
Bay
Sacramento River
Joaquin
Old Riv
er
Naval
ByronAirport
Military OceanTerminal Complex
MtDiablo
Buch-ananAirport
Chevron
Marathon
Philips66
KellerCanyonLandfill
West Co.Landfill
Martinez
MorganTerritory
TassajaraValley
AgriculturalCore
ByronTract
ConeyIsland
QuimbyIsland
OrwoodTract
PalmTract
VealeTract
BixlerTract
HollandTract
JerseyIsland
BradfordIsland
WebbTract
WinterIsland
BrownsIsland
FranklinCanyon
BollingerCanyon Vasco
Hills
Briones
Canyon
SandmoundSlough
Refinery Former
Weapons
Concord
Station
BethelIsland
Kensington
El Sobrante
Rodeo
Crockett
Alamo
Knightsen
DiscoveryBay
Byron
BayPoint
Pacheco
Blackhawk
Diablo
PortCosta
Clyde
NorthRichmond
Saranap
ContraCostaCentre
MtView
VineHill
TaraHills
MontalvinManor
Bayview
EastRichmond Heights
San Miguel
NorthGate
Reliez
AlhambraValley
Rollingwood
ShellRidge
Camino Tassajara
NorrisCanyon
Valley
WALNUTCREEK
AcalanesRidge
CastleHill
HERCULES
PINOLE
RICHMOND
MARTINEZ
CONCORD
PLEASANTHILL
WALNUTCREEK
LAFAYETTE
CLAYTON
ANTIOCHOAKLEY
BRENTWOOD
SANRAMON
ORINDA
MORAGA
ELCERRITO
SAN PABLO
PITTSBURG
DANVILLE
ANTIOCH
}ÿ4
}ÿ24
}ÿ242
}ÿ160
}ÿ4
}ÿ4
}ÿ4
§̈¦80
§̈¦80
567J4
§̈¦580
§̈¦80
§̈¦680
§̈¦680
§̈¦680
§̈¦680
}ÿ4}ÿ4
}ÿ4
}ÿ4
}ÿ24
BERKELEY
OAKLAND
SANFRANCISCO
DUBLIN
ALAMEDA
ALBANY
BENICIA
VALLEJO
SANLEANDRO LIVERMORE
TRACY
DALY CITY CastroValley
MountainHouse
Diablo, Blackhawk, Camino Tassajara, and Tassajara Valleyto District 2
-10127-4.33%
All ofPinole
to District 1
3
1
2
4
5Concord split at former railroad
right-of-way, Hwy 242, Olivera Rd Port Chicago Hwy, Hwy 4
Pittsburg's 'Tuscany Meadows'annexation to District 5.
Antioch split at Hwy 4, A St,UP railroad, Cavallo
Rd, E 18th St
MorganTerritory Rd
area inside MtDiablo school
district toDistrict 4
Split at Hwy 24 and I-680Acalanes Ridge CDPin District 4;Saranap and Castle HillCDP in District 2
Split by School District & City SOI:Lafayette Elementary - Dist 2
Mt Diablo School & WC SOI - Dist 4Mt Diablo School & PH SOI - Dist 4Martinez School & PH SOI - Dist 5
24551.05%
-9355-4.00%
57622.47%
112644.82%
PINOLECONCORD
ANTIOCH
ReliezValley
WALNUT CREEK
SanRamon
Valley
MorganTerritory
CONTRA COSTA COUNTY
¯0 5 102.5Miles
District 1District 2District 3District 4District 5
CurrentDistricts
Population VarianceVariance Percentage
TotalVariance9.16%
DRAFT - 2021 Supervisorial DistrictsDetailed Map - Proposed Map: C
Prepared by the Department of Conservation and Development - GIS Group for the November 9th, 2021 Board of Supervisors Public Hearing.

CONTRA COSTA COUNTY
352
1 4
Current Supervisorial Boundaries
Demographic AnalysisRace and Ethnicity by District
9.16%2021 PopulationPopulation: 1,168,069Equal Distribution: 233,614Citizen Voting Age Population(CVAP): 761,065
CONCORD1 5
24
3
ANTIOCH
OAKLEY
SANRAMON
RICHMOND
DANVILLE
ORINDA
WALNUTCREEK
PITTSBURG
LAFAYETTE
MARTINEZ
BRENTWOOD
MORAGA
PINOLEHERCULES
PLEASANTHILL CLAYTON
EL CERRITO
SANPABLO
ByronAlamo
Knightsen
BethelIsland
Blackhawk
BayPoint
DiscoveryBay
Rodeo
Diablo
PachecoElSobrante
Saranap
Crockett
CaminoTassajara
Clyde
Kensington
VineHill
Contra CostaCentre
Prepared by the Department of Conservation and Development - GIS Group for the November 9th, 2021 Board of Supervisors Public Hearing.Data Source: 2021 California State Redistricting Data, Adjusted P.L 94-171 Redistrricting Data and block level Citizen Voting Age Population (CVAP)
District 1District 2District 3District 4District 5
Total Population - Race and Ethnicty
Citizen Voting Age Population (CVAP)Race and Ethnicty
Population by DistrictTotal Variance Population Variance Percentage by District
DRAFT - 2021 Supervisorial DistrictsOverview Map and Data - Proposed Map: C
District Population Variance PercentDistrict 1 236,069 2,455 1.05%District 2 244,878 11,264 4.82%District 3 223,487 (10,127) -4.33%District 4 239,376 5,762 2.47%District 5 224,259 (9,355) -4.00%
1.05%4.82%
-4.33%
2.47%
-4.00%-5.0%-2.5%0.0%2.5%5.0%
District 1 District 2 District 3 District 4 District 5
Total Latino White Black Asian Other95,017 51,396 33,307 40,760 15,589
40.2% 21.8% 14.1% 17.3% 6.6%19,799 133,531 3,879 71,377 16,292
8.1% 54.5% 1.6% 29.1% 6.7%69,894 82,114 27,194 27,066 17,219
31.3% 36.7% 12.2% 12.1% 7.7%50,573 126,832 7,128 36,576 18,267
21.1% 53.0% 3.0% 15.3% 7.6%80,142 62,008 27,491 38,769 15,849
35.7% 27.7% 12.3% 17.3% 7.1%315,425 455,881 98,999 214,548 83,216
27.0% 39.0% 8.5% 18.4% 7.1%
District 5 224,259
County 1,168,069
District 3 223,487
District 4 239,376
District 1 236,069
District 2 244,878
Total Latino White Black Asian Other35,145 45,432 27,283 26,038 6,421
25.0% 32.4% 19.4% 18.6% 4.6%9,962 112,518 2,542 31,023 4,632
6.2% 70.0% 1.6% 19.3% 2.9%34,337 72,617 19,606 14,549 7,430
23.1% 48.9% 13.2% 9.8% 5.0%23,802 111,801 5,309 20,538 7,283
14.1% 66.3% 3.1% 12.2% 4.3%34,470 58,730 18,944 23,451 7,202
24.1% 41.1% 13.3% 16.4% 5.0%137,716 401,098 73,684 115,599 32,968
18.1% 52.7% 9.7% 15.2% 4.3%
District 5 142,797
County 761,065
District 2 160,677
District 3 148,539
District 4 168,733
District 1 140,319

SanRiver
StraitCarquinez
BigBreak
San Leandro Reservoir
Los Vaqueros Reservoir
BrionesReservoir
San Pablo Reservoir
CliftonCourt
Forebay
FranksTract
HonkerBay
SuisunBay
SanPablo
Bay
SanFrancisco
Bay
Joaquin
Old Riv
er
Sacramento River
Naval
ByronAirport
Military OceanTerminal Complex
MtDiablo
Buch-ananAirport
Chevron
Marathon
Philips66
KellerCanyonLandfill
West Co.Landfill
Martinez
MorganTerritory
TassajaraValley
AgriculturalCore
ByronTract
ConeyIsland
QuimbyIsland
OrwoodTract
PalmTract
VealeTract
BixlerTract
HollandTract
JerseyIsland
BradfordIsland
WebbTract
WinterIsland
BrownsIsland
FranklinCanyon
BollingerCanyon Vasco
Hills
Briones
Canyon
SandmoundSlough
Refinery Former
Weapons
Concord
Station
BethelIsland
Kensington
El Sobrante
Rodeo
Crockett
Alamo
Knightsen
DiscoveryBay
Byron
BayPoint
Pacheco
Blackhawk
Diablo
PortCosta
Clyde
NorthRichmond
Saranap
ContraCostaCentre
MtView
VineHill
TaraHills
MontalvinManor
Bayview
EastRichmond Heights
San Miguel
NorthGate
Reliez
AlhambraValley
Rollingwood
ShellRidge
Camino Tassajara
NorrisCanyon
Valley
AcalanesRidge
CastleHill
HERCULES
PINOLE
RICHMOND
MARTINEZ
CONCORD
PLEASANTHILL
WALNUTCREEK
LAFAYETTE
CLAYTON
ANTIOCHOAKLEY
BRENTWOOD
SANRAMON
ORINDA
MORAGA
ELCERRITO
SAN PABLO
PITTSBURG
DANVILLE
ANTIOCH
}ÿ4
}ÿ24
}ÿ242
}ÿ160
}ÿ4
}ÿ4
}ÿ4
§̈¦80
§̈¦80
567J4
§̈¦580
§̈¦80
§̈¦680
§̈¦680
§̈¦680
§̈¦680
}ÿ4}ÿ4
}ÿ4
}ÿ4
}ÿ24
BERKELEY
OAKLAND
SANFRANCISCO
DUBLIN
ALAMEDA
ALBANY
BENICIA
VALLEJO
SANLEANDRO LIVERMORE
TRACY
DALY CITY CastroValley
MountainHouse
Diablo, Blackhawk, Camino Tassajara, and Tassajara Valleyto District 2
Split at Hwy 24 and I-680Acalanes Ridge CDPin District 4;Saranap and Castle HillCDP in District 2
Split by School District & City SOI:Lafayette Elementary - Dist 2
Mt Diablo School & WC SOI - Dist 4Mt Diablo School & PH SOI - Dist 4Martinez School & PH SOI - Dist 5
92733.97%
112644.82%
-11568-4.95%
-11425-4.89%
All ofPinole
to District 1
24551.05%
3
1
2
4
5
SanRamon
Valley
WALNUT CREEK
ReliezValley
PINOLECONCORD
ANTIOCH
Concord split at former railroad right-of-way,
Hwy 242, Hwy 4Pittsburg's 'Tuscany Meadows'
annexation to District 5.Antioch split at Somersville Rd,
Auto Center Dr,UP railroad
WALNUTCREEK
MorganTerritory
MorganTerritory Rd
area inside MtDiablo school
district toDistrict 4
CONTRA COSTA COUNTY
¯0 5 102.5Miles
District 1District 2District 3District 4District 5
CurrentDistricts
Population VarianceVariance Percentage
TotalVariance9.77%
DRAFT - 2021 Supervisorial DistrictsDetailed Map - Proposed Map:D
Prepared by the Department of Conservation and Development - GIS Group for the November 9th, 2021 Board of Supervisors Public Hearing.

CONTRA COSTA COUNTY
352
1 4
Current Supervisorial Boundaries
Demographic AnalysisRace and Ethnicity by District
9.77%Total Variance
2021 PopulationPopulation: 1,168,069Equal Distribution: 233,614Citizen Voting Age Population(CVAP): 761,065
CONCORD1 5
24
3
ANTIOCH
OAKLEY
SANRAMON
RICHMOND
DANVILLE
ORINDA
WALNUTCREEK
PITTSBURG
LAFAYETTE
MARTINEZ
BRENTWOOD
MORAGA
PINOLEHERCULES
PLEASANTHILL CLAYTON
EL CERRITO
SANPABLO
ByronAlamo
Knightsen
BethelIsland
Blackhawk
BayPoint
DiscoveryBay
Rodeo
Diablo
PachecoElSobrante
Saranap
Crockett
CaminoTassajara
Clyde
Kensington
VineHill
Contra CostaCentre
Prepared by the Department of Conservation and Development - GIS Group for the November 9th, 2021 Board of Supervisors Public Hearing.Data Source: 2021 California State Redistricting Data, Adjusted P.L 94-171 Redistrricting Data and block level Citizen Voting Age Population (CVAP)
District 1District 2District 3District 4District 5
Total Population - Race and Ethnicty
Citizen Voting Age Population (CVAP)Race and Ethnicty
Population by District Population Variance Percentage by District
DRAFT - 2021 Supervisorial DistrictsOverview Map and Data - Proposed Map: D
District Population Variance PercentDistrict 1 236,069 2,455 1.05%District 2 244,878 11,264 4.82%District 3 222,046 (11,568) -4.95%District 4 242,887 9,273 3.97%District 5 222,189 (11,425) -4.89%
1.05%4.82%
-4.95%
3.97%
-4.89%-5.0%-2.5%0.0%2.5%5.0%
District 1 District 2 District 3 District 4 District 5
Total Latino White Black Asian Other95,017 51,396 33,307 40,760 15,589
40.2% 21.8% 14.1% 17.3% 6.6%19,799 133,531 3,879 71,377 16,292
8.1% 54.5% 1.6% 29.1% 6.7%69,542 81,031 27,904 26,345 17,224
31.3% 36.5% 12.6% 11.9% 7.8%51,722 128,353 7,243 36,979 18,590
21.3% 52.8% 3.0% 15.2% 7.7%79,345 61,570 26,666 39,087 15,521
35.7% 27.7% 12.0% 17.6% 7.0%315,425 455,881 98,999 214,548 83,216
27.0% 39.0% 8.5% 18.4% 7.1%
District 5 222,189
County 1,168,069
District 3 222,046
District 4 242,887
District 1 236,069
District 2 244,878
Total Latino White Black Asian Other35,145 45,432 27,283 26,038 6,421
25.0% 32.4% 19.4% 18.6% 4.6%9,962 112,518 2,542 31,023 4,632
6.2% 70.0% 1.6% 19.3% 2.9%33,432 71,479 20,136 14,262 7,515
22.8% 48.7% 13.7% 9.7% 5.1%24,248 113,490 5,383 20,841 7,422
14.1% 66.2% 3.1% 12.2% 4.3%34,929 58,179 18,340 23,435 6,978
24.6% 41.0% 12.9% 16.5% 4.9%137,716 401,098 73,684 115,599 32,968
18.1% 52.7% 9.7% 15.2% 4.3%
District 5 141,861
County 761,065
District 2 160,677
District 3 146,824
District 4 171,384
District 1 140,319